Article

Comparative Study on Genome Size and Phytochemical Profile of Three Potential Species of Acacia: Threatened and Endemic to Saudi Arabia

Department of Botany and Microbiology, College of Science, King Saud University, P.O. Box 2455, Riyadh 11451, Saudi Arabia
*
Author to whom correspondence should be addressed.
Horticulturae 2022, 8(11), 994; https://doi.org/10.3390/horticulturae8110994
Submission received: 25 September 2022 / Revised: 17 October 2022 / Accepted: 18 October 2022 / Published: 26 October 2022
(This article belongs to the Special Issue Morphology, Palynology and Phytochemicals of Medicinal Plants)

Abstract

:
Acacias are widely distributed in tropical and subtropical regions of the world and have both economic as well as medicinal value. The estimation of genome size is very important as it changes due to the change in noncoding DNA sequence as well as genome duplication among organisms for their evolutionary aspects. Three potential species of the genus Acacia including Acacia etbaica, Acacia johnwoodii and Acacia origena, which are threatened and nearly endemic to Saudi Arabia, were collected. The present study was carried out to determine the genome size (2C DNA contents), total phenolic content (TPC), total flavonoid (TFC) and some bioactive compounds in these species for their comparison. The genome size ranged from 1.91 pg (A. etbaica) to 2.45 pg/2C (A. origena) among the Acacia species, which correspond to genome sizes 1843.15–2364.25 Mbp, respectively. The variation was observed in genome size within Acacia species as nuclei were extracted using different extraction buffers except for GB and MB01 buffers. The FTIR analysis revealed the presence of various functional groups in compounds that might be responsible for different types of phytochemicals in these Acacia species. Total flavonoid content (TFC) ranged from 0.647 (A. origena) to 1.084 mg QE/g DW (A. etbaica), whereas the total phenolic f content (TPC) ranged between 15.322 (A. origena) to 28.849 (A. johnwoodii) mg/g DW of GAE. HPLC analysis revealed the presence of quercetin 3-β-D-glucoside and luteolin 7-rutinoside in the leaves of all three Acacia species in considerable amounts, and these might have good health-promoting effects. This is our first study on genome size (2C DNA content) using flow cytometry and phytochemical profiling on these Acacias. Thus, estimated genome size and phytochemical study of these species could help to understand the biosynthesis of secondary metabolites under various genes and the evolutionary relationships among them.

1. Introduction

Acacia species (approx. 1380 species) are distributed in tropical and subtropical parts of the world, including large areas of the Arabian Peninsula, deserts of Africa and the Middle East, and two-thirds are native to Australia [1,2,3,4]. Acacia, also known as Acacias (family: Fabaceae; subfamily: Mimosoideae), is considered an important shrub and tree. Different species of Acacia are found in Western, Northern and Eastern parts of Saudi Arabia and grow in various types of soils [5,6]. Some species of Acacia, viz., Acacia johnwoodii Boulos, Acacia origena Hunde and Acacia etbaica Schweinf, have been reported from Saudi Arabia. According to Al-Mefarrej [7], A. origena and A. etbaica are found in the Al-Baha and Aseer regions of Saudi Arabia. Acacias have various uses as these are potential sources of firewood, forage, timber, gum, fiber, tannins, folk food, and medicine; moreover, these species are used as useful for soil, environmental protection and water conservation.
Genome size is an invariable feature of an individual and is generally invariable within a species. The amount of nuclear DNA, a set of simple multiples of its basic quantity, is named ‘C-values’. The amount of DNA in the unreplicated gametic nucleus of an organism is known as the 1C value (holoploid genome size) [8], which is termed genome size. Genome size (nuclear DNA content) varies approx. 2400-fold in angiosperms as a result of changes in the amount of genome duplication and noncoding DNA sequences [9]. In seed plants genome size varied from 0.13 to 254.8 pg [10,11]. Comparative studies have suggested that large genome size is maladaptive through its constraints on plant physiology in plants [12,13]. At present, duplications of whole-genome have clearly had a main effect on genome size in plants.
The use of flow cytometry (FCM) in the determination of DNA ploidy level, cell cycle analysis and assessment of nuclear DNA content have arisen as its most widespread applications [11,14]. Flow cytometry has been commonly used at the population level to identify alterations in nuclear DNA contents, i.e., cytotype and intraspecific variation, which is often one of the results of hybridization, as reported in Sorbus and Viola [15] [16,17]. Undoubtedly, this method is simple, low cost and has become a complementary means to infer output data from population genetics (i.e., allelic frequencies). There are various protocols available in the literature for the extraction of nuclei for genome size estimation as developed by researchers [18,19,20,21,22].
A large group of plant polyphenols known as flavonoids is found in different plant species. Flavonoids have a wide range of health-promoting properties due to their antioxidant nature. Natural flavonoids and phenolic compounds have been used to cure various human diseases [23]. These flavonoids act as shielding compounds to protect the plant against damage from high levels of solar radiation, particularly ultraviolet (UV) radiation. The flavonoid quercetin is a major constituent in plants which is found in abundance in its glycoside form [24]. Quercetin compounds have various biological and pharmacological activities, including anti-inflammatory, antiviral, antibacterial and anticarcinogenic [25,26,27]. Flavonoid glycosides participate in the prevention of cancer, atherosclerosis, and chronic inflammation in humans by deacceleration of oxidative degradation and treatment of amyotrophic lateral sclerosis [23,28]. The flavonoid rutin has multiple pharmacological activities and protects plants against pathogens or ultraviolet radiation and also used to inhibit the side effects of some diseases such as hypercholesteremia diabetes, and cancer treatments [29,30]. Among the various secondary metabolites, phenolics compounds have several beneficial effects to humans particularly in the cure of diseases such as neurodegenerative disorders, cancer and cardiovascular [31,32,33,34].
Based on many applications of secondary metabolites in humans, as reported in the literature, our main objective is to study the phytochemical profiling of the leaves of Acacia species, including A. johnwoodii, A. etbaica and A. origena, since a comparative phytochemical study has not been reported till date. The estimation of genome size (2C DNA content) of these Acacia species is important as they have a narrow geographical range, low density and small population size and grow under extreme environmental conditions. Therefore, in the present study, different extraction buffers were used for the extraction of nuclei from cotyledons of germinated seeds of Acacias for genome size estimation and a comparative study was performed among them.

2. Materials and Methods

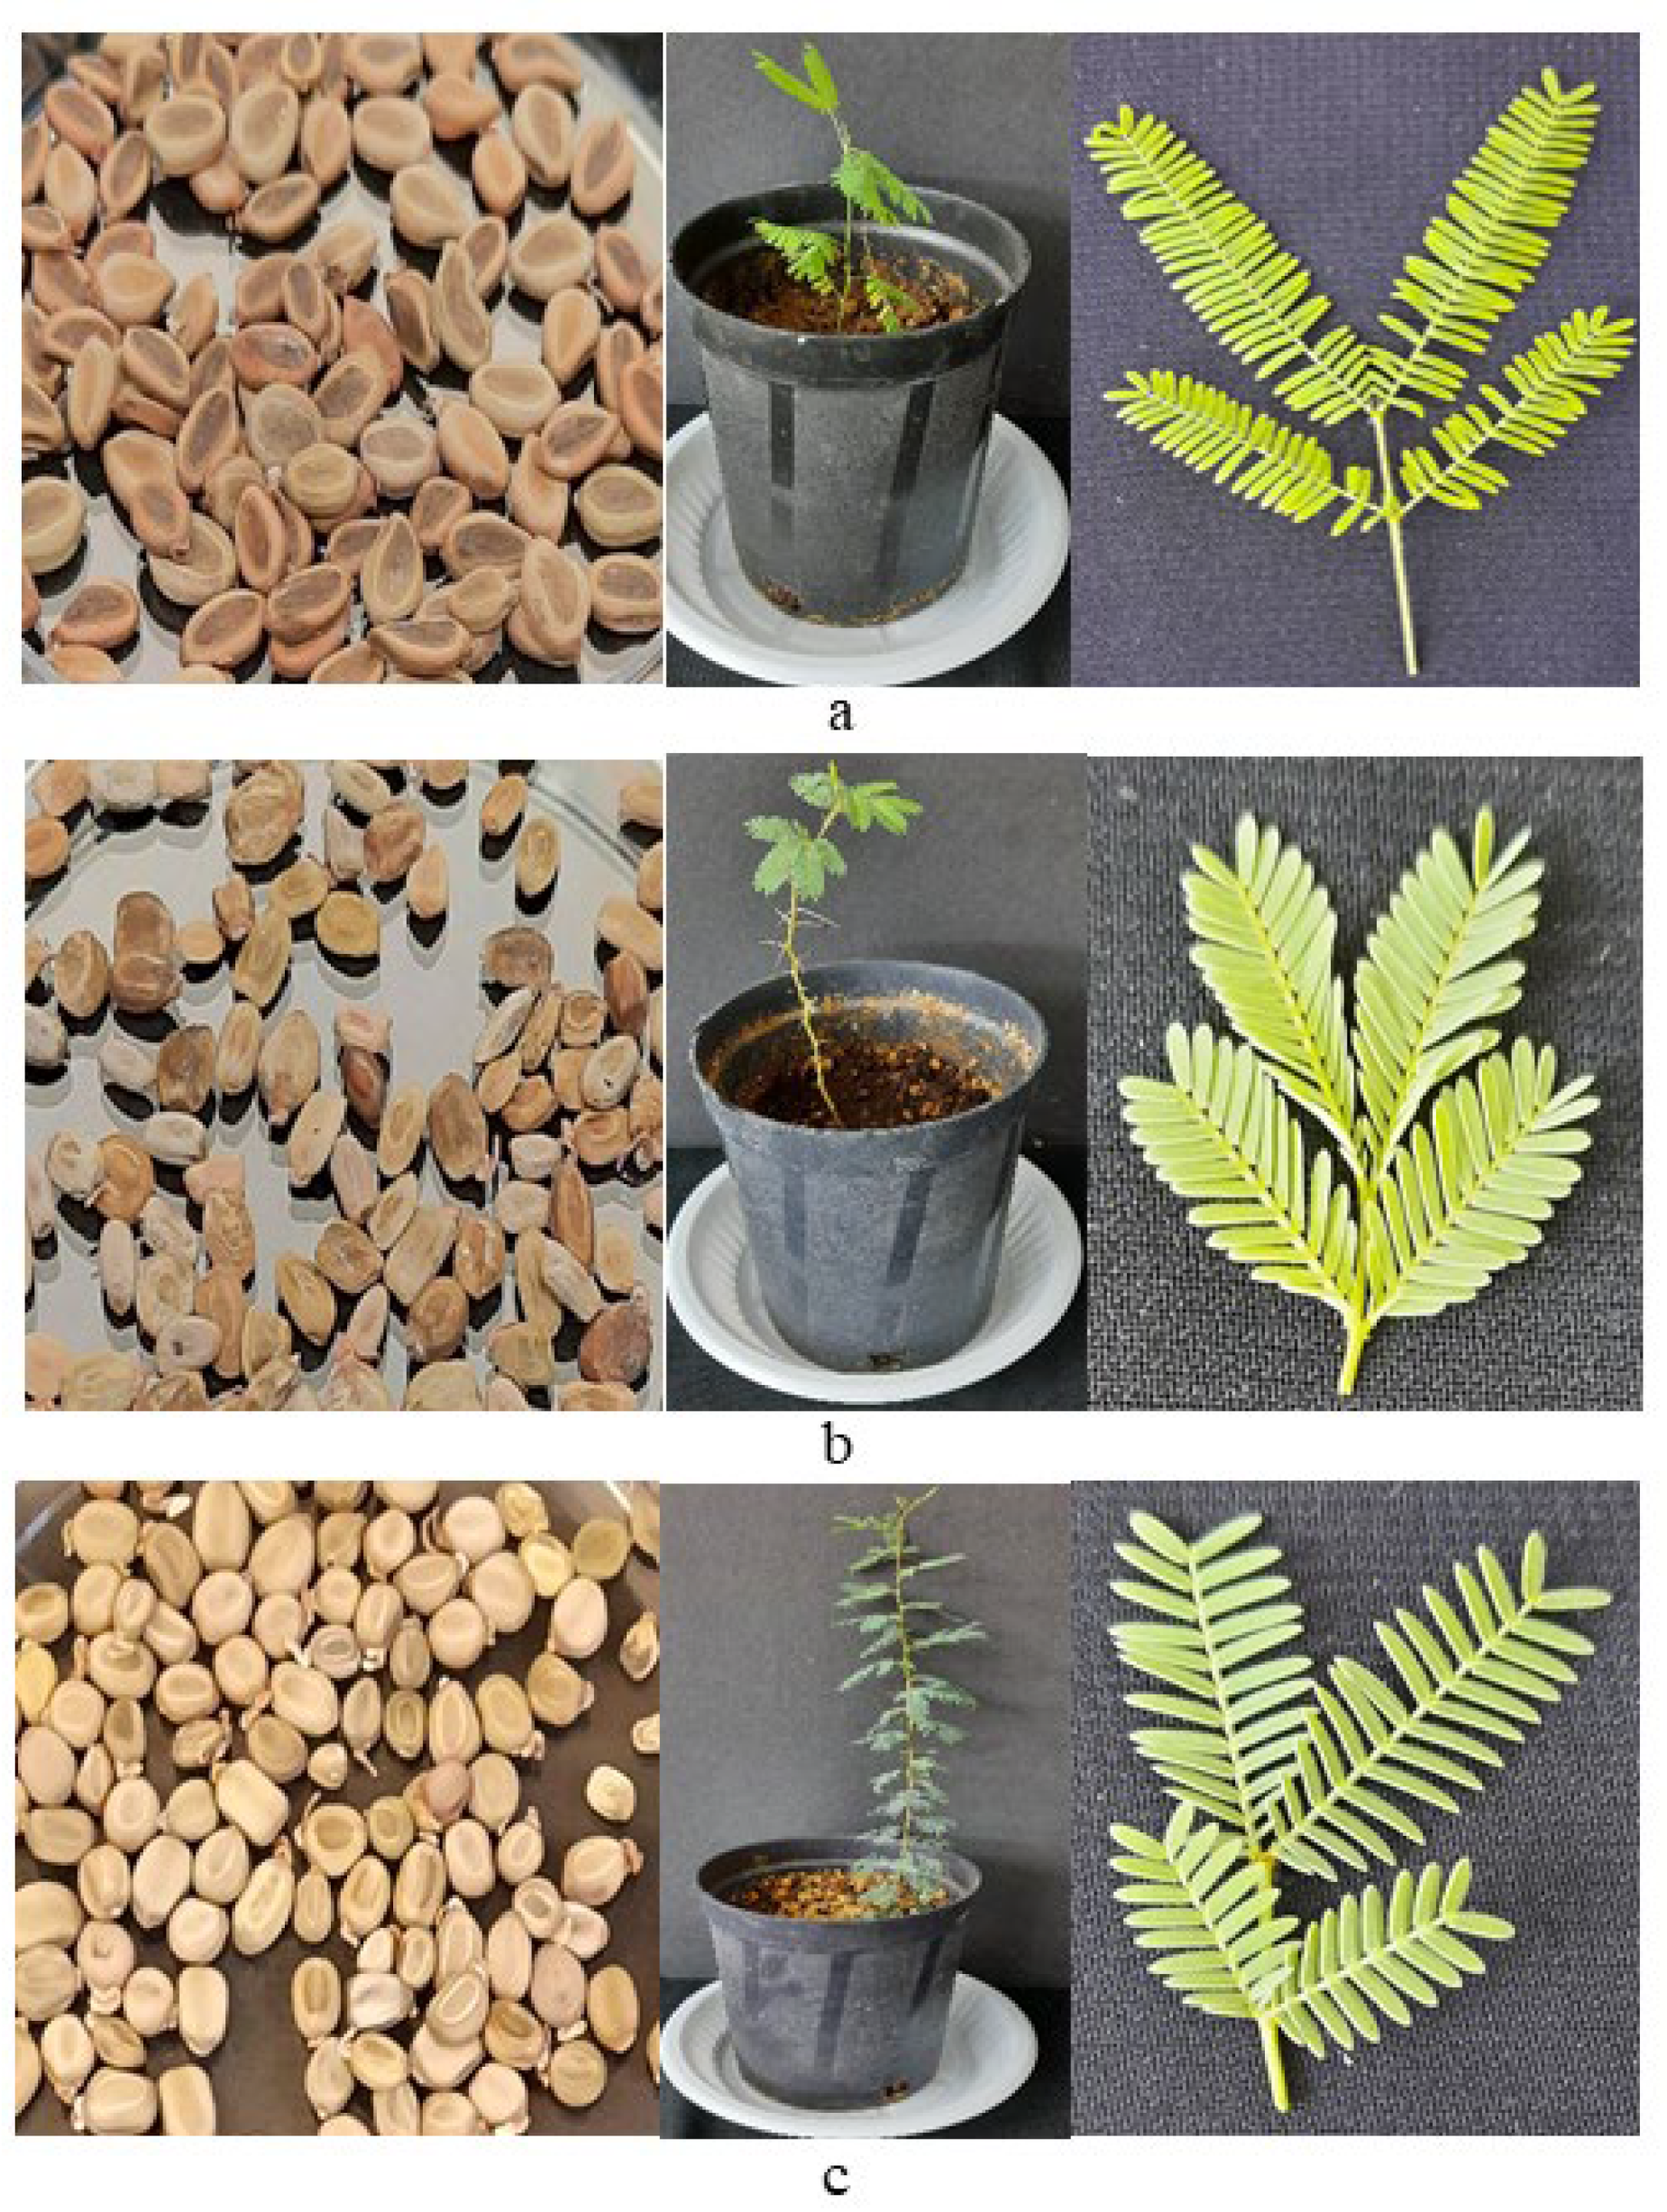
2.1. Seeds Collection

The seeds of Acacia species were collected in the month of June 2021 from Abha province of Saudi Arabia. The seeds were identified by a taxonomist, and voucher specimen for Acacia johnwoodii (21635), Acacia origena (23066) and Acacia etbaica (23811) was deposited at the Department of Botany and Microbiology, College of Science, King Saud University, Riyadh, Saudi Arabia. After collection, the seeds were stored at room temperature, and further, they were air-dried to a minimum moisture content before storage. The collection of Acacia species and their information are given in (Table 1).

2.2. Pot Experiment

The Acacias seeds were sterilized with minor modifications, as followed by Al-Qurainy et al. [35]. The collected mature seeds were washed with tap water for 30 min, followed by doubled distilled water to remove microbes and dust. The washed seeds were treated with 50% bleach for 10 min for surface cleaning, and thereafter, they were washed with distilled water 3–4 times. The sterilized seeds were sowed in the pot containing soil consisting of peat moss and pearlite (3:1). The seedlings of all Acacias were raised in a growth chamber adjusted the conditions as 16-h/8-h, 25 ± 1 °C Day/night cycle. The cotyledons (20 days after sowing) were harvested for the genome size estimation. The young leaves were harvested from 3 months old plants for phytochemical profiling and bioactive compound estimation.

2.3. Buffer Preparation for Nuclei Extraction

Galbraith’s buffer [18] (45 mM MgCl2; 30 mM sodium citrate; 20 mM MOPS; 0.1% (v/v) Triton X-100; pH 7.0)
LB01 buffer [21] (15 mM Tris; 2 mM Na2EDTA; 0.5 mM spermine.4HCl; 80 mM KCl; 20 mM NaCl; 15 mM β-mercaptoethanol; 0.1% (v/v) Triton X-100; pH 7.5)
MB01 [22] (20 mM MOPS; 25 mM Na2EDTA; 0.7 mM spermine.4HCl; 80 mM KCl; 20 mM NaCl; 1% (w/v) PVP; 0.5% (v/v) β-mercaptoethanol; 0.2% (v/v) Triton X-100; pH 7.4
Tris-MgCl2 buffer [19] (200 mM Tris; 4 mM MgCl2.6H2O; 0.5%(v/v) Triton X-100; pH 7.5)

2.4. Nuclei Extraction and Staining

The nuclei were extracted using the protocol as developed by authors [18,19,20,21] with slight modification in PVP (2%, w/v) and β-mercaptoethanol (0.6%, v/v) concentrations in nuclei isolation buffer. For each species, three replicates were taken for nuclei extraction as well as analysis. All necessary equipment used in the nuclei extraction was cleaned thoroughly. The whole nuclei extraction process was performed on ice. The cotyledon was used from the germinated seeds of all Acacias for the extraction of nuclei. The harvested cotyledons were washed with distilled water three times to remove soil, bacteria and fungi. Before extraction of the nuclei, the cotyledons were kept in doubled distilled water to get fully turgid cells for easy chopping and releasing of nuclei in the buffer. The young and fresh cotyledons of germinated seeds (25 mg for each) were chopped with a sharp razor blade into 0.4–0.5 mm size in cold nuclei isolation buffer (500 µL buffer). The released nuclei in the extraction buffer were passed through a double nylon mesh (pore size, 20 µm, purchased from Macrokun ((Shijiazhuang, China). The final volume of filtered nuclei suspension was made to 750 µL. The nuclei suspension was stained with 50 µg/mL of PI dye (Propidium iodide) and incubated at 4 °C for 10 min. The same process was used for the extraction of nuclei from the standard plant (Solanum lycopersicum) with the same extraction buffer. Relative 2C nuclear DNA content (genome size) of each Acacia was estimated by comparing them with plant DNA standards (Solanum lycopersicum) provided by Dr. Jaroslav Dolezel.

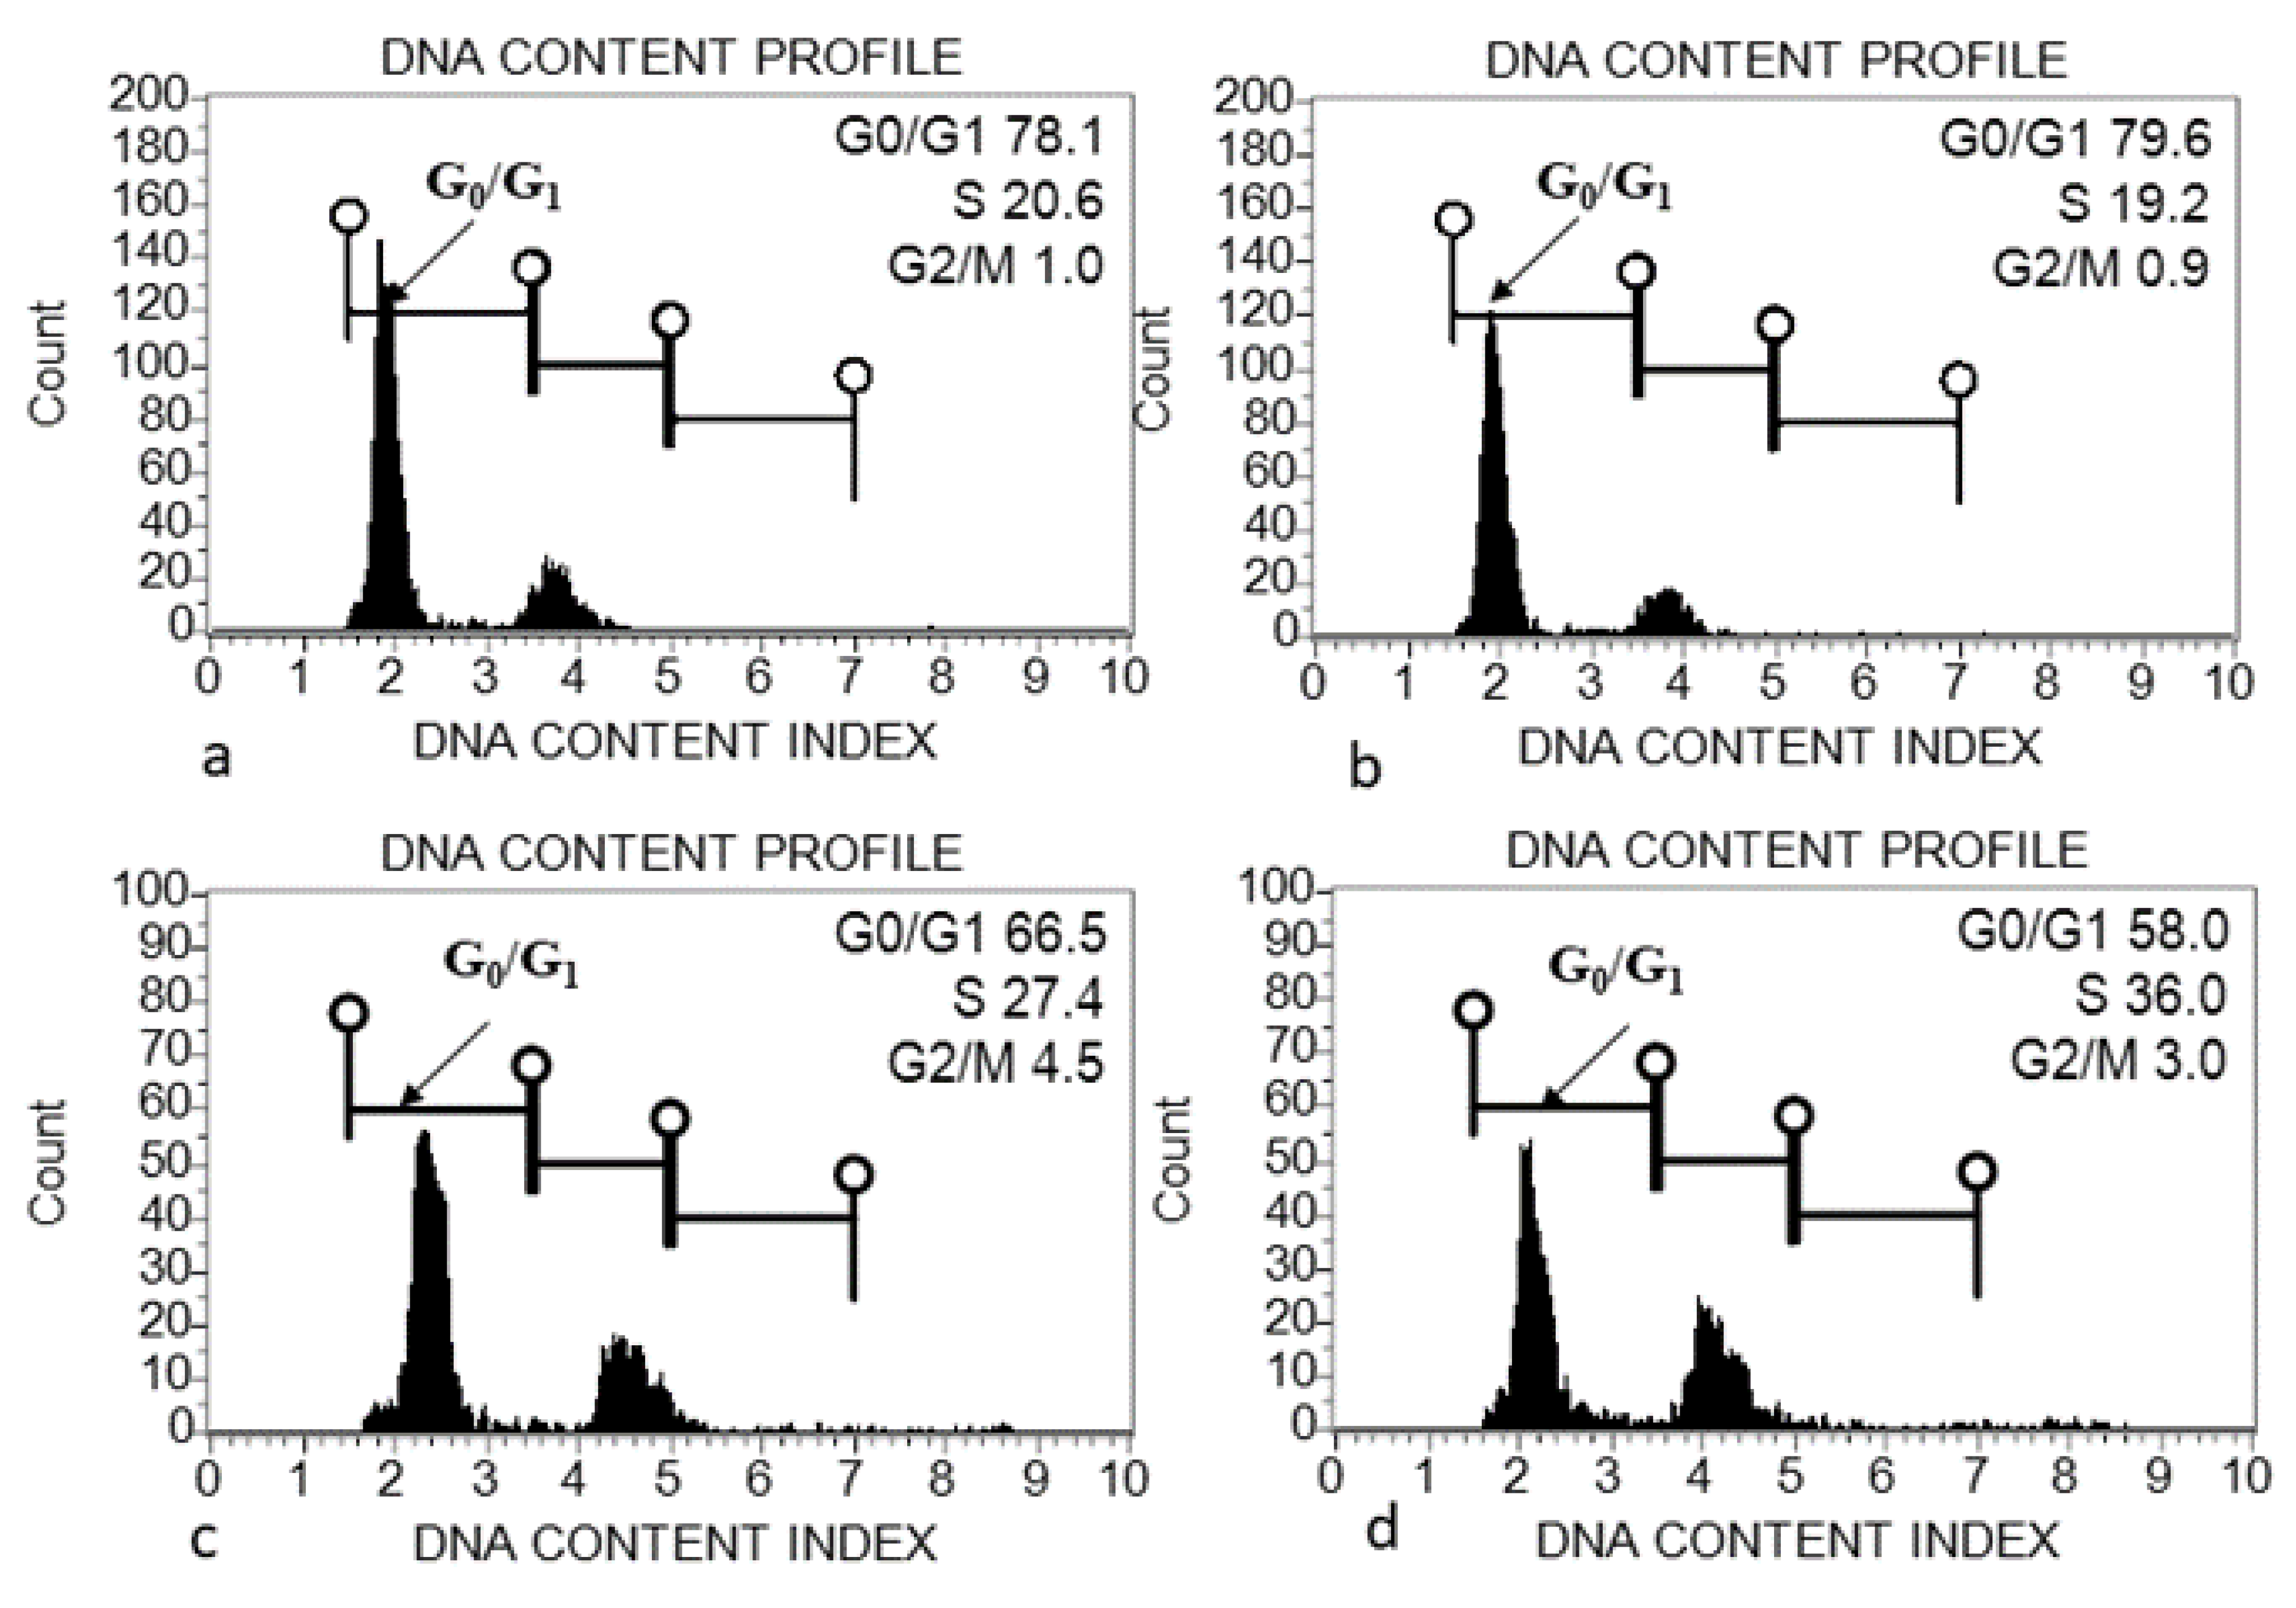
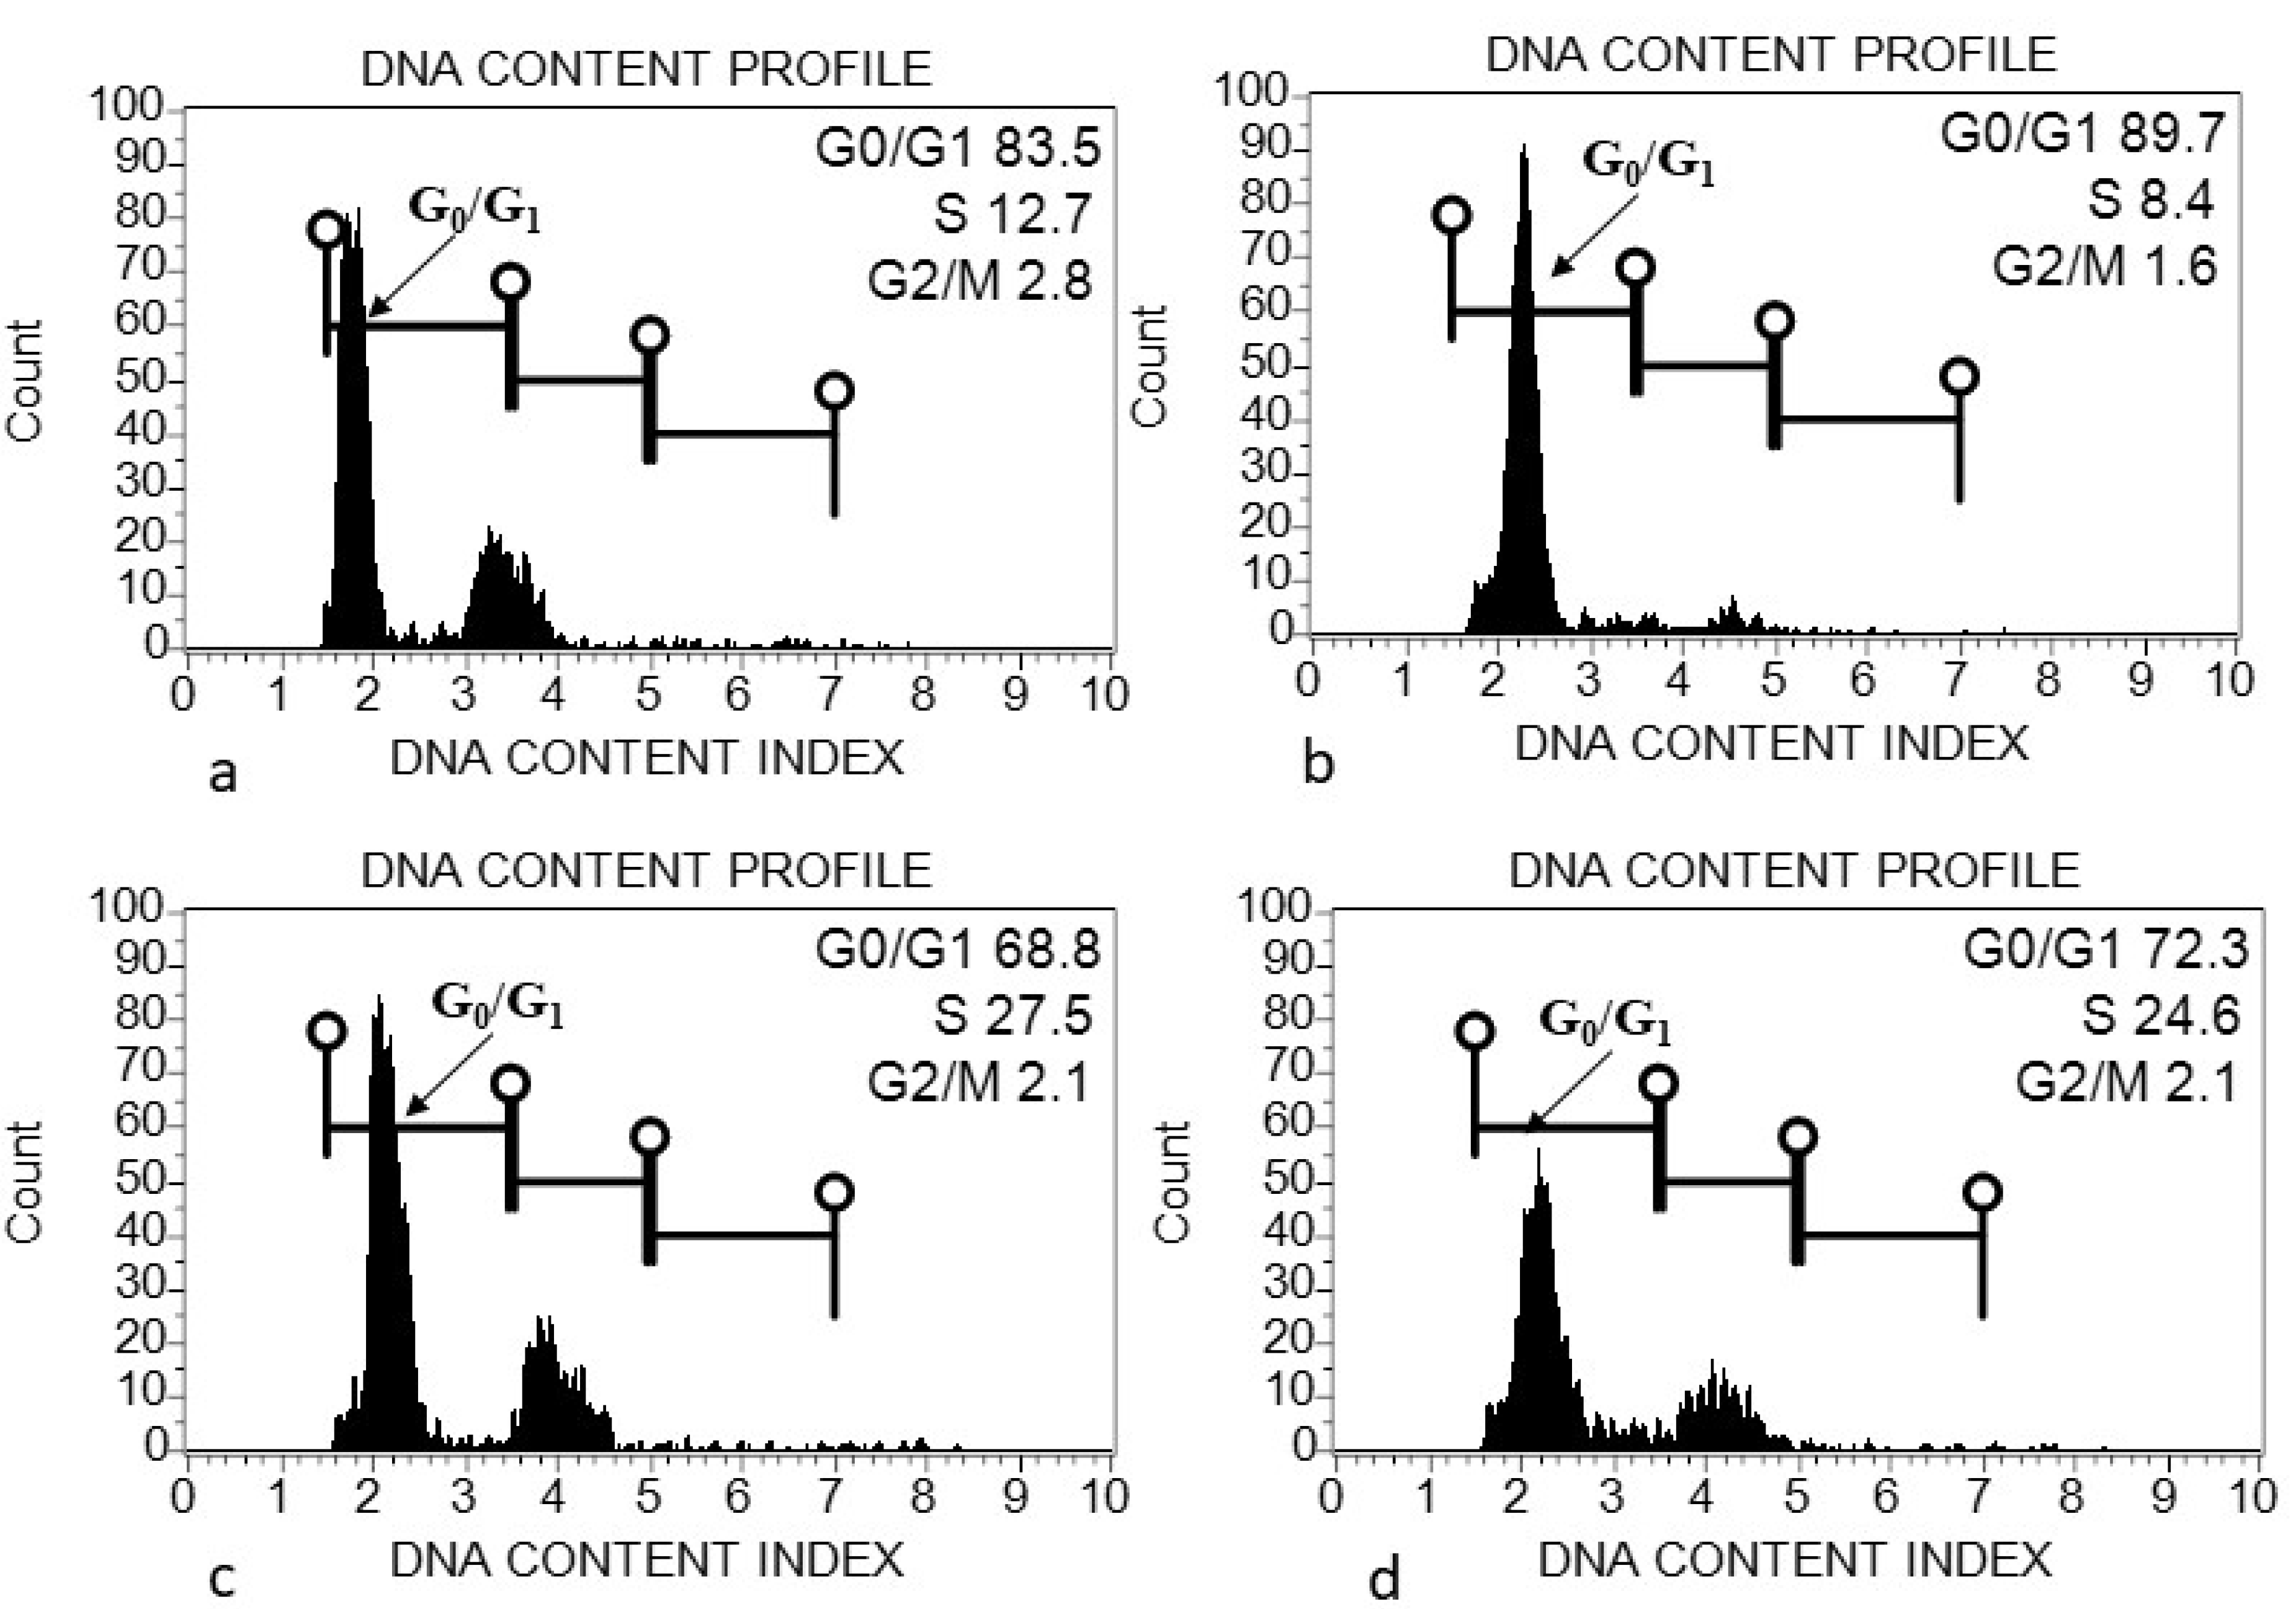
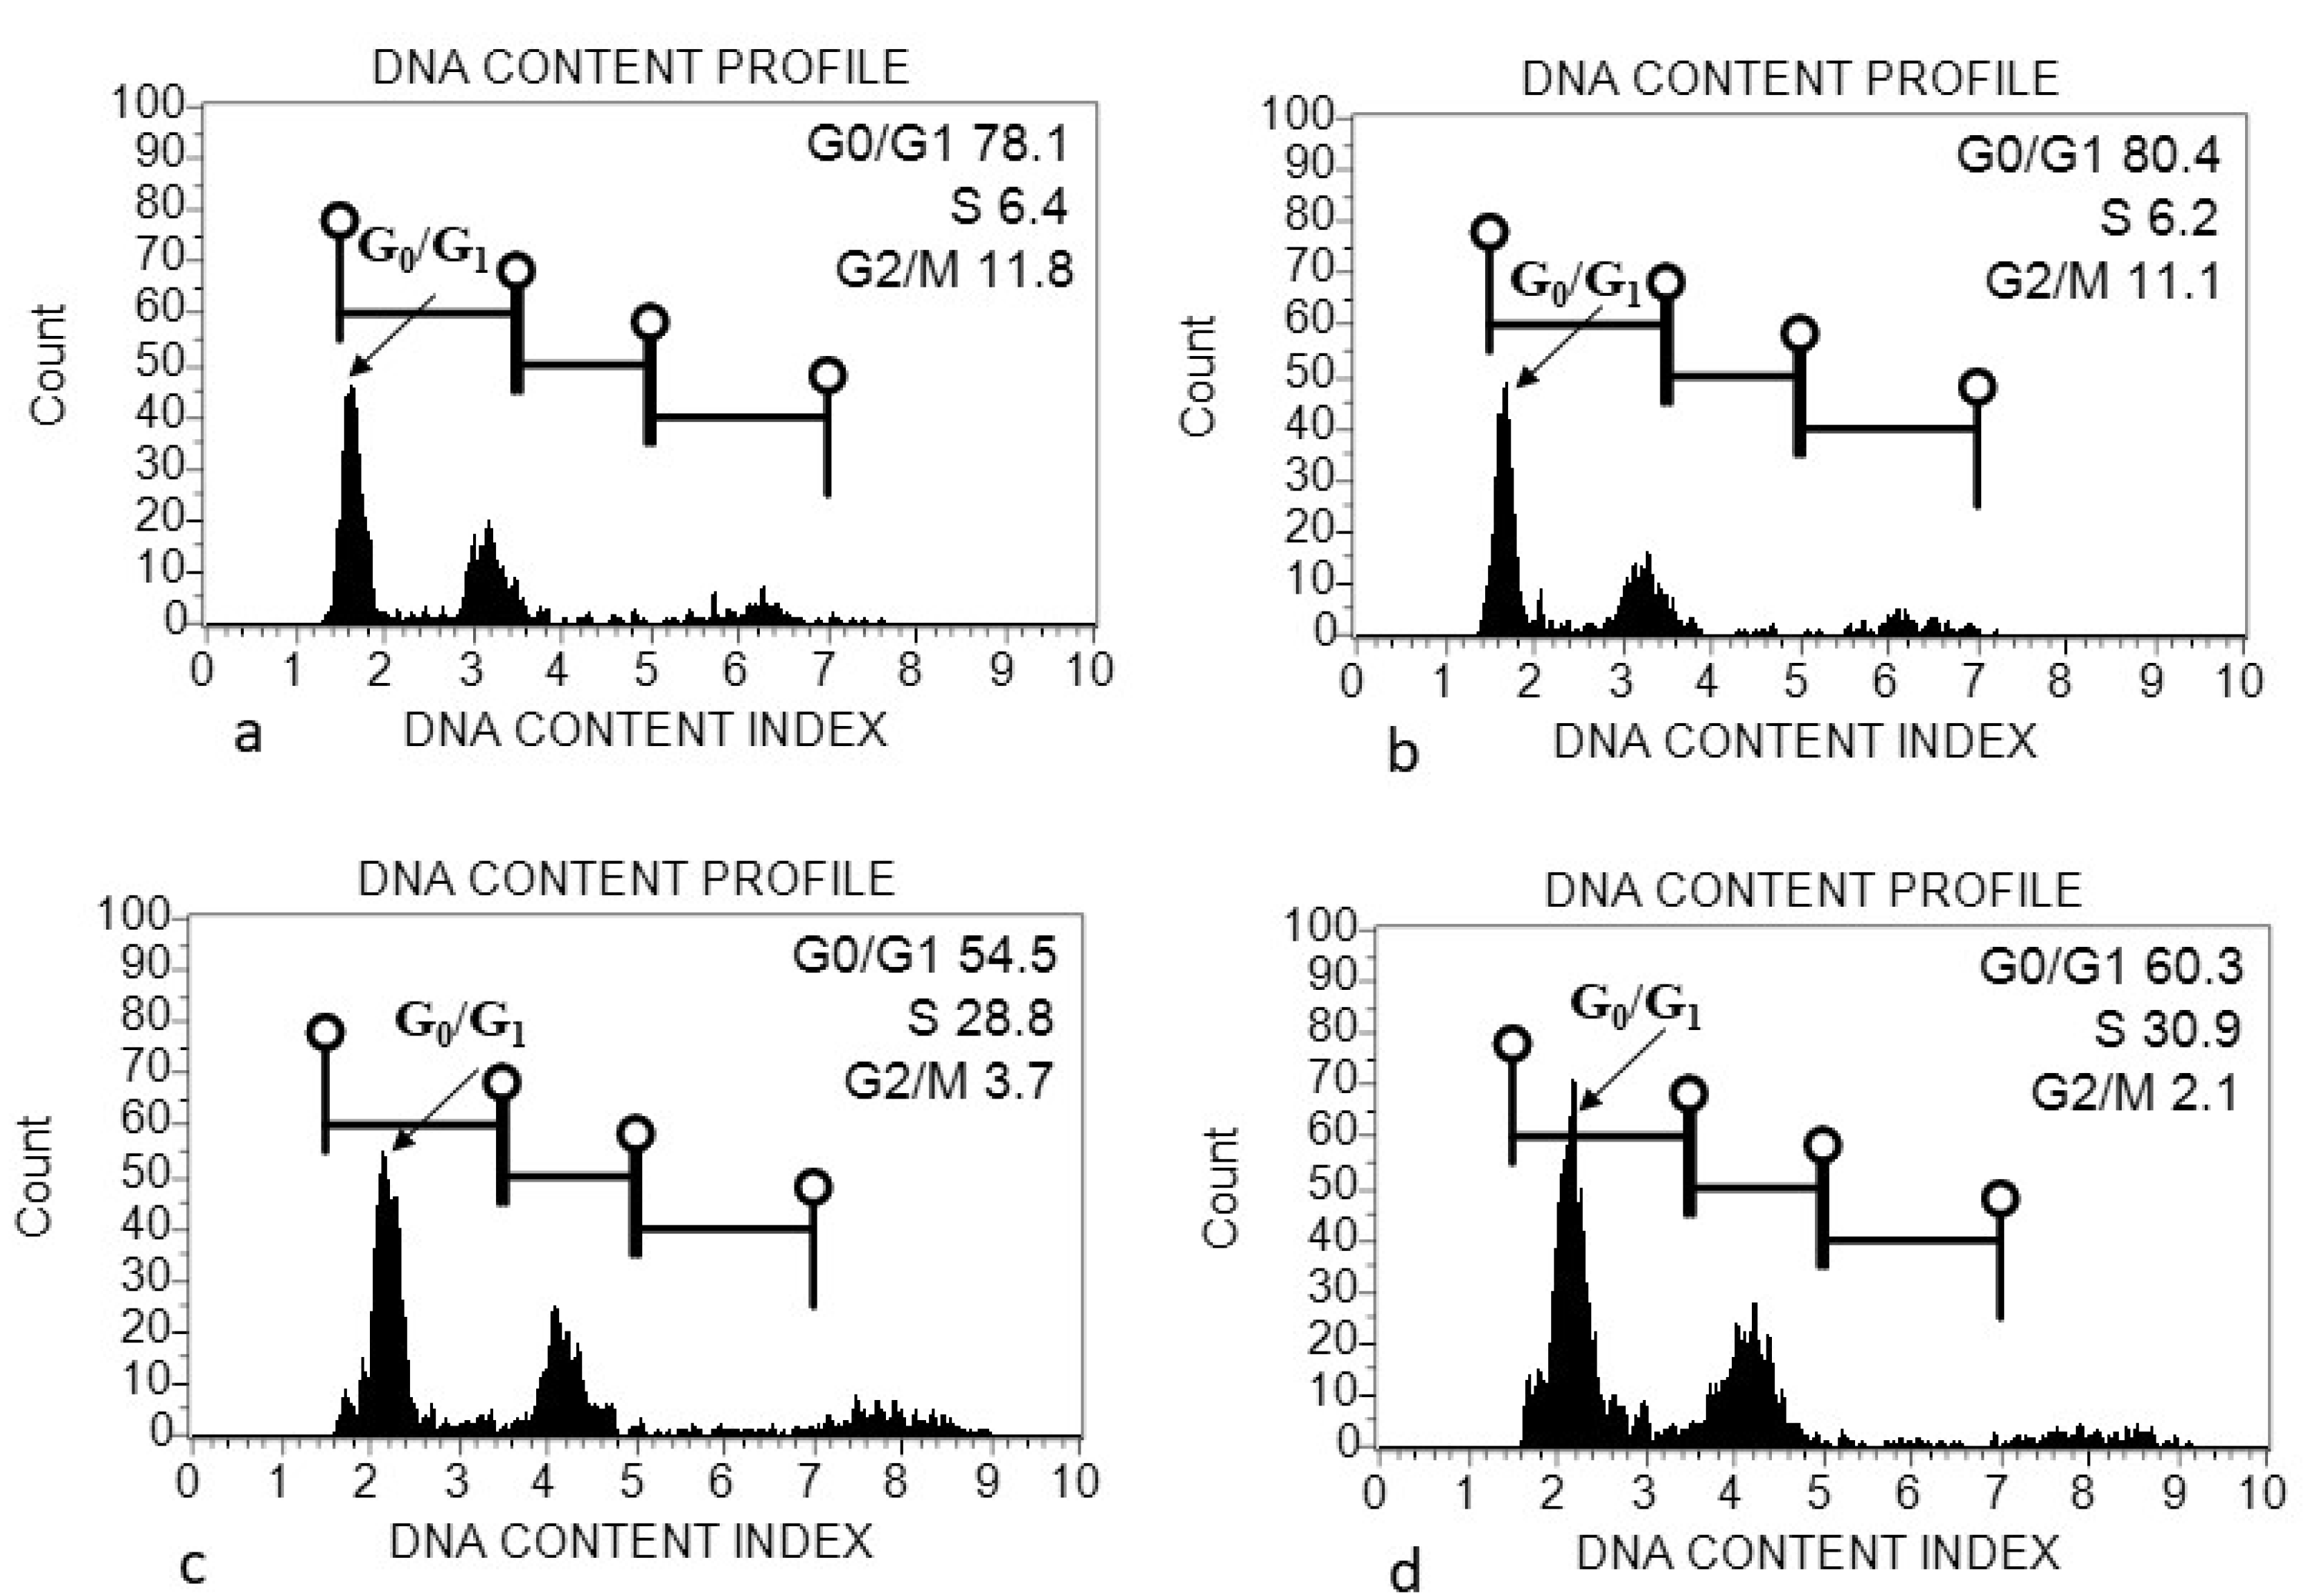
2.5. Flow Cytometric Analysis

Nuclear DNA content (2C DNA content) in all Acacia species was calculated according to Doležel et al. [21]. A minimum of 5000 propidium iodide-stained nuclei was estimated using a flow cytometer FACS Muse cell analyzer (Sigma, St. Louis, MO, USA). A minimum flow rate (0.12 µL/s) of the capillary was set to ensure the accuracy of the results. Solanum lycopersicum (2C = 1.96 pg) was kindly provided by Dr. Jaroslav Dolezel, Laboratory of Molecular Cytogenetics and Cytometry, Institute of Experimental Botany, Czech Republic, for the estimation of the genome size of Acacia species. The histograms generated in the Muse cell analyzer were computerized, and further analysis was performed for genome size estimation. The sample 2C DNA content was calculated according to the formula:
2 C   D N A   c o n t e n t   A c a c i a s = Fluorescence   mean   intensity   of   Acacias Fluorescence   mean   intensity   of   standard   ×   2 C   DNA   content   of   standard
The number of base pairs per haploid genome was calculated based on the equivalent of 1 pg DNA = 965 megabase pairs [36].

2.6. Extraction of Phytochemicals

Plant samples (leaves harvested from 3-month-old plants grown in pots) were washed properly and dried in the shade at room temperature (25 °C). The fine, coarse powder was made from dried leaves. 5 g of leaf powder was used for the extraction of phytochemicals in 100 mL methanol. The mixture was kept in a rotatory shaker for 12 hrs, and thereafter, it was filtered through Whatman filter paper No. 1. The filtrate was concentrated and dried under reduced pressure at 40 °C using a rotary vacuum evaporator. The concentrated samples (extract) were dissolved in methanol for analysis and kept at 4 °C until used.

2.6.1. Determination of Total Phenolic Contents (TPCs)

The total phenolic content in the methanolic leaf extract of A. etbaica, A. johnwoodii and A. origena was measured using Folin–Ciocalteu reagent using the method developed by Ainsworth [37]. The reaction was set up in a final volume of 2 mL (50 µL of leaf extract, 50 µL of Folin–Ciocalteu reagent and 1.9 mL of deionized water) and kept for 8 min. The above mixture was neutralized with 20% Na2CO3 solution and incubated for 30 min. The standard curve of gallic acid (1 mg/mL, dissolved in the methanol stock solution) was prepared for the estimation of TPCs in the samples. After adding all the reagents to the reaction tube and incubation, the samples were read at 765 nm wavelength as the color developed in the reaction mixture using a UV-visible spectrophotometer (SHIMADZU, UV-1800, Tokyo, Japan). The total phenolic content was estimated from the linear equation of a standard curve prepared with gallic acid (y = 0.0017x − 0.0289 with R2 = 0.9807). The calculated TPCs were expressed as mg/g gallic acid equivalent (GAE) of dry weight sample.

2.6.2. Determination of the Total Flavonoid Content (TFCs)

Estimation of the total flavonoid content in the leaf of A. etbaica, A. johnwoodii and A. origena was performed using the protocol developed by Ordonez [38]. In 2 mL of Eppendorf tube, 0.2 mL of 2% AlCl3 and 0.2 mL of plant extract were added and incubated at room temperature for 1 h. After incubation, deionized water (0.4 mL) was added to the above mixture. The absorbance was taken at 420 nm using a UV-visible spectrophotometer (SHIMADZU, UV-1800, Kyoto, Japan). A calibration curve was prepared using the quercetin reference standard compound. Total flavonoid content was calculated as quercetin (mg/g DW) using the following equation (Y = 0.031x + 0.137 with R2 = 0.9893), as generated from calibration curve.

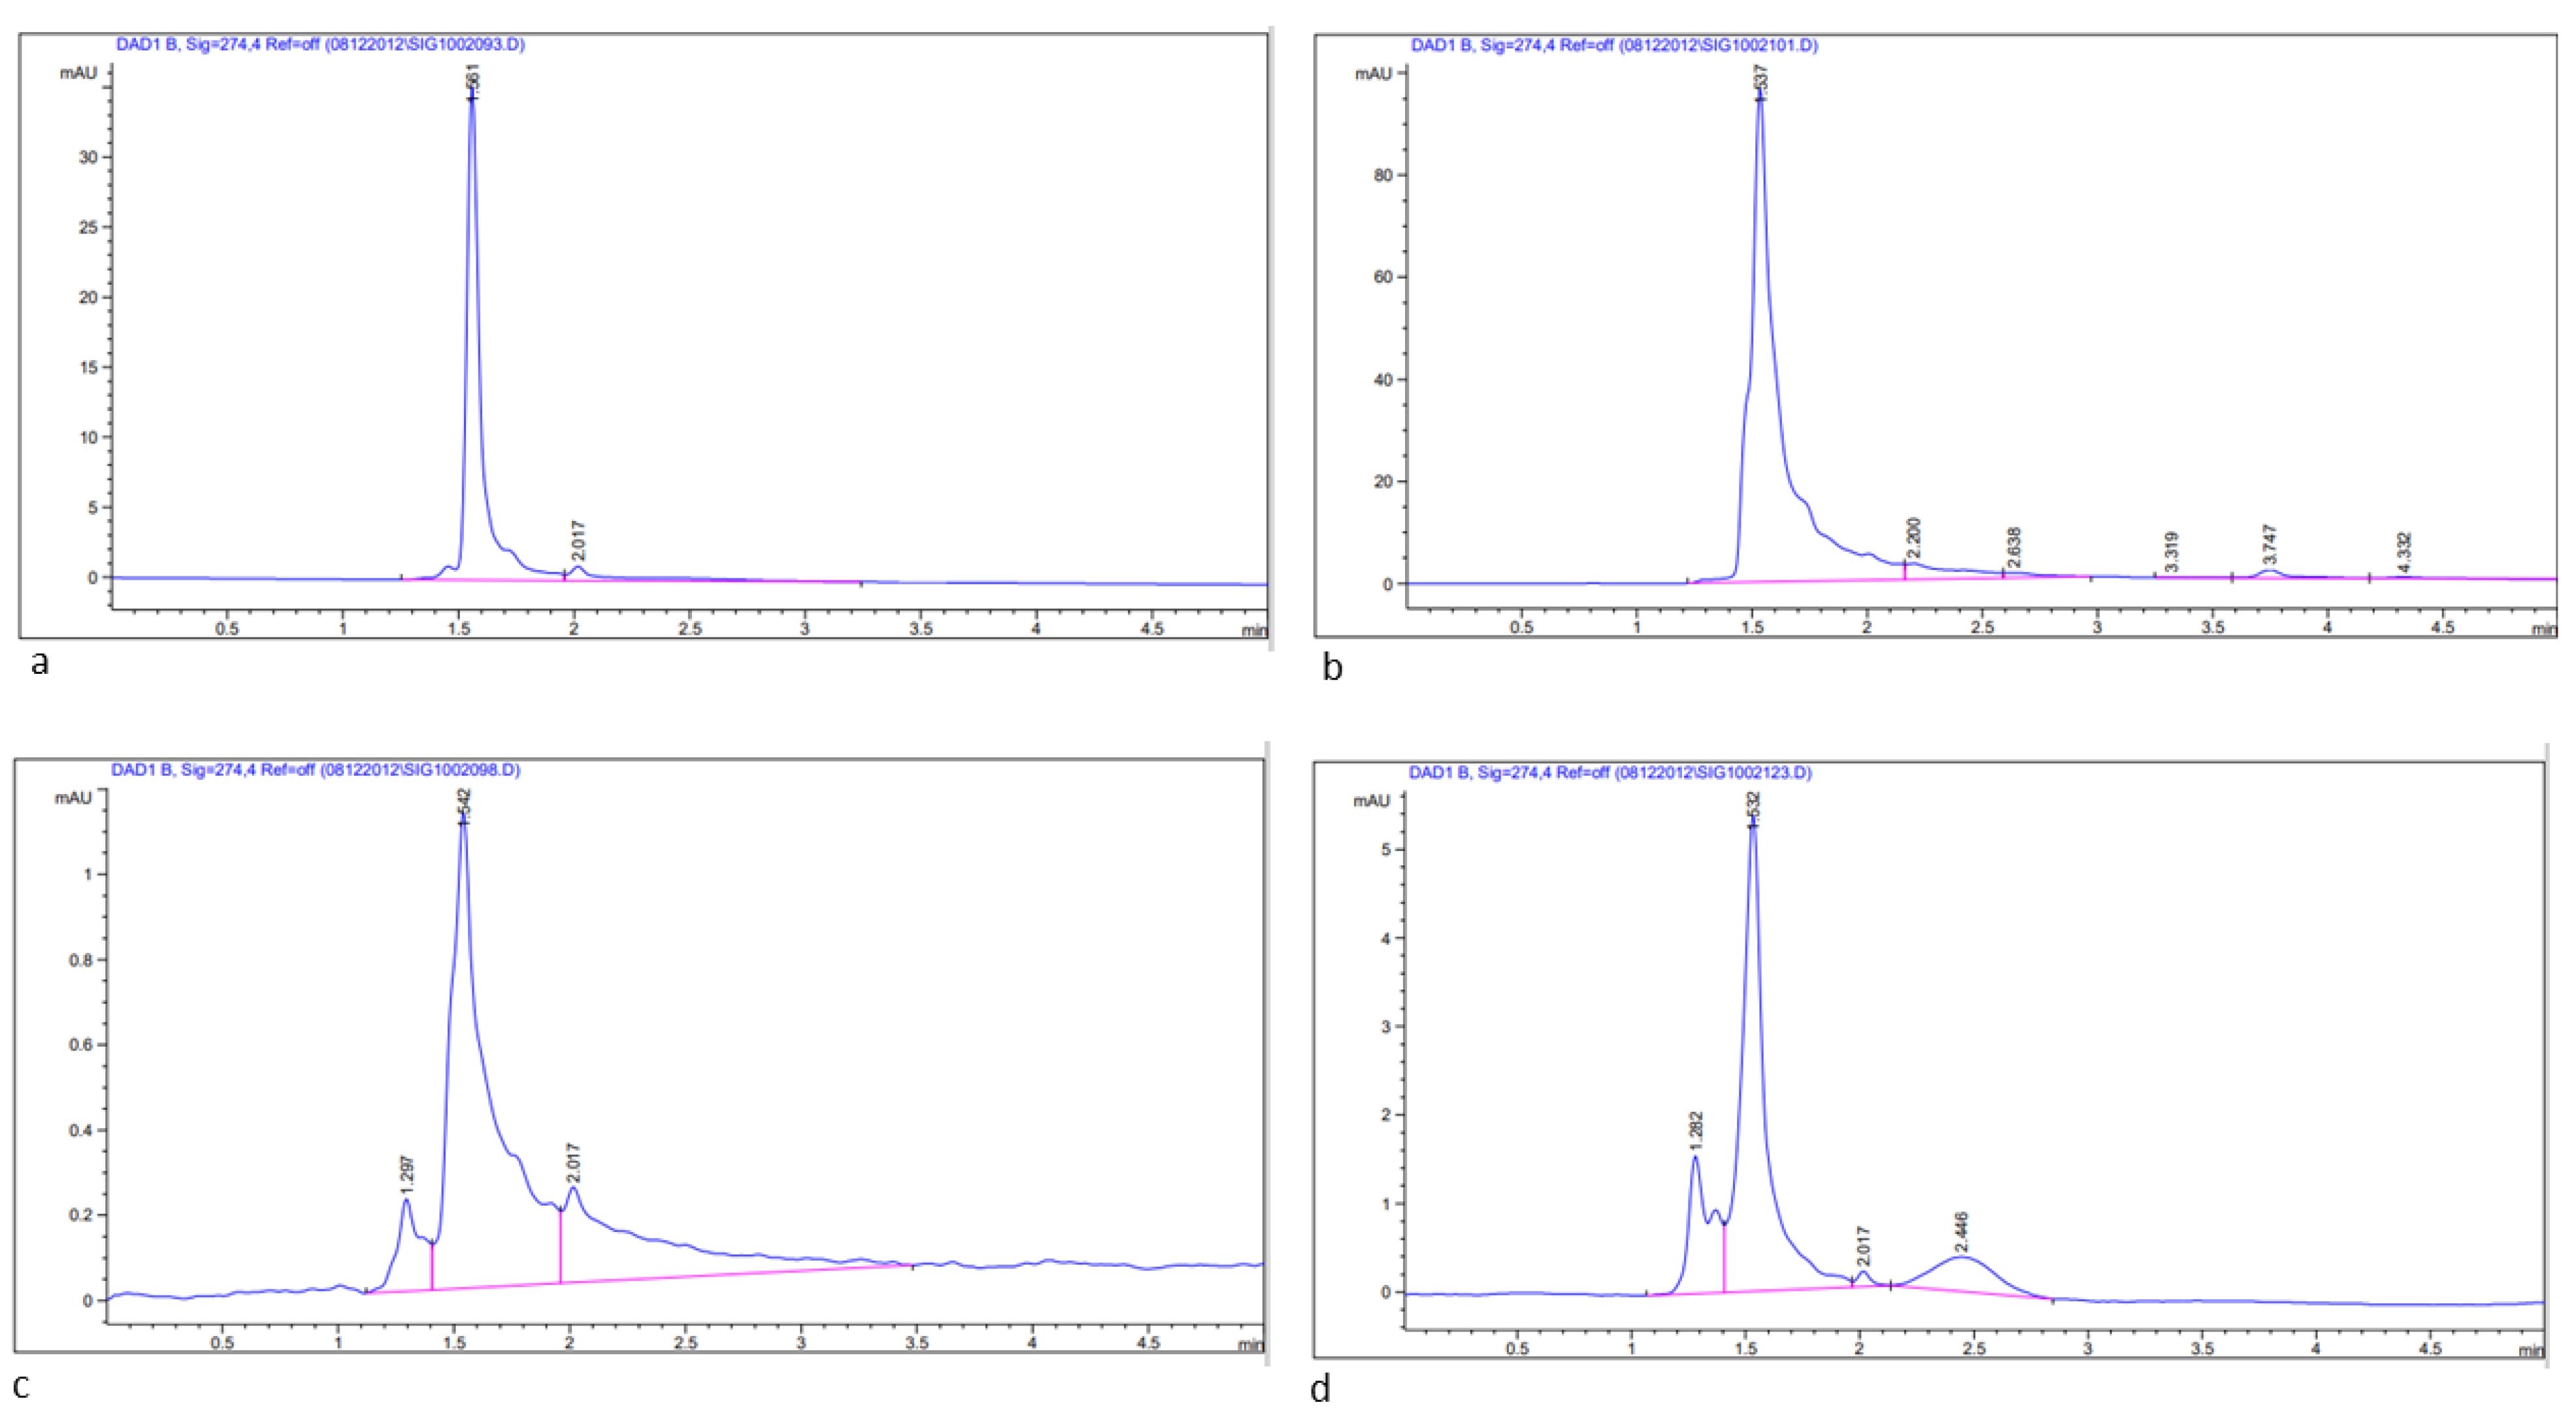
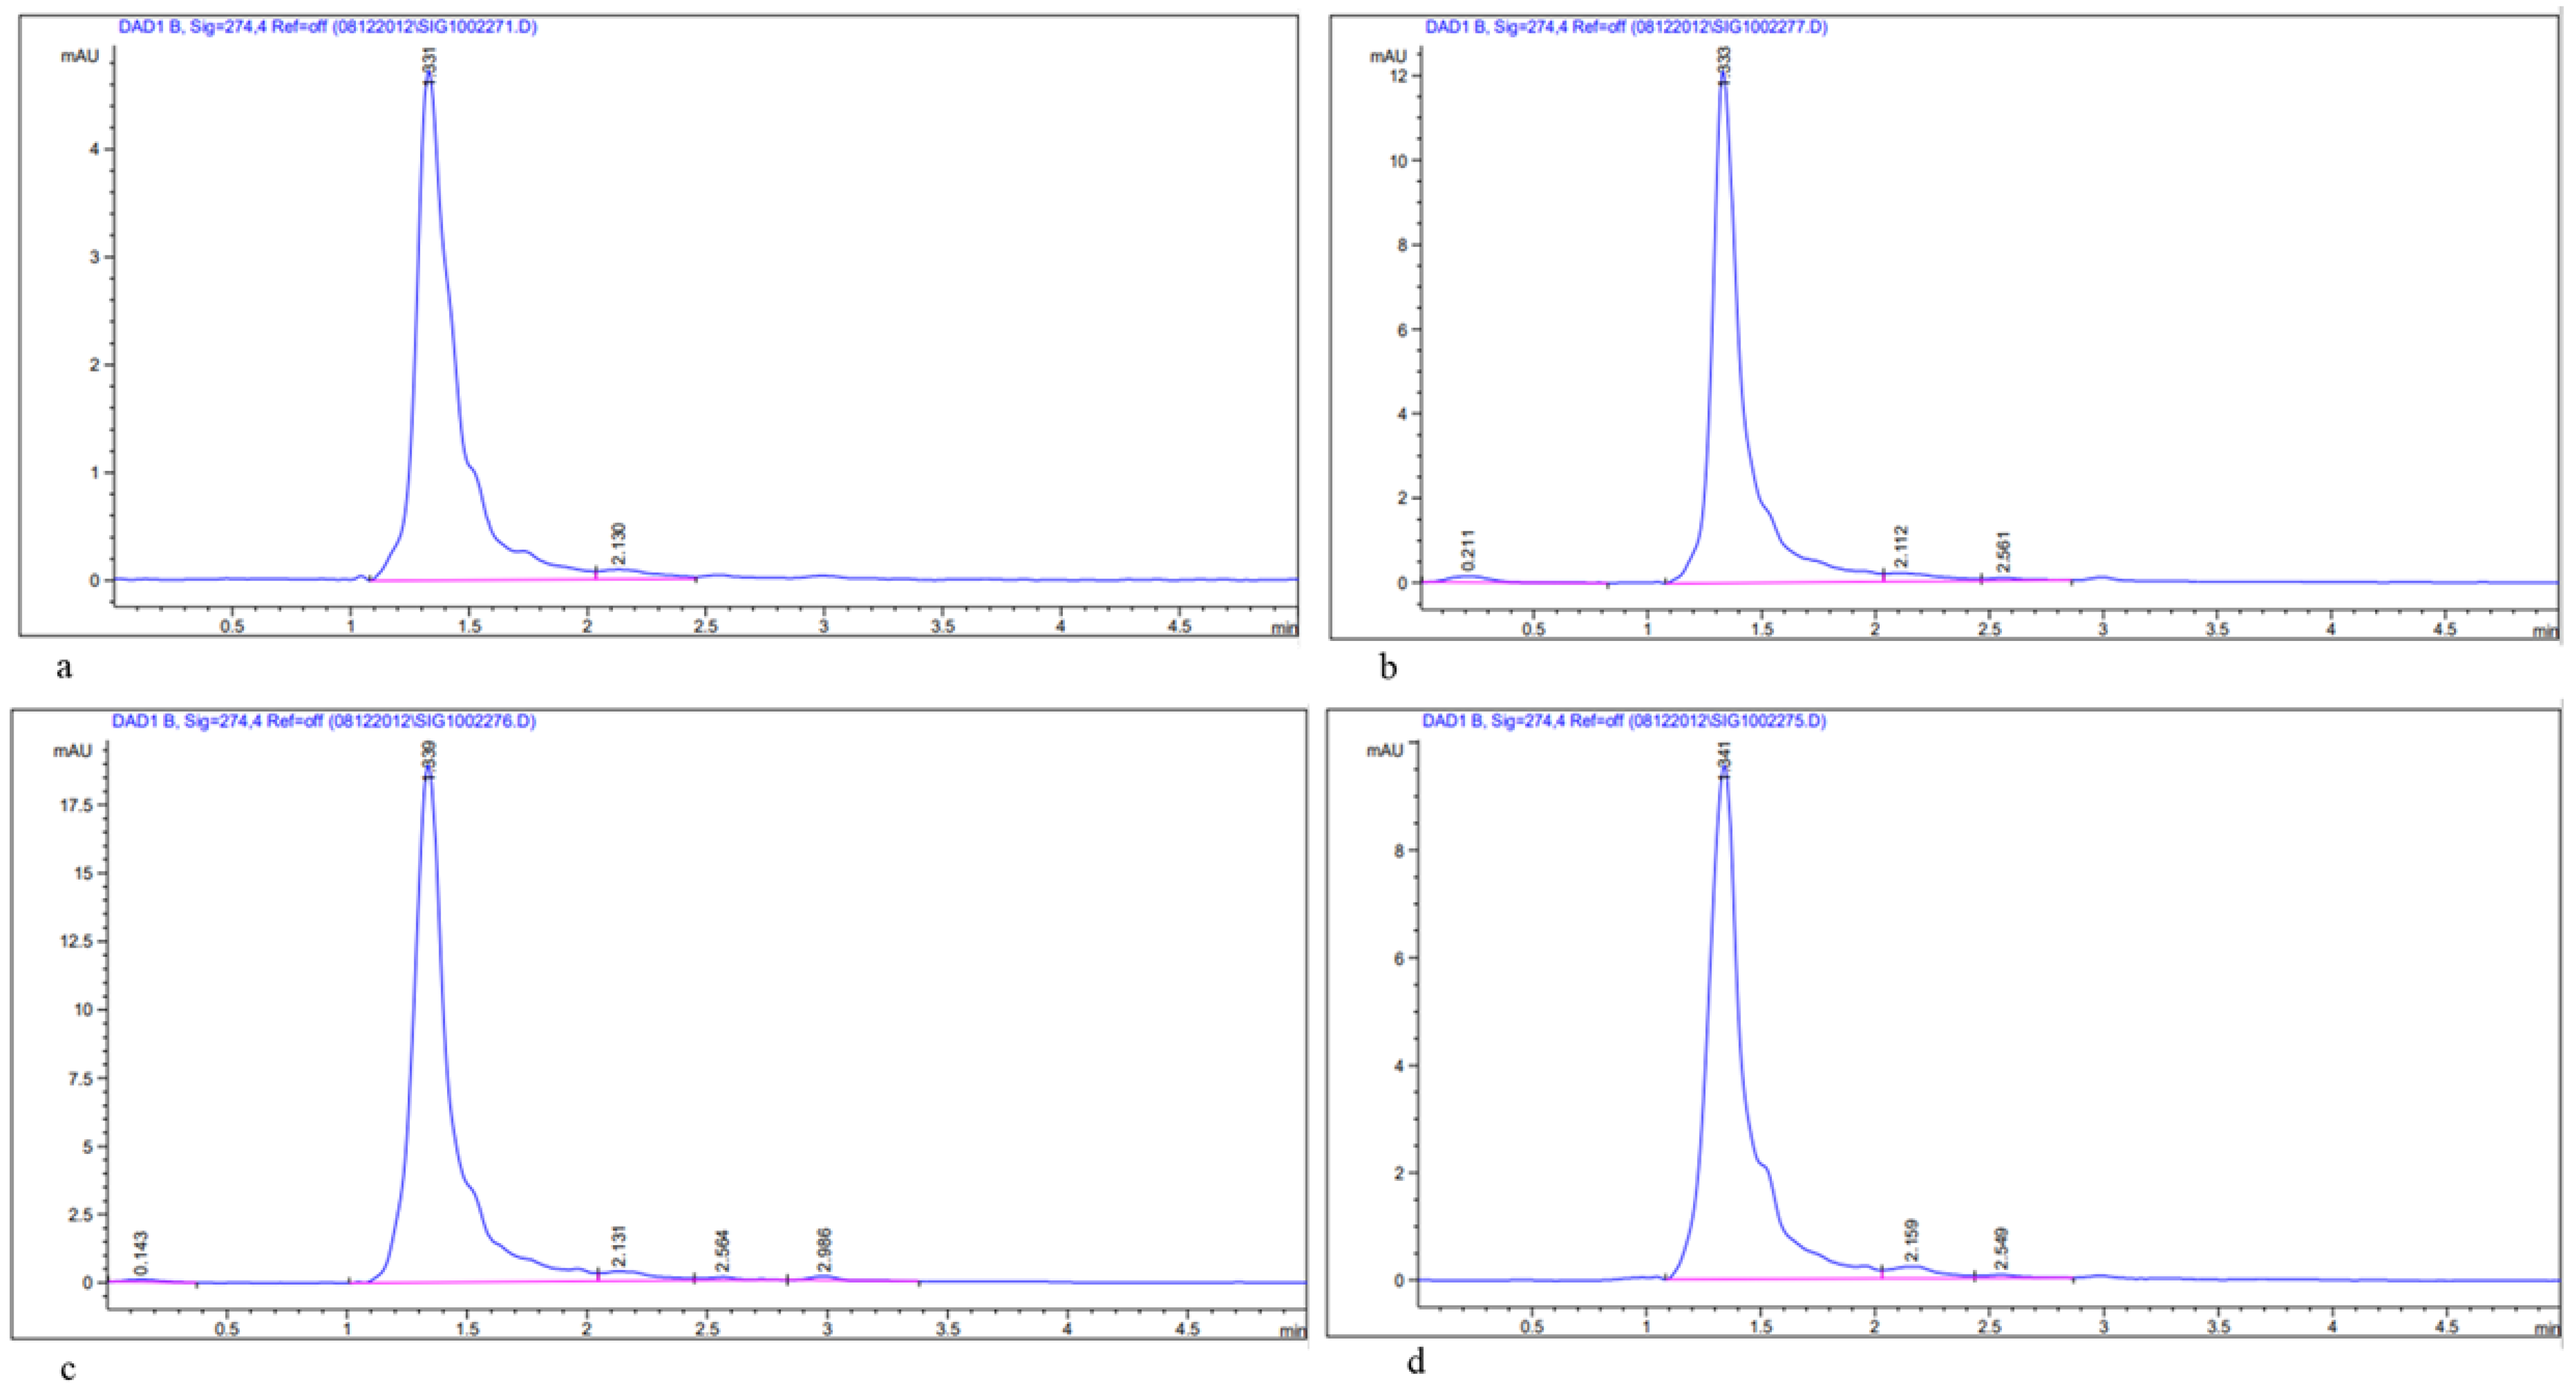
2.6.3. Estimation of Bioactive Compounds, Quercetin and Rutin in Methanolic Leaf Extract of Acacias Using HPLC

The quantification of flavonoid compounds was conducted using HPLC analysis with a UV-Vis diode array detector (DAD). The methanolic extract of the samples was analyzed using a Waters system (Agilent Technologies 1290 Infinity system, Santa Clara, CA, USA) coupled to a diode array detector with a 200–400 nm detection range and mobile phase for HPLC, as followed by Al-Qurainy et al. [35] with minor modification. The separation was performed in a ZOBRAX RX-C18 column (4.6 × 150 mm) in which the mobile phases were pumped at a flow rate of 0.800 mL/min (quercetin 3-β-d-glucoside) and 1 mL/min (luteolin 7-rutinoside) with a run time of 5 min and injection volume of 1 µL. The flavonoid standard solutions (quercetin-3-β-d-glucoside and luteolin 7-rutinoside) and samples were injected into the system using an auto-injector. Various mobile phases were checked at different flow rates with the same column temperatures in order to find a suitable separation method for the standards. Finally, the mobile phase (methanol and acetonitrile) was set up in the ratio of (65:35) for better separation of quercetin-3-β-d-glucoside, and for luteolin 7-rutinoside separation, methanol and 0.6% acetic acid (v/v) in HPLC grade water in the ratio of (65:35) was used. Both flavonoids (quercetin-3-β-d-glucoside and luteolin 7-rutinoside) were estimated at a wavelength (λ) = 274 nm. The standard compound, quercetin-3-β-d-glucoside and luteolin 7-rutinoside, were purchased from (Sigma–Aldrich, St. Louis, MO, USA) for estimation in samples by comparing their retention times (quercetin-3-β-d-glucoside, 1.54 min, and luteolin 7-rutinoside, 1.34 min) and absorbance spectra. Calibration curves were constructed with standard solutions (quercetin-3-β-d-glucoside) of 0.1, 0.2, 0.3 and 0.4 µg/µL and content in the samples were calculated with linear-squares y = 1244x + 23.5 using Microsoft Office Excel software with correlation values of ≥0.9956. Similarly, luteolin 7-rutinoside was calculated using the linear regression equations obtained from standard curve: Y = 5260X-2, (R2 = 0.9965, Y: peak area, X: rutin content). All samples were examined in triplicate to ensure the accuracy of the results.

2.7. Functional Groups Characterization by FTIR

Fourier transform infrared spectrophotometer (FTIR) is the most powerful technique for the identification of the nature of chemical bonds (functional groups) present in compounds. All the Acacias extracts were analyzed in triplicates for the reproducibility of the results. The wavelength of light absorbed by the functional group present in the compound can be seen in the spectrum. The scanning was achieved at wavelength 400–4000 cm−1, and results were shown in the % transmission analysis. The functional groups of the compounds were separated according to peak ratio (peak values in IR radiation region).

2.8. Statistical Analysis

The statistical analysis was carried out in SPSS software by one-way analysis of variance (ANOVA) followed by Duncan’s test for the estimation of genome size and phytochemicals. The fluorescence histograms were resolved into G0/G1 (2C), S and G2/M (4C) cell-cycle compartments. The mean fluorescence intensity of G0/G1 was used for the calculation of the 2C DNA content of Acacia species. Different letters were used on bars which represent the significant difference at p ≤ 0.05.

3. Results

The morphometric traits, including seed length and diameter, were measured among three species of Acacias. Both traits of seed were found to be highest in A.johnwoodii than the other two species, A. etbaica and A. origena (Table 1). Seed shape was also varied among them, as given in Figure 1. The seeds were sowed in the pot in the growth chamber to get the cotyledon for genome size estimation. The morphology and size of leaves varied among the Acacia species (data taken in pot experiment) (Figure 1). The largest variation in leaf length was observed in A. johnwoodii, followed by A. etbaica and A. origena, under normal conditions. The cotyledons of germinated seeds (20 days after sowing) were used for the estimation of genome size. The excised cotyledons from germinated seeds were washed with double distilled water before chopping them into the extraction buffer. The extracted and stained nuclei (propidium iodide) were scanned with a Muse cell analyzer. The cell cycle phase (G0/G1) was found to be highest in nuclei extracted using the MBO1 buffer in all Acacias, followed by GB, Tris-MgCl2 and LB01, respectively (Figure 2, Figure 3 and Figure 4). The sharp peak of the histogram that corresponds to the G0/G1 phase (2C level) of the cell cycle was detected in all species (Figure 2, Figure 3 and Figure 4), and the mean intensity of this phase was used for the calculation of genome size (2C DNA content). The peaks corresponding to the G2 + M (M = mitosis) phase (4C level) were also detected in all species.
The data represented in the table is the mean of three replicates ±SD. The significant differences between the Acacia species are shown by different letters in the table. Duncan’s test at p < 0.05 was used for the analysis.
The genome size (2C DNA content) was compared among and within Acacia species in different extraction buffers. The estimated genome size using different extraction buffers ranged from 1.91 to 2.21 pg (A. etbaica), 2.07–2.19 pg (A. johnwoodii) and 2.09–2.45 pg (A. origena), respectively (Table 2). Among the three species of Acacia, the highest genome size was found to be 2.45 pg/2C in A. origena with LB01 buffer, whereas the lowest was 1.91 pg/2C in A. etbaica with GB and MB buffers, respectively. Genome size remained the same within species in MB and GB buffer in all three Acacia species. However, it varied among species. No significant difference was found in genome size within A. origena, when nuclei were extracted with buffers (GB, MB and Tris buffers). All three species showed variation in genome size with Tris-MgCl2 and LB01 buffers. Significant differences were found in the genome size of A. etbaica and A. johnwoodii with Tris-MgCl2 and LB01 buffers.

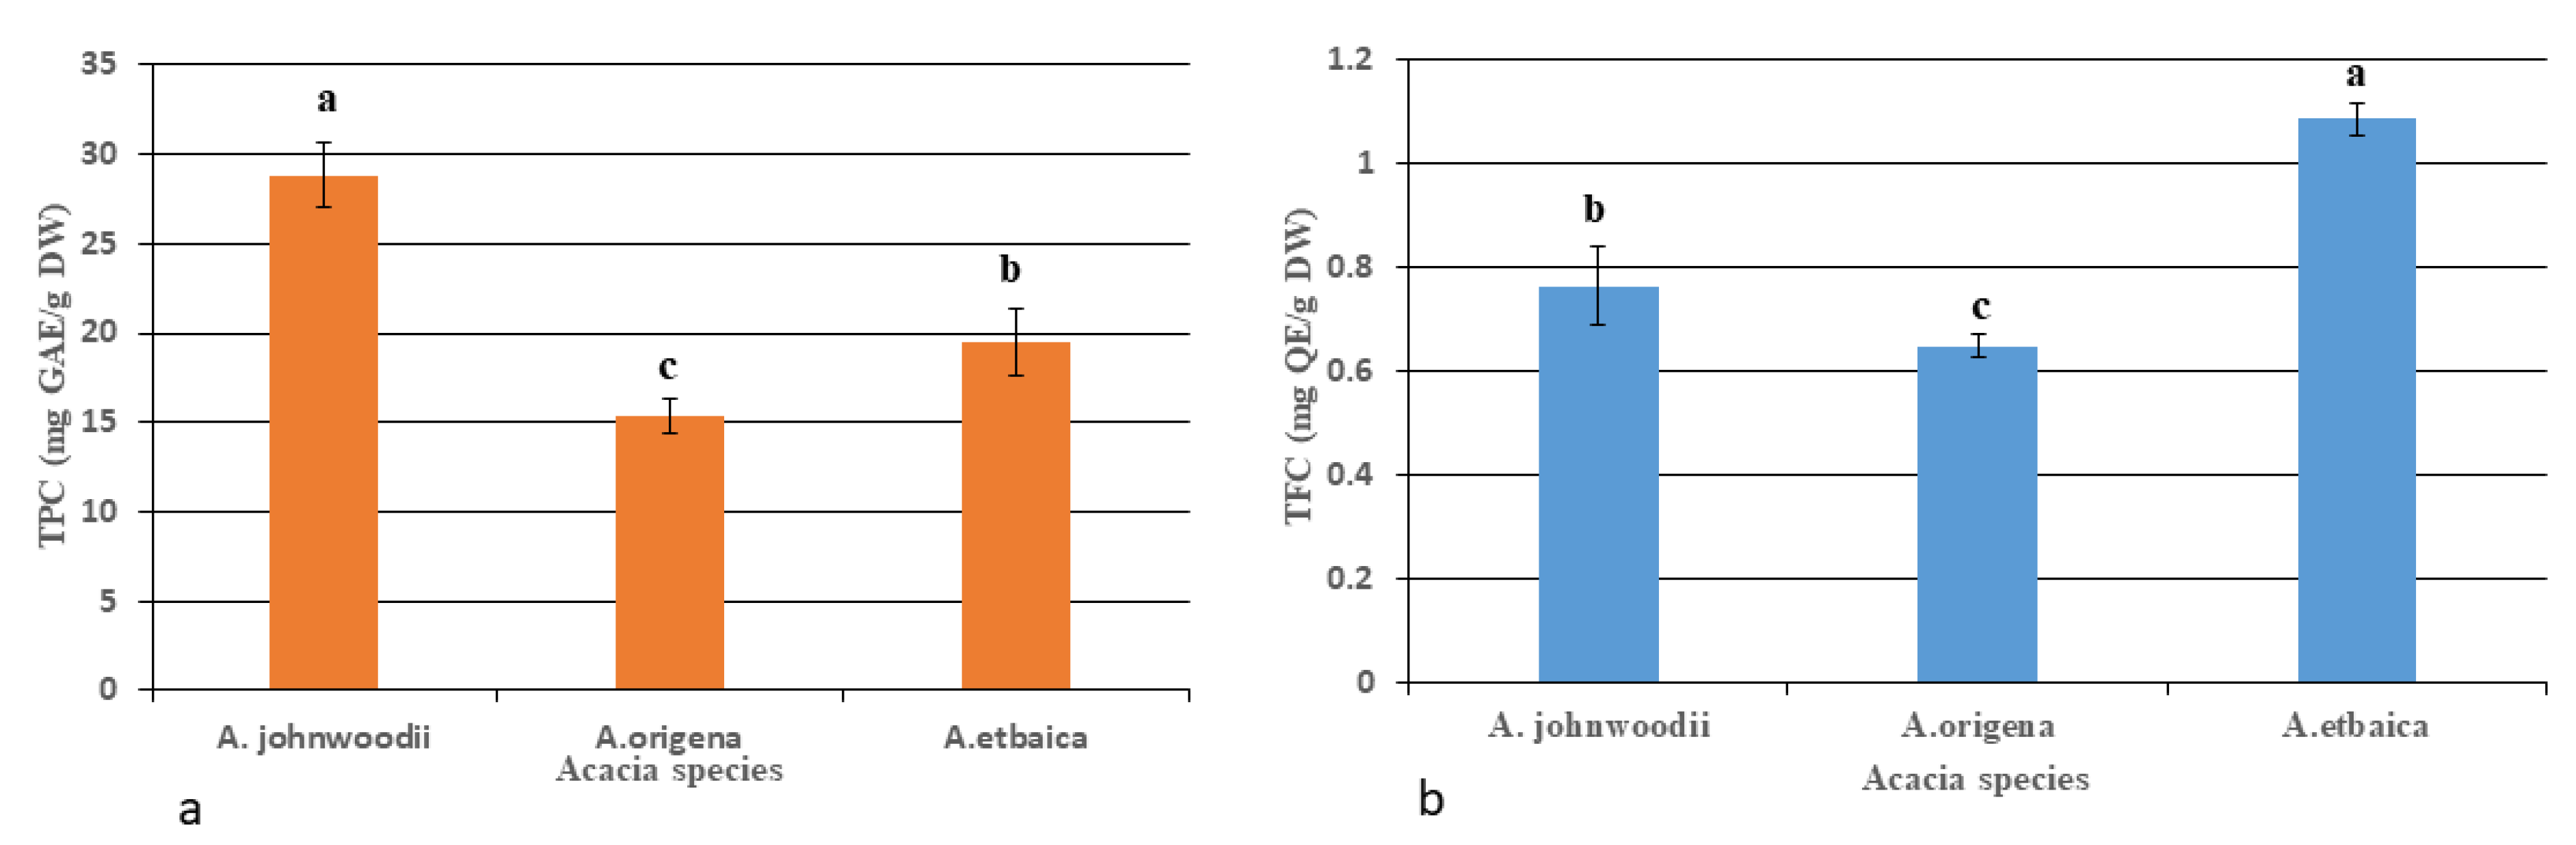
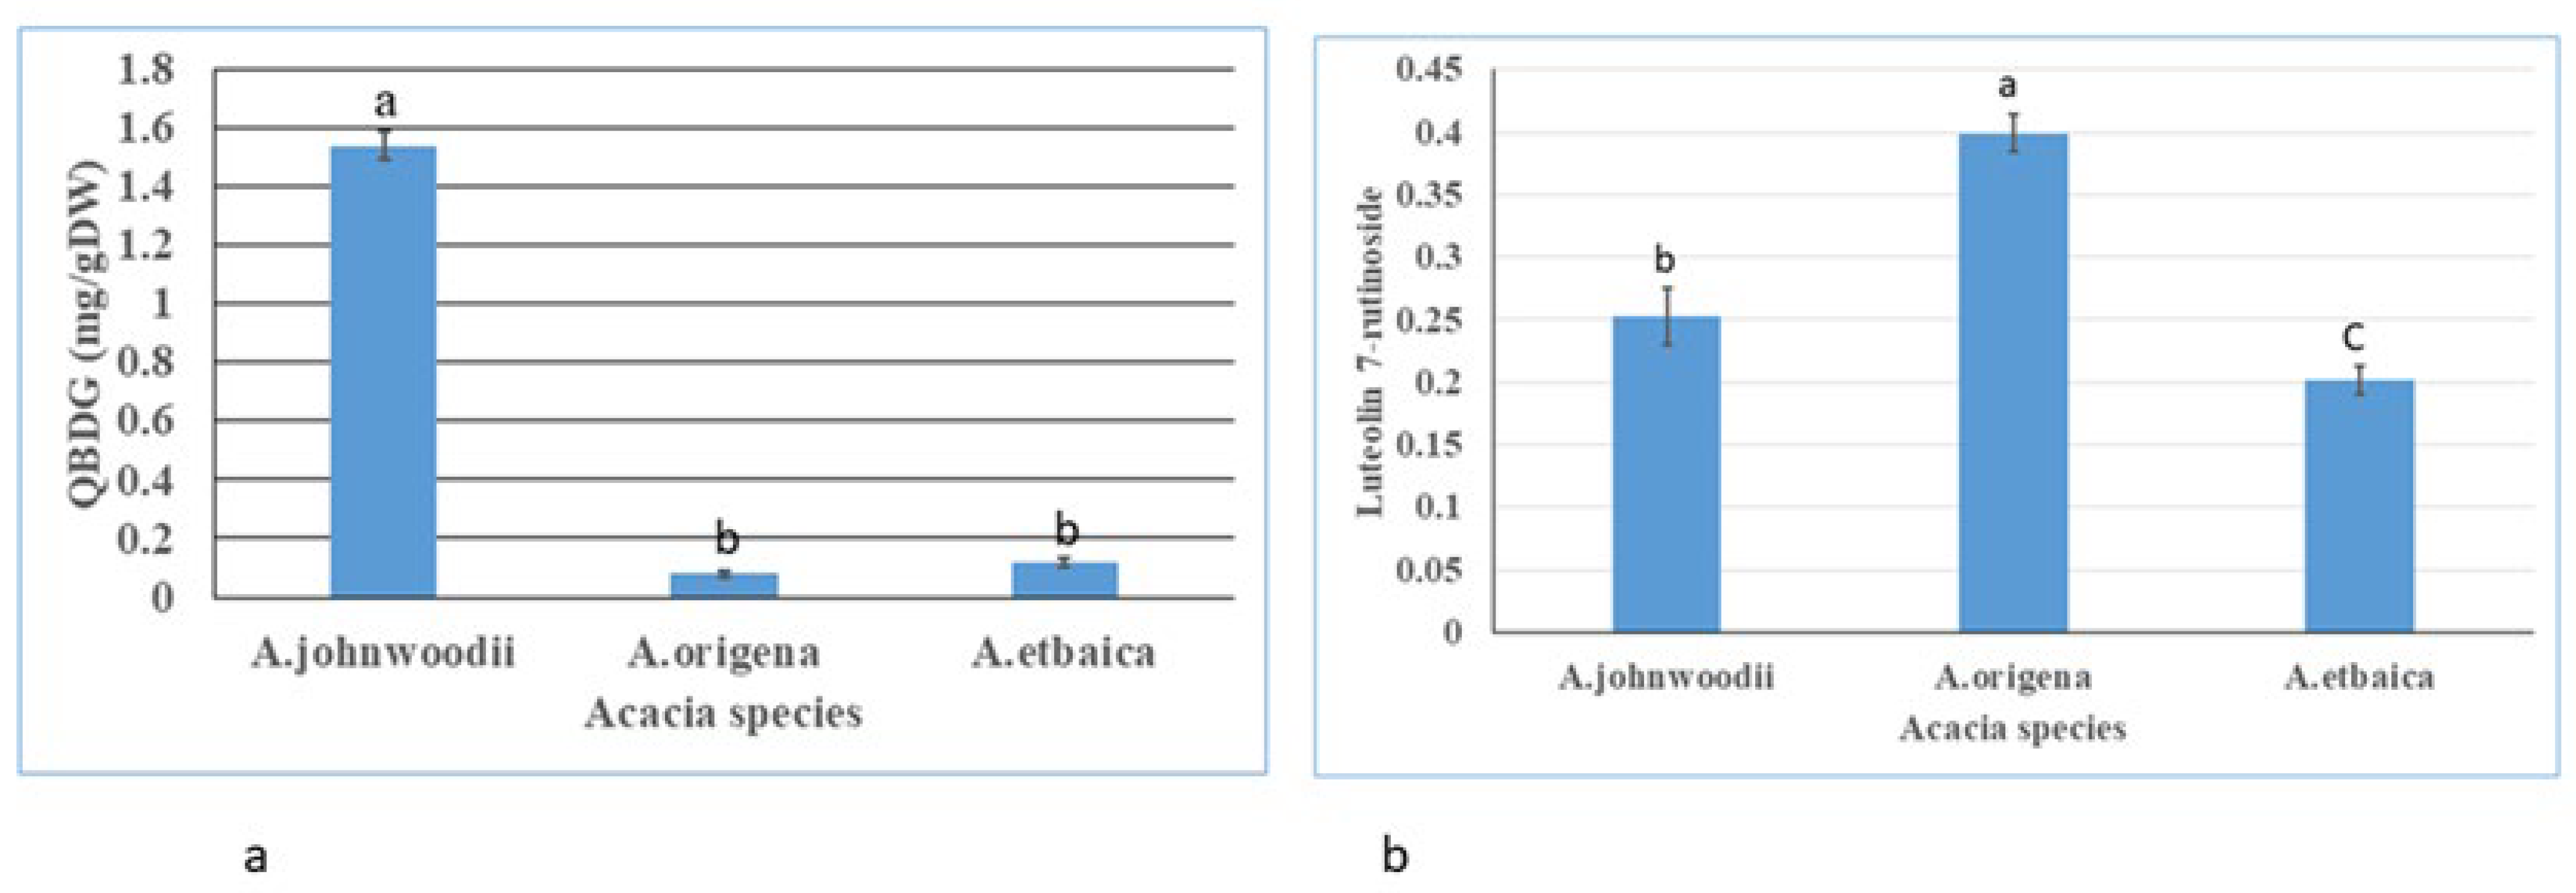
3.1. Determination of Total Flavonoids (TFCs), Total Phenols (TPCs), and Bioactive Compounds

Total flavonoids and phenols were measured using the UV-visible spectrophotometer following the methods used by Ordonez [38]; Ainsworth [37]. The total flavonoids and phenols were calculated using the quercetin and gallic acid (GA) standard compounds curve as generated by plotting the absorbance of different concentrations of quercetin and gallic acid. The TPC content was varied in Acacia species, and highest was to be detected in A. johnwoodii (28.84 ± 1.79 mg GAE/g DW), followed by A. etbaica (19.49 ± 1.87 mg GAE/g DW) and A. origena (15.32 ± 0.94 mg GAE/g DW), respectively (Figure 5a). In contrast to TPC, the TFCs content was found to be highest in A. etbaica (1.084 ± 0.30 mg QE /g DW), followed by A. johnwoodii and A. origena (Figure 5b). The bioactive compounds quercetin 3-β-d-glucoside (QBDG) and luteolin 7-rutinoside were detected in HPLC in considerable amounts in all Acacia species (Figure 6 and Figure 7). The quercetin 3-β-d-glucoside (QBDG), which is a flavonoid glycoside, was observed to be highest in A. johnwoodii (1.53 ± 0.04 mg/g DW) than the other two species of Acacia which had a low concentration of this compound (Figure 8a). The content of quercetin 3-β-d-glucoside content varied non-significantly between A. etbaica and A. origena. In contrast to quercetin 3-β-d-glucoside, the content of luteolin 7-rutinoside was detected in the highest concentration in A. origena (0.399 ± 0.01 mg/g DW), followed by A. johnwoodii (0.252 0.02 mg/g DW) and A. etbaica (0.202 ± 0.01 mg/g DW), respectively. However, a significant difference was observed in the content of luteolin 7-rutinoside among the species of Acacia (Figure 8b).

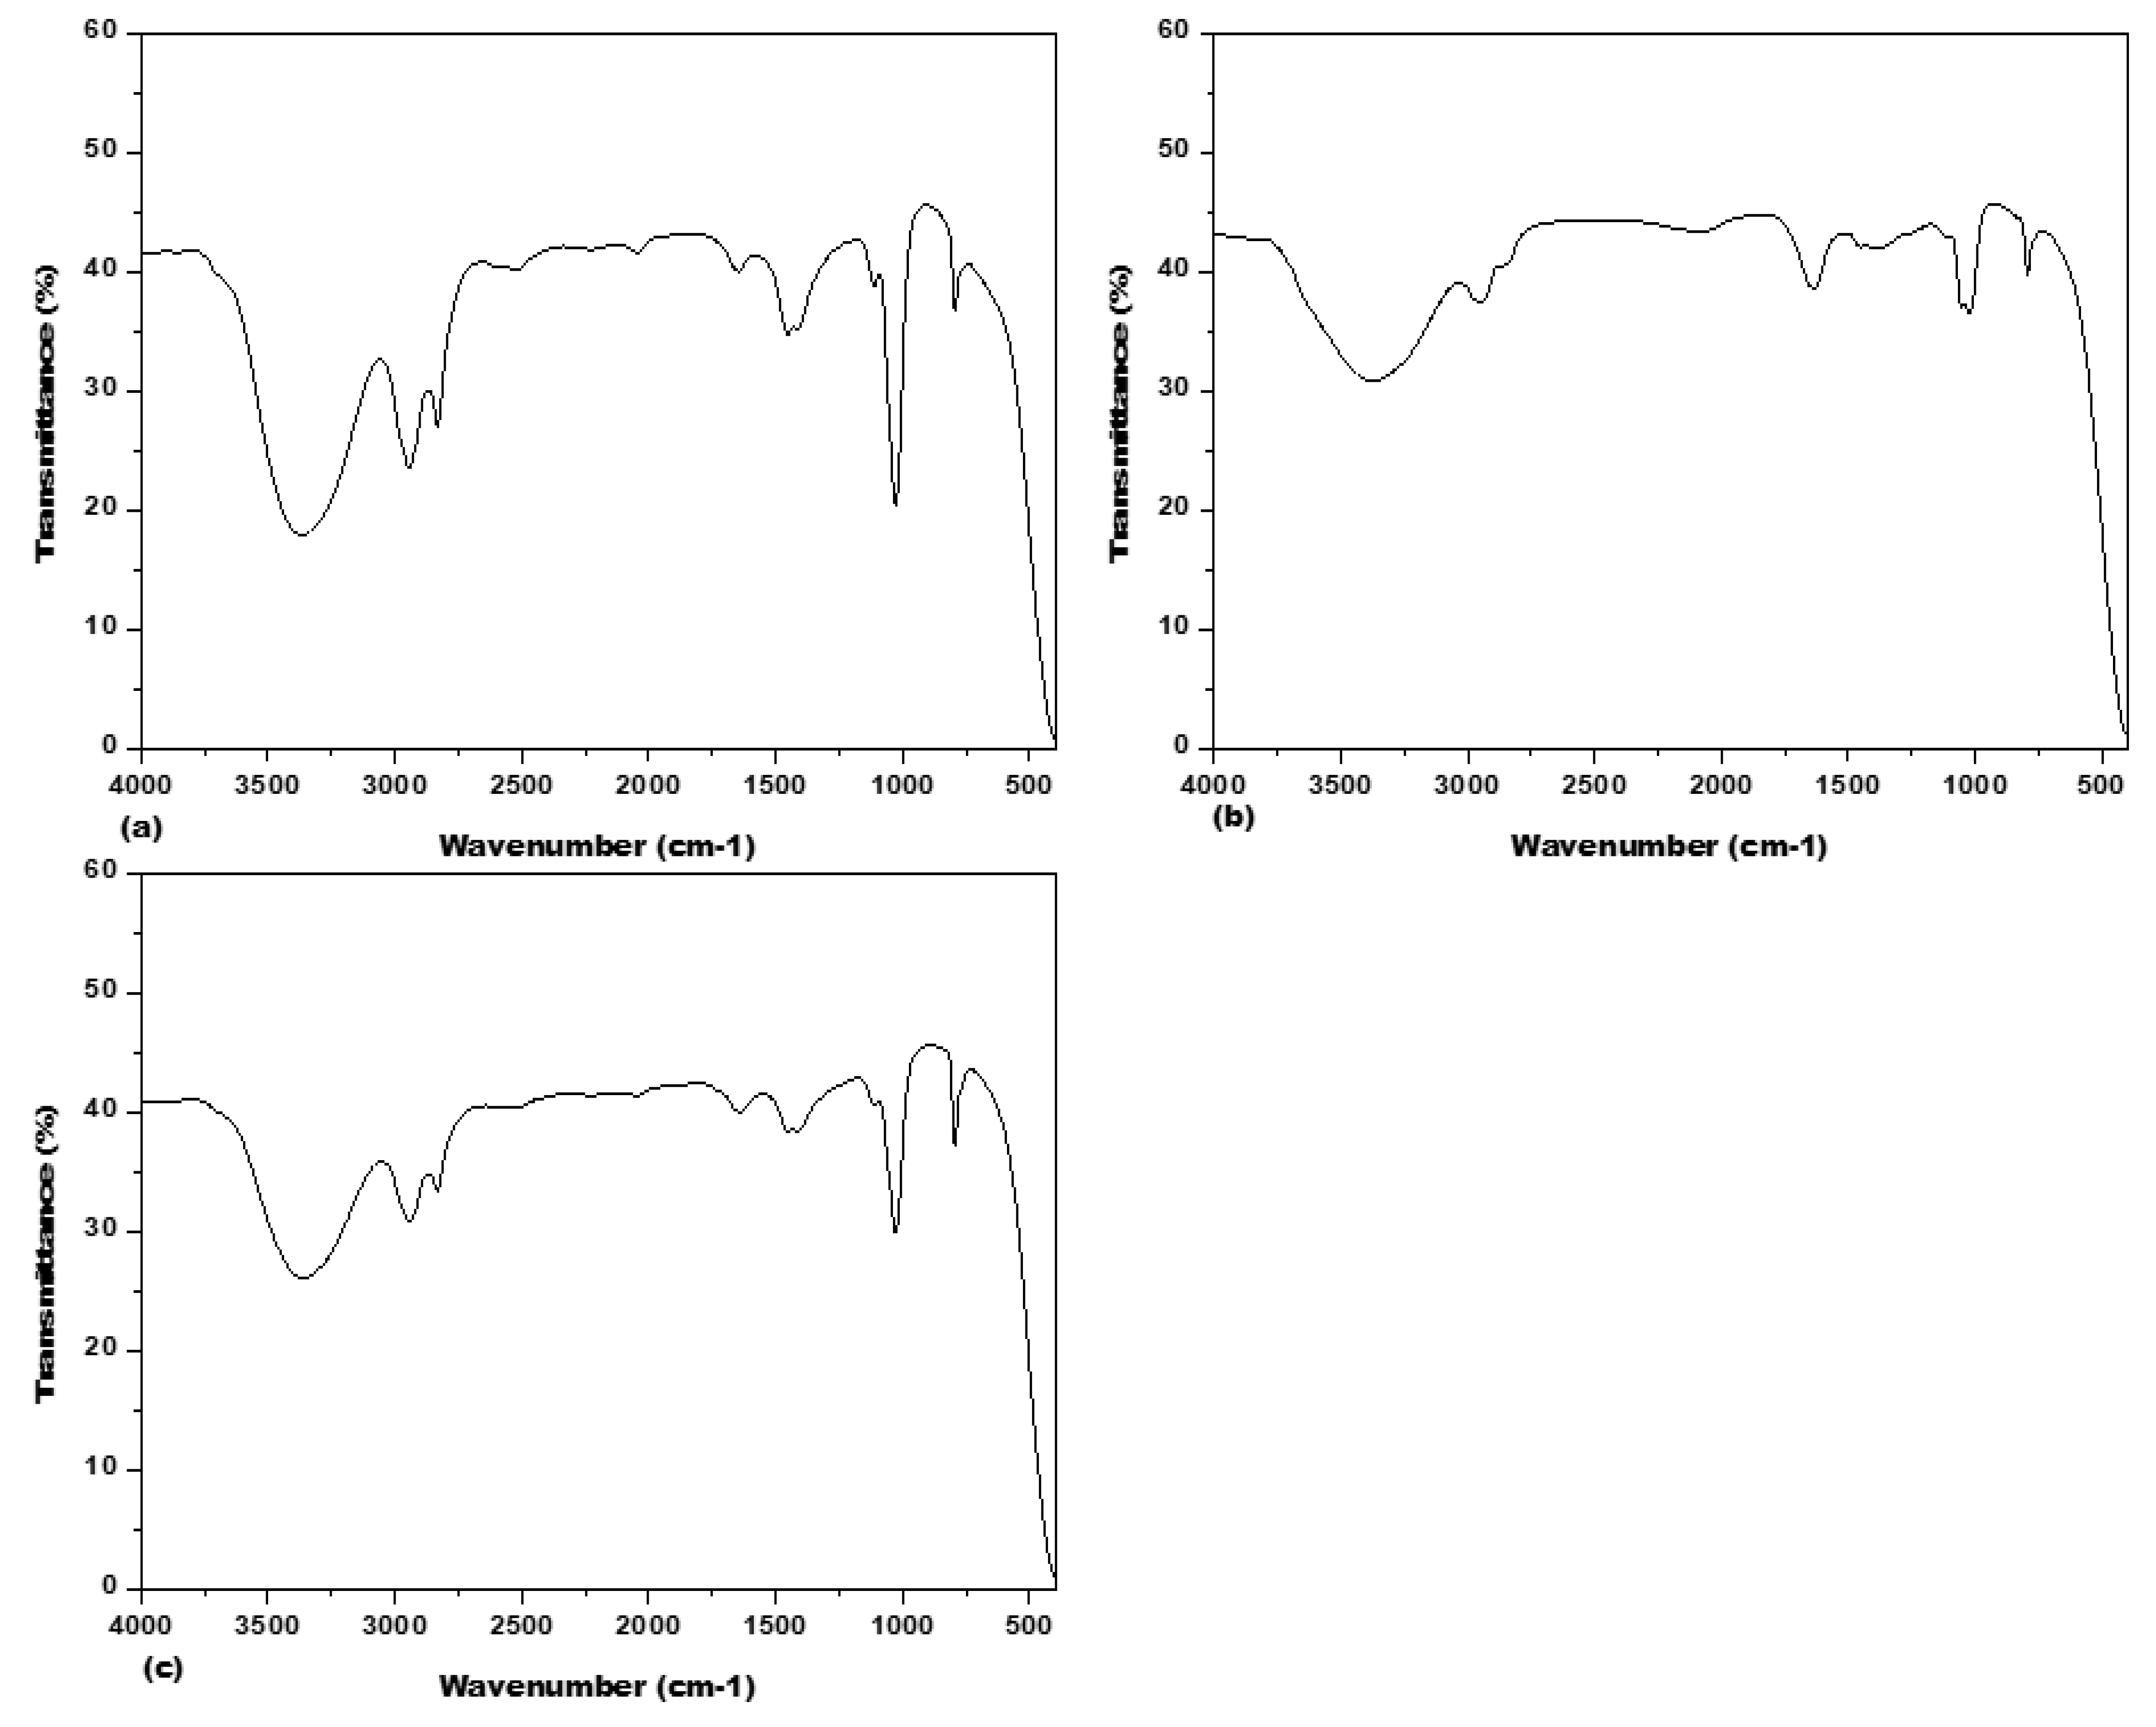
3.2. Fourier Transform Infrared Spectrometer (FTIR) Spectrum Analysis

Fourier Transform Infrared Spectrometer (FTIR) spectrum analysis was used to illustrate the functional group of bio-compounds based on the peak value in the infrared region (Figure 9) and assigned their functional groups (https://www.sigmaaldrich.com/SA/en/technical-documents/technical-article/analytical-chemistry/photometry-and-reflectometry/ir-spectrum-table, accessed on 5 July 2022). The more intense band occurring at 3363.62 cm−1, 2943.79 cm−1, 2834.06 cm−1, 1642.96 cm−1, 1642.96 cm−1, 1451.85 cm−1, 1028.52 cm−1 and 794.26 cm−1 corresponding to different functional groups for related compounds in A. origena (Table 3).
In A. etbaica, the intense band was observed at 3375.47 cm−1, 2947.10 cm−1, 2076.89 cm−1, 1637.10 cm−1, 1398.89 cm−1, 1022.61 cm−1 and 794.46 cm−1 corresponding to various functional groups present on different compounds (Table 4). Similarly, the peak value detected for the functional group for compounds present in A. johnwoodii at 3368.71 cm−1, 2944.93 cm−1, 2833.19 cm−1, 1648.33 cm−1, 1452.43 cm−1 and 793.82 cm−1, respectively (Table 5).

4. Discussion

Acacias grow in dry, hot environments due to the presence of their xeromorphic structure. The high-water holding capacity of leaves and well-developed root system enable Acacias to adapt to their dry, hot environment. To analyze the plant based on such abiotic stress tolerant character, genome size and phytochemical study are necessary. Plant genome size influences stress tolerances in plants via plasticity [39]. The genome size has an impact on various parameters of the plant, such as drought tolerance, various nutritional growth, and herbivore defense traits [40,41]. Information about the genome size of any plant is very important as it has a strong correlation to many traits of the plants and their evolutionary aspects. In the present study, the seeds of all three species were collected from the same geographical region, time and same environmental conditions for genome size estimation and phytochemical study. The plants were grown in a growth chamber under optimum conditions. The morphological traits of Acacia species, including seed shape, size and leaf morphology, were different from each other (Figure 1). However, seed color was almost similar among the three species. The largest variation in leaf size was observed in A. johnwoodii than the other two Acacia species. Overall, the morphological traits were observed to be superior in A. johnwoodi than A. origena and A. etbaica. Similarly, the genome size of A. johnwoodii (2.19 pg/2C DNA content) was higher than A. etbaica (1.91 pg/2C DNA content) and A. origena (2.09 pg/2C DNA content) in the same extraction buffer. Variations in seed mass have been more closely associated with variations in genome size than with divergences in other ecological and morphological variables [42]. The strong relationship between DNA content, cell division rate and cell size could lead to predictable morphological differences in plants, including a negative relationship with leaf mass per unit area [43].
Identification of Acacia species according to phenotypic (morphological) characters is very difficult as sometimes these markers overlap with each other. Plant genomes provide knowledge on biosynthetic pathways engaged in the synthesis of phytoconstituents. Plant phenotypic expression [42,44], cell size, mitotic cell cycle and their constituent organelles [45] have been correlated to the genome size. The estimated genome size herein in Acacia species could be used for their identification based on observed variation among them. The genome size estimated with two buffers, namely MB01 and GB, was found to be the same within Acacia species and could be used for the identification of these species. In some study, genome size was stable within an individual and usually within a species [46,47]; however, there are notable exceptions where variation have been observed within species [48].

4.1. Genome Size (2C DNA Content) Variation within and among Acacias

For the first time, the genome size (2C DNA content) was estimated in Acacias, including A. johnwoodii, A. etbaica and A. origena, which are important species found in the Kingdom of Saudi Arabia. All three species had shown genome size variation within and among when nuclei extracted with LB01 and Tris MgCl2 buffer. According to extraction buffers (MB01 and GB), the genome size within Acacia species was found to be the same; however, it varied among the species (Table 2). The result obtained in the current study for genome size (2C DNA content) was supported by the work of other researchers who worked on various plant species of the same genus and their populations [22,49,50,51]. Ouarda et al. [52] found genome size variation in Acacia tortilis from 2.95–3.03 pg/2C in Tunisian, and those originating from Zimbabwe had consistent genome sizes (2C nuclear DNA = 1.39–1.40 pg).
Various reasons might be possible for genome size variation in studied Acacias, including biotic and abiotic factors prevailing in the natural habitat. Secondly, all three Acacias are different species that belong to the same genus, so this might be the reason for the variation in genome size. The genome size diversity in plant species is partly related to variations in chromosome number [53], and polyploidy is recognized as one of the main reasons for genome size variation [54]. Knight et al. [13] provided a literature review that covers several factors that have been linked to DNA content variation in plants, such as species diversity, latitude, altitude, precipitation temperature, generation time, seed mass, various leaf anatomical traits and growth rate. Some studies have found relationships between abiotic field conditions and genome size in plant species [45,55]. In another study, it was observed that climate seasonality and biotic interactions are potential forces shaping the evolution of genome size [56]. The ecological factors could also be important in shaping the evolutionary dynamics of genome size [57] and the origins of secondary compounds through gene duplication events [58].
Extraction buffer has an important role in genome size determination as different extraction buffers have different chemical compositions, which could help in the extraction of nuclei from different plant species in different levels of quantity and quality. The purpose of using different extraction buffers in the present study is to measure the accurate genome size of Acacias, as one nucleus extraction buffer cannot use for all plant species. In our study, genome size varied within and among Acacia species significantly and non-significantly in some buffers (Table 2), whereas it remained the same in some buffers. Different extraction buffers may give variation in the yield and quality of extracted nuclei, which results in variation in genome size (2C DNA content), as reported by Sadhu et al. [22].
The isolation of nuclei in pure form is very important for genome size estimation as the presence of various secondary metabolites and chlorophyll in the plant cell decreases the purity of nuclei suspension and further affects fluorochrome fluorescence. Such compounds exacerbate the problem of nuclei extraction and thus, affecting sample quality and causing problems in DNA staining [59,60]. According to Noirot et al. [59], caffeine and chlorogenic acids present in Coffea spp. hinder the PI’s intercalation to the DNA. Similarly, Lycium species contain numerous cytosolic compounds, such as flavonoids and phenolic acids [61], which can interfere with the fluorescent staining of nuclear DNA [60,62]. Therefore, sample selection is very important for the extraction of pure nuclei. We used cotyledons of germinated seeds of Acacias for the extraction of pure nuclei, which had a low quantity of secondary metabolites and chlorophyll content as compared to the leaf sample. Extraction of nuclei from cotyledons was found to be pure as compared to leaf. Initially, we used the same buffer composition as reported in the literature for the extraction of nuclei; however, we could not get the sharp peak in FCM and hence were unable to estimate accurate genome size (data not shown). Therefore, we modified the buffer composition by adding the PVP (2% w/v) and 0.6% β-mercaptoethanol (v/v), which reduced the compounds’ interaction with nuclei released from the cell and improved the purity of nuclei as indicated by sharp peaks in all Acacias (Figure 2, Figure 3 and Figure 4). The compound β-mercaptoethanol is a reducing agent and checks the activity of phenolic compounds in the presence of another competitor, such as PVP, and breaks the hydrophobic interactions [63]. In another study, Sadhu et al. [22] used 1% of PVP in different extraction buffers, which yielded good-quality nuclei from plants of different genera of the same family from both root and shoot tissues. In earlier reports, it has been reported that PVP reduced the effect of polyphenols by changing their conformational structure, maintaining the cell compounds in a reduced state and making hydrogen bonds [63,64,65]. Thus, our result revealed that the two extraction buffers viz., GB and MB01, could be used for the extraction of nuclei for estimation of genome size as no variation in genome size within Acacia species has been observed as compared to other extraction buffers used in this study.

4.2. Phytochemicals Profiling in Acacias

Phytochemicals are secondary metabolites that defend the plant and are used as medicine to cure various human diseases. Phytochemical profiling was performed using the methanolic extract of young leaves of Acacia species for comparative study based on TFCs, TPCs and bioactive compound contents. The present study was conducted in the growth chamber for phytochemicals comparison among three Acacia species (A. johnwoodii, A. etbaica and A. origena). The leaves were harvested from 3-month-old plants for the extraction of phytochemicals in methanol. Fourier-transform infrared spectroscopy (FTIR) results showed the presence of different functional groups present on compounds in all Acacia species. The functional group detected on compounds were almost similar except for some unique functional groups, as aliphatic ether was detected in A. johnwoodii whereas isothiocyanate, cyclic alkene and sulphonyl chloride were detected in A. etbaica. However, functional groups, including Imine/oximes and conjugated alkenes, were not detected in A. johnwoodii, whereas these were detected in the other two species of Acacia. The obtained results show that FTIR spectroscopy is a rapid, reliable method for the comparative study of Acacias. This is one type of analytical method of fingerprinting for the identification and differentiation of plant species. Such type of fingerprinting method has been used for the identification of various plant species such as Lycium, some moss species, birch species and Rhodobryum roseum Limpr. and its adulterants [66,67,68,69].
Total flavonoids (TFCs) and phenolic contents (TPCs) were measured by colorimetric spectrophotometry, and they varied among the Acacia species significantly. Among the three species of Acacias, the TPCs were observed to be highest in A. johnwoodii (28.84 ± 1.79 mg GAE/g DW) than the other two species of Acacia (A. etbaica and A. origena) significantly. However, in contrast to TPCs, the TFCs were found to be highest in A. etbaica. This large variation in phenolic and flavonoid contents among Acacias might be responsible for different levels of medicinal properties. Many species of Acacia have shown medicinal properties and have been used in different countries. Several species of Acacia have important resources of bioactive compounds such as phenolics, flavonoids, alkaloids, saponins, terpenoids, polysaccharides and tannins [70] which are responsible for several pharmacological effects, including hypoglycemic, antibacterial, anti-inflammatory, anti-platelet aggregation, anticancer, anti-atherosclerotic, anti-hypertensive and analgesic properties [71]. The present result was supported by other researchers who observed variation in secondary metabolites (TFCs and TPCs) in different plant species belonging to the same genus, including Iris species and Monochoria species [72,73].
A high-performance liquid chromatographic method was used for the quantitative determination of luteolin 7-rutinoside and quercetin 3-β-d-glucoside, which are important flavonoids in plants. These bioactive compounds were extracted in 100% methanol from the young leaf of A. johnwoodii, A. origena, and A. etbaica, as methanol is a good solvent for the extraction of secondary metabolites. Different types of flavonoids are found in plants as quercetin-3-rutinoside, rutoside, sophorin and luteolin 7-rutinoside [74,75], and they have different pharmacological activities. The flavonoids, quercitrin and quercetin 3-β-d-glucoside (QBDG) act as a chemical chaperone for the A4V SOD1 ALS-causing mutant [76]. The concentration of both compounds, including quercetin 3-β-d-glucoside and luteolin 7-rutinoside, varied among the Acacia species. This variability of bioactive compound content has differentiated the Acacia species from each other as the highest concentration of quercetin 3-β-d-glucoside was found in A. johnwoodii and Luteolin 7-rutinoside in A. origena. The compound luteolin glycoside is found in different plant species, such as artichokes [77] and possesses a varied range of biological activities participating in the prevention and treatment of various diseases. Luteolin plays a vital role in shielding plants against ultraviolet radiation [26,78].
Based on the phytochemical study, TFCs, TPCs, luteolin 7-rutinoside and quercetin 3-β-d-glucoside, all three species of Acacia showed variation in a controlled environment, and these might have different pharmacological activities. The reason behind this variability of phytochemicals in these Acacia species might be due to the genotype variation (different species of the same genus) since no stress was imposed on the plant at any stage. However, the biosynthesis of such compounds, including phenolics, depends on the plant stage [79], growing conditions, species exclusiveness, vegetation period (altitude, climatic factors and soil properties) [80,81,82,83], and seasonal variation [84]. The variation in the content of flavonoids and phenolics has been observed in different species of Acacias and in their different parts [85,86]. Such compounds (flavonoids) could be used in other plant species effectively to analyze the evolutionary relationships of different plant families and for their authentication.

5. Conclusions

Estimation of genome size is very important in plant species as it makes whole genome sequencing easy, which will support carrying out a more comprehensive study of the evolution and origin. The results of the present study on genome size and phytochemical study on different species of Acacias are the first time that could be used further for molecular biology research. Our study shows that genome size (2C DNA content) varied among the species of Acacias. Among different nuclei extraction buffers, MB01 and GB proved to be the best buffers for extraction of nuclei for estimation of genomes size and could be used for other Acacia species as genome size within Acacia species remained the same. FTIR spectra of leaf extract revealed the presence or absence of diverse functional groups on a compound, and some are unique to Acacia species. The leaves of Acacias species showed the presence of quercetin 3-β-d-glucoside and luteolin 7-ritinoside, which are good antioxidant flavonoids. Further, the research could be performed in natural habitats for the screening and estimation of phytochemicals during different seasons as well as under abiotic stress conditions. More detailed studies of the phytochemical profile and extraction of individual phenolic compounds need to be carried out in the future.

Author Contributions

Conceptualization, S.K. and M.N.; methodology, S.K., M.N., and F.A.-Q., A.M.S.; software, M.T. and M.N. investigation, S.K.; results, S.K. and M.N.; writing—original draft preparation, S.K. and M.N.; writing—review and editing, S.K. and M.N.; supervision, F.A.-Q., A.A.-h. and H.O.S. software analysis. All authors have read and agreed to the published version of the manuscript.

Funding

The authors extend their appreciation to the Researchers Supporting Project No. (RSP-2021/73) at King Saud University, Riyadh, Saudi Arabia.

Institutional Review Board Statement

Not applicable.

Informed Consent Statement

Not applicable.

Data Availability Statement

All the data supporting the findings of this study are included in this article.

Conflicts of Interest

The authors declare no conflict of interest.

References

  1. Orchard, A.E.; Maslin, B.R. (1584) Proposal to conserve the name Acacia (Leguminosae: Mimosoideae) with a conserved type. Taxon 2003, 52, 362–363. [Google Scholar] [CrossRef]
  2. Maslin, B.; Miller, J.; Seigler, D. Overview of the generic status of Acacia (Leguminosae: Mimosoideae). Austral. Syst. Botany 2003, 16, 1–18. [Google Scholar] [CrossRef]
  3. Javed Muhammad, A.; Abdullah, M.Z.; Muhammad, N.; Ratnam, W. Detecting mislabeling and identifying unique progeny in Acacia mapping population using SNP markers. J. For. Res. 2017, 28, 1119–1127. [Google Scholar] [CrossRef]
  4. Muhammad, A.J.; Ong, S.S.; Ratnam, W. Characterization of mean stem density, fibre length and lignin from two Acacia species and their hybrid. J. For. Res. 2018, 29, 549–555. [Google Scholar] [CrossRef]
  5. Migahid, A.M. Flora of Saudi Arabia, 3rd ed.; Riyadh University Publication: Riyadh, Saudi Arabia, 1990. [Google Scholar]
  6. Collenette, S. Illustrated Guide to the Flowers of Saudi Arabia; Scorpion: Hampshire, UK, 1985. [Google Scholar]
  7. Al-Mefarrej, H. Diversity and frequency of Acacia spp. in three regions in the Kingdom of Saudi Arabia. Afr. J. Biotechnol. 2012, 11, 11420–11430. [Google Scholar] [CrossRef]
  8. Greilhuber, J.; Doležel, J.; Lysák, M.A.; Bennett, M.D. The origin, evolution and proposed stabilization of the terms ‘genome size’and ‘C-value’to describe nuclear DNA contents. Ann. Botany 2005, 95, 255–260. [Google Scholar] [CrossRef]
  9. Bennett, M.D.; Leitch, I.J. Nuclear DNA amounts in angiosperms: Targets, trends and tomorrow. Ann. Botany 2011, 107, 467–590. [Google Scholar] [CrossRef]
  10. Greilhuber, J.; Borsch, T.; Müller, K.; Worberg, A.; Porembski, S.; Barthlott, W. Smallest angiosperm genomes found in Lentibulariaceae, with chromosomes of bacterial size. Plant Biol. 2006, 8, 770–777. [Google Scholar] [CrossRef]
  11. Bennett, M.; Leitch, I. Plant DNA C-Values Database; (release 4.0, Dec. 2005); Royal Botanic Gardens: Kew, UK, 2005. [Google Scholar]
  12. Vinogradov, A.E. Selfish DNA is maladaptive: Evidence from the plant Red List. Trends Genet. 2003, 19, 609–614. [Google Scholar] [CrossRef]
  13. Knight, C.A.; Molinari, N.A.; Petrov, D.A. The large genome constraint hypothesis: Evolution, ecology and phenotype. Ann. Botany 2005, 95, 177–190. [Google Scholar] [CrossRef]
  14. Galbraith, D.W. Cytometry and plant sciences: A personal retrospective. Cytometry Part A J. Int. Soc. Anal. Cytol. 2004, 58, 37–44. [Google Scholar] [CrossRef] [PubMed]
  15. Pellicer, J.; Clermont, S.; Houston, L.; Rich, T.C.; Fay, M.F. Cytotype diversity in the Sorbus complex (Rosaceae) in Britain: Sorting out the puzzle. Ann. Botany 2012, 110, 1185–1193. [Google Scholar] [CrossRef] [PubMed] [Green Version]
  16. Żabicka, J.; Migdałek, G.; Słomka, A.; Sliwinska, E.; Mackiewicz, L.; Keczyński, A.; Kuta, E. Interspecific hybridization and introgression influence biodiversity—Based on genetic diversity of Central European Viola epipsila-V. palustris complex. Diversity 2020, 12, 321. [Google Scholar] [CrossRef]
  17. Levin, J.; Fay, M.F.; Pellicer, J.; Hedrén, M. Multiple independent origins of intermediate species between Sorbus aucuparia and S. hybrida (Rosaceae) in the Baltic region. Nordic J. Botany 2018, 36. [Google Scholar] [CrossRef]
  18. Galbraith, D.W.; Harkins, K.R.; Maddox, J.M.; Ayres, N.M.; Sharma, D.P.; Firoozabady, E. Rapid flow cytometric analysis of the cell cycle in intact plant tissues. Science 1983, 220, 1049–1051. [Google Scholar] [CrossRef]
  19. Pfosser, M.; Heberle-Bors, E.; Amon, A.; Lelley, T. Evaluation of sensitivity of flow cytometry in detecting aneuploidy in wheat using disomic and ditelosomic wheat–rye addition lines. Cytometry J. Int. So. Anal. Cytol. 1995, 21, 387–393. [Google Scholar] [CrossRef]
  20. Arumuganathan, K.; Earle, E. Estimation of nuclear DNA content of plants by flow cytometry. Plant Mol. Biol. Report. 1991, 9, 229–241. [Google Scholar] [CrossRef]
  21. Doležel, J.; Binarová, P.; Lucretti, S. Analysis of nuclear DNA content in plant cells by flow cytometry. Biology 1989, 31, 113–120. [Google Scholar]
  22. Sadhu, A.; Bhadra, S.; Bandyopadhyay, M. Characterization of Tulbaghia violacea (Tulbaghieae, Allioideae, Amaryllidaceae) from India: A cytogenetic and molecular approach. Nucleus 2018, 61, 29–34. [Google Scholar] [CrossRef]
  23. Cartea, M.E.; Francisco, M.; Soengas, P.; Velasco, P. Phenolic compounds in Brassica vegetables. Molecules 2010, 16, 251–280. [Google Scholar] [CrossRef]
  24. Arts, I.C.; Sesink, A.L.; Faassen-Peters, M.; Hollman, P.C. The type of sugar moiety is a major determinant of the small intestinal uptake and subsequent biliary excretion of dietary quercetin glycosides. Br. J. Nutr. 2004, 91, 841–847. [Google Scholar] [CrossRef]
  25. Di Carlo, G.; Mascolo, N.; Izzo, A.A.; Capasso, F. Flavonoids: Old and new aspects of a class of natural therapeutic drugs. Life Sci. 1999, 65, 337–353. [Google Scholar] [CrossRef]
  26. Harborne, J.B.; Williams, C.A. Advances in flavonoid research since 1992. Phytochemistry 2000, 55, 481–504. [Google Scholar] [CrossRef]
  27. Formica, J.; Regelson, W. Review of the biology of quercetin and related bioflavonoids. Food Chem. Toxicol. 1995, 33, 1061–1080. [Google Scholar] [CrossRef]
  28. Hollman, P.C.; de Vries, J.H.; van Leeuwen, S.D.; Mengelers, M.J.; Katan, M.B. Absorption of dietary quercetin glycosides and quercetin in healthy ileostomy volunteers. Am. J. Clin. Nutr. 1995, 62, 1276–1282. [Google Scholar] [CrossRef] [Green Version]
  29. Mehta, R.G.; Murillo, G.; Naithani, R.; Peng, X. Cancer chemoprevention by natural products: How far have we come? Pharm. Res. 2010, 27, 950–961. [Google Scholar] [CrossRef]
  30. Martens, S.; Mithöfer, A. Flavones and flavone synthases. Phytochemistry 2005, 66, 2399–2407. [Google Scholar] [CrossRef]
  31. Bhullar, K.S.; Rupasinghe, H. Polyphenols: Multipotent therapeutic agents in neurodegenerative diseases. Oxidd Med. Cell. Longev. 2013, 2013, 891748. [Google Scholar] [CrossRef] [Green Version]
  32. Fernández-Arroyo, S.; Camps, J.; Menendez, J.A.; Joven, J. Managing hypertension by polyphenols. Planta Med. 2015, 81, 624–629. [Google Scholar] [CrossRef] [Green Version]
  33. Rodrigo, R.; Libuy, M.; Feliu, F.; Hasson, D. Polyphenols in disease: From diet to supplements. Curr. Pharm. Biotechnol. 2014, 15, 304–317. [Google Scholar] [CrossRef]
  34. Mocanu, M.-M.; Nagy, P.; Szöllősi, J. Chemoprevention of breast cancer by dietary polyphenols. Molecules 2015, 20, 22578–22620. [Google Scholar] [CrossRef] [PubMed]
  35. Al-Qurainy, F.; Tarroum, M.; Khan, S.; Nadeem, M.; Gaafar, A.-R.Z.; Alansi, S.; Alfarraj, N.S. Genome Estimation and Phytochemical Compound Identification in the Leaves and Callus of Abrus precatorius: A Locally Endangered Plant from the Flora of Saudi Arabia. Plants 2022, 11, 567. [Google Scholar] [CrossRef]
  36. Smith, J.; Heslop-Harrison, J. Nuclear DNA amounts in angiosperms. Philos. Trans. Roy. Soc. London B 1976, 274, 227–274. [Google Scholar]
  37. Ainsworth, E.A.; Gillespie, K.M. Estimation of total phenolic content and other oxidation substrates in plant tissues using Folin–Ciocalteu reagent. Nat. Protocols 2007, 2, 875–877. [Google Scholar] [CrossRef] [PubMed]
  38. Ordonez, A.; Gomez, J.; Vattuone, M. Antioxidant activities of Sechium edule (Jacq.) Swartz extracts. Food Chem. 2006, 97, 452–458. [Google Scholar] [CrossRef]
  39. Meyerson, L.A.; Pyšek, P.; Lučanová, M.; Wigginton, S.; Tran, C.T.; Cronin, J.T. Plant genome size influences stress tolerance of invasive and native plants via plasticity. Ecosphere 2020, 11, e03145. [Google Scholar] [CrossRef]
  40. Pyšek, P.; Skálová, H.; Čuda, J.; Guo, W.Y.; Suda, J.; Doležal, J.; Kauzál, O.; Lambertini, C.; Lučanová, M.; Mandáková, T. Small genome separates native and invasive populations in an ecologically important cosmopolitan grass. Ecology 2018, 99, 79–90. [Google Scholar] [CrossRef] [Green Version]
  41. Meyerson, L.A.; Cronin, J.T.; Bhattarai, G.P.; Brix, H.; Lambertini, C.; Lučanová, M.; Rinehart, S.; Suda, J.; Pyšek, P. Do ploidy level and nuclear genome size and latitude of origin modify the expression of Phragmites australis traits and interactions with herbivores? Biol. Invas. 2016, 18, 2531–2549. [Google Scholar] [CrossRef]
  42. Beaulieu, J.M.; Moles, A.T.; Leitch, I.J.; Bennett, M.D.; Dickie, J.B.; Knight, C.A. Correlated evolution of genome size and seed mass. New Phytol. 2007, 173, 422. [Google Scholar] [CrossRef] [Green Version]
  43. Beaulieu, J.M.; Leitch, I.J.; Knight, C.A. Genome size evolution in relation to leaf strategy and metabolic rates revisited. Ann. Botany 2007, 99, 495–505. [Google Scholar] [CrossRef]
  44. Morgan, H.D.; Westoby, M. The relationship between nuclear DNA content and leaf strategy in seed plants. Ann. Botany 2005, 96, 1321–1330. [Google Scholar] [CrossRef] [PubMed]
  45. Knight, C.A.; Ackerly, D.D. Variation in nuclear DNA content across environmental gradients: A quantile regression analysis. Ecol. Lett. 2002, 5, 66–76. [Google Scholar] [CrossRef]
  46. Greilhuber, J. Intraspecific variation in genome size in angiosperms: Identifying its existence. Ann. Botany 2005, 95, 91–98. [Google Scholar] [CrossRef] [PubMed] [Green Version]
  47. Lysák, M.A.; Rostková, A.; Dixon, J.M.; Rossi, G.; Doležel, J. Limited genome size variation in Sesleria albicans. Ann. Botany 2000, 86, 399–403. [Google Scholar] [CrossRef] [Green Version]
  48. Cullis, C.A. Mechanisms and control of rapid genomic changes in flax. Ann. Botany 2005, 95, 201–206. [Google Scholar] [CrossRef]
  49. Pellicer, J.; López-Pujol, J.; Aixarch, M.; Garnatje, T.; Vallès, J.; Hidalgo, O. Detecting introgressed populations in the Iberian endemic Centaurea podospermifolia through genome size. Plants 2021, 10, 1492. [Google Scholar] [CrossRef]
  50. Chen, W.; Kao, Y.; Tang, C.; Tsai, C.; Lin, T. Estimating nuclear DNA content within 50 species of the genus Phalaenopsis Blume (Orchidaceae). Sci. Hortic. 2013, 161, 70–75. [Google Scholar] [CrossRef]
  51. Siljak-Yakovlev, S.; Stevanovic, V.; Tomasevic, M.; Brown, S.C.; Stevanovic, B. Genome size variation and polyploidy in the resurrection plant genus Ramonda: Cytogeography of living fossils. Environ. Exp. Botany 2008, 62, 101–112. [Google Scholar] [CrossRef]
  52. El Ferchichi Ouarda, H.; Walker, D.J.; Khouja, M.L.; Correal, E. Diversity analysis of Acacia tortilis (Forsk.) Hayne ssp. raddiana (Savi) Brenan (Mimosaceae) using phenotypic traits, chromosome counting and DNA content approaches. Gen. Resour. Crop Evol. 2009, 56, 1001–1010. [Google Scholar] [CrossRef]
  53. Bennett, M.D.; Leitch, I.J. Genome size evolution in plants. In The Evolution of the Genome; Elsevier: Amsterdam, The Netherlands, 2005; pp. 89–162. [Google Scholar]
  54. Soltis, P.S.; Marchant, D.B.; Van de Peer, Y.; Soltis, D.E. Polyploidy and genome evolution in plants. Curr. Opin. Gen. Dev. 2015, 35, 119–125. [Google Scholar] [CrossRef] [Green Version]
  55. Carta, A.; Peruzzi, L. Testing the large genome constraint hypothesis: Plant traits, habitat and climate seasonality in L. iliaceae. New Phytol. 2016, 210, 709–716. [Google Scholar] [CrossRef] [PubMed] [Green Version]
  56. Cacho, N.I.; McIntyre, P.J.; Kliebenstein, D.J.; Strauss, S.Y. Genome size evolution is associated with climate seasonality and glucosinolates, but not life history, soil nutrients or range size, across a clade of mustards. Ann. Botany 2021, 127, 887–902. [Google Scholar] [CrossRef] [PubMed]
  57. Guignard, M.S.; Crawley, M.J.; Kovalenko, D.; Nichols, R.A.; Trimmer, M.; Leitch, A.R.; Leitch, I.J. Interactions between plant genome size, nutrients and herbivory by rabbits, molluscs and insects on a temperate grassland. Proc. R. Soc. B 2019, 286, 20182619. [Google Scholar] [CrossRef] [Green Version]
  58. Edger, P.P.; Heidel-Fischer, H.M.; Bekaert, M.; Rota, J.; Glöckner, G.; Platts, A.E.; Heckel, D.G.; Der, J.P.; Wafula, E.K.; Tang, M. The butterfly plant arms-race escalated by gene and genome duplications. Proc. Natl. Acad. Sci. USA 2015, 112, 8362–8366. [Google Scholar] [CrossRef] [Green Version]
  59. Noirot, M.; Barre, P.; Duperray, C.; Louarn, J.; Hamon, S. Effects of caffeine and chlorogenic acid on propidium iodide accessibility to DNA: Consequences on genome size evaluation in coffee tree. Ann. Botany 2003, 92, 259–264. [Google Scholar] [CrossRef] [PubMed] [Green Version]
  60. Loureiro, J.; Rodriguez, E.; DOLEŽEL, J.; Santos, C. Flow cytometric and microscopic analysis of the effect of tannic acid on plant nuclei and estimation of DNA content. Ann. Botany 2006, 98, 515–527. [Google Scholar] [CrossRef] [Green Version]
  61. Inbaraj, B.S.; Lu, H.; Kao, T.; Chen, B. Simultaneous determination of phenolic acids and flavonoids in Lycium barbarum Linnaeus by HPLC–DAD–ESI-MS. J. Pharm. Biomed. Anal. 2010, 51, 549–556. [Google Scholar] [CrossRef]
  62. Bennett, M.D.; Price, H.J.; Johnston, J.S. Anthocyanin inhibits propidium iodide DNA fluorescence in Euphorbia pulcherrima: Implications for genome size variation and flow cytometry. Ann. Botany 2008, 101, 777–790. [Google Scholar] [CrossRef]
  63. Greilhuber, J.; Temsch, E.M.; Loureiro, J.C. Nuclear DNA content measurement. In Flow Cytometry with Plant Cells: Analysis of Genes, Chromosomes and Genomes; John Wiley & Sons: Hoboken, NJ, USA, 2007; pp. 67–101. [Google Scholar]
  64. Doyle, J.J.; Doyle, J.L. A Rapid DNA Isolation Procedure for Small Quantities of Fresh Leaf Tissue. Phytochem. Bull. 1987, 19, 11–15. [Google Scholar]
  65. Loureiro, J.; Rodriguez, E.; Doležel, J.; Santos, C. Two new nuclear isolation buffers for plant DNA flow cytometry: A test with 37 species. Ann. Botany 2007, 100, 875–888. [Google Scholar] [CrossRef] [Green Version]
  66. Peng, Y.; Sun, S.; Zhao, Z.; Leung, H. A rapid method for identification of genus Lycium by FTIR spectroscopy. Guang Pu Xue Yu Guang Pu Fen Xi Guang Pu 2004, 24, 679–681. [Google Scholar] [PubMed]
  67. Cao, Z.; Liu, Y.; Zhao, J. Efficient discrimination of some moss species by fourier transform infrared spectroscopy and chemometrics. J. Spectr. 2014, 2014, 191796. [Google Scholar] [CrossRef] [Green Version]
  68. Depciuch, J.; Kasprzyk, I.; Drzymała, E.; Parlinska-Wojtan, M. Identification of birch pollen species using FTIR spectroscopy. Aerobiologia 2018, 34, 525–538. [Google Scholar] [CrossRef] [PubMed]
  69. Cao, Z.; Wang, Z.; Shang, Z.; Zhao, J. Classification and identification of Rhodobryum roseum Limpr. and its adulterants based on fourier-transform infrared spectroscopy (FTIR) and chemometrics. PLoS ONE 2017, 12, e0172359. [Google Scholar] [CrossRef] [Green Version]
  70. Kalaivani, T.; Rajasekaran, C.; Suthindhiran, K.; Mathew, L. Free radical scavenging, cytotoxic and hemolytic activities from leaves of Acacia nilotica (L.) Wild. ex. Delile subsp. indica (Benth.) Brenan. Evid.-Based Complem. Alter. Med. 2011, 2011, 274741. [Google Scholar] [CrossRef] [Green Version]
  71. Jelassi, A.; El Ayeb-Zakhama, A.; Nejma, A.B.; Chaari, A.; Harzallah-Skhiri, F.; Jannet, H.B. Phytochemical composition and allelopathic potential of three Tunisian Acacia species. Ind. Crops Prod. 2016, 83, 339–345. [Google Scholar] [CrossRef]
  72. Kaššák, P. Total flavonoids and phenolics content of the chosen genus Iris species. Acta Univ. Agric. Silviculturae Mendelianae Brunensis 2013, 60, 119–126. [Google Scholar] [CrossRef] [Green Version]
  73. Tungmunnithum, D.; Drouet, S.; Garros, L.; Lorenzo, J.M.; Hano, C. Flavonoid Profiles and Antioxidant Potential of Monochoria angustifolia (GX Wang) Boonkerd & Tungmunnithum, a New Species from the Genus Monochoria C. Presl. Antioxidants 2022, 11, 952. [Google Scholar]
  74. Kreft, S.; Knapp, M.; Kreft, I. Extraction of rutin from buckwheat (Fagopyrum esculentum Moench) seeds and determination by capillary electrophoresis. J. Agri. Food Chem. 1999, 47, 4649–4652. [Google Scholar] [CrossRef]
  75. Shalashvili, A.; Rakviashvili, N. Rutin and luteolin 7-rutinoside from the leaves ofCitrus unshiu. Chem. Nat. Comp. 1984, 20, 621–622. [Google Scholar] [CrossRef]
  76. Ip, P.; Sharda, P.R.; Cunningham, A.; Chakrabartty, S.; Pande, V.; Chakrabartty, A. Quercitrin and quercetin 3-β-d-glucoside as chemical chaperones for the A4V SOD1 ALS-causing mutant. Protein Eng. Des. Selec. 2017, 30, 431–440. [Google Scholar] [CrossRef] [Green Version]
  77. Jiménez-Moreno, N.; Cimminelli, M.J.; Volpe, F.; Ansó, R.; Esparza, I.; Mármol, I.; Rodríguez-Yoldi, M.J.; Ancín-Azpilicueta, C. Phenolic composition of artichoke waste and its antioxidant capacity on differentiated Caco-2 cells. Nutrients 2019, 11, 1723. [Google Scholar] [CrossRef] [PubMed] [Green Version]
  78. Antognoni, F.; Zheng, S.; Pagnucco, C.; Baraldi, R.; Poli, F.; Biondi, S. Induction of flavonoid production by UV-B radiation in Passiflora quadrangularis callus cultures. Fitoterapia 2007, 78, 345–352. [Google Scholar] [CrossRef] [PubMed]
  79. Chepel, V.; Lisun, V.; Skrypnik, L. Changes in the content of some groups of phenolic compounds and biological activity of extracts of various parts of heather (Calluna vulgaris (L.) Hull) at different growth stages. Plants 2020, 9, 926. [Google Scholar] [CrossRef] [PubMed]
  80. Rieger, G.; Muller, M.; Guttenberger, H.; Bucar, F. Influence of altitudinal variation on the content of phenolic compounds in wild populations of Calluna vulgaris, Sambucus nigra, and Vaccinium myrtillus. J. Agric. Food Chem. 2008, 56, 9080–9086. [Google Scholar] [CrossRef]
  81. Yao, X.-H.; Zhang, Z.-B.; Song, P.; Hao, J.-Y.; Zhang, D.-Y.; Zhang, Y.-F. Different harvest seasons modify bioactive compounds and antioxidant activities of Pyrola incarnata. Ind. Crops Prod. 2016, 94, 405–412. [Google Scholar] [CrossRef]
  82. Ribeiro, D.A.; de Macêdo, D.G.; Boligon, A.A.; Menezes, I.R.A.; de Almeida Souza, M.M.; da Costa, J.G.M. Influence of seasonality on the phenolic composition of Secondatia floribunda A. DC (Apocynaceae) during its phenological cycle. Acta Physiol. Plant. 2019, 41, 1–16. [Google Scholar] [CrossRef]
  83. Yang, L.; Wen, K.-S.; Ruan, X.; Zhao, Y.-X.; Wei, F.; Wang, Q. Response of plant secondary metabolites to environmental factors. Molecules 2018, 23, 762. [Google Scholar] [CrossRef] [Green Version]
  84. Gabr, S.; Nikles, S.; Wenzig, E.M.P.; Ardjomand-Woelkart, K.; Hathout, R.M.; El-Ahmady, S.; Motaal, A.A.; Singab, A.; Bauer, R. Characterization and optimization of phenolics extracts from Acacia species in relevance to their anti-inflammatory activity. Biochem. Syst. Ecol. 2018, 78, 21–30. [Google Scholar] [CrossRef]
  85. Sulaiman, C.; Balachandran, I. Total phenolics and total flavonoids in selected Indian medicinal plants. Indian J. Pharm. Sci. 2012, 74, 258. [Google Scholar] [CrossRef] [Green Version]
  86. Verick Purba, B.A.; Sunarti, S.; Lukmandaru, G. Phenolics content and antioxidant activity of wood extractives from three clones of Acacia hybrid (Acacia mangium × Acacia auriculiformis). Maderas. Cien. Tecnol. 2021, 23. [Google Scholar] [CrossRef]
Figure 1. Acacia species; morphology of seeds measured in centimeters (cm), plant grown in a pot and leaf morphology (leaf length) measured in centimeters (cm) (a): A. johnwoodii; (b): A. etbaica; (c): A. origena.
Horticulturae 08 00994 g001
Figure 2. Flow cytometry (FCM) histograms of propidium iodide (PI) fluorescence intensity of nuclei prepared from cotyledon of Acacia etbaica using different extraction buffers. (a) Galbraith’s buffer; (b) MB01 Buffer; (c) Tris-MgCl2 buffer; (d) LB01 buffer.
Horticulturae 08 00994 g002
Figure 3. Flow cytometry (FCM) histograms of propidium iodide (PI) fluorescence intensity of nuclei prepared from cotyledon of Acacia johnwoodii using different extraction buffers. (a) Galbraith’s buffer; (b) MB01 Buffer; (c) Tris-MgCl2 buffer; (d) LB01 buffer.
Horticulturae 08 00994 g003
Figure 4. Flow cytometry (FCM) histograms of propidium iodide (PI) fluorescence intensity of nuclei prepared from cotyledon of Acacia origena using different extraction buffers. (a) Galbraith’s buffer; (b) MB01 Buffer; (c) Tris-MgCl2 buffer; (d) LB01 buffer.
Horticulturae 08 00994 g004
Figure 5. Total phenolic content (TPCs); (a); and flavonoid content (TFC); (b) in the young leaves of Acacia species. Values are the mean of three replicates ± S.D. Letters on bars represent the significant differences according to Duncan’s test (p < 0.05).
Horticulturae 08 00994 g005
Figure 6. HPLC chromatogram of bioactive compound (Quercitin 3-β-d-glucoside) extracted from young leaves of Acacia species; (a) Standard compound, Quercitin 3-β-d-glucoside; (b) A. johnwoodii; (c) A. origena; (d) A. etbaica.
Horticulturae 08 00994 g006
Figure 7. HPLC chromatogram of bioactive compound (Luteolin 7-rutinoside) extracted from young leaves of Acacia species; (a) Standard compound, Luteolin 7-rutinoside; (b) A. johnwoodii; (c) A. origena; (d) A. etbaica.
Horticulturae 08 00994 g007
Figure 8. Content of Quercetin 3-β-d-glucoside (QBDG) (a) and Luteolin 7-rutinoside (b) in young leaves of Acacia species estimated by HPLC system. Values are the mean of three replicates ± S.D. Letters on bars represent the significant differences according to Duncan’s test (p < 0.05).
Horticulturae 08 00994 g008
Figure 9. Fourier Transform Infrared Spectroscopy (FTIR) analysis for the methanolic extract of Acacia species: (a) A. johnwoodii; (b) A. etbaica; (c) A. origena.
Horticulturae 08 00994 g009
Table 1. Acacia species status, collection place, seed size and leaf size (plant grown in a pot in a growth chamber).
Acacia Species Accession NumberSpecies Status in Saudi ArabiaCollection PlaceSeed Diameter (cm)
(Mean ± SD)
Seed Length (cm)
(Mean ± SD)
Leaf Length
(cm)
Acacia johnwoodii (Boulos) Ragup., Seigler, Ebinger & MaslinKSUSB95ThreatenedDhi Ain (Abha)0.62 ± 0.012 a1.1 ± 0.100 a4.7 ± 0.55 a
Acacia etbaica (Schweinf.) Kyal. & BoatwrKSUSB99Near endemicWadi Khaytan (Abha)0.43 ± 0.007 c0.518 ± 0.01 c2.47 ± 0.34 b
Acacia origena (Hunde) Kyal. & BoatwrKSUSB92Near endemicDhi Ain (Abha)0.52 ± 0.025 b0.630 ± 0.01 b1.53 ± 0.152 c
a,b,c indicates significant difference according to Duncan’s test (p < 0.05).
Table 2. Genome size (2C DNA content) of Acacia species as nuclei isolated with different nuclei extraction buffers with slight modification (0.6% β-mercaptoethanol and 2% PVP).
Plant SpeciesExtraction Buffers
GB Buffer
(Mean ± SD)
MB01 Buffer
(Mean ± SD)
Tris MgCl2 Buffer
(Mean ± SD)
LB01 Buffer
(Mean ± SD)
Acacia etbaica (Schweinf.) Kyal. & Boatwr1.91 ± 0.00 c1.91 ± 0.02 c2.21 ± 0.02 a2.11 ± 0.02 b
Acacia johnwoodii (Boulos) Ragup., Seigler, Ebinger & Maslin2.19 ± 0.04 a2.19 ± 0.00 a2.07 ± 0.07 b2.12 ± 0.00 ab
Acacia origena (Hunde) Kyal. & Boatwr2.09 ± 0.00 a2.09 ± 0.01 a2.10 ± 0.18 a2.45 ± 0.05 b
a,b,c indicates significant difference according to Duncan’s test (p < 0.05).
Table 3. Fourier Transform Infrared Spectrometer (FTIR) spectrum analysis for the methanolic extract of A. origena.
Frequency (cm−1)Intensity AssignmentsCompound Group
794.26Medium C=C bendingAlkene
1028.52Strong C-F stretchingFluro compound
1451.85Medium C-H bendingAlkane
1642.96medium
medium
medium
C-N stretching
C=C stretching
C=C stretching
Imine/oxime
Alkene
Conjugated alkene
2834.06Strong, broad
Weak, broad
O-H stretching
O-H stretching
Carboxylic acid
Alcohol
2943.79Strong, broad
Weak, broad
Strong, broad
Medium
O-H stretching
O-H stretching
N-H stretching
C-H stretching
Carboxylic acid
Alcohol
Amine salt
Alkane
3363.62Strong, broadO-H stretchingAlcohol
Table 4. Fourier Transform Infrared Spectrometer (FTIR) spectrum analysis for the methanolic extract of A. etbaica.
Frequency (cm−1)IntensityAssignmentsCompound Group
794.46Medium C=C bendingAlkene
1022.61Strong C-F stretchingFluro compound
1398.89Strong S=O stretchingsulfonyl chloride
1637.10Medium
Medium
C=C stretching
C=C stretching
cyclic alkene
Alkane
2076.89StrongN=C=S stretchingIsothiocyanate
2947.10Weak, broad
Medium
Strong, broad
O-H stretching
C-H stretching
N-H stretching
Alcohol
Alkane
Amine salt
3375.47Medium N-H stretchingaliphatic primary amine
Table 5. Fourier Transform Infrared Spectrometer (FTIR) spectrum analysis for the methanolic extract of A. johnwoodii.
Frequency (cm−1)IntensityAssignmentsCompound Group
793.82Medium C=C bendingAlkene
1113.21Strong
medium
Strong
C-F stretching
C-N stretching
C-O stretching
Fluro compound
amine
aliphatic ether
1452.43Medium C=H bending Alkane
1648.33medium
medium
medium
C-N stretching
C=C stretching
C=C stretching
Imine/oxime
Alkene
Conjugated alkene
2833.19Strong, broad
Weak, broad
O-H stretching
O-H stretching
Carboxylic acid
Alcohol
2944.93Strong, broad
Weak, broad
Strong, broad
Medium
O-H stretching
O-H stretching
N-H stretching
C-H stretching
Carboxylic acid
Alcohol
Amine salt
Alkane
3368.71Strong, broadO-H stretchingAlcohol
Publisher’s Note: MDPI stays neutral with regard to jurisdictional claims in published maps and institutional affiliations.

