
The Olive-Oil Chain of Salerno Province (Southern Italy): A Life Cycle Sustainability Framework


 ,
, 
Abstract
1. Introduction
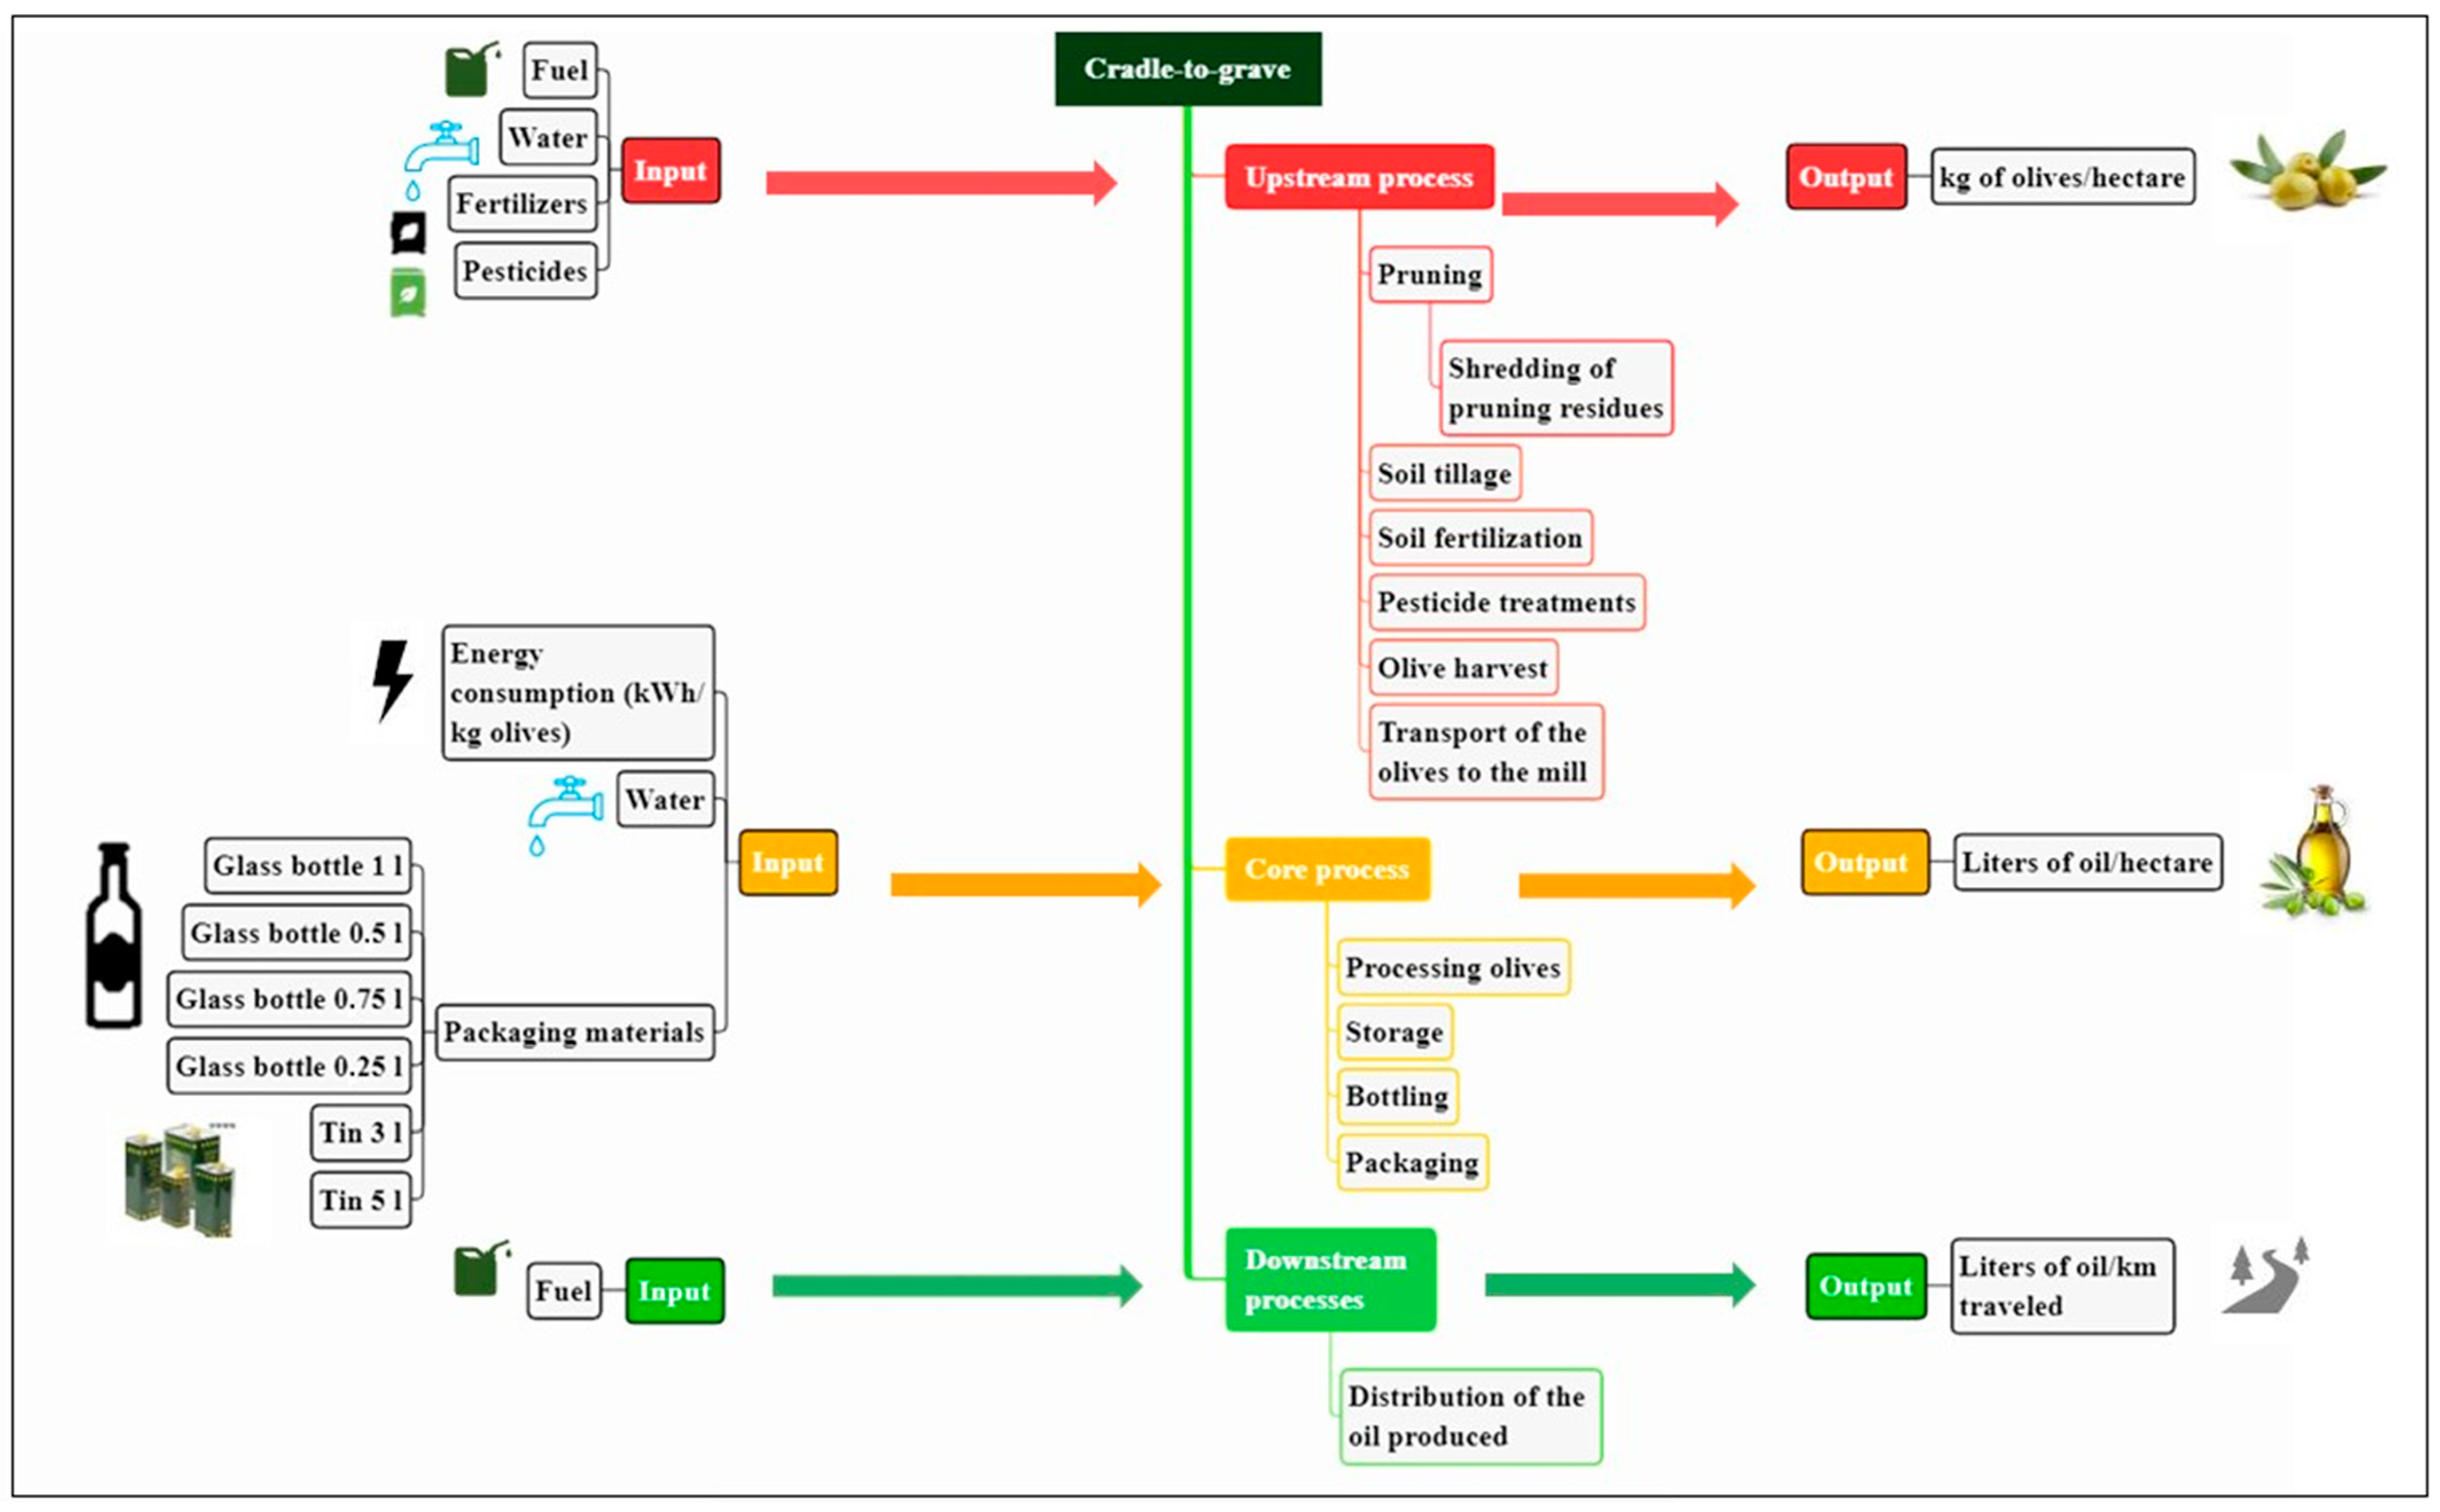
2. Study Area and Systems Description
3. Materials and Methods
3.1. Environmental Impact Assessment
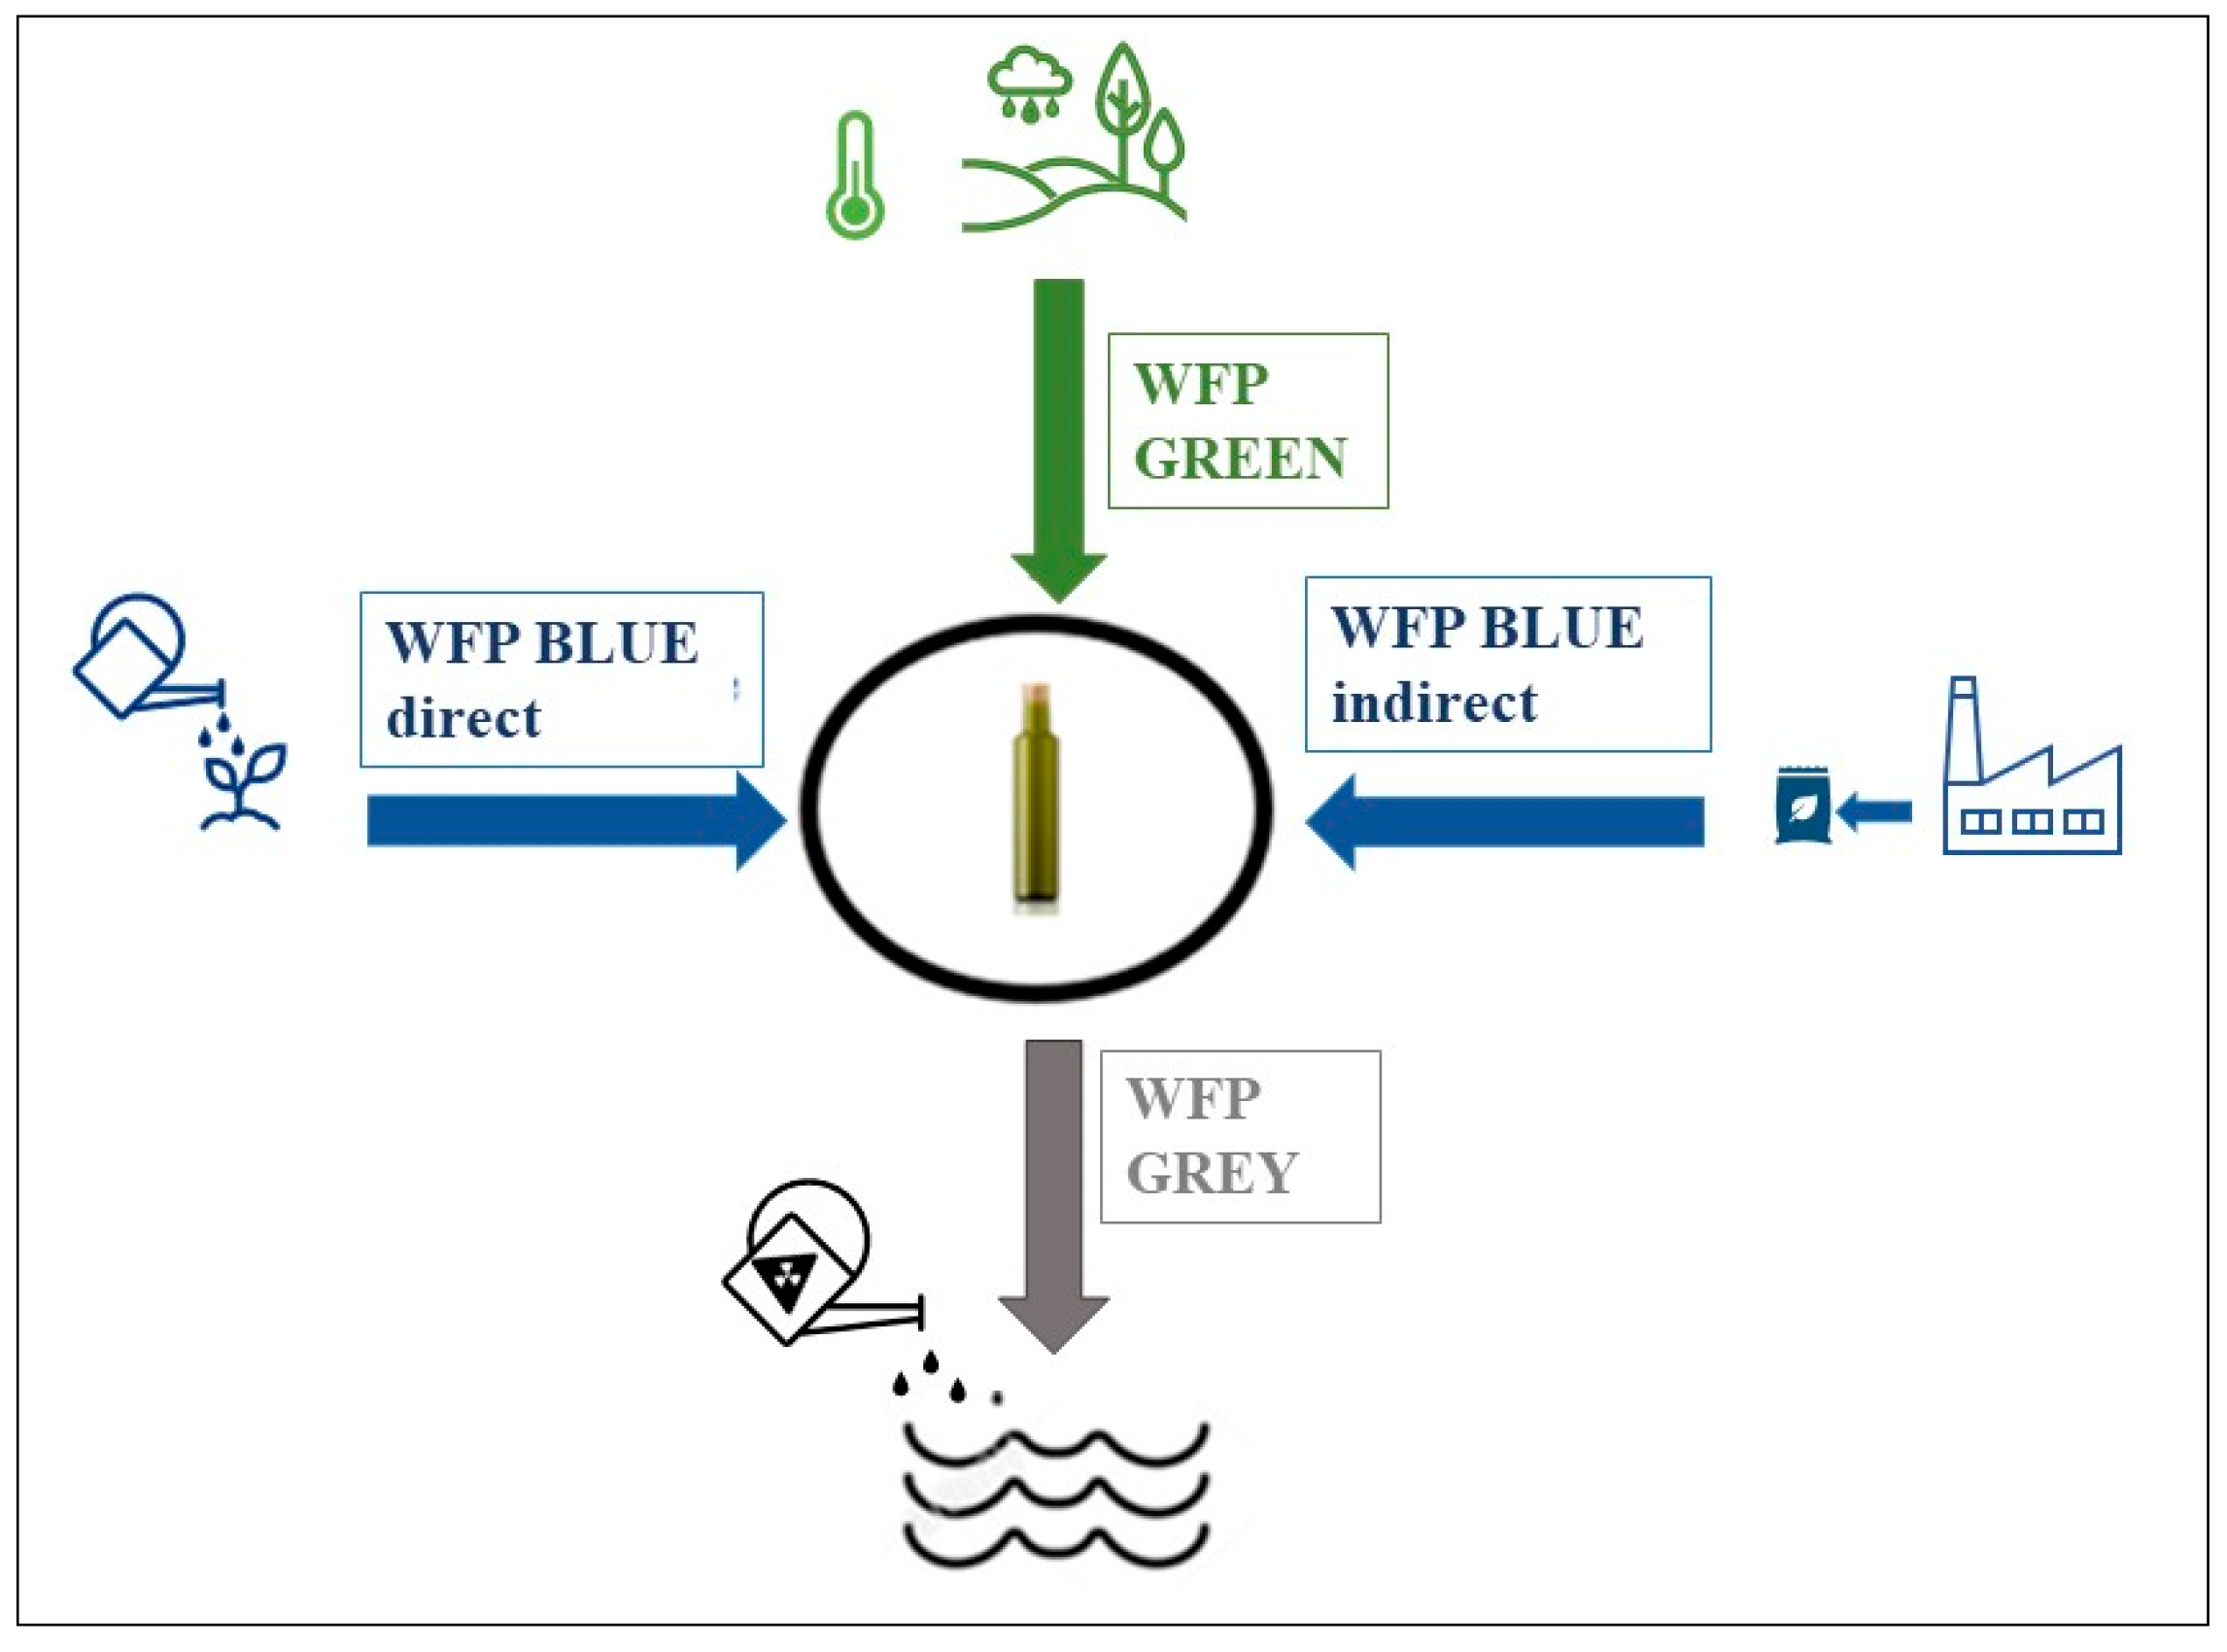
3.2. Water Footprint
- the fraction of water directly consumed by the farm during irrigation, fertilization and phytosanitary treatments;
- the fraction of water indirectly used by the farm, i.e., the amount of water necessary for the production of the inputs used (fertilizers, chemicals, diesel) (Figure 2).
- (a)
- quantity of water directly used in phytosanitary treatments; fertilizations; irrigation; washing of the olives and milling;
- (b)
- water indirectly used in the manufacture of inputs;
- (c)
- types of water resources used, distinguished between rainwater and irrigation water;
- (d)
- forms of water use: evaporation; transpiration; product integration; release in river basins or at sea; moving water from one type of water resource to another water resource;
- (e)
- climatic conditions of the production areas of the olive-growing systems analyzed.
3.3. Production Cost Analysis
3.4. Social Life Cycle Assessment
4. Results
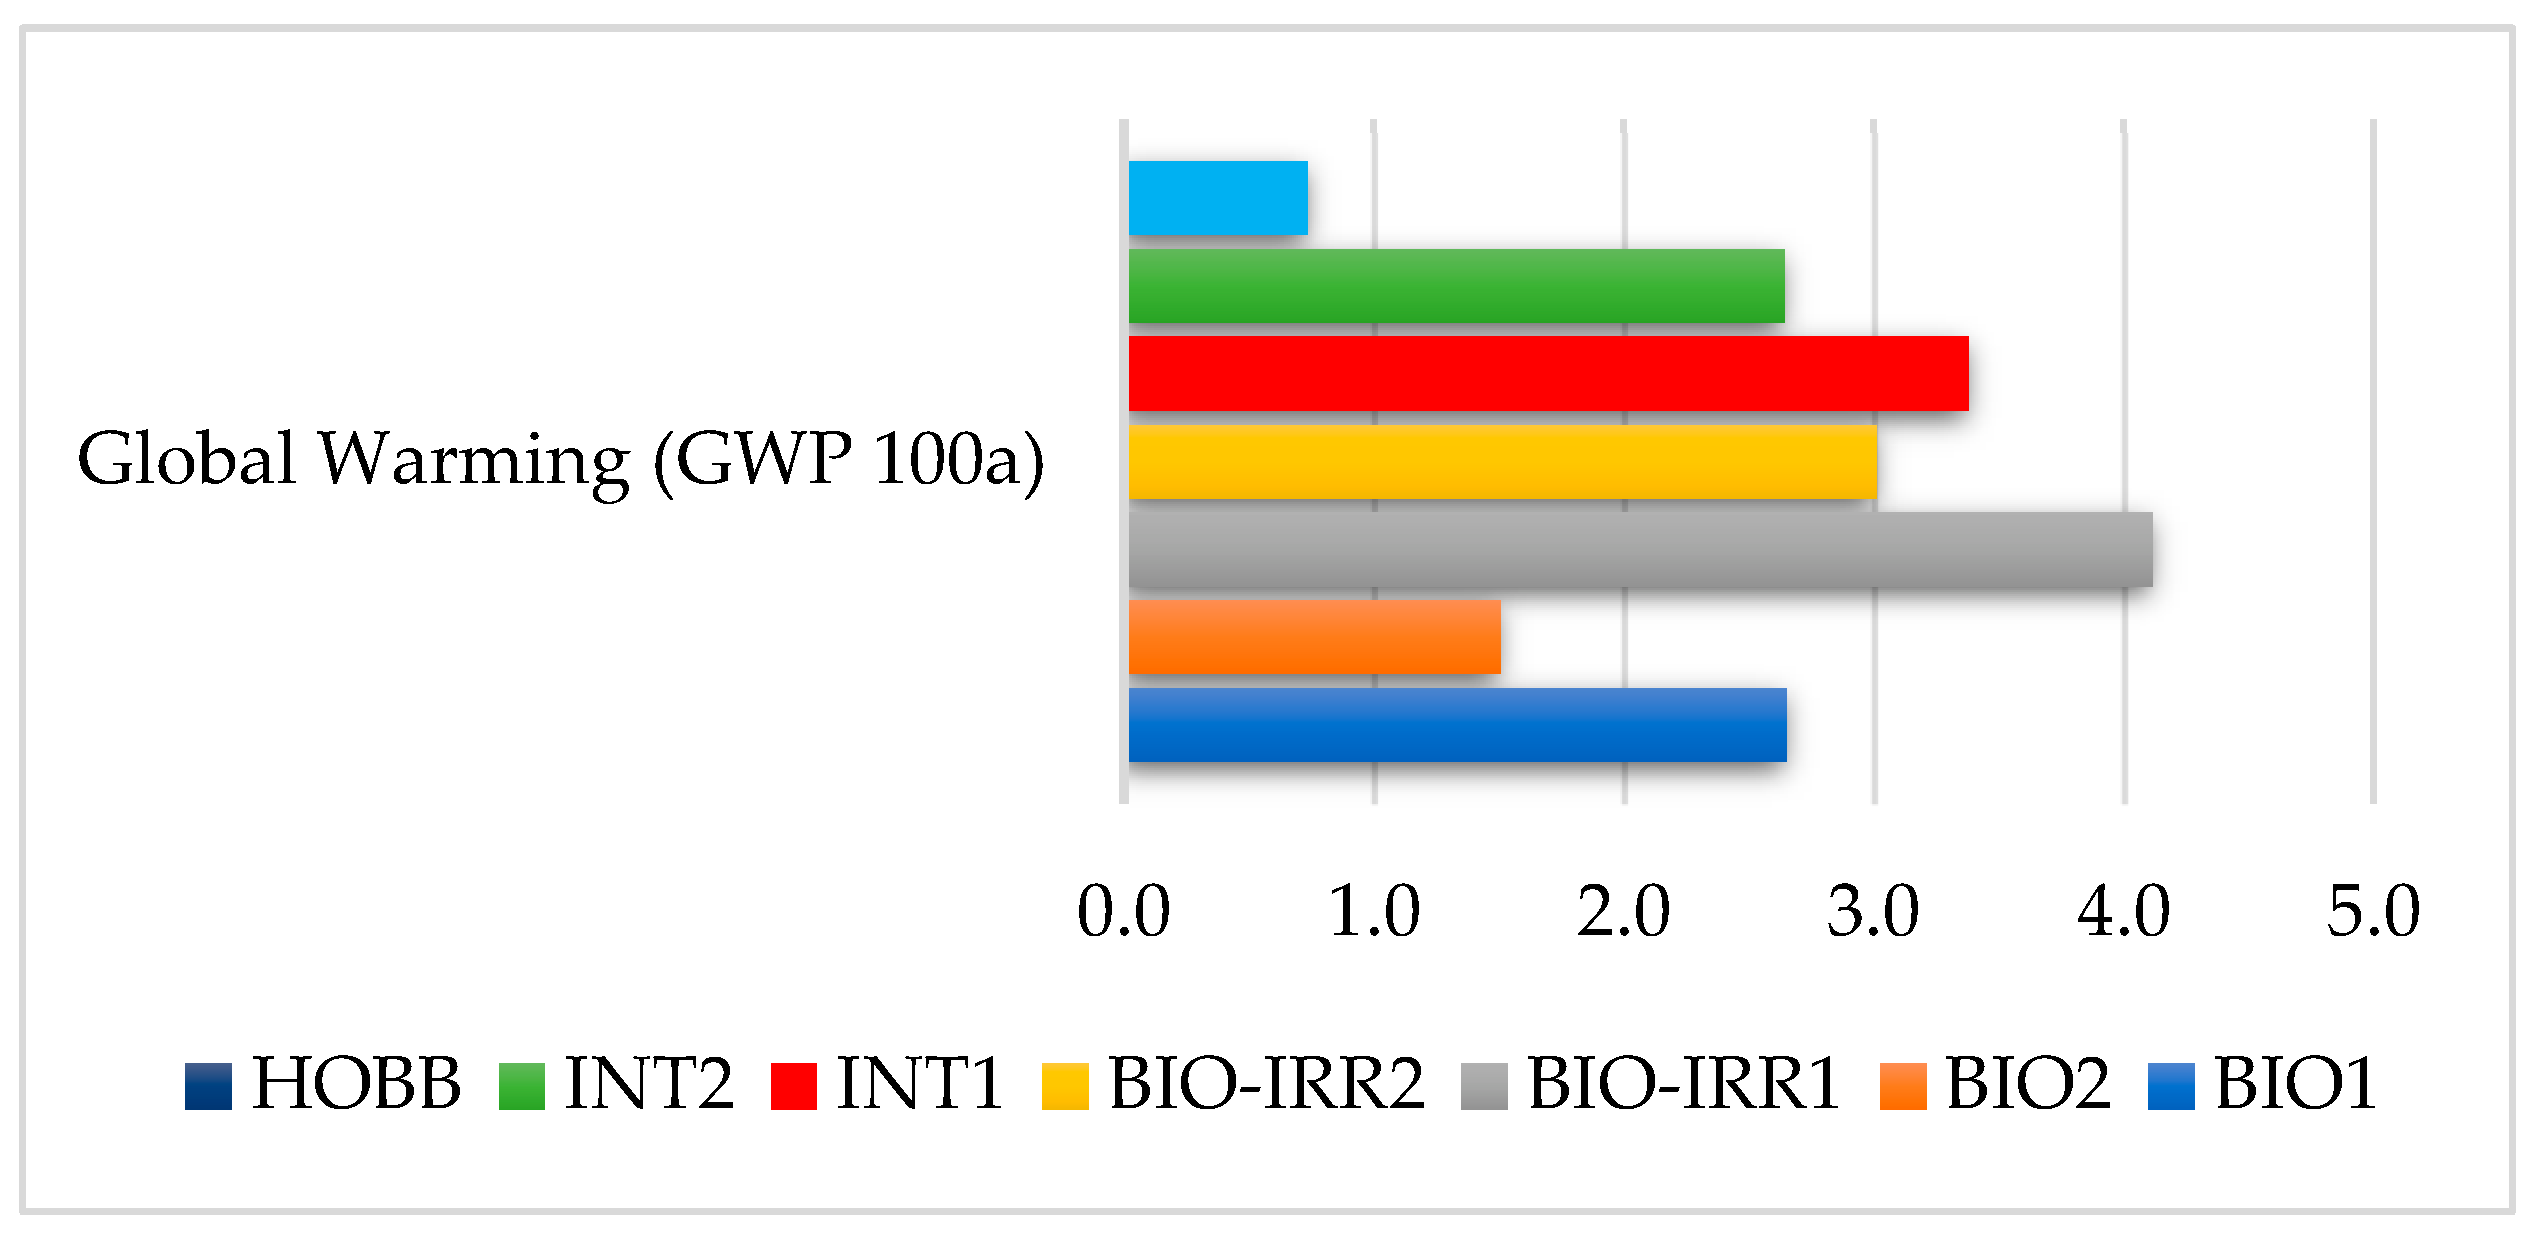
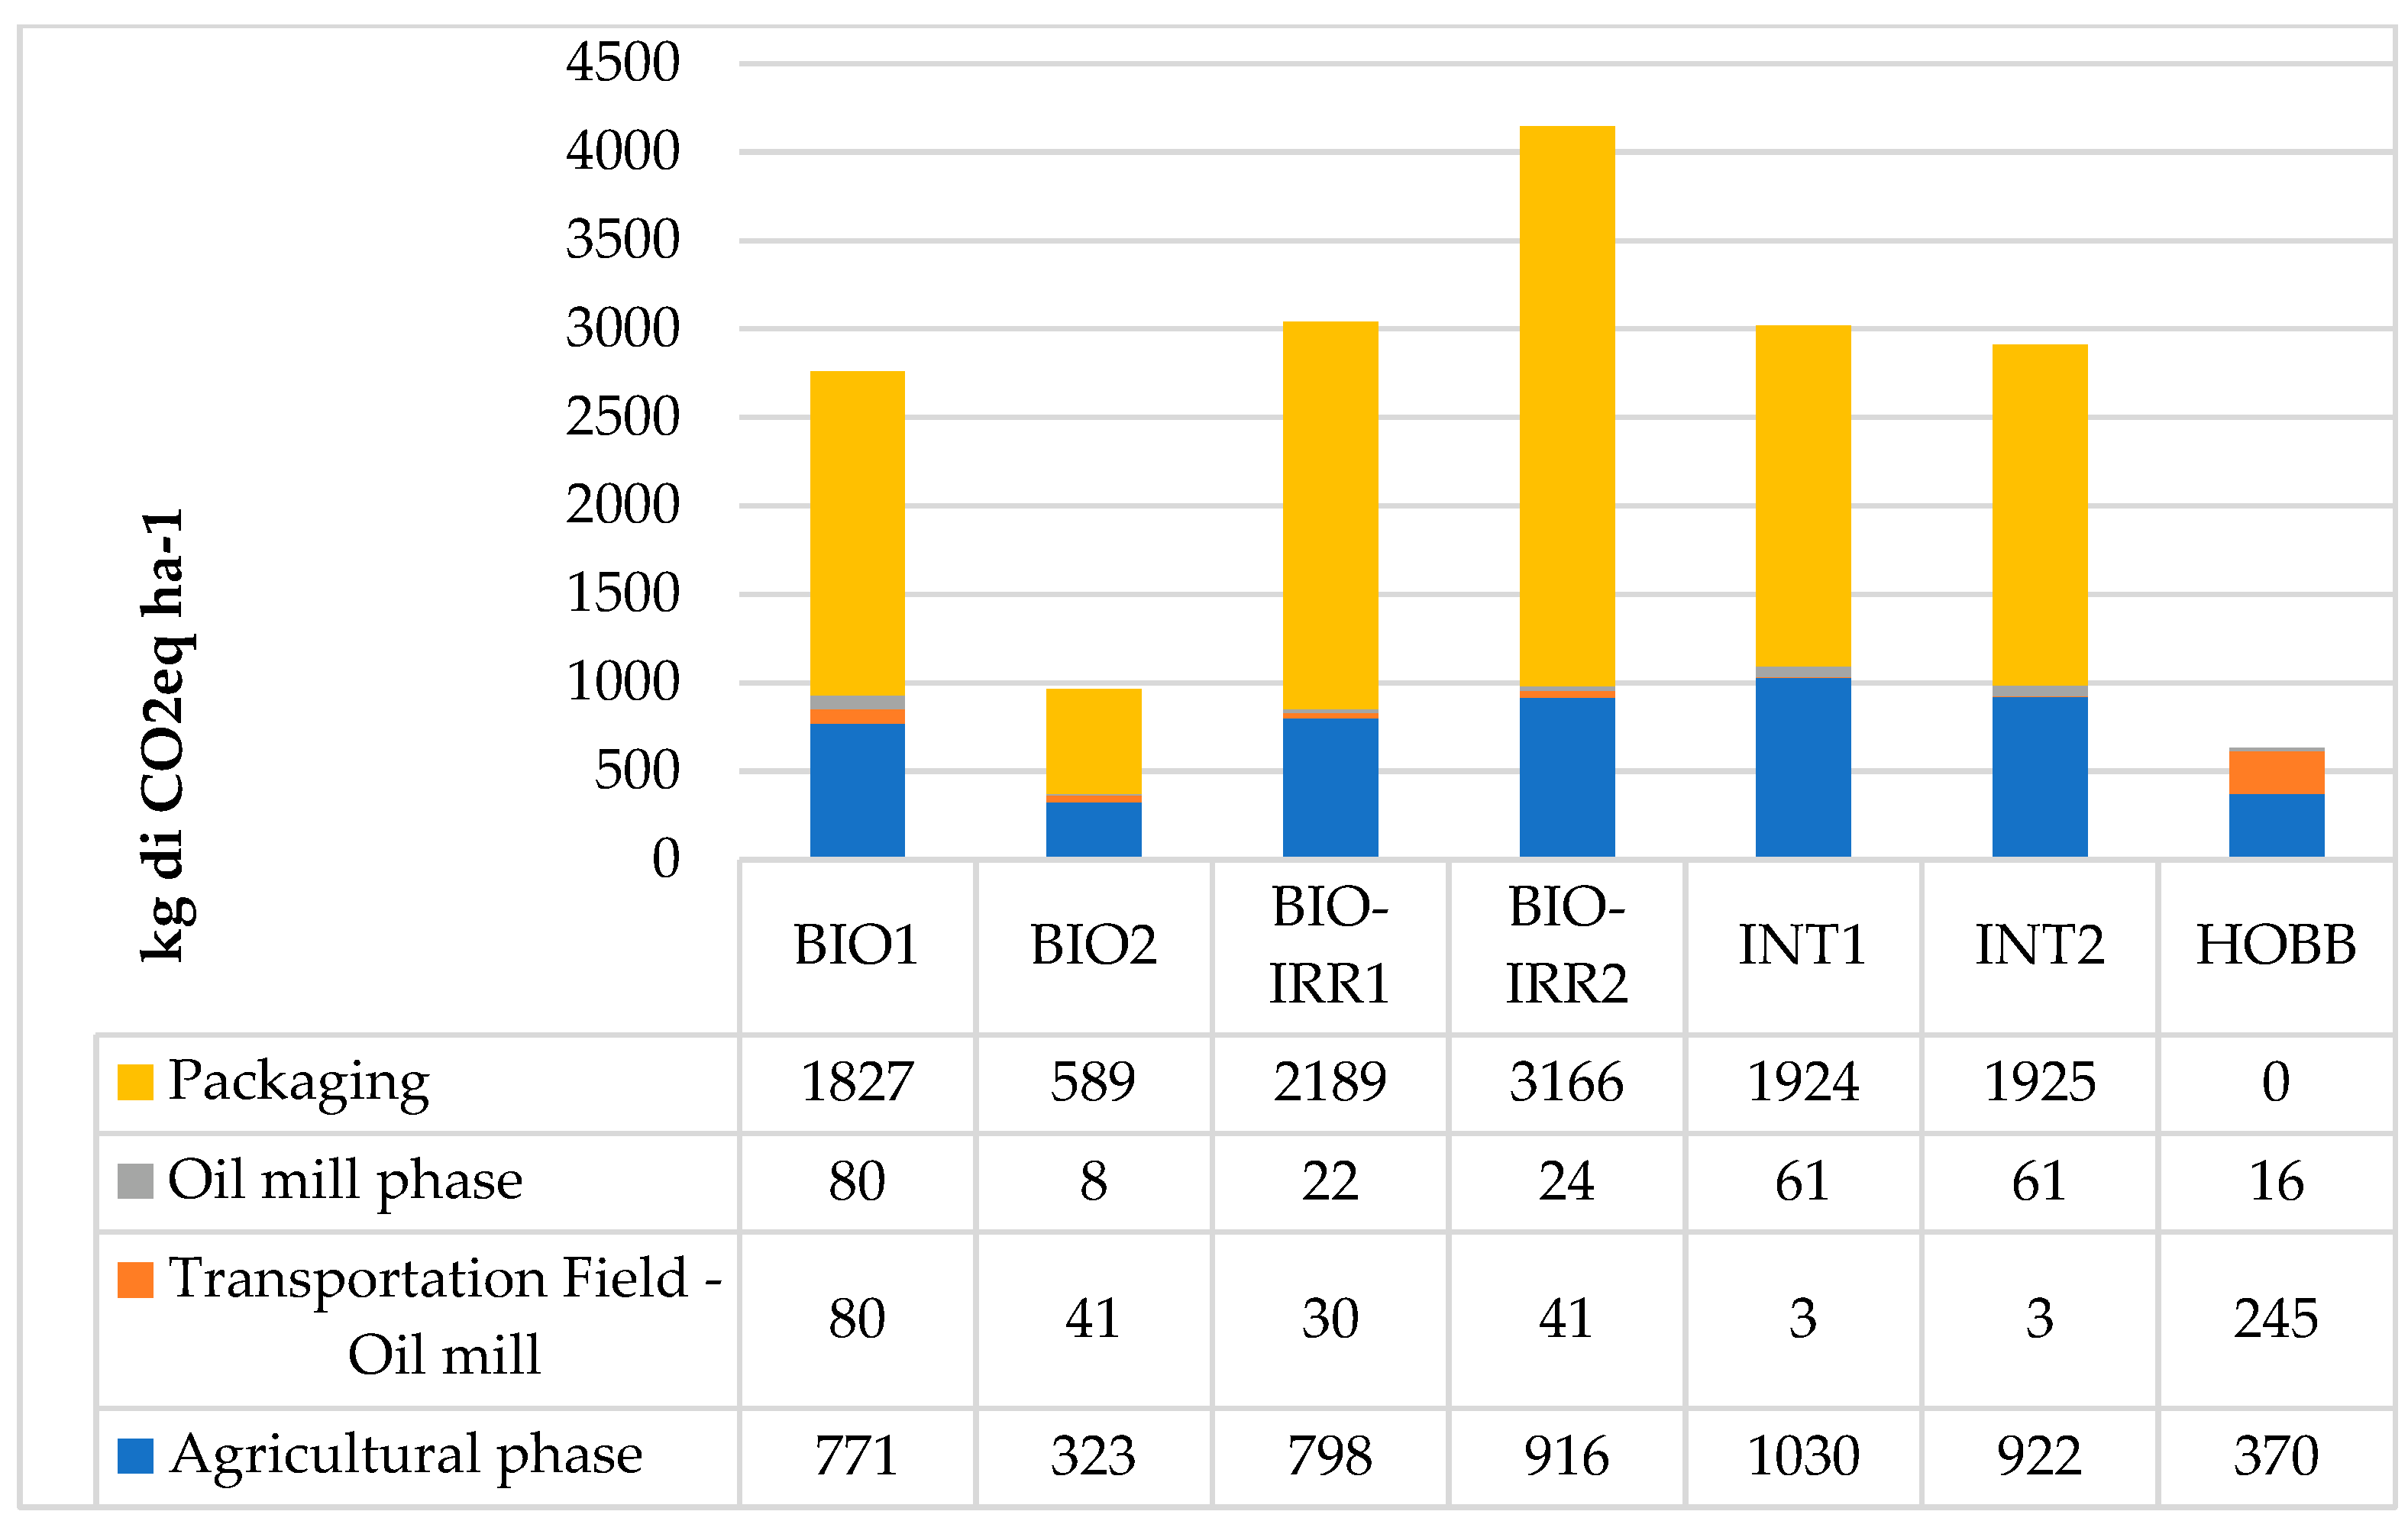
4.1. Environmental Impacts
4.2. Water Footprint
4.2.1. Green Water Footprint (WFgreen)
4.2.2. Blue Water Footprint (WFblue)
4.2.3. Grey Water Footprint (WFgrey)
4.2.4. Total Water Footprint (WF)
4.3. Economic Analysis
4.4. Social Analysis
5. Discussion
6. Conclusions
Author Contributions
Funding
Institutional Review Board Statement
Informed Consent Statement
Data Availability Statement
Acknowledgments
Conflicts of Interest
References
- Giovannini, E.; Riccaboni, A. Agenda 2030: Un Viaggio attraverso gli Obiettivi di Sviluppo Sostenibile; ASvis e Santa Chiara Lab: Roma Italy, 2021; ISBN 979-12-80634-01-6. Available online: https://asvis.it/public/asvis2/files/Pubblicazioni/Volume_Agenda2030_ASviS_Siena.pdf (accessed on 15 February 2022).
- FAO. Statistical Pocketbook—World Food and Agriculture. FAO: Rome, Italy. 2015. Available online: https://www.fao.org/3/i4691e/i4691e.pdf (accessed on 2 December 2021).
- Carraro, C. Clima, Acqua e Agricoltura: Dagli Impatti alle Buone Pratiche. 2016. Available online: https://carlocarraro.org/argomenti/cambiamento-climatico/clima-acqua-e-agricoltura-dagli-impatti-alle-buone-pratiche/ (accessed on 19 November 2021).
- Hallström, E.; Carlsson-Kanyama, A.; Börjesson, P. Environmental impact of dietary change: A systematic review. J. Clean. Prod. 2015, 91, 1–11. [Google Scholar] [CrossRef]
- Halpern, B.S.; Cottrell, R.S.; Blanchard, J.L.; Bouwman, L.; Froehlich, H.E.; Gephart, J.A.; Jacobsen, N.S.; Kuempel, C.D.; McIntyre, P.B.; Metian, M.; et al. Opinion: Putting all foods on the same table: Achieving sustainable food systems requires full accounting. Proc. Natl. Acad. Sci. USA. 2019, 116, 18152–18156. [Google Scholar] [CrossRef] [PubMed]
- Gibin, D.; Simonetto, A.; Zanini, B.; Gilioli, G. A framework assessing the footprints of food consumption. An application on water footprint in Europe. Env. Impact Assess Rev. 2022, 93, 106735. [Google Scholar] [CrossRef]
- EU Auditors ECA—European Court of auditors. Integration of EU Water Policy Objectives with the CAP: A Partial Success; Publications Office of the European Union: Luxembourg, 2014; ISBN 978-92-872-0028-0. Available online: https://www.eca.europa.eu/Lists/ECADocuments/SR14_04/SR14_04_EN.pdf (accessed on 10 November 2021). [CrossRef]
- European Commission. Communication from the Commission to the European Parliament and the Council—Addressing the Challenge of Water Scarcity and Droughts in the European Union; 2007. Available online: https://www.eea.europa.eu/policy-documents/addressing-the-challenge-of-water (accessed on 20 January 2022).
- European Commission. Comunicazione della Commissione al Parlamento Europeo, al Consiglio, al Comitato Economico e Sociale Europeo e al Comitato delle Regioni—Piano per la Salvaguardia delle Risorse Idriche Europee. 2012. Available online: https://eur-lex.europa.eu/legal-content/IT/ALL/?uri=celex:52012DC0673 (accessed on 25 January 2022).
- UNESCO—World Water Assessment Programme. The United Nations World Water Development Report 2020: Water and Climate Change; United Nations Educational, Scientific and Cultural Organization: Paris, France, 2020. [Google Scholar]
- Boselli, M.; Bahouaoui, M.A.; Lachhab, N.; Sanzani, S.M.; Ferrara, G.; Ippolito, A. Protein hydrolysates effects on grapevine (Vitis vinifera L., cv. Corvina) performance and water stress tolerance. Sci. Hortic. 2019, 258, 108784. [Google Scholar] [CrossRef]
- Bedbabis, S.; Rouina, B.B.; Boukhris, M.; Ferrara, G. Effects of irrigation with treated wastewater on root and fruit mineral elements of Chemlali olive cultivar. Sci. World J. 2014, 2014, 1–8. [Google Scholar] [CrossRef]
- Palese, A.M.; Pasquale, V.; Celano, G.; Figliuolo, G.; Masi, S.; Xiloyannis, C. Irrigation of olive groves in Southern Italy with treated municipal wastewater: Effects on microbiological quality of soil and fruits. Agric. Ecosyst. Environ. 2009, 129, 43–51. [Google Scholar] [CrossRef]
- Torres, R.; Ferrara, G.; Soto, F.; López, J.A.; Sanchez, F.; Mazzeo, A.; P’erez-Pastor, A.; Domingo, R. Effects of soil and climate in a table grape vineyard with cover crops. Irrigation management using sensors networks. Ciênc. Téc. Vitiviníc. 2017, 32, 72–81. [Google Scholar] [CrossRef]
- Fernández-Lobato, L.; García-Ruiz, R.; Jurado, F.; Vera, D. Life cycle assessment, C footprint and carbon balance of virgin olive oils production from traditional and intensive olive groves in southern Spain. J. Environ. Manag. 2021, 293, 112951. [Google Scholar] [CrossRef]
- Giourga, C.; Loumou, A. Olive groves: The life and identity of the Mediterranean. Agric. Hum. Values 2003, 20, 87–95. [Google Scholar]
- ISTAT. Censimento Agricoltura. 2010. Available online: http://censimentoagricoltura.istat.it/index.php?id=73 (accessed on 15 November 2021).
- ISMEA. Scheda di Settore: Olio D’oliva. 2021. Available online: https://www.ismeamercati.it/olio-oliva (accessed on 2 November 2021).
- Sisti, A.; Sarnari, T. L’Italia e la PAC Post 2020: Fabbisogni e Strumenti per Una Nuova Strategia del Settore Olivicolo-Oleario. Documento Realizzato nell’ambito del Programma Rete Rurale Nazionale 2014–20. 2021. Available online: https://www.reterurale.it/flex/cm/pages/ServeBLOB.php/L/IT/IDPagina/22568 (accessed on 11 November 2021).
- Infante-Amate, J.; Villa, I.; Aguilera, E.; Torremocha, E.; Guzmán, G.; Cid, A.; González de Molina, M. The Making of Olive Landscapes in the South of Spain. A History of Continuous Expansion and Intensification. In Biocultural Diversity in Europe; Agnoletti, M., Emanueli, F., Eds.; Environ Hist; Springer: Cham, Switzerland, 2016; Volume 5. [Google Scholar] [CrossRef]
- Russo, C.; Cappelletti, G.M.; Nicoletti, G.M.; Michalopoulos, G.; Pattara, C.; Palomino, J.A.P.; Tuomisto, H.L. Product environmental footprint in the olive oil sector: State of the art. Env. Eng. Manag. J. 2016, 15, 2019–2027. [Google Scholar] [CrossRef]
- Ferrara, G.; Loffredo, E.; Simeone, R.; Senesi, N. Evaluation of antimutagenic and desmutagenic effects of humic and fulvic acids on root tips of Vicia faba. Environ. Toxicol. 2000, 15, 513–517. [Google Scholar] [CrossRef]
- Ferrara, G.; Loffredo, E.; Senesi, N. Anticlastogenic, antitoxic and sorption effects of humic substances on the mutagen maleic hydrazide tested in leguminous plants. Eur. J. Soil. Sci. 2004, 55, 449–458. [Google Scholar] [CrossRef]
- Villanueva, M.; Colombo, S. Cost analysis of parcel fragmentation in agriculture: The case of traditional olive cultivation. Biosyst. Eng. 2017, 164, 135–146. [Google Scholar] [CrossRef]
- Palese, A.M.; Pergola, M.; Favia, M.; Xiloyannis, C.; Celano, G. A sustainable model for the management of olive orchards located in semi-arid marginal areas: Some remarks and indications for policy makers. Environ. Sci. Policy. 2013, 27, 81–90. [Google Scholar] [CrossRef]
- Stillitano, T.; Falcone, G.; De Luca, A.I.; Piga, A.; Conte, P.; Strano, A.; Gulisan, G. A life cycle perspective to assess the environmental and economic impacts of innovative technologies in extra virgin olive oil extraction. Foods 2019, 8, 209. [Google Scholar] [CrossRef]
- De Luca, A.I.; Stillitano, T.; Falcone, G.; Squeo, G.; Caponio, F.; Strano, A.; Gulisano, G. Economic and environmental assessment of extra virgin olive oil processing innovations. Chem. Eng. Trans. 2018, 67, 133–138. [Google Scholar] [CrossRef]
- Maffia, A.; Pergola, M.; Palese, A.M.; Celano, G. Environmental impact assessment of organic vs. integrated olive-oil systems in Mediterranean context. Agronomy 2020, 10, 416. [Google Scholar] [CrossRef]
- Brentrup, F.; Kusters, J.; Kuhlmann, H.; Lammel, J. Application of the Life Cycle Assessment methodology to agricultural production: An example of sugar beet production with different forms of nitrogen fertilisers. Eur. J. Agron. 2001, 14, 221–233. [Google Scholar] [CrossRef]
- Brentrup, F.; Kusters, J.; Kuhlmann, H.; Lammel, J. Environmental impact assessment of agricultural production systems using the life cycle assessment methodology—I. Theoretical concept of a LCA method tailored to crop production. Eur. J. Agron. 2004, 20, 247–264. [Google Scholar] [CrossRef]
- Cederberg, C. Life Cycle Assessment (LCA) of Animal Production. Ph.D. Thesis, Department of Applied Environmental Science, Göteborg University, Göteborg, Sweden, March 2002. [Google Scholar]
- Charles, R.; Jolliet, O.; Gaillard, G.; Pellet, D. Environmental analysis of intensity level in wheat crop production using life cycle assessment. Agric. Ecosyst. Environ. 2006, 113, 216–225. [Google Scholar] [CrossRef]
- De Backer, E.; Aertsens, J.; Vergucht, S.; Steurbaut, W. Assessing the Ecological Soundness of Organic and Conventional Agriculture by Means of Life Cycle Assessment (LCA)—A Case Study of Leek Production. Br. Food J. 2009, 10, 1028–1061. Available online: http://www.emeraldinsight.com/10.1108/00070700910992916 (accessed on 3 February 2021). [CrossRef]
- Haas, G.; Wetterich, F.; Geier, U. Life cycle assessment framework in agriculture on the farm level. Int. J. Life. Cycle. Assess. 2000, 5, 45–348. [Google Scholar] [CrossRef]
- i Canals, L.M.; Burnip, G.M.; Cowell, S.J. Evaluation of the environmental impacts of apple production using Life Cycle Assessment (LCA): Case study in New Zealand. Agric. Ecosyst. Environ. 2006, 114, 226–238. [Google Scholar] [CrossRef]
- Stern, S.; Sonesson, U.; Gunnarsson, S.; Oborn, I.; Kumm, K.I.; Nybrant, T. Sustainable development of food production: A case study on scenarios for pig production. AMBIO 2005, 34, 402–407. [Google Scholar] [CrossRef] [PubMed]
- Thomassen, M.A.; van Calker, K.J.; Smits, M.C.J.; Iepema, G.L.; de Boer, I.J.M. Life cycle assessment of conventional and organic milk production in the Netherlands. Agric. Syst. 2008, 96, 95–107. [Google Scholar] [CrossRef]
- Espadas-Aldana, G.; Vialle, C.; Belaud, J.P.; Vaca-Garcia, C.; Sablayrolles, C. Analysis and trends for Life Cycle Assessment of olive oil production. Sustain. Prod. Consum. 2019, 19, 216–230. [Google Scholar] [CrossRef]
- Pellegrini, G.; Ingrao, C.; Camposeo, S.; Tricase, C.; Contó, F.; Huisingh, D. Application of water footprint to olive growing systems in the Apulia region: A comparative assessment. J. Clean. Prod. 2016, 112, 2407–2418. [Google Scholar] [CrossRef]
- EN ISO 14044; Environmental Management, Life Cycle Assessment—Requirements and Guidelines. International Organization for Standardization (ISO): Geneva, Switzerland, 2006.
- EN ISO 14040; Environmental Management, Life Cycle Assessment—Principles and Framework. International Organization for Standardization (ISO): Geneva, Switzerland, 2006.
- Schau, E.M.; Palomino, J.A.P.; Michalopoulos, G.; Russo, C. Product Environmental Footprint Category Rules for Olive Oil. Draft for 3rd Public Consultation Phase. 2016. Available online: https://ec.europa.eu/environment/eussd/smgp/pdf/pilots/draft_pefcr_olive_oil_pilot_for_3rd_consultation.pdf (accessed on 3 February 2020).
- PCR—Product Category Rules. Virgin Olive Oil and Its Fractions Product Group: Un Cpc 21537. 2017. Version 2010:07. Valid Until 1/04/2018. Available online: https://www.environdec.com/PCR/ (accessed on 7 January 2020).
- Cerutti, A.K.; Bruun, S.; Beccaro, G.L.; Bounous, G. A review of studies applying environmental impact assessment methods on fruit production systems. J. Environ. Manag. 2011, 92, 2277–2286. [Google Scholar] [CrossRef]
- Pergola, M.; Persiani, A.; Pastore, V.; Palese, A.M.; Arous, A.; Celano, G. A comprehensive Life Cycle Assessment (LCA) of three apricot orchard systems located in Metapontino area (Southern Italy). J. Clean. Prod. 2017, 142, 4059–4071. [Google Scholar] [CrossRef]
- Seda, M.; Assumpeió, A.; Muñoz, P. Analysing the influence of functional unit in agricultural LCA. LCA FOOD 2010. In Proceedings of the 7th International Conference on Life Cycle Assessment in the Agri-Food Sector (LCA Food 2010), Bari, Italy, 22–24 September 2010. [Google Scholar]
- Guinée, J.B.; Gorrée, M. Life Cycle Assessment: An Operational Guide to the ISO Standards; School of System Engineering, Policy Analysis and Management, Delft University of Technology: Delft, The Netherlands, 2001. [Google Scholar]
- Hoekstra, A.Y.; Chapagain, A.K.; Mekonnen, M.M. The Water Footprint Assessment Manual: Setting the Global Standard; Earthscan: London, UK, 2011. [Google Scholar]
- Hoekstra, A.Y.; Hung, P.Q. Virtual Water Trade: A Quantification of Virtual Water Flows between Nations in Relation to International Crop Trade. Value of Water Research Report Series, No. 11; UNESCO-IHE: Delft, The Netherlands, 2002. [Google Scholar]
- Hoekstra, A.Y.; Chapagain, A.K. Globalization of Water: Sharing the Planet’s Freshwater Resources; Blackwell Publishing: Oxford, UK, 2008. [Google Scholar]
- EN ISO 14046; Environmental Management—Water Footprint—Principles, Requirements and Guidelines. International Organization for Standardization (ISO): Geneva, Switzerland, 2016.
- Badruzzaman, M.; Oppenheimer, J. Water Footprints: A New Concept for Sustainable Water Utilities; The Water Research Foundation: Denver, CO, USA, 2014; pp. 6–10. [Google Scholar]
- Chapagain, A.K.; Hoekstra, A.Y.; Savenije, H.H.G.; Gautam, R. The water footprint of cotton consumption: An assessment of the impact of worldwide consumption of cotton products on the water resources in the cotton producing countries. Ecol. Econ. 2006, 60, 186–203. [Google Scholar] [CrossRef]
- Maragno, A. Water Footprint di un Prodotto Alimentare Biologico: Studio Pilota per il Calcolo dell’indicatore e la Valutazione degli Impatti. Tesi di Laurea Magistrale in Ingegneria Chimica e dei Processi Industriali; Università degli studi di Padova: Padova, Italy, 2011. [Google Scholar]
- Mekonnen, M.M.; Hoekstra, A.Y. The green, blue and grey water footprint of crops and derived crop products. Hydrol. Earth. Syst. Sci. 2011, 15, 1577–1600. [Google Scholar] [CrossRef]
- FAO. Database CROPWAT. 2010. Available online: http://www.fao.org/land-water/databases-and-software/cropwat/en/ (accessed on 17 May 2022).
- Ammar, M.; Zayed, T.; Moselhi, O. Fuzzy-based life-cycle cost model for decision making under subjectivity. J. Constr. Eng. Manag. 2013, 139, 556–563. [Google Scholar] [CrossRef]
- Peña, A.; Rovira-Val, M.R. A longitudinal literature review of life cycle costing applied to urban agriculture. Int. J. Life Cycle Assess. 2020, 25, 1418–1435. [Google Scholar] [CrossRef]
- EN ISO 15686-5; Buildings and Constructed Assets—Service-Life Planning—Part 5: Life-Cycle Costing. Nederlands Normalisatie Institut: Delft, The Nederlands, 2008.
- Wu, S.; Longhurst, P. Optimising age-replacement and extended non-renewing warranty policies in lifecycle costing. Int. J. Prod. Econ. 2011, 130, 262–267. [Google Scholar] [CrossRef][Green Version]
- Brandão, M.; Clift, R.; Basson, L. A life-cycle approach to characterising environmental and economic impacts of multifunctional land-use systems: An integrated assessment in the UK. Sustainability 2010, 2, 3747–3776. [Google Scholar] [CrossRef]
- Zinnanti, C.; Schimmenti, E.; Borsellino, V.; Paolini, G.; Severini, S. Economic performance and risk of farming systems specialized in perennial crops: An analysis of Italian hazelnut production. Agric. Syst. 2019, 176, 102645. [Google Scholar] [CrossRef]
- Pappalardo, G.; Scienza, A.; Vindigni, G.; D’Amico, M. Profitability of wine grape growing in the EU member states. J. Wine. Res. 2013, 24, 59–76. [Google Scholar] [CrossRef]
- Huertas-Valdivia, I.; Ferrari, A.M.; Settembre-Blundo, D.; García-Muiña, F.E. Social Life-Cycle Assessment: A Review by Bibliometric Analysis. Sustainability 2020, 12, 6211. [Google Scholar] [CrossRef]
- Hunkeler, D. Societal LCA Methodology and Case Study. Int. J. Life Cycle Assess. 2006, 11, 371–382. [Google Scholar] [CrossRef]
- Benoît, C.; Norris, G.A.; Valdivia, S.; Ciroth, A.; Moberg, A.; Bos, U.; Prakash, S.; Ugaya, C.; Beck, T. The guidelines for social life cycle assessment of products: Just in time! Int. J. Life Cycle Assess. 2010, 15, 156–163. [Google Scholar] [CrossRef]
- UNEP—SETAC. Guidelines for Social Life Cycle Assessment of Products. Belgian Federal Public Planning Service Sustainable Development. 2009. Available online: https://www.lifecycleinitiative.org/wp-content/uploads/2012/12/2009%20-%20Guidelines%20for%20sLCA%20-%20EN.pdf (accessed on 10 February 2020).
- Huarachi, D.A.R.; Piekarski, C.M.; Puglieri, F.N.; de Francisco, A.C. Past and future of Social Life Cycle Assessment: Historical evolution and research trends. J. Clean Prod. 2020, 264, 121506. [Google Scholar] [CrossRef]
- De Luca, A.I.; Iofrida, N.; Strano, A.; Falcone, G.; Gulisano, G. Social life cycle assessment and participatory approaches: A methodological proposal applied to citrus farming in Southern Italy. Integr. Env. Assess. Manag. 2015, 11, 383–396. [Google Scholar] [CrossRef] [PubMed]
- Iofrida, N.; Strano, A.; Gulisano, G.; De Luca, A.I. Why social life cycle assessment is struggling in development? Int. J. Life Cycle Assess. 2018, 23, 201–203. [Google Scholar] [CrossRef]
- Arcese, G.; Lucchetti, M.C.; Massa, I. Modeling Social Life Cycle Assessment framework for the Italian wine sector. J. Clean Prod. 2017, 140, 1027–1036. [Google Scholar] [CrossRef]
- Samperi, A. Cos’è la SLCA e Perché Dovresti Usarla nella Tua Azienda. 2020. Available online: https://www.sfridoo.com/2020/07/23/aziende/social-lca-perche-dovresti-usarla-nel-tuo-business (accessed on 3 March 2021).
- European Council. Directive n 91/676/EEC of 12 December 1991 Concerning the Protection of Waters against Pollution Caused by Nitrates from Agricultural Sources. 1991. Available online: https://eur-lex.europa.eu/legal-content/EN/TXT/?uri=celex%3A31991L0676 (accessed on 3 February 2021).
- Salvioli, L.; Finizio, M.; Cattaneo, L.; Federico, B.; Galimberti, L.; Calvi, A.; Zitti Pozzi. Indice della Criminalità. Sole 24 Ore su dati del Dipartimento di Pubblica Sicurezza—Ministero dell’Interno. 2022. Available online: https://lab24.ilsole24ore.com/indice-della-criminalita/indexT.php (accessed on 15 May 2022).
- Gattullo, C.E.; Mezzapesa, G.N.; Stellacci, A.M.; Ferrara, G.; Occhiogrosso, G.; Petrelli, G.; Castellini, M.; Spagnuolo, M. Cover crop for a sustainable viticulture: Effects on soil properties and table grape production. Agronomy 2020, 10, 1334. [Google Scholar] [CrossRef]
- Amicarelli, V.; Lagioia, G.; Gallucci, T.; Dimitrova, V. The water footprint as an indicator for managing water resources: The case of Italian olive oil. Int. J. Sustain. Econ. 2011, 3, 425–439. [Google Scholar] [CrossRef]
- Dichio, B.; Palese, A.M.; Montanaro, G.; Xylogiannis, E.; Sofo, A. A preliminary assessment of water footprint components in a Mediterranean olive grove. Acta Hortic. 2014, 1038, 671–676. [Google Scholar] [CrossRef]
- Nogueira, A.M.; Paço, T.A.; Silvestre, J.C.; Gonzalez, L.F.; Santos, F.L.; Pereira, L.S. Water footprint of a super-intensive olive grove under Mediterranean climate using ground-based evapotranspiration measurements and remote sensing. Geophys. Res. Abstr. 2012, 14, 2012–11301. [Google Scholar]
- Salmoral, G.; Aldaya, M.M.; Chico, D.; Garrido, A.; Llamas, M.R. The water footprint of olives and olive oil in Spain. Span. J. Agric. Res. 2011, 9, 1089–1104. [Google Scholar] [CrossRef]
- Raluy, R.G.; Quinteiro, P.; Dias, A.C. Water Footprint of Forest and Orchard Trees: A Review. Water 2022, 14, 2709. [Google Scholar] [CrossRef]
- Palese, A.M.; Celano, G.; Xiloyannis, C. Esigenze Minerali e Tecniche di Concimazione. Accademia Nazionale dell’Olivo e dell’Olio Palazzo Ancajani—Piazza della Libertà, 12. 06049 Spoleto (PG). Collana divulgativa dell’Accademia. Volume X. 2012. ISSN 2281-4930. Available online: https://accademiaolivoeolio.com/img2/file/palese-et-al-esigenze-minerali-e-tecniche-di-concimazione_201804061101921_9c1pcptsi5mnhw9ivqw4d800z.pdf (accessed on 15 October 2022).


| Orchard Characteristics | BIO1 | BIO2 | BIO-IRR1 | BIO-IRR2 | INT1 | INT2 | HOBB |
|---|---|---|---|---|---|---|---|
| Cultivar | Salella | Rotondella | Pisciottana | Pisciottana | Rotondella | Leccino | Rotondella |
| Leccino | Salella | Frantoio | Frantoio | Frantoio | Ogliarola | ||
| Frantoiana | Rotondella | Ogliarola | Carpellese | ||||
| Leccino | Carpellese | ||||||
| Planting density (trees ha–1) | 156 (8 × 8) | 277 (6 × 6) | 277 (6 × 6) | 277 (6 × 6) | 400 (5 × 5) | 333 (5 × 6) | 333 (5 × 6) |
| Soil texture | Clayey | Clayey | Franco-clayey | Franco-clayey | Sandy | Clayey | Franco-Sandy |
| Trees age (years) | Secular | Secular | Secular | Secular | 80 | 30 | Secular |
| Cultivation system | Certified organic | Certified organic | Certified organic | Organic regenerative agriculture | Integrated | Integrated | Organic |
| Pruning method | Manual | ||||||
| Pruning residues management | Used as soil mulching | Composting | 80% Used as soil mulching, 20% wood bundles | Used as soil mulching | Firewood | Used as soil mulching | Firewood |
| Irrigation | NO | NO | YES | YES | NO | NO | NO |
| Fertilization | Annual/ organic | Annual/ organic | Annual/ organic | Annual/ organic | Annual/ mineral | Annual/ mineral | Annual/ organic |
| Soil management/ weed control | Temporary natural grass cover-Disk harrowing | Temporary natural grass cover-Disk harrowing | Green manure-Disk harrowing | Grazing-Disk harrowing | Glyphosate-Disk harrowing | NO | NO |
| Disease control | Organic products | Organic products | Organic products | Organic products | Convention al products | Convention al products | NO |
| Harvesting method | Mechanized | Manual | Mechanized | Manual | |||
| BIO1 | BIO2 | BIO-IRR1 | BIO-IRR2 | INT1 | INT2 | HOBB | |
|---|---|---|---|---|---|---|---|
| Fertilizers (kg ha−1) | |||||||
| Ferti Field (organic nitrogen) | 800 | 800 | |||||
| Compost | 400 | 500 | 10,000 | 5000 | |||
| Biofertilizer | 80 | ||||||
| NPK | 300 | ||||||
| Chemicals (kg ha−1) | |||||||
| Bordeaux mixture | 3 | ||||||
| Lime | 1.5 | ||||||
| kaolin | 1 | 1.5 | 10 | ||||
| Vitabor | 1.5 | ||||||
| Copper, Sulfur, Zeolite | 1 | ||||||
| Idrofloral | 6.5 | 6.5 | |||||
| Iperion | 9 | 9 | |||||
| Boron | 1 | 2 | 2 | ||||
| Epik | 1.2 | 1.2 | |||||
| Spinosad | 3 | ||||||
| Manisol | 3 | 5 | |||||
| Abies-Cu | 2 | ||||||
| Glifosate | 4 | ||||||
| Seeds | 30 | ||||||
| Human labour (h ha–1) | 257 | 85 | 187 | 102 | 501 | 120 | 186 |
| Machinery (h ha–1) | 117 | 69 | 89 | 98 | 134 | 106 | 130 |
| Diesel (kg ha–1) | 181 | 66 | 176 | 275 | 81 | 80 | 54 |
| Water (l ha−1) | 6400 | 10,000 | |||||
| Olives average yield (kg ha−1 year−1) | 8300 | 3500 | 8400 | 8500 | 8000 | 8500 | 4300 |
| Stakeholders | Impact Categories | ||||
|---|---|---|---|---|---|
| Workers | Safety | Remuneration | Equity of treatment | Protected category workers | Foreign workers |
| Suppliers | Fair Payments | Compliance with delivery times | Respect for human rights throughout the supply chain | Absence of corruption | No abuse of power |
| Community | No impact on health due to the proximity of the plants | No movement of the community due to the proximity of the plants | Philanthropic activities of the farm | Interactions with local authorities | Farm participation in local events |
| Consumers | Product safety | Product transparency | No damage due to the consumption of products | Possibility to track the purchased product | Any discounts for fragile categories |
| Impact Categories | Unit | BIO1 | BIO2 | BIO-IRR1 | BIO-IRR2 | INT1 | INT2 | HOBB |
|---|---|---|---|---|---|---|---|---|
| AD | kg Sb eq | 0.001 | 0.000 | 0.006 | 0.009 | 0.001 | 0.001 | 0.000 |
| AD-fossil fuels | MJ | 33.394 | 13.586 | 58.525 | 65.800 | 46.597 | 36.567 | 8.354 |
| GWP | kg CO2 eq | 2.649 | 1.504 | 3.045 | 4.067 | 3.389 | 2.634 | 0.734 |
| ODP | Kg CFC-11 eq | 0.000 | 0.000 | 0.000 | 0.000 | 0.000 | 0.000 | 0.000 |
| HT | kg 1,4-DB eq | 3.540 | 4.305 | 20.000 | 27.019 | 3.687 | 3.102 | 0.030 |
| FWE | kg 1,4-DB eq | 0.736 | 0.421 | 20.980 | 29.372 | 1.067 | 0.880 | 0.007 |
| MAE | kg 1,4-DB eq | 3219 | 1685 | 24824 | 34228 | 4483 | 3938 | 35 |
| TE | kg 1,4-DB eq | 0.007 | 0.007 | 0.023 | 0.030 | 0.006 | 0.007 | 0.000 |
| PO | kg C2H4 eq | 0.001 | 0.000 | 0.001 | 0.001 | 0.001 | 0.001 | 0.000 |
| AA | kg SO2 eq | 0.045 | 0.016 | 0.033 | 0.041 | 0.040 | 0.041 | 0.005 |
| EU | kg PO43− eq | 0.007 | 0.003 | 0.028 | 0.036 | 0.008 | 0.008 | 0.001 |
| Systems | Yield (kg Olives) | ETgreen (m3 ha−1) | WFgreen | |
|---|---|---|---|---|
| m3 kgolives−1 | m3 Loil−1 | |||
| BIO1 | 8300 | 2522 | 0.304 | 2.532 |
| BIO2 | 3500 | 2522 | 0.721 | 4.804 |
| BIO-IRR1 | 8400 | 2110 | 0.251 | 2.093 |
| BIO-IRR2 | 8500 | 2110 | 0.248 | 2.069 |
| INT1 | 8000 | 3790 | 0.474 | 3.644 |
| INT2 | 8500 | 3790 | 0.446 | 3.430 |
| HOBB | 4300 | 2110 | 0.491 | 2.453 |
| Systems | Yield (kg Olives) | ET blue (m3 ha−1) | Direct Fraction (m3 ha−1) | Indirect Fraction (m3 ha−1) | Total ETblue (m3 ha−1) | WFblue | |
|---|---|---|---|---|---|---|---|
| m3 kgolives−1 | m3 Loil−1 | ||||||
| BIO1 | 8300 | 954 | 6.1 | 3.1 | 963 | 0.12 | 0.967 |
| BIO2 | 3500 | 954 | 5.1 | 2.1 | 961 | 0.27 | 1.831 |
| BIO-IRR1 | 8400 | 140 | 68.8 | 2.2 | 211 | 0.03 | 0.209 |
| BIO-IRR2 | 8500 | 140 | 105.7 | 3.5 | 249 | 0.03 | 0.244 |
| INT1 | 8000 | 1839 | 6.3 | 1.3 | 1847 | 0.23 | 1.776 |
| INT2 | 8500 | 1839 | 6.4 | 1.3 | 1847 | 0.22 | 1.671 |
| HOBB | 4300 | 954 | 4.0 | 1.2 | 959 | 0.22 | 1.115 |
| Systems | Yield (kg Olives) | Nitrogen | α | C max (kg m3) | WFgrey | |
|---|---|---|---|---|---|---|
| Kg ha−1 | m3 kgolives−1 | m3 Loil−1 | ||||
| BIO1 | 8300 | 10 | 0.10 | 0.015 | 0.02 | 0.152 |
| BIO2 | 3500 | 12 | 0.10 | 0.015 | 0.01 | 0.064 |
| BIO-IRR1 | 8400 | 120 | 0.10 | 0.015 | 0.10 | 0.667 |
| BIO-IRR2 | 8500 | 240 | 0.10 | 0.015 | 0.19 | 1.569 |
| INT1 | 8000 | 64 | 0.25 | 0.015 | 0.13 | 1.113 |
| INT2 | 8500 | 64 | 0.25 | 0.015 | 0.13 | 0.629 |
| HOBB | 4300 | 24 | 0.10 | 0.015 | 0.04 | 0.187 |
| Systems | WF GREEN | WF BLUE | WF GREY | Total WF |
|---|---|---|---|---|
| m3 kg−1 Olives | ||||
| BIO1 | 0.304 | 0.116 | 0.018 | 0.438 |
| BIO2 | 0.721 | 0.275 | 0.010 | 1.005 |
| BIO-IRR1 | 0.251 | 0.025 | 0.100 | 0.376 |
| BIO-IRR2 | 0.248 | 0.029 | 0.188 | 0.466 |
| INT1 | 0.474 | 0.231 | 0.134 | 0.838 |
| INT2 | 0.446 | 0.217 | 0.126 | 0.789 |
| HOBB | 0.491 | 0.223 | 0.037 | 0.751 |
| Operation | BIO1 | BIO2 | BIO-IRR1 | BIO-IRR2 | INT1 | INT2 | HOBB |
|---|---|---|---|---|---|---|---|
| € ha−1 | |||||||
| Farm Costs (Insurance, Taxes, Consortium Contributions, Interest on Working Capital, Overheads) | 543 | 546 | 564 | 566 | 718 | 718 | 552 |
| Pruning | 343 | 380 | 328 | 242 | 444 | 444 | 227 |
| Pruning residues management | 275 | 31 | 249 | 230 | 82 | 82 | 29 |
| Soil management and weed control | 256 | 78 | 777 | 377 | 450 | 329 | 823 |
| Fertilization | 48 | 70 | 250 | 375 | 740 | 740 | 311 |
| Disease control | 72 | 152 | 403 | 1093 | 514 | 514 | 0 |
| Harvesting | 333 | 696 | 833 | 562 | 956 | 578 | 300 |
| Oil mill | 830 | 350 | 750 | 800 | 800 | 850 | 430 |
| Bottling and Labelling | 1152 | 850 | 1195 | 1248 | 1240 | 1250 | 0 |
| Total | 3853 | 3154 | 5349 | 5494 | 5945 | 5506 | 2672 |
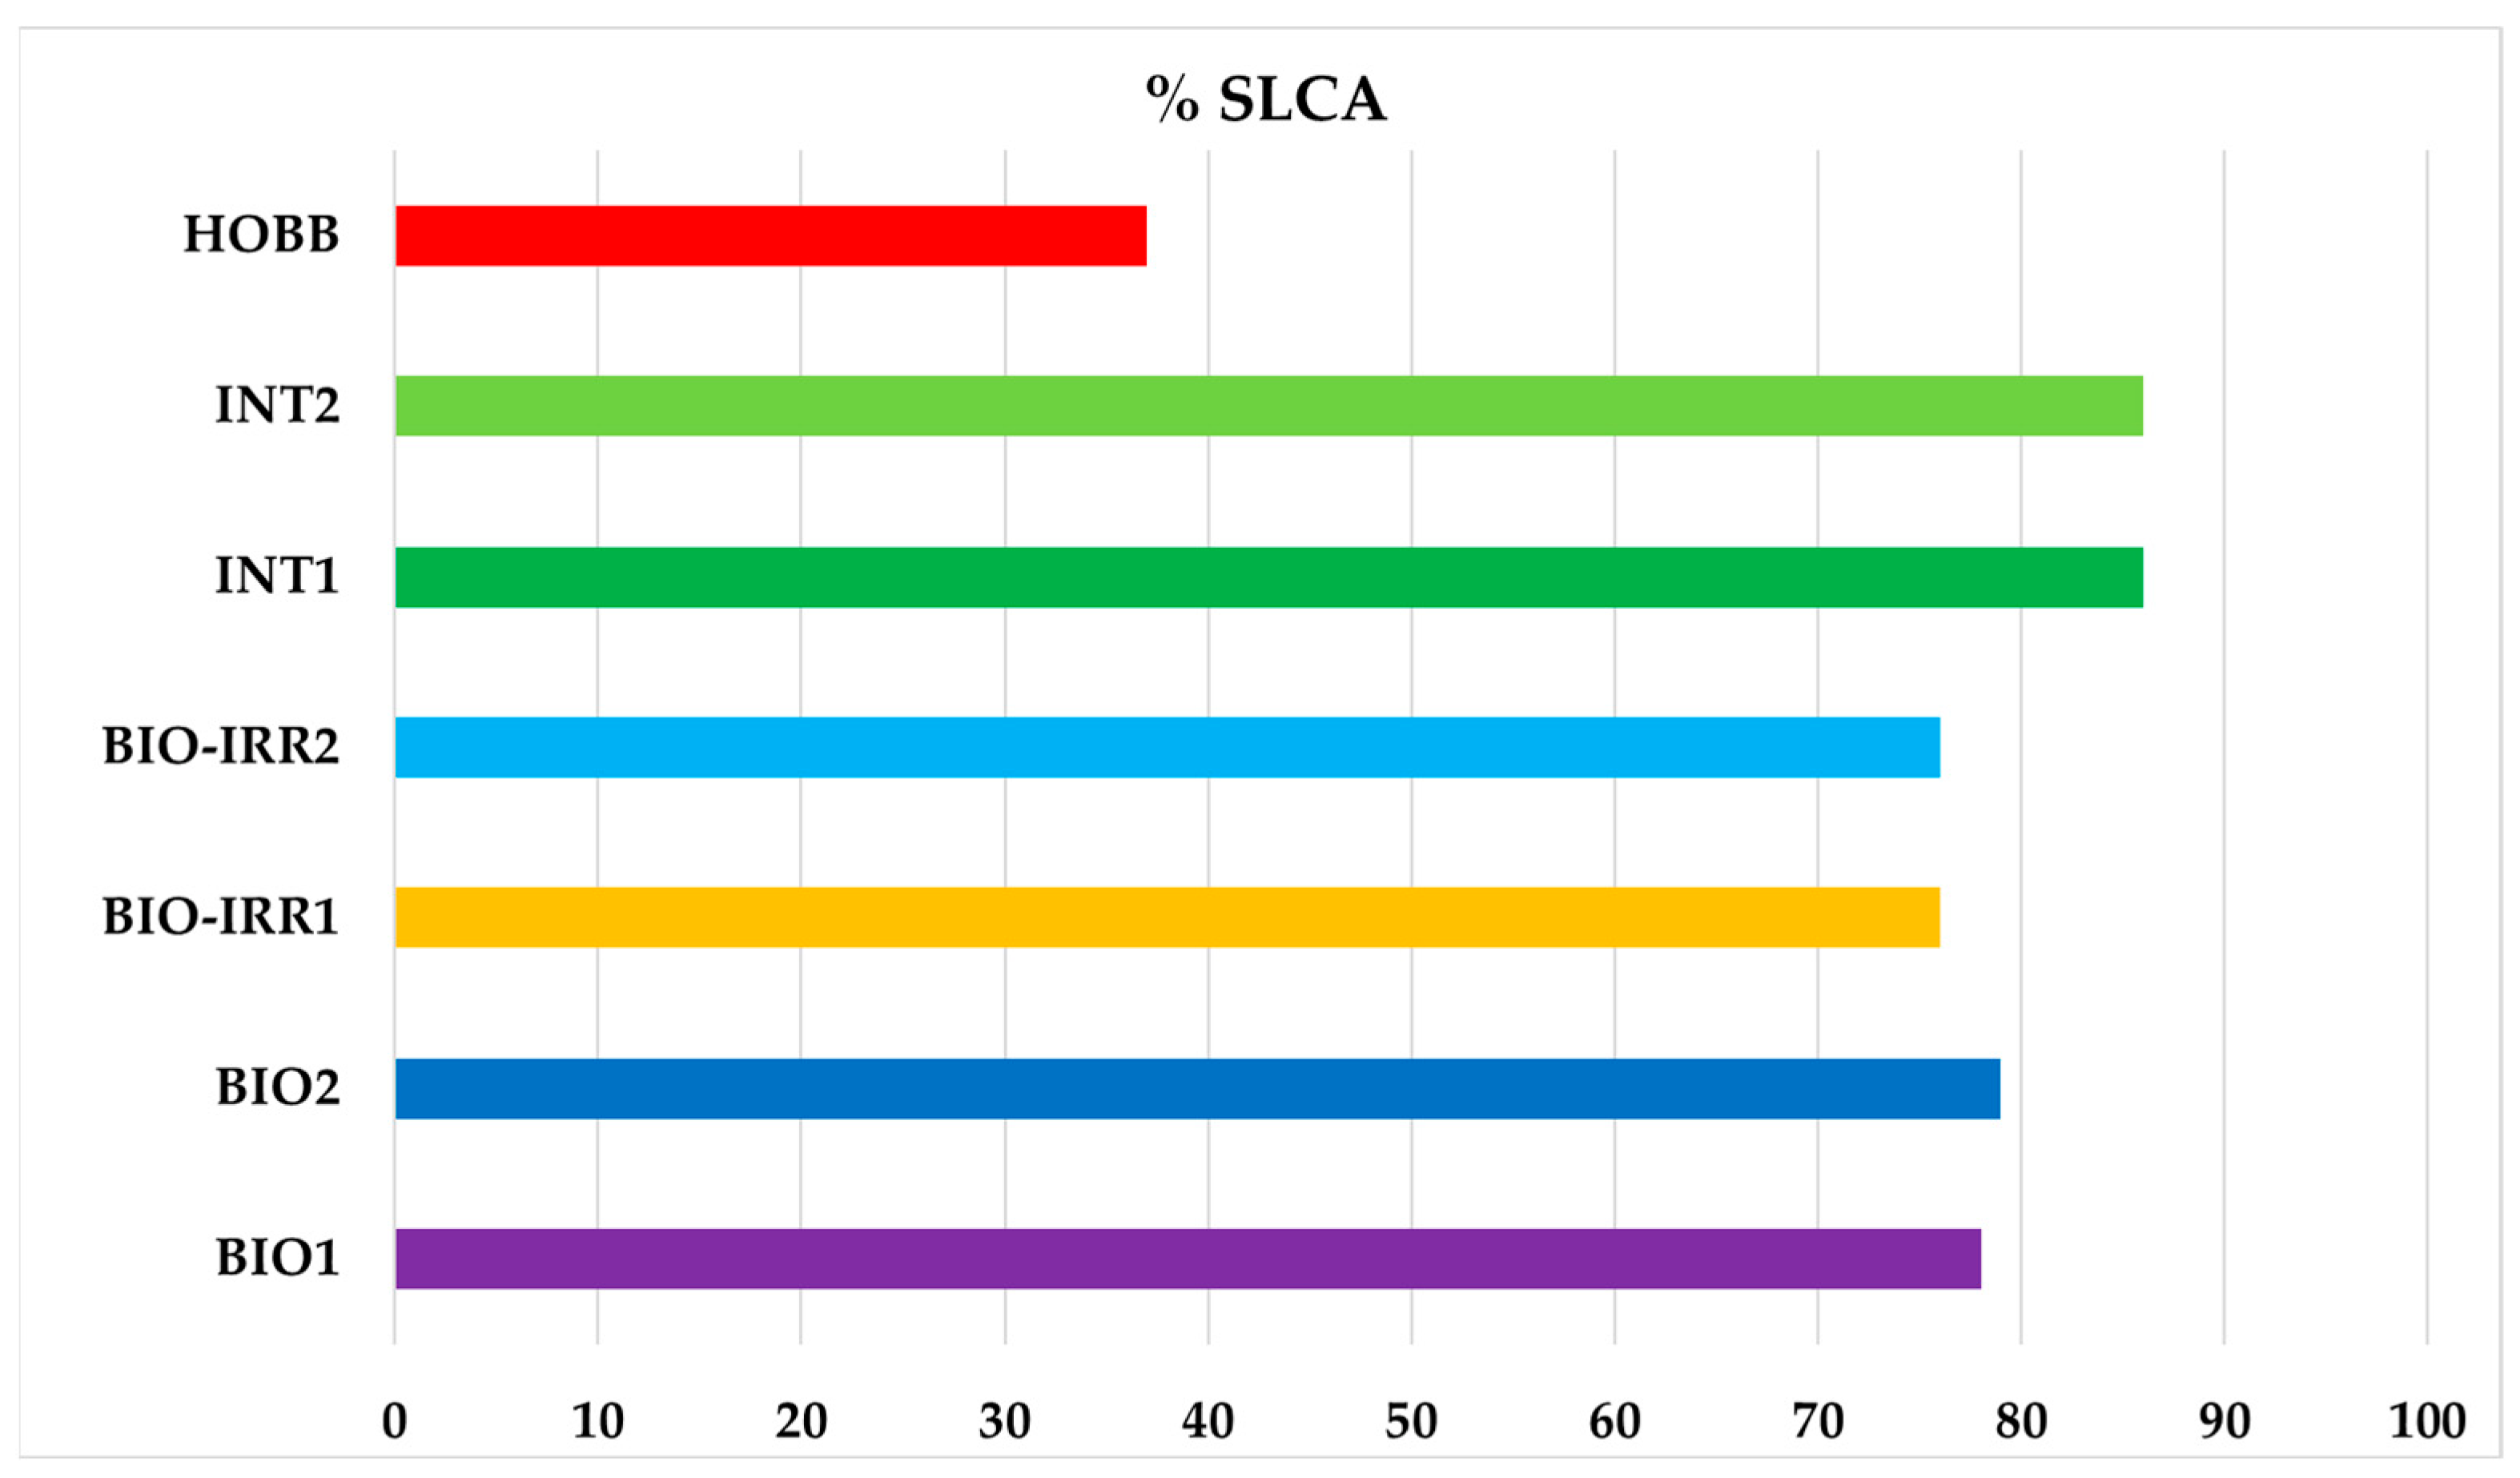
| Systems | GWP | WF | SLCA | Costs | ||
|---|---|---|---|---|---|---|
| kg CO2 eq Loil−1 | m3 kg−1 olives | m3 Loil−1 | % | € ha−1 | € Loil−1 | |
| BIO1 | 2.65 | 0.44 | 3.65 | 78 | 3853 | 3.87 |
| BIO2 | 1.50 | 1.00 | 6.70 | 79 | 3154 | 6.01 |
| BIO-IRR1 | 3.05 | 0.38 | 2.97 | 76 | 5349 | 5.31 |
| BIO-IRR2 | 4.07 | 0.47 | 3.88 | 76 | 5494 | 5.39 |
| INT1 | 3.39 | 0.84 | 6.53 | 86 | 5945 | 5.72 |
| INT2 | 2.63 | 0.79 | 5.73 | 86 | 5506 | 4.98 |
| HOBB | 0.73 | 0.75 | 3.76 | 37 | 2672 | 3.11 |
Publisher’s Note: MDPI stays neutral with regard to jurisdictional claims in published maps and institutional affiliations. |
© 2022 by the authors. Licensee MDPI, Basel, Switzerland. This article is an open access article distributed under the terms and conditions of the Creative Commons Attribution (CC BY) license (https://creativecommons.org/licenses/by/4.0/).
Share and Cite
Maffia, A.; Palese, A.M.; Pergola, M.; Altieri, G.; Celano, G. The Olive-Oil Chain of Salerno Province (Southern Italy): A Life Cycle Sustainability Framework. Horticulturae 2022, 8, 1054. https://doi.org/10.3390/horticulturae8111054
Maffia A, Palese AM, Pergola M, Altieri G, Celano G. The Olive-Oil Chain of Salerno Province (Southern Italy): A Life Cycle Sustainability Framework. Horticulturae. 2022; 8(11):1054. https://doi.org/10.3390/horticulturae8111054
Chicago/Turabian StyleMaffia, Angela, Assunta Maria Palese, Maria Pergola, Gessica Altieri, and Giuseppe Celano. 2022. "The Olive-Oil Chain of Salerno Province (Southern Italy): A Life Cycle Sustainability Framework" Horticulturae 8, no. 11: 1054. https://doi.org/10.3390/horticulturae8111054
APA StyleMaffia, A., Palese, A. M., Pergola, M., Altieri, G., & Celano, G. (2022). The Olive-Oil Chain of Salerno Province (Southern Italy): A Life Cycle Sustainability Framework. Horticulturae, 8(11), 1054. https://doi.org/10.3390/horticulturae8111054