Article

Metabolomics Data Revealed Metabolite Changes during Endocarp Lignification in Kernel-Using Apricot

Liaoning Institute of Pomology, Yingkou 115009, China
*
Author to whom correspondence should be addressed.
Horticulturae 2022, 8(10), 967; https://doi.org/10.3390/horticulturae8100967
Submission received: 3 October 2022 / Revised: 16 October 2022 / Accepted: 17 October 2022 / Published: 19 October 2022

Abstract

:
To understand the metabolite dynamics and genetic regulatory mechanism of apricot shell, a typical endocarp, before and after lignification are unknown, we investigated the metabolite differences of the endocarp of ‘Youyi,’ a popular kernel-using apricot cultivar, using ultra-performance liquid chromatography tandem mass spectrometry strategy. The endocarp thickness increased rapidly from 8 to 37 days after flowering (DAF) and lignin deposition began at 37 DAF. In total, 626 non-volatile metabolites were obtained from the endocarp tissues before (33 DAF) and after (41 and 45 DAF) lignification. The relative sugar and organic acid contents decreased continuously and those of L-phenylalanine and L-tyrosine increased after lignification. In the non-lignified endocarp, the phenylpropanoid metabolites were mainly in the form of p-coumaric acid, ferulic acid, neochlorogenic acid, dicumarol, coniferin, and some lignans. After lignification, the metabolites were mainly in the form of glycoside lignin or lactone coumarins, and the relative contents of L-asarinin and forsythin increased. The results of transcriptome confirmed the upregulation of genes related to lignin biosynthesis, including β-glucosidase and coniferyl-alcohol glucosyltransferase and laccases, accelerated lignification. This study provides insights into the formation of lignified endocarp in a kernel-using apricot and clarifies the role of monolignin transport and oxidative polymerization.

1. Introduction

Apricots in China can be classified into three types according to the utilization method: flesh-using, kernel-using, and ornamental. The kernel-using apricot (Prunus armeniaca L.) is native to northern China; it is thin, with little juice, and astringent flesh but a large sweet kernel within the stone [1]. It is an economically important fruit tree species in arid areas of ‘three North’ (the vast desertification marginal areas in Northeast China, North China, and Northwest China) because of its hardiness and cold and drought tolerance. In China, the area and annual output of kernel-using apricots are approximately 957,000 hm2 and 300,000 tons, respectively. The hardness of the stone of the kernel-using apricot increases the cost of opening the shell and using the kernel. Therefore, it is particularly important to study the formation and regulation mechanism of shell hardness in apricot.
Apricot, peach, almond, and plum are typical drupe fruits and the formation of rigid and strong stone shells is closely related to changes in the secondary cell wall. This specialized cellular metabolic process is known as endocarp lignification. Endocarp formation occurs relatively early during fruit development, and lignification occurs approximately 32–35 days after flowering (DAF) in apricots [2]. In peaches, the progressive event of endocarp lignification starts at 39 DAF and ends at 60 DAF [3]. The timing of this event is related to the ripening time and shows large differences among different ripening peach cultivars [4]. Studies of almond also showed that the timing of endocarp lignification differed by cultivar and the lignification sequence in most varieties proceeded from two sides to the middle [5]. ‘Lihe’ apricot has an incomplete development of the endocarp layer, and its insoluble lignin content is significantly lower than that of ‘Jinxihong’ apricot endocarp [6]. The hardness of mature kernels in apricots was determined to be positively correlated with the insoluble lignin content through the determination of physical and chemical characteristics [7]. Therefore, the polymerization and deposition of monolignols may determine the hardness of the endocarp or shell in the apricot.
Lignin is a complex compound typically composed of p-hydroxyphenyl (H), guaiacyl (G), and syringyl (S) units, which are derived from the polymerization of the monolignols p-coumaryl alcohol, coniferyl alcohol, and sinapyl alcohol, respectively [8]. Owing to their potential toxicity and low water solubility, monolignol glucosides are the dominant form of monolignols in the cytoplasm. Lignification shows extensive flexibility with other monomer units, such as conferyl esters, coumarates, flavone tricin, dilignols, and trilignols [9]. The lignin of xylem tissues belongs to the G and S units in dicotyledonous plants, with a few H types [10]. In pear stone cells, some compounds, such as p-coumaric acid, ferulic acid, sinapaldehyde, coniferyl alcohol, and sinapyl alcohol, were detected in the lignification process, suggesting regulation of the intermediate metabolite contents for improving the quality of the pears, especially p-coumaric acid [11]. However, the metabolites involved in endocarp lignification in apricots are still unknown.
Lignin biosynthesis pathways have been comprehensively studied and the enzymes involved have been described in detail [8,12]. Based on these studies, cinnamic acid 4-hydroxylase (C4H), p-coumarate 3-hydroxylase (C3H), and ferulate 5-hydroxylase (F5H), belonging to cytochrome P450 oxidoreductases, responsible for aromatic ring hydroxylation, are on the outer surface of the endoplasmic reticulum, while other monolignol biosynthetic enzymes are in the cytoplasm, including phenylalanine ammonialyase (PAL), 4-coumarate:CoA ligase (4CL), shikimate O-hydroxycinnamoyltransferase (HCT), caffeoyl shikimate esterase (CSE), caffeoyl-CoA O-methyltransferase (CcOAMT), cinnamoyl-CoA reductase (CCR), caffeic acid O-methyltransferase (COMT), and cinnamyl alcohol dehydrogenase (CAD). Monolignols must be transported to the secondary cell wall during glycoside formation through UDP-glucosyltransferase (UGT) and β-glucosidase (BGLU) and then oxidized and polymerized into lignin by peroxidase (POD) and laccases (LAC). C3H and HCT are key enzymes that control the contents of H-monolignol and G/S-monolignin [9]. The lignification processes of the endocarp in peach and Arabidopsis share common regulators [13]. Analysis of the transcriptome indicates that the regulation of lignification in apricot might involve structural genes such as CAD, POD, and LAC [6]; the transcription factor NST1 is also involved in lignin biosynthesis by regulating CAD [14]. Although lignin biosynthesis involves changes in a large number of primary metabolites and phenylpropanoid compounds, there are few reports on the regulation of metabolites during endocarp lignification in apricots.
At present, the process of monolignols biosynthesis and polymerization has been reported, but we are not aware of any published study on the metabolite dynamics before and after the endocarp lignification in apricot. Untargeted metabolome technology has been widely used to determine differences in the composition and quantity of metabolites during the fruit development process because of its characteristics of high sensitivity and large amount of detection [11,15]. Herein, ‘Youyi’ kernel-using apricot, one of the most widely grown cultivars, was used as the study material. In this study, therefore, ultra-performance liquid chromatography-tandem mass spectrometry (UPLC-MS/MS) and transcriptome technology was used to assess the metabolic changes and relevant regulatory pathways in lignification process. The aims of our study were to clarify the spatial and temporal pattern of lignin deposition and to identify the differential metabolites before and after the endocarp lignification. The results provide the basis for stone hardness formation and endocarp lignification regulation in apricots.

2. Materials and Methods

2.1. Plant Materials and Sampling

Three apricot trees aged 20 years and of ‘Youyi’ cultivar, planted from the National Germplasm Repository for Plums and Apricot (Xiongyue, Liaoning, China), was used as the test material. Representative flowers or fruits were selected for the 2021 season. Bloom occurred on 7 April, when 50% of the flowers had opened. Ovary or fruits were collected 3 days before flowering (4 April) and 1 (8 April), 8, 15, 22, 29, 33, 37, 41, and 45 days after flowering (DAF).
At each time, 15–50 fruits per biological replicate were randomly collected around the canopy from the same tree at a height of 1.5 m. After sampling in the first three periods (3 days before flowering and 1 and 8 DAF), 15 fruits were fixed in FAA fixative [5% formaldehyde, 5% acetic acid, and 90% alcohol (v/v)] and used for paraffin section observation. Ten fruits were directly dissected to observe the lignin deposition of the endocarp from 15 to 37 DAF using freehand sections, and the endocarp of the remaining samples was rapidly isolated, frozen in liquid N2, and stored at −80 °C for future UPLC-MS/MS analysis and RNA extraction.

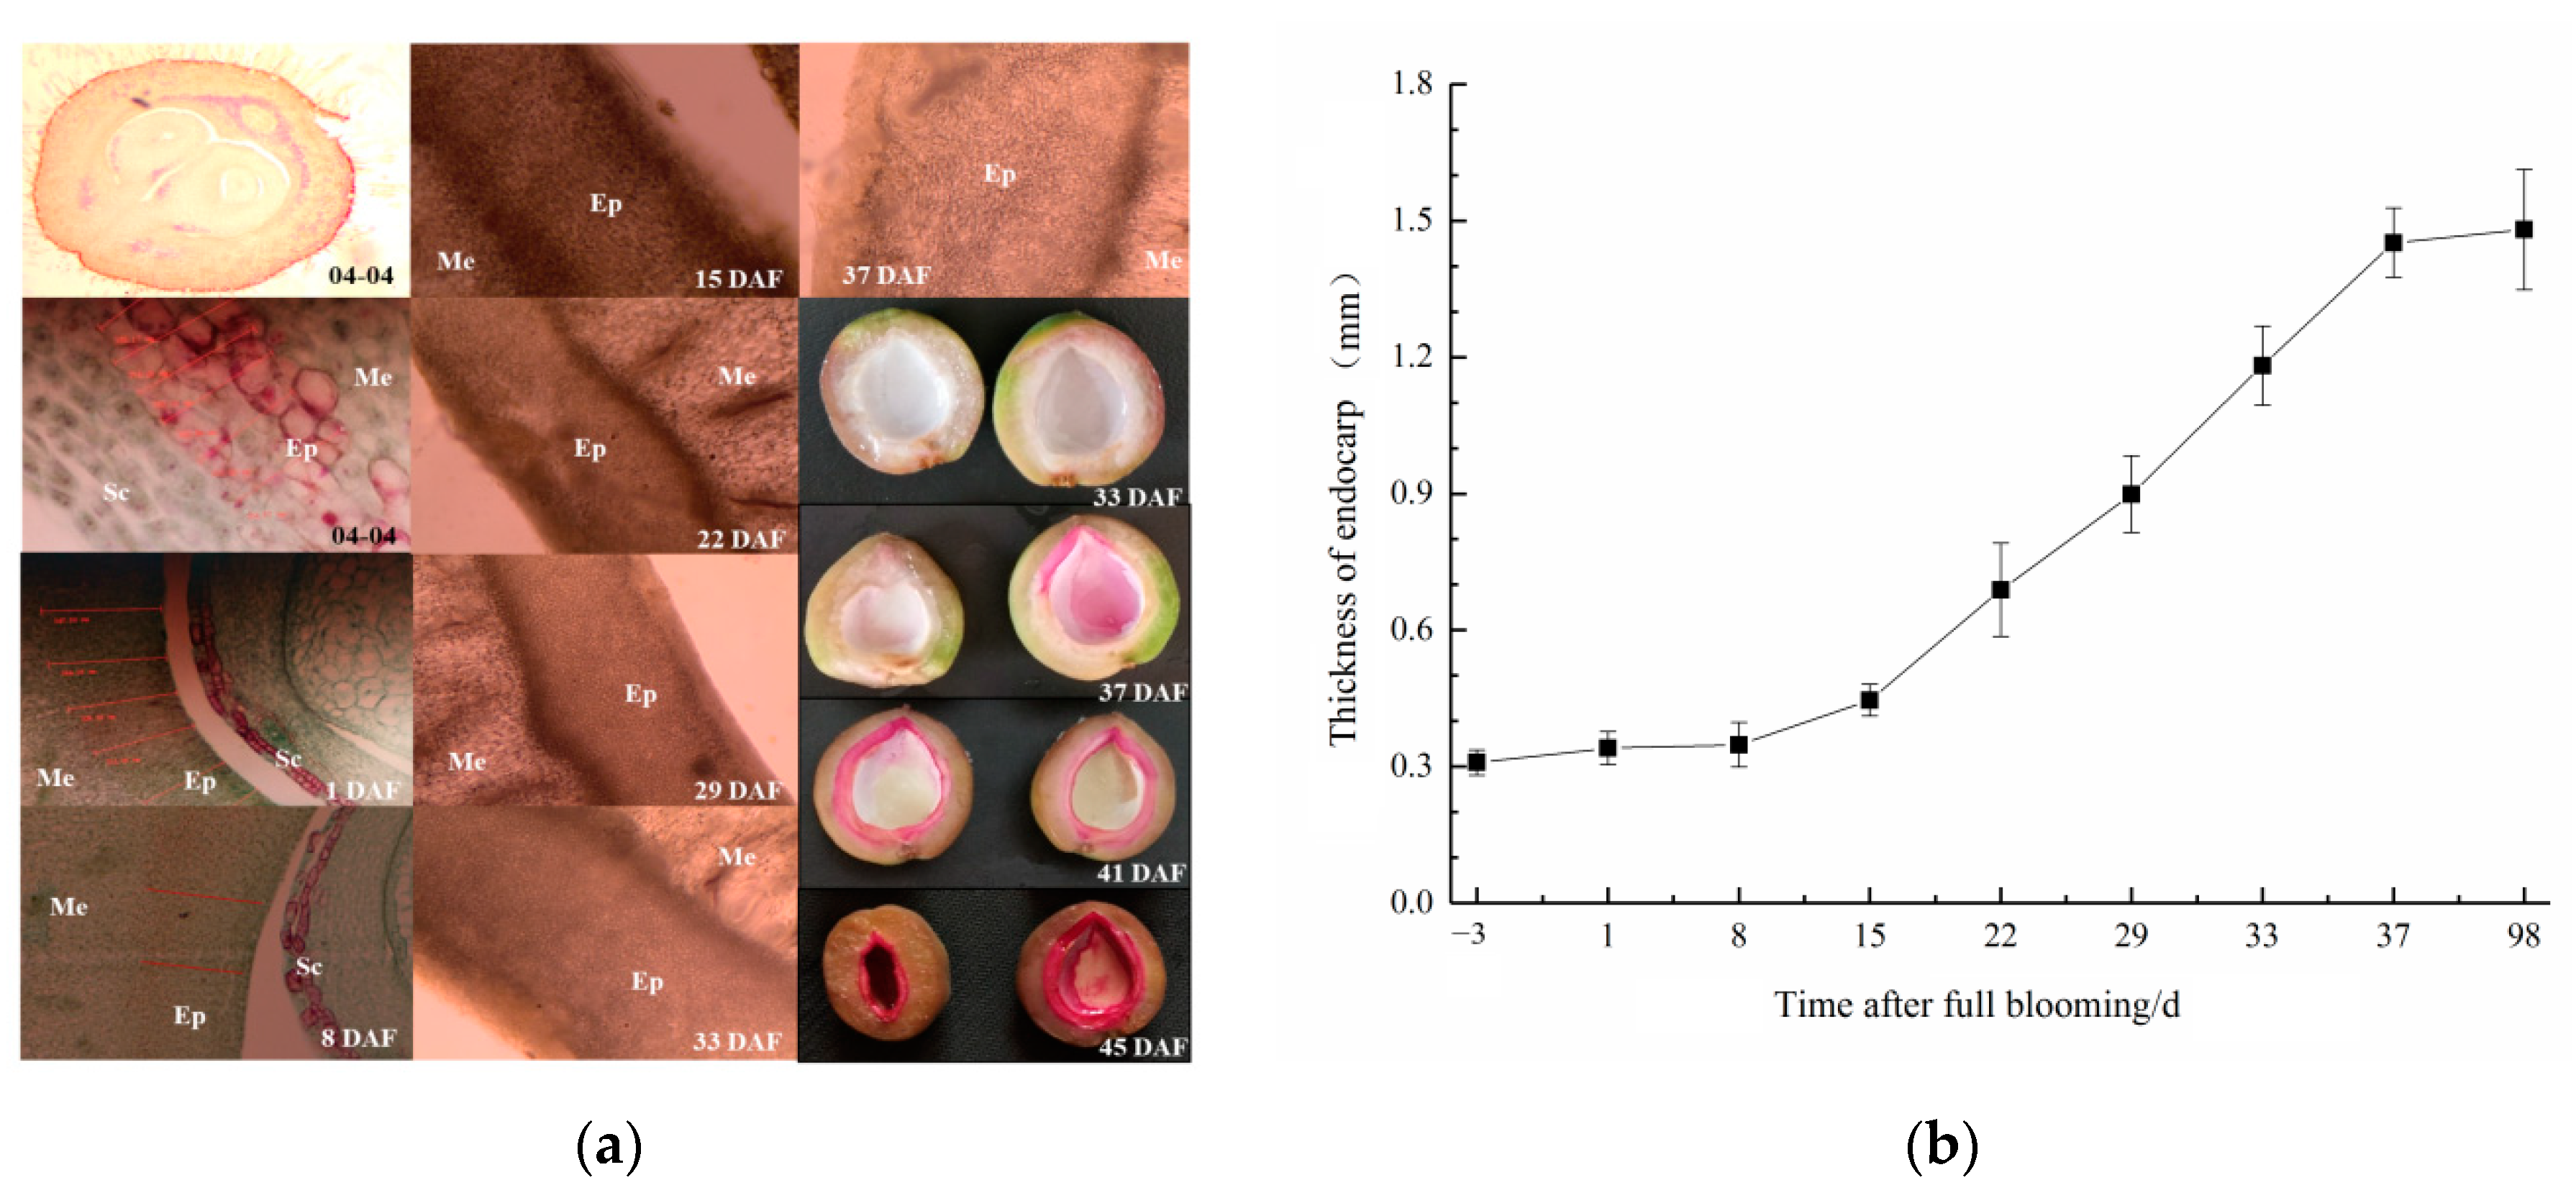
2.2. Observation of Endocarp Development and Lignin Staining

Paraffin sections were prepared according to the method described by Li [16]. The middle part of the fruit was taken for embedding, and the thickness of the sections was 10 µm. The slices were stained with saffron and solid green and sealed with neutral gum. These paraffin section were stored in herbarium at Liaoning Institute of Pomology. For freehand sectioning (1) the fruit was cut into 1 mm thin sections from the middle of the fruit transverse with a surgical blade, (2) the thin sections were placed on the slide and soaked with 2 drops each of 1% phloroglucinol solution and 50% concentrated hydrochloric acid for 5 min, and (3) the sections were photographed under a microscope. Simultaneously, 10 fruits were cut along the suture line and soaked in a mixture of phloroglucinol and concentrated hydrochloric acid for 10 min. Staining status of the endocarp was observed. The pink color indicates that lignin deposition and lignification began in the tissues. The darker the stain, the more lignified the tissue.
The cell layers of the endocarp were observed and measured using a NiKon Y-FL Optical microscope (NiKon, Tokyo, Japan). Five sections were cut from each sample and five samples were collected for each period. Five fields of view were observed for each section and five measurements were randomly taken in each field.

2.3. Sample Preparation and UPLC-MS/MS Analysis

Combined with the observation results of the sections, 33 DAF (no lignification stage), 41 DAF (early lignification stage), and 45 DAF (middle lignification stage) after flowering were selected for metabolomic analysis. Fruit samples were collected from the field and quickly returned to the laboratory for processing. The fruits were cut with a razor blade to remove the kernel, and the flesh was removed as much as possible, leaving only the white endocarp. Quantitative and qualitative determination of endocarp metabolites was conducted in the Beijing Genomics Institute (BGI) (Shenzhen, China). Thirty fruits were randomly selected from each sample and the assay was repeated six times for each period.
In total, 50 mg of tissue was weighed and extracted by directly adding 800 μL of precooled extraction reagent [MeOH: H2O (70:30, v/v, precooled at −20 °C)]. In addition, 20 μL of internal standards (d3-leucine, 13C9-phenylalanine, d5-tryptophan, and 13C3-progesterone) mix was added for quality control of sample preparation. Two small steel balls were added to the Eppendorf tubes. After homogenization at 50 Hz for 5 min using a TissueLyser (JXFSTPRP, Shanghai, China), the samples were sonicated for 30 min at 4 °C and incubated at −20 °C for 1 h. The samples were further centrifuged for 15 min at 14,000 rpm at 4 °C. The supernatant (600 μL) was filtered through 0.22 μm microfilters and transferred to autosampler vials for LC-MS analysis.
UPLC-MS/MS analysis was performed using a Waters ACQUITY UPLC 2D (Waters, Milford MA, USA) coupled to a Q-Exactive mass spectrometer (Thermo Fisher Scientific, Waltham MA, USA) with a heated electrospray ionization source [17], and the detailed steps were carried out according to Dunn et al. [18]. Sample analysis was performed. A quality control (QC) sample was prepared by pooling 20 μL of supernatant from each sample to evaluate the reproducibility and stability of the whole LC-MS analysis. To provide more reliable experimental results, the samples were randomly sorted to reduce the system error. The QCs samples were injected at regular intervals (every 10 samples) throughout the analytical run to provide a set of data from which repeatability could be assessed.
Chromatographic separation was performed on a Hypersil GOLD aQ column (2.1 × 100 mm, 1.9 μm, Thermo Fisher Scientific), with mobile phase A consisting of 0.1% formic acid in water and mobile phase B consisting of 0.1 formic acid in acetonitrile. The column temperature was maintained at 40 °C. The gradient conditions were as follows: 5% B over 0.0–2.0 min, 5–95% B over 2.0–22.0 min, held constant at 95% B over 22.0–27.0 min, and washed with 95% B over 27.1–30 min. The flow rate was 0.3 mL/min and the injection volume was 5 μL.
The mass spectrometric settings for electrospray ionization positive ion mode (ESI+) and negative ion modes (ESI−) were as follows: spray voltage, 3.8/−3.2 kV; sheath gas flow rate, 40 arbitrary units (arb); aux gas flow rate, 10 arb; aux gas heater temperature, 350 °C; capillary temperature, 320 °C. The full scan range was 100–1500 m/z with a resolution of 70,000, and the automatic gain control (AGC) target for MS acquisitions was set to 1e6 with a maximum ion injection time of 100 ms. Top 3 precursors were selected for subsequent MSMS fragmentation with a maximum ion injection time of 50 ms and resolution of 30,000, the AGC was 2e5. The stepped normalized collision energies were set to 20 eV, 40 eV, and 60 eV.

2.4. Metabolomics Data Processing and Statistical Analysis

Raw data collected by LC-MS/MS were imported into Compound Discoverer 3.1 (Thermo Fisher Scientific) for data processing, which included peak extraction, retention time correction within and between groups, adduct ion combination, missing value filling, background peak labeling, and metabolite identification.
Finally, molecular weight, retention time, peak area, and identification results were determined. Metabolites were identified using the BGI High-Resolution Plant Metabolome Database (BGI HR-PMDB) and mzCloud database. The main parameters for metabolite identification were precursor mass tolerance < 5 ppm, fragment mass tolerance < 10 ppm, and RT tolerance < 0.2 min. Data preprocessing was performed using MetaX [19] according to the following steps: (1) the normalization of probabilistic quotient was used to normalize the data and obtain the relative peak area; (2) the batch effect was corrected through quality control-based sequence of signals (QC-RLSC); (3) compounds with a coefficient of variation of the relative peak area greater than 30% in all QC samples were deleted. The identified metabolites were classified and functionally annotated to understand the classification and functional characteristics of different metabolites using the Kyoto Encyclopedia of Genes and Genomes (KEGG) pathway and human metabolome databases.
Principal component analysis (PCA) and partial least squares method-discriminant analysis (PLS-DA) were used to assess the repeatability of metabolites in the same sample based on the peak area of metabolites using the COULD cloud platform (https://www.bioincloud.tech, accessed on 13 September 2022). PLS-DA is a supervised discriminant analysis statistical method that can best reflect the differences between groups. This method uses partial least squares regression to achieve modeling predictions for sample classes and to screening of difference metabolites by the variable importance for Projection (VIP) [20]. Seven fold cross validation was carried out when building a model, and 200 response permutation testing (RPTs) were performed to judge the quality of the model of PLS-DA. Standardized correction of data included: (1) abundance (peak area) matrix correction, that is, log10 conversion of all abundance values; (2) correction of feature, that is, subtract the mean value of the feature abundance from the abundance of all samples corresponding to the feature, and then divide it by the standard deviation of the feature abundance. A heatmap was drawn after Z-score standardization of the peak area values of the metabolites using the COULD cloud platform. For the differential metabolite analysis, the screening criteria of differential metabolites were as follows: (1) VIP values of the first two PCs of the PLS-DA model ≥ 1.20, and (2) p value < 0.001. Significantly changing metabolites between before and after lignification were identified using PLS-DA. Screening of different metabolites was performed using the COULD cloud platform. In addition, the fold changes (FC) and p values of the different metabolites were calculated using the t-test under 41 vs. 33 and 45 vs. 33 DAF.

2.5. RNA Extraction and Transcriptome Analysis

Total RNA was extracted from the endocarp tissue according to a previous study [6]. RNA concentration and integrity were assessed using an Agilent 2100 Bioanalyzer (Agilent Technologies, Santa Clara CA, USA). Pure mRNA was fragmented and reverse-transcribed for cDNA synthesis. The RNA-seq transcriptome library preparation and sequencing of the endocarp tissue were performed on a BGISEQ-500 platform (BGI, Shenzhen, China), and paired-end reads with fragments of approximately 240 bp in length were generated by the BGI. Each stage, with three biological replicates, was independently constructed.
Clean reads were obtained by removing low-quality reads from the raw data using the SOAPnuke software [21]. These clean reads were separately mapped to the reference genome sequence [22]) using Bowtie2 v2.2.5 software [23]. Gene expression levels were quantified using RSEM v1.2.12 ([24] to calculate fragments per kilobase of exon per million fragments mapped (FPKMs). Transcripts with a p-adjusted value < 0.001 and FC > 2 were identified as differentially expressed genes (DEG) [25]. The DEGs were further investigated for their involvement in biological pathways based on the GO and KEGG databases.

3. Results

3.1. Spatial/Temporal Pattern of Lignin Deposition in the Apricot Endocarp

To identify the critical times of stone development of ‘Youyi’ apricot, the morphological changes of endocarp and pattern of lignin deposition were observed from the pre-anthesis ovary stage to the hard shell formation stage by paraffin or freehand sections. The results in Figure 1 show that endocarp tissue was formed and the cells were arranged neatly and tightly (red after saffron staining) in the ovarian stage before pollination (4 April). By 15 April (8 DAF), the thickness of the endocarp had not increased but the number of cell layers had increased. The endocarp cells were clearly different from the mesocarp cells (Figure 1a). At 37 DAF, the tip of the endocarp suture was dyed pink with phloroglucinol mixed solution, which marked the beginning of endocarp lignin deposition and the start of the lignification process. Subsequently, lignification rapidly spread to the entire endocarp layer. After only one week (45 DAF), the color of the endocarp deepened, the tissue hardened, and it was difficult to cut. At 52 DAF, the lignified endocarp hardened completely and could not be cut using a blade. From the endocarp (or shell) thickness, endocarp expansion was slow before 8 DAF, but subsequently, the thickness of the endocarp continuously increased. At 37 DAF, the thickness of the endocarp was close to that of the shell of the matured fruit (Figure 1b).

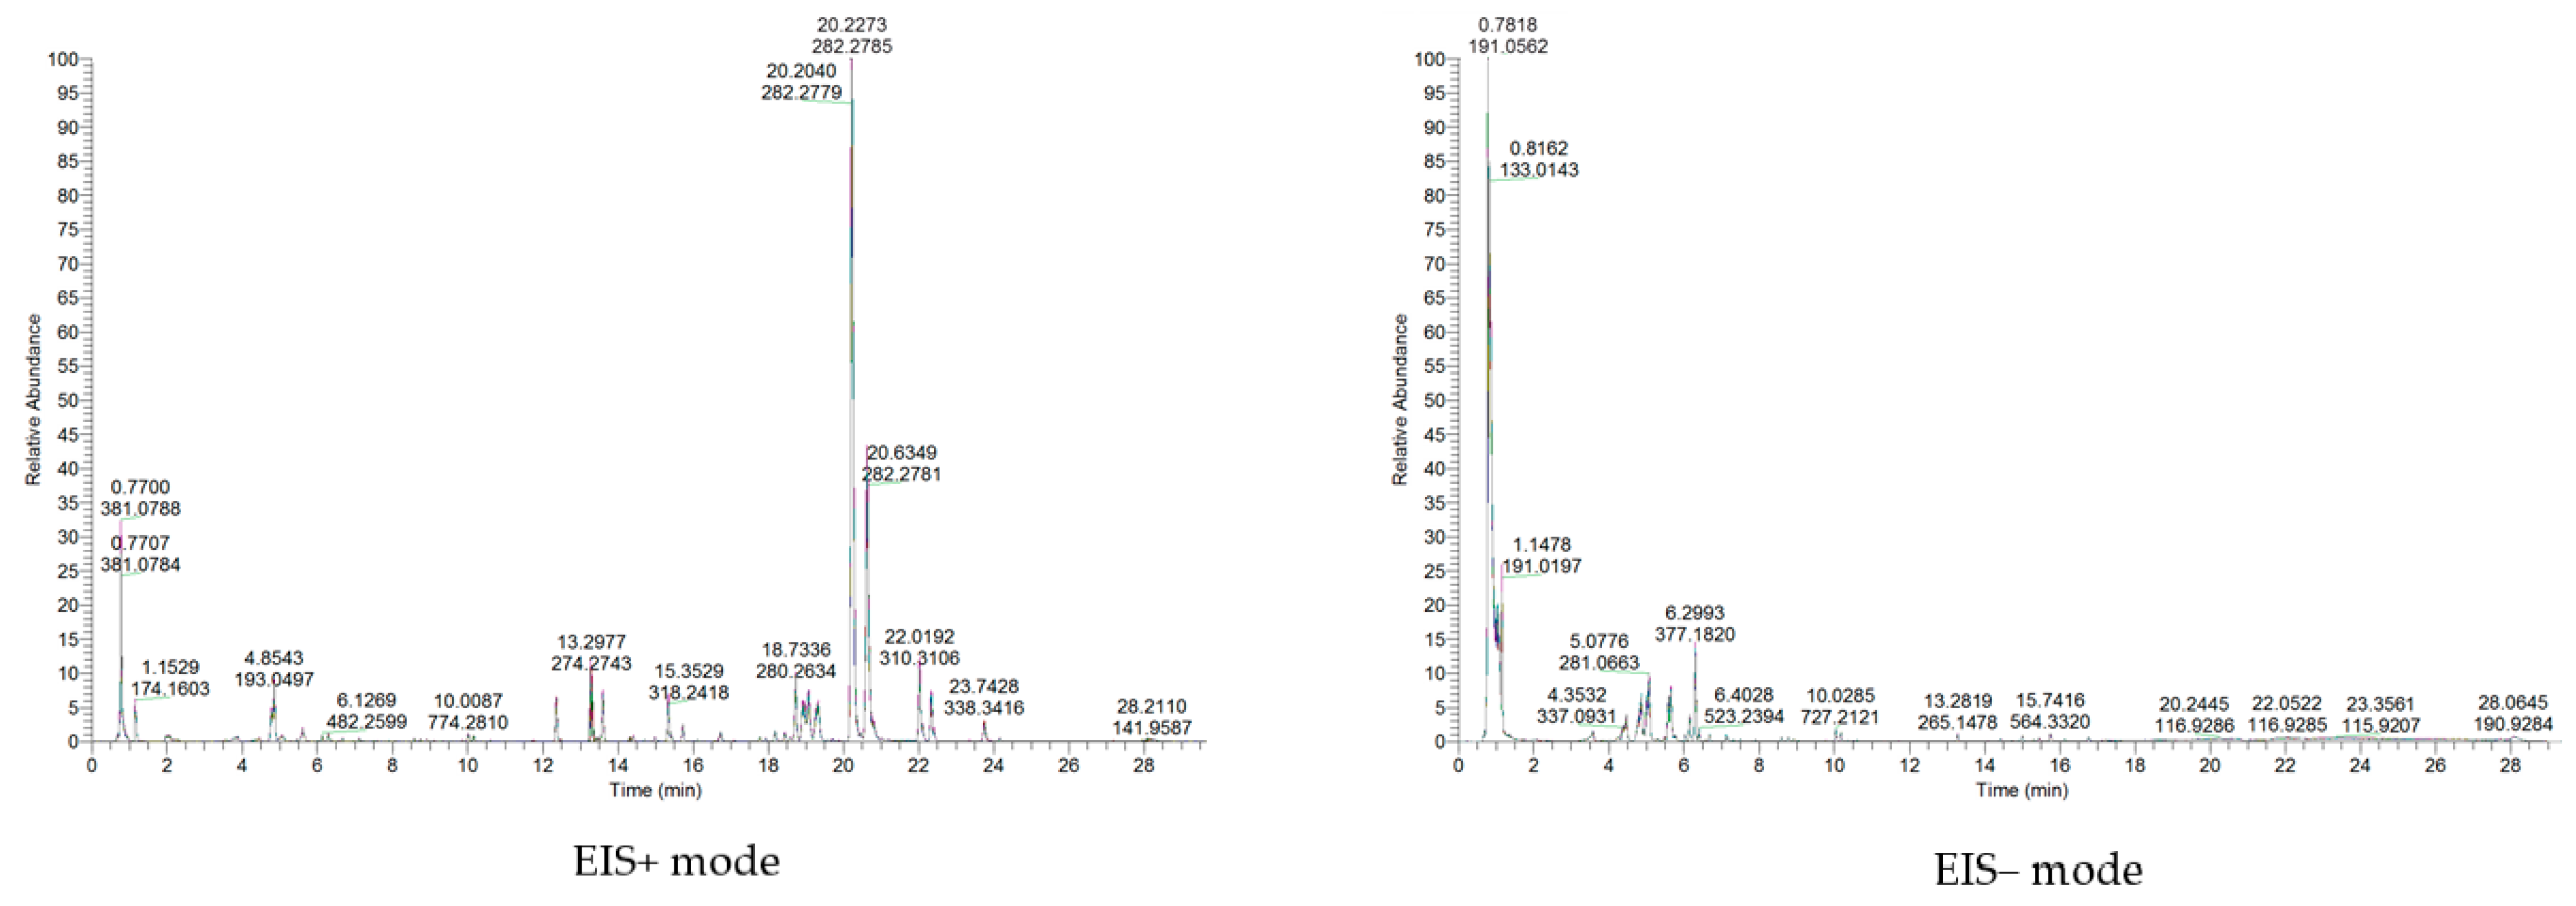
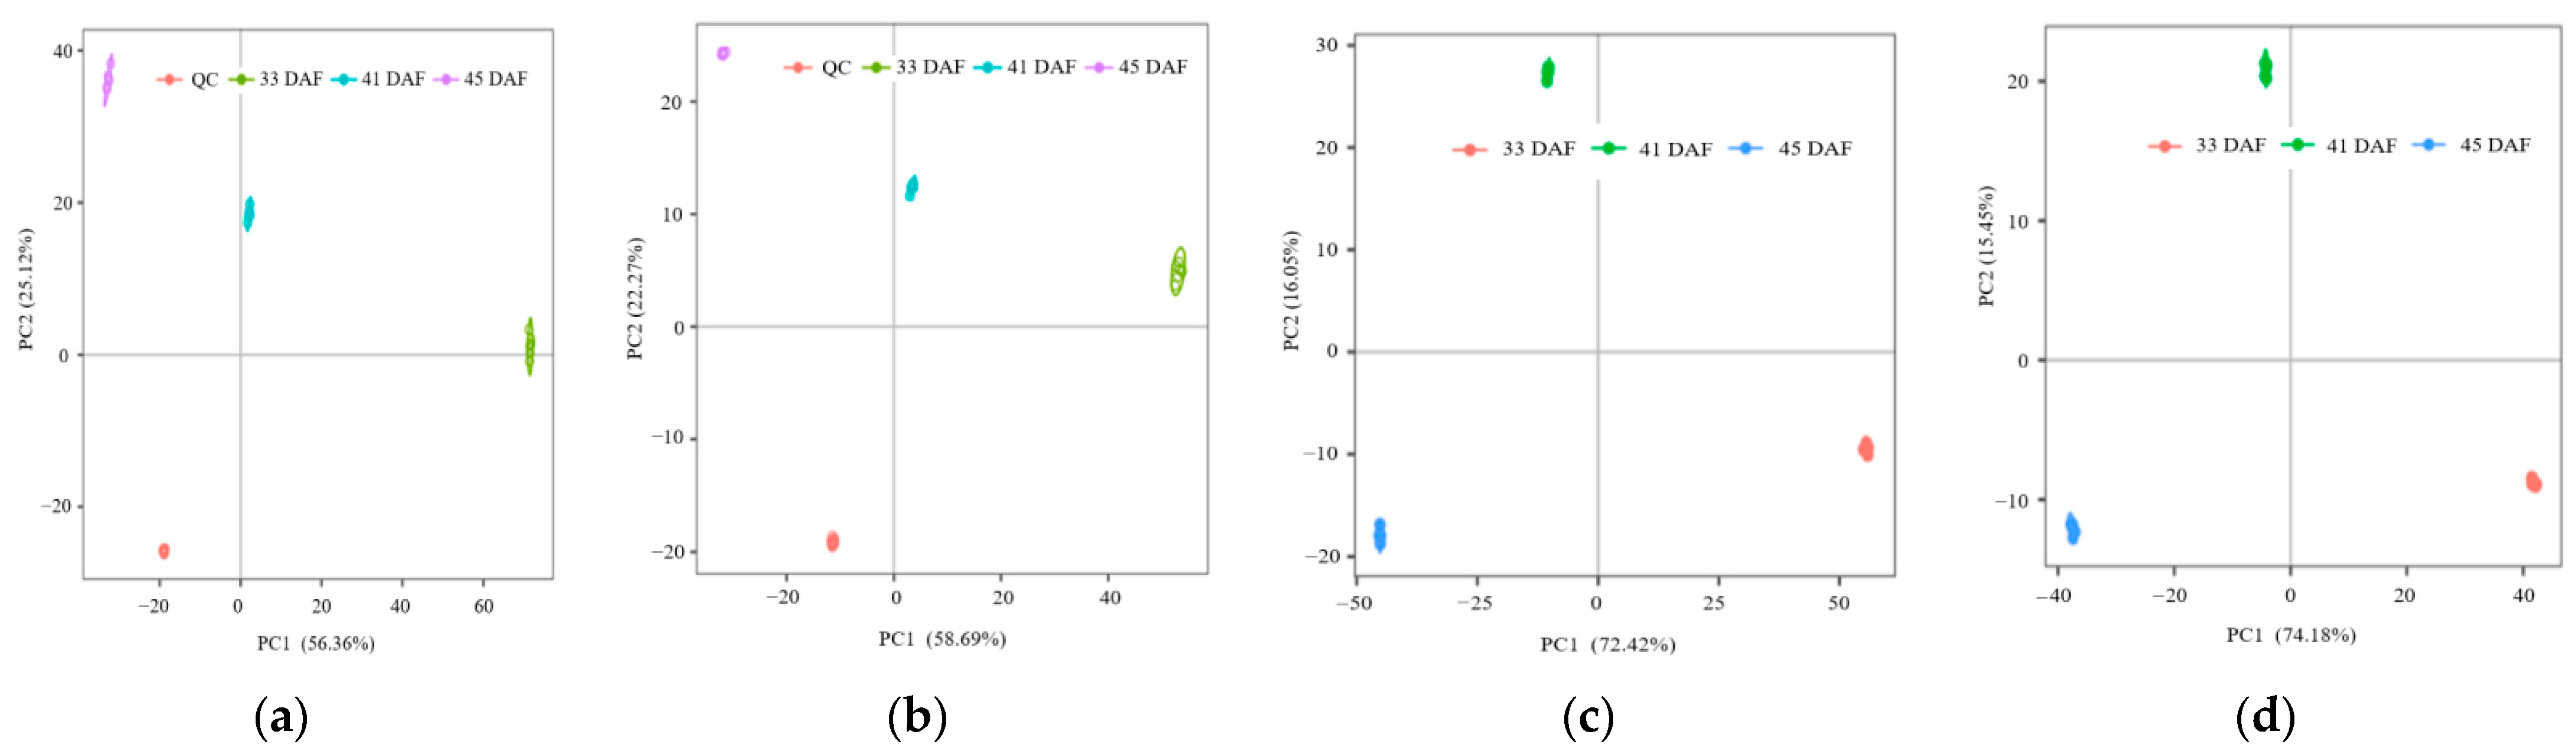
3.2. Metabolic Profiles and Metabolite Identification during Endocarp Lignification

UPLC-MS/MS technology was used to detect the metabolites of endocarp tissues at the non-lignification (33 DAF), initial lignification (41 DAF), and rapid lignification (45 DAF) stages and to analyze the changes in metabolites during the lignification of the endocarp of kernel-using apricot. From Figure 2, it can be seen that the instrument was in good condition and the signal was stable during the whole process of sample detection and analysis in EIS+ or EIS−. After peak information extraction and matching, 4756 compound characteristic ions were obtained, among which 4451 compounds had a coefficient of variation of relative peak area less than or equal to 30% in the quality control samples, which were used for further analysis.
In the PCA diagram (Figure 3a,b), PC1 and PC2 represent the rate of interpretation of the dataset by the first and second principal components, respectively. As shown in Figure 3, the sum of the contribution rates of the first two principal components in the EIS+ and EIS− modes obtained from the UPLC-MS/MS original data analysis were 80.82% and 83.82%, respectively. According to the distribution of endocarp samples from 33, 41, and 45 DAF in EIS+ and EIS− modes, the six repeated samples of each developmental stage were clustered together, which indicated that the metabolites in endocarp tissues changed significantly at different developmental stages, and they were stable among different repeated samples. Similar to the PCA result, the PLS-DA diagrams showed that all samples were always classified correctly (Figure 3c,d). In order to judge the qualities of the model, 200 RPTs were performed on the model of PLS-DA. The result of the validation test (Figure S1) indicated that the PLS-DA model was validity without overfitting based on cross model validation and permutation testing.
Endocarp lignification is a process in which primary metabolites flow into phenylpropanoid metabolism and monolignol deposition. The branches of phenylpropanoid metabolism produce end products, such as flavonoids, stilbenes, phenolic acids, precursors of lignin, lignans, and coumarins [26]. According to the mzCloud and BGI HR-PMDB standard database, 390 compounds in the endocarp of kernel-using apricot were identified in EIS+ mode, including coumarins (21), lignins (14), lignans (9), phenolic acids (7), flavonoids (24), and the classes of primary metabolites represented approximately 5.13% of the metabolite total number, such as sugars, organic acids, and amino acids (Table 1 and Table S1). A total of 236 metabolites were detected in EIS− modes, including coumarins (7), lignins (16), lignans (7), phenolic acids (6), flavonoids (13), and primary metabolites of sugar, amino acids, and organic acids were 6.36%, 3.39%, and 5.08%, respectively.

3.3. Expression Patterns of Primary Metabolites during Endocarp Lignification

Carbohydrate, the main source of lignin biosynthesis, produces phenylalanine and tyrosine precursors through the pentose phosphate and shikimic acid pathways and then enters phenylpropanoid metabolism. As shown in Table 2, the relative contents (peak area) of carbohydrates, such as galactol, D-glucose, L-trenonic acid, α-lactose, L-sorbose, and mannitol, gradually decreased during the lignification of the endocarp, while the relative contents of the intermediate metabolites 1,6-P-fructose, 1-P-mannose, succinic acid, shikimic acid, and D-quinic acid were slightly lower than those in the early stage, and then significantly decreased before lignification (45 DAF). However, the d-fructose, levulinic acid, and isopropylmalic acid contents increased. Except for a few amino acids, the contents of most amino acids were high during endocarp lignification. The contents of L-phenylalanine and L-tyrosine, which were the initial substances of phenylpropanoid synthesis, increased during the lignification process and were significantly higher at 45 DAF than at the previous two periods. This result indicated that phenylpropanoid metabolism or monolignin biosynthesis in endocarp tissue was still active at 45 DAF in kernel-using apricots.

3.4. Expression Patterns of Phenylpropanoids Metabolites during Endocarp Lignification

Phenylalanine is generated from the shikimate pathway and leads to the biosynthesis of phenylpropanoid metabolites. A total of 122 phenylpropanoid metabolites were detected in the endocarp tissue during lignin deposition (Table S2). As shown in Figure 4, a large number of compounds, such as flavonoids, stilbenes, and phenolic acids, accumulated in the non-lignified stage (33 DAF), including apigenin, naringenin, flavokawain B, taxifolin, robinin, isobutyl 4-hydroxybenzoate, 6-gingerol, and polydatin. The lignin precursors in the endocarp were cinnamic acid, p-coumaric acid, 2-hydroxycinnamic acid, caffeic acid, chlorogenic acid, ferulic acid, and ethyl 4-methoxycinnamate. Some coumarins and lignans, such as dicumarol, coumarin, lariciresinol, rosin, and cycloolivil, are produced before lignification. The relative content of these compounds showed a downward trend during lignification. However, glycosylation/deglycosylation of monolignols, such as p-coumaryl alcohol 4-glucoside, rosavin, syringin, coniferaldehyde, sibiricose A6, and tenuifoliside B, gradually increased. In addition, the changes in the relative contents of some lactone coumarins, such as dihydrocoumarin, 7-hydroxycoumarin, esculetin, esculin, scopoletin, scopolin, fraxetin, fraxin, fraxinol, and isofraxidin suggested that there may be differences in the expression of genes related to the phenylalanine metabolic pathway during endocarp lignification.

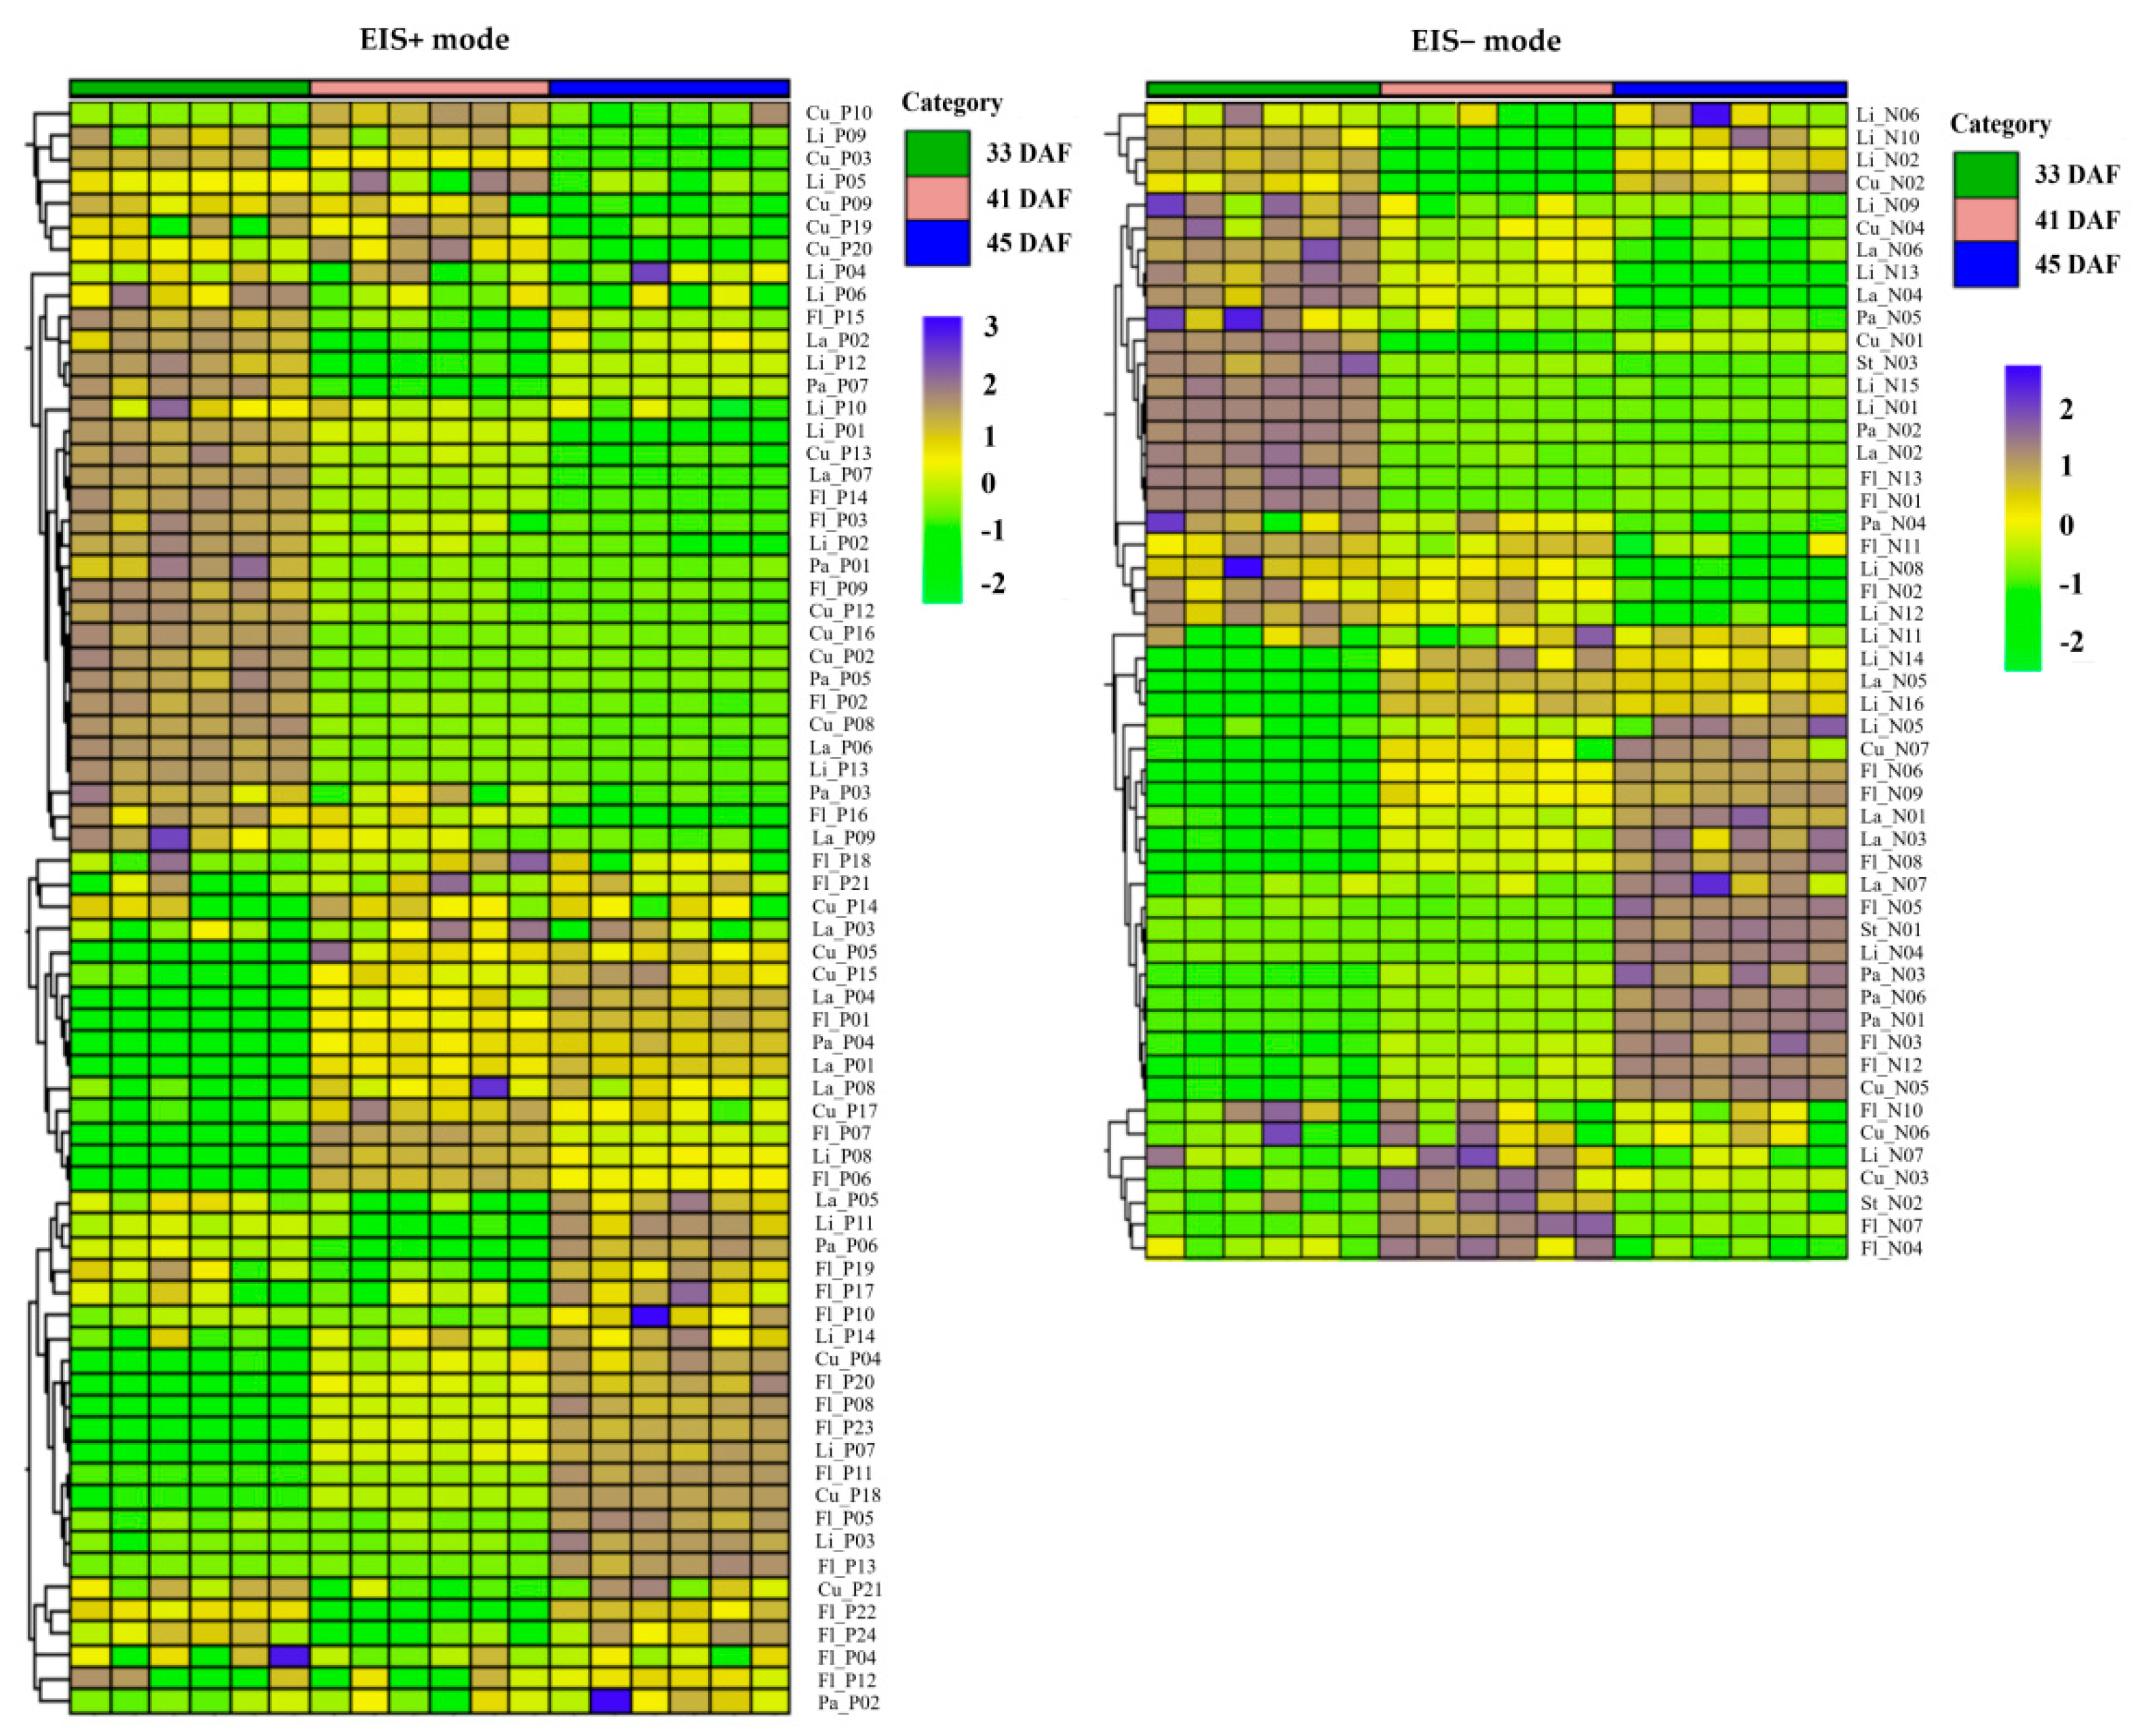
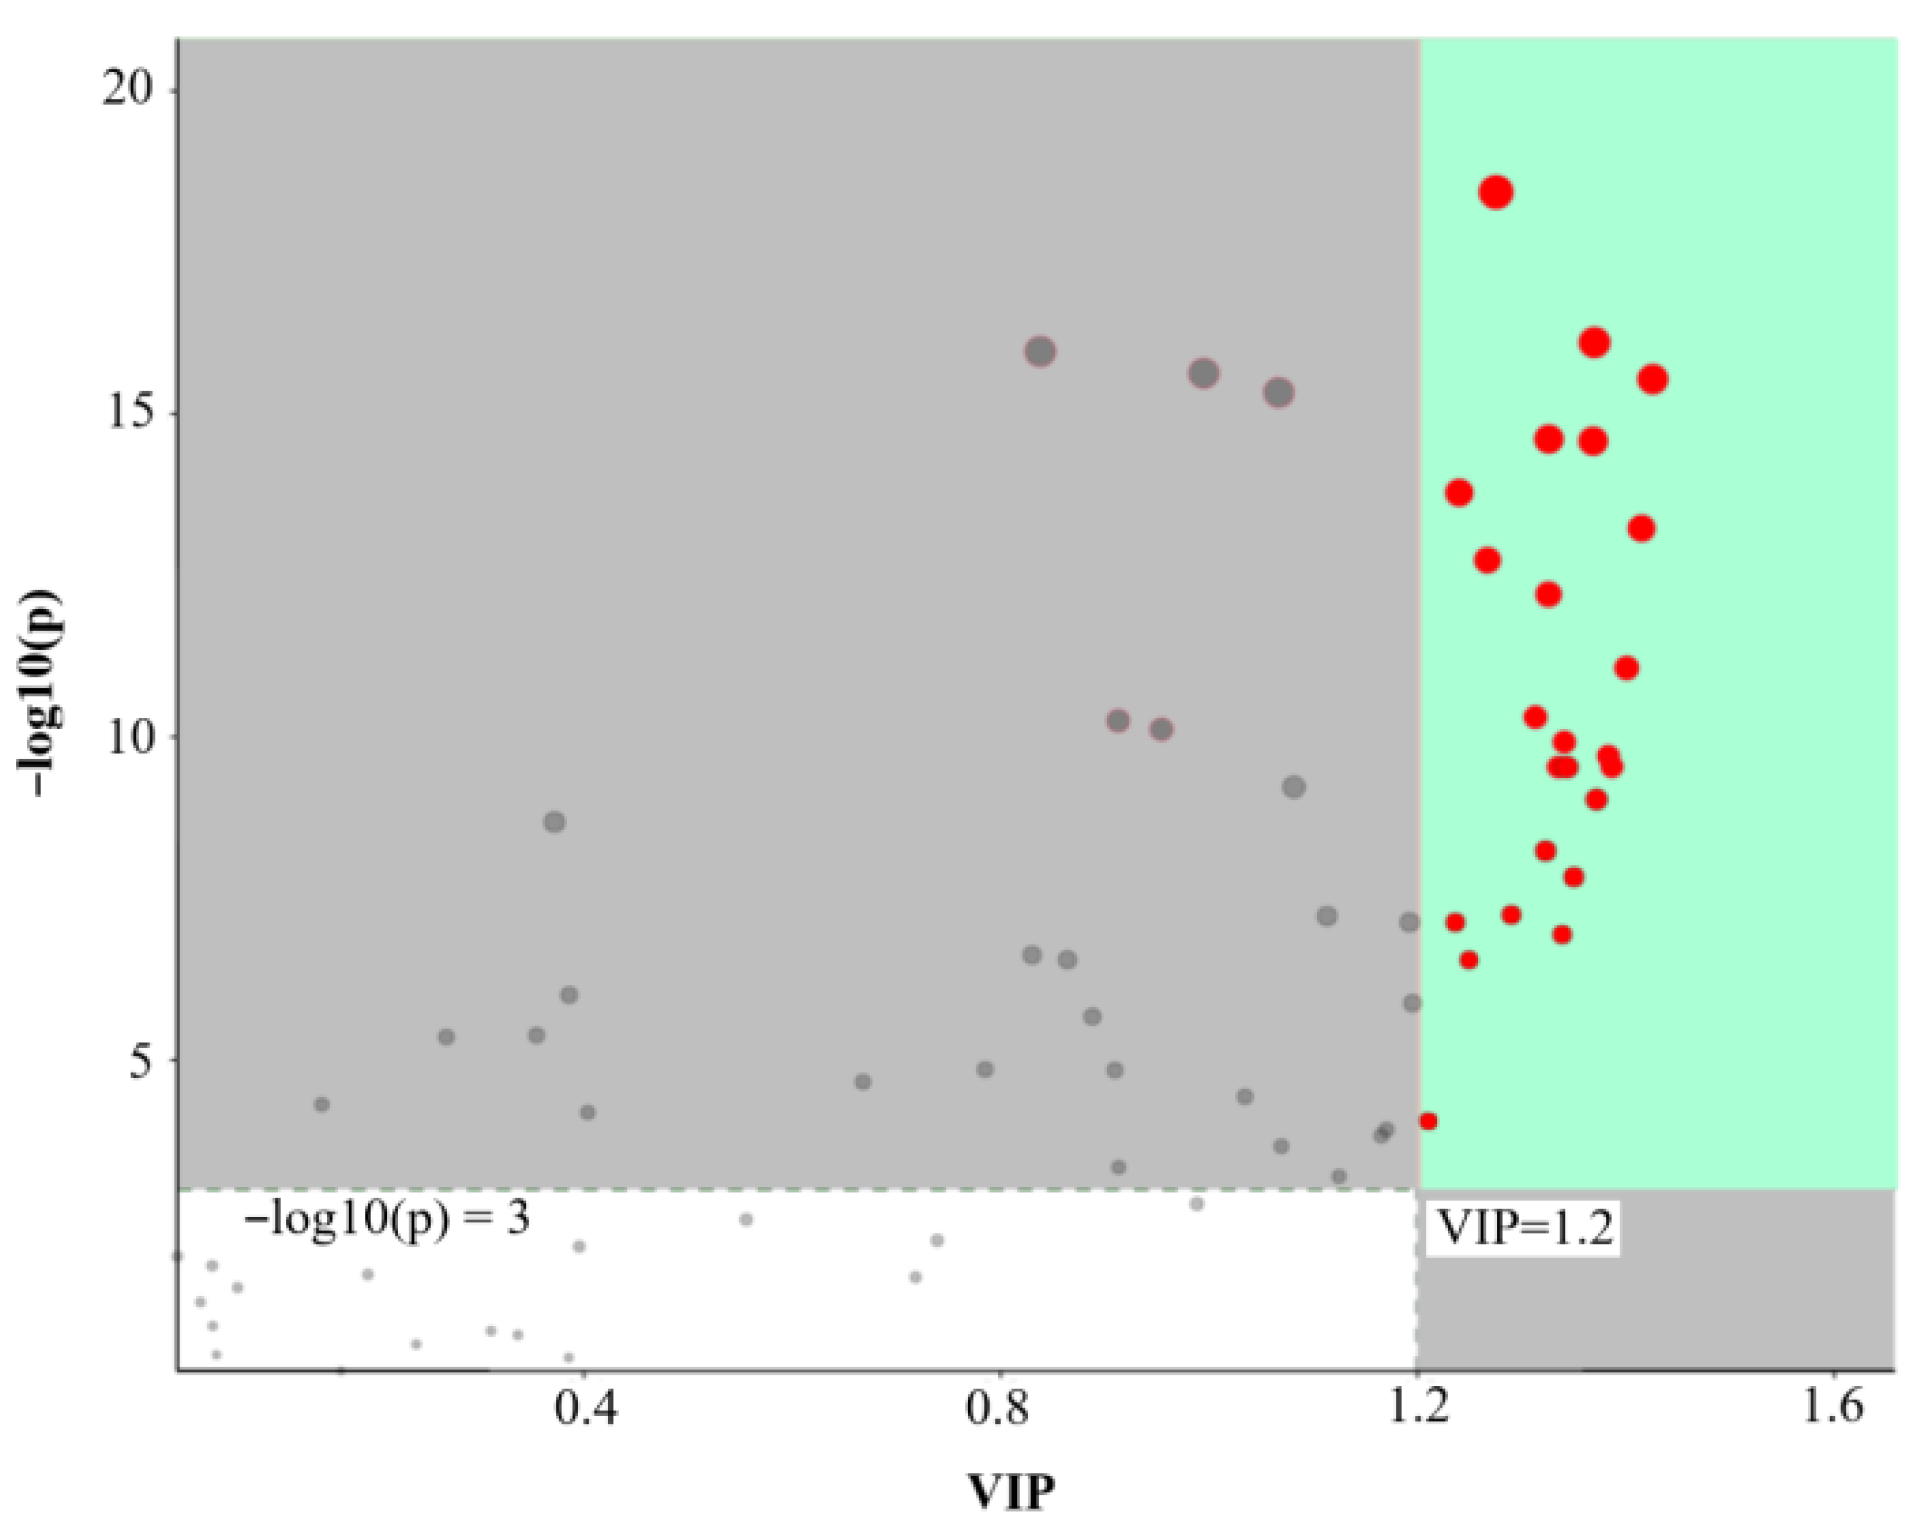
3.5. Analysis of Lignin Metabolites before and after Lignification

There are many branches in the lignin biosynthesis pathway that can produce a variety of metabolites, such as lignans (dimers or polymers) and coumarins (lactones), which are derived from the same precursors as lignin. Among the 69 representative metabolites, only 7 compounds showed insignificant changes in their relative contents through analysis of variance. A total of 24 differential metabolites were screened based on the VIP and p values using the PLS-DA model (Figure 5 and Table S3), 14 of which decreased and 10 significantly increased (Table 3). The metabolites with decreased relative contents were lignans (such as cycloolivil, (+)-pinoresinol, lariciresinol 4-o-glucoside, and dicumarol), while the metabolites with increased contents were mainly isochlorogenic acid C and alcohol glycosides of lignin (such as p-coumaryl alcohol 4-glucoside, rosavin, and sibiricose A6). However, the relative contents of some lignans or lactones, such as forsythin, l-asarinin, dihydrocoumarin, fraxinol, and fraxetin, increased. Interestingly, p-coumaric acid, ferulic acid, and neochlorogenic acid were significantly downregulated. This result might be related to lignin polymers, which must be transported from the cytoplasm to the secondary cell wall in the form of monolignin glycosides.

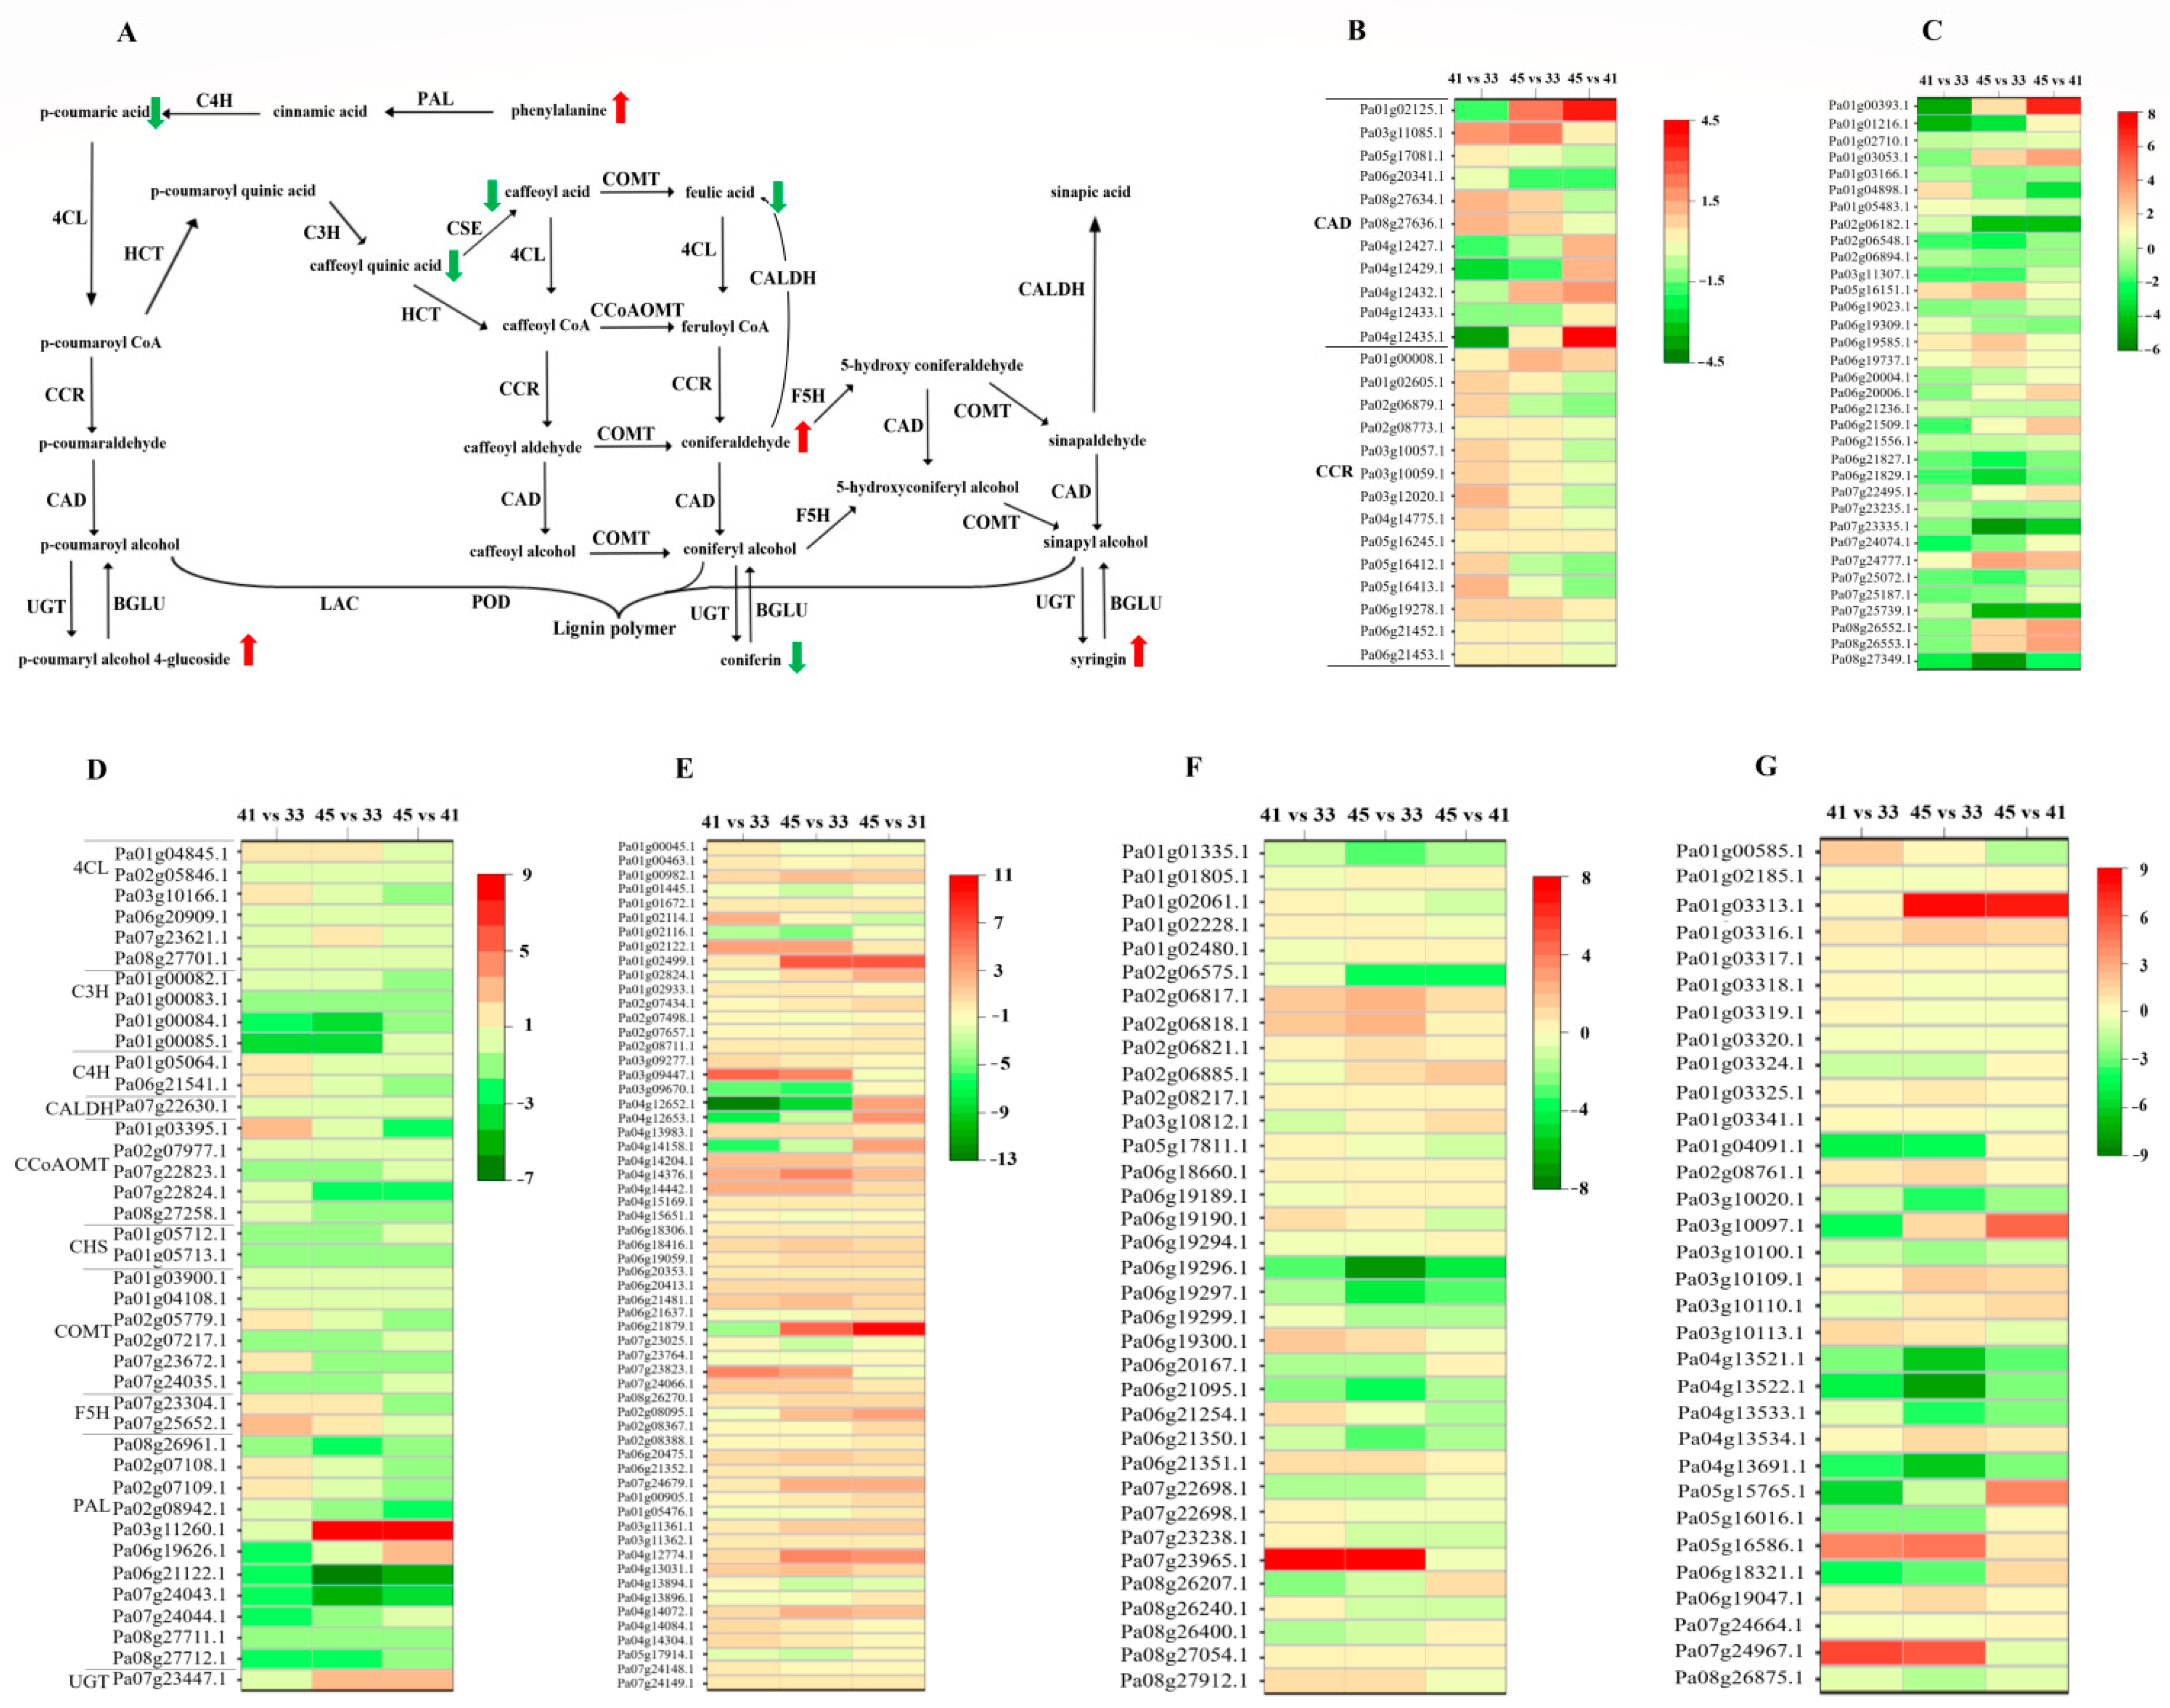
3.6. Expression Patterns of Genes Associated with Lignin Metabolic Pathway during Endocarp Lignification

To further understand metabolite regulation during endocarp lignification, transcriptome sequencing of nine cDNA libraries was performed on the same three-stage samples. The number of clean reads ranged from 40,355,220 to 47,112,930, and the Q30 percentage was >95% for each library. The DEGs at different developmental stages were investigated. Compared with 33 DAF, a total of 3050 (41 vs. 33) and 5337 (45 vs. 33) DEGs were identified, and the number of upregulated genes was basically equal to that of downregulated genes for 45 vs. 33 (Table S4). Through transcriptome sequencing of the endocarp tissue, we detected multiple copies of genes in the same enzyme, which are involved in lignin synthesis. The copy numbers of these genes ranged from one in UGT to 63 in BGLU (Table S5).
As shown in Figure 6, the expression patterns of genes involved in lignin biosynthesis were divided into four types before and after lignification. In the first type, the COMT, CCoAOMT, and CALDH genes were consistently expressed at high levels. In the second type, the gene expression levels of 4CL, C4H, F5H, CCR, UGT, and BGLU continued to increase during the lignification process. In the third type, the expression pattern of the majority of enzyme genes, including PAL and C3H, mainly were downregulated. Among the 10 genes in PAL, the expression of seven genes was downregulated, whereas that of the other three genes was upregulated. C3H is encoded by a gene cluster located in LG1, which consists of four genes (Pa01g00082.1, Pa01g00083.1, Pa01g00084.1, and Pa01g00085.1) repeated in tandem next to each other on the chromosome. The expression of Pa01g00082.1 and Pa01g00083.1 were consistently high and that of Pa01g00084.1 and Pa01g00085.1 were low. In the fourth type, the gene number of the enzyme is large, and the expression patterns of the different genes are different, such as CAD, HCT, POD, and LAC. Among the 11 genes in CAD, the expression of 5 genes was downregulated, that of 4 was upregulated, and that of the other 2 showed high expression levels. We detected a total of 34 HCT genes, of which 8 were upregulated, 13 were downregulated, and the levels of 7 genes were consistently high and those of the remaining 6 were consistently low. Among the 37 copy genes of POD, the expression of 19 genes showed a downward trend, 5 showed an upward trend, 9 were always at a high expression level, and the expression of the remaining genes was very low. Similar to those of POD, the levels of 11 LAC were downregulated, 7 were upregulated, 15 had high expression levels, and the others had lower expression levels. This result suggests that different gene members may have different specific activities or expression patterns.

4. Discussion

4.1. Timing of Endocarp Lignification in Kernel-Using Apricot

Drupe fruits, including peach, almond, apricot, and jujube, have typical lignified hard shells, which are beneficial to seed maturation and development and avoiding biological damage [27]. However, for dried fruit, the highly lignified shell (or endocarp) increases the labor cost during kernel harvesting.
Endocarp (or stone tissue) formation occurs in the early stages of fruit development, and its subsequent lignification occurs in the middle stage of fruit development. In peaches, it has been reported that the medial cells of the ovary wall are active for 1 week after anthesis of cell division and some cells are lignified when the medial cells are still in the meristem [28]. The lignification of the endocarp is a progressive event, which starts from the stylar end at 39 days after anthesis and then gradually extends throughout the endocarp tissue from inside to outside in peach, and the whole process lasted approximately 20 days [3]. In almonds, the lignification order of most cultivars occurs from both sides to the middle and the entire process lasts for one month [5]. The timing of occurrence of endocarp lignification takes approximately 32–35 days after anthesis in apricot [2]. Meng et al. [29] reported that the degree of hardness increased sharply approximately 35 days post-flowering in jujube; however, the length of time required to complete the lignification of the entire endocarp varies by cultivar. The timing of this event is related to the ripening and developmental period of the fruit [4]. Therefore, there were significant differences in the time and order of endocarp lignification among different varieties or species. In this study, the results of tissue section observations in ‘Youyi’ apricot showed that endocarp expansion ceased with lignin deposition in the secondary wall of endocarp cells at 37 DAF, the order of endocarp lignification was from the suture tip to the entire endocarp, and lignification lasted approximately two weeks (to 51 DAF).

4.2. Changes of Metabolites before and after Lignification of Endocarp in Kernel-Using Apricot

Lignin polymerization is an important process of secondary cell wall thickening and hardening in plants and the total lignin content determines the hardness of tissues [8]. In dicotyledonous plants, lignin polymers are composed of three basic monolignols: p-coumaryl, coniferyl, and sinapyl alcohol [12]. These monolignols are produced by deamination, acylation, methylation, and redox reactions of phenylalanine or tyrosine, while phenylalanine and tyrosine are synthesized through the pentose phosphate and shikimic acid pathways [26,30]. Therefore, a large number of primary metabolites, such as carbohydrates and amino acids, are important bases for lignin synthesis.
Owing to the limitations of detection technology, previous studies on endocarp lignification only focused on the changes in the total amount of lignin or a few compounds [6,29,31]. In this study, 626 metabolites in apricot were detected in the lignified tissues of the endocarp through UPLC-MS, including 34 amino acids and their derivatives, 21 sugars, 14 organic acids, and 23 nucleosides and endogenous metabolites. In peach, the peak of total sugar accumulation in endocarp tissue occurred at the beginning of lignification (40 DAF) and then the total carbohydrate content and the activity of sorbitol metabolism decreased rapidly [31]. As per the results, in ‘Youyi’ apricot, the relative content of sugars and organic acids decreased gradually in the lignification process of endocarp and the content of the precursors of lignin synthesis, such as L-phenylalanine and L-tyrosine, were significantly increasing, which was similar to previous reports in other species. This result shows that several primary metabolites might be converted to phenylpropanoid during endocarp hardening in kernel-using apricots.
Lignin biosynthesis is accomplished via phenylpropanoid metabolism, which is accompanied by the generation of flavonoids, phenylpropenes, stilbenes, coumarins, and lignans [26]. In pears, phenolic acids accumulate continuously during the peak period of lignification of stone cells and then the contents of these compounds decrease continuously. The level of p-coumaric acid is an important intermediate metabolite affecting the content of stone cells in pears, and there are also significant differences in ferulic acid, sinapaldehyde, and coniferyl alcohol contents during the lignification process of stone cells [11]. However, p-coumaric acid is a shared intermediate metabolite of the phenylpropanoid metabolism. In this study, the levels of p-coumaric acid, the main flavonoid, and stilbenes were significantly downregulated in the hardening of endocarp in apricot. This result may be caused by the flow of phenylpropanoid metabolism to monolignols during endocarp lignification.
The evaluation of the force required to crush the endocarp indicated that the degree of hardness in the stone shell of the mature fruit was positively correlated with its lignin content in apricot [7]. However, the changes in metabolites before and after lignification in apricots remain unclear. Although monolignols are synthesized within the cell protoplast, lignin deposition is restricted to secondary cell walls [12]. In this study, the main metabolites in the unlignified endocarp were p-coumaric, ferulic, and neochlorogenic acids, while the main metabolites involved in endocarp lignification in apricots were alcohol glycosides of monolignin, such as p-coumaryl alcohol 4-glucoside, rosavin, tenuifoliside B, syringin, and sibiricose A6. This result may be related to the transport and storage of monolignin. Because monolignol exhibits notable plasticity [26], in this study, some lactone forms of monolignin (coumarins) were identified in endocarp lignification, such as dihydrocoumarin, fraxinol, and fraxetin. Additionally, some metabolites of lignans, p-hydroxybenzoates, phenylpropenes, and benzoic acids were identified during endocarp lignification. Interestingly, experimental evidence showed that coniferin was mainly present in the monlignin glycosides before lignin deposition, while the relative contents of p-coumaryl alcohol 4-glucoside and syringing increased after the lignification of the endocarp. In brief, screening these specific metabolites is helpful for understanding the hardening mechanism of the endocarp in kernel-using apricots.

4.3. Regulation of a Lignified Endocarp in Kernel-Using Apricot

Vanholme et al. [8] divided lignin biosynthesis into three steps: (i) phenylacetone pathway from phenylalanine to p-hydroxycinnamate coA, (ii) the specific pathway from p-hydroxycinnamate CoA to monolignin biosynthesis, and (iii) glycosylation transportation and oxidation polymerization. These reactions occur mainly in the cytoplasm, whereas lignin polymers form directly in the secondary cell wall. The activities of lignin-related enzymes are very high during endocarp lignification in almonds and the activities of enzymes differ depending on the lignification process [32]. In peaches, lignin biosynthesis results from the sequential involvement of phenoloxidase, POD, and LAC. The activity of phenoloxidase can increase the content of lignin precursors in the early stage of lignification, whereas POD and LAC enzymes can aid the cross coupling between the growing polymers during endocarp lignification [30]. In this study, multiple copies of the genes encoding these enzymes were identified and the expression patterns of these genes differed before and after lignification.
p-Coumarate-CoA is an important component of the phenylpropanoid pathway. Chalcone synthase (CHS) acts on p-coumarate-CoA as a substrate to generate chalcone, leading to flavonoid metabolism and stilbene synthases (STS) synthesis of simple monomeric stilbenes using cinnamoly-CoA and p-coumarate-CoA as substrates [9]. Similarly, experimental evidence showed that the relative content of stilbenes (polydatin and 6-gingerol) and the majority of flavonoids (taxifolin, rutin, hyperoside, phloridzin, and apigenin) were downregulated, which was confirmed by the downregulation of CHS (Pa01g05713.1 and Pa01g05712.1) and STS (Pa03g10400.1, Pa03g10397.1, and Pa03g11454.1) genes (Table S5) during endocarp hardening. C3H and HCT determine the metabolic flux from the general phenylpropanoid pathway to monolignol biosynthesis [26]. The data showed that the expression of two C3H genes remained high and decreased, respectively. Among the 34 HCT genes, only eight were upregulated and seven were consistently at high levels of expression. Isochlorogenic acid C, methyl 4-hydroxy-3-methoxycinnamate, scopoletin, fraxetin, and forsythin contents continually increased, indicating that there may be differences in the expression of related genes involved in monolignol biosynthesis during endocarp lignification in kernel-using apricots. Overexpression of F5H can lead to nearly exclusively coniferaldehyde shifting to S-lignin in poplar [33]. The experimental results showed that the levels of F5H genes and syringyl monomer content (syringing and sibiricose A6) were higher, suggesting that F5H might play a critical role in the structural properties of endocarp lignin in apricots. The expression of the UGT and BGLU genes, responsible for the transport and storage of monolignin, was significantly upregulated, which was consistent with the high contents of p-coumaryl alcohol 4-glucoside and syringing during endocarp lignification.
LAC is highly structurally conserved and its number has slightly increased, ranging from 17 to 39 in angiosperms during plant evolution [12]. In this study, a total of 36 LAC genes were identified, of which 11 were downregulated, 7 were upregulated, and 15 had high expression levels, whereas the other genes had lower expression levels. Different peroxidases and laccases may have different effects on lignin polymer composition. The At-LAC15 mutant has a significantly reduced capacity to oxidize coniferyl alcohol and an increased presence of β-β/β-5 and β-o-4 linkages in seed cells compared to wild-type seeds [34]. The enzymatic activity of POD to produce dehydrogenation polymers appears to be more specific to coniferyl alcohol than to other monolignins, and POD appears to be unable to use sinapyl alcohol as a substrate [12]; therefore, in this study, the majority of POD genes were downregulated and the relative content of coniferin decreased, whereas the relative content of syringing increased during endocarp lignification. CAD is the final step in the biosynthesis of monolignol; Zhang et al. [14] believed that the low expression of CAD gene leads to less lignin deposition in endocarp of ‘Lihe’ apricot and transcription factor NST1 could regulate the expression of CAD gene. In this study, a total of 11 CAD encoding genes were identified of which four genes were upregulated and five were downregulated. In Arabidopsis, most insertion lines of the 17 CAD genes had only a marginal effect on the overall lignin composition and not all of these genes actually contributed to monolignol formation [26]. However, the different expression patterns of multiple genes encoding the same enzymes might also be associated with a complex grid of temporal and organ (or cell)-specific regulatory mechanisms and autonomous and co-operative lignification [12]. Lillo et al. [35] suggested that individual PAL genes might respond differentially to biotic and abiotic stressors and that their expression is developmentally and spatially controlled. Therefore, the differential expression pattern of this multigene during endocarp lignification requires further study.
In addition, the regulation of phenylpropanoid metabolism, especially the regulation of structural genes involved in lignin biosynthesis by hormones and transcription factors, has been extensively reviewed [9,10]. However, the regulatory network of these genes in endocarp lignification needs to be further studied in apricots.
In conclusion, we elucidated the changes and regulation of metabolites during endocarp lignification in ‘Youyi’ through metabonomics and transcriptome analyses. The results showed that endocarp expansion in the kernel-using apricot was rapid in the early stage of fruit development and stopped at the initial lignification (37 DAF). The endocarp lignification process lasted approximately two weeks. At the non-lignification stage (33 DAF), the levels of primary metabolites in the endocarp were relatively high and the majority monolignol precursors were low. During endocarp lignification, the expression of genes related to lignin biosynthesis was upregulated, the phenylpropanoid pathway gradually fluxed into lignin metabolism, and the relative contents of some lignin metabolites increased. These findings provide new insights into the formation of stone shells and help to understand the molecular regulation of endocarp lignification in kernel-using apricots.

Supplementary Materials

The following supporting information can be downloaded at: https://www.mdpi.com/article/10.3390/horticulturae8100967/s1, Figure S1: Response sequencing verification diagram of the PLS-DA analysis model. Table S1: The information of total 626 metabolites in this study; Table S2: The relative contents of phenylpropanoid compounds during the lignifying process in the apricot endocarp; Table S3: Screening of differential metabolites at the three developmental stages of apricot endocarp; Table S4: Screening of differential genes at the three developmental stages of apricot endocarp; Table S5: The gene expressions related to lignin biosynthesis at the three developmental stages of apricot endocarp.

Author Contributions

Conceptualization, Q.Z.; methodology, W.L.; software, N.L.; validation, Y.Z. (Yuping Zhang) and M.X.; formal analysis, X.M.; investigation, S.L., Y.Z. (Yujun Zhang) and H.Z.; data curation, J.L.; writing—original draft preparation, Q.Z.; writing—review and editing, X.M.; project administration, W.L.; funding acquisition, Q.Z. All authors have read and agreed to the published version of the manuscript.

Funding

This research was funded by the National Natural Science Foundation of China, grant number 31972365; the National Crop Germplasm Resources Platform of China, grant number NHGRC2022−NH10; and the Program of Conservation and Utilization of Crop Germplasm Resources in China, grant number 2018NWB003.

Institutional Review Board Statement

Not applicable.

Data Availability Statement

Not applicable.

Conflicts of Interest

The authors declare no conflict of interest.

References

  1. Liu, W.; Liu, N.; Zhang, Y.; Yu, X.; Sun, M.; Xu, M.; Zhang, Q.; Liu, S. Kernel-using apricot resources and its utilization. Acta Hortic. 2012, 966, 189–191. [Google Scholar] [CrossRef]
  2. Wang, R.H.; Li, J.R.; Chen, L.L. Prelimiary studies on tissue structure and developmental anatomy of apricot during fruit growth and development. Acta Univ. Agric. Boreali-Occident. 2000, 28, 45–50. [Google Scholar] [CrossRef]
  3. Shi, M.Y.; Li, Y.; Zhang, W.; Xu, J.; Liu, Y.P. Dynamic changes of lignin deposition in the endocarp of peach fruit. J. Beijing Agric. Coll. 2013, 28, 25–28. [Google Scholar] [CrossRef]
  4. Yamaguchi, M.; Haji, T.; Miyake, M.; Yaegaki, H. Studies on the varietal differences and early deviation of mesocarp cell numbers and lengths and fruit weight among commercial peach [Prunus persica (L.) Batsch] cultivars and selections, wild types, and their hybrids. J. Jpn. Soc. Hortic. Sci. 2002, 71, 459–466. [Google Scholar] [CrossRef]
  5. Zhu, Q.P.; Guo, C.M.; Xu, J.; Tudi, M.; Gong, P.; Tuerxungu, A.; Yang, B.; Liao, K. Tissue anatomical observation of almond endocarp development. Nonwood For. Res. 2017, 35, 124–129. [Google Scholar] [CrossRef]
  6. Zhang, X.; Zhang, L.J.; Zhang, Q.P.; Xu, J.Y.; Liu, W.S.; Dong, W.X. Comparative transcriptome profiling and morphology provide insights into endocarp cleaving of apricot cultivar (Prunus armeniaca L.). BMC Plant Biol. 2017, 17, 72. [Google Scholar] [CrossRef]
  7. Lv, C.J.; Zhang, Q.P.; Liu, N.; Zhang, Y.P.; Xu, M.; Liu, S.; Ma, X.X.; Zhang, Y.J.; Liu, W.S. Correlations between physical properties and major chemical components of shells in apricot. J. Fruit Sci. 2021, 38, 1717–1724. [Google Scholar] [CrossRef]
  8. Vanholme, R.; De Meester, B.; Ralph, J.; Boerjan, W. Lignin biosynthesis and its integration into metabolism. Curr. Opin. Biotech. 2019, 56, 230–239. [Google Scholar] [CrossRef]
  9. Dong, N.Q.; Lin, H.X. Contribution of phenylpropanoid metabolism to plant develppment and plant-environment interactions. J. Integr. Plant Biol. 2021, 63, 180–209. [Google Scholar] [CrossRef] [PubMed]
  10. Zhang, J.; Xie, M.; Tuskan, G.; Muchero, W.; Chen, J.G. Recent advances in the transcriptional regulation of secondary cell wall biosynthesis in the woody plants. Front. Plant Sci. 2018, 9, 1535. [Google Scholar] [CrossRef]
  11. Li, S.M.; Su, X.Q.; Abdullah, M.; Sun, Y.M.; Li, G.H.; Cheng, X.; Lin, Y.; Cai, Y.P.; Jin, Q. Effects of different pollens on primary metabolism and lignin biosynthesis in pear. Int. J. Mol. Sci. 2018, 19, 2273. [Google Scholar] [CrossRef] [Green Version]
  12. Barros, J.; Serk, H.; Granlundz, I.; Pesquet, E. The cell biology of lignification in higher plants. Ann. Bot. 2015, 115, 1053–1074. [Google Scholar] [CrossRef] [PubMed] [Green Version]
  13. Dardick, C.D.; Callahan, A.M.; Chiozzotto, R.; Schaffer, R.J.; Piagnani, M.C.; Scorza, R. Stone formation in peach fruit exhibits spatial coordination of the lignin and flavonoid pathways and similarity to Arabidopsis dehiscence. BMC Biol. 2010, 8, 13. [Google Scholar] [CrossRef] [Green Version]
  14. Zhang, X.; Zhang, Q.P.; Sun, X.Y.; Du, X.; Liu, W.S.; Dong, W.X. Differential expression of genes encoding phenylpropanoid enzymes in an apricot cultivar (Prunus armeniaca L.) with cleavable endocarp. Trees 2019, 33, 1695–1710. [Google Scholar] [CrossRef]
  15. Xu, J.; Yan, J.; Li, W.; Wang, Q.; Wang, C.; Guo, J.; Geng, D.; Guan, Q.; Ma, F. Integrative analyses of widely targeted metabolic profiling and transcriptome data reveals molecular insight into metabolomic variations during apple (Malus domestica) fruit development and ripening. Int. J. Mol. Sci. 2020, 21, 4797. [Google Scholar] [CrossRef]
  16. Li, Z.L. Plant Sectioning Technology, 2nd ed.; Science Press: Beijing, China, 1987; pp. 105–137. [Google Scholar]
  17. Guida, R.D.; Engel, J.; Allwood, J.W.; Weber, R.J.M.; Jones, M.R.; Sommer, U.; Viant, M.R.; Dunn, W.B. Non-targeted UHPLC-MS metabolomic data processing methods: A comparative investigation of normalisation, missing value imputation, transformation and scaling. Metabolomics 2016, 12, 93. [Google Scholar] [CrossRef] [PubMed] [Green Version]
  18. Dunn, W.B.; Broadhurst, D.; Begley, P.; Zelena, E.; Francis-Mcintyre, S.; Anderson, N.; Brown, M.; Knowles, J.D.; Halsall, A.; Haselden, J.N. Procedures for large-scale metabolic profiling of serum and plasma using gas chromatography and liquid chromatography coupled to mass spectrometry. Nat. Protoc. 2011, 6, 1060–1083. [Google Scholar] [CrossRef]
  19. Wen, B.; Mei, Z.L.; Zeng, C.W.; Liu, S.Q. MetaX: A flexible and comprehensive software for processing metabolomics data. BMC Bioinform. 2017, 18, 183. [Google Scholar] [CrossRef] [PubMed] [Green Version]
  20. Westerhuis, J.A.; Hoefsloot, H.C.J.; Smit, S.; Vis, D.J.; Smiled, A.K.; Van Velzen, E.J.J.; Van Duijnhoven, J.P.M.; Van Dorsten, F.A. Assessment of PLSDA cross validation. Metabolomics 2008, 4, 81–89. [Google Scholar] [CrossRef] [Green Version]
  21. Cock, P.J.A.; Fields, C.J.; Goto, N.; Heuer, M.L.; Rice, P.M. The Sanger FASTQ file format for sequences with quality scores, and the Solexa/Illumina FASTQ variants. Nucleic Acids Res. 2010, 38, 1767–1771. [Google Scholar] [CrossRef] [PubMed]
  22. Zhang, Q.P.; Zhang, D.Y.; Yu, K.; Ji, J.J.; Liu, N.; Zhang, Y.P.; Xu, M.; Zhang, Y.J.; Ma, X.X.; Liu, S.; et al. Frequent germplasm exchanges drive the high genetic diversity of Chinese-cultivated common apricot germplasm. Hortic. Res. 2021, 8, 215. [Google Scholar] [CrossRef] [PubMed]
  23. Langmead, B.; Salzberg, S.L. Fast gapped-read alignment with Bowtie 2. Nat. Methods 2012, 9, 357–359. [Google Scholar] [CrossRef] [PubMed] [Green Version]
  24. Li, B.; Dewey, C.N. RSEM: Accurate transcript quantification from RNA-Seq data with or without a reference genome. BMC Bioinform. 2011, 12, 323. [Google Scholar] [CrossRef] [PubMed] [Green Version]
  25. Wang, L.; Feng, Z.; Wang, X.; Wang, X.; Zhang, X. DEGseq: An R package for identifying differentially expressed genes from RNA-seq data. Bioinformatics 2010, 26, 136–138. [Google Scholar] [CrossRef] [PubMed] [Green Version]
  26. Vogt, T. Phenylpropanoid biosynthesis. Mol. Plant 2010, 3, 2–20. [Google Scholar] [CrossRef] [Green Version]
  27. Dardick, C.D.; Callahan, A.M. Evolution of the fruit endocarp: Molecular mechanisms underlying adaptations in seed protection and dispersal strategies. Front. Plant Sci. 2014, 5, 284. [Google Scholar] [CrossRef]
  28. Ge, S.L.; Wang, Y.N.; Meng, H.L.; Wang, Y.M.; Guan, W.; Lu, P. Study on anatomy and pit-splitting during peach fruit development. J. Beijing Agric. Coll. 2006, 21, 1–4. [Google Scholar] [CrossRef]
  29. Meng, Z.; Yu, J.; Yang, A.Z.; Shi, G.L.; Zhang, T.Q.; Wang, Y.N. The lignin deposition process in fruit endocarp of different jujube cultivars. J. Agric. 2016, 6, 82–87. [Google Scholar] [CrossRef]
  30. Canton, M.; Drincovich, M.F.; Lara, M.V.; Vizzotto, G.; Walker, R.P.; Famiani, F.; Bonghi, C. Metabolism of stone fruits: Reciprocal contribution between primary metabolism and cell wall. Front. Plant Sci. 2020, 11, 1054. [Google Scholar] [CrossRef]
  31. Yang, A.Z.; Zhang, Z.Y.; Cao, A.J.; Meng, H.L.; Wang, Y.N. Studies of changes in sugar accumulation and lignin deposition during peach fruit endocarp development. Acta Hortic. Sin. 2009, 36, 1113–1119. [Google Scholar] [CrossRef]
  32. Zhu, Q.P.; Guo, C.M.; Mubarak, A.; Gong, P.; Shu, R.; Yang, B.; Liao, K. Changes in relative enzyme activities during the lignification in the almond endocarp. J. Fruit Sci. 2018, 35, 1079–1086. [Google Scholar] [CrossRef]
  33. Stewart, J.J.; Akiyama, T.; Chapple, C.C.S.; Ralph, J.; Mansfield, S.D. The effects on lignin structure on overexpression of ferulate 5-hydroxylase in hybrid poplar. Plant Physiol. 2009, 150, 621–635. [Google Scholar] [CrossRef] [PubMed] [Green Version]
  34. Liang, M.; Davis, E.; Gardner, D.; Cai, X.; Wu, Y. Involvement of AtLAC15 in lignin synthesis in seeds and in root elongation of Arabidopsis. Planta 2006, 224, 1185–1196. [Google Scholar] [CrossRef] [PubMed]
  35. Lillo, C.; Lea, U.S.; Ruoff, P. Nutrient depletion as a key factor for manipulating gene expression and product formation in different branches of the flavonoid pathway. Plant Cell Environ. 2008, 31, 582–601. [Google Scholar] [CrossRef] [PubMed]
Figure 1. (a) Changes of tissue and lignin deposition during endocarp developing. Me, Mesocarp; Ep, Endocarp; Sc, Seed coat. 04-04, Ovaries and endocarp stain with saffron; 1 and 8 DAF, seed coat separate from endocarp; plates from 15 to 37 DAF show thickening of the endocarp; the right row of plates show endocarp lignin deposition stained with phloroglucinol. (b) Changes of tissue thickness during endocarp developing. Each period is repeated 5 times sampling, and the endocarp thickness is measured in n = 25.
Horticulturae 08 00967 g001
Figure 2. UPLC-MC profiles of metabolites in the apricot endocarp.
Horticulturae 08 00967 g002
Figure 3. Assessment of repeatability and variability of samples from the same period. (a) Principle component analysis (PCA) in EIS+ mode; (b) PCA in EIS− mode; (c) Partial least squares method-discriminant analysis (PLS-DA) in EIS+ mode; (d) PLS-DA in EIS− mode. The horizontal axis is the first principle component (PC) and the vertical axis is the second PC, and the ellipse in the PCA score graph is 95% confidence interval. Each dot represents a sample, with different colors for different groups. The number in parentheses is the score of the PC, indicating the ability of the PC to interpret the whole model.
Horticulturae 08 00967 g003
Figure 4. The cluster heatmap of phenylpropanoids metabolites at the three developmental stages of apricot endocarp. The peak area data of metabolites were standardized by Z cores during cluster analysis. Detailed data of metabolite was shown in Supplementary Table S2.
Horticulturae 08 00967 g004
Figure 5. Differential metabolites were detected at the three developmental stages of apricot endocarp based on the (variable importance for the projection) VIP and p values using the PLS-DA model. Each dot represented a metabolite, and the red dot is the metabolite with significant difference among different stages.
Horticulturae 08 00967 g005
Figure 6. Lignin biosynthesis (A) and related gene expression (BG) at the lignin deposition stages of apricot endocarp. The red arrow represents an increase in the relative content of the metabolite, while the green arrow represents a decrease in the relative content of the metabolite. (C,EG) were the gene expression of POD, BGLU, LAC and POD, respectively. SK, shikimate kinase; CM, chorismate mutase; ADH, arogenate dehydrogenase; PAL, phenylalanine ammonia-lyase; C4H, cinnamate 4-hydroxylase; 4CL, 4-coumarate:CoA ligase; HCT, shikimate O-hydroxycinnamoyltransferase; C3H, p-Coumarate 3-hydroxylase; CSE, caffeoyl shikimate esterase; CcOAMT, caffeoyl-CoA O-methyltransferase; CCR, cinnamoyl-CoA reductase; F5H, ferulate 5-hydroxylase; COMT, caffeic acid O-methyltransferase; CAD, cinnamyl alcohol dehydrogenase; CALDH, coniferyl aldehyde dehydrogenase; BGLU, β-glucosidase; POD, peroxidase; LAC, laccases. Each cell represented the differentially expressed genes (DEGs) involved in the corresponding pathways. The cell color indicated the fold change of the DEGs (red means up-regulated and blue is down-regulated). The first, second and third column, respectively, represented the DEGs among 41 vs. 33 DAF, 45 vs. 33 DAF and 45 vs. 41 DAF. Different lines represent each homologous gene, which was shown in Supplementary Table S5.
Horticulturae 08 00967 g006
Table 1. Identification and composition of metabolites in the apricot endocarp.
Ion ModeTotalAmino AcidsSugarsOrganic AcidsCoumarinsLigninsLignansPhenolic AcidsFlavonoidsOthers
EIS+390126221149724295
EIS−236815127167613152
The data include the same compound detected in different ion modes. The metabolite names and classes are detailed in Supplement Table S1.
Table 2. The peak areas of amino acids, sugars and organic acids compounds during the lignifying process in the apricot endocarp (peak area, ×107).
MetabolitesIon33 DAF41 DAF45 DAFANOVA_PKW_P
DL-Arginine+73.114.069.190.0000.001
L-Aspartic acid+0.881.570.840.0000.003
L-Aspartic acid7.0511.8510.480.0000.002
Asparagine+23.0416.9926.110.0330.018
Asparagine83.8954.0782.690.0000.004
D-Glutamic acid+22.8925.7513.980.0000.001
L-Glutamic acid12.7614.358.430.0000.001
L-Pyroglutamic acid+7.548.146.920.0010.002
D-(−)-Glutamine+2.462.592.780.0670.045
D-(−)-Glutamine1.882.001.960.2810.241
L-Histidine+3.001.344.610.0000.001
L-Histidine4.501.184.580.0000.003
DL-β-Leucine0.140.460.920.0000.001
L-Isoleucine+2.425.2415.160.0000.001
Isoleucine+0.671.433.590.0000.001
L-Norleucine+1.112.727.100.0000.001
L-Phenylalanine3.674.6421.220.0000.002
L-Tyrosine+0.631.032.650.0000.004
D-(+)-Tryptophan+0.926.4732.280.0000.001
D-(+)-Tryptophan0.332.5912.690.0000.001
α-Oxoglutaric acid210.29177.71386.870.0000.001
α-Hydroxyglutaric acid3.214.081.290.4860.103
Citric acid105.5665.82213.980.0000.001
Isocitric acid19.5914.5523.650.0000.001
Fumaric acid61.3555.1447.780.0530.030
Levulinic acid0.090.150.310.0000.001
DL-Malic acid2502.172037.391760.690.0000.003
2-Isopropylmalic acid6.629.7927.440.0000.001
D-(−)-Quinic acid+3.082.381.330.0000.001
D-(−)-Quinic acid536.46440.19364.910.0330.045
Shikimic acid0.480.290.250.0000.001
Succinic acid17.9411.287.700.0000.001
trans-Aconitic acid+2.542.125.060.0000.001
trans-Aconitic acid12.649.0914.450.0000.001
5-Hydroxymethylfurfural+1.720.860.410.0000.001
α-Lactose+8.575.682.900.0000.001
α-Lactose15.6711.058.240.0010.001
Galactitol+8.754.561.850.0000.001
D-(−)-Lyxose0.890.670.660.1240.034
D-(−)-Fructose0.260.420.700.0000.001
D-Fructose-1,6-diphosphate+0.520.460.390.0000.001
D-Fructose-1,6-diphosphate8.817.506.090.0000.001
D-(+)-Glucose+2.931.610.750.0000.001
Glucose 1-phosphate10.448.995.400.0000.001
D-Glucosamine+0.650.410.590.0000.001
Gluconic acid14.0710.948.760.0000.001
D-(+)-Maltose1.611.481.140.0040.008
Mannitol91.6461.2535.550.0000.001
The variation of the same metabolite in different treatments were represented by the peak areas, the data are mean value (n = 6); + and − represent metabolites detected in EIS+ and EIS− mode, respectively; ANOVA_P was the p value of analysis of variance; KW_P was the p value of Kruskal–Wallis Test.
Table 3. Differential metabolites screened at the three developmental stages of apricot endocarp.
CodeMetaboliteRegulationVIPp Value41 vs. 3345 vs. 33
FClog2(FC)FClog2(FC)
La_N01forsythinup1.36 6.18 × 10−153.081.629.123.19
Li_N14sibiricose A6up1.36 3.06 × 10−133.06 1.616.112.61
Li_P07rosavinup1.32 2.56 × 10−1514.07 3.8129.724.89
Li_N04p-coumaryl alcohol 4-glucosideup1.31 9.24 × 10−91.91 0.932.461.30
La_P03l-asarininup1.28 7.02 × 10−155.87 2.557.112.83
Cu_P18fraxinolup1.27 5.58 × 10−113.63 1.864.112.04
Li_N15tenuifoliside Bup1.25 1.40 × 10−72.11 1.082.391.25
Li_P08isochlorogenic acid Cup1.22 1.56 × 10−1854.16 5.7660.325.91
Cu_N03fraxetin up1.21 1.26 × 10−1210.32 3.3710.483.39
Cu_P19dihydrocoumarinup1.20 1.05 × 10−71.33 0.413.371.75
Li_P11coniferindown1.34 1.31 × 10−100.74 −0.440.38−1.40
La_N03cycloolivildown1.33 4.64 × 10−110.45 −1.150.22−2.18
Li_P042-hydroxycinnamic aciddown1.33 2.55 × 10−160.60 −0.740.11−3.23
Li_P02ethyl 4-methoxycinnamatedown1.32 1.47 × 10−100.67 −0.590.43−1.21
La_P02lariciresinol 4-o-glucosidedown1.32 1.07 × 10−100.57 −0.800.35−1.52
La_N06pinoresinol 4-o-glucoside down1.31 3.60 × 10−100.80 −0.310.34−1.54
La_N02(+)-pinoresinoldown1.31 8.28 × 10−100.80 −0.310.34−1.57
Cu_P134-methylumbelliferyl-α-d-glucopyranosidedown1.30 4.78 × 10−100.61 −0.710.40−1.33
Li_P053-hydroxycinnamic aciddown1.30 1.03 × 10−110.80 −0.330.24−2.09
Cu_P08dicumaroldown1.29 2.46 × 10−80.47 −1.080.22−2.16
La_N04lariciresinol 4-o-glucosidedown1.28 6.03 × 10−110.47 −1.080.31−1.67
Li_N02p-coumaric aciddown1.26 3.06 × 10−90.88 −0.190.32−1.63
Li_N11ferulic aciddown1.24 2.65 × 10−80.98 −0.020.47−1.09
Li_N10neochlorogenic aciddown1.22 7.12 × 10−60.59 −0.770.33−1.61
The metabolite code was the ID number in the process of data analysis. The first two letters represented the classification of compounds, and the fourth letter P and N represented the positive and negative ion mode, respectively. Detailed code of metabolite was shown in Supplementary Table S1.
Publisher’s Note: MDPI stays neutral with regard to jurisdictional claims in published maps and institutional affiliations.

