Article

Identification and Characterization of Trihelix Transcription Factors and Expression Changes during Flower Development in Pineapple

1
Key Laboratory of Quality Control of Tropical Horticultural Crops of Hainan Province, Horticulture College, Hainan University, Haikou 570228, China
2
Key Laboratory of Biology and Genetic Resources of Tropical Crops, Ministry of Agriculture, Institute of Tropical Bioscience and Biotechnology, Chinese Academy of Tropical Agricultural Sciences, Haikou 571101, China
*
Author to whom correspondence should be addressed.
These authors contributed equally to this work.
Horticulturae 2022, 8(10), 894; https://doi.org/10.3390/horticulturae8100894
Submission received: 7 August 2022 / Revised: 22 September 2022 / Accepted: 26 September 2022 / Published: 29 September 2022

Abstract

:
Trihelix transcription factors with helix–loop–helix–loop–helix characteristics are essential in plant growth, development, and response to adversity. Several potential functions of Trihelix have been studied in multiple plant species, but little is known about the features and functions of Trihelix genes in pineapple. In this study, 23 Trihelix members were identified and classified into 5 groups and were unevenly distributed in 17 chromosomes of pineapple. The results revealed that six fragment duplication events and one tandem duplication event were found through gene duplication analysis. Moreover, 4, 10, 21, and 23 homologous gene pairs were found between pineapple and Arabidopsis, grape, banana, and rice, respectively. The promoters of Trihelix have many cis-elements, especially in light and hormone response. The expression characteristics of AcTrihelix members showed obvious tissue specificities in different tissues. The expressions of AcTrihelix3, AcTrihelix8, AcTrihelix16, AcTrihelix19, AcTrihelix20, and AcTrihelix23 were maintained at high levels during the late stage of flower bud development. In floral organs, the expression of different members was very different. In conclusion, some AcTrihelix members may play important roles during the floral development of pineapple, and they provide resources for further studies of the function of Trihelix and the molecular mechanism during pineapple flower formation.

1. Introduction

The Trihelix family was first discovered in pea (Pisum sativum) in the 1990s and classified as GT factors [1,2]. They bound to the degenerate core sequences of 5′-G-Pu-(T/A)-A-A-(T/A)-3′ of the rbcS-3A gene in order to regulate light response [2,3]. Later, a tandem trihelix (helix–loop–helix–loop–helix) structure had been identified for the DNA-binding domain of the GT factors, which were named Trihelix transcription factors. The trihelix structures of GT factors were similar to the three α helices (helix–helix–turn–helix) of the MYB TF family. It was believed that the Trihelix TF family originated from MYB-like genes. Therefore, the Myb/SANT-LIKE domain was deemed to be the conserved domain of the Trihelix family [1,4,5]. The Trihelix family and their functions were identified in many species. The different responses of this family to plant growth were investigated, including light response, embryonic development, the morphogenesis of various floral organs, and biotic and abiotic stress resistance [6].
Until now, the studies of Trihelix have been focused on responding to both biological and abiotic stresses. Previous studies showed that the Arabidopsis SIP1 clade Trihelix1 (AST1) responded to salt and osmotic stress through AGAG-box or GT motifs [7]. In rice, OsGTγ-2 was reported in response to salinity, osmotic, oxidative stresses, and abscisic acid (ABA) by binding to the GT-1 element in the OsRAV2 promoter [8]. The rest of the GTγ members, including OsGTγ-1 and OsGTγ-3, had effects on abiotic stress, which leads one to speculate that the OsGTγ subfamily may attend to the regulation of stress tolerance in rice [9]. Additionally, GmGT-2A and GmGT-2B have been shown to involve in adversity stress resistance in soybean [10]. In tomato, ShCIGT was overexpressed under cold and drought stress by interacting with SnRK1, which increased the abilities of abiotic stress resistance [11].
In addition, Trihelix genes also play crucial roles in plant growth and development. Previous studies showed that GT-1-like transcription factors were responsible for light-specific regulatory functions in Arabidopsis, which were involved in the pathogen- and salt-induced SCaM-4 gene expression in both soybean and Arabidopsis [12]. The GT-1 gene RML1 (OsMSL21) was repressed by light in etiolated seedlings in rice [13]. The Arabidopsis Trihelix family members ASIL1 (At1g54060) and ASIL2 (At3g14180) were identified as the inhibiting factors of the microRNA-synthesizing enzyme DICER-LIKE1, which repressed embryo development [2,14]. ASIL1 has been shown to regulate late embryonic development but ASIL2 affected early embryo development [14,15]. However, the functions of GT-1-like transcription factors in floral organ formation have yet to be characterized except in Arabidopsis and tomato. The PTL (At5g03680) has been reported to be effective in the development of flower organs, especially in the perianth, petals, stamens [2,16,17], and curly leaves [18]. In tomato, SLGT11 (Solyc03g006900) affected the floral organ patterning and maintenance of floral determinacy by analyzing a novel tomato stamenless-like flower (slf) [19].
Pineapple (Ananas comosus (L.) Merr.) (2n = 50) is one of the most important tropical fruits in the world, and its flowering status affects the marketing time and quality of fruits directly. The identification of floral regulation genes is important for the elucidation of the molecular mechanism of floral formation in pineapple, although the Trihelix transcription factors have been reported to control the morphogenesis of flower organs in Arabidopsis and tomato. However, it is not clear whether Trihelix is involved in flower induction and development. In this study, all Trihelix members were identified in the pineapple genome. The chromosome location, gene structure, duplication events, collinearity, promoter characteristics, gene expression characteristics, and interaction protein prediction were systematically analyzed. The results will thus improve our understanding of the functions of Trihelix genes in pineapple and provide theoretical guidance for pineapple flower formation.

2. Materials and Methods

2.1. Identification of AcTrihelix Genes in Pineapple

To identify the potential Trihelix genes, the pineapple protein sequences were downloaded from a pineapple genome database [20] (http://pineapple.zhangjisenlab.cn/pineapple/html/index.html, accessed on 15 July 2021). BLASTP was conducted to search the pineapple genome database using Trihelix protein sequences in Arabidopsis as queries. The Trihelix protein sequences of Arabidopsis were downloaded from Tair [21] (https://www.arabidopsis.org/, accessed on 15 July 2021). The TBtools software was used to perform the first filtrate, and the candidate genes were obtained. The NCBI Conserved Domain Database (https://www.ncbi.nlm.nih.gov/cdd, accessed on 1 August 2021) was used to further confirm the protein based on the Myb/SANT-LIKE domain [1]. The molecular weight (MW), isoelectric point (pI), protein instability index, and grand average of hydropathicity (GRAVY) of AcTrihelix proteins were predicted using the ExPASy proteomics server [22] (https://www.expasy.org/, accessed on 10 August 2021). Among them, the molecular weight (MW) is the sum of the relative atomic masses of all the atoms that make up the molecule. The isoelectric point (pI) is the pH value of a particular solution when the tendency of amino acids to dissociate into positive and negative ions is equal, and the protein no longer moves in the electric field. The protein instability index is the reference value for protein stability in in vitro testing. The GRAVY index is the ratio between the sum of the hydrophilic values of all amino acids in the protein sequence and the number of amino acids. The CELLO v.2.5 website [23] (http://cello.life.nctu.edu.tw/, accessed on 10 August 2021) was used to forecast the subcellular location.

2.2. Phylogenetic, Conserved Motif, and Gene Structure Analyses

The Clustalx software was used to identify the multiple sequence alignments of Trihelix proteins between pineapple and Arabidopsis [24]. The phylogenetic tree was constructed by using the MEGA 6.0 software [25] with the neighbor-joining method (NJ); the bootstrap replications were stetted to 1000. Then, 2000 bp of the nucleotide sequence upstream of the transcription initiation site was identified as the proximal promoter region sequences. MEME was used to search the motifs in the Trihelix family proteins (http://meme-suite. org/tools/meme, accessed on 12 August 2021) [26]. The gene structures of the AcTrihelix genes were determined with the GSDS 2.0 tool (Gene Structure Display Server, http://gsds.gao-lab.org/, accessed on 19 June 2022) according to their GFF annotation files.

2.3. cis-Element Identification, Chromosome Location, Duplication Events, and Collinear Analysis

To predict cis-elements, all the promoter region sequences were submitted to the PlantCARE database [27] (http://bioinformatics.psb.ugent.be/webtools/plantcare/html/, accessed on 30 August 2021). The chromosome location and gene duplications of the AcTrihelix genes, and identification collinearity with other species were analyzed by using the TBtools software [28]. All the data were downloaded from the pineapple genome database.

2.4. Expression Profiling of AcTrihelix Genes by RNA-Seq

The expression data of the AcTrihelix genes in various tissues were retrieved from the transcriptome data of pineapple. Additionally, the transcriptome data of pineapple were uploaded into the National Genomics Data Center database (https://ngdc.cncb.ac.cn/gsa/ (accessed on 6 May 2022)). The assigned accession of the submission is CRA006826. The transcript abundance of each AcTrihelix gene was calculated using the fragments per kilobase of repeat per million fragments mapped (FPKM) values. Based on the obtained expression values, heatmaps were generated with the TBtools software for further visualization [28].

2.5. Plant Materials and Treatments

The pineapple plantlets (Ananas comosus L. cv. Comte de Paris) used in this study were 15-month-old uniform pineapple plants. The experimental groups were treated with 30 mL of 400 mg/L ethylene to induce flowering. The terminal buds of the pineapple plants were, respectively, collected at 0 h (Bud-0h), 1 week (Bud-1w), 3 weeks (Bud-1w), 5 weeks (Bud-5w), and 7 weeks (Bud-7w) after treatment. The different floral organs of the pineapple, including the petal, ovary, stamen, sepal, and style, were collected at the full-bloom stage. The fruits were collected at ripening. The bud, leaf, and root of the pineapple plants were, respectively, collected before treatment. All the samples were immediately frozen with liquid nitrogen and stored at −80 °C until further use.

2.6. RNA Extraction and Real-Time Quantitative PCR (RT-qPCR) Analysis

The total RNAs were extracted from pineapple tissues using a Quick RNA isolation Kit (Huayueyang Biotechnology, Beijing, China) according to the operating manual. The qualities and concentrations of the obtained RNAs were detected using 1.2% agarose gel and a NanoDrop™ One/OneC Spectrophotometer (Thermo Fisher Scientific, Waltham, MA, USA). The total RNAs were reversely transcribed into cDNA using a Revert Aid First-Strand cDNA Synthesis Kit (Thermo Fisher Scientific, USA).
Real-time PCR was performed with an SYBR Green qPCR Master MIX Kit (Thermo Fisher Scientific, USA) using the Light Cycler 480 II system (Roche, Basel, Switzerland). The 2−ΔΔCt method was used to calculate the relative expression levels of all genes [29]. The AcActin gene was used as a reference gene [30]. The primers needed for the experiment were designed using Primer Premier 5.0 [31] (Table S1).

3. Results

3.1. Identification and Characterization of Trihelix Proteins in Pineapple

The Trihelix family members of pineapple were obtained using two BLASTP methods based on the Trihelix protein sequences of Arabidopsis. After deleting the redundant members, 23 Trihelix members were identified and named from AcTrihelix1 to AcTrihelix23, according to the ascending order of their gene IDs. The length of protein sequences, MW, pI, instability index, GRAVY, and subcellular localization are illustrated in Table 1.
The length of the 23 Trihelix proteins ranged from 203 (AcTrihelix12) to 1179 AA (AcTrihelix18). The lowest MW was 24.60 kDa (AcTrihelix12), and the highest MW was 129.66 kDa (AcTrihelix18). The value of the pI varied from 4.82 (AcTrihelix7) to 11.33 (AcTrihelix14), and 10 acidic proteins (AcTrihelix1, AcTrihelix4, AcTrihelix5, AcTrihelix7, AcTrihelix9, AcTrihelix10, AcTrihelix16, AcTrihelix17, AcTrihelix18, and AcTrihelix23) were obtained. The Instability index varied from 41.54 (AcTrihelix10) to 97.54 (AcTrihelix15), and all the family members were unstable proteins. The values of the GRAVY ranged from −1.37 (AcTrihelix7) to −0.232 (AcTrihelix18). According to the prediction of subcellular localization, all protein members in this family were predicted in nuclear, except for AcTrihelix18, which was predicted in the plasma membrane (Table 1).

3.2. Phylogenetic Analysis

The phylogenetic trees of pineapple and Arabidopsis were made using the neighbor-joining method to analyze the evolutionary relationships and classifications of the AcTrihelix genes. In total, 23 AcTrihelix proteins and 30 AtTrihelix members were classified into 5 subfamilies, including Group GT-1, Group GT-2, Group GTγ, Group SH4, and Group SIP1. Among the members of the AcTrihelix family in pineapples, Group SIP1 with eight AcTrihelix members was the most clade, while Group GT-2 with family two members was the least clade. Additionally, Group GT-1 Group SH4, and Group GTγ contained seven, three, and three AcTrihelix members, respectively (Figure 1).

3.3. Gene Structures, Conserved Domains, and Motif Analysis

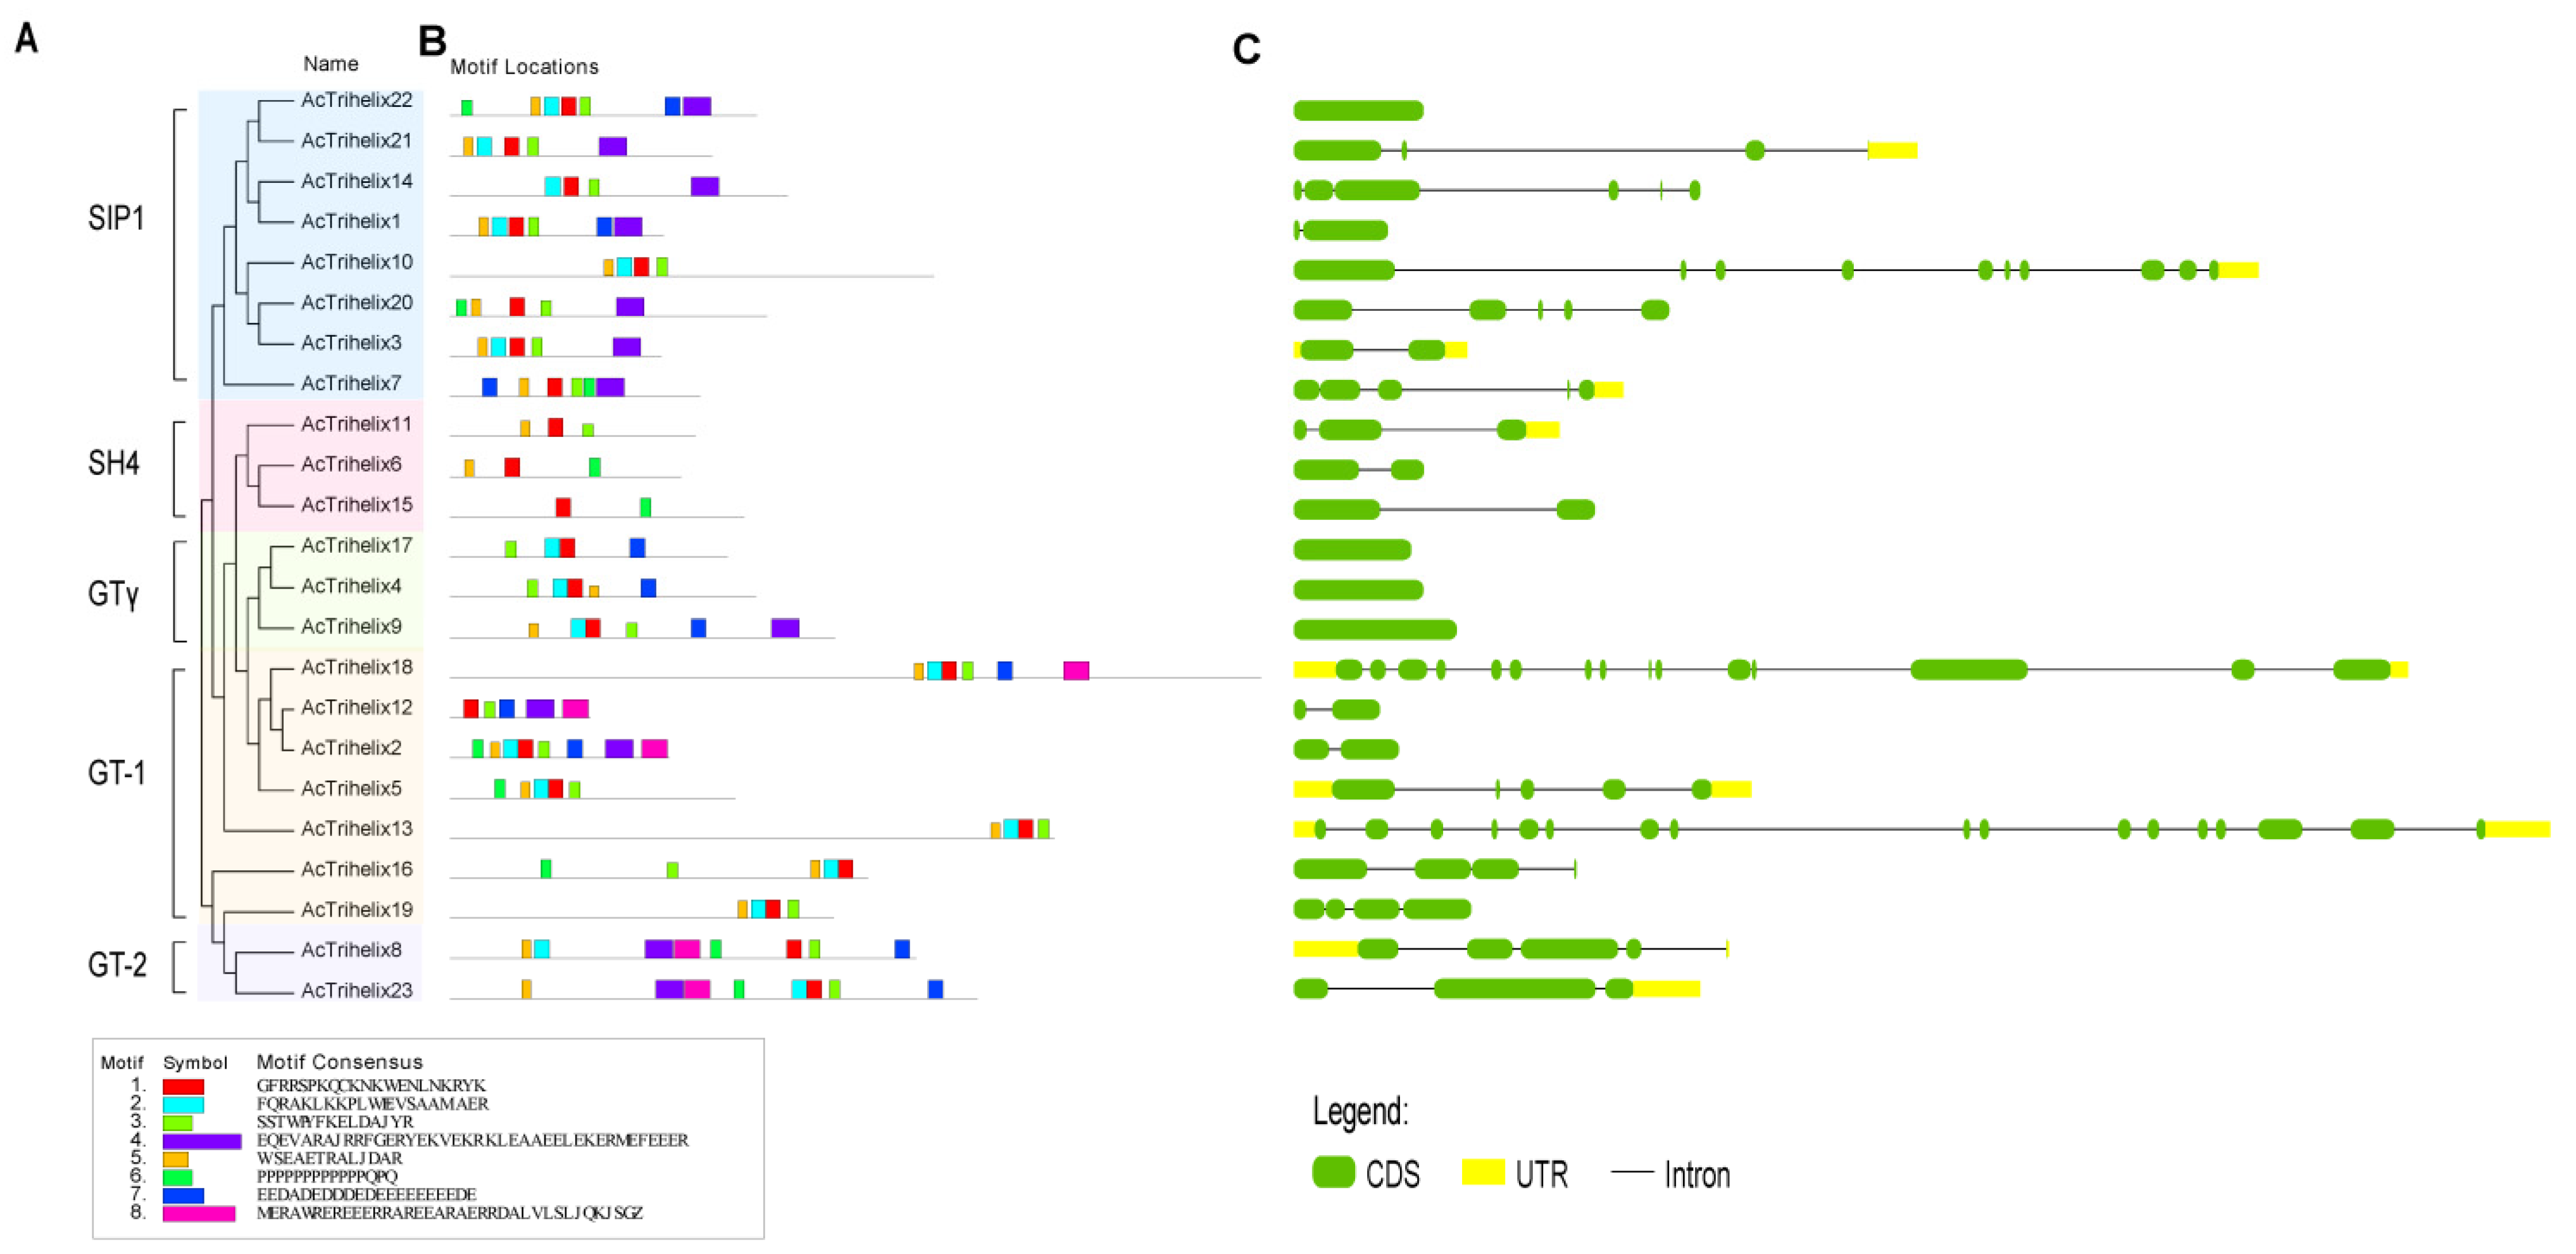
The conserved motifs of the 23 AcTrihelix proteins are shown in Figure 2. Every member had Motif 1. The gene structure analysis showed that the subfamilies had obviously distinct motifs. Aside from Motif1, GT-1 and SIP1 contained Motif 3, GT-γ included Motif2, Motif3, and Motif7, and GT-2 had the rest of the seven motifs. These motifs may determine the functions of subfamilies.
In addition, the exon-intron structure arrangements of the Trihelix family were analyzed. The information in Figure 2B is shown in Figure S1. The AcTrihelix family had 23 members, 4 members had no introns, and 19 members contained 1–16 introns, most of which belonged to AcTrihelix13. AcTrihelix3, AcTrihelix5, AcTrihelix13, and AcTrihelix18 had both 5′-UTR on N-terminus and 3′-UTR on C-terminus. AcTrihelix7, AcTrihelix10, AcTrihelix11, AcTrihelix21, and AcTrihelix23 had 3′-UTR on C-terminus, while AcTrihelix8 had 5′-UTR on N-terminus (Figure 2).

3.4. cis-Element Analysis of the AcTrihelix Promoters

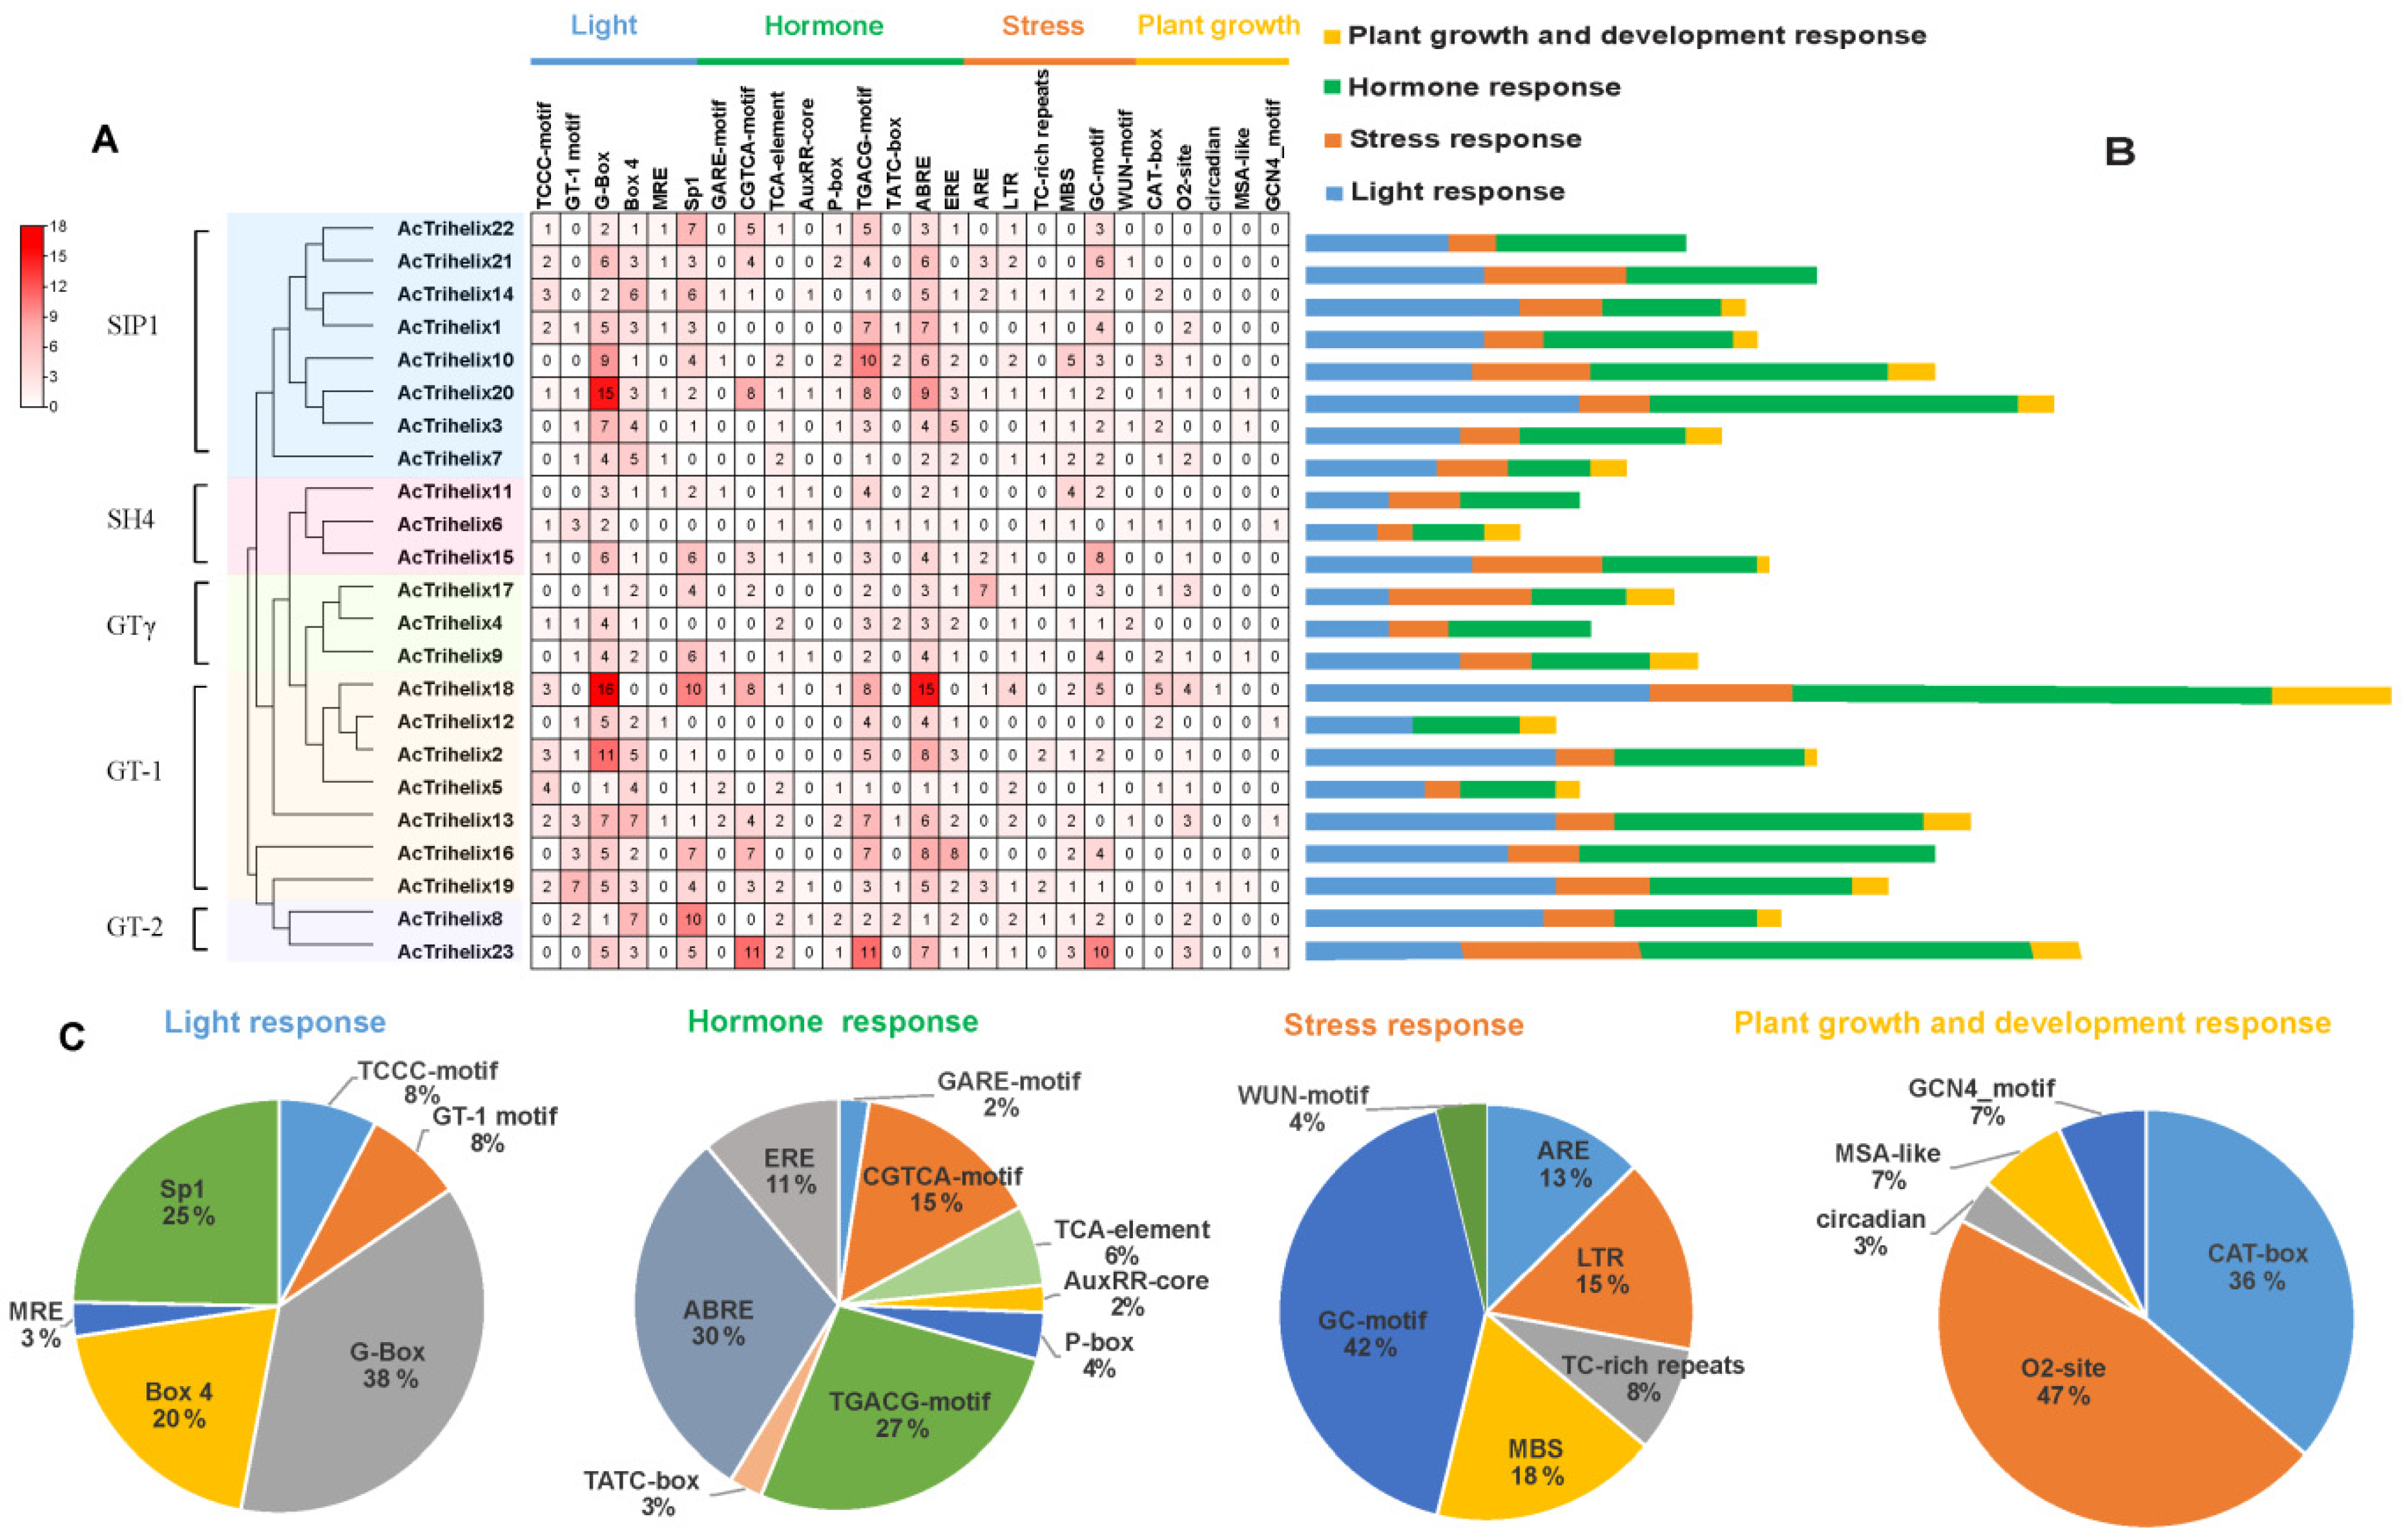
To understand the potential function and regulatory mechanism of the AcTrihelix genes, the cis-acting elements of the AcTrihelix promoters were predicted using the PlantCARE website (Figure 3). A total of 931 response elements were obtained, including 336 light response elements, 379 hormone response elements, 158 stress response elements, and 58 response elements related to plant growth and development. The hormone response elements were abundant, including GARE-motif, CGTCA-motif, TCA-element, AuxRR-core, P-box, TGACG-motif, TATC-box, ABRE, and ERE. Among them, ABRE accounted for 30%, which was the largest proportion. AuxRR-core had the least proportion at 2% (Figure 3). The number of response elements related to plant growth and development was the least, and the elements of plant growth and development were absent in AcTrihelix4, AcTrihelix11, AcTrihelix16, AcTrihelix21, and AcTrihelix22.

3.5. Chromosomal Location and Gene Duplication of AcTrihelix Gene

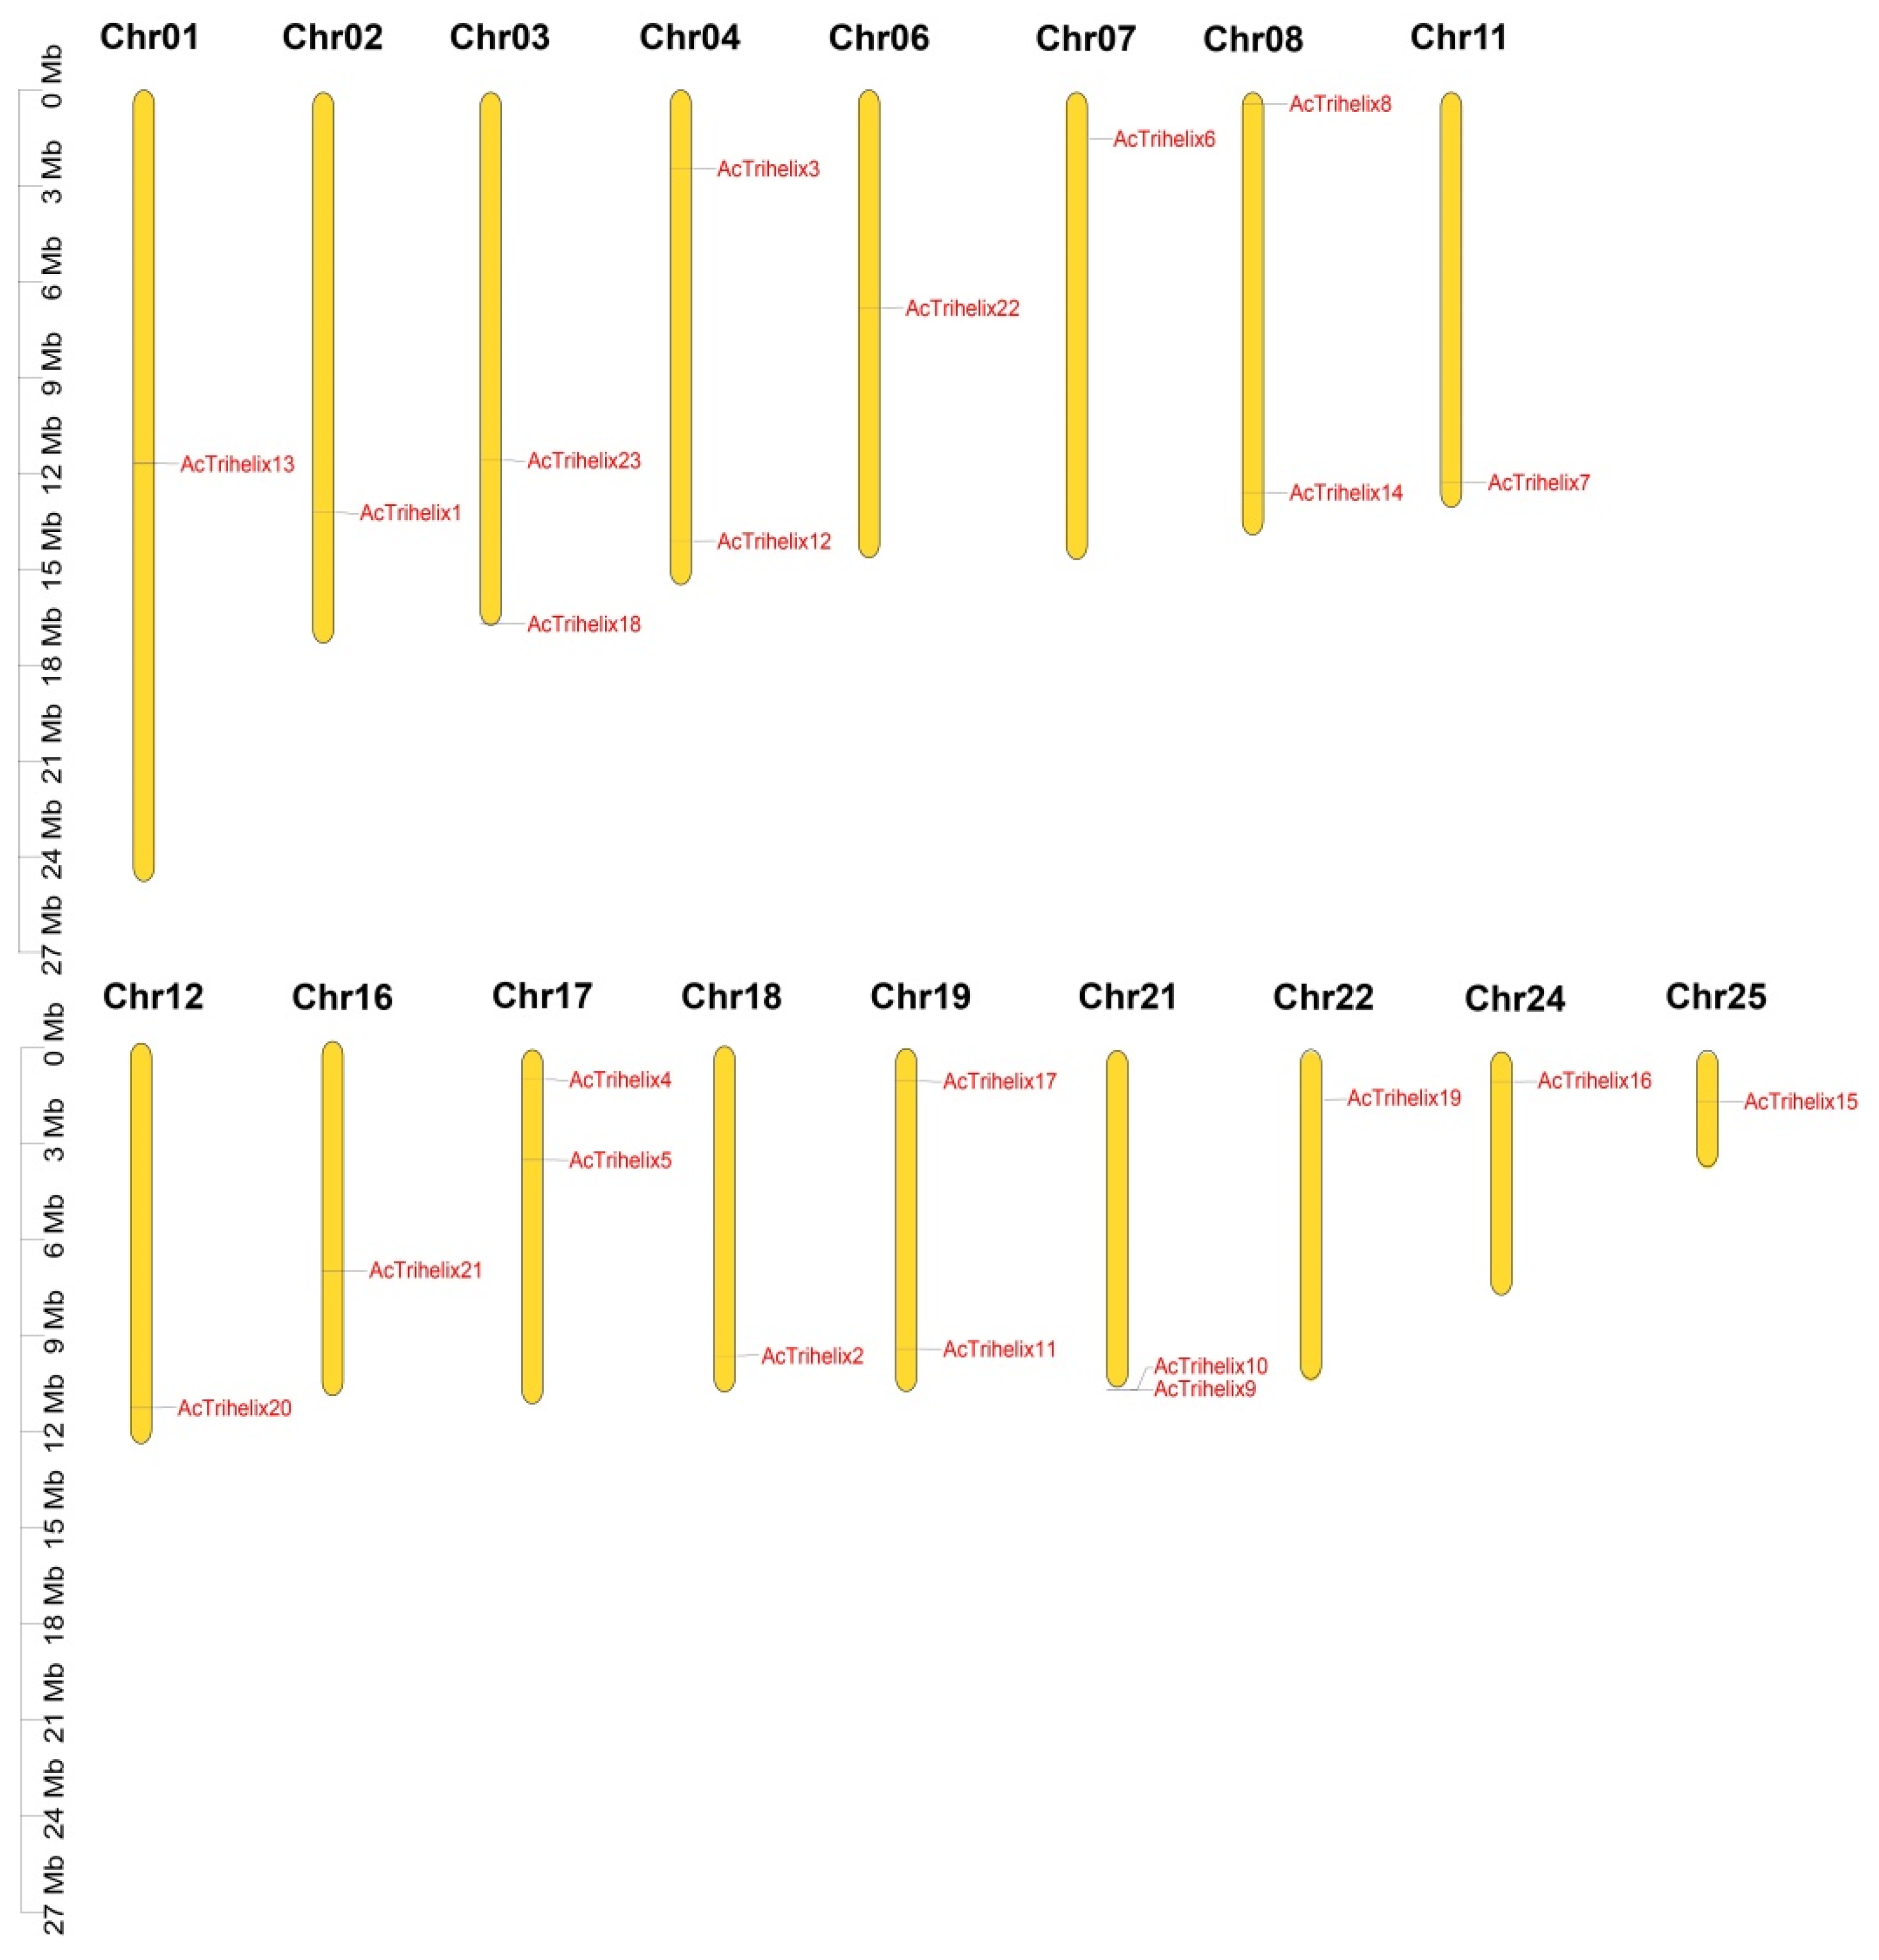
To reveal the distribution characteristics of Trihelix genes in the pineapple genome, the chromosomal localization analysis of 23 AcTrihelix genes is shown in Figure 4. The results revealed that 23 Trihelix genes were unevenly distributed on 17 chromosomes, accounting for 68 percent of the 25 pineapple chromosomes. In addition, 6 chromosomes including Chr03, Chr04, Chr08, Chr17, Chr19, and Chr21, had two AcTrihelix genes, and the rest of the 11 chromosomes had only one AcTrihelix gene (Figure 4).
As shown in Figure 5A, 23 AcTrihelix genes were involved in 6 fragment duplication events (AcTrihelix2/AcTrihelix12, AcTrihelix19/AcTrihelix16, AcTrihelix19/AcTrihelix18, AcTrihelix16/AcTrihelix18, AcTrihelix8/AcTrihelix23, and AcTrihelix14/AcTrihelix18). Most of these gene pairs were from GT-1 except for two pairs (AcTrihelix8/AcTrihelix23 and AcTrihelix14/AcTrihelix18). That means the duplication events of the members of the GT-1 subfamily may be the main driving force for the expansion of the Trihelix gene family. A chromosomal region within 200 kb containing two or more genes is called a tandem duplication event [1], and the AcTrihelix family was found to have one tandem duplication event (AcTrihelix9 and AcTrihelix10) (Figure 5A).
To further understand the gene duplication mechanisms of the Trihelix family, four comparative syntenic maps of pineapple associated with four representative species including two dicots (Arabidopsis and grape) and two monocots (rice and banana) were constructed (Figure 5B). Pineapple had 4, 10, 21, and 23 homologous gene pairs with Arabidopsis, grape, banana, and rice, respectively. Pineapple had more homologous gene pairs with rice and banana than with Arabidopsis and grape. These special orthologous pairs between monocotyledonous plants could form after the divergence of dicotyledonous and monocotyledonous plants and play crucial roles in the evolution of the Trihelix family.

3.6. Expression Profiles of AcTrihelix in Different Tissues in Pineapple

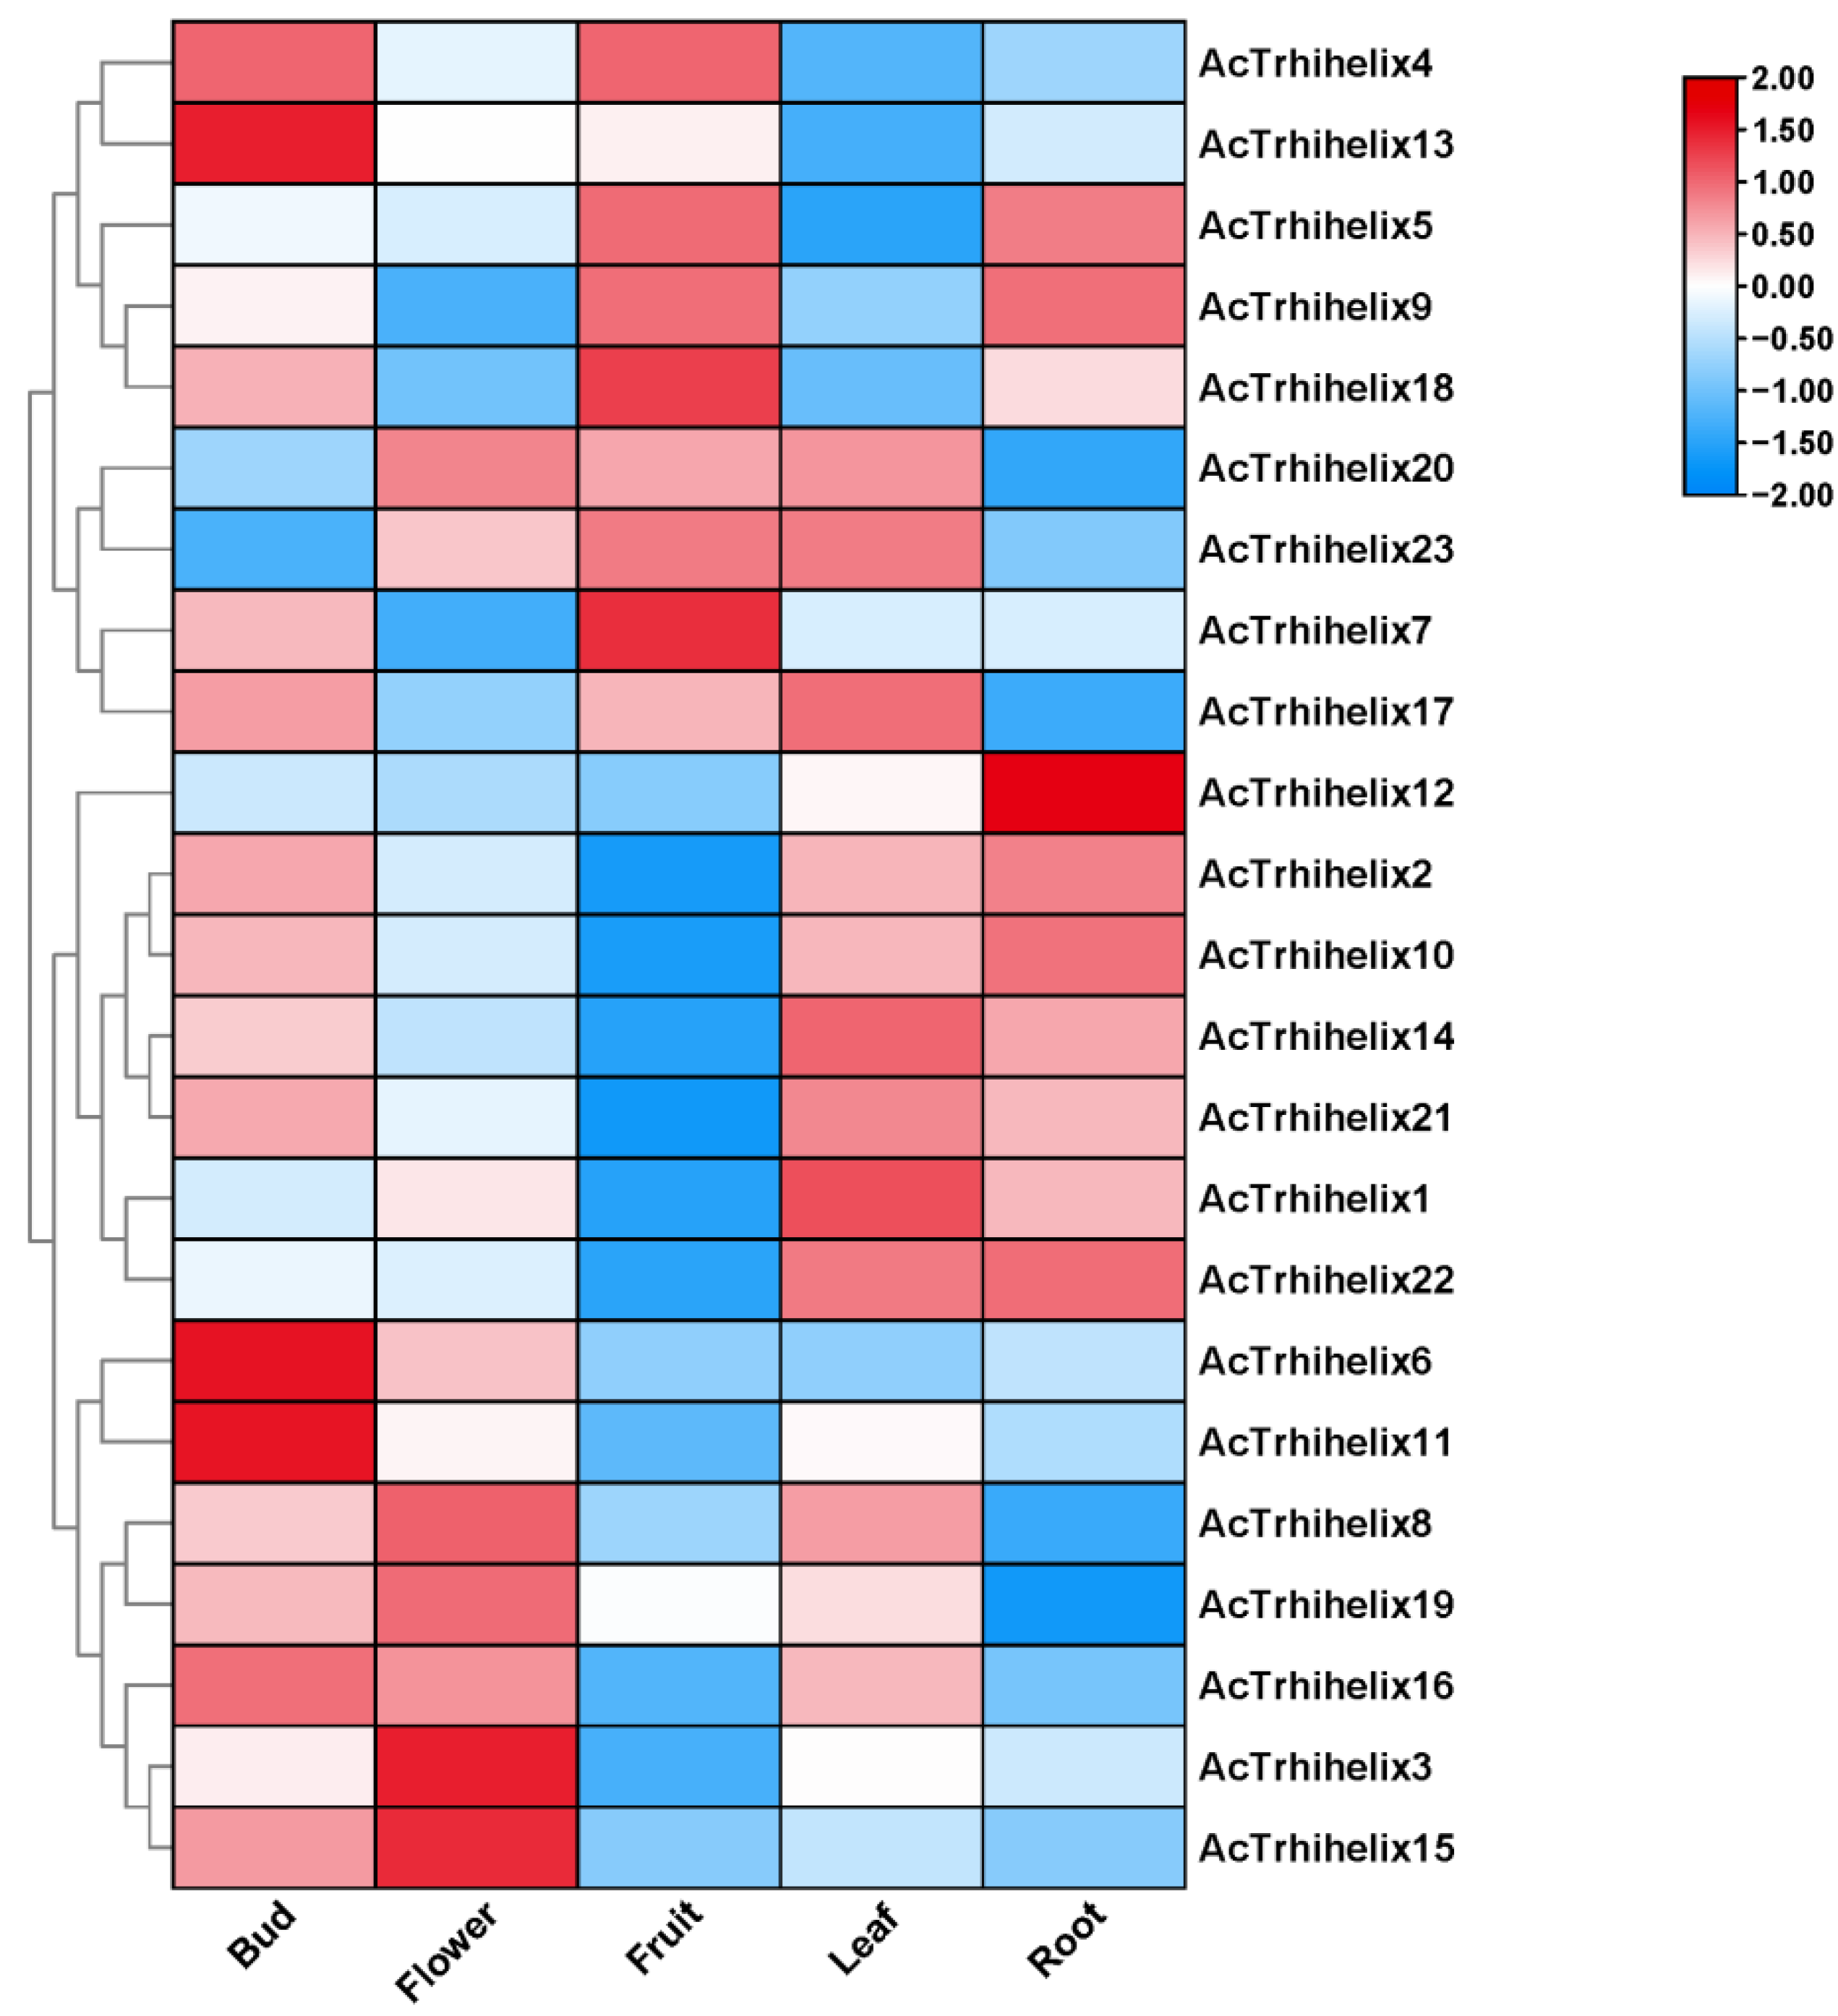
To explore the tissue specificity of the AcTrihelix genes, the transcriptome data of different pineapple tissues was used to analyze the expression characteristics of the AcTrihelix genes. Figure 6 shows that the expression characteristics of different AcTrihelix members had obvious tissue specificity. AcTrihelix6, AcTrihelix11, AcTrihelix13, and AcTrihelix16 were highly expressed in the bud, AcTrihelix7 and AcTrihelix18 were highly expressed in fruit, and AcTrihelix1 and AcTrihelix12 had much higher expression in the leaf and root, respectively. Notably, AcTrihelix3, AcTrihelix8, AcTrihelix15, and AcTrihelix19 were highly expressed in the pineapple flower, and the expressions of AcTrihelix16, AcTrihelix20, and AcTrihelix23 in the flower were also higher than the other AcTrihelix members (Figure 6, Table S2).

3.7. Expression Profiles of AcTrihelix in Flower Induction and Flowering Process in Pineapple

To further verify the role of AcTrihelix in flower formation, the expression characteristics of AcTrihelix in the different stages of pineapple after flower induction were analyzed, and the original data are shown in Table S3. As shown in Figure 7, the expression trends of the AcTrihelix genes were divided into two categories. One group mainly concentrated on the specific high expression in the late flower formation, while the other group mainly had their peak in the early stage. However, what interested us more was that these members had higher expression levels in the late stage of flower formation. The expression levels of six AcTrihelix members, including AcTrihelix3, AcTrihelix8, AcTrihelix16, AcTrihelix19, AcTrihelix20, and AcTrihelix23, were conspicuously increased with the flowering process, as their expressions reached their peak at 5 weeks after ethephon treatment (Figure 7). The fifth week after ethephon catalysis is a critical period for floral organ differentiation; thus, these six AcTrihelix members may play important roles in flower development.

3.8. Expression Profiles of AcTrihelix in Floral Tissue and Organ

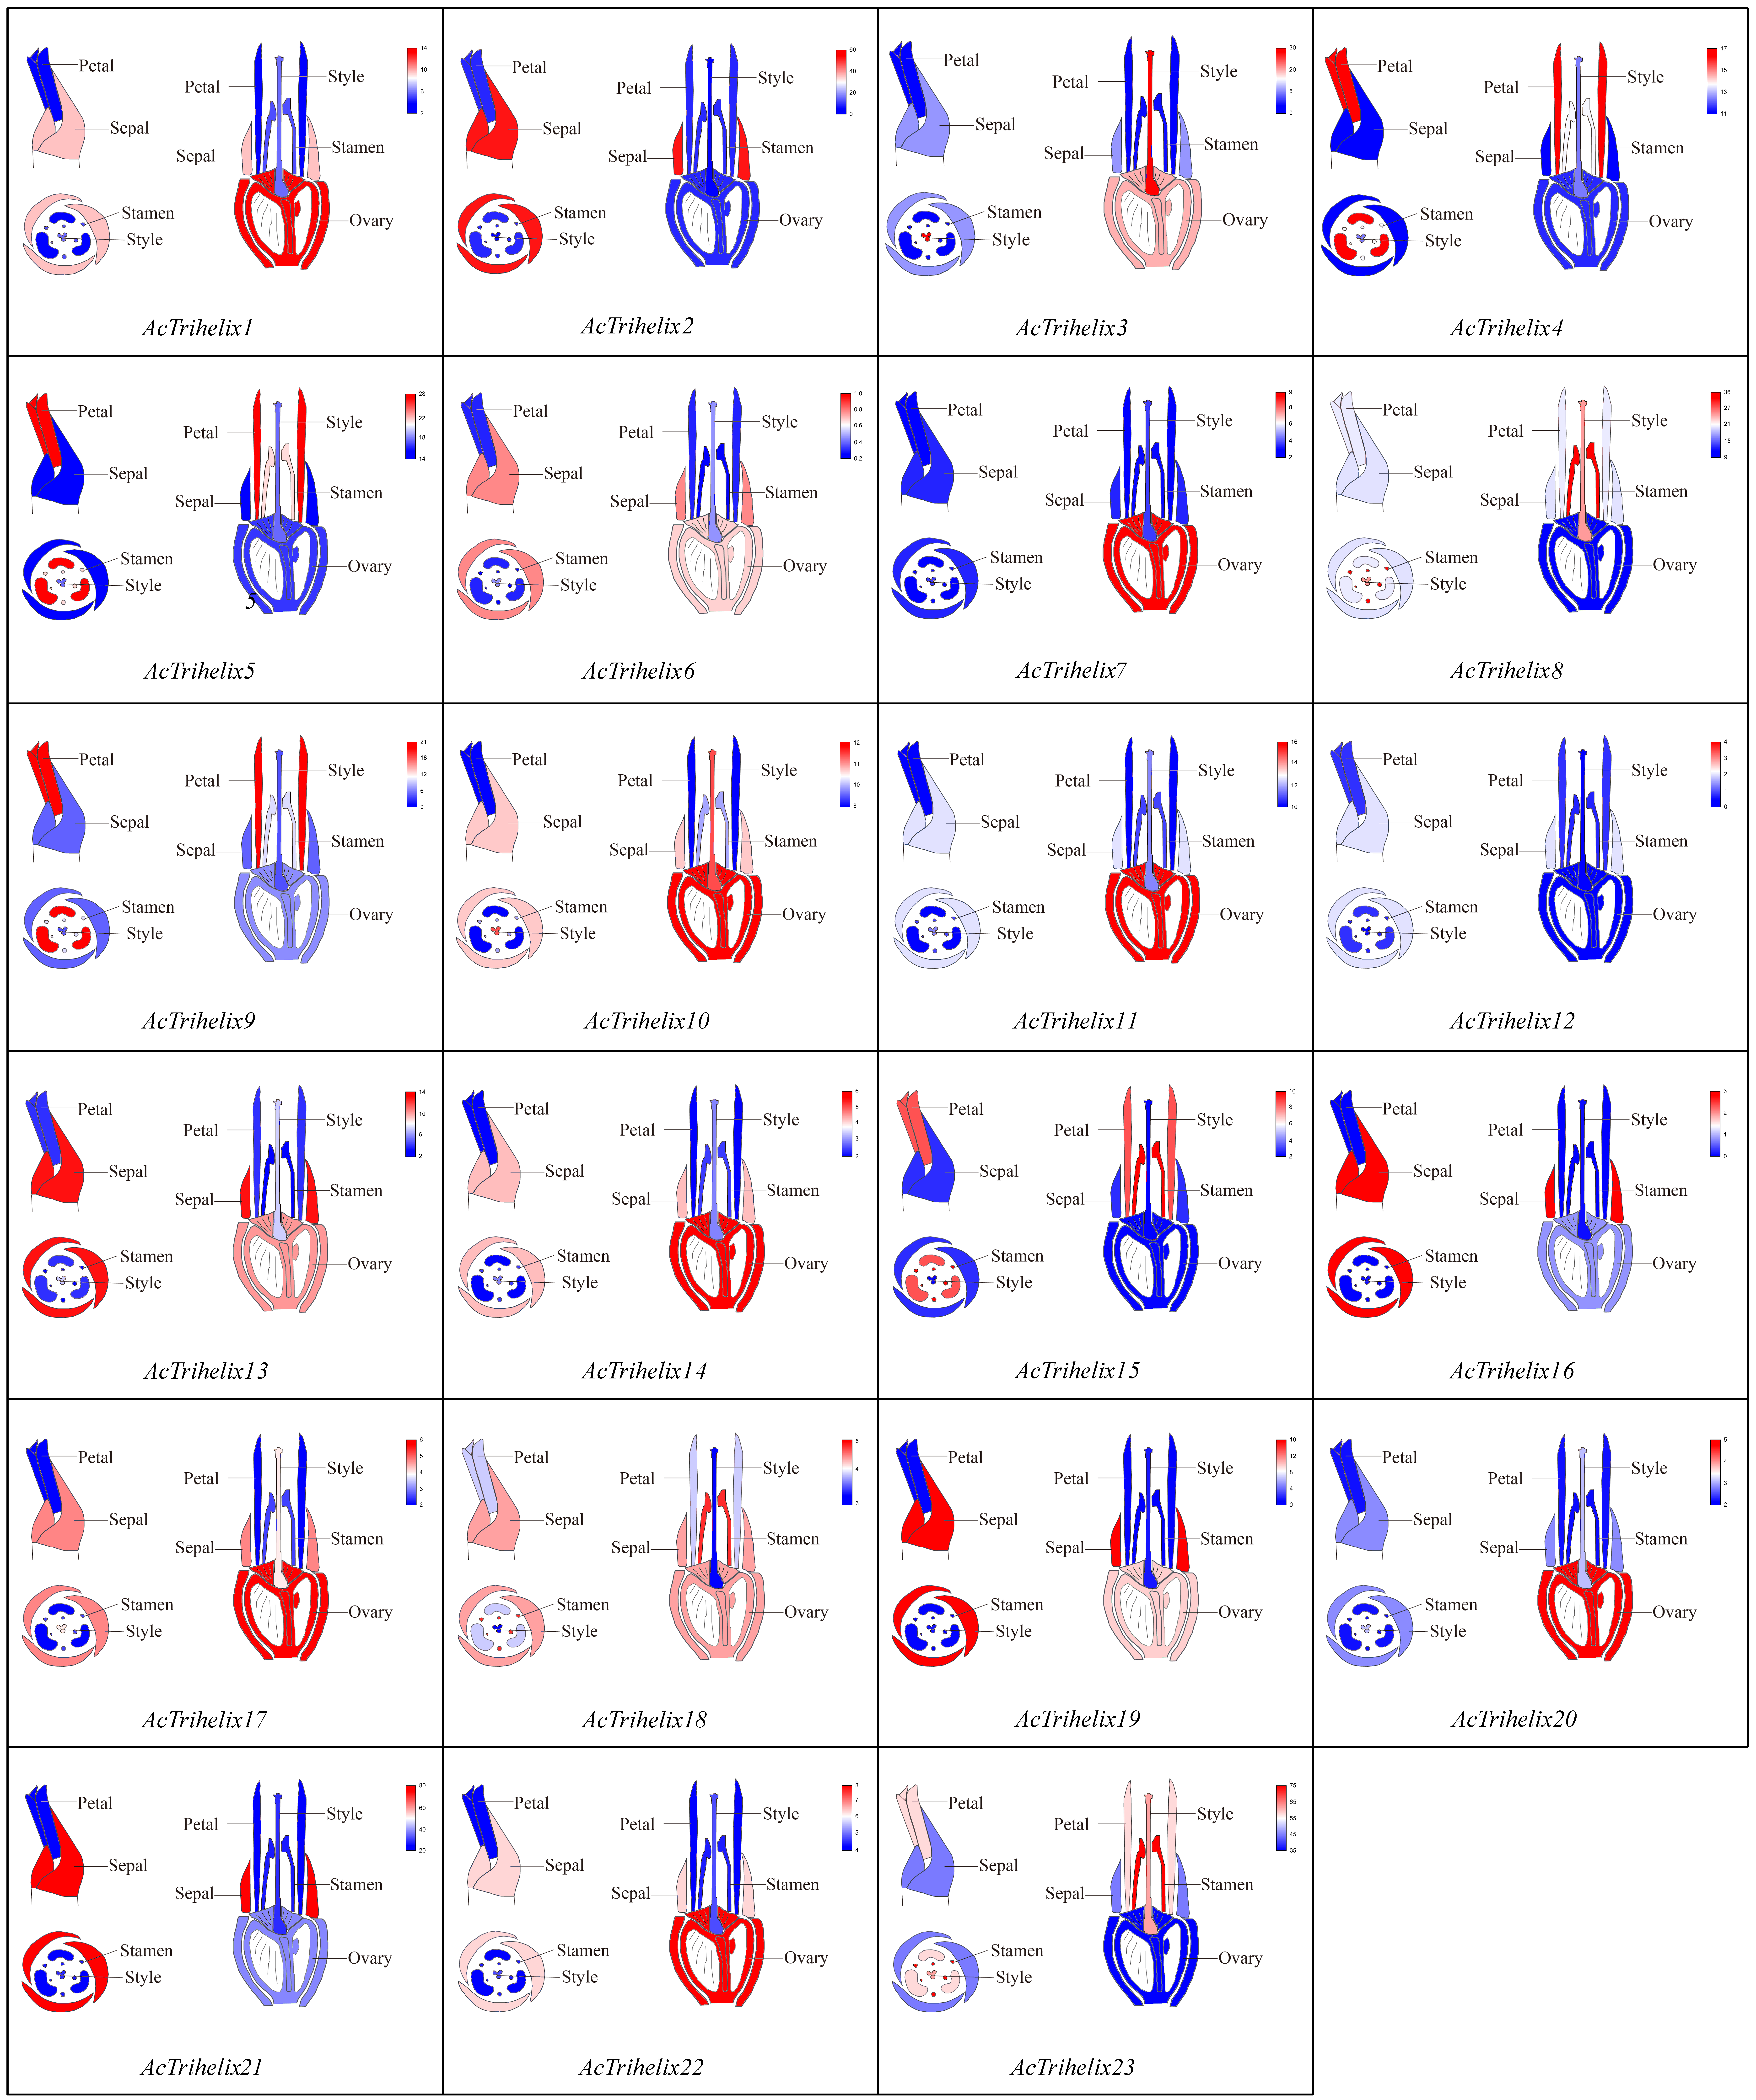
To further investigate the role of AcTrihelix in floral organ differentiation, the expression characteristics of AcTrihelix members in the different tissues of the flowering flowers were analyzed (Figure 8), and the original data are shown in Table S4. The expression levels of nine AcTrihelix members, including AcTrihelix1, AcTrihelix3, AcTrihelix7, AcTrihelix10, AcTrihelix11, AcTrihelix14, AcTrihelix17, AcTrihelix20, and AcTrihelix22, were significantly higher than the other parts in the ovary, and these members belonged to the SIP1 group except AcTrihelix7 and AcTrihelix11. Six AcTrihelix members, including AcTrihelix2, AcTrihelix6, AcTrihelix12, AcTrihelix13, AcTrihelix16, and AcTrihelix19, were obviously expressed higher in the sepal than in other tissues. In addition, seven members, i.e., AcTrihelix4, AcTrihelix5, AcTrihelix8, AcTrihelix9, AcTrihelix15, AcTrihelix18, and AcTrihelix23, had significant expressions in the stamen (Figure 8).

3.9. qRT-PCR Assays of the Expression Patterns of AcTrihelix in Flowering Process and Floral Organ

To further verify the expression features of Trihelix in flower development, six AcTrihelix members with high expression levels in late flower development were verified via qRT-PCR. After ethephon treatment, the expressions of AcTrihelix3, AcTrihelix8, AcTrihelix16, AcTrihelix19, AcTrihelix20, and AcTrihelix23 gradually increased and reached their peak at 5 weeks (Figure 9A). After 7 weeks of ethephon treatment, the floral organ differentiation of pineapple was completed. In different floral organs, the expression level of AcTrihelix3 was the highest in the style, while the transcription level of AcTrihelix16 in the sepal was much higher than that in the other parts of the floret. AcTrihelix8 was highly expressed in the stamen and petal, while AcTrihelix19 was highly expressed in the ovary and sepal. The expressions of AcTrihelix20 in the style, stamen, and sepal were higher than that in the petal and ovary, while AcTrihelix23 had higher transcriptional levels in the style, stamen, and petal (Figure 9B). Additionally, the expression patterns of most AcTrihelix members were consistent with the transcriptome results, indicating that the expression characteristics of these genes were accurate and reliable, and further confirmed the validity of our experimental results. In a word, some AcTrihelix family members may play important roles in floral organ development, but the tissue specificity of the different members greatly varied.

4. Discussion

Since the 1990s, when the Trihelix family was first discovered in pea (Pisum sativum), more species have been discovered in this family [1,2,32,33,34,35]. However, information about pineapple Trihelix genes is scarce and needs further exploration. In this study, 23 Trihelix members from pineapple were identified. The numbers of Trihelix in pineapple (23) were lower than that of Arabidopsis (30), Oryza sativa (41), Lycopersicon esculentum (36), Brassica Rapa (52), Glycine max (63), Fagopyrum tataricum (31), Sorghum bicolor (40), Phyllostachys edulis (24), Dendrobium officinale (32), and Helianthus annuus (31) [1,2,5,32,33,34,35,36,37,38]. Moreover, the evolutionary relationship and classification of the Trihelix family were obviously different among various species. In Arabidopsis, 30 Trihelix members were identified and divided into 5 groups including GT-1, GT-2, GTγ, SH4, and SIP1 [39]. In Oryza sativa, 41 Trihelix members were also classified into 5 subfamilies, but GT-1 and GT-2 were combined into a GT clade, and the GTδ group was added [1]. Thirty-six Trihelix members of Solanum lycopersicum were classified into six groups, five of which were the same as Arabidopsis, and the GTδ group was added [34]. The Trihelix family classification of Helianthus annuus was the same as Solanum lycopersicum [35]. According to their phylogenetic relationships with Trihelix proteins from Arabidopsis and pineapple (Figure 1), these genes were divided into five subfamilies, and each subgroup contained at least one protein from pineapple and Arabidopsis.
Each AcTrihelix member contained Motif1 located at the N-terminus of the amino acid sequence, which was supposed to be the Myb-type DNA-binding domain. These results were consistent with those observed for tomato, Oryza sativa, and sorghum [1,34,38]. Thus, the Trihelix family was highly conserved in the evolutionary process of different species. Furthermore, the similarity of the motif compositions of most AcTrihelix genes in each subfamily supported the results of the phylogenetic analysis. Gene families expand and evolve mainly through tandem and segmental duplications [40,41]. In this study, 23 Trihelix genes were unevenly distributed on 17 chromosomes among a total of 25 chromosomes in pineapple; they were involved in six fragment duplication events and one tandem duplication event (Figure 5A). These results showed that segmental duplication (8 Trihelix genes, 34.7%) contributed more to the increase in pineapple Trihelix membership than tandem repeat events. A similar phenomenon was also reported in the sorghum Trihelix gene families [38]. The rate of the Trihelix family’s replication events in pineapple was also higher than that in other species [1,38,42]. Most Trihelix members from the segmental duplication event were all linked within parallel subfamilies. Therefore, the segmental duplication type likely played a crucial role in the expansion of the Trihelix family members in pineapple.
Previous studies showed that the Trihelix family was widely involved in complex physiological functions, including the response to various stresses, plant growth, and development [7,8,9,10,11,12,13,14,15,16,17,18,19]. More and more functions of the Trihelix family have been identified and reported, but studies on Trihelix-regulated flower development have been rarely reported [19,43]. To obtain an overview of the Trihelix gene expression profiles, the expression patterns in the different stages of flower formation and floral organs were studied using the transcriptome data. To our surprise, we found that the expression of six AcTrihelix members increased sharply and reached a peak in the later stage of flower development (Figure 7). The same expression patterns of these six AcTrihelix genes were also verified using qRT-PCR. These results suggest that these candidate genes may be involved in flower organogenesis at the later stages of flower development. The results of the phylogenetic analysis showed that AcTrihelix8, AcTrihelix23, and PTL (At5g03680) were all classified into the GT-2 group, which suggested that these members may have similar functions in plant growth and development. In addition, the gene fragment duplication event between AcTrihelix8 and AcTrihelix23 also verified this. In Arabidopsis, the PTL gene (At5g03680) participates in regulating inflorescence development, inhibiting the growth of the prime sepals, and controlling the size of the sepals’ margins [2,16,17,43]. In addition, the loss of PTL function leads to a decrease in petal numbers. Thus, AcTrihelix8 and AcTrihhelix23 from the GT-2 group may play important roles in the morphogenesis of floral organs in pineapple.
After 5 weeks of ethephon treatment, the morphological differentiation of the flower began and the flower organs of pineapple gradually formed [44]. We further analyzed the expression levels of the Trihelix family in different flower organs and found that many AcTrihelix members exhibited obviously tissue-specific expressions in certain flower organs (Figure 8). In tomato, SLGT11 (Solyc03g006900) had specific expression in the stamen and carpel during the late stage of flower development, so it had functions in floral organ patterning and the maintenance of floral determinacy [19]. Cluster analysis showed that AcTrihliex5, AcTrihliex6, AcTrihliex15, and SLGT11 had close evolutionary relationships, which indicated that they may have similar biological functions (Figure S2). This hypothesis was also supported by the high expression of AcTrihliex15 in the stamen and petal in pineapple (Figure 8). In conclusion, these results provide important references for further studies on the biological functions of the AcTrihelix family and the molecular mechanisms of pineapple flower development.

5. Conclusions

In this study, 23 AcTrihelix members were identified from pineapple. The evolutionary relationship, cis-acting element, gene structure, conserved motif, chromosomal location, and gene replication, followed by the expression patterns in various tissues and the different phases of flower development were systematically analyzed. The expression analysis showed that the six AcTrihelix genes had tissue specificity and were highly expressed in the late stage of flower development. The expression characteristics of different AcTrihelix members showed obvious tissue specificities in the different tissues of flowers. Thereby, this study facilitates further studies of the functional characterization of the Trihelix family in the flower development of pineapple.

Supplementary Materials

The following supporting information can be downloaded at: https://www.mdpi.com/article/10.3390/horticulturae8100894/s1. Figure S1: Distribution of conserved motifs in pineapple AcTrihelix proteins. Figure S2: Phylogenetic analysis of Trihelix proteins between pineapple and Solanum lycopersicum. Table S1: List of primers used in this study. Table S2: Expression profile of AcTrihelix genes in different tissues of pineapple. Table S3: Expression profiles of AcTrihelix genes in flower induction and flowering process. Table S4: Expression profiles of AcTrihelix genes in floral tissue and organ.

Author Contributions

Writing—original draft preparation, J.W.; methodology, J.W. and Y.O.; data curation and software, J.W. and Y.O.; writing—review and editing, H.Z., Y.W. and J.K.; supervision: H.Z. and Y.W.; conceptualization, H.Z. and Y.W.; resources and investigation, X.Z.; funding acquisition: H.Z. All authors have read and agreed to the published version of the manuscript.

Funding

The project was funded by the National Key R&D Program of China (2019YFD1001105 and 2018YFD1000504), the National Natural Science Fund of China (31872079 and 32160687), the Natural Science Foundation of Hainan Province (321RC467), the major science and technology project of Hainan Province (ZDKJ2021014), and the Scientific Research Start-up Fund Project of Hainan University (KYQD-ZR-20090).

Institutional Review Board Statement

Not applicable.

Informed Consent Statement

Not applicable.

Data Availability Statement

The data are available on request from the corresponding author.

Conflicts of Interest

The authors declare that they have no conflict of interest.

References

  1. Li, J.M.; Zhang, M.H.; Sun, X.; Mao, X.; Wang, J.; Liu, H.L.; Zheng, H.L.; Zhen, Z.; Zhao, H.W.; Zou, D.T. Genome-Wide Characterization and Identification of Trihelix Transcription Factor and Expression Profiling in Response to Abiotic Stresses in Rice (Oryza sativa L.). Int. J. Mol. Sci. 2019, 20, 251. [Google Scholar] [CrossRef]
  2. Kaplan-Levy, R.N.; Brewer, P.B.; Quon, T.; Smyth, D.R. The trihelix family of transcription factors-light, stress and development. Trends Plant Sci. 2012, 17, 163–171. [Google Scholar] [CrossRef]
  3. Green, P.J.; Kay, S.A.; Chua, N.H. Sequence-specific interactions of a pea nuclear factor with light-responsive elements upstream of the rbcS-3A gene. EMBO J. 1987, 6, 2543–2549. [Google Scholar] [CrossRef] [PubMed]
  4. Nagano, Y. Several Features of the GT-Factor Trihelix Domain Resemble Those of the Myb DNA-Binding Domain. Plant Physiol. 2000, 124, 491–494. [Google Scholar] [CrossRef] [PubMed]
  5. Ma, Z.T.; Liu, M.Y.; Sun, W.J.; Huang, L.; Wu, Q.; Bu, T.L.; Li, C.L.; Chen, H. Genome-wide identification and expression analysis of the trihelix transcription factor family in tartary buckwheat (Fagopyrum tataricum). BMC Plant Biol. 2019, 19, 344. [Google Scholar] [CrossRef] [PubMed]
  6. Qin, Y.; Ma, X.; Yu, G.H.; Wang, Q.; Wang, L.; Kong, L.R.; Kim, W.; Wang, H.W. Evolutionary history of trihelix family and their functional diversification. Plant Physiol. 2000, 124, 491–493. [Google Scholar] [CrossRef] [PubMed]
  7. Xu, H.Y.; Shi, X.X.; He, L.; Guo, Y.; Zang, D.D.; Li, H.Y.; Zhang, W.H.; Wang, Y.C. Arabidopsis thaliana Trihelix Transcription Factor AST1 Mediates Salt and Osmotic Stress Tolerance by Binding to a Novel AGAG-Box and Some GT Motifs. Plant Cell Physiol. 2018, 59, 946–965. [Google Scholar] [CrossRef]
  8. Liu, X.S.; Wu, D.C.; Shan, T.F.; Xu, S.B.; Qin, R.Y.; Li, H.; Negm, M.; Wu, D.X.; Li, J. The trihelix transcription factor OsGTγ-2 is involved adaption to salt stress in rice. Plant Mol. Biol. 2020, 103, 545–560. [Google Scholar] [CrossRef]
  9. Fang, Y.J.; Xie, K.B.; Hou, X.; Hu, H.H.; Xiong, L.Z. Systematic analysis of GT factor family of rice reveals a novel subfamily involved in stress responses. Mol. Genet. Genom. 2010, 283, 157–169. [Google Scholar] [CrossRef]
  10. Xie, Z.M.; Zou, H.F.; Lei, G.; Wei, W.; Zhou, Q.Y.; Niu, C.F.; Liao, Y.; Tian, A.G.; Ma, B.; Zhang, W.K.; et al. Soybean Trihelix transcription factors GmGT-2A and GmGT-2B improve plant tolerance to abiotic stresses in transgenic Arabidopsis. PLoS ONE 2009, 4, e6898. [Google Scholar] [CrossRef] [Green Version]
  11. Yu, C.Y.; Song, L.L.; Song, J.W.; Ouyang, B.; Guo, L.J.; Shang, L.L.; Wang, T.T.; Li, H.X.; Zhang, J.H.; Ye, Z.B. ShCIGT, a Trihelix family gene, mediates cold and drought tolerance by interacting with SnRK1 in tomato. Plant Sci. 2018, 270, 140–149. [Google Scholar] [CrossRef] [PubMed]
  12. Park, H.C.; Kim, M.L.; Kang, Y.H.; Jeon, J.M.; Yoo, J.H.; Kim, M.C.; Park, C.Y.; Jeong, J.C.; Moon, B.C.; Lee, J.H.; et al. Pathogen- and NaCl-induced expression of the SCaM-4 promoter is mediated in part by a GT-1 box that interacts with a GT-1-like transcription factor. Plant Physiol. 2004, 135, 2150–2161. [Google Scholar] [CrossRef] [PubMed]
  13. Wang, R.; Hong, G.F.; Han, B. Transcript abundance of rml1, encoding a putative GT1-like factor in rice, is up-regulated by Magnaporthe grisea and down-regulated by light. Gene 2004, 324, 105–115. [Google Scholar] [CrossRef] [PubMed]
  14. Barr, M.; Willmann, M.R.; Jenik, P.D. Is there a role for trihelix transcription factors in embryo maturation? Plant Signal. Behav. 2012, 7, 205–209. [Google Scholar] [CrossRef]
  15. Gao, M.J.; Li, X.; Lui, X.; Lui, H.; Gropp, G.M.; Lydiate, D.D.; Wei, S.; Hegedus, D.D. ASIL1 is required for proper timing of seed filling in Arabidopsis. Plant Signal Behav. 2011, 6, 1886–1888. [Google Scholar] [CrossRef]
  16. Griffith, M.E.; Conceio, A.D.S.; Smyth, D.R. PETAL LOSS gene regulates initiation and orientation of second whorl organs in the Arabidopsis flower. Development 1999, 126, 5635–5644. [Google Scholar] [CrossRef]
  17. Brewer, P.B.; Howles, P.A.; Dorian, K.; Kristen, G.M.E.; Ishida, T.; Kaplan-Levy, R.N.; Kilinc, A.; Smyth, D.R. PETAL LOSS, a trihelix transcription factor gene, regulates perianth architecture in the Arabidopsis flower. Development 2004, 131, 4035–4045. [Google Scholar] [CrossRef]
  18. Li, X.; Qin, G.J.; Chen, Z.L.; Gu, H.Y.; Qu, L.J. A gain-of-function mutation of transcriptional factor PTL results in curly leaves, dwarfism and male sterility by affecting auxin homeostasis. Plant Mol. Biol. 2008, 66, 315–327. [Google Scholar] [CrossRef] [PubMed]
  19. Yang, L.L.; Qi, S.L.; Touqeer, A.; Li, H.Y.; Zhang, X.L.; Liu, X.F.; Wu, S. SlGT11 controls floral organ patterning and floral determinacy in tomato. BMC Plant Biol. 2020, 20, 562. [Google Scholar] [CrossRef]
  20. Xu, H.; Yu, Q.; Shi, Y.; Hua, X.; Tang, H.; Yang, L.; Ming, R.; Zhang, J. PGD: Pineapple Genomics Database. Hortic. Res. 2018, 5, 66. [Google Scholar] [CrossRef] [PubMed] [Green Version]
  21. Poole, R.L. The TAIR database. Methods Mol. Biol. 2007, 406, 179–212. [Google Scholar] [PubMed]
  22. Gasteiger, E.; Gattiker, A.; Hoogland, C.; Ivanyi, I.; Appel, R.D.; Bairoch, A. ExPASy: The proteomics server for in-depth protein knowledge and analysis. Nucleic Acids Res. 2003, 31, 3784–3788. [Google Scholar] [CrossRef] [PubMed]
  23. Yu, C.; Chen, Y.; Lu, C.; Hwang, J.K. Prediction of protein subcellular localization. Proteins 2006, 64, 643–651. [Google Scholar] [CrossRef] [PubMed]
  24. Kohli, D.K.; Bachhawat, A.K. CLOURE: Clustal Output Reformatter, a program for reformatting ClustalX/ClustalW outputs for SNP analysis and molecular systematics. Nucleic Acids Res. 2003, 31, 3501–3502. [Google Scholar] [CrossRef]
  25. Hall, B.G. Building phylogenetic trees from molecular data with MEGA. Mol. Biol. Evol. 2013, 30, 1229–1235. [Google Scholar] [CrossRef]
  26. Bailey, T.L.; Boden, M.; Buske, F.A.; Frith, M.; Grant, C.E.; Clementi, L.; Ren, J.; Li, W.W.; Noble, W.S. MEME SUITE: Tools for motif discovery and searching. Nucleic Acids Res. 2009, 37, W202–W208. [Google Scholar] [CrossRef]
  27. Lescot, M.; Déhais, P.; Thijs, G.; Marchal, K.; Moreau, Y.; Van de Peer, Y.; Rouzé, P.; Rombauts, S. PlantCARE, a database of plant cis-acting regulatory elements and a portal to tools for in silico analysis of promoter sequences. Nucleic Acids Res. 2002, 30, 325–327. [Google Scholar] [CrossRef]
  28. Chen, C.; Chen, H.; Zhang, Y.; Thomas, H.R.; Frank, M.H.; He, Y.; Xia, R. TBtools: An Integrative Toolkit Developed for Interactive Analyses of Big Biological Data. Mol. Plant 2020, 13, 1194–1202. [Google Scholar] [CrossRef]
  29. Rao, X.Y.; Huang, X.L.; Zhou, Z.C.; Lin, X. An improvement of the 2−ΔΔCT method for quantitative real-time polymerase chain reaction data analysis. Biostat. Bioinform. Biomath. 2013, 3, 71–85. [Google Scholar]
  30. Azam, S.M.; Liu, Y.H.; Rahman, Z.U.; Ali, H.; Yan, C.; Wang, L.L.; Priyadarshani, V.G.N.; Hu, B.Y.; Xiong, J.Y.; Qin, Y. Identification, Characterization and Expression Profiles of Dof Transcription Factors in Pineapple (Ananas comosus L). Trop. Plant Biol. 2018, 11, 49–64. [Google Scholar] [CrossRef]
  31. Lalitha, S. Primer premier 5. Biotech. Softw. Internet Rep. 2000, 1, 270–272. [Google Scholar] [CrossRef]
  32. Gao, H.Y.; Huang, R.; Liu, J.; Gao, Z.M.; Zhao, H.S.; Li, X.P. Genome-Wide Identification of Trihelix Genes in Moso Bamboo (Phyllostachys edulis) and Their Expression in Response to Abiotic Stress. J. Plant Growth Regul. 2019, 38, 1127–1140. [Google Scholar] [CrossRef]
  33. Tong, Y.; Huang, H.; Wang, Y.H. Genome-Wide Analysis of the Trihelix Gene Family and Their Response to Cold Stress in Dendrobium officinale. Sustainability 2021, 13, 2826. [Google Scholar] [CrossRef]
  34. Yu, C.Y.; Cai, X.F.; Ye, Z.B.; Li, H.X. Genome-wide identification and expression profiling analysis of trihelix gene family in tomato. Biochem. Biophys. Res. Commun. 2015, 468, 653–659. [Google Scholar] [CrossRef] [PubMed]
  35. Song, J.; Shen, W.Y.; Shaheen, S.; Li, Y.Y.; Liu, Z.R.; Wang, Z. Genome-wide identification and analysis of the trihelix transcription factors in sunflower. Biol. Plant. 2021, 65, 80–87. [Google Scholar] [CrossRef]
  36. Wang, W.; Peng, W.; Liu, T.K.; Ren, H.; Hou, X. Genome-wide analysis and expression divergence of the trihelix family in Brassica rapa: Insight into the evolutionary patterns in plants. Sci. Rep. 2017, 7, 6463. [Google Scholar] [CrossRef]
  37. Osorio, M.B.; Bücker-Neto, L.; Castilhos, G.; Turchetto-Zolet, A.C.; Wiebke-Strohm, B.; Bodanese-Zanettini, M.H.; Margis-Pinheiro, M. Identification and in silico characterization of soybean trihelix-GT and bHLH transcription factors involved in stress responses. Genet. Mol. Biol. 2012, 35, 233–246. [Google Scholar] [CrossRef]
  38. Li, K.L.; Zhang, Y.B.; Shi, M.X.; Chen, S.S.; Yang, M.F.; Ding, Y.Q.; Peng, Y.S.; Dong, Y.B.; Yang, H.; Li, Z.H.; et al. Genome-wide identification and expression profile analysis of trihelix transcription factor family genes in response to abiotic stress in sorghum [Sorghum bicolor (L.) Moench]. BMC Genom. 2021, 22, 738. [Google Scholar] [CrossRef]
  39. Gao, M.J.; Lydiate, D.J.; Li, X.; Lui, H.; Gjetvaj, B.; Hegedus, D.D.; Rozwadowski, K. Repression of seed maturation genes by a trihelix transcriptional repressor in arabidopsis seedlings. Plant Cell 2009, 21, 54–71. [Google Scholar] [CrossRef]
  40. Paterson, A.H.; Freeling, M.; Tang, H.; Wang, X. Insights from the comparison of plant genome sequences. Annu. Rev. Plant Biol. 2010, 61, 349–372. [Google Scholar] [CrossRef]
  41. Cannon, S.B.; Mitra, A.; Baumgarten, A.; Young, N.D.; May, G. The roles of segmental and tandem gene duplication in the evolution of large gene families in Arabidopsis thaliana. BMC Plant Biol. 2004, 4, 10. [Google Scholar] [CrossRef] [PubMed] [Green Version]
  42. Liu, W.; Zhang, Y.; Li, W.; Lin, Y.; Wang, C.; Xu, R.; Zhang, L.F. Genome-wide characterization and expression analysis of soybean trihelix gene family. PeerJ 2020, 8, e8753. [Google Scholar] [CrossRef] [PubMed]
  43. Quon, T.; Lampugnani, E.R.; Smyth, D.R. PETAL LOSS and ROXY1 Interact to Limit Growth within and between Sepals but to Promote Petal Initiation in Arabidopsis thaliana. Front. Plant Sci. 2017, 8, 152. [Google Scholar] [CrossRef]
  44. Zhang, H.; Pan, X.; Liu, S.; Lin, W.Q.; Li, Y.H.; Zhang, X.M. Genome-wide analysis of AP2/ERF transcription factors in pineapple reveals functional divergence during flowering induction mediated by ethylene and floral organ development. Genomics 2020, 113, 474–489. [Google Scholar] [CrossRef] [PubMed]
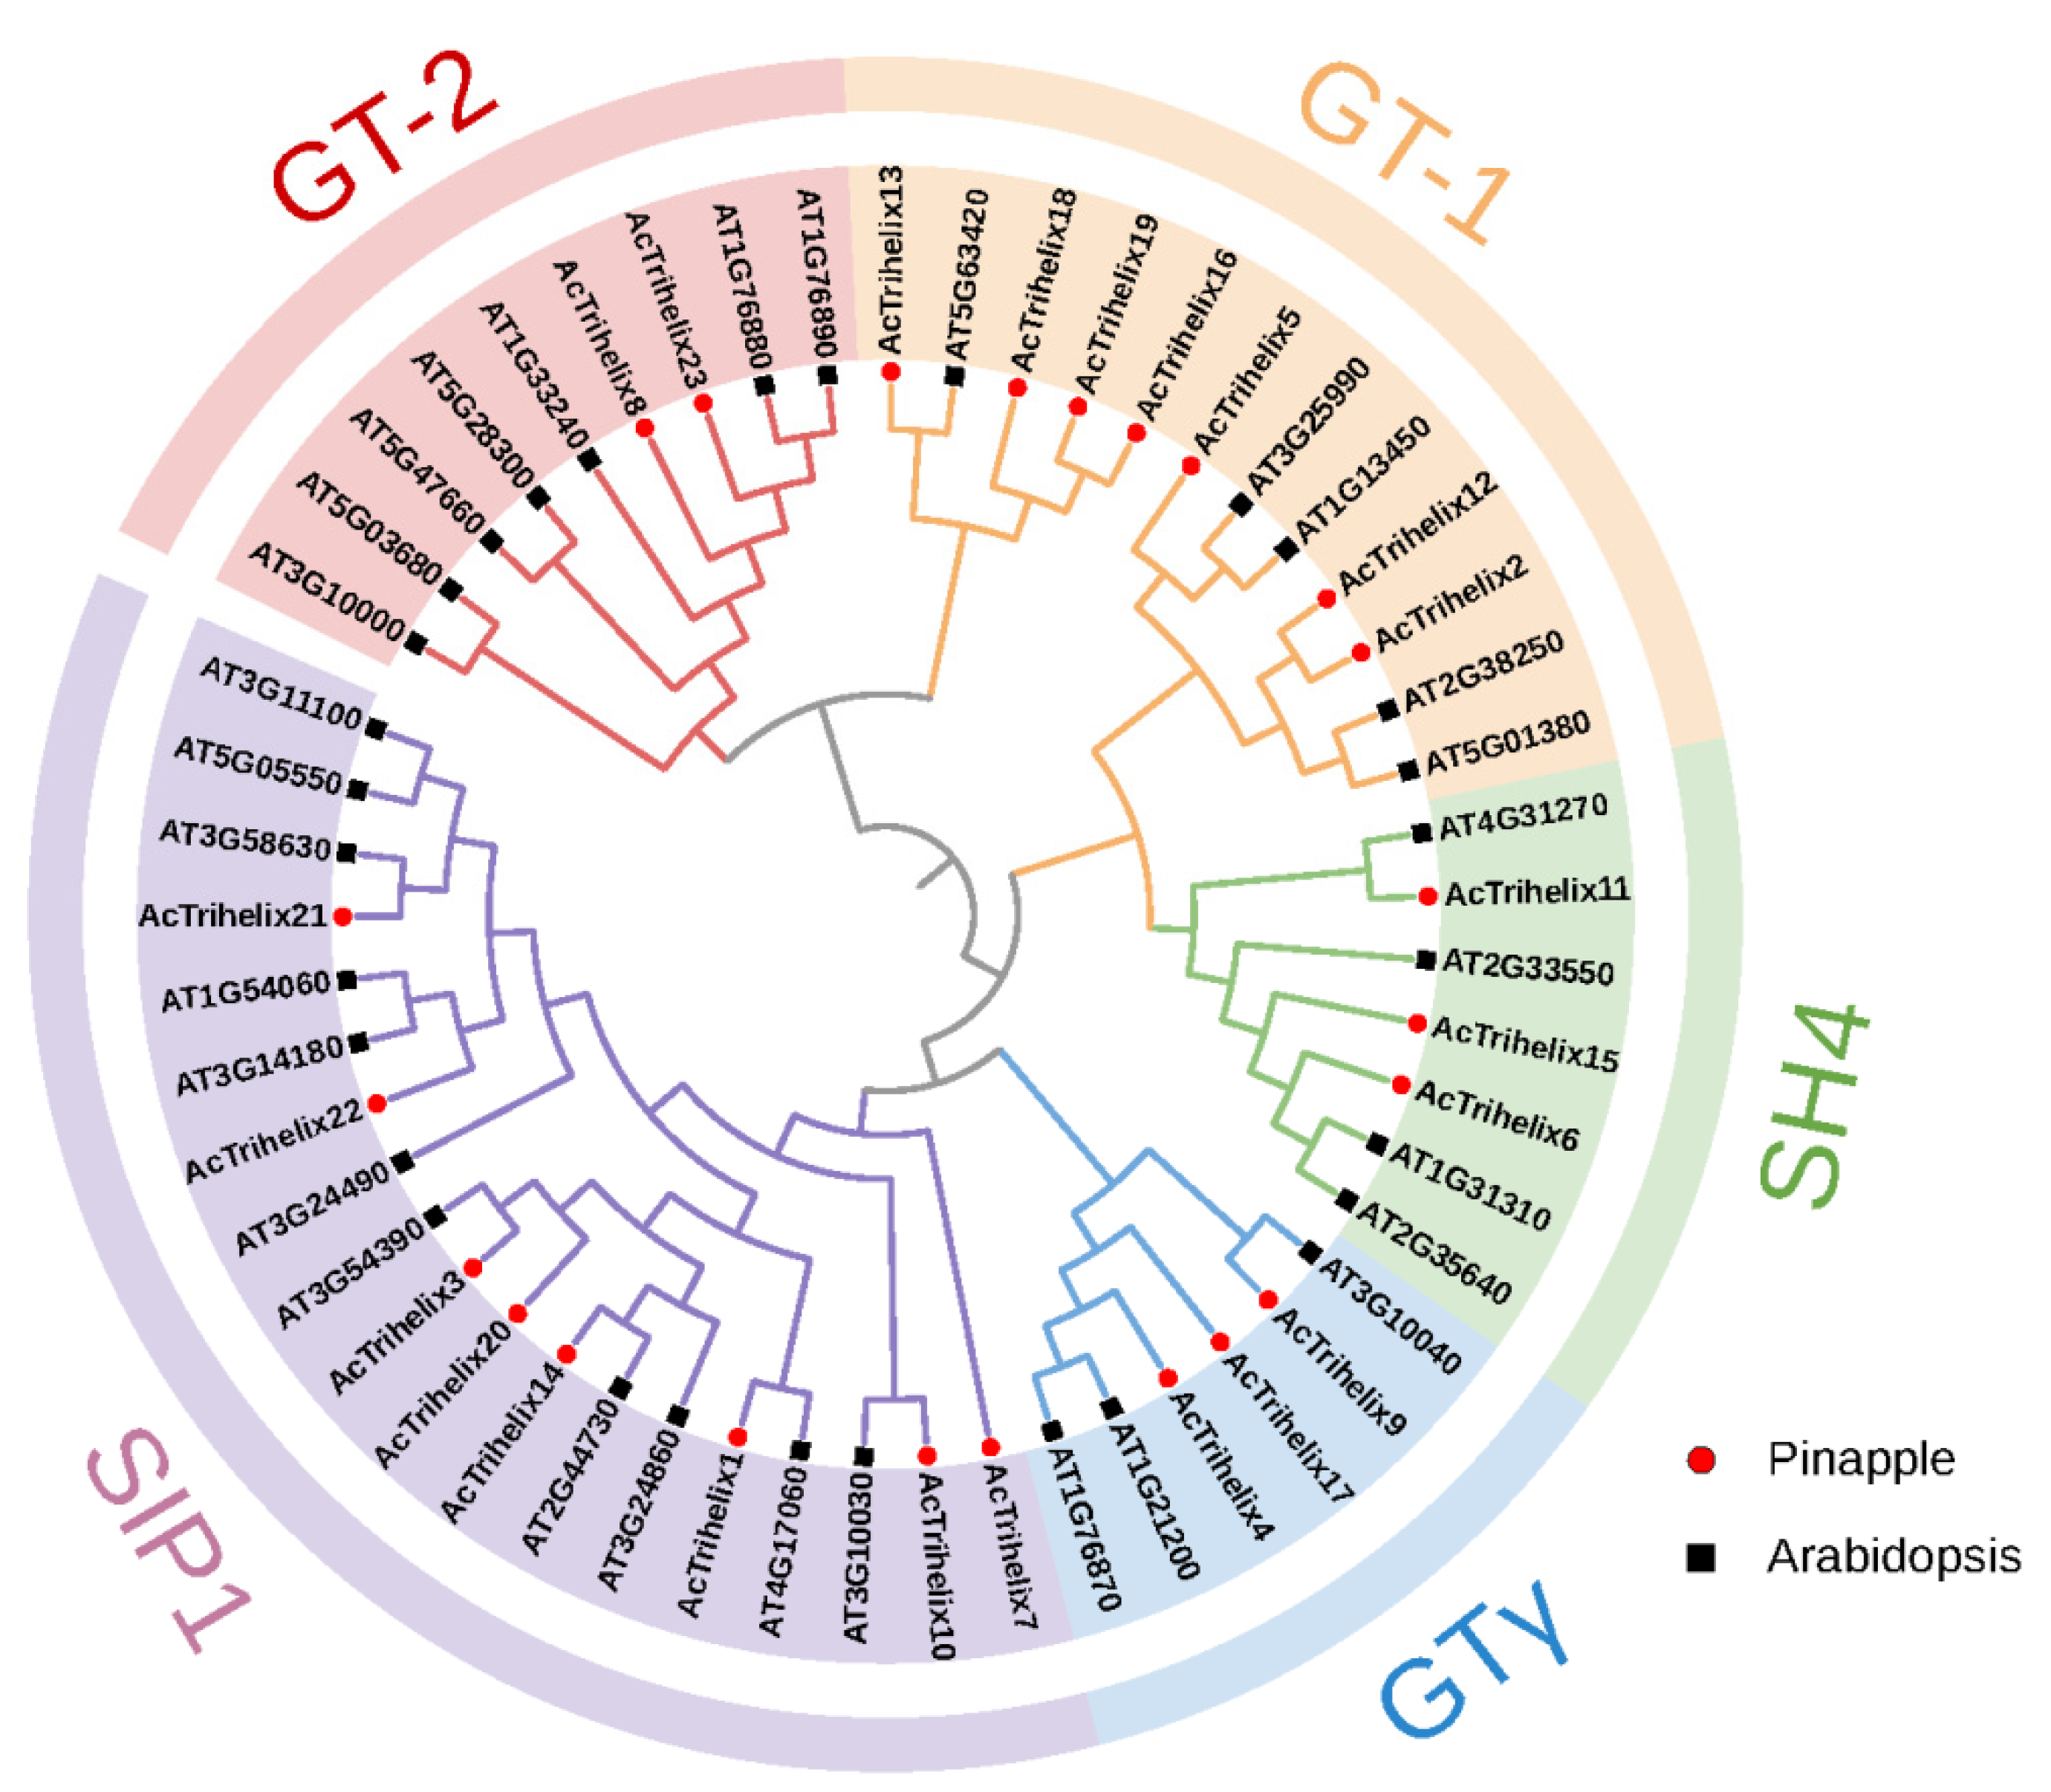
Figure 1. The phylogenetic analysis of Trihelix proteins between pineapple and Arabidopsis. The phylogenetic tree was made using MEGA 6.0 program. (neighbor-joining method, bootstrap value = 1000).
Horticulturae 08 00894 g001
Figure 2. Phylogenetic relationships and gene structures of the 23 AcTrihelix genes: (A) neighbor-Joining tree analysis of Trihelix family in pineapple; (B) the distributions of the predicted motifs in the AcTrihelix proteins; (C) gene structures of pineapple Trihelix family. The yellow icon means UTR (untranslated region), the green icon means CDS (coding sequence), and the line between UTR and CDS means intron (a noncoding part of a gene or mRNA molecule).
Horticulturae 08 00894 g002
Figure 3. cis-element analysis of AcTrihelix promoters: (A) the cis-element analysis of Trihelix promoter region; (B) the numbers of different types of elements of AcTrihelix promoters were counted and are indicated by different colors; (C) the pie chart shows the proportion of each cis-element of the four types of response elements.
Horticulturae 08 00894 g003
Figure 4. Distribution of AcTrihelix genes in pineapple chromosomes, showing that 23 AcTrihelix genes were distributed on 17 chromosomes. The yellow vertical bars represent the chromosomes (Chr) in pineapple genome. The left scale bar is the length of the chromosome.
Horticulturae 08 00894 g004
Figure 5. Duplication analysis and synlinearity analysis: (A) duplicate analysis of AcTrihelix gene in pineapple; (B) synteny analysis of AcTrihelix gene between pineapple and other plants (Arabidopsis and grape, rice and banana). The red line represents the homologous gene pairs.
Horticulturae 08 00894 g005
Figure 6. Expression profile of AcTrihelix genes in different tissues of pineapple. The labels of the X-axis represent the different organs of the pineapple. The Y-axis refers to the deduced FPKM value normalized with Log2.
Horticulturae 08 00894 g006
Figure 7. Expression profile of AcTrihelix genes in flower induction and flowering process. The labels Bud-0h, Bud-1w, Bud-5w, and Bud-7w on the X-axis represent the time (0 h, 1 week, 3 weeks, 5 weeks, and 7 weeks) after ethephon treatment. The number represents the three biological replicates of each sample. The Y-axis refers to the deduced FPKM value normalized with Log2.
Horticulturae 08 00894 g007
Figure 8. The expression of AcTrihelix genes in different floral organs. The red module represents high expression of tissues, and the blue module shows low expression. The patterns of expression were visualized with TBtools.
Horticulturae 08 00894 g008
Figure 9. qRT-PCR validation of six AcTrihelix genes involved in flowering regulation: (A) relative expression levels of AcTrihelix genes in flower induction and flowering process. The labels Bud-0h, Bud-1w, Bud-5w, and Bud-7w on the X-axis represent the time (0 h, 1 week, 3 weeks, 5 weeks, and 7 weeks) after ethephon treatment. The Y-axis indicates the relative expression level of each gene; (B) the expression level of AcTrihelix genes in different floral organs. The values are presented as the mean ± SE (n = 3).
Horticulturae 08 00894 g009
Table 1. Trihelix gene family identified in pineapple (Ananas comosus).
Gene NameGene IDProtein/AAMW (kDa)pIInstability IndexGRAVYSubcellular
Localization
AcTrihelix1Aco001232.131035.375.2267.04−1.11N
AcTrihelix2Aco001562.131837.377.1776.45−1.23N
AcTrihelix3Aco002322.130633.898.7846.02−0.86N
AcTrihelix4Aco003181.144450.896.0352.11−0.93N
AcTrihelix5Aco003514.141447.306.1056.72−0.83N
AcTrihelix6Aco005017.133538.138.8262.67−1.03N
AcTrihelix7Aco005686.136342.404.8271.97−1.37N
AcTrihelix8Aco007563.167773.098.8472.72−0.91N
AcTrihelix9Aco007761.155960.945.4266.22−0.95N
AcTrihelix10Aco007763.170376.766.5441.54−0.58N
AcTrihelix11Aco008315.135639.378.4152.18−0.84N
AcTrihelix12Aco011052.120324.609.2190.86−1.36N
AcTrihelix13Aco011421.187897.278.9242.96−0.31N
AcTrihelix14Aco011649.149053.0311.3374.69−0.43N
AcTrihelix15Aco012997.142746.4610.7497.54−0.85N
AcTrihelix16Aco013248.160764.266.7666.99−0.61N
AcTrihelix17Aco015633.140344.505.5548.58−0.96N
AcTrihelix18Aco017242.11179129.666.2553.97−0.23Pla
AcTrihelix19Aco017510.155759.588.7268.35−0.62N
AcTrihelix20Aco018180.146050.389.2857.04−0.86N
AcTrihelix21Aco021658.138042.099.7652.18−0.74N
AcTrihelix22Aco023568.144548.577.1472.58−1.12N
AcTrihelix23Aco024437.176681.195.5773.19−0.87N
Note: N, nucleus; Pla, plasma membrane.
Publisher’s Note: MDPI stays neutral with regard to jurisdictional claims in published maps and institutional affiliations.