Article

Integrated Volatile Metabolomics and Transcriptomics Analyses Reveal the Influence of Infection TuMV to Volatile Organic Compounds in Brassica rapa

1
State Key Laboratory of North China Crop Improvement and Regulation, Institute of Vegetables and Flowers, Chinese Academy of Agricultural Sciences, Beijing 100081, China
2
State Key Laboratory of North China Crop Improvement and Regulation, Department of Horticulture, Hebei Agricultural University, Baoding 071000, China
*
Authors to whom correspondence should be addressed.
These authors contributed equally to this work.
Horticulturae 2022, 8(1), 57; https://doi.org/10.3390/horticulturae8010057
Submission received: 29 November 2021 / Revised: 24 December 2021 / Accepted: 5 January 2022 / Published: 8 January 2022
(This article belongs to the Special Issue Advances in Brassica Crops Genomics and Breeding)

Abstract

:
Turnip mosaic virus (TuMV), which is distributed almost all over the world and has a wide range of hosts, mainly brassica crops, was first described in Brassica rapa in the USA. Plant volatile compounds play an important role in the host searching behavior of natural enemies of herbivorous insects. In this study, TuMV-inoculated resistant and susceptible B. rapa lines were tested using volatile metabolome and transcriptome analyses. In volatile metabolome analysis, the volatile organic compounds (VOCs) were different after inoculation with TuMV in resistant B80124 and susceptible B80461, and the degree of downregulation of differentially expressed metabolites was more obvious than the degree of upregulation. Through transcriptome analysis, 70% of differentially expressed genes were in biological process, especially focusing on defense response, flavonoid biosynthetic process, and toxin metabolic process, which indicates that TuMV stress maybe accelerate the increase of VOCs. Integrating the metabolome and transcriptome analyses, after inoculating with TuMV, auxin regulation was upregulated, and ARF, IAA and GH3 were also upregulated, which accelerated cell enlargement and plant growth in tryptophan metabolism. The different genes in zeatin biosynthesis pathways were downregulated, which reduced cell division and shoot initiation. However, the metabolite pathways showed upregulation in brassinosteroid biosynthesis and α-linolenic acid metabolism, which could cause cell enlargement and a stress response. This study determined the difference in volatiles between normal plants and infected plants and may lay a foundation for anti-TuMV research in B. rapa.

Graphical Abstract

1. Introduction

Turnip mosaic virus (TuMV), which is distributed almost all over the world and has a wide range of hosts, mainly brassica crops, belongs to the Potyviridae family. TuMV is one of the most prevalent viruses and is threatening brassica vegetables around the world, especially in Europe, Asia, and North America [1,2,3]. Therefore, TuMV has become a model for potyvirus–host interactions [3]. TuMV-diseased brassica crops show various symptoms, including the development of a mosaic pattern, shrinking, slight leaf stunting, mottling, chlorosis or spotting, and in the late stages of infection, severe stunting, chlorosis, necrosis, non-heading or unwound heading, and withering of the entire plant [4]. Moreover, TuMV caused a loss of 30% in Brassica napus production in Canada [5], as well as seed yield losses of up to 70% in B. napus in the UK [6] and 50% reductions in B. oleracea (cabbage) head production in Kenya [7].
In addition, plants suffer from numerous pathogens and herbivore challenges in both natural and agricultural environments and often face multiple simultaneous threats [8]. Most plant viruses need mediators to transmit viruses, and insects are the most important type of mediators. Most of these vectors are hemipterans, which are a group of phloem-feeding insects, such as aphids, planthoppers, and whiteflies [9]. Aphids are the main transmission vector of TuMV among brassica plants. Special volatiles are released after plants are attacked by insects. Aphids mainly use host volatiles to identify hosts through their olfactory systems [10]. Therefore, there are more studies on plant volatiles. Plant volatile compounds can be divided into plant- and pest-induced volatiles according to the presence or absence of pest induction. The volatile odor components of plants are affected by season, plant age, physiological conditions, microorganisms, and environmental factors, such as soil and light. In addition, changes due to mechanical damage and pest feeding occur frequently.
Plant volatiles are often mixed with a variety of substances, and volatiles with different components and concentrations can be recognized by specific insects; therefore, plant volatiles are chemical signals for host recognition by herbivorous insects. They affect the host selection behavior of herbivorous insects [11,12]. Plant volatile compounds play an important role in the host selection of herbivorous insects. When brassica crops are harmed by herbivorous insects, they release plant volatiles that are different from those in healthy periods to regulate the relationship among brassica plants, herbivorous insects, and natural enemy insects. Allyl isothiocyanates released by cruciferous plants have a strong attractive effect on Diaeretiella rape, and the sinigrin released by these plants is a chemical clue for aphids to find hosts [13].
Plant volatile compounds play an important role in the host searching behavior of natural enemies of herbivorous insects. The composition and content of volatiles released by plants change significantly after plants are attacked by herbivorous insects. For example, terpene biosynthesis is suppressed in begomovirus–infected plants, leading to reduced plant resistance and enhanced whitefly (Bemisia tabaci) performance, enabling virus transmission [14]. The behavioral responses of different herbivorous insects to herbivore-induced plant volatiles (HIPVs) are different. When some plants are injured and release HIPVs, it will induce the healthy parts of the same plant and adjacent plants to release HIPVs, to reduce the damage caused by insect pests. In this study, TuMV-inoculated resistant/susceptible lines were tested by metabolome and transcriptome analyses to determine the difference in volatiles between normal plants and infected plants and may lay a foundation for anti-TuMV research in B. rapa.

2. Materials and Methods

2.1. Plant Materials

B80124 is a TuMV-resistant Chinese cabbage line, and B80461 is a TuMV-susceptible line. B80124-CK and B80461-CK were not inoculated with TuMV, while B80124 and B80461 were inoculated with TuMV. Three plants from each line were mixed into a sample and placed in a 15-mL cryopreservation tube. Six biological replicates were conducted in GC-MS test. Fresh plant materials were harvested, weighed, immediately frozen in liquid nitrogen, and stored at −80 °C until further use. Samples were ground to a powder in liquid nitrogen.

2.2. Detection of TuMV Resistance in Brassica rapa

The TuMV C4 isolate was used in this study, which was maintained on susceptible cultivar ‘113′ fresh leaves at −80 °C. The second and third true leaves were mechanically inoculated with TuMV-C4 at the third true leaf stage [15]. Resistance (the absence of systemic spread) was assessed 20 d post-inoculation with an enzyme-linked immunosorbent assay (ELISA) on the non-inoculated fourth and fifth leaves [15]. ELISA reagents were purchased from Agdia Inc. (Elkhart, IN, USA), and an ELx808 microplate reader (BioTek, Winusky, VT, USA) was used to measure absorbance at 405 nm. Segregation data were analyzed by the Chi-square test for goodness of fit.

2.3. Material Cultivation

In September 2020, the materials were planted in a 7×7 nutrient bowl in an insect-proof net in an artificial climate room. The temperature during the day was 20 °C–25 °C, and the temperature at night was 15 °C–19 °C. The humidity was about 60%. Plants were thoroughly watered, and aphids were controlled regularly.

2.3.1. TuMV Inoculation

Plants were inoculated with TuMV following our previous study [16], and the specific steps were as follows: when the third true leaf of the test material was fully expanded, a thin layer of emery was evenly sprayed on the front of the second and third leaves of the expanded plant; 1 g of TuMV-C4 infected leaves was ground in a high-temperature sterilized mortar and 4 mL phosphate buffer (0.05 mol/L, pH = 7.0) was added. Evenly ground samples were immediately used for inoculation. The TuMV homogenate was gently applied in the direction of the leaf veins; inoculation was repeated three times. Immediately after inoculation, the leaves were rinsed with clean water and shaded for 24 h. The inoculation was repeated 1 d after the first inoculation. The temperature during the day was controlled at 25 °C–28 °C, and the temperature at night was controlled at 20 °C–22 °C to cause the disease to develop. TuMV resistance identification was conducted after 3 weeks.

2.3.2. TuMV-ELISA Test

The TuMV-ELISA reagent test kit and positive control were purchased from Agdia, USA. This test was performed according to the manufacturer’s instructions. Detailed steps for TuMV-ELISA testing are provided in Supplementary Materials.

2.3.3. Isolation and Concentration of Volatiles

Volatiles were detected by MetWare (http://www.metware.cn/, accessed on 21 August 2021) based on the Agilent 8890-5977B platform. Six replicates of each assay were performed. One gram or 1 mL of the sample was transferred immediately to a 20-mL head-space vial (Agilent, Palo Alto, CA, USA), containing NaCl saturated solution, to inhibit any enzyme reaction. The vials were sealed using crimp-top caps with TFE-silicone headspace septa (Agilent). At the time of SPME analysis, each vial was placed at 60 °C for 10 min; then, a 65 µm divinylbenzene/carboxen/polydimethylsiloxane fiber (Supelco, Bellefonte, PA, USA) was exposed to the headspace of the sample for 20 min at 60 °C.
GC-MS conditions. After sampling, desorption of the VOCs from the fiber coating was conducted in the injection port of the GC apparatus (Model 8890; Agilent) at 250 °C for 5 min in splitless mode. The identification and quantification of VOCs was conducted using an Agilent Model 8890 GC and a 5977B mass spectrometer (Agilent), equipped with a 30 m × 0.25 mm × 0.25 μm DB-5MS (5% phenyl-polymethylsiloxane) capillary column. Helium was used as the carrier gas at a linear velocity of 1.0 mL/min. The injector temperature was kept at 250 °C and the detector at 280 °C. The oven temperature was programmed from 40 °C (5 min), increasing at 5 °C/min to 280 °C, and held for 5 min. Mass spectra were recorded in electron impact (EI) ionization mode at 70 eV. The quadrupole mass detector, ion source, and transfer line temperatures were set at 150 °C, 230 °C, and 280 °C, respectively. Mass spectra were scanned in the range m/z 30–350 amu at 1-s intervals. Identification of volatile compounds was achieved by comparing the mass spectra with the data system library (MWGC) and linear retention index.
PCA. Unsupervised PCA was performed by the function ‘prcomp’ within R (www.r-project.org/, accessed on 21 August 2021). The data were unit variance scaled before unsupervised PCA.
Hierarchical Cluster Analysis and Pearson Correlation Coefficients. Hierarchical cluster analyses (HCA) of samples and metabolites were presented as heatmaps with dendrograms, while Pearson correlation coefficients (PCC) between samples were calculated by the ‘cor’ function in R and presented as heatmaps. Both HCA and PCC were conducted using the R package ‘pheatmap.’ For HCA, normalized signal intensities of metabolites (unit variance scaling) were visualized as a color spectrum.
Selection of Differential Metabolites. Significantly differentially regulated metabolites between groups were determined by VIP ≥ 1 and absolute Log2FC (fold change) ≥ 1. VIP values were extracted from OPLS-DA, which also contained score plots and permutation plots, and were generated using the R package ‘MetaboAnalystR.’ The data were log transformed (log2) and mean centered before OPLS-DA. To avoid overfitting, a permutation test (200 permutations) was performed.
KEGG Annotation and Enrichment Analysis Identified metabolites were annotated using the KEGG compound database (http://www.kegg.jp/kegg/compound/, accessed on 21 August 2021). Annotated metabolites were then mapped to the KEGG pathway database (http://www.kegg.jp/kegg/pathway.html, accessed on 21 August 2021). Pathways with significantly regulated metabolites were then imported into MSEA (metabolite sets enrichment analysis), and their significance was determined by hypergeometric test p-values.

2.3.4. RNA Extraction and Library Construction

This experiment used the TRIzol reagent method to extract total RNA and Agilent 2010 to detect the quality of the obtained RNA. The cDNA library was constructed on the qualified RNA samples, and the fragment size and concentration of the library were detected by an Agilent 2100 Bioanalyzer. Sequencing was performed by combinatorial Probe-Anchor Synthesis (cPAS), and a sequencing read length of 150 bp was obtained.
  • Data Analyses
The FASTQ Trimmer was used to filter the sequencing data, check the error rate, and check the GC content distribution to obtain clean reads. HISAT2 was used to compare the clean reads after quality control with the cabbage reference genome to obtain the position information on the reference genome or gene and the unique sequence feature information of the sequenced sample.

3. Results

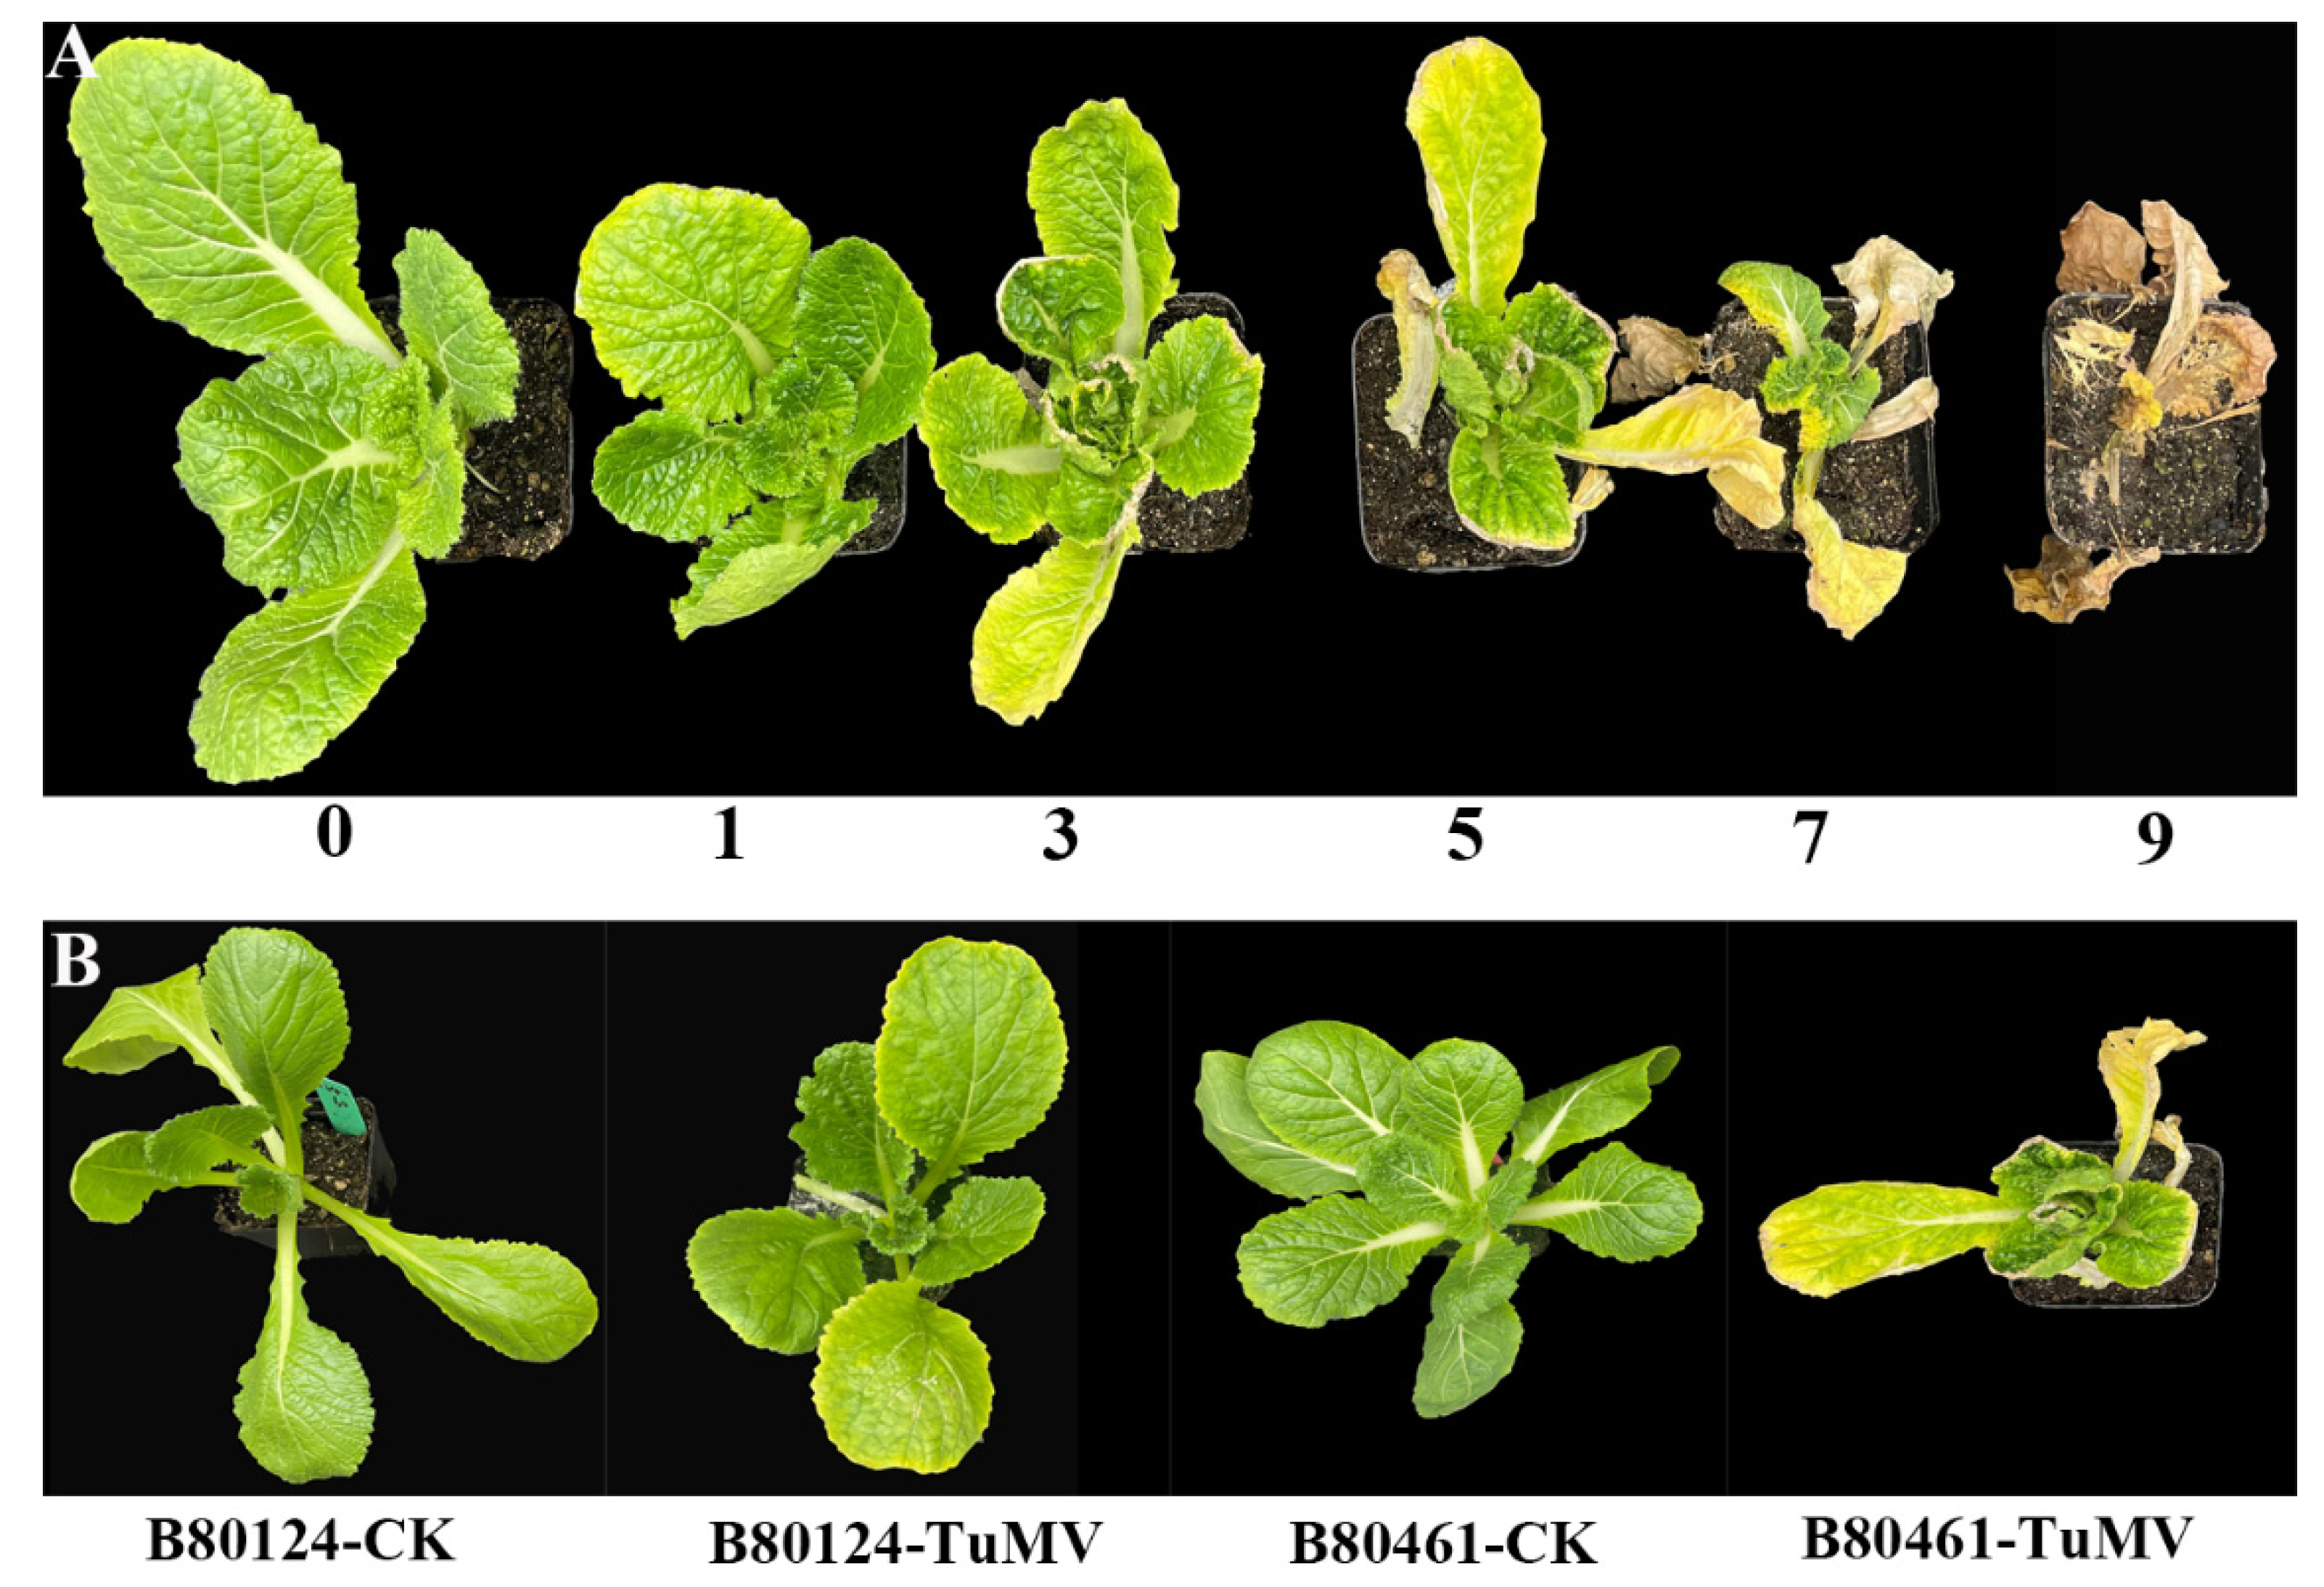
3.1. Phenotype Analysis of Resistance and Susceptibility to TuMV in B. rapa

‘B80124′ and ‘B80461′ lines were planted in the greenhouse, and the leaves were inoculated with TuMV at the three-leaf stage. Plants with the same growth status were selected and placed in no-insect nets numbered ‘B80124-CK’ and ‘B80461-CK’. After 20 d, the resistance index was calculated by phenotype analysis and enzyme linked immunosorbent assay (ELISA) methods. From the phenotype analysis, the resistant index was divided into six ranks, i.e., 0, 1, 3, 5, 7, and 9 (Figure 1A), and according to the ELISA instructions, the resistant index was divided into positive (susceptible) and negative (resistant). Samples with an O.D. value higher than two times the healthy average were positive, and samples with an OD value below two times the healthy average were negative. (OD value = the OD405 value of the sample/the OD405 value of the healthy average). The average OD405 values of the healthy plants were 0.180. Through the two methods of analysis, the B80124 line was resistant (OD value = 0.235), and the B80461 line was susceptible (OD value = 4.360) (Figure 1B). The OD405 values of the samples are shown in Table S1.

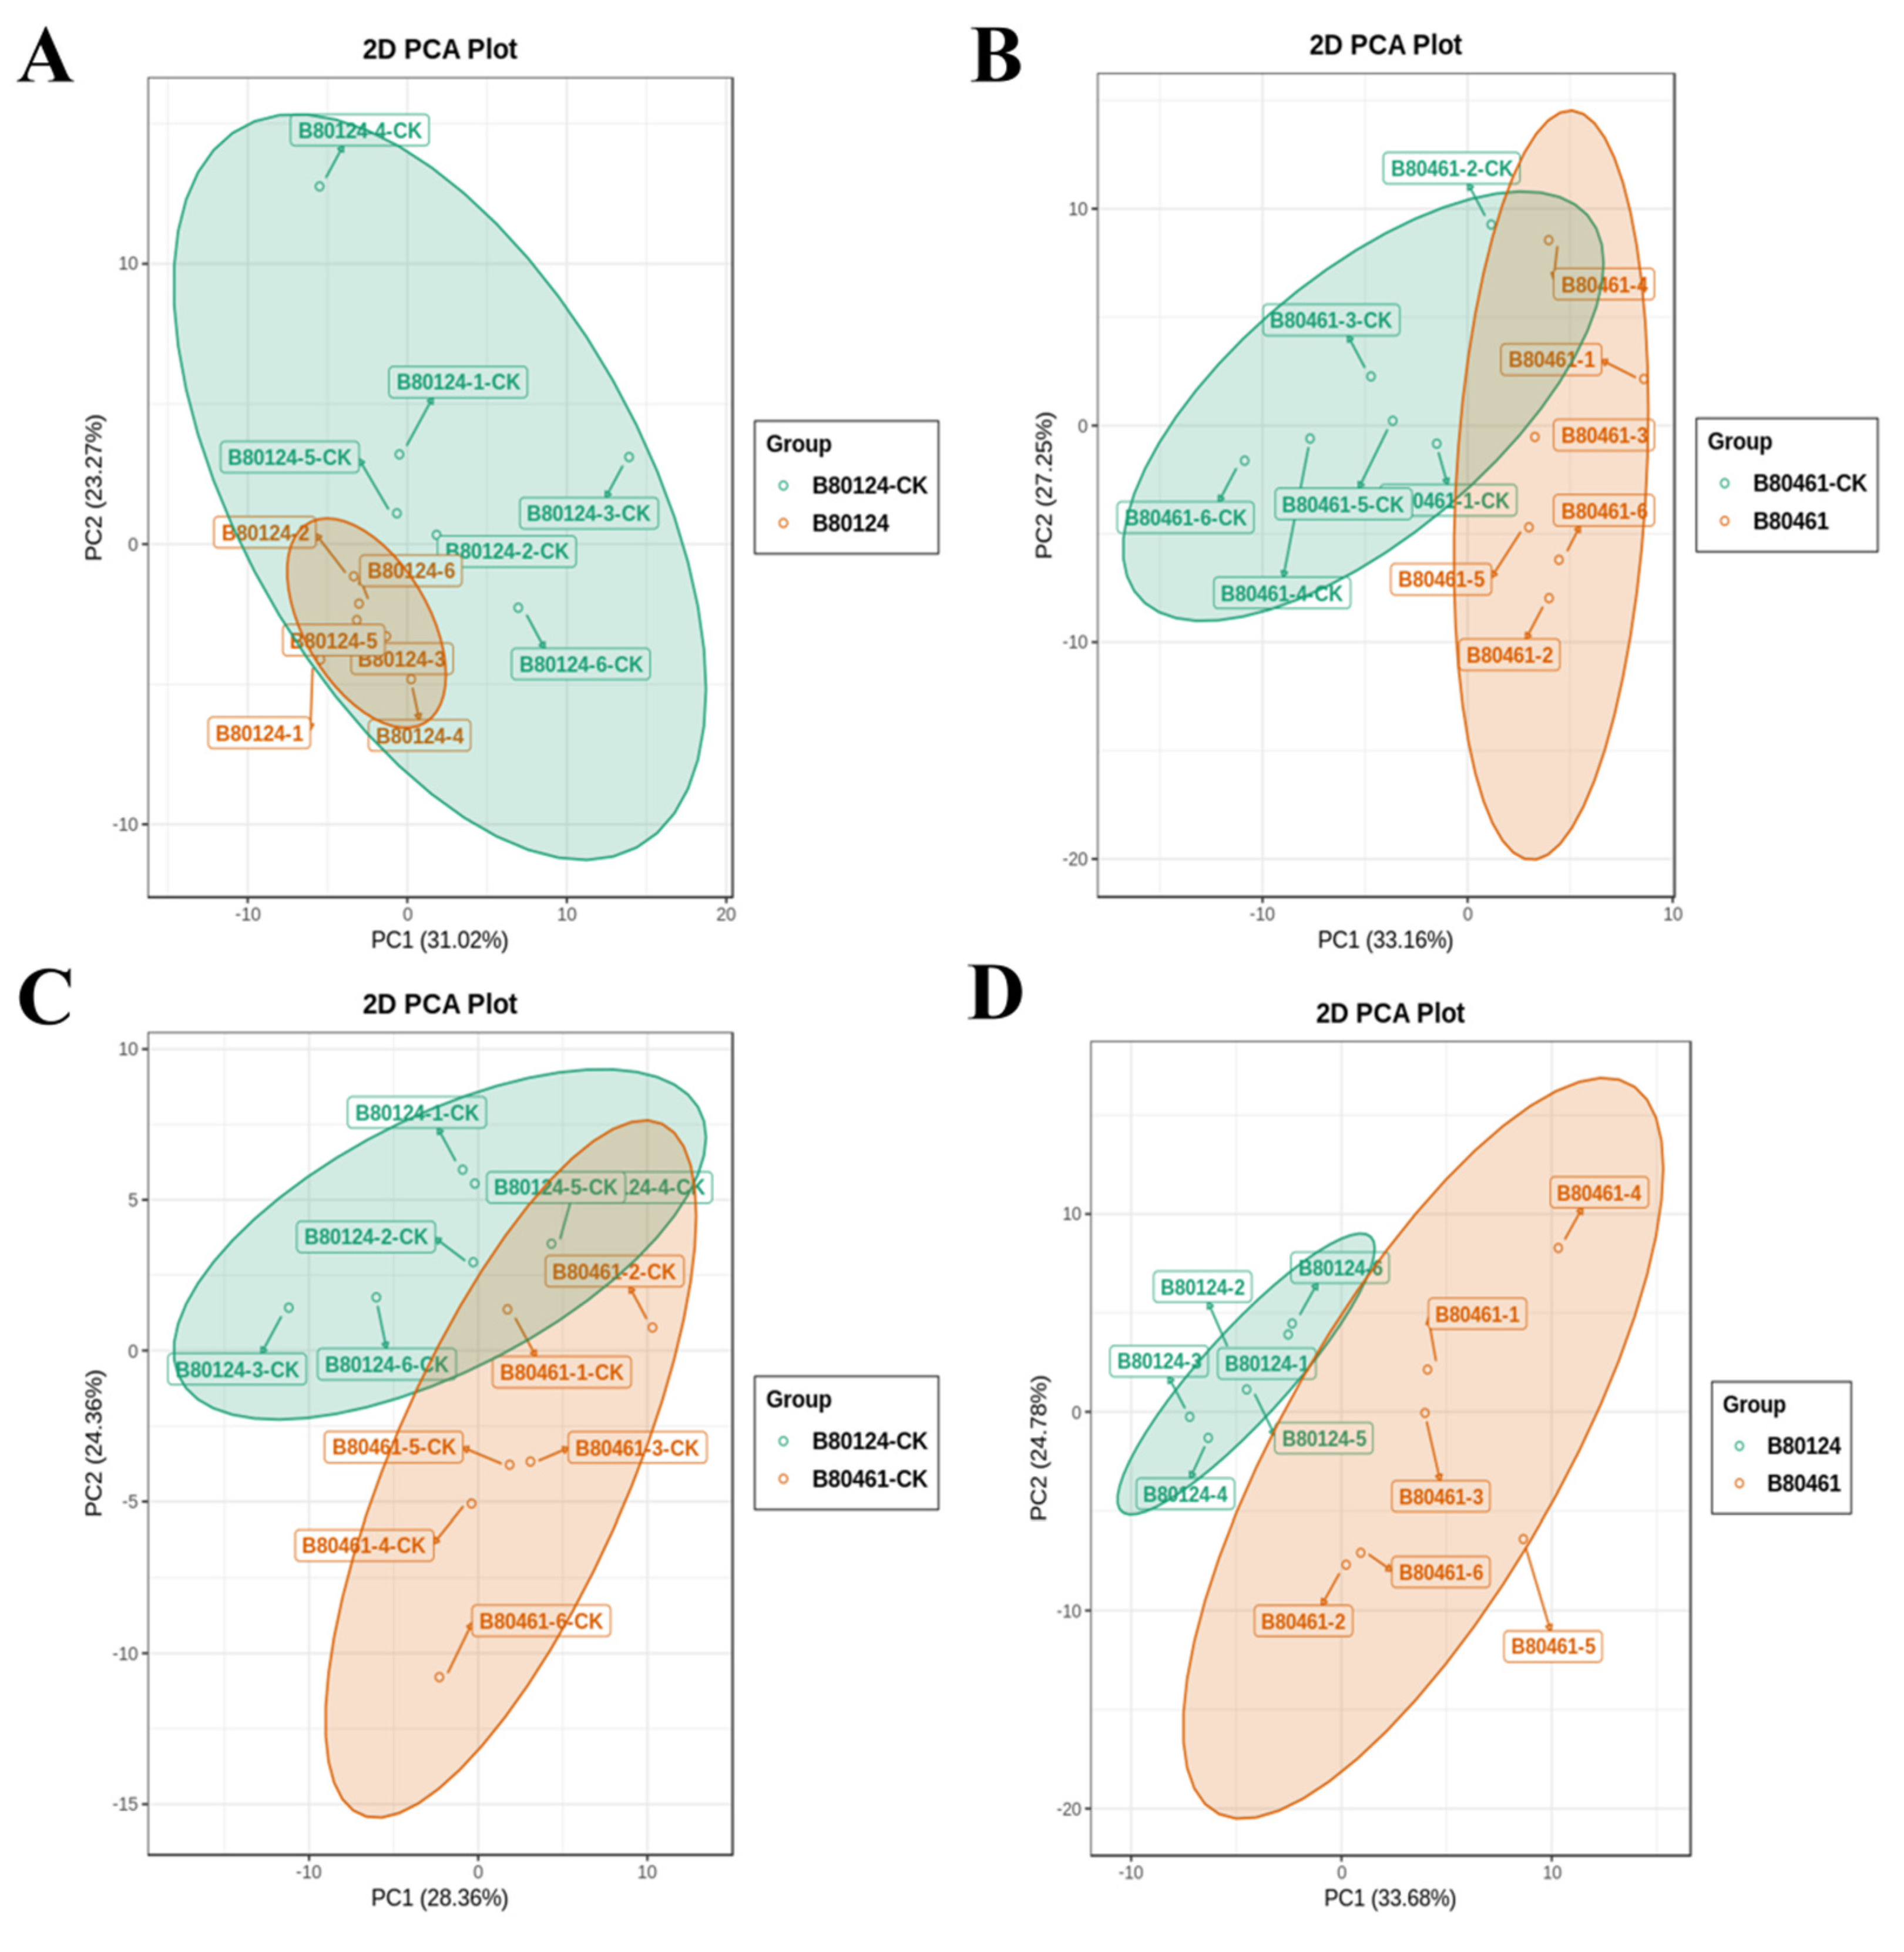
3.2. Volatile Metabolome Analysis of Volatile Organic Compound Accumulation in B. rapa

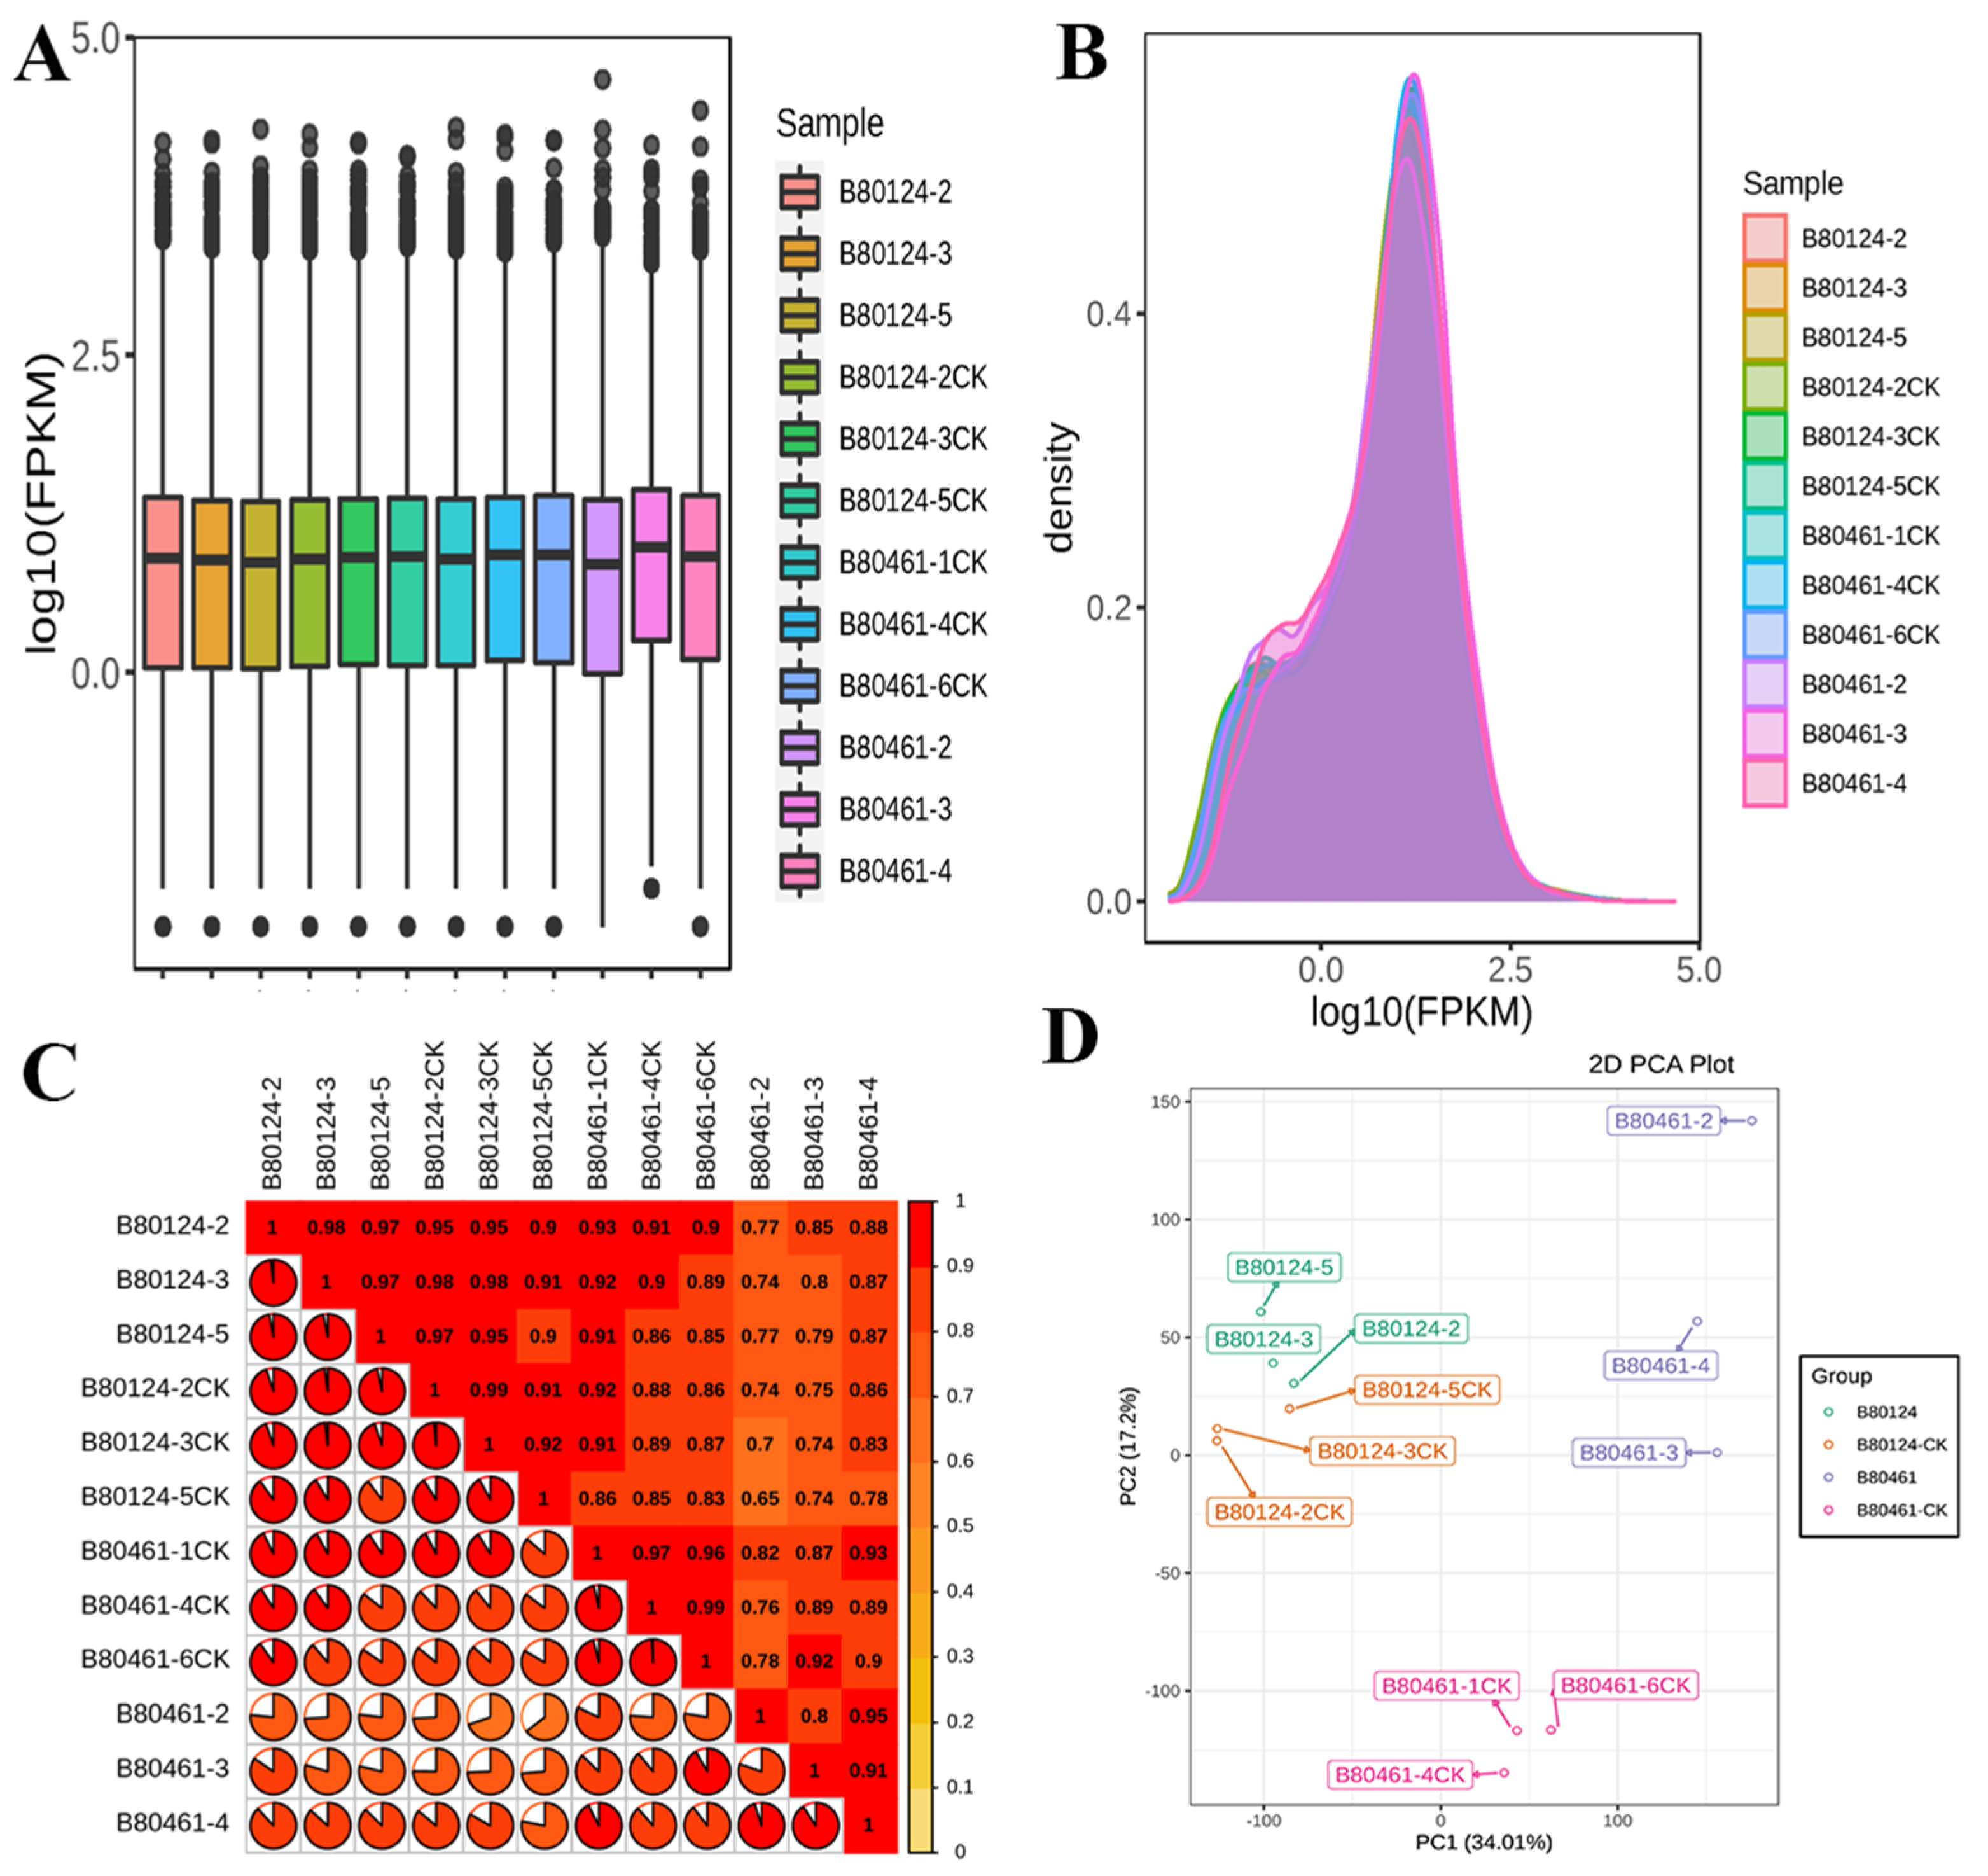
3.2.1. The Volatile Organic Compound Data Quality

GC-MS analysis was used to obtain the volatile organic compounds (VOCs). Three methods, namely, total ion current (TIC), principal component analysis (PCA), and cluster analysis, were used to control the data quality. TIC analysis of different quality control (QC) samples showed that the curves of the total ion flow detected by metabolites had high overlap; that is, the retention time and peak intensity were consistent, indicating that the signal stability was good when the same sample was detected at different times by mass spectrometry (Figure S1A). In addition, PCA is a multi-dimensional data statistical analysis method for unsupervised pattern recognition. Through orthogonal transformation, a set of potentially correlated variables from B80124 and B80461 were converted into a set of linearly uncorrelated variables, indicating that the volatile metabolome data are reliable (Figure S1B). Furthermore, cluster analysis is a multivariate statistical analysis method for classification. Individuals, objects, and subjects were classified according to the four lines B80124-CK, B80124, B80461-CK, and B80461, so that individuals within the same category had a high homogeneity, and each category had a high heterogeneity, which infers that the volatile metabolome analysis is within reasonable limits (Figure S1C). The cluster analysis of different GC-MS samples is shown in Figure S2.
Before analysis, PCA was conducted on the group samples to observe the degree of variation between groups and between samples within groups. The principal components from B80124-CK completely contained those from B82104, which indicated that after inoculation with TuMV, changes to the principal components were not observed in the highly resistant line B80124 (Figure 2A). The principal components changed dramatically between B80461-CK and B80461, which was the highly susceptible line (Figure 2B). There were consistent and inconsistent principal components between B80124-CK and B80461-CK (Figure 2C); however, the principal components were different between resistant B80124 and susceptible B80461 (Figure 2D), which suggested that the VOCs were different after inoculation with TuMV in resistant B80124 and susceptible B80461.

3.2.2. VOC Data Analysis

After qualitative and quantitative analysis of the detected metabolites were combined with the grouping situation of specific samples, 99 types of volatile substances were obtained from the test results (Table S2). Changes in the quantitative information of metabolites in each grouping were compared. In this study, we mainly compared the different metabolites of resistant and susceptible lines (B80124 vs. B80461) after inoculation to determine the potential processes related to TuMV resistance in B. rapa.
In B80124 vs. B80461, Seven metabolites, namely KMW0186 (Octanal), XMW0048 (Phenol, 2-nitro), NMW0108 (Bicyclo [2.2.1]heptane-2,5-dione, 1,7,7-trimethyl), XMW0947 ((E)-Hex-3-enyl (E)-2-methylbut-2-enoate), KMW0253 (2-octenal), KMW0158 (Benzaldehyde), and KMW0504 (Benzene, 1-ethenyl-4-methoxy) were upregulated, and the metabolites of KMW0186 (Octanal) were most elevated (Figure S3A). However, 13 metabolites were downregulated, and the decrease in KMW0110 (Allyl Isothiocyanate) was the greatest (Figure S3A), (The significantly regulated metabolites after inoculation B80124 vs. B80461 in Table S3). The results of differentially expressed metabolites ranked first in the VIP value in the OPLS-DA model showed that the decrease in metabolites was higher than the increase, and the decrease of final metabolites was still obvious (Figure S3B). By means of volcano plot, the difference in metabolite expression levels in the two samples (groups) and the statistical significance of the difference were examined. The degree of downregulation of differentially expressed metabolites was more obvious than the degree of upregulation (Figure S3C). According to the Pharmacopoeia of the People’s Republic of China [17], the relative standard deviation (RSD) of the repeatability peak area of five consecutive headspace injections is less than 10%. The relative content of differential volatile metabolites in Table S3 is based on a logarithm of 10, and the RSD values of differential volatile metabolites of B80124 and B80461 are shown in Table S4. It was obvious that except KMW0499 of B80461, the RSD of all volatile substances was less than 10%. Similarities between replicates showed that repeatability was good in general. The differential metabolites were annotated using the KEGG database and classified according to pathway types in KEGG. The results showed that the differential metabolites between resistant material B80124 and susceptible material B80461 were mainly related to phenylalanine metabolism, metabolic pathways, and biosynthesis of secondary metabolites (Figure S4).

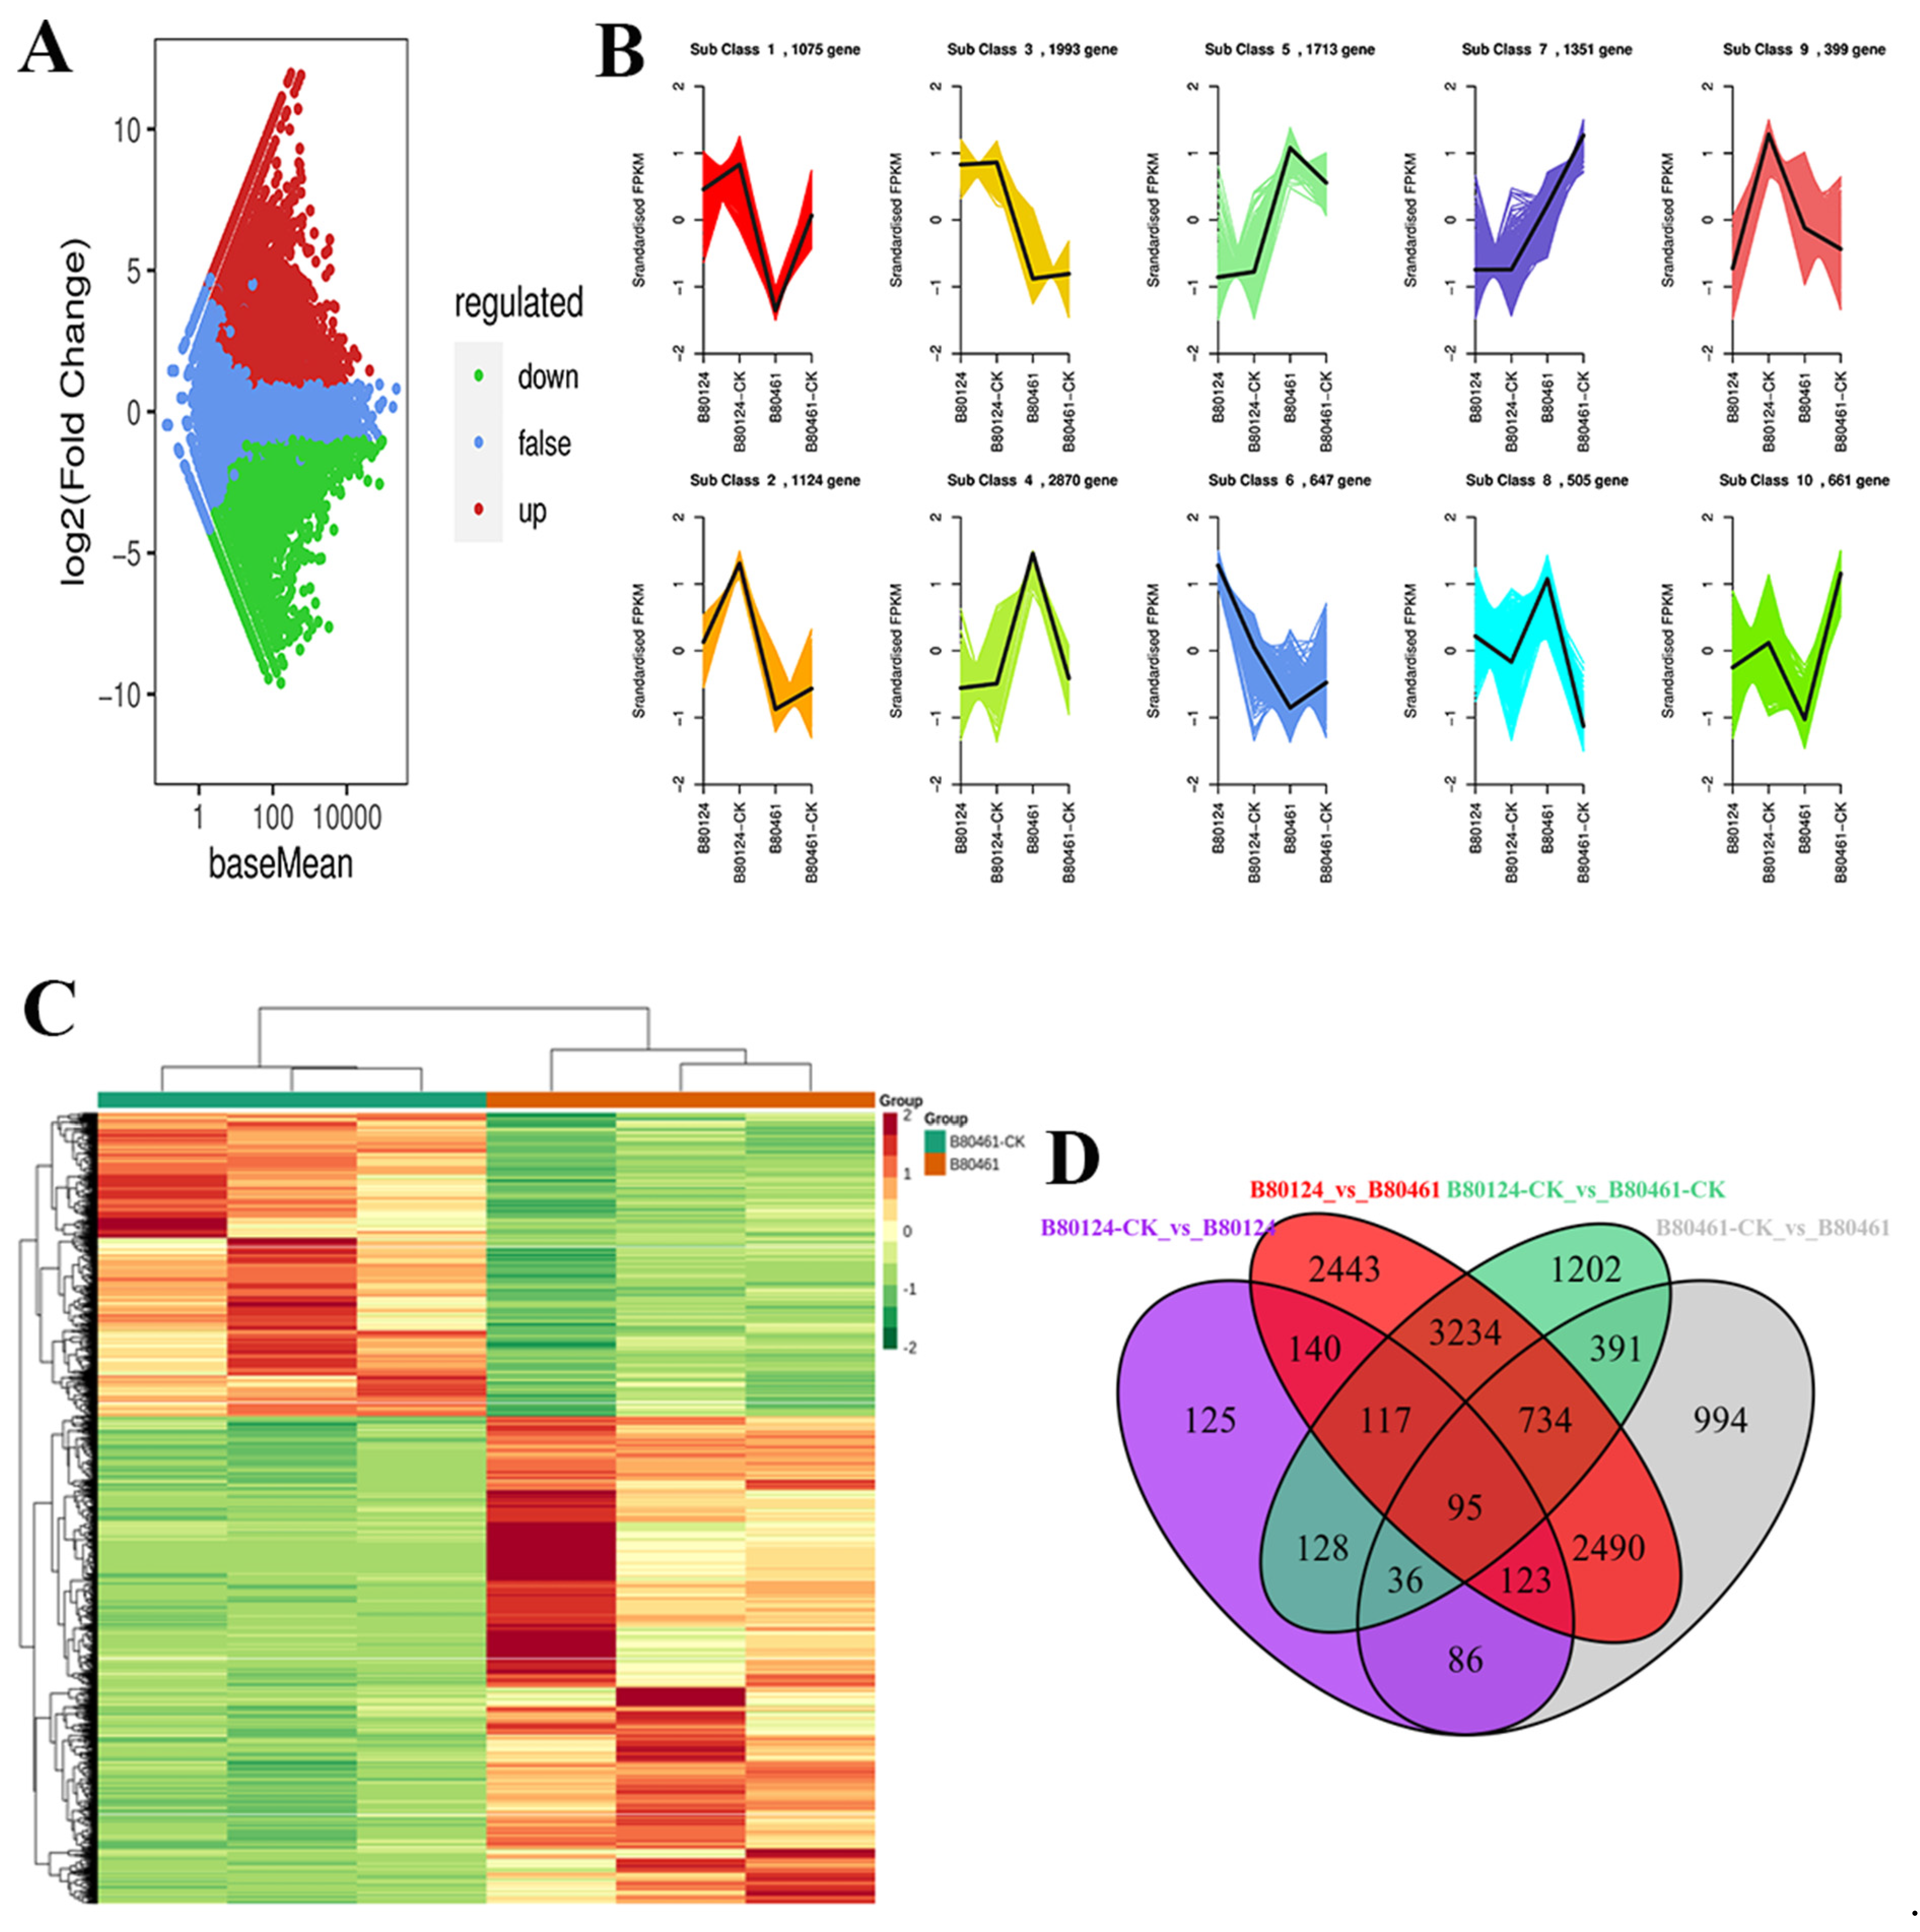
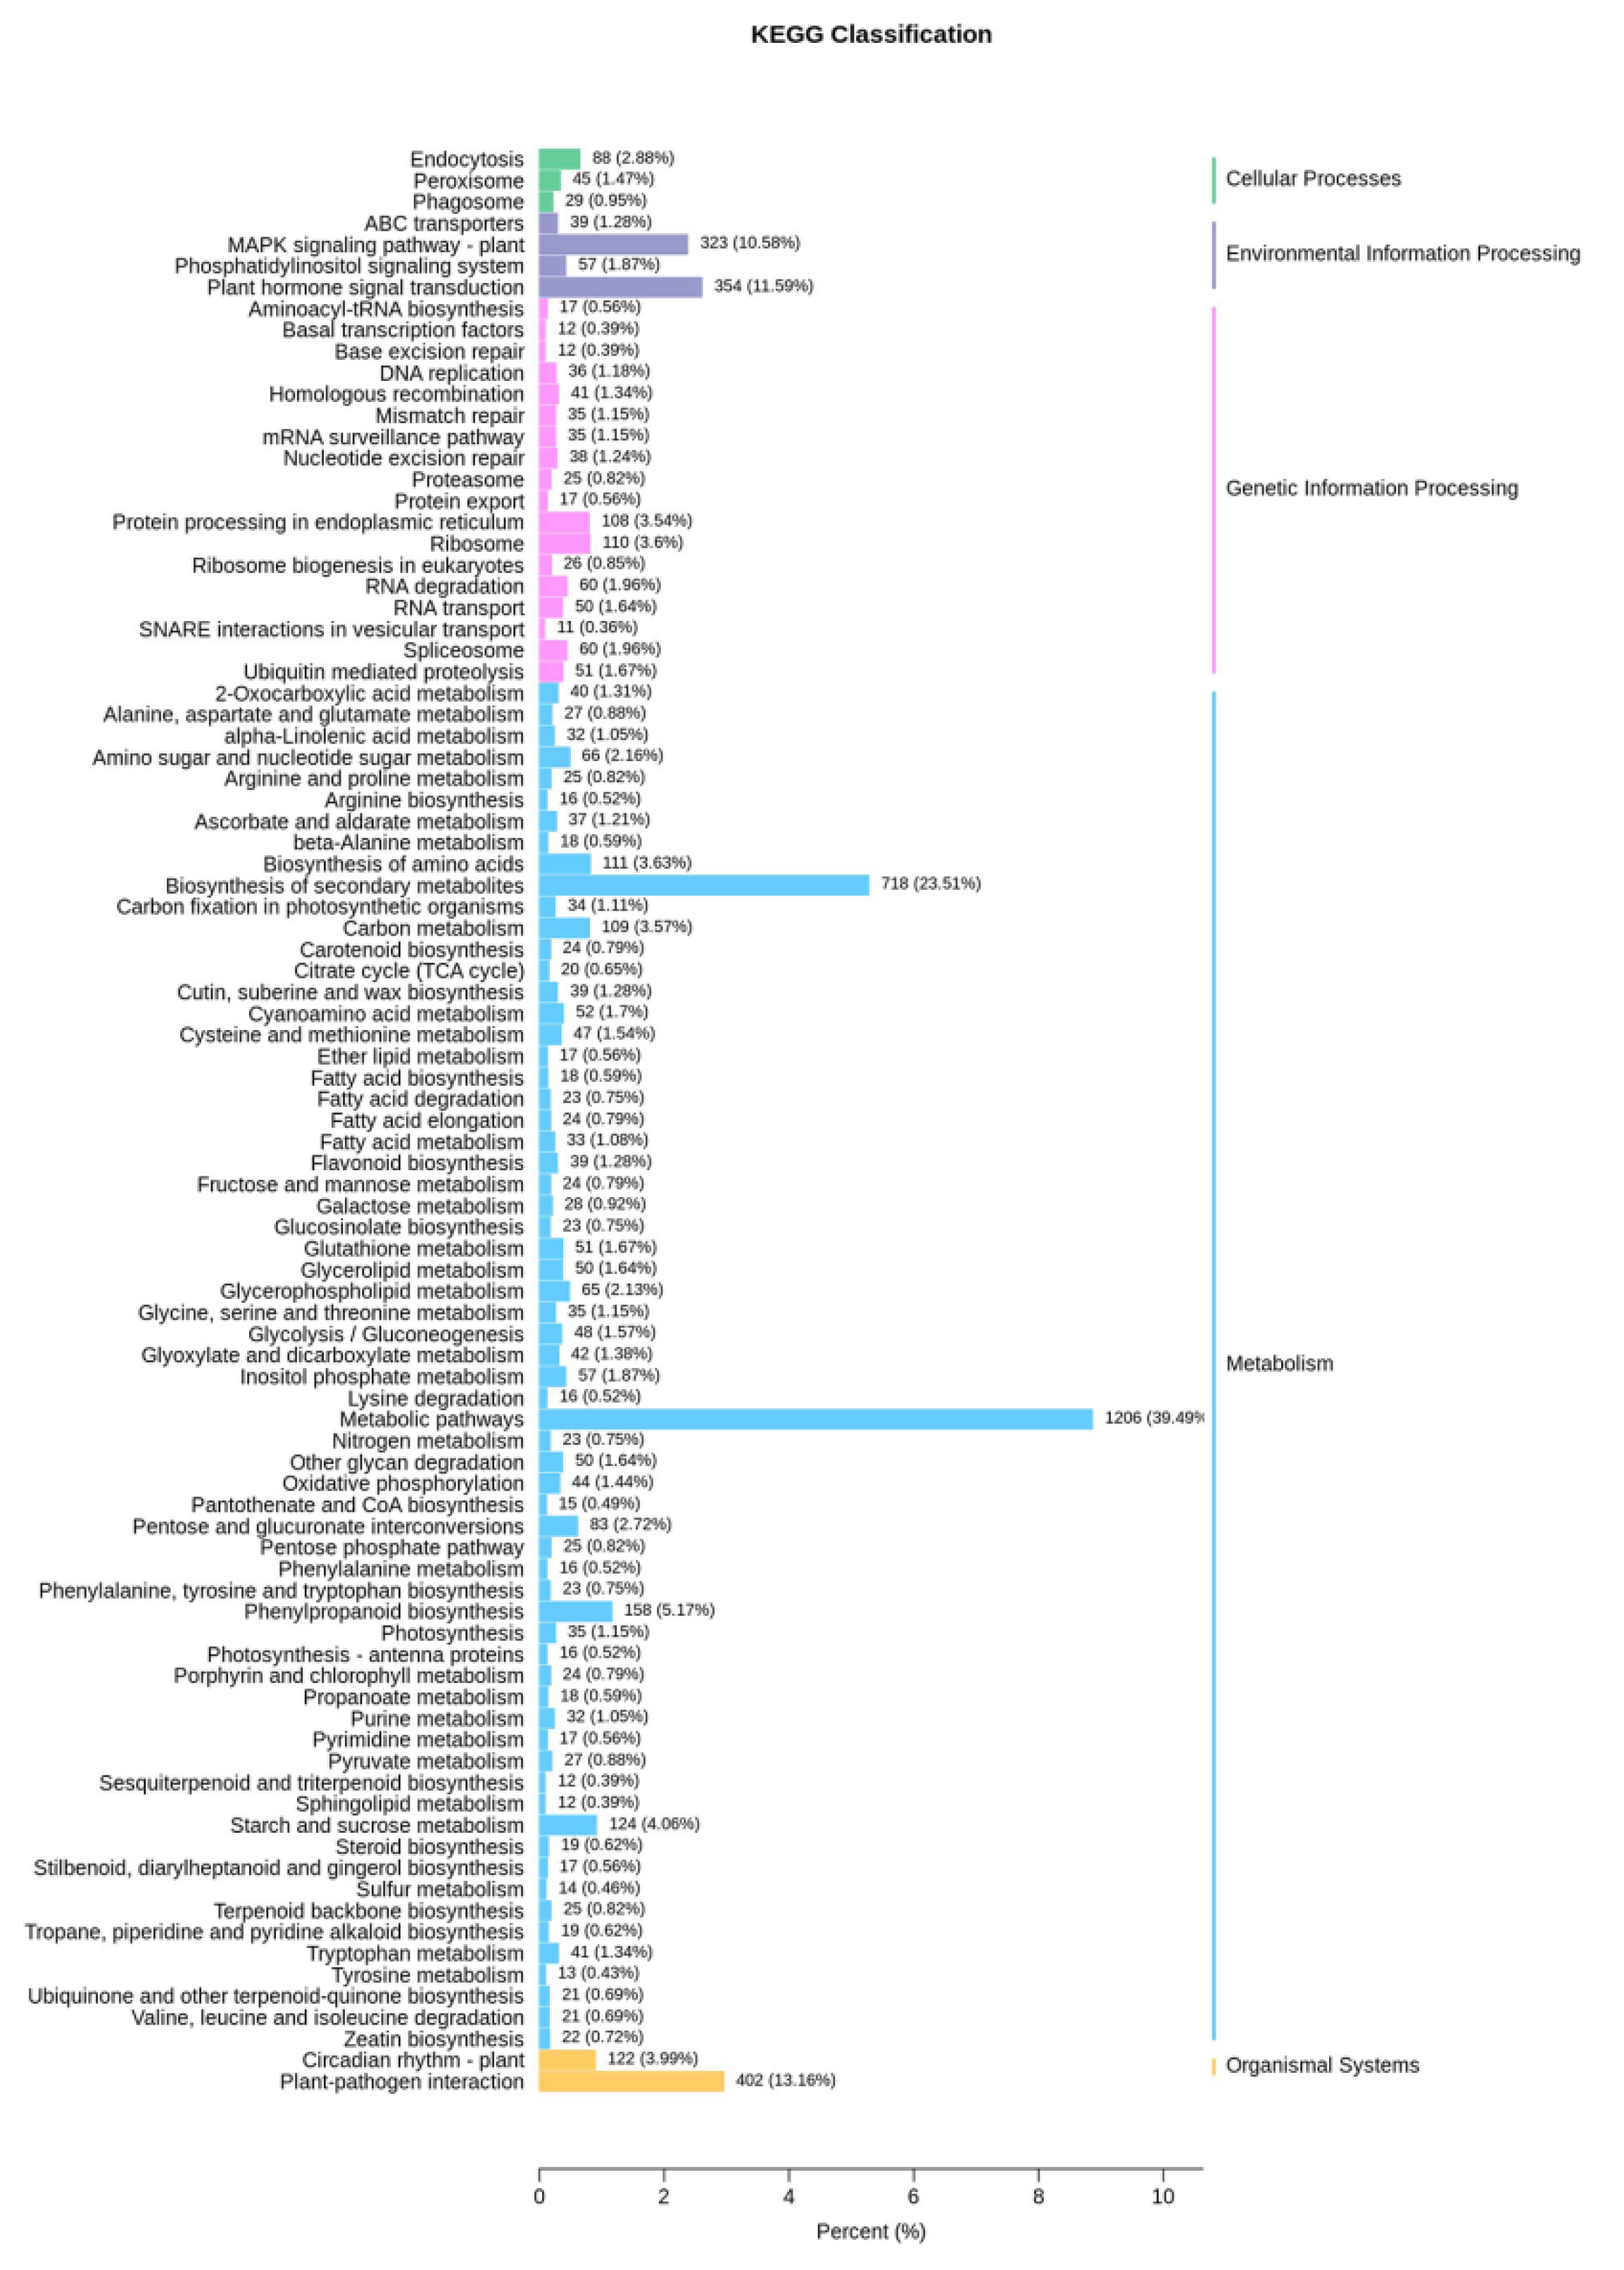
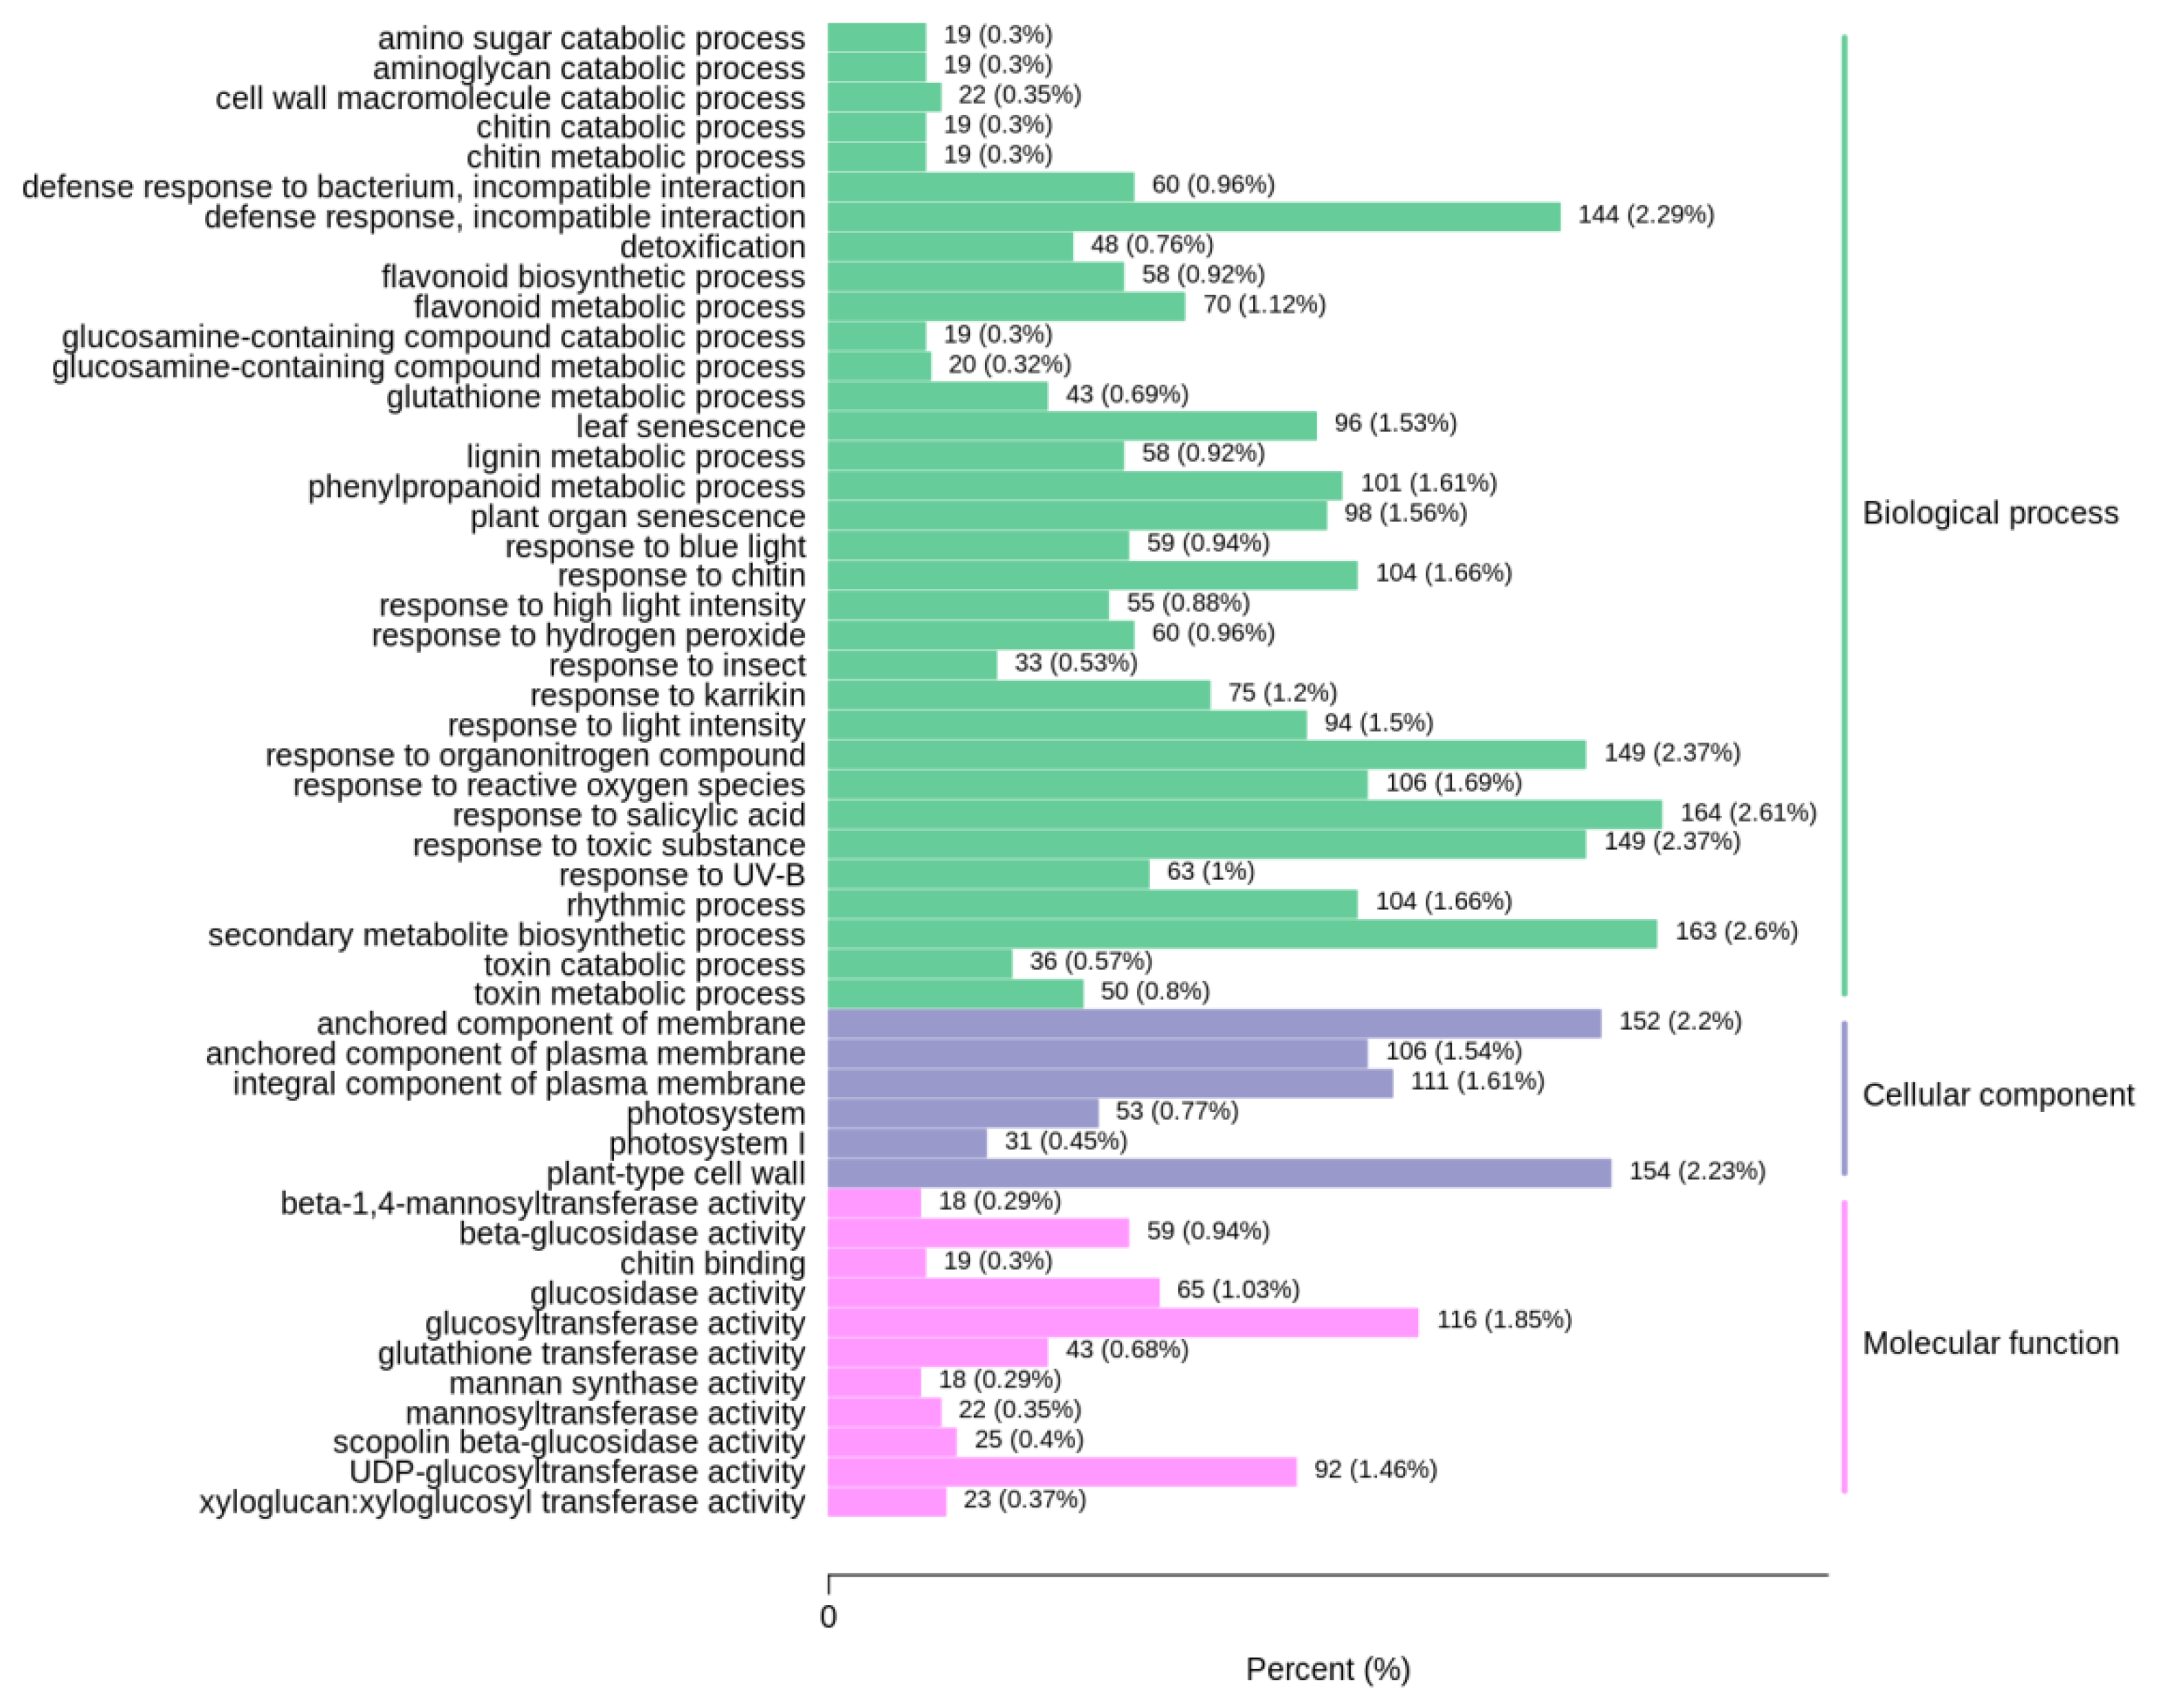
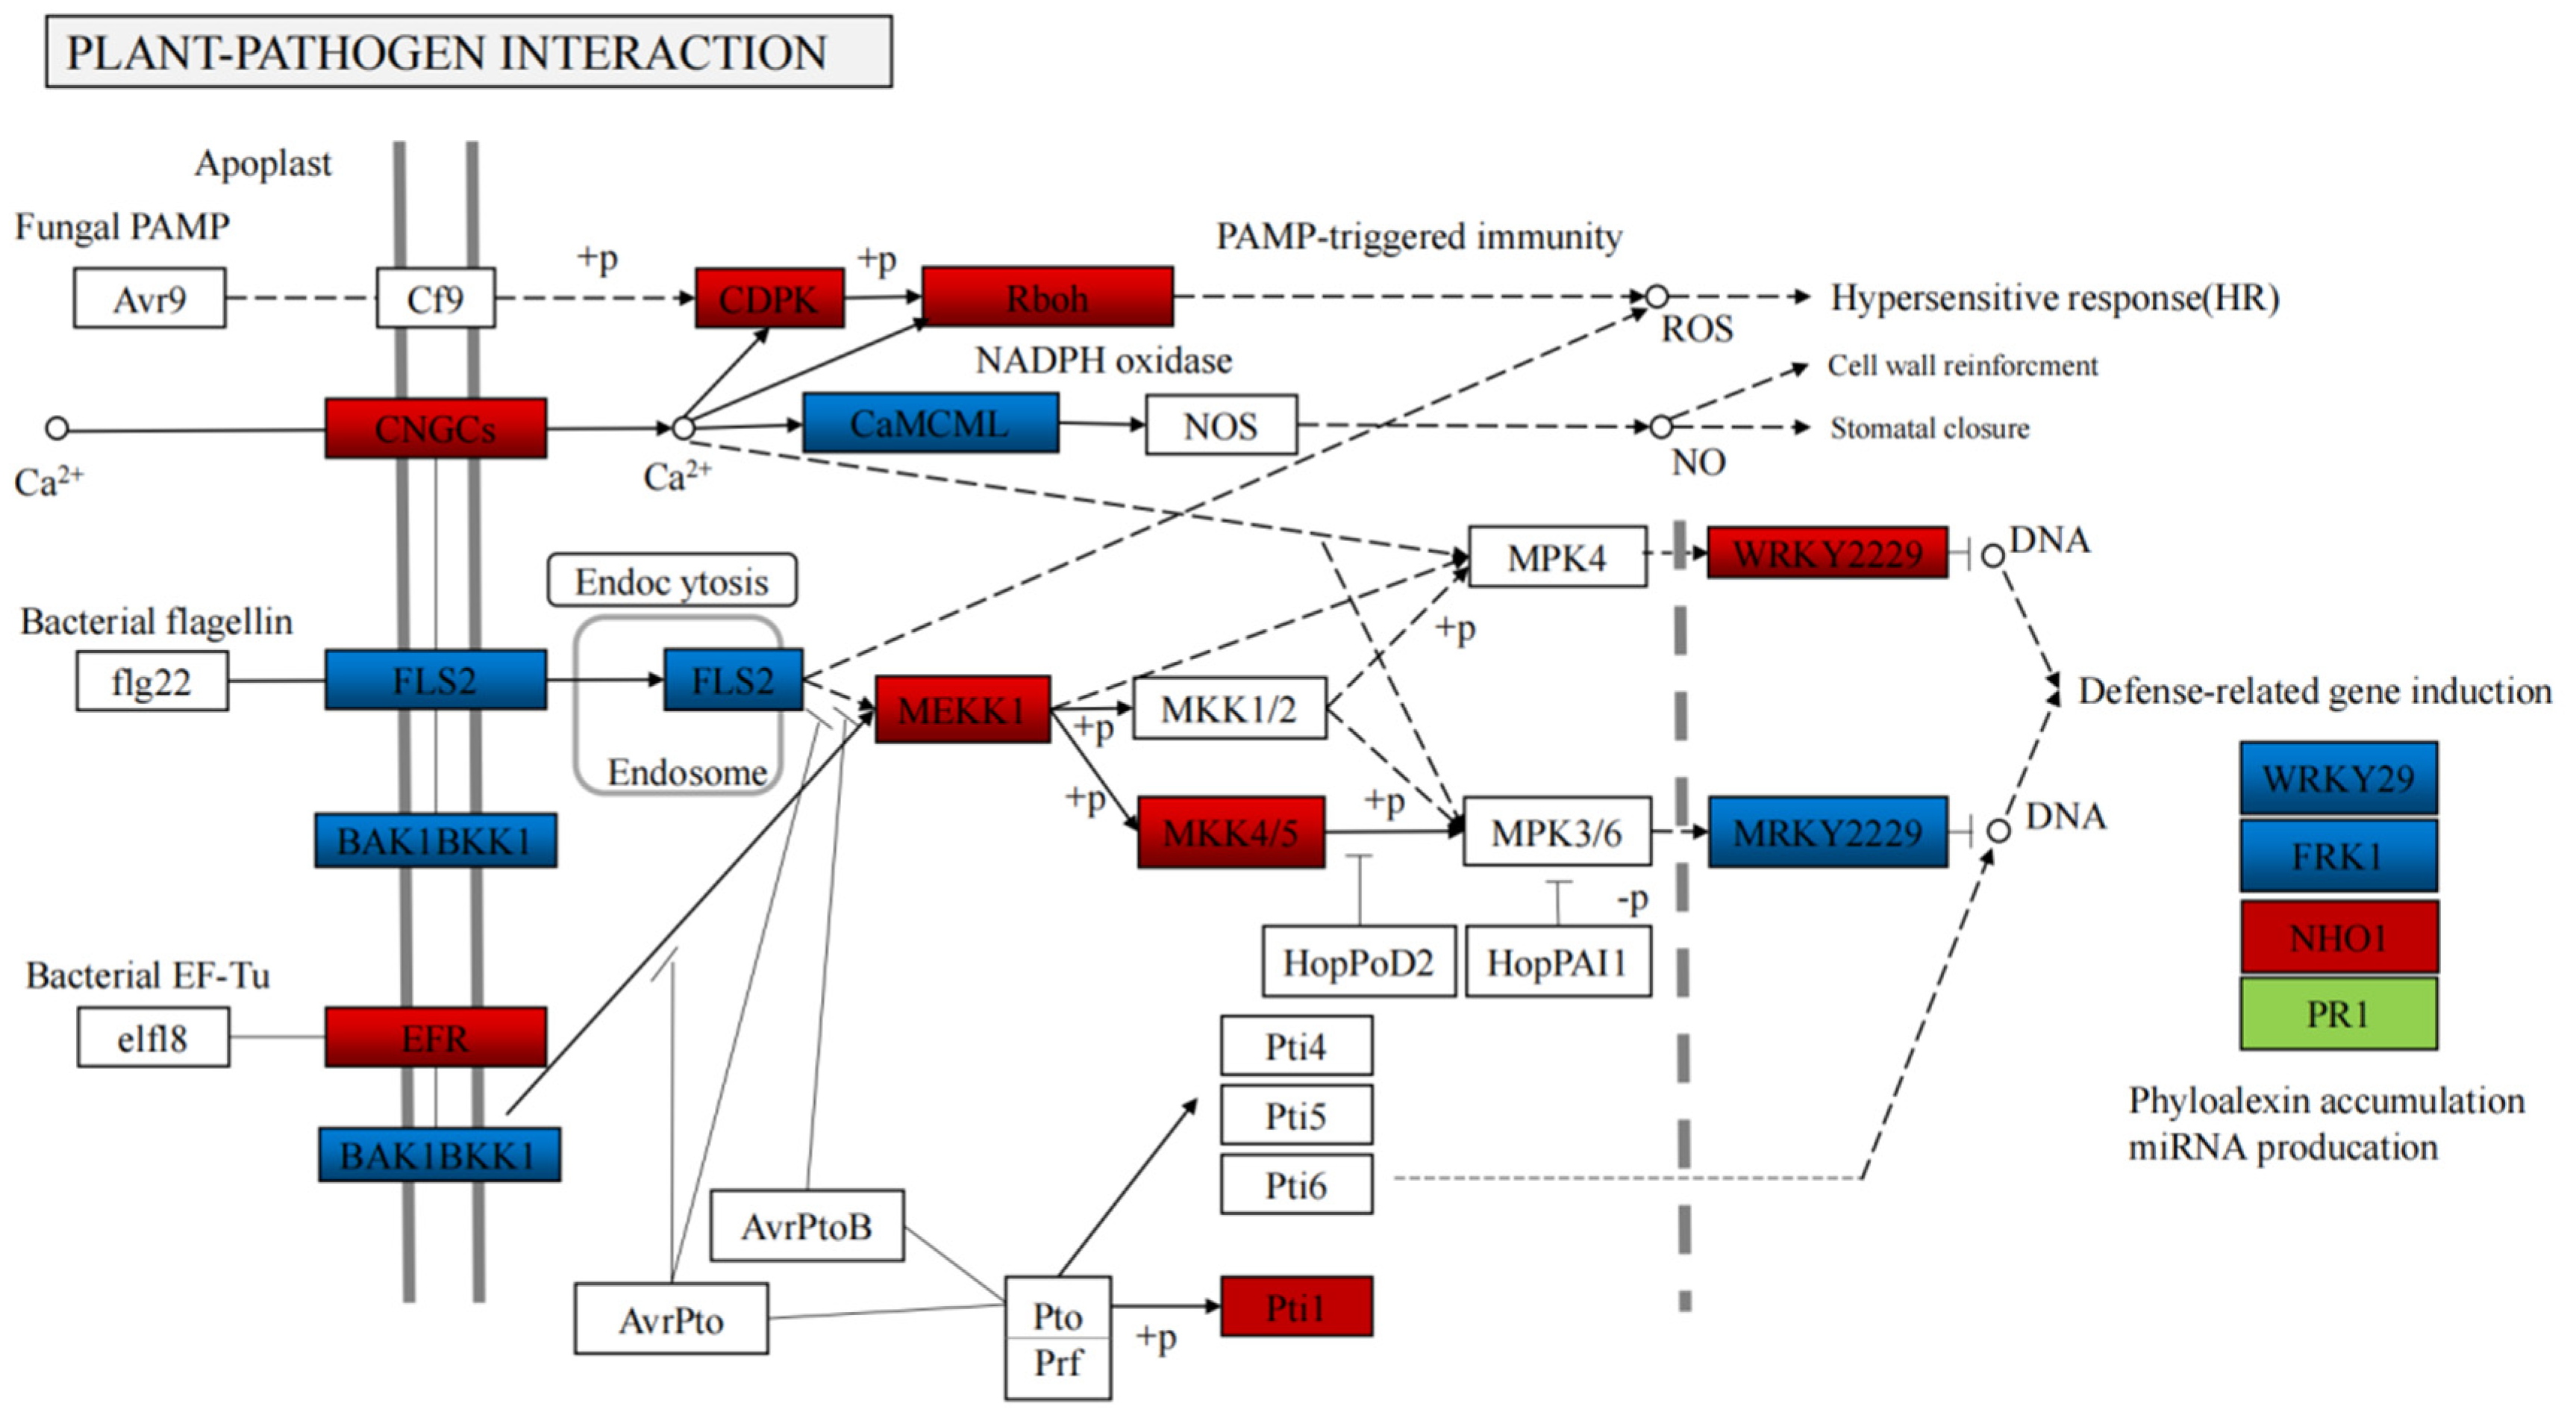
3.3. Transcriptome Analysis of Volatile Organic Compound Accumulation in B. rapa

RNA sequencing was conducted on 12 samples, consisting of three independent biological replicates for each of line (B80124-CK, B80124, B80461-CK, B80461). Comparing the RNA sequencing date to the Brassica genome and TuMV reference genome, it was found that only three samples of B80461 were mapped to the TuMV reference genome, and the remaining nine samples were mapping to the Brassica reference genome and not to TuMV genome (Table S5). In addition, gene expression was detected by transcriptome analysis. Based on the fragments per kilobase of transcript per million fragments mapped (FPKM), the dispersion degree of gene expression level distributed in each sample was very similar, and overall gene expression levels were similar in each sample (Figure 3A). A density map showed the trend of gene abundance in the sample with the change in gene expression and clearly reflected the range of gene expression concentrations in the sample (Figure 3B). Furthermore, Pearson’s correction coefficient was analyzed, which revealed the corrections among all repetitive samples. The R2 values were all > 0.8, implying that the corrections among the three repetitive samples were reliable, and the data could be used in the subsequent analysis (Figure 3C). In addition to R2 values, PCA was also conducted to uncover the corrections among the repetitive samples. PCA suggested that the quality of the transcriptomic samples reach to the level for further analysis (Figure 3D).
DESeq2 software was used to count the differentially expressed genes, the total number of differential genes, the number of upregulated genes, and the number of downregulated genes in each group. The statistical results are shown in Table S6. There were 9376 differential genes between B80124 and B80461. From the MA analysis, after inoculating B. rapa with TuMV, there were more upregulated genes than downregulated genes (Figure 4A), which might be due to the stress response caused by the virus entering the plant. In addition, the upregulated and downregulated genes were classified through the standardized FPKM analysis. Clustering was performed with the k-means values. As shown in Figure 4B, the sub-class 3/7/8/10 obtained identical results, i.e., the FPKM values between B80124 and B80124-CK were similar, which were obviously different from the FPKM values between B80461 and B80461-CK (Figure 4B). There were changes in gene expression pathways between lines inoculated with TuMV and those that were not and between the resistant line (B80124) and the susceptible line (B80461). Notably, sub-class 1/2/4/6 showed irregular gene changes among the resistant/susceptible lines (Figure 4B). All differentially expressed genes were used to draw the cluster heat map, in which the upregulated and downregulated genes among the resistant/susceptible lines were shown (Figure 4C). The differentially expressed genes showed great changes before and after inoculation with TuMV in the resistant/susceptible lines. In addition, the Venn diagram among different combinations also showed differences in gene changes before and after inoculation of different lines with TuMV, which could indicate that biological stress can promote changes in the metabolic pathways of resistant materials (Figure 4D). There were only 95 common differentially expressed genes among B80124, B80124-CK, B80461, and B80461-CK.
The Kyoto Encyclopedia of Genes and Genomes (KEGG) was analyzed to identify the different pathways. The differentially expressed genes were associated with five KEGG pathways (cellular processes, environment information processing, genetic information processing, metabolism, and organismal systems), and metabolic pathways in metabolism was the most frequent category (1207 different genes, accounting for 39.49%). The results were consistent with the metabolomic data (Figure 5), indicating that TuMV stress was related to metabolic pathways, especially focusing on defense response, flavonoid biosynthetic process, and toxin metabolic process (Figure 6). This indicates that TuMV stress maybe influence the release of VOCs; however, the further exploration for the mechanism of the interaction between TuMV and VOCs, are still necessary (Figure 7). In the plant–pathogen interaction after TuMV infected the plants, the hypersensitive response would upgrade, which could cause gene upregulation, such as that of NADPH oxidase, WRKY2, and MEKK (Figure 8). Notably, the elf18 gene played an important role in the interaction between plant and pathogen (Figure 8), which demonstrated that eukaryotic translation initiation factors (eIFs), such as eIF4E and eIF(iso)4E, could help plant pathogens replicate and spread in B. rapa, like retr01/retr02 [eIF(iso)4E], retr03 (eIF2Bβ).

3.4. Integrated Volatile Metabolome and Transcriptome Analysis of VOC Accumulation in B. rapa

A hypergeometric test was used to determine the ratio of the number of differentially expressed metabolites, genes in the corresponding pathway to the total number of metabolites, and genes detected and annotated in the pathway:
P   = 1 i   = 0 m 1 ( M i ) ( N M n i ) ( N n )
N’ represents the number of volatile metabolites, genes with KEGG annotation in all volatile metabolites/genes; ‘n’ represents the number of differential metabolites/genes in ‘N’; ‘M’ represents the number of volatile metabolites/genes in a KEGG pathway in ‘N’; and ‘M’ represents the number of differential volatile metabolites/genes in a KEGG pathway in ‘M’.
By integrating the transcriptome and volatile metabolome data into KEGG analysis, the accumulation of different genes was higher than the accumulation of different metabolites in the biosynthesis of secondary metabolites, cyanoamino acid metabolites, and metabolite pathways; in particular, the accumulation of different genes was 50-fold higher than that of various metabolites in metabolite pathways (Figure 9A). Different genes were highest in metabolites’ pathways; however, the accumulation of different genes was highest in the cyanoamino acid metabolites (Figure 9A). Pearson’s correction coefficient (PCC) analysis showed that of the genes and metabolites with inconsistent regulatory trends, metabolites were upregulated, while genes were unchanged or downregulated in the 1/2/4 quadrants (Figure 9B). However, the differential expression pattern of genes and metabolites was consistent, and the change in metabolites may be positively regulated by genes if the genes and metabolites have the same regulation trend in the 3/7 quadrants (Figure 9B). The expression abundance of metabolites was lower than that of genes, and genes and metabolites with an inconsistent regulation trend were upregulated, while metabolites were not changed or downregulated in the 6/8/9 quadrants (Figure 9B). Both genes and metabolites were not differentially expressed, and the differentially grouped genes and metabolites were not differentially expressed in the fifth quadrant (Figure 9B). For differential metabolites with a Pearson’s correlation coefficient above 0.8, all correlation calculation results were selected to draw a clustering heat map, and the different genes and metabolites varied between the control and those inoculated with TuMV in the resistant/susceptible lines (Figure 9C). Five pathways showed higher corrections with TuMV inoculation, which included six genes (BraA02g001320.3C, BraA09g053440.3C, BraA01g009070.3C, BraA05g013640.3C, BraA05g029570.3C, and BraA03g045650.3C) (Figure 9D). These genes (BraA09g053440.3C, BraA01g009070.3C, and BraA05g013640.3C) could encode the aminotransferase, which could regulate VOCs in the resistant/susceptible lines after inoculating with TuMV. The VOC metabolites could attract aphids to harm plants, which could also spread the virus.
The destruction of viral infection to the normal plant developmental physiology is often related to plant hormone accumulation and changes in signaling changes. Changes in phytohormone levels have been repeatedly thought to be related to changes in virus accumulation [18]. In the process of virus–plant interactions, hormone signal-mediated plant resistance plays an important role in regulating the process of virus occurrence, such as symptom development, virus replication and virus movement [19,20]. Based on KEGG and gene ontology (GO) analysis, the different genes and metabolites between B80124 and B80461 were integrated into four signaling pathways related to plant hormone signal transduction, namely, tryptophan metabolism, zeatin biosynthesis, brassinosteroid biosynthesis, and α-linolenic acid metabolism (Figure 8). After inoculating with TuMV, auxin was upregulated, and ARF, IAA and GH3 were also upregulated, which accelerated cell enlargement and plant growth in tryptophan metabolism, AUX is mainly involved in plant growth and development, but also plays a role in plant defense [21] (Figure 8). The genes in zeatin biosynthesis pathways were downregulated, which reduced cell division and shoot initiation. However, the metabolite pathways were upregulated in brassinosteroid biosynthesis and α-linolenic acid metabolism, which could cause cell enlargement and a stress response (Figure 8). Jasmonic acid (JA) is mainly involved in plant defense against pathogens [22]. Some studies have found that jasmonic acid-mediated resistance is very important for regulating plant resistance to vector insects or plant viruses [23] (Figure 8).

4. Discussion

TuMV disease was first described in B. rapa in the USA [24,25], while it was later found in B. oleracea in the UK [26], and in B. napus in China [27]. After TuMV infection of brassica crops, the veins in the plants’ new leaves became increasingly obvious and gradually turned into mottled leaves, and the leaves shrank and grew slowly. This leads to dwarfing and abnormal growth, non-heading, or loose heading, and could cause serious production losses in areas with serious disease [28,29].
In this study, TuMV-resistant Chinese cabbage line B80124 and TuMV-susceptible line B80461 (inoculated with TuMV) and B80124-CK, B80461-CK (non-inoculated) were subjected to volatile metabolome and transcriptome analyses. TuMV challenge induces drastic changes in gene expression and metabolite production in B. rapa. This manuscript focued on comparisons between B80124 and B80461, to find out potential processes associated with resistance to TuMV in B. rapa.

4.1. VOCs Changed Greatly between B80124 and B80461 Inoculated with TuMV

The volatiles produced and released by plants after they are attacked by insects are called herbivore-induced plant volatiles (HIPVs). The composition of HIPVs is very complex, including alkanes, olefins, alcohols, aldehydes, ketones, ethers, esters, and hydroxy acids [30]. Brassica plant volatiles can effectively stimulate herbivorous insects to feed and lay eggs. These volatiles mainly include hydrocarbons, alcohols, aldehydes, ketones, esters, organic acids, and terpenes [31]. Herbivorous insects sense these volatile odors through their antennae for host identification and orientation. In the study of the interaction between TuMV-transmitting aphids and brassica crops, brassica crops produce some chemical volatiles to regulate the behavior of aphids. Sesquiterpenes and monoterpenes, including (E)-α-vanilene, (E)-β-butene, and camphor, affect the feeding behavior of insects. Pathogens may modulate plant volatile production to influence vector behavior. For instance, volatile terpenoids mediate direct defense against the whitefly Bemisia tabaci (Hemiptera: Aleyrodidae) [32,33]. Previous studies have shown that there are significant differences in the drive ability of non-toxic vector insects and virulent vector insects for healthy plants and susceptible plants, and non-toxic vector insects tend to feed on susceptible plants, while virulent vector insects tend to consume healthy plants [34,35]. In volatile metabolome analysis, the volatile organic compounds (VOCs) were different after inoculation with TuMV in resistant B80124 and susceptible B80461, and the degree of downregulation of differentially expressed metabolites was more obvious than the degree of upregulation. This was linked to the use of VOCs to attract aphids. In particular, the allyl isothiocyanate, which causes the special smell released by cruciferous plants, was not detected in B80461. Studies have shown that Plutella xylostella (Linnaeus) and aphids are attracted by the mustard oil emitted by cruciferous plants, namely allyl isothiocyanate [13,36]. It may also be related to the close of plant stomata, which controls the release of plant VOCs [37]. Many pathogens invade plant tissue through stomata [38], and the closure of plant stomata prevents the invasion of plant pathogens, thereby reducing the release of plant volatiles induced by herbivores, and the potential for VOC/green leaf volatiles (GLV)-mediated inter/intra-plant signaling/communication [39,40]. After the susceptible material B80461 was inoculated with TuMV, why did this substance disappear? It may be because this metabolite is an attractant for aphids. After 25 d inoculating TuMV in susceptible B. rapa line, the plant leaves were obviously necrotic, which caused the vegetable quality decline to deteriorate. The special smell from the deteriorate plants was no longer emitted, driving the aphids to eat other healthy plants. However, the specific interaction mechanisms among TuMV-VOCs-aphids needs to be further explored.

4.2. Integrated Volatile Metabolome and Transcriptome analysis of VOC accumulation in B. rapa

Plant volatiles are often mixed with a variety of substances, and volatiles with different components and concentrations can be recognized by specific insects, which promotes the selection of different types of insects among different types of crops [11]. The VOC compositions and concentrations were different between inoculated and non-inoculated varieties in brassica crops, indicating that there were significant differences in gene expression and metabolism. In this study, there are seven metabolites were upregulated, and 13 metabolites were downregulated. The differentially expressed genes were excavated by transcriptome analysis, revealing which genes were upregulated and which genes were downregulated. Compared with volatile metabolome analysis, the transcriptome analysis obtained the similar results, which included the upregulation of genes from the tryptophan pathway, brassinosteroid biosynthesis pathway, and α-Linolenic acid pathway, and the downregulation of genes form the zeatin biosynthesis pathway (Figure 8). Zeatin is a natural cytokinin that promotes cell division. In the TuMV-inoculated line (B80461, susceptible line), the significant decrease of zeatin may be the main cause of leaf shrinkage. In addition, jasmonates and SA are upregulated with the release of this VOCs in the brassinosteroid biosynthesis pathway, which is related to resistance to pathogen infection [22], as both are signal molecules that induce the expression of resistance genes in plants in response to external injury (mechanical injury, herbivore injury, insect injury) and pathogen infection. In the volatile metabolome, determining the final differential metabolites and the content of the metabolites would help explain the function of specific metabolites.

Supplementary Materials

The following supporting information can be downloaded at: https://www.mdpi.com/article/10.3390/horticulturae8010057/s1, Table S1. The OD450 values of the samples. Table S2. The 99 types of volatile substances obtained from the test results. Table S3. Significantly Regulated Metabolites After Inoculation B80124 vs B80461. Table S4. The RSD values of different volatile metabolites of B80124 and B80461. Table S5. The results of RNA sequence date mapping to the Brassica genome and TuMV reference genome. Table S6. Statistical table of different genes. Figure S1. Sample Quality control and Principal Component Analysis. Gas chromatography-mass spectrometry (GC-MS) analysis based on unsupervised total ion current (TIC) of different quality control (QC) samples, (Rt, retention time; cps, count per second) (A), principal component analysis (PCA) showed the trend of volatile metabolome separation between groups, PC1 represents the first principal component, PC2 represents the second principal component, and the percentage indicates the interpretation rate of the principal component to the data set. Each point in the figure represents a sample, and samples in the same group are represented by the same color (B), For cluster analysis, the horizontal axis is the sample name, the vertical axis is the metabolite information, and the different colors are the values obtained after the relative content standardization process (red represents high content, green represents low content) (C). Figure S2. The cluster analysis of different GC-MS samples. Figure S3. Screening of differential metabolites of B80124 and B80461. Fold change of the quantitative information of metabolites in each group based on log2FC (fold change ≥ 2 or fold change ≤ 0.5) (A), VIP value (VIP ≥ 1) (B), volcano plot (C). Figure S4. KEGG classification diagram of differential metabolites of B80124 vs. B80461. User Guide: Compound-ELISA Reagent Set.

Author Contributions

Data curation, X.L., L.Z. and W.H.; Formal analysis, X.L., L.Z. and W.H.; Investigation, S.Z. (Shifan Zhang), F.L. and H.Z.; Methodology, R.S.; Supervision, G.L.; Writing—original draft, X.L. and S.Z. (Shujiang Zhang); Writing—review and editing, G.L., J.Z. and S.Z. (Shujiang Zhang). All authors have read and agreed to the published version of the manuscript.

Funding

This work was funded by the State Key Laboratory of North China Crop Improvement and Regulation, the Beijing Natural Science Foundation (6212030), the National Natural Science Foundation of China (32102373, 31772302). This work was performed at the Key Laboratory of Biology and Genetic Improvement of Horticultural Crops, Ministry of Agriculture, Beijing, China.

Institutional Review Board Statement

Not applicable.

Informed Consent Statement

Not applicable.

Data Availability Statement

The date presented in this study are openly avaliable in NCBI with BioProject number: PRJNA764554 (https://www.ncbi.nlm.nih.gov/search/all/?term=PRJNA764554, accesed on 21 August 2021).

Acknowledgments

We thank LetPub for its linguistic assistance during the preparation of this manuscript.

Conflicts of Interest

All the authors declare that they have no conflicts of interests.

References

  1. Tomlinson, J.A. Epidemiology and control of virus diseases of vegetables. Ann. Appl. Biol. 1987, 110, 661–681. [Google Scholar] [CrossRef]
  2. Walkey, D.G.A.; Pink, D.A.C. Reactions of white cabbage (Brassica oleracea var. capitata) to four different strains of turnip mosaic virus. Ann. Appl. Biol. 1988, 112, 273–284. [Google Scholar] [CrossRef]
  3. Walsh, J.A.; Jenner, C.E. Turnip mosaic virus and the quest for durable resistance. Mol. Plant Pathol. 2002, 3, 289–300. [Google Scholar] [CrossRef]
  4. Walsh, J.A. Turnip mosaic virus. In Data Sheet for Commonwealth Agriculture Bureau International Global Crop Protection Compendium; CAB International: Wallingford, UK, 1997. [Google Scholar]
  5. Shattuck, V.I.; Stobbs, L.W. Evaluation of rutabaga cultivars for turnip mosaic virus resistance and the inheritance of resistance. Hortscience. 1987, 22, 935–937. [Google Scholar]
  6. Hardwick, N.V.; Davies, J.M.L.; Wright, D.M. The incidence of three virus diseases of winter oilseed rape in England and Wales in the 1991/92 and 1992/93 growing seasons. Plant Pathol. 1994, 43, 1045–1049. [Google Scholar] [CrossRef]
  7. Spence, N.J.; Phiri, N.A.; Hughes, S.L.; Mwaniki, A.; Simons, S.; Oduor, G.; Chacha, D.; Kuria, A.; Ndirangu, S.; Kibata, G.N.; et al. Economic impact of Turnip mosaic virus, Cauliflower mosaic virus and Beet mosaic virus in three Kenyan vegetables. Plant Pathol. 2007, 56, 317–323. [Google Scholar] [CrossRef]
  8. Casteel, C.L.; Hansen, A.K. Evaluating Insect-Microbiomes at the Plant-Insect Interface. J. Chem. Ecol. 2014, 40, 836–847. [Google Scholar] [CrossRef] [PubMed]
  9. Antolinez, C.A.; Fereres, A.; Moreno, A. Risk assessment of ‘Candidatus Liberibacter solanacearum’ transmission by the psyllids Bactericera trigonica and B-tremblayi from Apiaceae crops to potato. Sci Rep. 2017, 7, 1–10. [Google Scholar]
  10. Webster, B. The role of olfaction in aphid host location. Physiol. Entomol. 2012, 37, 10–18. [Google Scholar] [CrossRef]
  11. Davis, T.S.; Wu, Y.; Eigenbrode, S.D. The effects of bean leafroll virus on life history traits and host selection behavior of specialized pea aphid (Acyrthosiphon pisum, Hemiptera: Aphididae) genotypes. Environ. Entomol. 2017, 46, 68–74. [Google Scholar] [PubMed]
  12. Fereres, A.; Penaflor, M.F.G.V.; Favaro, C.F.; Azevedo, K.E.X.; Landi, C.H.; Maluta, N.K.P.; Bento, J.M.S.; Lopes, J.R.S. Tomato infection by whitefly-transmitted circulative and non-circulative viruses induce contrasting changes in plant volatiles and vector behaviour. Viruses-Basel 2016, 8, 225. [Google Scholar] [CrossRef] [Green Version]
  13. Read, D.P.; Feeny, P.P.; Root, R.B. Habitat selection by the aphid parasite Diaeretiella rapae (Hymenoptera: Braconidae) and hyperparasite Charips brassicae (Hymenoptera: Cynipidae). Can. Entomol. 1970, 102, 1567–1578. [Google Scholar] [CrossRef]
  14. Li, R.; Weldegergis, B.T.; Li, J.; Jung, C.; Qu, J.; Sun, Y.; Qian, H.; Tee, C.; Van Loon, J.J.A.; Dicke, M.; et al. Virulence factors of geminivirus interact with MYC2 to subvert plant resistance and promote vector performance. Plant Cell. 2014, 26, 4991–5008. [Google Scholar] [CrossRef] [PubMed] [Green Version]
  15. Walsh, J.A.; Sharpe, A.G.; Jenner, C.E.; Lydiate, D.J. Characterisation of resistance to turnip mosaic virus in oilseed rape (Brassica napus) and genetic mapping of TuRB01. Theor. Appl. Genet. 1999, 99, 1149–1154. [Google Scholar] [CrossRef]
  16. Li, G.L.; Lv, H.H.; Zhang, S.J.; Zhang, S.F.; Li, F.; Zhang, H.; Qian, W.; Fang, Z.Y.; Sun, R. TuMV management for brassica crops through host resistance: Retrospect and prospects. Plant Pathol. 2019, 68, 1035–1044. [Google Scholar] [CrossRef]
  17. Chinese Pharmacopoeia Committee. Pharmacopoeia of the People’s Republic of China; China Medical Science and Technology Press: Beijin, China, 2015; p. 105. (In Chinese)
  18. Guo, H.J.; Gu, L.; Liu, F.; Chen, F.; Ge, F.; Sun, Y. Aphid-borne viral spread is enhanced by virus-induced accumulation of plant reactive oxygen species. Plant Physiol. 2019, 179, 143–155. [Google Scholar] [CrossRef] [PubMed] [Green Version]
  19. Alazem, M.; Lin, N.-S. Roles of plant hormones in the regulation of host-virus interactions. Mol. Plant Pathol. 2015, 16, 529–540. [Google Scholar] [CrossRef]
  20. Collum, T.D.; Culver, J.N. The impact of phytohormones on virus infection and disease. Curr. Opin. Virol. 2016, 17, 25–31. [Google Scholar] [CrossRef] [PubMed] [Green Version]
  21. Robert-Seilaniantz, A.; Grant, M.; Jones, J.D.G. Hormone crosstalk in plant disease and defense: More than just JASMONATE-SALICYLATE antagonism. Annu. Rev. Phytopathol. 2011, 49, 317–343. [Google Scholar] [CrossRef]
  22. Derksen, H.; Rampitsch, C.; Daayf, F. Signaling cross-talk in plant disease resistance. Plant Sci. 2013, 207, 79–87. [Google Scholar] [CrossRef]
  23. Zarate, S.I.; Kempema, L.A.; Walling, L.L. Silverleaf whitefly induces salicylic acid defenses and suppresses effectual jasmonic acid defenses. Plant Physiol. 2007, 143, 866–875. [Google Scholar] [CrossRef] [PubMed] [Green Version]
  24. Broin, M.; Cuine, S.; Eymery, F.; Rey, P. The plastidic 2-cysteine peroxiredoxin is a target for a thioredoxin involved in the protection of the photosynthetic apparatus against oxidative damage. Plant Cell. 2002, 14, 1417–1432. [Google Scholar] [CrossRef] [PubMed] [Green Version]
  25. Schultz, E.S. A transmissible mosaic disease of Chinese cabbage, mustard and Turnip. Afr. J. Agric. Res. 1921, 22, 173–177. [Google Scholar]
  26. Smith, K.M. A virus disease of cultivated Crucifers. Ann. Appl. Biol. 1935, 22, 239–242. [Google Scholar] [CrossRef]
  27. Ling, L.; Yang, J.Y. A mosaic disease of Rape and other crucifera in China. Phytopathology. 1940, 30, 338–342. [Google Scholar]
  28. Walsh, J.A.; Rusholme, R.L.; Hughes, S.L.; Jenner, C.E.; Bambridge, J.M.; Lydiate, D.J.; Green, S.K. Different classes of resistance to turnip mosaic virus in Brassica rapa. Eur. J. Plant Pathol. 2002, 108, 15–20. [Google Scholar] [CrossRef]
  29. D’Alessandro, M.; Turlings, T.C.J. Advances and challenges in the identification of volatiles that mediate interactions among plants and arthropods. Analyst 2006, 131, 24–32. [Google Scholar] [CrossRef] [PubMed] [Green Version]
  30. Meiners, T.; Hilker, M. Induction of plant synomones by oviposition of a phytophagous insect. J. Chem. Ecol. 2000, 26, 221–232. [Google Scholar] [CrossRef]
  31. Bleeker, P.M.; Diergaarde, P.J.; Ament, K.; Guerra, J.; Weidner, M.; Schuetz, S.; de Both, M.T.J.; Haring, M.A.; Schuurink, R.C. The role of specific tomato volatiles in tomato-whitefly interaction. Plant Physiol. 2009, 151, 925–935. [Google Scholar] [CrossRef] [PubMed] [Green Version]
  32. Luan, J.-B.; Yao, D.-M.; Zhang, T.; Walling, L.L.; Yang, M.; Wang, Y.-J.; Liu, S.-S. Suppression of terpenoid synthesis in plants by a virus promotes its mutualism with vectors. Ecol. Lett. 2013, 16, 390–398. [Google Scholar] [CrossRef]
  33. Eigenbrode, S.D.; Bosque-Perez, N.A.; Davis, T.S. Insect-borne plant pathogens and their vectors: Ecology, evolution, and complex interactions. Annu. Rev. Entomol. 2018, 63, 169–191. [Google Scholar] [CrossRef]
  34. Mauck, K.E. Variation in virus effects on host plant phenotypes and insect vector behavior: What can it teach us about virus evolution? Curr. Opin. Virol. 2016, 21, 114–123. [Google Scholar] [CrossRef]
  35. Furlong, M.J.; Pell, J.K. Interactions between the fungal entomopathogen Zoophthora radicans Brefeld (Entomophthorales) and two hymenopteran parasitoids attacking the diamondback moth, Plutella xylostella L. J. Invertebr. Pathol. 1996, 68, 15–21. [Google Scholar] [CrossRef] [PubMed]
  36. Niinemets, U.; Loreto, F.; Reichstein, M. Physiological and physicochemical controls on foliar volatile organic compound emissions. Trends Plant Sci. 2004, 9, 180–186. [Google Scholar] [CrossRef] [PubMed]
  37. Melotto, M.; Underwood, W.; He, S.Y. Role of stomata in plant innate immunity and foliar bacterial diseases. Annu. Rev. Phytopathol. 2008, 46, 101–122. [Google Scholar] [CrossRef] [Green Version]
  38. Ameye, M.; Allmann, S.; Verwaeren, J.; Smagghe, G.; Haesaert, G.; Schuurink, R.C.; Audenaert, K. Green leaf volatile production by plants: A meta-analysis. New Phytol. 2018, 220, 666–683. [Google Scholar] [CrossRef]
  39. Lin, P.A.; Chen, Y.; Ponce, G.; Acevedo, F.E.; Lynch, J.P.; Anderson, C.T.; Ali, J.G.; Felton, G.W. Stomata-mediated interactions between plants, herbivores, and the environment. Trends Plant Sci. 2021. [Google Scholar] [CrossRef]
  40. Seidl-Adams, I.; Richter, A.; Boomer, K.B.; Yoshinaga, N.; Degenhardt, J.; Tumlinson, J.H. Emission of herbivore elicitor-induced sesquiterpenes is regulated by stomatal aperture in maize (Zea mays) seedlings. Plant Cell Environ. 2015, 38, 23–34. [Google Scholar] [CrossRef] [PubMed]
Figure 1. Ranks of turnip mosaic virus (TuMV) in brassica crops. From the phenotype analysis, the resistant index was divided into six ranks, i.e., 0, 1, 3, 5, 7, and 9 (A), B80124-CK and B80461-CK were the blank group (not inoculated with TuMV), and B80124-TuMV and B80461-TuMV were the experimental materials (inoculated with TuMV) (B).
Horticulturae 08 00057 g001
Figure 2. Principal component analysis (PCA) of samples between groups for difference comparison. The four groups were B80124-CK (“-CK” stands for the non-inoculated materials) and B80124 (A), B80461-CK and B80461 (B), B80124-CK and B80461-CK (C), B80124 and B80461 (D).
Horticulturae 08 00057 g002
Figure 3. Transcriptome analysis of gene expression. Analyses were performed using the following four methods: fragments per kilobase of the transcript per million fragments mapped (FPKM) (A), density map (B), Pearson’s correction coefficient (R2 > 0.8) (C), and principal component analysis (D).
Horticulturae 08 00057 g003
Figure 4. MA analysis showed that after inoculating Brassica rapa with turnip mosaic virus (TuMV), there were more upregulated genes than downregulated genes (A). Upregulated and downregulated genes classified through standardized FRKM analysis; the clustering was performed by the k-means values (B). All upregulated and downregulated genes among the resistant/susceptible lines are shown in the cluster heat map (C). The Venn diagram among different combinations showed the differences in gene changes before and after the inoculation of different materials with TuMV (D).
Horticulturae 08 00057 g004
Figure 5. Differentially expressed genes divided into five different pathways based on Kyoto Encyclopedia of Genes and Genomes (KEGG).
Horticulturae 08 00057 g005
Figure 6. Differentially expressed genes divided into three different pathways based on gene ontology (GO).
Horticulturae 08 00057 g006
Figure 7. KEGG pathway: Plant–pathogen interaction.
Horticulturae 08 00057 g007
Figure 8. Differential genes and metabolites of B80124 and B80461 involved in four signaling pathways.
Horticulturae 08 00057 g008
Figure 9. Integrated volatile metabolome and transcriptome analysis of volatile organic compound (VOC) accumulation in Brassica rapa. There were more differentially expressed genes than differentially expressed metabolites enriched in biosynthesis of secondary metabolites, cyanoamino acid metabolites, and metabolites pathways (A), Through Pearson’s correction coefficient (PCC) analysis for the different genes and metabolites, genes and metabolites had an inconsistent regulatory trend. Red dots indicate changes only at the metabolic level; Green dots indicate changes only at the gene level; Blue dots indicate changes at the metabolic level and gene levels. Black dots indicate both genes and metabolites were not differentially expressed (B), Heat map with Pearson’s correlation coefficient above 0.8 (C), Five pathways showed higher corrections after inoculation with TuMV. Green represents metabolites, red represents genes, solid lines represent positive correlations, and dotted lines represent negative correlations (D).
Horticulturae 08 00057 g009
Publisher’s Note: MDPI stays neutral with regard to jurisdictional claims in published maps and institutional affiliations.

