Article

Neglected Potential of Wild Garlic (Allium ursinum L.)—Specialized Metabolites Content and Antioxidant Capacity of Wild Populations in Relation to Location and Plant Phenophase

1
Department of Agricultural Technology, Storage and Transport, Faculty of Agriculture, University of Zagreb, Svetošimunska Cesta 25, 10000 Zagreb, Croatia
2
Department Vegetable Crops, Faculty of Agriculture, University of Zagreb, Svetošimunska Cesta 25, 10000 Zagreb, Croatia
*
Author to whom correspondence should be addressed.
Horticulturae 2022, 8(1), 24; https://doi.org/10.3390/horticulturae8010024
Submission received: 26 November 2021 / Revised: 22 December 2021 / Accepted: 22 December 2021 / Published: 24 December 2021
(This article belongs to the Collection Prospects of Using Wild Plant Species in Horticulture)

Abstract

:
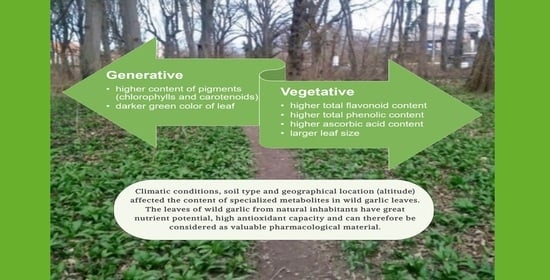
Wild garlic (Allium ursinum L.) is one of the species widely distributed in Europe and Asia and is often nutritionally neglected, characterized by a high content of various phytochemicals with high therapeutic potential and a range of biological activities. The aim of this study was to determine the content of bioactive compounds in the leaves of wild garlic populations collected from different micro-locations, and to determine the differences in the content of phytochemicals in the vegetative and generative phases. A significant content of different specialized metabolites was detected in all analyzed leaves of wild garlic populations regardless of the different factors (location and phenophase): vitamin C content with the highest determined value of 63.31 mg/100 g fw; total phenolic content with the highest determined value of 186.18 mg GAE/100 g fw (according to gallic acid in fresh sample); and antioxidant capacity with the highest determined value of 2230.66 µmol TE/L (according to Trolox). Significant differences in all the phytochemicals analyzed were observed depending on both the location and phenophase of the plants, with the most pronounced differences depending on the phenophase. Thus, lower levels of polyphenolic compounds and vitamin C were generally observed before the flowering phase, while the trend toward higher levels of pigment compounds was observed during the flowering phase of the plants. The results suggest that the leaves of wild garlic can be considered a valuable source of a variety of specialized metabolites with high antioxidant capacity, and thus have high production potential for various functional products and food supplements of natural origin, which are important for the promotion of human health.

Graphical Abstract

1. Introduction

An accelerated lifestyle, improper and inadequate nutrition, and the increasing prevalence of obesity are some of the negative features of the lifestyle of modern mankind. For this very reason, consumers are increasingly aware of the need to consume seasonally available, new food sources characterized by a rich nutritional composition and significant content of phytochemicals with high antioxidant capacity [1]. In fact, numerous studies show that a healthy diet and the prevention of various degenerative diseases are closely linked, and that by consuming foods rich in bioactive compounds, phytonutrients, we can have a significant positive impact on health. One of the important components of a healthy diet today is low environmental impact. This means that a healthy diet includes foods that are rich in nutrients as well as those that are less harmful to the environment, such as fruits, vegetables, and medicinal plant species [2]. Therefore, when planning a healthy daily meal, it is important to include those foods that are characterized by a rich composition of specialized, environmentally friendly metabolites.
One of the neglected plant species, especially in terms of nutrition, is wild garlic (Allium ursinum L.). Wild garlic is a medicinal plant of the Amaryllidaceae family that has long been used in traditional medicine to treat many ailments. However, studies on its chemical and nutritional composition and pharmacological activity are recent and very rare. The plant is widely distributed in Europe and Asia and does not grow in areas above 1900 m above sea level. The active growth phase of wild garlic lasts three to four months and begins in early spring, between late February and early March. The expected flowering period of wild garlic is between April and May. All parts of the plant are edible [3], but the bulbs and leaves are most commonly consumed. For consumption, the leaves are harvested by flowering time, while for medicinal purposes, leaves or herb (Allii ursini folium/herba), collected in April and May, and bulbs (Allii ursini bulbus), collected in September and October, are used [4,5]. Wild garlic is usually collected as a wild plant species from natural habitats, but in some countries, this plant species is on the list of protected plants, so it is not possible to collect it from the wild for personal use and sale [6]. The cultivation of this species is relatively demanding, as it has special requirements, especially environmental conditions in which it grows in its natural habitats. Moreover, the propagation of this plant is difficult due to certain biological characteristics or ecological requirements, such as slow growth, specific soil requirements and low germination rates [7].
Modern pharmacological studies have confirmed many of the above traditional indications for the use of wild garlic. It is recommended as a digestive, antimicrobial, and detoxifying agent for the body, and a number of in vitro and in vivo experiments have shown Allium ursinum to be a plant with high potential for the prevention and treatment of diseases of the cardiovascular system [8,9,10,11,12,13]. It is commonly used as a remedy for respiratory diseases, such as colds or bronchitis [14]. Wild garlic is effective in wound healing, as well as chronic skin diseases [6]. It is effective in regulating blood pressure, lowering insulin levels and total cholesterol levels, with a tendency to increase HDL cholesterol. All the mentioned beneficial effects of wild garlic on human health can be attributed mainly to the sulfurous compounds, which are the most characteristic constituents of Allium plants. Allium ursinum belongs to the Allium species of methiine/alliine type, which means that it contains mainly a mixture of (+)-S-methyl-L-cysteine sulfoxide (methiine) and (+)-S-allyl-L-cysteine sulfoxide (alliine). Another important chemical constituent of wild garlic is also polyphenolic compounds. The leaves of wild garlic contain high concentrations of ferulic and vanillic acid, p-coumaric acid, and kaempferol derivatives, as well as high concentrations of flavonoids [15,16,17]. In addition, wild garlic leaves contain pigment compounds, especially chlorophylls and carotenoids, vitamins, such as vitamin C, and of the macro- and microelements in wild garlic, the iron content of 247.9 mg/kg is noteworthy [18,19]. Precisely because of the rich nutritional composition and content of phytochemicals with high therapeutic potential and the range of biological activities, from antioxidant to antimicrobial, that it exhibits, this plant species can be considered a functional food with high production potential for various functional products and food supplements of natural origin.
Therefore, the aim of this study was to determine the content of bioactive components in the leaves of wild populations of wild garlic (Allium ursinum L.) collected from different micro-locations and to determine the differences in the content of phytochemicals in the vegetative and generative phases. We also aimed to determine the antioxidant capacity of collected plant samples.

2. Materials and Methods

2.1. Plant Material

The research was conducted throughout 2019 by sampling the leaves from wild garlic populations at 4 different locations (ZG I, ZG II, ZG III, S-R) within the continental Croatia shown in detail in Table 1. Geographical coordinates for each locality were recorded using Garmin vista e-Trex GPS (Garmin International, Inc., Hampshire, UK). Collected plant material were botanically determined through accessible Virtual Herbarium ZAGR (http://herbarium.agr.hr/; accessed on 4 May 2019). Approximately 500 g of fresh plant material (leaves) was randomly collected from each location for a total of 20 plants per habitat. Fresh plant material was collected on two harvest periods, depending on the phenophase of plant development: I period on 04 April 2019 before flowering (vegetative phase) and on 19 April 2019 when the plants were in full flower (generative phase). The collection was carried out in the early morning hours on dry weather, and the fresh leaves were packed in paper bags immediately after collection and delivered to the laboratory, where they were stored in a cool place at 4 °C until the intended analysis.
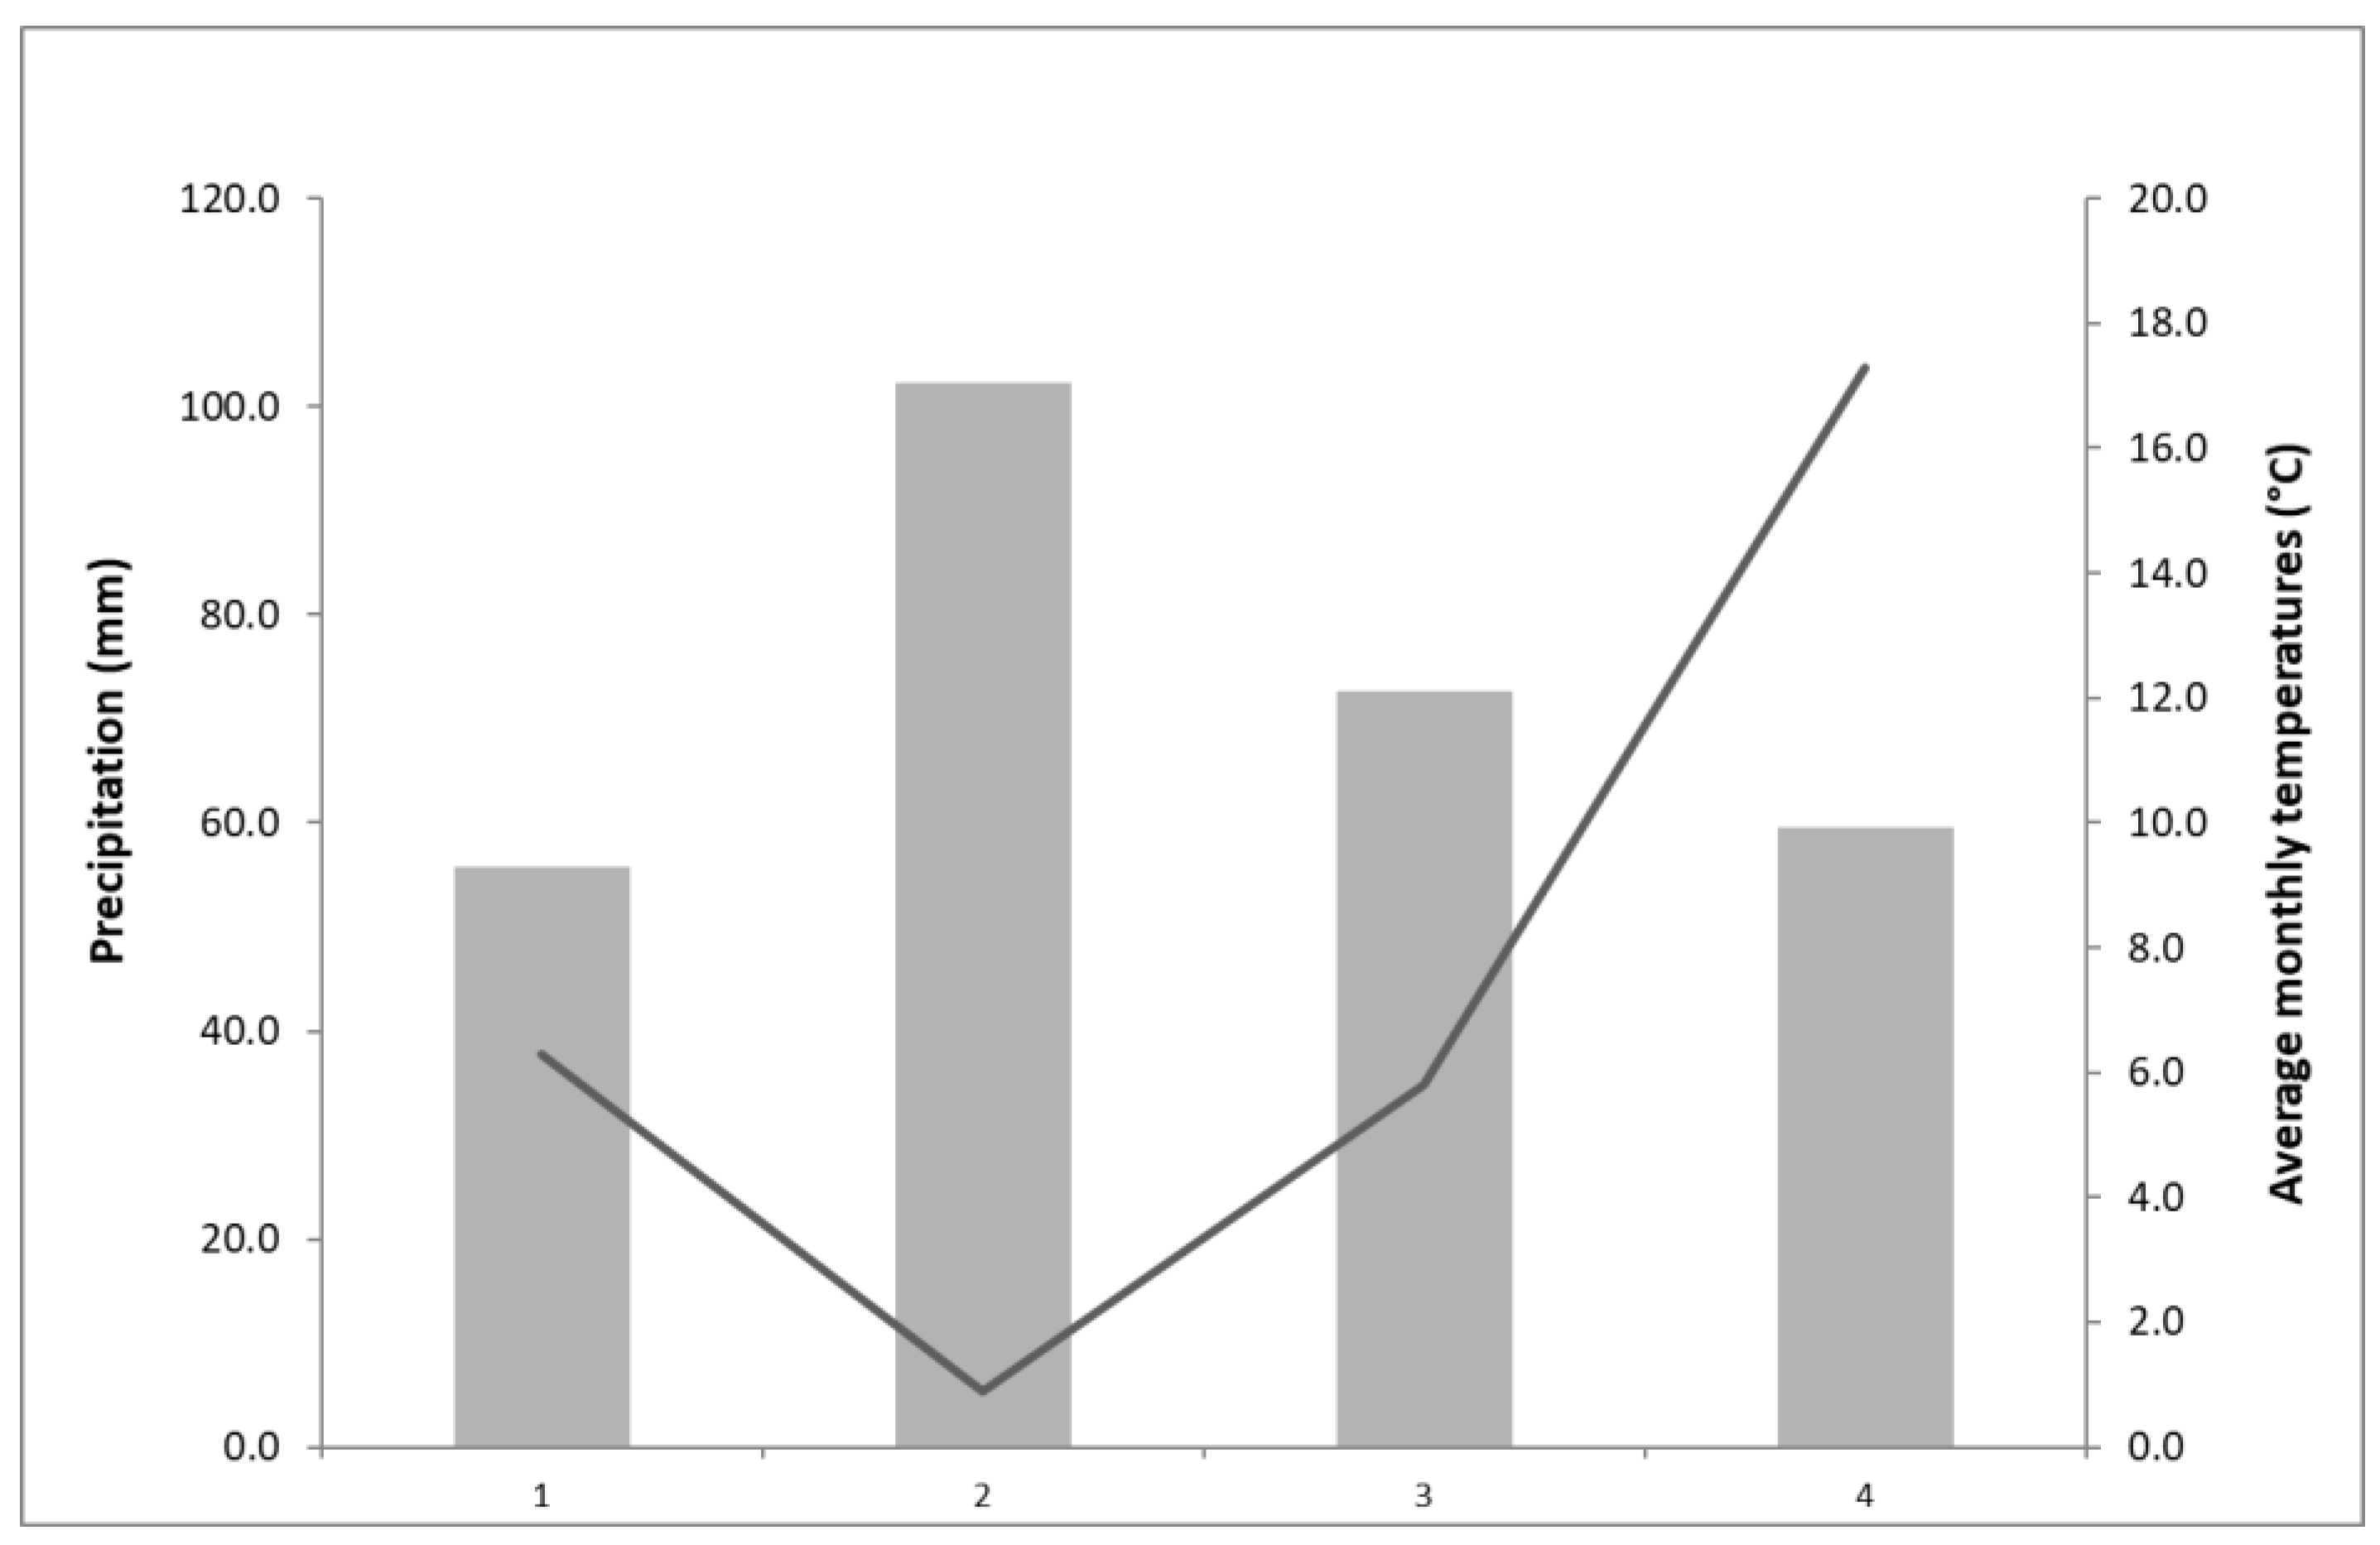
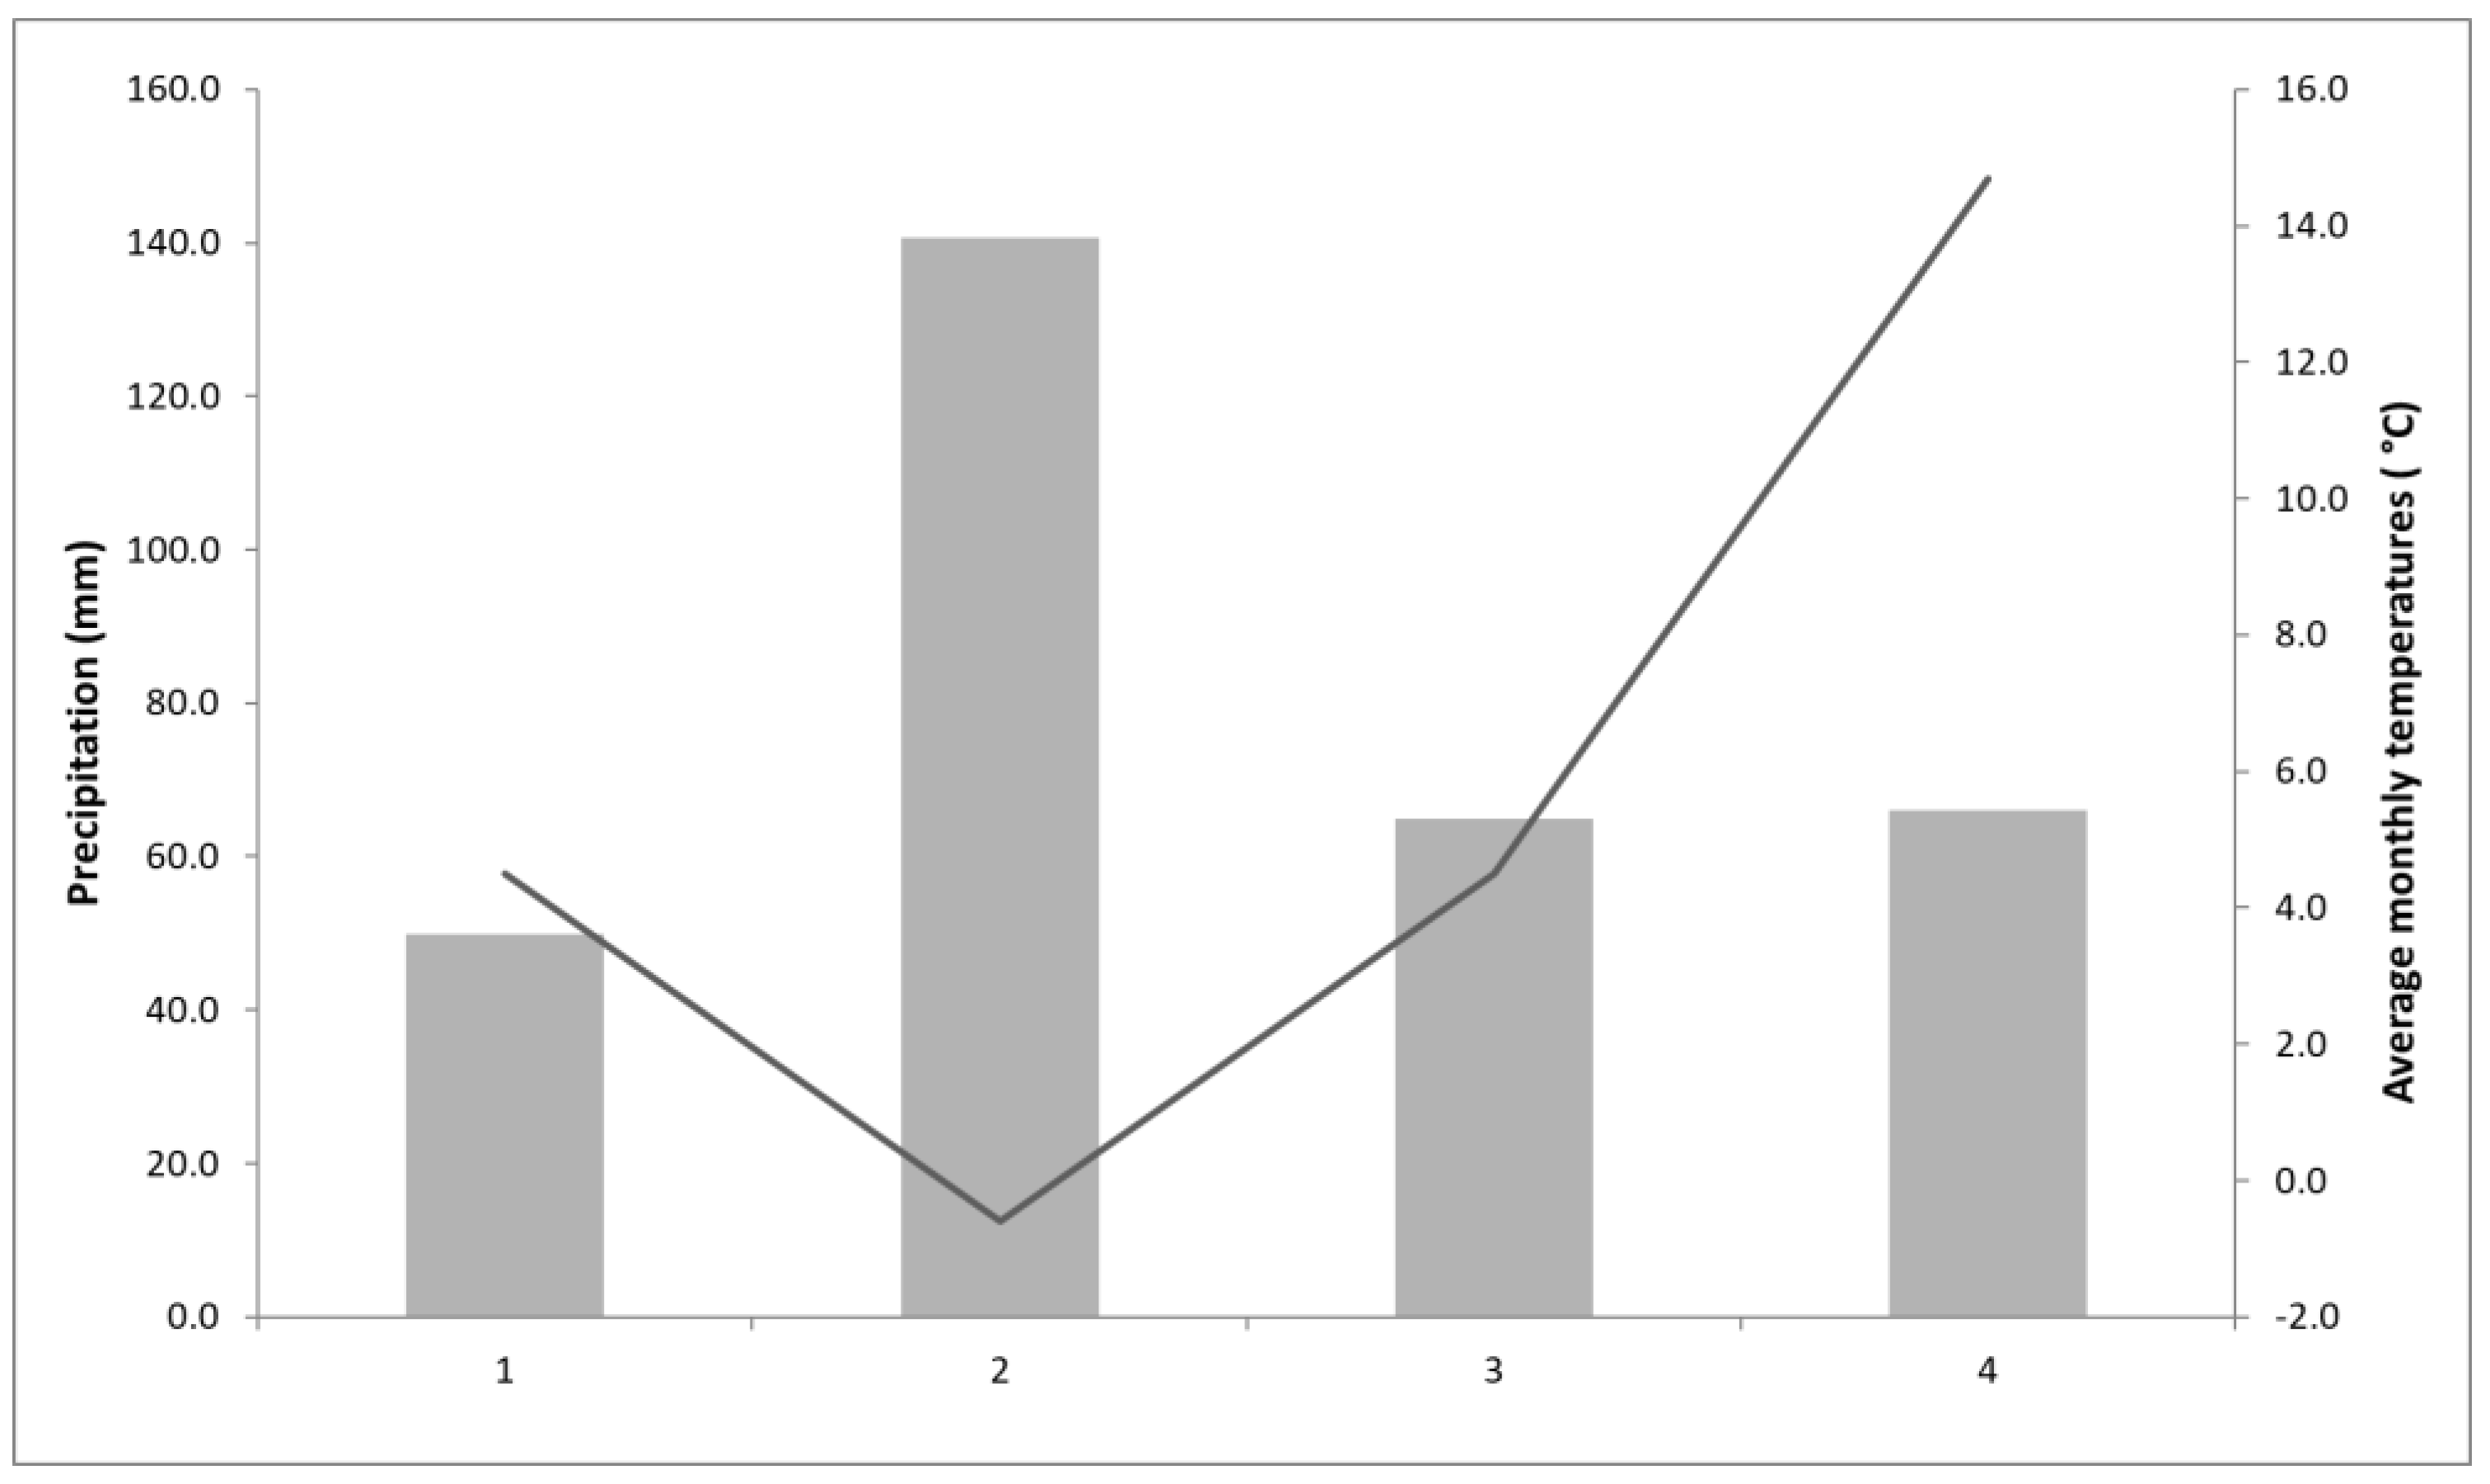
The climatic conditions of each location during the four-month period (from January to April 2019) are described by climate diagrams (Figure 1, Figure 2 and Figure 3) with data from meteorological stations closest to the locations from which the plant material was collected: thus, for the locations of ZG I and II from meteorological stations ‘Maksimir’ (Figure 1); for ZG III from meteorological station ‘Grič’ (Figure 2); and for the location S–R from station ‘Šibice’ (Figure 3).

2.2. Determination of Morphological and Physicochemical Characteristics of Leaves

Basic morphological characteristics, i.e., length (mm), width (mm), and external color, were determined on a sample of a total of 30 leaves from each location. Leaf size was measured using a digital moving balance (Jiangsu, China), while chromaticity parameters (L*, a*, b*, C, h°) were determined according to the CIELab method using a colorimeter (ColorTec PCM+, PCE Instruments, Southampton, UK). Standard laboratory procedures according to Association of Officiating Analytical Chemists (AOAC) [22] were used to determine total dry matter content (DM, %) by drying at 105 °C to constant mass, total acidity (TA, %) by potentiometric titration and pH with a digital pH meter (Mettler Toledo, SevenMulti, Greifensee, Switzerland).

2.3. Determination of Specialized Metabolites and Antioxidant Capacity of Fresh Leaves

The ascorbic acid (AsA) content was determined by titration with 2,6-dichloroindophenol (DCPIP) according to the standard method [23]. AsA was isolated from the fresh wild garlic leaves by homogenizing 10 g ± 0.01 of the plant material with 100 mL of 2% (v/v) oxalic acid. The prepared solution was allowed to stand for about 20 min, filtered through Whatman filter paper and a total volume of 10 mL was used for titration with DKF. Titration with freshly prepared DKF was carried out until pink coloration appeared. The final AsA content was calculated according to Equation (1) and expressed as mg/100 g fresh weight (fw).
AsA = V   ( DKF ) × F D × 100
where V (DCPIP) is the volume of DCPIP (mL); F is the factor of DCPIP; and D is the sample mass used for titration.
Total phenols (TPC), flavonoids (TFC) and non-flavonoids (TNFC) were determined spectrophotometrically (Shimadzu UV 1900i, Germany) according to the method of Ough and Amerine [24]. The isolation of polyphenolic compounds was performed as follows: 10 g ± 0.01 of the plant material was weighed into an Erlenmeyer flask (Sartorius, Entris® II Essential, Zagreb, Croatia) and 40 mL of 80% EtOH (v/v) was added and heated to boiling for 10 min under reflux. After 10 min, the sample was filtered through Whatman filter paper into a 100 mL volumetric flask while the remainder of the sample was transferred to the Erlenmeyer flask and another 50 mL of 80% EtOH (v/v) was added. The procedure was repeated under reflux for 10 min. The filtrates were combined, and the flask was made up to the mark with 80% EtOH (v/v). The polyphenolic extract thus prepared was used for the reaction with Folin–Ciocalteu reagent. To a volumetric flask of 50 mL, 0.5 mL of the ethanolic extract was added and the following chemicals were added: 30 mL of distilled water (dH2O), 2.5 mL of the prepared Folin–Ciocalteu reagent (1:2 with dH2O), and 7.5 mL of saturated sodium carbonate solution (Na2CO3); the flask was filled to the mark with dH2O, and the prepared sample was allowed to stand at room temperature for 2 h with intermittent shaking. For TNFC determination, the separation was performed according to the following procedure: 10 mL of the ethanolic extract was added to the 25 mL volumetric flask, and 5 mL of HCl (1:4, v/v) and 5 mL of formaldehyde were added. The prepared samples were bubbled with nitrogen (N2) and left for 24 h at room temperature in a dark place. After 24 h, the samples were filtered through Whatman filter paper and the same Folin–Ciocalteu reaction as for TPC was performed. The absorbance of blue color in both TPC and TNFC reactions was measured spectrophotometrically at 750 nm using dH2O as a blank. Gallic acid and catechol were used as external standards and the concentration of TPC and TNFC content was expressed as mg GAE/100 g fresh weight (fw). The TFC content was mathematically expressed as the difference between total phenols and non-flavonoids.
Chlorophyll a (Chl_a), chlorophyll b (Chl_b), total chlorophylls (TCh) and total carotenoids (TCA) were determined according to the method described by Holm [25] and Wettstein [26]. For the extraction of pigments from wild garlic leaves, 0.2 g ± 0.01 of the fresh plant material was weighed, and a total of 15 mL of acetone (p.a.) was added three times. After each addition of acetone, the samples were homogenized using a laboratory homogenizer (IKA, UltraTurrax T-18, Staufen city, Germany). The final solution was filtered through Whatman filter paper and transferred to a 25 mL volumetric flask. Absorbance was measured spectrophotometrically (Shimadzu UV 1900i, Duisburg Germany) at 662, 644 and 440 nm using acetone as a blank. Holm–Wettstein equations were used to quantify each pigment (2), and the final content was expressed in mg/g.
Chl _ a = 9.784 × A 662 0.990 × A 644   [ mg / L ]
Chl _ b = 21.426 × A 644 4.65 × A 622   [ mg / L ]
TCh = 5.134 × A 662 + 20.436 × A 644   [ mg / L ]
TCA = 4.695 × A 440 0.268 × TCh   [ mg / L ]
The ABTS (2,2′-azinobis (3-ethylbenzothiazoline-6-sulfonic acid)) assay was performed to determine the antioxidant capacity according to the method described by Re et al. [27]. ABTS, potassium persulfate, and Trolox (6-hydroxy-2,5,7,8-tetramethylchroman-2-carboxylic acid) (TE) were purchased from Sigma-Aldrich (St. Louis, MO, USA). Trolox was used as the antioxidant standard, and a standard solution of Trolox (2.5 mM) was prepared in ethanol (80% v/v). To prepare the ABTS radical solution (ABTS+), 5 mL of ABTS solution (7 mM) and 88 mL of potassium persulphate solution (140 mM) were mixed and left in the dark at room temperature for 16 h. On the day of analysis, a 1% ABTS+ solution (in 96% ethanol) was prepared. A total of 160 µL of the ethanolic extract was directly injected into the cuvette and mixed with 2 mL of 1% ABTS+ while absorbance was measured at 734 nm (Shimadzu 1900i, Duisburg, Germany). The final antioxidant capacity results were calculated from the calibration curve and expressed in µmol TE /L (according to Trolox).

2.4. Statistical Analysis

The data obtained were statistically analyzed using SAS® version 9.4 [28]. A generalized linear model (PROC GLM) with replicates and site and plant phenophase interactions was used for the analysis (L–location; P–phenophase; L × P–location and phenophase). Means were compared using the least significant difference (LSD) t-test and considered significantly different at p ≤ 0.01. In addition to the results, different letters are indicated in the tables to indicate significant statistical differences between the different treatments at p ≤ 0.0001. The average deviation of the results from the mean for each parameter studied with the standard deviation values are also indicated.

3. Results and Discussion

3.1. Morphological and Physico-Chemical Characteristics of Wild Garlic Leaves

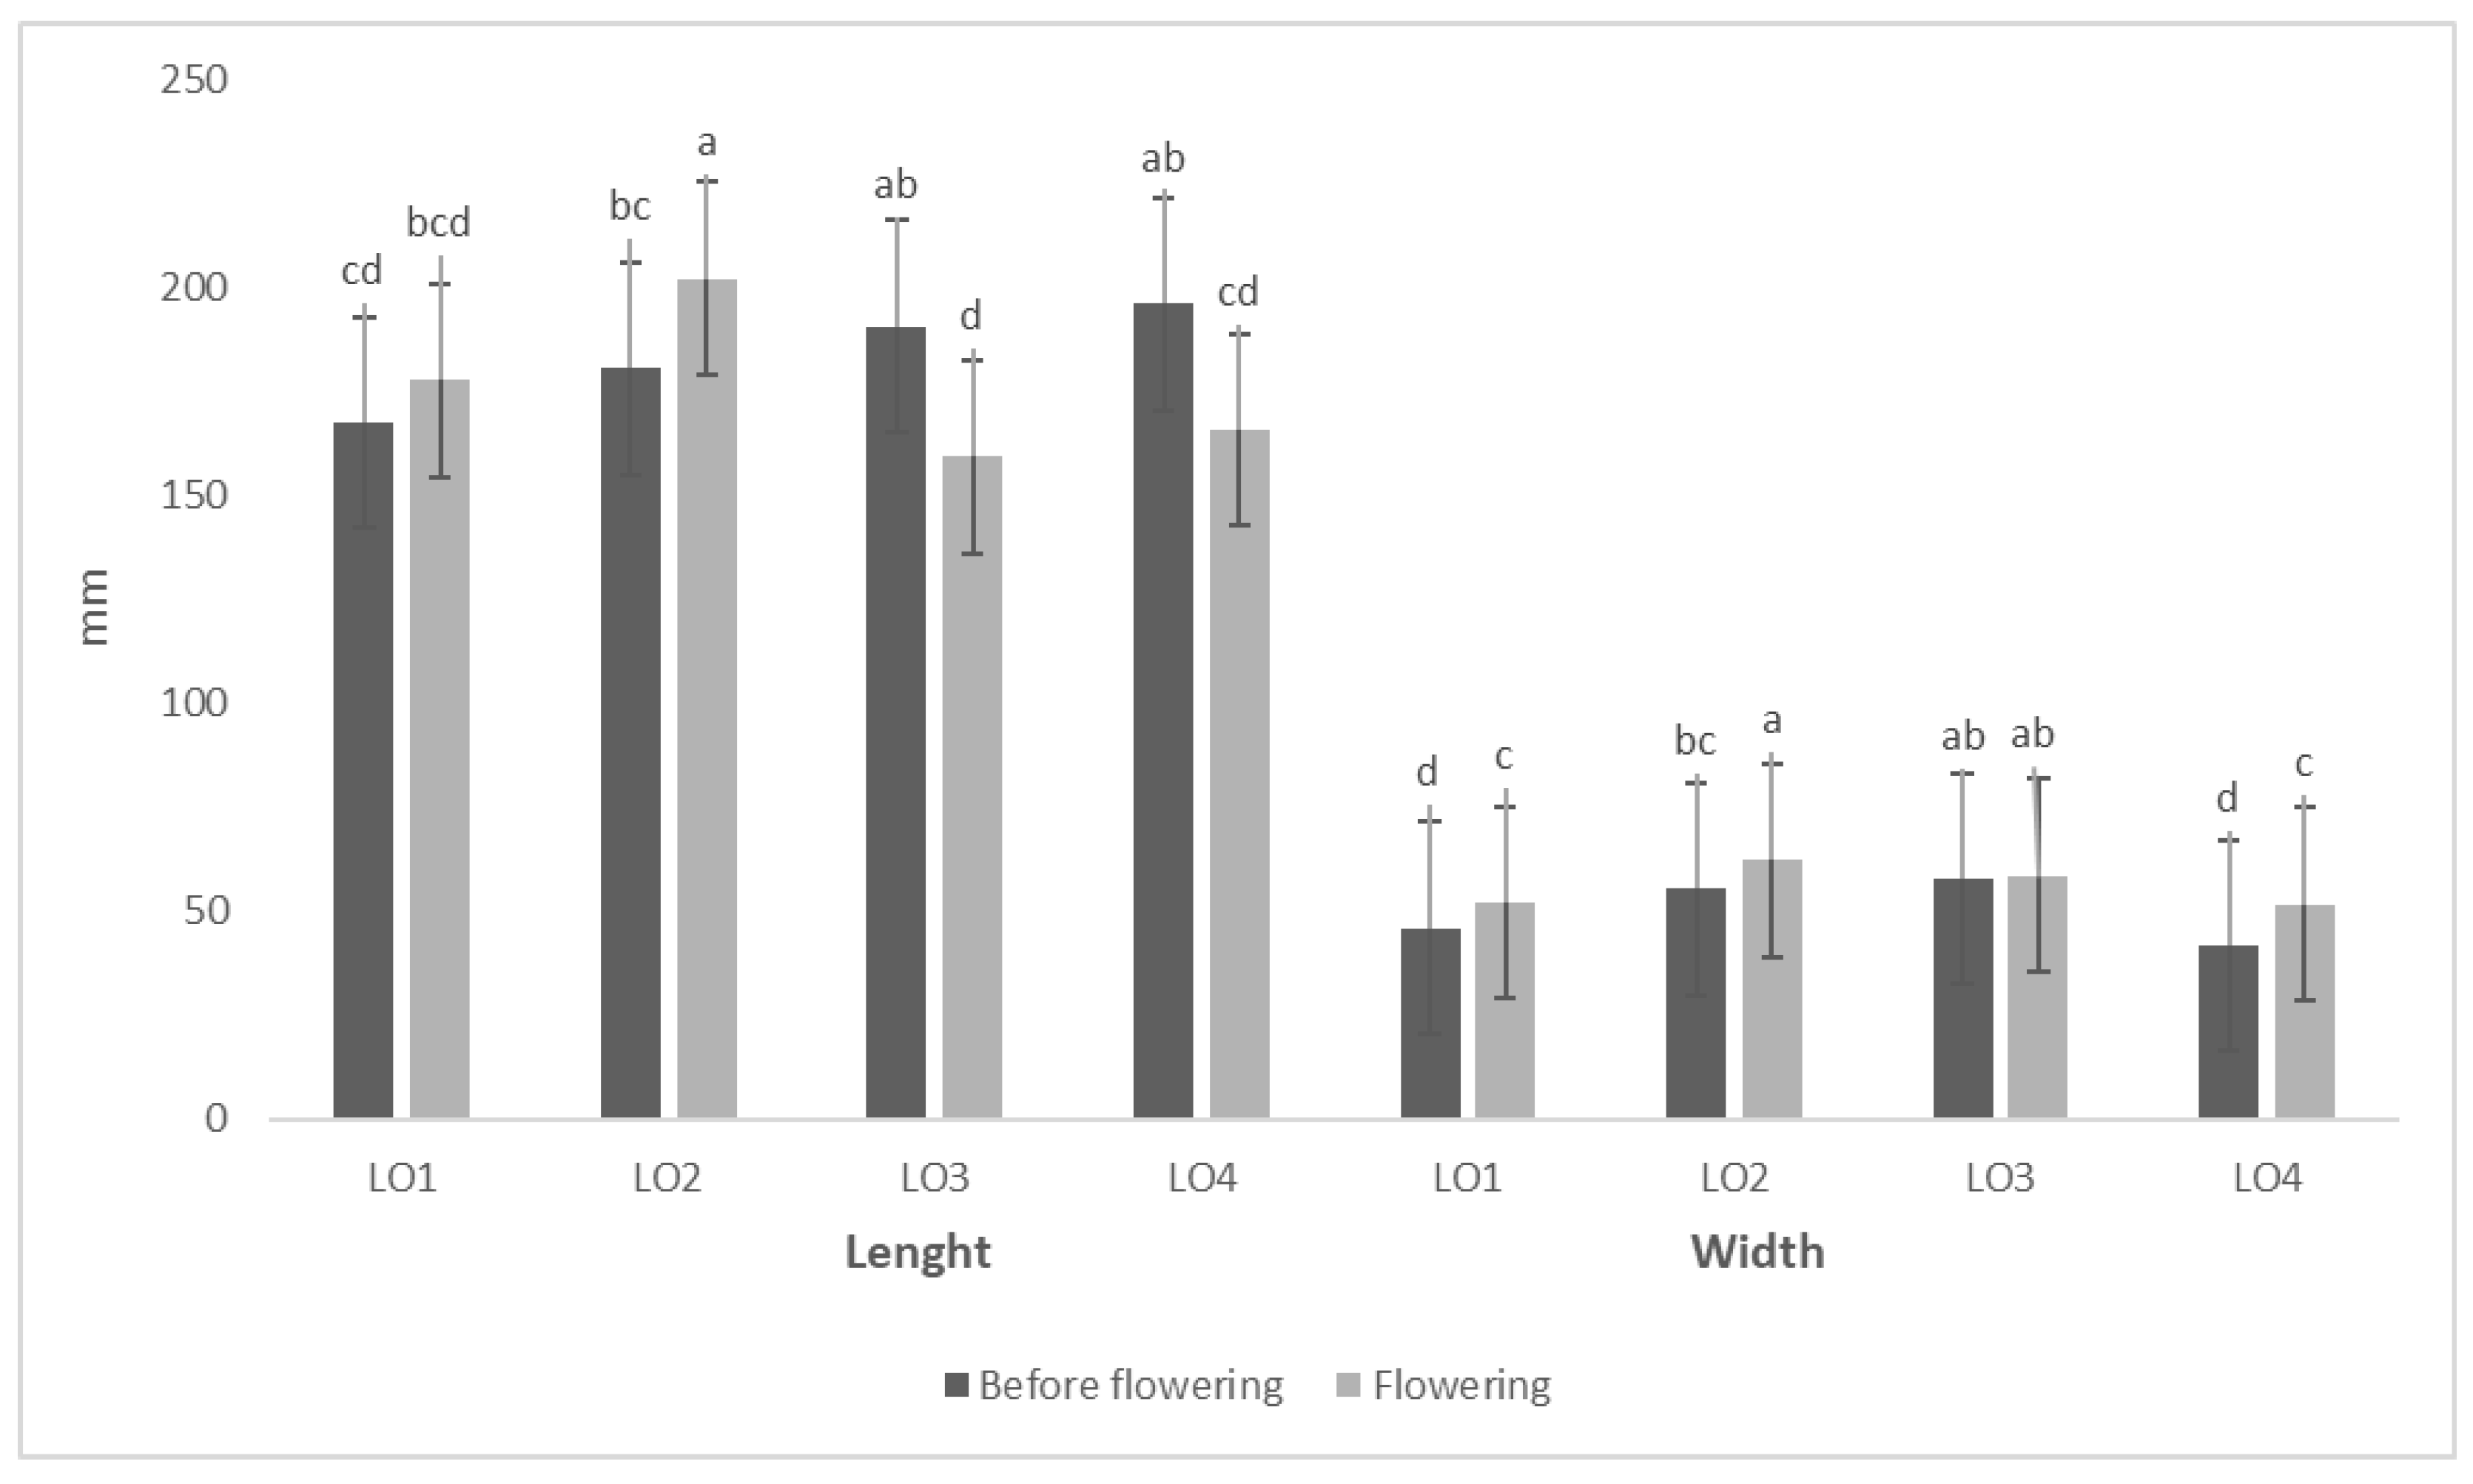
The morphological characteristics of wild garlic leaves, and their chromaticity parameters are shown in Figure 4 and Table 2. Significant differences were found among the studied samples in both leaf length and leaf width in relation to the location and phenophase (before and during flowering) of wild garlic populations. Leaf length before flowering varied between 159.99 and 195.99 mm depending on the sampling location, with an average value of 187.24 mm, while leaf width varied in the range of 41.92–57.95 mm, with an average value of 49.59 mm. During flowering, the length of leaves varied in the range of 157.38–202.09 mm depending on the location with an average value of 185.64 mm, while the width was in the range of 55.24–66.23 mm, with an average value of 59.55 mm. From the results obtained, it can be concluded that leaf length did not change significantly as a function of the phenophase, while the leaf width was on average 10 mm greater during the flowering phase. The size, i.e., leaf length and width, differed significantly according to the place of sampling. For example, before flowering, plants from LO 4 had the largest leaf length (195.99 mm), while plants from LO 3 had the largest width (57.95 mm). During flowering, plants from LO 2 exhibited the largest leaf size with 202.09 mm length and 62.2 mm width. Other authors also note a significant influence of certain factors on the morphological characteristics of the plants, from the phenophase of development (flowering) to the ecotypes in the year, i.e., genetic traits, to basic climatic factors [29,30]. Since all the samples analyzed have an average leaf width of more than 35 mm, the populations studied belong to the form ucrainicum.
The chromaticity parameters of fresh wild garlic leaves of selected wild populations from different locations and plant phenophases (before and during flowering) are presented in Table 2. Significant differences were found in all analyzed color parameters both among different factors, locations and phenophases. Depending on the phenophase of the plant, L* values ranged from 19.42 to 29.44 with an average value of 23.33 irrespective of the location, while higher L* values were obtained in the flowering phase with an average value of 24.56. According to Hunterlab [31], when L* = 0, there is no reflection, indicating the presence of black, and when L* = 100, the reflection is greatest, indicating the presence of white. An a* value indicates the presence of a red or green color, with (−a*) indicating the presence of green and positive values (+a*) indicating the presence of red. Thus, it was expected that the observed negative values of the a* parameter would occur in all leaf samples, regardless of location or phenophase. On average, more green coloration was observed in the leaves before flowering (mean value of −11.42), compared to the color of the leaves at the flowering stage of the plant (mean value of −11.29). In addition, depending on the phenophase in general, regardless of the location, higher b* values were observed for leaves before flowering (average value of 17.27), compared to leaves in the flowering phase of the plant, indicating a stronger yellow coloration since positive b* values (+b*) indicate the presence of yellow, while negative values (−b*) indicate the presence of blue. Both parameters C and h° represent the color saturation. The results of this study suggest that leaves differ in color from different locations, with dark green coloration being more pronounced in flowering plants.
The results of some physicochemical properties of wild garlic leaves are presented in Table 3. Significant differences were found for all the analyzed parameters depending on the location and phenophase. In general, higher dry matter content (DM) was recorded in plant leaves before flowering, with an average value of 9.83%, while lower DM values were recorded in all observed locations (except LO 4) when plants were in the flowering phase, with an average value of 9.59%. In general, the DM content or the water content of the plant material correlates strongly with the specific pedoclimatic conditions, i.e., temperature, humidity, precipitation, soil type, number of sunny days, altitude, but also with the phenophase of plant development [29,30,32]. In the conditions of higher temperature values, i.e., higher average air temperatures, and lower amounts of recorded precipitation, a higher DM content is expected, respectively, a lower accumulation of water in the plant material (lower water content). Based on the aforementioned, the lowest DM content on LO 4 is expected, due to the fact that according to meteorological data (Table 1) on this location the lowest average air temperature and the highest precipitation were recorded. Vegetable species, in general, are not specific in terms of organic acid content, and pH values close to neutral as well as very low acid content were expected for samples of fresh wild garlic leaves. Both total acid content (TA) and pH value significantly differed depending on the location but the phenophase of plant development had a much more pronounced effect on the mentioned parameters. In general, higher TA and pH values were recorded in plant leaves in flowering stage with an average value of 0.071% for TA and 5.67 for pH.

3.2. Specialized Metabolites and Antioxidant Capacity of Fresh Leaves

The results of the analysis of the content of specialized metabolites in fresh wild garlic leaves differed significantly depending on the micro-location (L) and plant phenophase (P) (Table 4). Both factors, individually and in interaction (L × P), showed a significant effect on ascorbic acid (AsA) content, with AsA levels generally higher in the plant phenophase before flowering. Irrespective of location, the AsA content was found to be 84% higher in plant leaves before flowering with an average value of 55.64 mg/100 g fw. When comparing the locations, some variations were observed depending on the plant phenophase. For example, the highest AsA content before flowering (63.31 mg/100 g fw) was recorded in the leaves of LO 2 (ZG II), while the highest AsA content (39.17 mg/100 g fw) was recorded in the flowering phase on LO 4 (S-R). These two sites differed primarily in terms of altitude, soil type and also basic climatic conditions (average air temperature, precipitation and number of sunny days). In general, ecological factors (biotic and abiotic) are among the crucial factors that have the greatest impact on the content of specific metabolites. Some conditions that plants are often exposed to in their native environment when growing wild, such as drought, high/low air temperatures, excessive light exposure, wind, rain, etc., can cause stress in plants, causing them to activate their protective mechanisms to protect themselves and adapt to the new survival conditions. One of the effective antioxidants whose synthesis and accumulation in plant organelles is activated when plants are exposed to stress conditions is ascorbic acid, a low molecular weight antioxidant that is considered one of the best-known oxygen scavenging molecules. Numerous scientific data demonstrate the activation and increased AsA content in plants exposed to stress [33,34,35]. In conclusion, different AsA contents in leaves of wild garlic collected from different locations can be expected, as the four micro-locations studied differed significantly in terms of climatic conditions, soil type and geographical location (altitude). However, compared to the location, the phenophase of plant development [36] had a stronger influence on AsA content. L-ascorbic acid is involved in a number of important metabolic functions in the plant organism, including detoxification of reactive oxygen species (ROS), and serves as an important co-factor in the biosynthesis of some plant hormones (ethylene, gibberellic acid, and abscisic acid), affecting the regulation of developmental processes including senescence, but also flower induction. During senescence, there is a loss of antioxidant capacity and thus, an increase in ROS in plant cells, which can be assumed to be a direct consequence of low AsA levels. This leads to damage of the photosynthetic apparatus and a decrease in photosynthetic activity in tissues deficient in AsA, thereby accelerating senescence [37,38,39]. Ultimately it can be concluded that flowering is delayed by high levels of AsA, respectively, at the beginning of flowering, AsA levels decrease significantly, which is in agreement with the results of this research.
Polyphenolic compounds are some of the most significant antioxidants for plants, having an important role in scavenging and the inhibition of ROS, thus protecting plant cells from oxidative stress. Phenols are molecules of plant secondary metabolism and are involved in plant-defense mechanisms, protecting the plant from different stress conditions, biotic, abiotic and anthropogenic [40,41,42]. As for the AsA content, the phenols content decline causes oxidative stress in the flower, leading to programmed cell death and flower senescence. Thus, a decrease in phenols content toward senescence may be a driving factor for senescence to occur [43]. However, some studies also indicate the significant increase in the total phenols content from the bud to senescent stage, primarily significantly depending on the plant family [44,45,46,47]. Namely, some authors point out that the consequence of total phenols increase in the flowering phase of the plant can be due to failure of the reallocation of the phenols toward the developing parts during senescence, or by the increased synthesis of phenols toward senescence as part of the defense mechanism [48,49]. Comparing the results obtained in this research, in general, regardless of the location, significantly, TPC (about 13%) and TFC (about 27%) were determined in plant leaves before flowering. These results support the thesis that phenol content levels decrease toward senescence as a driving factor for senescence to occur. The results of TNFC content slightly differ since the trend of TNFC increase was determined in plant leaves in the flowering stage. Except phenophase, natural habitant location also significantly influenced TPC, TFC and TNFC contents in wild garlic leaves. Three locations, LO 1, LO 2 and LO 3, did not significantly differ in TPC and TFC content, with the average determined value of 184.77 mg GAE/100 g fw for TPC and 108.7 mg GAE/100 g fw for TFC, which is compared with phenolics content determined in LO 4, about 34% higher value for TPC and about 44% higher value for TFC. In addition, the two-way ANOVA results indicate the significant impact both of location (L), phenophase (P) and their interaction (L × P) on all analyzed polyphenol compounds.
Light is one of the most pronounced abiotic factors responsible for pigment synthesis in the plant cells, crucial for the photosynthesis process and plant growth in general [50,51]. Besides chlorophylls as the main plant pigments responsible for the absorption of specific light wavelengths and thus undisturbed flow of the photosynthesis process, carotenoids play an important role as photoprotective pigments crucial in plant organism defense against stress light conditions (too much exposure to light) [52]. Every specific geographical location is characterized by specific climatic conditions as well as number of sunny days, which are beside other climatic conditions in direct correlation with pigments synthesis and accumulation. If we relate the results of analyzed pigment compounds in wild garlic leaves within this research (Table 5) and the average number of sunny days of investigated geographical locations (LO 1–4; Table 1), it is evident that the total chlorophylls (TCh) content is higher in leaves of wild garlic populations collected on locations with a greater number of sunny days recorded (LO 1 and 2, on average 1.14 mg/g), which is in comparison with other specific locations with a lower number of sunny days, about 15% higher value compared to the TCh from LO 3 and about 22% higher compared to the TCh of leaves from LO 4 (the least number of sunny days). An opposite trend, but expected, was recorded for total carotenoids (TCa) depending on the sampling location (L) on which those with a lower recorded number of sunny days tended to have lower TCa values, both before and in the flowering state. Those results are expected due to the main role of carotenoids as photoprotective pigments in plant cells, which the synthesis rate rises when the plant is exposed to conditions of excessive light (too much UV radiation). The content of plant pigments is, besides the aforementioned abiotic factors, strongly affected by plant phenophase (P), and in general, plants tend to accumulate pigments in a generative state; respectively, chlorophyll content is the highest in the flowering stage [53,54], which is supported by results from this research. Both the highest TCh (1.42 mg/g) and TCa (0.62 mg/g) content were determined in wild garlic leaves from LO 2 in the flowering stage of plants. In general, regardless of the location, about 16% higher TCh values and about 8% higher TCa values were recorded in leaves in the flowering stage of plants, compared to the values of analyzed pigments in plants before flowering. Additionally, supported by the results of the significance of influence of the individual varied factors (location and phenophase), as well as their interaction (L × P), it can be concluded that both have significant influence on the content of analyzed pigments.
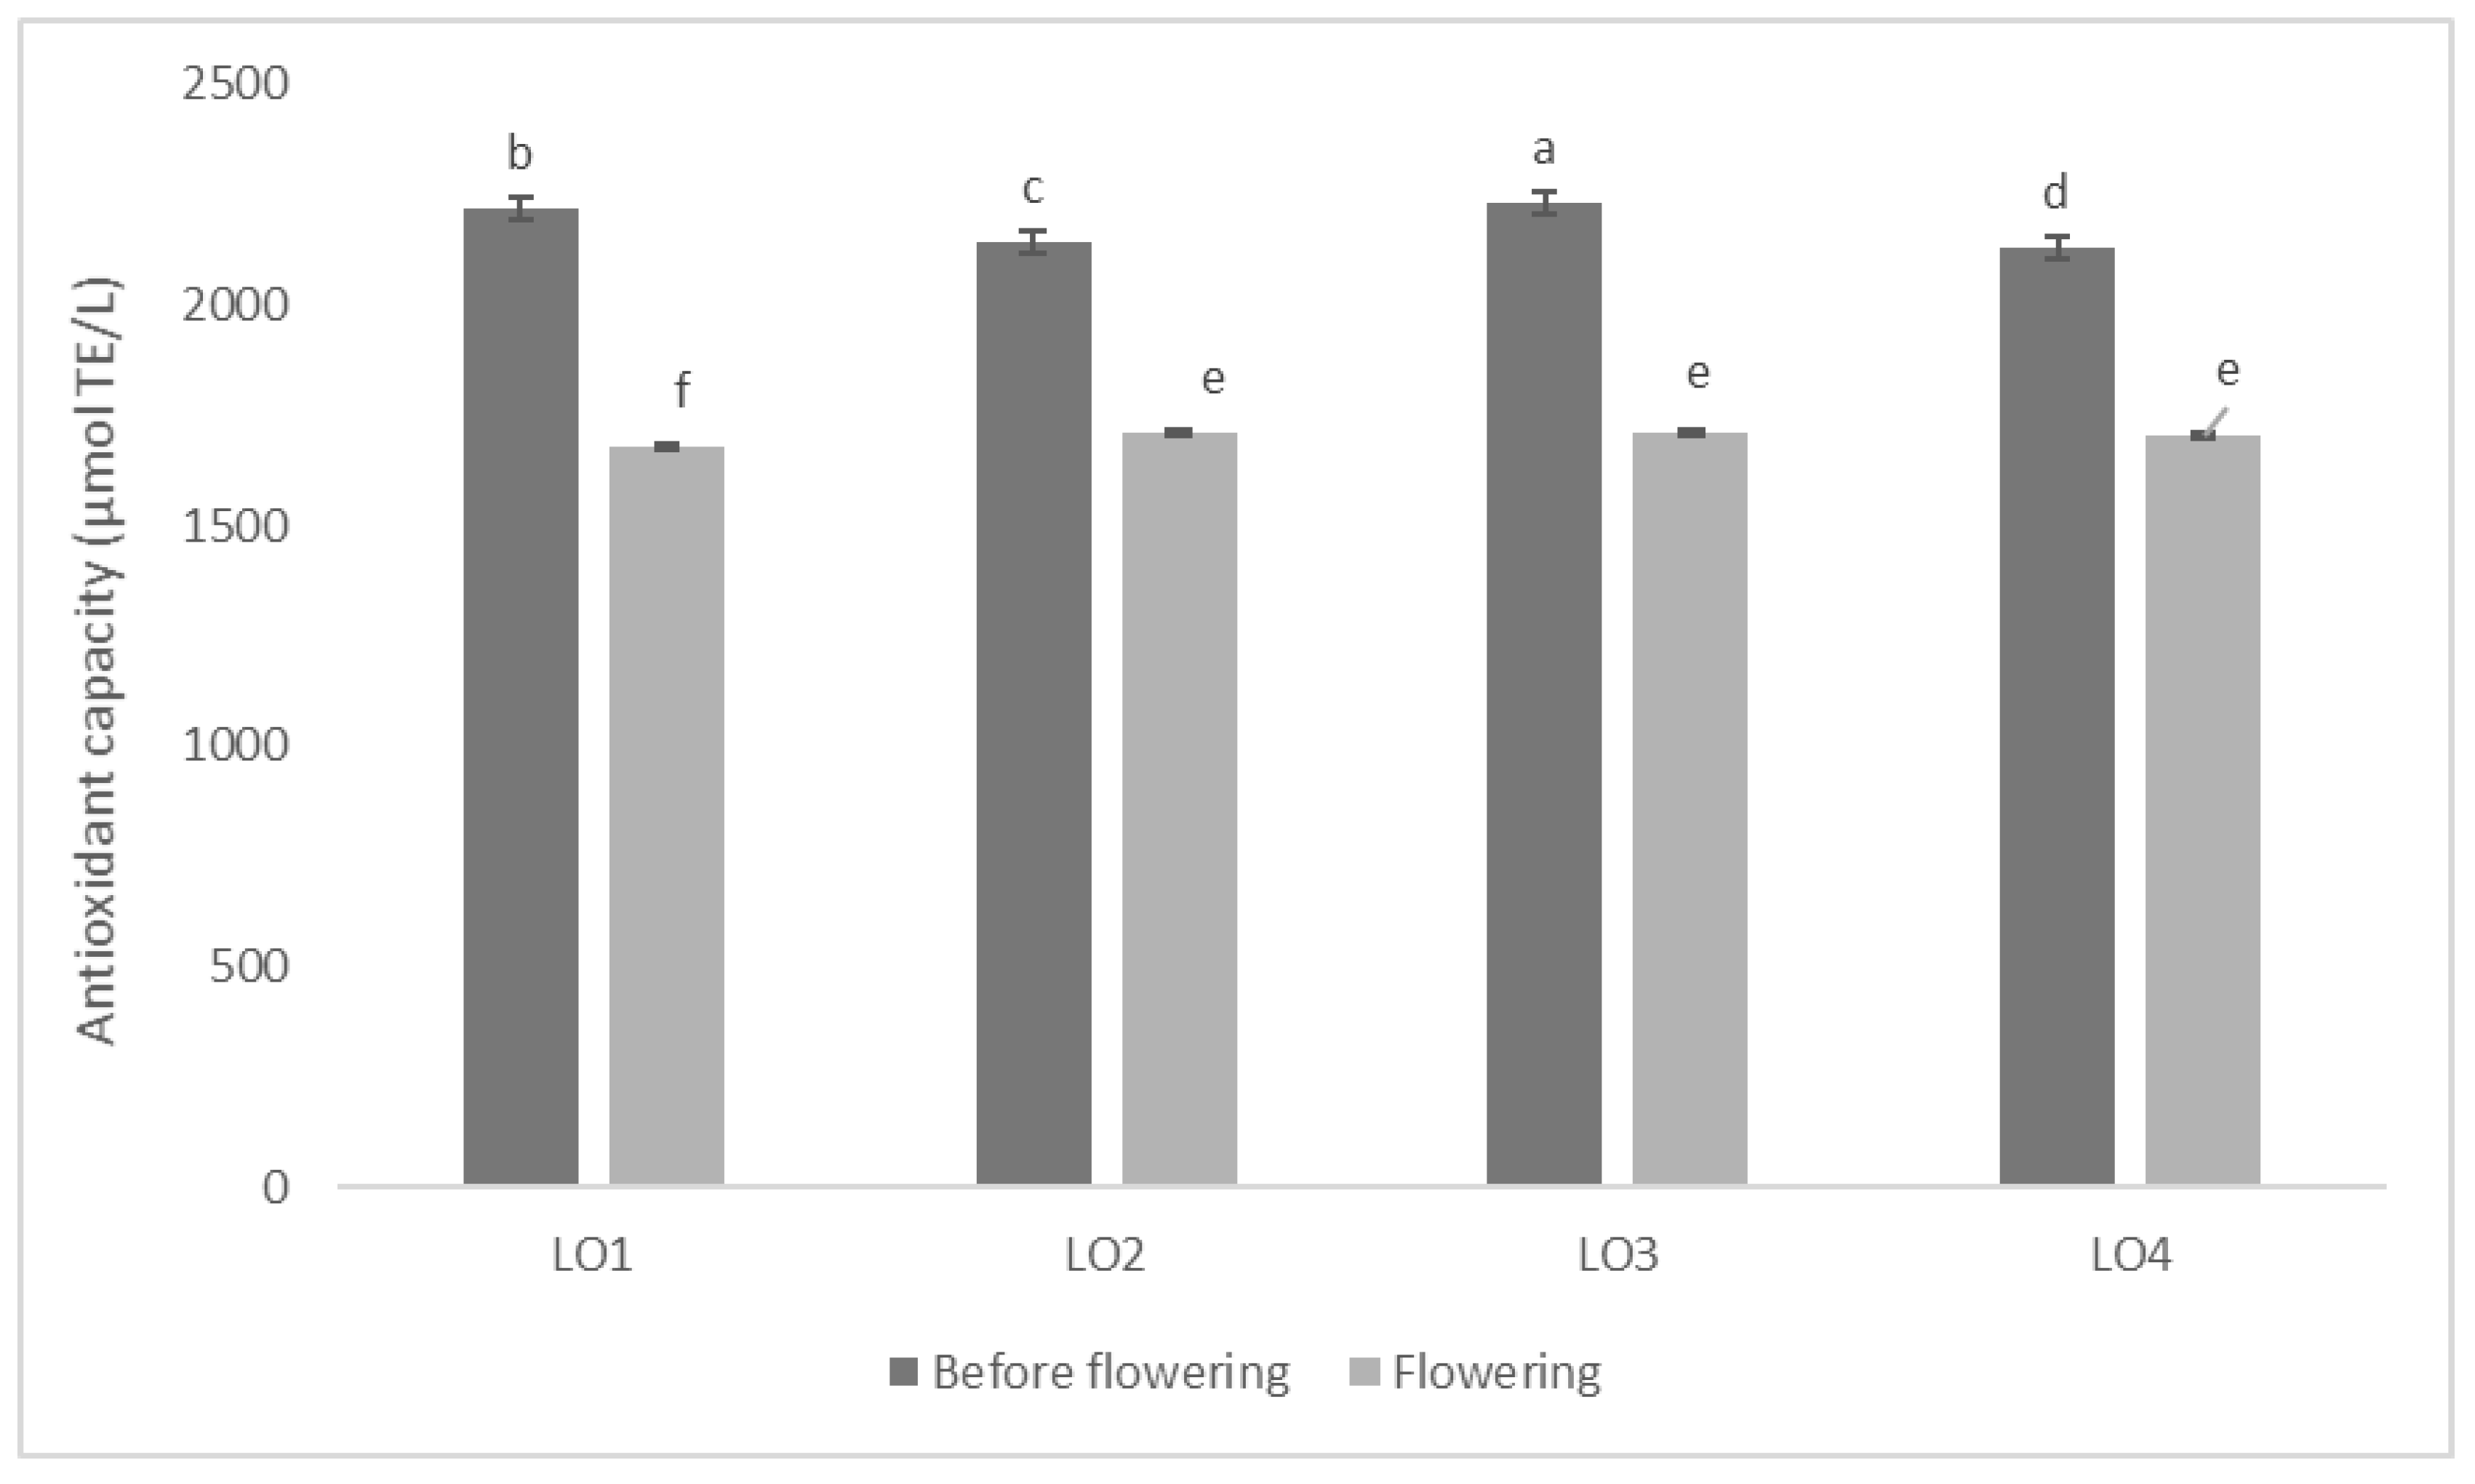
Given the results of all analyzed specialized metabolites within this research in leaves of wild garlic, the antioxidant capacity, regardless of the specific location, is expected to be higher before flowering (Figure 5). Namely, the content of bioactive compounds is in direct correlation with the antioxidant capacity, respectively, plant tissues which tend to accumulate higher levels of phytochemicals will exhibit higher antioxidant capacity, and thus have higher potential of ROS reduction and inhibition, protecting plants from oxidative stress. Phytonutrients, such as polyphenolic compounds, vitamins, chlorophylls, carotenoids, etc., are recognized as one of the strongest antioxidants, and thus, have numerous benefits to human health [39,40,55,56,57]. According to the results of TPC and TFC, as well as the content of AsA, higher antioxidant capacity with an average value of 2179.24 µmol TE/L, regardless of the location, was determined in the plant phenophase before flowering. Compared to the average antioxidant capacity value of wild garlic leaves when plants were in flowering stage, even 28% higher antioxidant capacity was determined in plants before flowering. In general, regardless of the varied factors, location and phenophase, leaves of wild garlic can be recognized as plant material with high antioxidant capacity.

4. Conclusions

Phenophase and location, i.e., specific pedoclimatic conditions, have a significant influence on the analyzed morphological and physicochemical characteristics, content of specific specialized metabolites and antioxidant capacity of wild garlic leaves. Significant changes in leaf size were more pronounced as a function of the plant phenophase, with a larger leaf size (average 183.55 mm × 50.34 mm) observed in the vegetative phase, i.e., before flowering. In addition, irrespective of the location, a greater dark green coloration of the leaves was observed when the plants were in the flowering phase. The changes in dry matter content were more pronounced depending on the characteristic location, especially on the geographical location (altitude), climatic conditions of the particular location (average air temperature, humidity, and number of sunny days) and soil type. Thus, the lower dry matter content (on average 9%) was found in leaves of sites with the lowest average air temperature and highest recorded precipitation (LO 1 and 4). Irrespective of the location, ascorbic acid content (on average 55.64 mg/100 g fw), total phenolic content (on average 173.18 mg GAE/100 g fw) and total flavonoid content (on average 100.4 mg GAE/100 g fw) were found to be higher in leaves of pre-flowering plants, proving that the decrease in the above specialized metabolites toward senescence is a driving factor for the occurrence of senescence. Since the four microsites studied differed significantly in terms of climatic conditions, soil type and geographical location (altitude), changes in specialized metabolites were also observed depending on the location, especially in plant pigments (chlorophylls and carotenoids), the content of which was generally higher at sites with more sunny days, but significantly lower before flowering (TCh on average 1.05 mg/g and TCa on average 0.50 mg/g). In conclusion, the leaves of wild garlic from natural inhabitants (wild populations) have great nutritional potential, with a high content of specialized metabolites, and thus, are characterized by high antioxidant capacity. Finally, it should be emphasized that research on certain specific bioactive compounds of wild garlic populations by more precise techniques (such as HPLC) is necessary and can contribute significantly to further research to highlight the health value of this plant species.

Author Contributions

Conceptualization, S.V. and J.Š.Ž.; methodology, J.Š.Ž.; software, S.R.; validation, S.V., J.Š.Ž. and S.R.; formal analysis, J.Š.Ž. and M.P.; investigation, S.F.U., S.R. and N.O.; resources, S.V.; writing—original draft preparation, S.V. and J.Š.Ž.; writing—review and editing, S.F.U. and S.R.; visualization, S.R. and N.O. All authors have read and agreed to the published version of the manuscript.

Funding

This research received no external funding.

Conflicts of Interest

The authors declare no conflict of interest.

List of Abbreviations

GAEgallic acid
TETrolox
AsAascorbic acid
DCPIP2,6-dichloroindophenol
TPCtotal phenolic content
TFCtotal flavonoid content
TNFCtotal non-flavonoid content
Chl_achlorophyll a content
Chl_bchlorophyll b content
TChtotal chlorophyll content
TCatotal carotenoid content
Llocation
Pphenophase
L × Plocation and phenophase
DMtotal dry matter content
TAtotal acid content

References

  1. Prakash, B. Functional and Preservative Properties of Phytochemicals; Academic Press Elsevier: London, UK, 2020. [Google Scholar]
  2. Cena, H.; Calder, P.C. Defining a Healthy Diet: Evidence for the Role of Contemporary Dietary Patterns in Health and Disease. Nutrients 2020, 12, 334. [Google Scholar] [CrossRef] [Green Version]
  3. Demasi, S.; Mellano, M.G.; Falla, N.M.; Caser, M.; Scariot, V. Sensory Profile, Shelf Life, and Dynamics of Bioactive Compounds during Cold Storage of 17 Edible Flowers. Horticulturae 2021, 7, 166. [Google Scholar] [CrossRef]
  4. Oborny, B.; Botta-Dukát, Z.; Rudolf, K.; Morschhauser, T. Population ecology of Allium ursinum, a space-monopolizing clonal plant. Acta Bot. Hung. 2011, 53, 371–388. [Google Scholar] [CrossRef]
  5. Lenkova, M.; Bystricka, J.; Toth, T.; Hrstkova, M. Evaluation and comparison of the content of total polyphenols and antioxidant activity of selected species of the genus Allium. J. Cent. Eur. Agric. 2016, 17, 1119–1133. [Google Scholar] [CrossRef] [Green Version]
  6. Sobolewska, D.; Podolak, I.; Makowska-Wąs, J. Allium ursinum: Botanical, phytochemical and pharmacological overview. Phytochem. Rev. 2015, 14, 81–97. [Google Scholar] [CrossRef] [Green Version]
  7. Jeong, M.J.; Song, H.J.; Kim, H.G.; Park, D.J.; Yong, S.H.; Choi, E.; Seol, Y.; Ghimire, B.; Choi, M.S. The optimal cultivation conditions for wild garlic (Allium victorialis var. Platyphyllum) under the forests as a non-timber forest product (NTFP). Agrofor. Syst. 2019, 94, 747–760. [Google Scholar] [CrossRef]
  8. Kim, T.K. Edible Medicinal and Non-Medicinal Plants; Springer: Dordrecht, Germany, 2014; Volume 7. [Google Scholar]
  9. Pavlović, D.R.; Veljković, M.; Stojanović, N.M.; Gočmanac-Ignjatović, M.; Mihailov-Krstev, T.; Branković, S.; Sokolović, D.; Marčetić, M.; Radulović, N.; Radenković, M. Influence of different wild-garlic (Allium ursinum) extracts on the gastrointestinal system: Spasmolytic, antimicrobial and antioxidant properties. J. Pharm. Pharm. 2017, 69, 1208–1218. [Google Scholar] [CrossRef]
  10. Murugesan, S.; Pandiyan, A.; Saravanakumar, L.; Moodley, K.; Mackraj, I. Protective role of wild garlic on isoproterenol-induced myocardial necrosis in wistar rats. J. Ethnopharmacol 2019, 237, 108–115. [Google Scholar] [CrossRef]
  11. Stanisavljević, N.; Bajić, S.S.; Jovanović, Ž.; Matić, I.; Tolinački, M.; Popović, D.; Popović, N.; Terzić-Vidojević, A.; Golić, N.; Beškoski, V.; et al. Antioxidant and Antiproliferative Activity of Allium ursinum and Their Associated Microbiota During Simulated in vitro Digestion in the Presence of Food Matrix. Front. Microbiol. 2020, 11, 1–17. [Google Scholar] [CrossRef]
  12. Forma, A.; Chilimoniuk, Z.; Januszewski, J.; Sitarz, R. The Potential Application of Allium Extracts in the Treatment of Gastrointestinal Cancers. Gastroenterol. Insights 2021, 2, 136–146. [Google Scholar] [CrossRef]
  13. Rankovic, M.; Krivokapic, M.; Bradic, J.; Petkovic, A.; Zivkovic, V.; Sretenovic, J.; Jeremic, N.; Bolevich, S.; Kartashova, M.; Jeremic, J.; et al. New Insight into the Cardioprotective Effects of Allium ursinum L. Extract Against Myocardial Ischemia-Reperfusion Injury. Front. Physiol. 2021, 12, 1–14. [Google Scholar] [CrossRef]
  14. Coulston, A.M.; Rock, C.L.; Monsen, E.R. Nutrition in the Prevention and Treatment of Disease; Academic Press: Orlando, FL, USA, 2001. [Google Scholar]
  15. Wu, H.; Dushenkov, S.; Ho, C.-T.; Sang, S. Novel acetylated flavonoid glycosides from the leaves of Allium ursinum. Food Chem. 2009, 115, 592–595. [Google Scholar] [CrossRef]
  16. Gîtin, L.; Dinicǎ, R.; Parnavel, R. The influence of extraction method on the apparent content of bioactive compounds in Romanian Allium spp. leaves. Not. Bot. Horti Agrobot. Cluj-Napoca 2012, 40, 93–97. [Google Scholar] [CrossRef] [Green Version]
  17. Oszmiański, J.; Kolniak-Ostek, J.; Wojdyło, A. Characterization and content of flavonol derivatives of Allium ursinum L. plant. J. Agric Food Chem. 2013, 61, 176–184. [Google Scholar] [CrossRef]
  18. Piatkowska, E.; Kopeć, A.; Leszczynska, T. Basic chemical composition, content of micro and macroelements and antioxidant activity of different varieties of garlic’s leaves polish origin. Nauka Technol. Jakość 2015, 98, 181–192. [Google Scholar]
  19. Lachowicz, S.; Oszmiański, J.; Wiśniewski, R. Determination of triterpenoids, carotenoids, chlorophylls, and antioxidant capacity in Allium ursinum L. at different times of harvesting and anatomical parts. Eur. Food Res. Technol. 2018, 244, 1269–1280. [Google Scholar] [CrossRef] [Green Version]
  20. Ostročki, L. Statistical Yearbook of the Republic of Croatia; Croatian Bureau of Statistics: Zagreb, Croatia, 2018; pp. 1–158. [Google Scholar]
  21. IUSS Working Group WRB. World Reference Base for Soil Resources 2014-International Soil Classification System for Naming Soils and Creating Legends for Soil Maps; World Soil Resources Reports No. 106; FAO: Rome, Italy, 2014. [Google Scholar]
  22. Association of Officiating Analytical Chemists. Official Methods of Analysis: Method 1995, 6th ed.; AOAC International: Washington, DC, USA, 1995. [Google Scholar]
  23. Association of Officiating Analytical Chemists. Official Methods of Analysis: Method 2002, 17th ed.; AOAC International: Washington, DC, USA, 2002. [Google Scholar]
  24. Ough, C.S.; Amerine, M.A. Methods for Analysis of Musts and Wines; John Wiley and Sons: New York, NY, USA, 1988; pp. 1–377. [Google Scholar]
  25. Holm, G. Chlorophyll mutations in barley. Acta Agric. Scand. 1954, 4, 457–471. [Google Scholar] [CrossRef]
  26. Wettstein, D. Chlorophyll-letale und der submikroskopische Formwechsel der Plastiden. Exp. Cell Res. 1957, 12, 427–434. [Google Scholar] [CrossRef]
  27. Re, R.; Pellegrini, N.; Proteggente, A.; Pannala, A.; Yang, M.; Rice-Evans, C. Antioxidant activity applying an improved ABTS radical cation decolorization assay. Free Radic Biol. Med. 1999, 26, 1231–1237. [Google Scholar] [CrossRef]
  28. SAS Institute. SAS®/STAT 9.3; SAS Institute Inc.: Cary, NC, USA, 2011. [Google Scholar]
  29. Todorović, V.; Lazić, B.; Igić, R.; Đurovka, M. The characteristics of different populations of spring onion Allium ursinum L. In the area of Republic of Srpska. In Proceedings of the 44th Croatian & 4th International Symposium on Agriculture, Opatija, Croatia, 16–20 February 2009; Faculty of Agriculture, University of Josip Juraj Strossmayer in Osijek: Osijek, Croatia, 2009; pp. 454–458. [Google Scholar]
  30. Błażewicz-Woźniak, M.; Michowska, A. The growth, flowering and chemical composition of leaves of three ecotypes of Allium ursinum L. Acta Agrobot. 2011, 64, 171–180. [Google Scholar] [CrossRef] [Green Version]
  31. Hunter, L.H. a, b Color Scale. Applications Note 8(9). 2012. Available online: http://www.hunterlab.se/wp-content/uploads/2012/11/Hunter-L-a-b.pdf (accessed on 15 June 2021).
  32. Dyduch, J.; Najda, A. Estimation of the biological value of winter garlic leaves from early cultivation on bunch crop. Part II. Plants grown from planting air bulbs. Electron J. Pol. Agric Univ. 2011, 3. Available online: http://www.ejpau.media.pl/volume3/issue2/horticulture/art-05.html (accessed on 28 February 2019).
  33. Ahanger, M.A.; Singh Tomar, N.; Tittal, M.; Argal, S.; Agarwal, R.M. Plant growth under water/salt stress: ROS production; antioxidants and significance of added potassium under such conditions. Physiol. Mol. Biol. Plants 2017, 23, 731–744. [Google Scholar] [CrossRef]
  34. Akram, N.; Shafiq, F.; Ashraf, M. Ascorbic Acid-A Potential Oxidant Scavenger and Its Role in Plant Development and Abiotic Stress Tolerance. Front. Plant Sci. 2017, 8, 613. [Google Scholar] [CrossRef] [PubMed]
  35. Abdelgawad, K.F.; El-Mogy, M.M.; Mohamed, M.I.A.; Garchery, C.; Stevens, R.G. Increasing Ascorbic Acid Content and Salinity Tolerance of Cherry Tomato Plants by Suppressed Expression of the Ascorbate Oxidase Gene. Agronomy 2019, 9, 51. [Google Scholar] [CrossRef] [Green Version]
  36. An, H.; Jiang, S.; Zhang, J.; Xu, F.; Zhang, X. Comparative Transcriptomic Analysis of Differentially Expressed Transcripts Associated with Flowering Time of Loquat (Eriobotya japonica Lindl.). Horticulturae 2021, 7, 171. [Google Scholar] [CrossRef]
  37. Gaafar, A.A.; Ali, S.I.; El-Shawadfy, M.A.; Salama, Z.A.; Sękara, A.; Ulrichs, C.; Abdelhamid, M.T. Ascorbic Acid Induces the Increase of Secondary Metabolites, Antioxidant Activity, Growth, and Productivity of the Common Bean under Water Stress Conditions. Plants 2020, 9, 627. [Google Scholar] [CrossRef]
  38. Barth, C.; De Tullio, M.; Conklin, P.L. The role of ascorbic acid in the control of flowering time and the onset of senescence. J. Exp. Bot. 2006, 57, 1657–1665. [Google Scholar] [CrossRef]
  39. Gallie, D.R. L-Ascorbic Acid: A Multifunctional Molecule Supporting Plant Growth and Development. Scientifica 2013, 2013, 795964. [Google Scholar] [CrossRef] [Green Version]
  40. Paciolla, C.; Fortunato, S.; Dipierro, N.; Paradiso, A.; De Leonardis, S.; Mastropasqua, L.; de Pinto, M.C. Vitamin C in Plants: From Functions to Biofortification. Antioxidants 2019, 8, 519. [Google Scholar] [CrossRef] [Green Version]
  41. Isah, T. Stress and defense responses in plant secondary metabolites production. Biol. Res. 2019, 52, 1–25. [Google Scholar] [CrossRef] [Green Version]
  42. Marchiosi, R.; dos Santos, W.D.; Constantin, P.P.; de Lima, R.B.; Soares, A.R.; Finger-Teixeira, A.; Mota, T.R.; de Oliveira, D.M.; Foletto-Felipe, M.P.; Abrahão, J.; et al. Biosynthesis and metabolic actions of simple phenolic acids in plants. Phytochem. Rev. 2020, 19, 865–906. [Google Scholar] [CrossRef]
  43. Šamec, D.; Karalija, E.; Šola, I.; Vujčić Bok, V.; Salopek-Sondi, B. The Role of polyphenols in abiotic stress response: The influence of molecular structure. Plants 2021, 10, 118. [Google Scholar] [CrossRef] [PubMed]
  44. Ahmad, S.S.; Tahir, I. Regulatory role of phenols in flower development and senescence in the genus Iris. Ind J Plant Physiol. 2017, 22, 135–140. [Google Scholar] [CrossRef]
  45. Shahri, W.; Tahi, I.; Islam, S.T.; Bhat, M.A. Physiological and biochemical changes associated with flower development and senescence in so far unexplored Helleborus orientalis Lam. cv. Olympicus. Physiol. Mol. Biol. Plants 2011, 17, 33–39. [Google Scholar] [CrossRef] [Green Version]
  46. Dar, R.A.; Tahir, I.; Ahmad, S.S. Sugars and sugar alcohols have their say in the regulation of flower senescence in Dianthus chinensis L. Sci. Hortic. 2014, 174, 24–28. [Google Scholar] [CrossRef]
  47. Dar, R.A.; Tahir, I.; Ahmad, S.S. Physiological and biochemical changes associated with flower development and senescence in Dianthus chinensis L. Indian J. Plant Physiol. 2014, 19, 215–221. [Google Scholar] [CrossRef]
  48. Nisar, S.; Tahir, I.; Ahmad, S.S. Modulation of flower senescence in Nicotiana plumbaginifolia L. by polyamines. Indian J. Plant Physiol. 2015, 20, 186–190. [Google Scholar] [CrossRef]
  49. Lattanzio, M.; Lattanzio, V.M.T.; Cardinali, A. Role of phenolics in the resistance mechanisms of plants against fungal pathogens and insects. Phytochem. Adv. Res. 2006, 661, 23–67. [Google Scholar]
  50. Schmitzer, V.; Veberic, R.; Osterc, G.; Stampar, F. Color and phenolic content changes during flower development in groundcover rose. J. Am. Chem. Soc. 2010, 135, 195–202. [Google Scholar] [CrossRef] [Green Version]
  51. Hasan, M.M.; Bashir, T.; Ghosh, R.; Lee, S.K.; Bae, H. An Overview of LEDs’ Effects on the Production of Bioactive Compounds and Crop Quality. Molecules 2017, 22, 1420. [Google Scholar] [CrossRef] [Green Version]
  52. Matsuda, R.; Ito, H.; Fujiwara, K. Effects of Artificially Reproduced Fluctuations in Sunlight Spectral Distribution on the Net Photosynthetic Rate of Cucumber Leaves. Front. Plant Sci. 2021, 12, 675810. [Google Scholar] [CrossRef] [PubMed]
  53. Ma, Y.; Xu, A.; Cheng, Z.-M. Effects of light emitting diode lights on plant growth, development and traits a meta-analysis. Hortic. Plant J. 2021, 7, 552–564. [Google Scholar] [CrossRef]
  54. Sousa-Souto, L.; Bocchiglieri, A.; Dias, D.M.; Ferreira, A.S.; Filho, J.P.L. Changes in leaf chlorophyll content associated with flowering and its role in the diversity of phytophagous insects in a tree species from a semiarid Caatinga. PeerJ 2018, 6, e5059. [Google Scholar] [CrossRef] [PubMed]
  55. Azigwe, C.; Zoryeku, P.A.D.; Asante, I.K.; Oppong-Adjei, F. Effect of gamma irradiation on chlorophyll content in the cowpea (Vigna unguiculata (L.) Walp). Ghana J. Sci. 2020, 61, 113–117. [Google Scholar] [CrossRef]
  56. Wink, M. Functions and Biotechnology of Plant Secondary Metabolites; Blackwell Publishing Ltd.: West Sussex, UK; John Wiley & Sons Ltd.: West Sussex, UK, 2010. [Google Scholar]
  57. Li, N.; Jia, Z.; Trush, M.A. Defining ROS in Biology and Medicine. React Oxyg Species 2016, 1, 1–10. [Google Scholar] [CrossRef] [Green Version]
Figure 1. Climate diagram with data from the meteorological station ‘Maksimir’ for the period of January (1) to April (4) (Croatian Meteorological and Hydrological Service, 2019). Columns represent precipitation (mm), while line the average monthly temperatures (°C).
Horticulturae 08 00024 g001
Figure 2. Climate diagram with data from the meteorological station ‘Grič’ for the period of January (1)–April (4) (Croatian Meteorological and Hydrological Service, 2019). Columns represent precipitation (mm), while the line, the average monthly temperatures (°C).
Horticulturae 08 00024 g002
Figure 3. Climate diagram with data from the meteorological station ‘Šibice’ for the period of January (1) to April (4) (Croatian Meteorological and Hydrological Service, 2019). Columns represent precipitation (mm), while the line, the average monthly temperatures (°C).
Horticulturae 08 00024 g003
Figure 4. Morphological characteristics (length and width) of wild garlic leaves from four different locations (LO 1–LO 4) before and in flowering stage. Different letters indicate significant differences between mean values at p ≤ 0.0001. Significance of interaction for leaf length: L–location p ≤ 0.0267; P—phenophase p ≤ 0.1147; L × P—location and phenophase p ≤ 0.0001, and leaf width: L—location p ≤ 0.0001; P—phenophase p ≤ 0.0001; L × P—location and phenophase p ≤ 0.1390.
Horticulturae 08 00024 g004
Figure 5. Antioxidant capacity (µmol TE/L) of wild garlic leaves from four different locations (LO1–4) before and in flowering stage. Different letters indicate significant differences between mean values at p ≤ 0.0001. Significance of interaction: L—location p ≤ 0.0001; P—phenophase p ≤ 0.0001; L × P—location and phenophase p ≤ 0.0001.
Horticulturae 08 00024 g005
Table 1. Location geographical coordinates, meteorological data [20] and soil type [21] of collected wild garlic populations within the continental Croatia.
Location Name/No.Location CoordinatesAreaAltitude (m)Air Temperatures (°C) *Precipitation (mm) *Number of Sunny Days *Soil Type
ZG I (LO 1)45.837714, 16.019946Zagreb13212.689769stagnosol albi
ZG II (LO 2)45.812264, 16.03534712512.689769alluvial soil
ZG III (LO 3)45.828827, 15.95035625013.6888.559stagnosol albi
S-R (LO 4)45.774578, 15.684153Samobor mountain28711.71 167.642sour brown on clasts
* average annual values.
Table 2. Chromaticity parameters of wild garlic leaves.
LocationL*a*b*C
Before flowering
LO 122.65 ab ± 0.94−11.66 ab ± 0.2717.01 bc ± 0.9120.1 bc ± 1.55125.77 b ± 2.12
LO 221.82 c ± 0.24−12.54 a ± 0.5515.33 cd ± 0.6119.8 bc ± 0.79129.27 a ± 0.59
LO 319.42 c ± 2.54−9.29 b ± 1.0212.26 d ± 1.3415.39 d ± 1.68127.63 ab ± 2.71
LO 429.44 a ± 1.01−12.19 ab ± 0.6124.45 a ± 1.9527.34 a ± 1.45116.62 d ± 1.16
Flowering stage
LO 128.94 a ± 0.27−11.99 ab ± 0.3720.39 b ± 0.0922.55 b ± 0.89120.74 c ± 0.34
LO 221.65 c ± 1.01−10.78 b ± 0.8713.21 d ± 1.7417.06 cd ± 1.89129.33 ± 1.53
LO 321.58 c ± 1.09−10.78 b ± 0.7413.84 cd ± 1.1417.54 cd ± 1.34127.76 ab ± 0.56
LO 426.06 ab ± 4.52−11.61 ab ± 0.2518.95 b ± 1.0222.23 b ± 0.95121.51 c ± 3.06
ANOVAp ≤ 0.0002p ≤ 0.0580p ≤ 0.0001p ≤ 0.0006p ≤ 0.0001
LSD3.42981.84963.4353.86433.1166
Location (L)0.00010.01890.00010.00010.0001
Phenophase (P)0.17150.75960.43120.38590.9801
L × P0.00830.08150.00800.02510.0032
Results are expressed as mean ± standard deviation. Different letters indicate significant differences between mean values. L × P—interaction between location and phenophase.
Table 3. Physicochemical characteristics of wild garlic leaves.
LocationDM (%)TA (%)pH
Before flowering
LO 110.69 a ± 0.540.077 ab ± 0.0085.42 c ± 0.03
LO 210.03 bc ± 0.080.06 cd5.39 c ± 0.03
LO 39.74 c ± 0.10.05 d ± 0.0015.55 b ± 0.05
LO 48.86 d ± 0.10.05 d ± 0.0015.54 b ± 0.05
Flowering stage
LO 18.99 d ± 0.320.06 cd ± 0.0115.56 b ± 0.13
LO 29.72 c ± 0.020.06 cd ± 0.0015.67 a ± 0.06
LO 39.24 d ± 0.10.077 ab ± 0.0015.74 a ± 0.02
LO 410.39 ab ± 0.120.087 a ± 0.0015.71 a ± 0.06
ANOVAp ≤ 0.0001p ≤ 0.0005p ≤ 0.0001
LSD0.42940.01230.0994
Location (L)0.04300.00070.2506
Phenophase (P)0.02380.00010.0004
L × P0.00010.27180.0001
DM—dry matter content; TA—total acid content. Results are expressed as mean ± standard deviation. Different letters indicate significant differences between mean values. L × P—interaction between location and phenophase.
Table 4. Specialized metabolites content of wild garlic leaves from different locations.
LocationAsA
(mg/100g fw)
TPC
(mg GAE/100g fw)
TFC
(mg CTH 100/g fw)
TNFC
(mg GAE 100/g fw)
Before flowering
LO 150.06 c ± 2.21184.05 a ± 7.09105.48 a ± 1.6978.56 bc ± 8.79
LO 263.31 a ± 1.18184.09 a ± 2.04109.98 a ± 2.1574.31 cd ± 0.34
LO 357.46 b ± 0.001186.18 a ± 2.52110.65 a ± 2.8475.61 cd ± 0.72
LO 451.73 c ± 2.67138.41 cd ± 0.3675.49 c ± 1.162.92 ef ± 1.02
Flowering stage
LO 124.06 f ± 2.78164.72 b ± 11.5197 b ± 3.8567.72 de ± 7.66
LO 230.23 e ± 1.47132.15 d ± 0.5376.57 c ± 0.8455.53 f ± 1.06
LO 327.58 ef ± 2.71147.2 c ± 1.4561.53 d ± 1.2685.67 ab ± 0.26
LO 439.17 c ± 1.47167.63 b ± 0.9279.28 c ± 1.7388.35 a ± 1.25
ANOVAp ≤ 0.0001p ≤ 0.0001p ≤ 0.0001p ≤0.0001
LSD4.519911.5455.48279.6124
Location (L)0.00010.00010.00010.0001
Phenophase (P)0.00010.00010.00010.4049
L × P0.00010.00010.00010.0001
AsA—ascorbic acid content; TPC—total phenol content; TFC—total flavonoid content; TNFC—total non-flavonoid content. Results are expressed as mean ± standard deviation. Different letters indicate significant differences between mean values. L × P—interaction between location and phenophase.
Table 5. Pigment compounds content of wild garlic leaves from different locations.
LocationChl_a
(mg/g)
Chl_b
(mg/g)
TCh
(mg/g)
TCa
(mg/g)
Before flowering
LO 10.81 b ± 0.0150.4 bc ± 0.051.20 bc ± 0.070.56 b ± 0.02
LO 20.73 c ± 0.0010.34 cd ± 0.061.07 cde ± 0.010.50 c ± 0.01
LO 30.69 cd ± 0.0010.29 d ± 0.0010.99 de ± 0.0010.49 c ± 0.01
LO 40.66 d ± 0.0010.28 d ± 0.0010.94 e ± 0.0010.46 c ± 0.001
Flowering stage
LO 10.82 b ± 0.080.45 ab ± 0.071.28 b ± 0.140.58 ab ± 0.05
LO 20.89 a ± 0.0010.52 a ± 0.0011.42 a ± 0.0010.62 a ± 0.001
LO 30.71 cd ± 0.0010.39 bc ± 0.021.10 cd ± 0.020.49 c ± 0.001
LO 40.65 d ± 0.0010.43 b ± 0.0011.07 cde ± 0.0010.48 c ± 0.01
ANOVAp ≤ 0.0001p ≤ 0.0001p ≤ 0.0001p ≤ 0.0001
LSD0.07250.0760.13940.0456
Location (L)0.00010.00010.00010.0001
Phenophase (P)0.00310.00010.00010.0001
L × P0.00070.01050.00250.0003
Chl_a—chlorophyll a; Chl_b—chlorophyll b; TCh—total chlorophylls; TCa—total carotenoids. Results are expressed as mean ± standard deviation. Different letters indicate significant differences between mean values. L × P—interaction between location and phenophase.
Publisher’s Note: MDPI stays neutral with regard to jurisdictional claims in published maps and institutional affiliations.