Article

Nutrient Deficiency Affects the Growth and Nitrate Concentration of Hydroponic Radish

Faculty of Biology-Oriented Science and Technology, Kindai University, Wakayama 649-6493, Japan
*
Author to whom correspondence should be addressed.
Horticulturae 2021, 7(12), 525; https://doi.org/10.3390/horticulturae7120525
Submission received: 1 November 2021 / Revised: 24 November 2021 / Accepted: 26 November 2021 / Published: 28 November 2021
(This article belongs to the Special Issue Impact of Plant Nutrition on Primary and Secondary Metabolites)

Abstract

:
In hydroponics, a continuous supply of mineral nutrients is essential for plant growth. However, constitutive nutrient-rich conditions also increase the nitrate content in the plants, which can be harmful to human health. Here, we investigated the effect of nutrient deficiency on the growth and component composition of hydroponic radish by changing the timing of nutrient removal from the hydroponic solution. Radish plants that were 14 days old were transferred to four different nutrient conditions for 14 days: nutrient deficiency for 14 days (WW), full nutrient for 14 days (NN), nutrient deficiency for the last 7 days (NW), and nutrient deficiency for the first 7 days (WN). After the treatments, the NW plants had similar taproot growth to NN plants. In contrast, the WN plants significantly reduced taproot growth. The WW plants reduced the shoot and taproot weight and their water contents. The nitrate content in the taproots was reduced in the NW and WW plants. The WW plants contained lower total phenol and higher ascorbic acid and sugar contents. These results suggest that the uptake of nutrient minerals at the young growth stage is important for the growth of radish taproot. Nutrient deficiency management can be one of the most effective tools for regulating radish growth and composition.

1. Introduction

Hydroponics is a soilless cultivation method that uses a nutrient solution that contains all of the essential minerals for plant growth [1]. This method was originally introduced in indoor farming, where the plant cultivation environment can be optimally controlled. This method makes it possible to grow crops in areas without soil and regardless of soil conditions. In addition, stable crop production can be achieved by avoiding soil diseases, salt damage, and continuous cropping obstacles [2]. At present, the practical application of hydroponics is mainly limited to leaf vegetables and some fruit crops, but research has been conducted to establish a hydroponics system for other crops, including root vegetables.
In hydroponics, several nutrient solution formulations have been developed that optimally contain the major and micronutrients that are essential for promoting nutrient intake and plant growth [3]. The nutrients in the solution are the only source of minerals for plants that are grown by means of hydroponics, so the removal of nutritional ions from hydroponic solutions generally lead to the restriction of plant growth [4]. On the other hand, under continuous nutrient rich conditions, plants absorb higher amounts of nitrate, which can adversely affect human health [5,6]. Thus, the regulation of nutrient supply might be needed to provide optimal growth while managing the nutrient content of the edible parts of hydroponic plants.
Many studies have been conducted to assess the effects of nutrient deficiency on the yield and phytochemical content of various crops. Nitrogen deficiency inhibits plant growth and development, reduces photosynthesis and leaf area, and accelerates senescence [7,8,9,10]. Phosphorous deficiency also causes the repression of plant growth and photosynthesis in various plants [11,12]. The limitation of other essential nutrient minerals also shows negative effects on the physiological parameters of the plant [4,13]. Although the effects of the deprivation of each essential nutrient mineral on plant growth and phytochemical composition have been well-studied to date, only a few studies have focused on the deprivation of all of the essential ions in hydroponic solutions. Radish (Raphanus sativus L.) is one of the most important root vegetables in cruciferous species and acts as a food source for human consumption in that the roots are used for human consumption because they provide adequate amounts of carbohydrates, minerals, fiber, and protein [14]. Radish has also been used in ethnomedicine as a laxative, stimulant, digestive stimulant, appetite stimulant, and remedy for stomach ailments [15]. Recently, as the demand for salad vegetables has grown, the importance of small, precocious radishes as root vegetables has increased [16]. Some radish varieties can be harvested within one month after sowing, so they are hydroponically cultivated under environmentally controlled conditions such as indoor farming [17]. Recent studies have demonstrated reduced growth in hydroponically grown lettuces transferred from a hydroponic solution to water in their late growing stages [18,19]. However, the influence of nutrient (all essential nutrient minerals) deficiency on root vegetables was not clarified. Here, we studied the effect of nutrient deprivation and its timing on the growth and nutrient composition of hydroponic radish.

2. Materials and Methods

2.1. Experimental Conditions

The seeds of the radish (R. sativusS L. var. sativus) cultivar “Hatsuka Daikon” (Takii Seed Co., Kyoto, Japan) were sown on wet paper towels and were pregerminated for 2 days at 20 °C in the dark. After 2 days of sowing (DAS), the germinated plants were placed on well-watered sponge cubes that were 2 × 2 × 2 cm in size. To set the plants in the sponge cubes, the roots of the plants were sandwiched in the cut in the center of each sponge cube. Water was drenched to the sponge cubes until it reached half of the cube height, and the plants were grown at 20 °C under 200 µmol m−2 s−1 of photosynthetic photon flux provided fluorescent lamps (FLs; FL40SBR-A; NEC Co., Tokyo, Japan) with a 16 h light cycle. At 7 DAS, plants were transferred to DFT hydroponics with a nutrient solution under the same temperature and light conditions. The Otsuka-A recipe (OAT Agrio Co., Ltd., Tokyo, Japan) nutrient solution was prepared as previously described [20,21]. At 14 DAS, For DFT hydroponics, 8 plants were planted in one container (26 × 19 × 11.5 cm size). The nutrient solution in the container was continuously aerated at a flow rate of 1.5 L min−1 using an air pump (e-AIR 4000WB, GEX Co. Ltd., Osaka, Japan) connected to an air stone.
At 14 DAS, the plants were exposed to a nutrient deficiency experiment for 14 days at the same light and temperature conditions (Figure 1). Four experimental groups were tested: (1) WW, where the plants were grown in water alone without nutrients throughout the cultivation period; (2) NN, where the plants were grown in the nutrient solution throughout the cultivation period; (3) NW, where the plants were grown in the nutrient solution for 7 days after the start of treatment (DAT) and were then transferred to water without nutrients, where they were grown until 14 DAT; (4) and WN, where the plants were grown in water without nutrients for 7 DAT and were then transferred to the nutrient solution, where they were grown until 14 DAT. In the WW and NN plants, the water or nutrient solution was exchanged at 7 DAT. This experiment was repeated four times and obtained similar results each time.

2.2. Measurement of Chlorophyll Content and Photosystem II Quantum Yield

Relative chlorophyll content was measured by a non-destructive method using the soil and plant analyzer development (SPAD) chlorophyll meter (SPAD-502; Konica Minolta, Tokyo, Japan). Measurements were conducted at 0, 4, 7, 10, 12, and 14 DAT using the first true leaf (old leaf) and the youngest fully expanded leaf (young leaf) of each plant.
The photosynthetic quantum yield of photosystem II (Fv/Fm) was measured using FluorPen FP100 (Photon Systems Instruments, Brno, Czech Republic). The first true leaf (old leaf) and the youngest fully expanded leaf (young leaf) at 0, 4, 7, 10, 12, 14 DAT were used after dark adaptation as previously described [22].

2.3. Measurement of Plant Growth

Shoot length and taproot diameter were measured at 0, 4, 7, 10, 12, and 14 DAT. Shoot length was defined as the distance from the leaf base to the leaf tip in the longest leaf. The taproot diameters were defined as the largest diameter measured. Plants at 14 DAT were harvested and separated into shoots, taproots, and fibrous roots. The taproot of hydroponic radish was defined as a main root with a diameter of more than 1 mm because they became thinner near the tip of the roots. Fresh weight was measured after each part was wiped dry with a paper towel. Dry weights were measured after each sample was oven-dried at 80 °C for 72 h or until the weight was constant. Water contents were obtained from the (FW–DW)/FW ratio, where FW and DW were the fresh weight and dry weight, respectively.

2.4. Measurement of Nitrate Content

Sliced taproot segments (50 mg) were immediately homogenized with 1 mL deionized water. The homogenate was filtered through a filter paper to remove tissue debris. The nitrate content of the filtered solution was measured with a reflectometer (RQflex, Merck, Darmstadt, Germany) and an analysis strip for nitrate (Nitrate Test 116971, Merck, Darmstadt, Germany).

2.5. Measurement of Total Phenol Content

Total phenol content was measured using the Folin–Ciocalteu method as described previously [23]. The central part of the taproot or the fibrous root from one plant was sliced and homogenized with a mortar and pestle. The homogenized 50 mg sample was transferred to a microtube (1.5 mL), to which 500 μL of 90% methanol was added. The sample was vigorously stirred and centrifuged at 10,000 g for 5 min. The supernatant (20 μL) was diluted to 630 μL with distilled water and mixed with 50 μL of phenolic reagent. After adding 300 μL of 5% sodium carbonate, the mixture was incubated at 25 °C for 30 min. The absorbance of the supernatant was measured at 765 nm, and a calibration curve was created using gallic acid. Absorbance was converted to total phenol concentration in milligrams of gallic acid per gram of fresh weight. Measurements were replicated in six plants per treatment. This experiment was repeated four times and obtained similar results each time.

2.6. Measurement of DPPH Radical Scavenging Capacity

The radical scavenging capacity was measured using 1,1-diphenyl-2-picrylhydrazyl (DPPH) radicals as previously described [24], with minor modifications. The central part of each taproot (50 mg fresh weight) was homogenized with 500 μL of 90% methanol. The sample was then centrifuged at 10,000 g for 5 min. The supernatant (100 μL) was mixed with 200 μL of 0.5 mM DPPH in ethanol and 500 μL of methanol. DPPH solution was freshly prepared just before the experiment. After 30 min incubation in the dark, the absorbance was monitored at 517 nm. The DPPH radical scavenging capacity was expressed as the percentage of DPPH radicals scavenged by calculating the difference between the pre-incubation and post-incubation absorbances.

2.7. Measurement of Ascorbic Acid

The ascorbic acid content was measured as previously described [25]. Sliced taproot segments (100 mg) from one plant were homogenized with 1 mL 5% (w/v) metaphosphoric acid. The sample was then centrifuged at 6000 g for 5 min at room temperature. The ascorbic acid content of the supernatant was measured with RQflex and an analysis strip for ascorbic acid (Ascorbic Acid Test, Merck, Darmstadt, Germany). This experiment was repeated four times and obtained similar results each time.

2.8. Measurement of Sugar Content

The radish taproots were homogenized using a grater, and the homogenates were filtered with filter paper (No. 1, Whatman plc, Maidstone, UK) to remove tissue debris. The sugar concentration was measured using an Atago PAL-1 Handheld Digital Brix Refractometer (Atago, Japan).

2.9. Measurement of Root Oxygen Consumption

The cut fibrous roots (500 mg) were immediately washed with distilled water and were immersed in a 50 mL tube containing an oxygen-saturated nutrient solution for 1 h. To calculate the depleted dissolved oxygen, we measured the initial and final dissolved oxygen concentrations in the solution using a dissolved oxygen meter DO-5509 (Lutron, Taipei, Taiwan).

2.10. Data Analysis

The data were analyzed using the JMP Statistics Package (SAS Institute, Cary, NC, USA). Significant differences between treatments were determined by one-way ANOVA followed by the Tukey–Kramer honest significance test for pairwise comparison at p < 0.05.

3. Results and Discussion

3.1. Effects of Nutrient Deficiency Timing on the Growth of Hydroponic Radish

In the NN and NW plants, taproot diameter consistently increased during the 14 days of the experiment (Figure 2). The WN and WW plants showed a lower increase in taproot growth compared to the NN and NW plants in the first 7 DAT. In the last 7 days before harvest, the WN plants showed a higher increase in taproot growth compared to the WW plants, but the taproot diameter at 14 DAT was lower than that of the NN and NW plants.
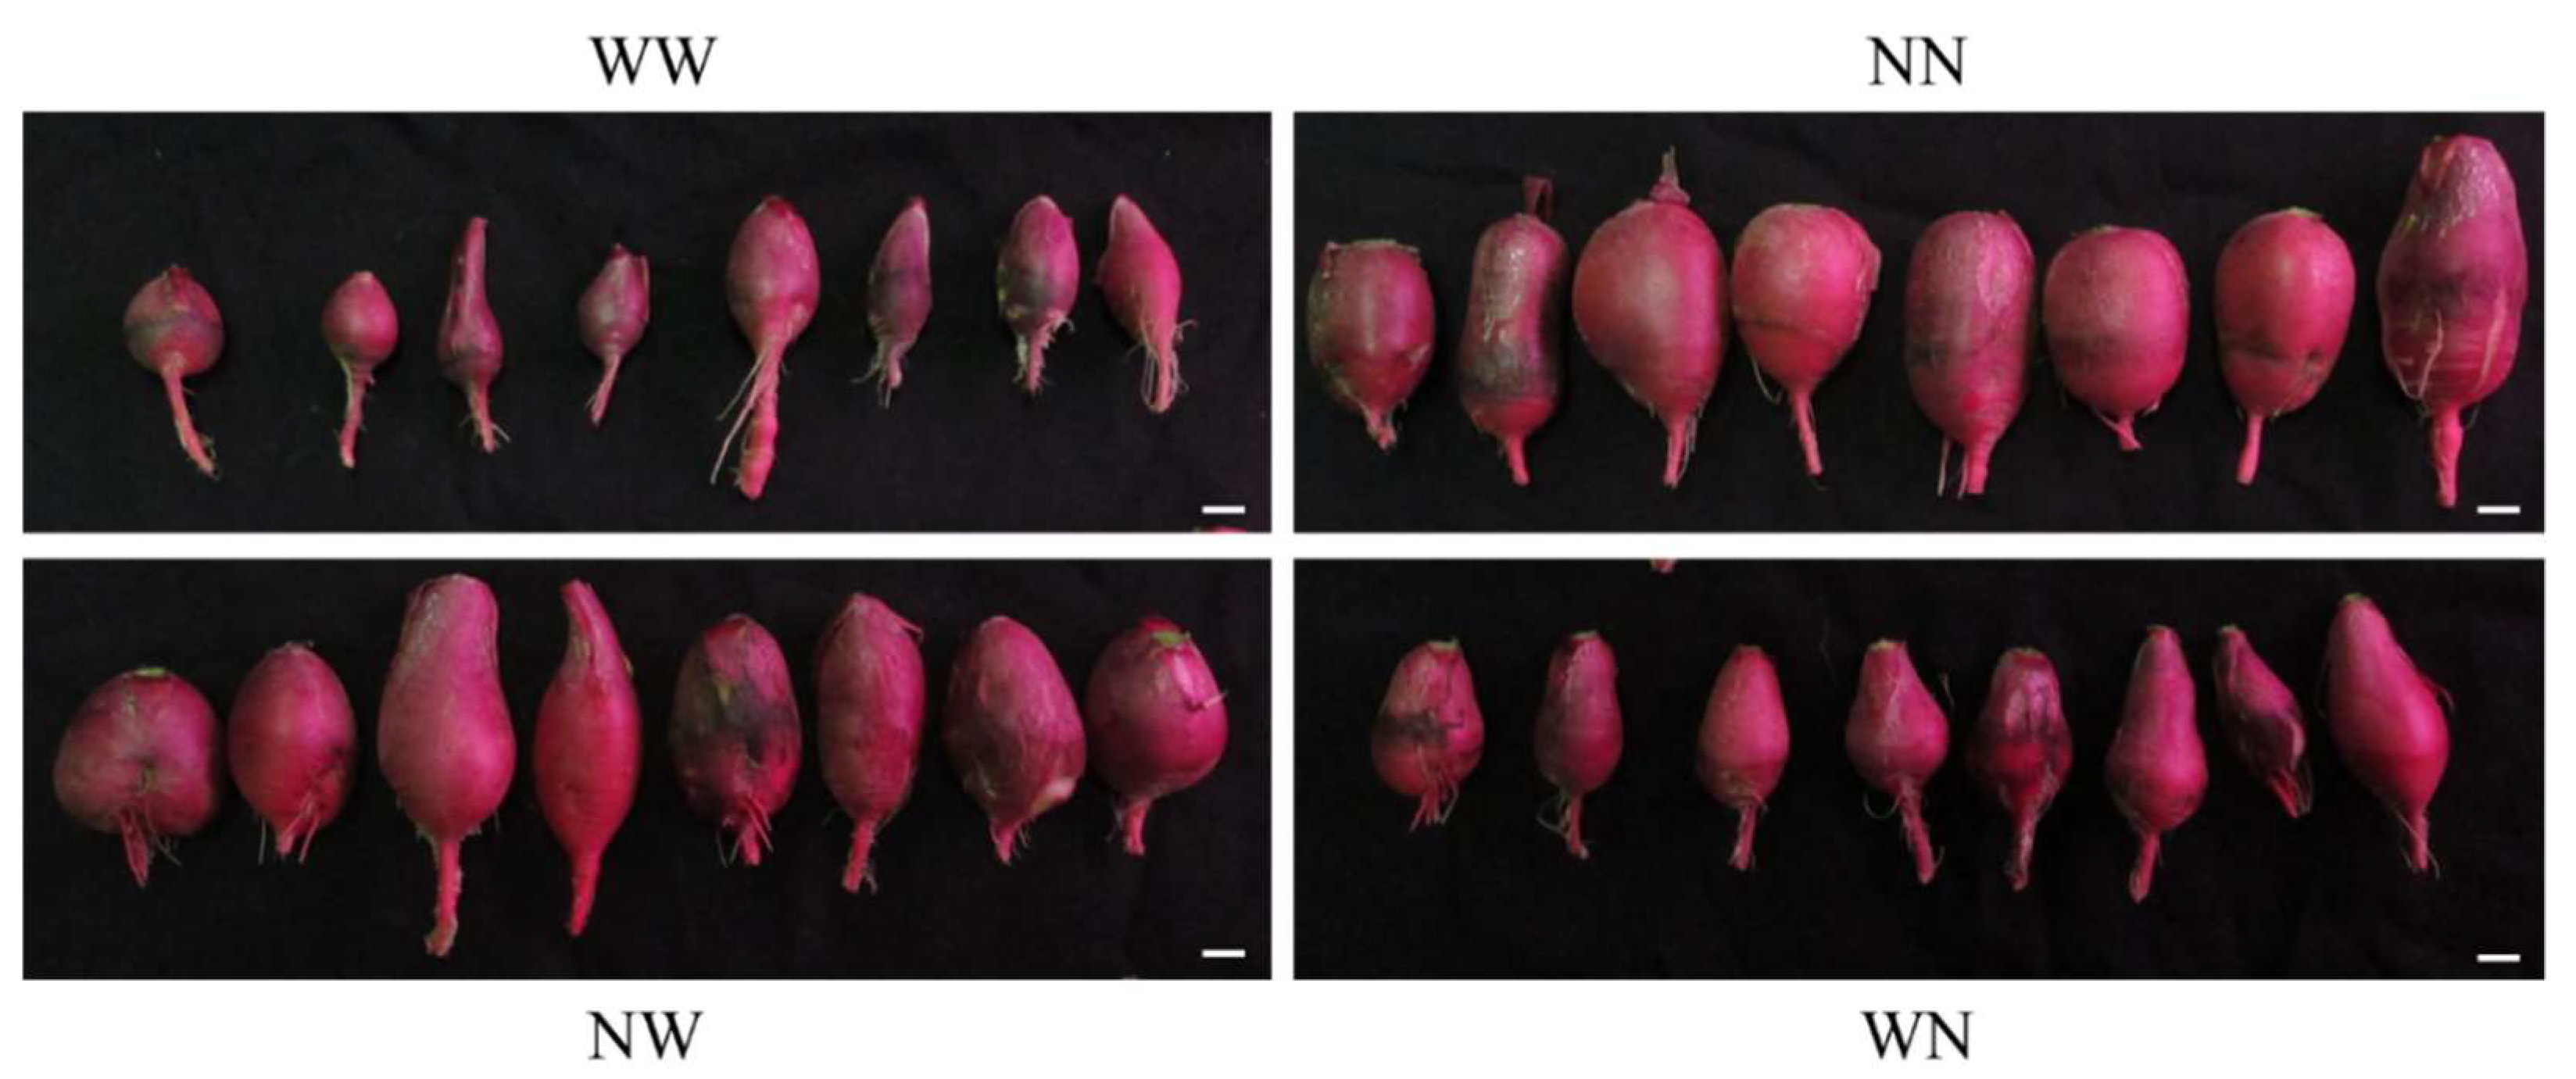
The plants were harvested at 14 DAT, and the growth and components were then examined. The hydroponically grown taproots were oblong- or spindle-shaped (Figure 3). The size of the taproots was larger in the NN and NW plants compared to in the WN and WW plants. The swelling of the lower part of the taproot was suppressed in all of the experimental groups, which was probably because these parts were submerged in the hydroponic solution. Waterlogging has also been reported to restrict root swelling in root vegetables such as carrot and sweet potato [26,27,28].
The WW plants had fewer leaves compared to the other experimental groups (Table 1). This implies that continuous nutrient deficiency resulted in developmental retardation.
The shoot fresh weight was the highest in the NN plants followed by the WN, NW, and WW plants (Table 2). The fresh weight of the taproots was higher in the NN and NW plants compared to the WW and WN plants. The fibrous root fresh weight was the highest in WN plants followed by in the NN and NW plants, and it was lowest in the WW plants. The dry weights of the shoots, taproots, and fibrous roots showed the same pattern as the one that was observed in the fresh weights. The water contents of the WW plants were lower than that of other plants. The ratio of the dry weight of the shoot to the taproot was the highest in the WN plants followed by NN plants, and it was lower in the WW and NW plants (Table 1).
A previous study of hydroponic radishes demonstrated that continuous low nutrient treatment decreased shoot growth, whereas root growth was not significantly influenced [29]. The NW plants showed a similar growth pattern to this previous study. Hydroponic plants are known to have large amounts of mineral nutrients in the leaves that have been absorbed from the nutrient solution [30]. Thus, in the NW plants, the stress caused by nutrient deficiency may have been mitigated by the leaf minerals that were acquired before the start of the nutrient deficiency. In contrast, taproot growth was restricted in the WN plants. Because the timing of nutrient deprivation was earlier in the WN plants compared to in the NW plants, the WN plants underwent nutrient deficiency during a younger growth stage. Younger plant leaves contain lower nitrate levels than older leaves [31,32]. This indicates that younger plants might be more sensitive to nutrient deficiency due to the low nutrient stocks in their leaves. Given that the increase in taproot diameter was also suppressed from 4–7 DAT in the WN and WW plants, it is postulated that complete nutrient removal at the early taproot growth stage is detrimental to taproot development. In potato plants, nutrient uptake has been reported to be higher at the tuber initiation stage than at the maturation stage [33]. Therefore, radish plants may also require a higher amount of nutrients at the initial taproot growth stage.
Shoot and root growth have been shown to be affected differently by transient stresses such as salt, drought, and flooding [34,35,36,37,38,39]. In sugar beets, temporal cold stress reduced the dry weight of taproots, but the dry weight of the leaves was unaffected [38]. Therefore, it is also suggested that WN plants were subjected to transient nutrient deficiency stress, causing different growth changes in shoots and taproots.

3.2. Effects of Nutrient Deficiency on the Nutritional Components of Hydroponic Radish

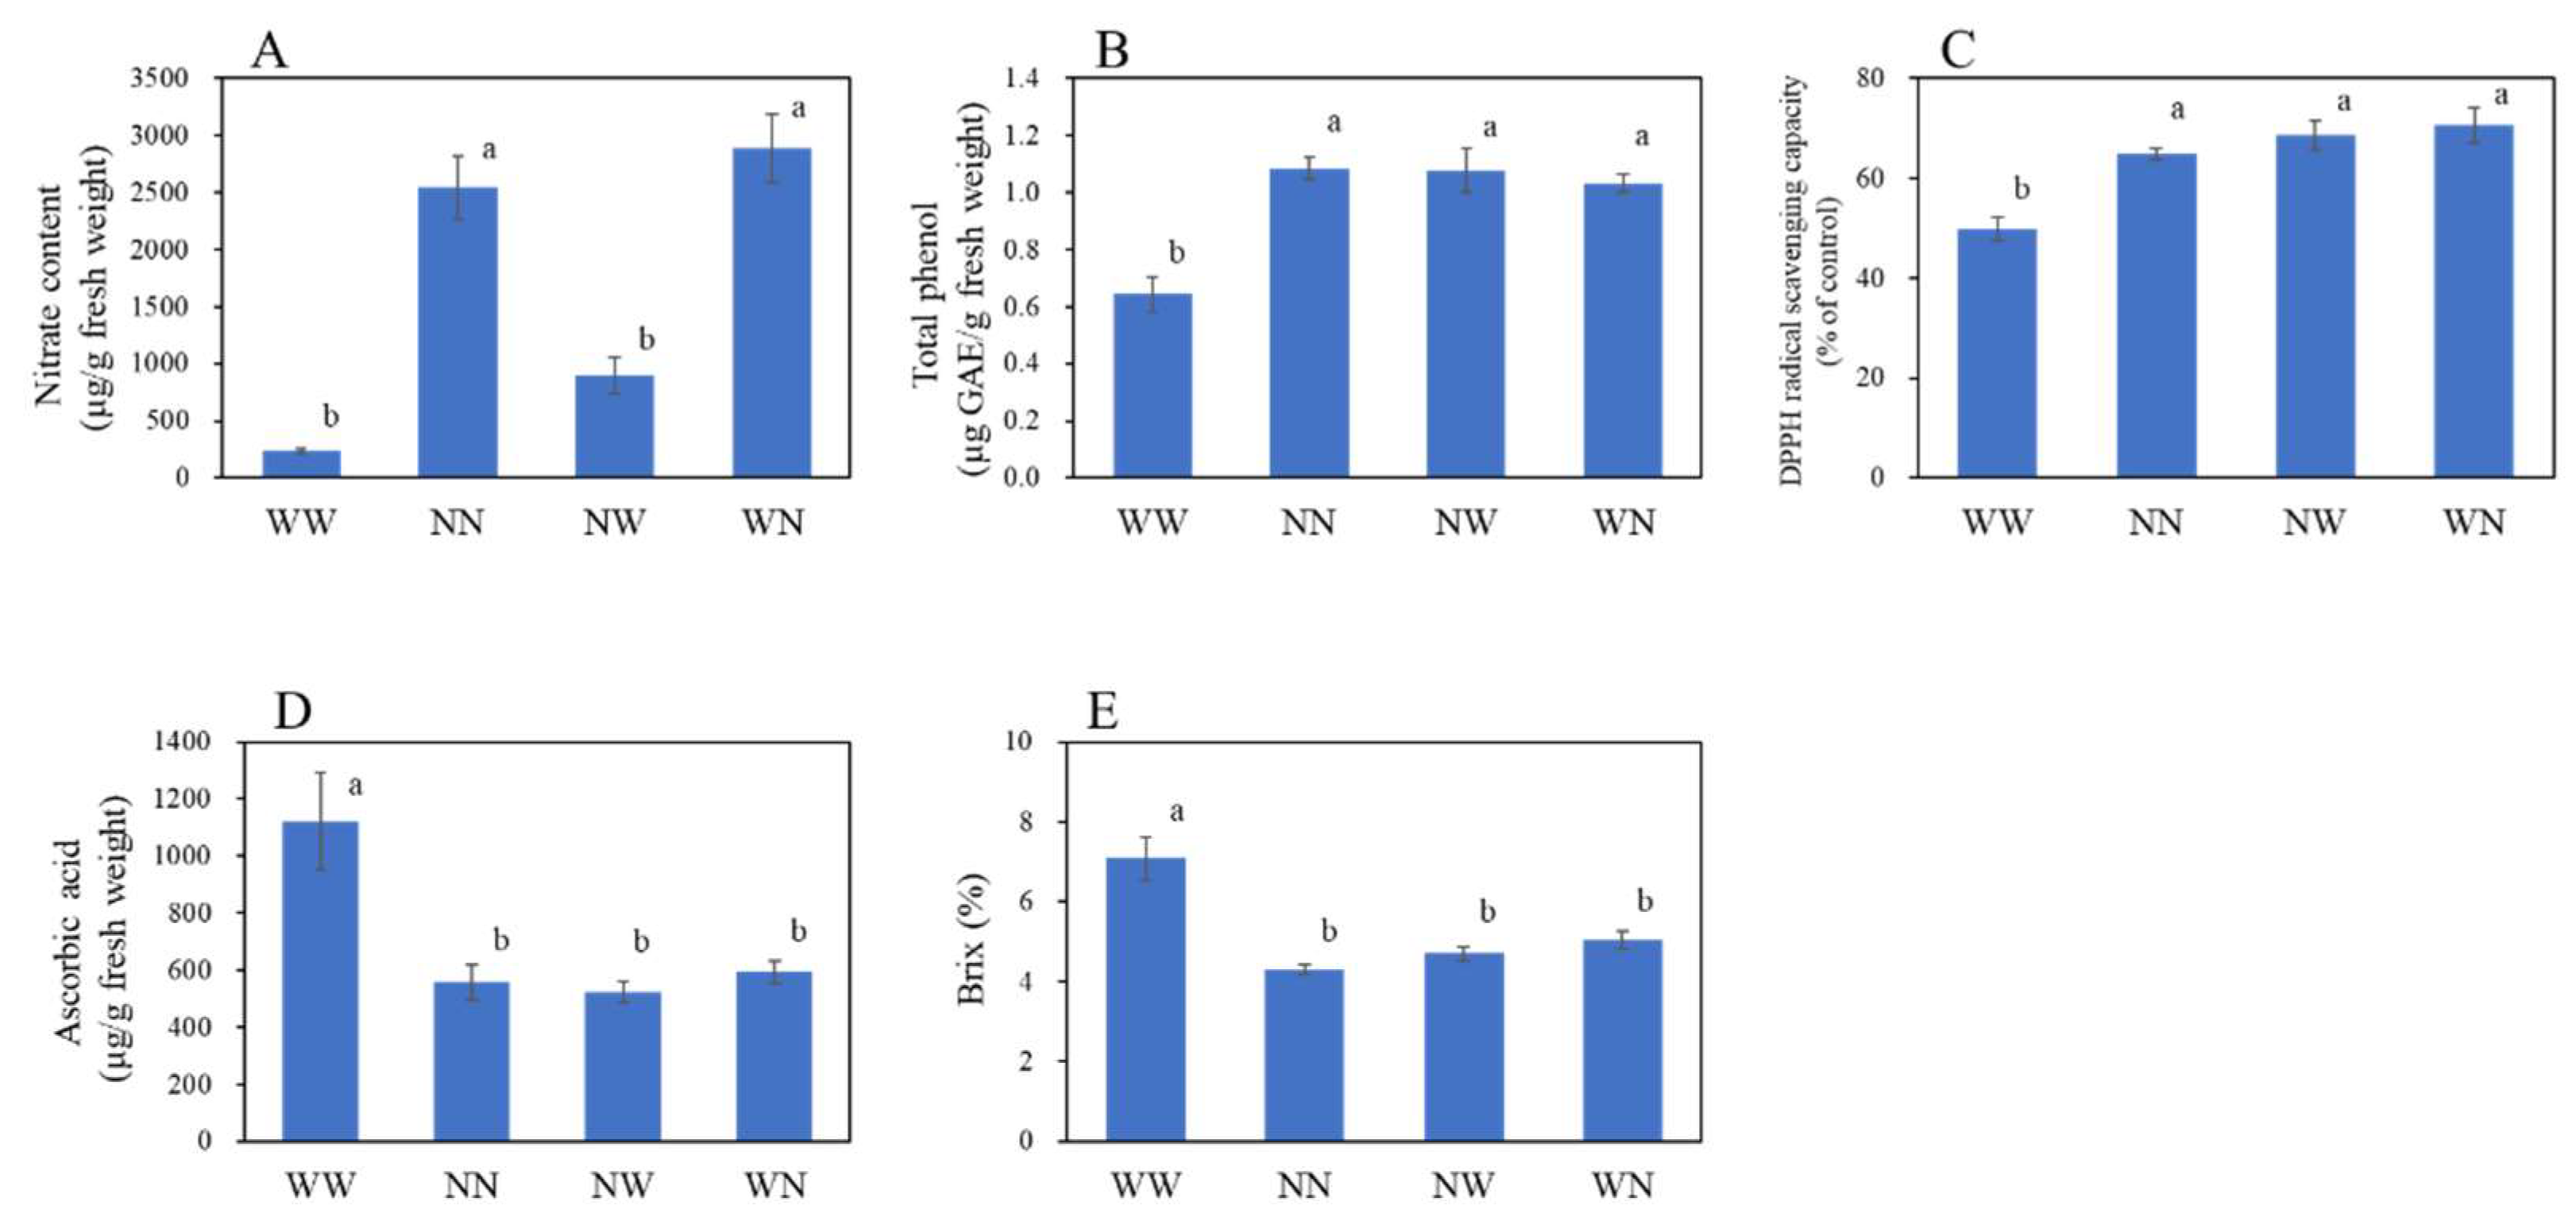
The nitrate content of taproots at 14 DAT was higher in the NN and WN plants compared to in the WW and NW plants (Figure 4A). The total phenol content was lower in WW plants compared to in the other experimental groups (Figure 4B). The radical scavenging capacity of the taproot measured by DPPH was also lower in the WW plants compared to in the other experimental groups (Figure 4C). In contrast, the ascorbic acid content was higher in the WW plants compared to the other experimental groups (Figure 4D). Brix, which is an index of sugar content, was also higher in the WW plants (Figure 4E).
Nitrate accumulation is influenced by several environmental factors, such as light, temperature, carbon dioxide, and nutrient solution [40]. In leaf vegetables, the nitrate content of plants has been shown to be dependent on nutrient solution concentration [41,42,43]. Reducing the supply of nutrients in the period immediately before harvest has also been shown to reduce nitrate accumulation in lettuce leaves [44,45]. Similar to these reports, nutrient deficiency 7 days pre-harvest in NW plants significantly reduced nitrate accumulation in taproots of hydroponic radish. Given that WN plants showed higher nitrate accumulation compared to NW plants, nitrate accumulation in radish taproot may depend not only on the duration of time that the plant was exposed to nutrient deficiency, but it may also depend on the timing of the plant’s exposure to nutrient deficiency.
Radish roots contain a variety of phenolic compounds such as catechin, sinapinic acid, and anthocyanins [46]. Phenolic compounds in the roots have shown to decrease in response to several stresses [47,48,49]. Therefore, the continuous nutrient deficiency of the WW plants could have caused severe stress, resulting in reduced water content and total phenol content in the roots.
In contrast to total phenol content, ascorbic acid and sugar content were increased in the radish plants that had been exposed to continuous nutrient deficiency. Ascorbic acid is one of several antioxidant molecules that diminish oxidative stresses and has been reported to be produced in response to various stresses [50,51,52]. In radish, water-deficit conditions enhanced the synthesis of ascorbic acid in the roots [53]. Given that the WW plants exhibited reduced size and water content compared to other experimental groups, it is possible that drought-like stress on WW plants induced ascorbic acid production. Sugar content increases in the last stage of taproot enlargement in radish [54,55]. Therefore, it is possible that taproots of WW plants may have undergone a faster maturation/aging process by restricting taproot swelling.

3.3. Effects of Nutrient Deficiency on the Leaf and Fibrous Root Parameters of Hydroponically Grown Radish

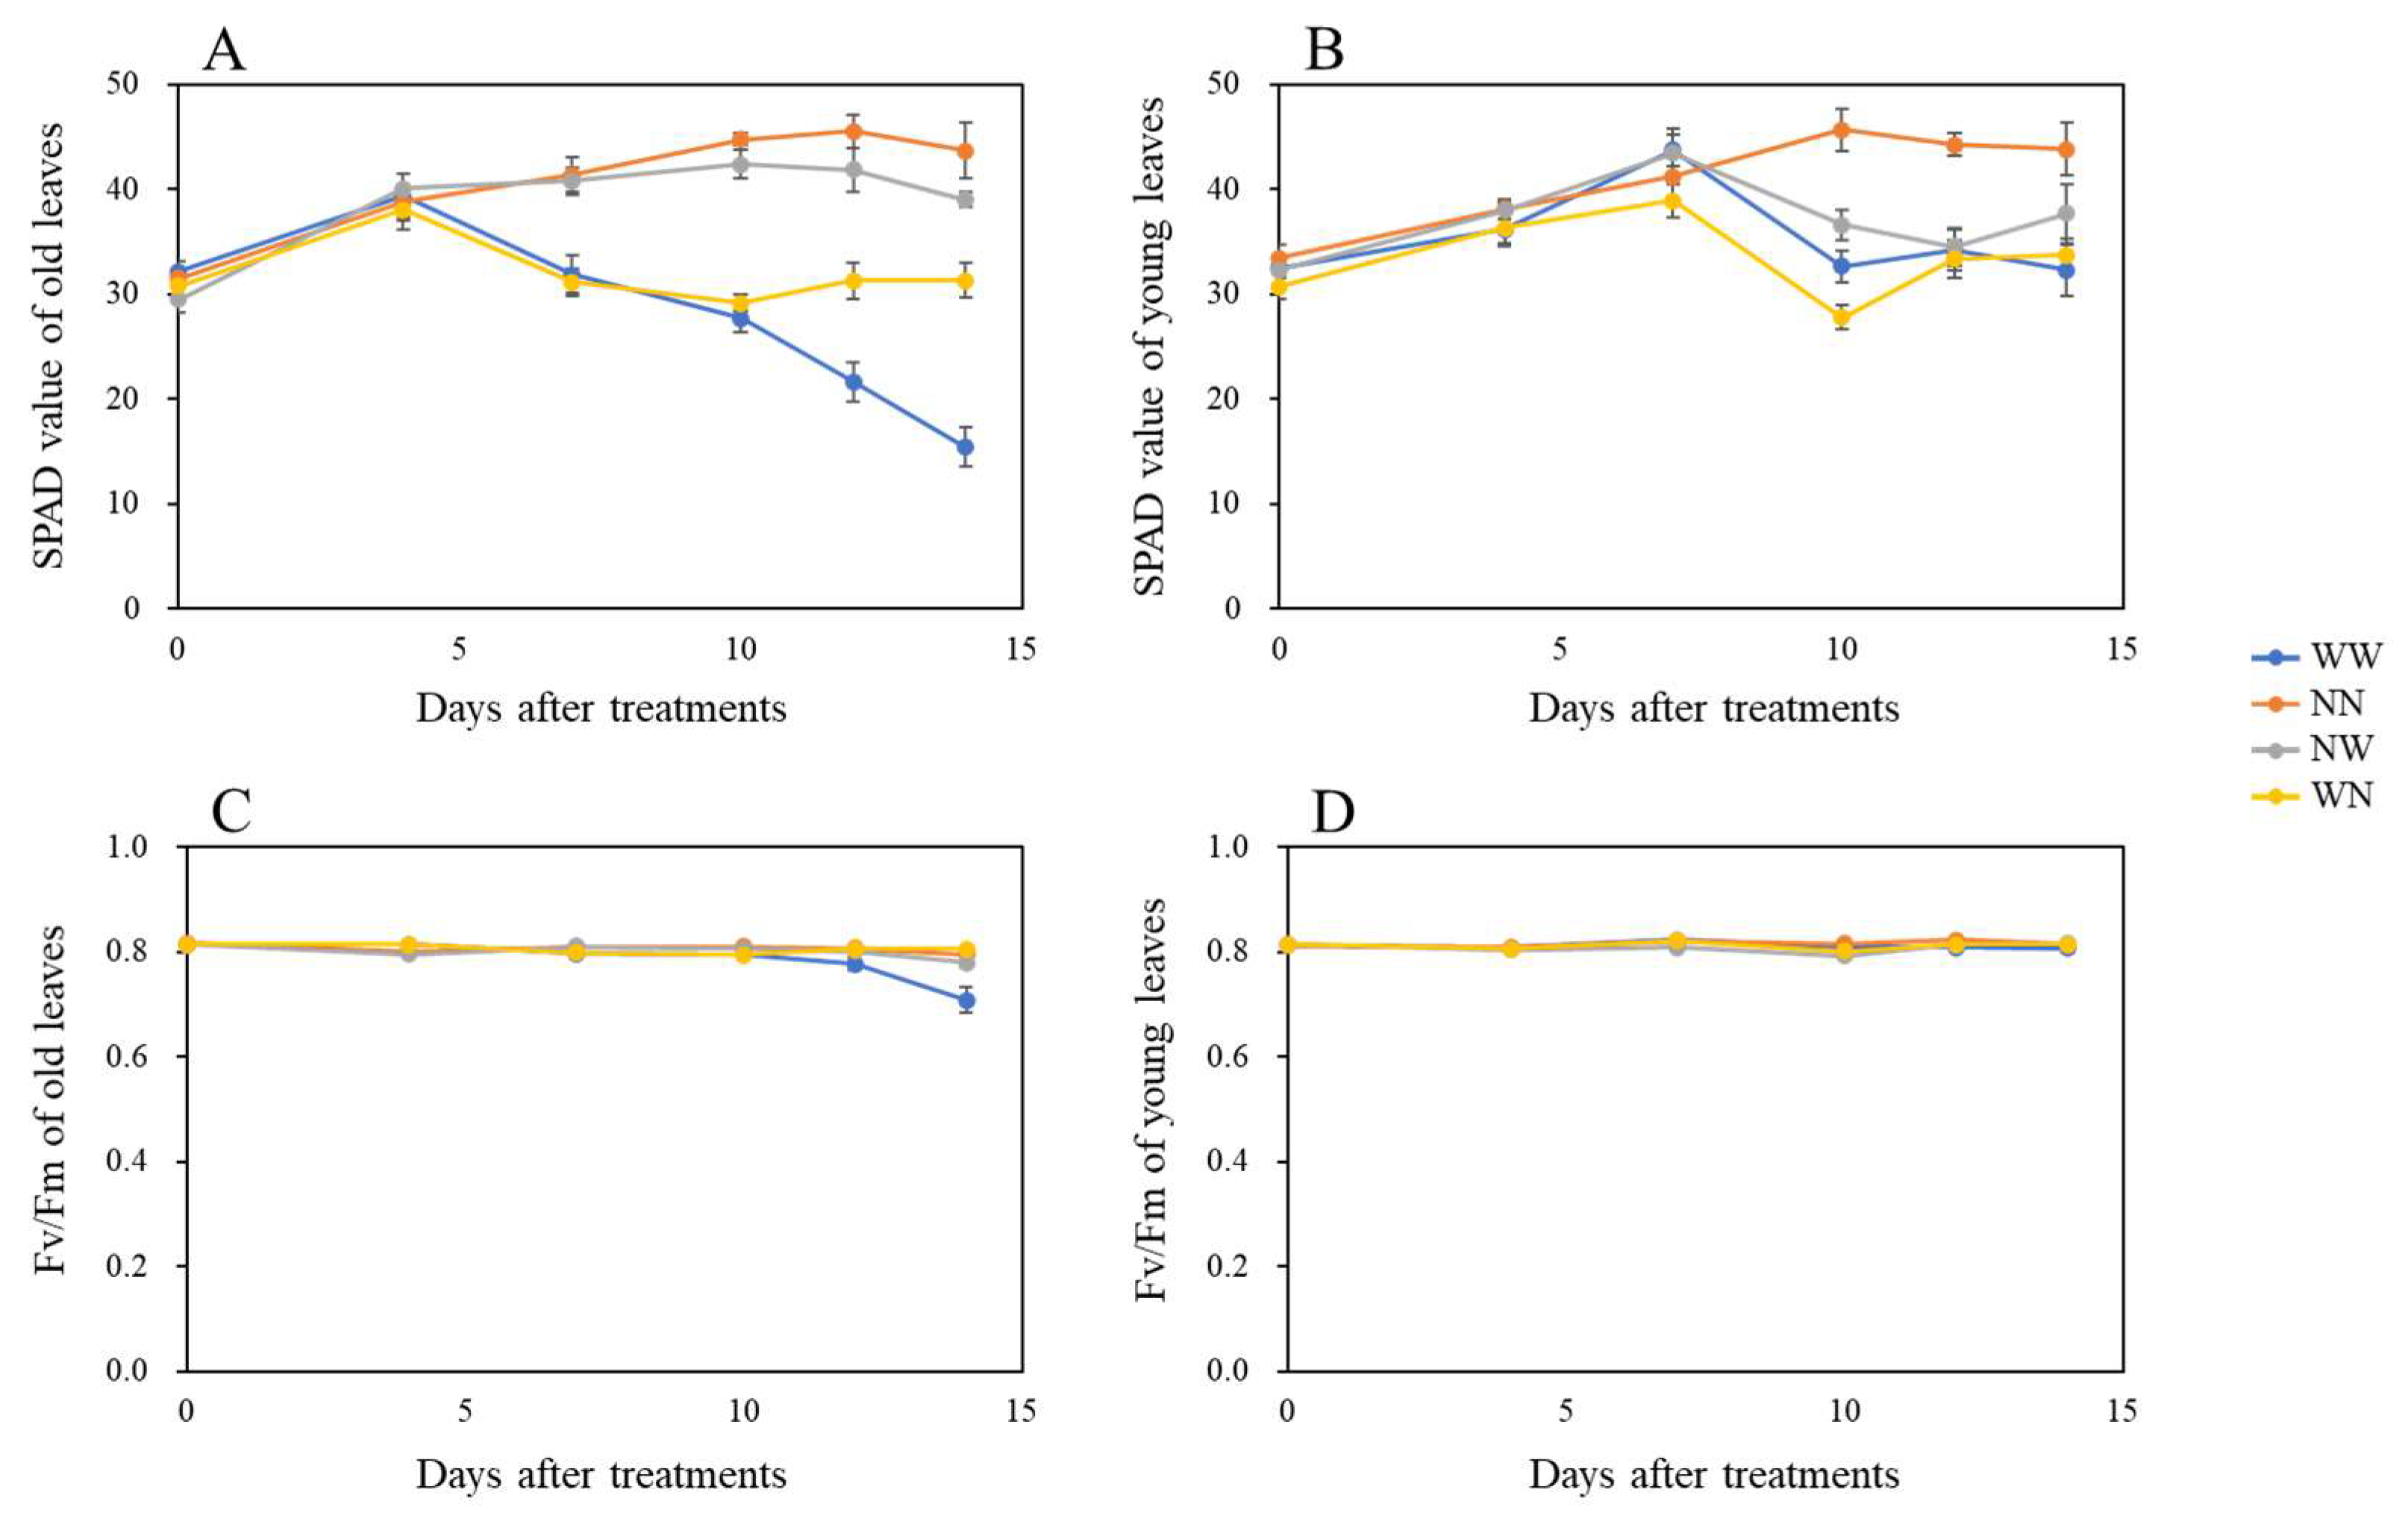
We also examined the effect of nutrient deficiency on the physiological changes of leaves and fibrous roots. The old leaf chlorophyll content measured by the SPAD value was not significantly changed within 4 DAT, but it continuously decreased from 7 DAT in the WW and WN plants (Figure 5A). The decrease of the SPAD value in the WN plants leveled off at 10 DAT. The SPAD value of young leaves were not significantly changed within 7 DAT and tended to be higher in the NN plants in the last 7 DAT (Figure 5B). The photosynthetic quantum yield of photosystem II (Fv/Fm) in the old leaves was not significantly different between treatments until 12 DAT, but it was significantly decreased in the WW plants at 14 DAT (Figure 5C). No difference was observed in the photosynthetic quantum yield of young leaves during the treatment period (Figure 5D). Total phenol content in fibrous roots was higher in WW plants compared to other experimental groups (Figure 6A). Root oxygen consumption was higher in the NN plants compared to in other experimental groups (Figure 6B).
Leaf SPAD values have been reduced by nitrogen and phosphate deficiency in prior studies [56,57]. In our study, the SPAD value was influenced more strongly in the WN plants compared to the NW plants when exposed to nutrient deficiency. This indicates that young plants (0 DAT) respond to nutrient deficiency more strongly than mature plants (7 DAT). In the first half of the treatment period, the SPAD value increased more strongly than it did during the second half of the treatment period in the NN plants. This SPAD value increase at early growth stages has also been observed in lettuces [58]. Nutrient deficiency in the earlier growth stages caused the plants to repress the synthesis and maintenance of chlorophyll because of the higher requirement of some nutritional minerals during the earlier growth stages [59]. During senescence, old leaf nutrients are recycled to different parts of the plants [60]. During this step, the leaf chlorophylls became degraded, and a decrease in SPAD value and photosynthetic quantum yield were observed [61]. This downregulation property has also been observed in the old leaves of WW plants, suggesting the acceleration of the aging process in plants that have been exposed to continuous nutrient deficiency. Nutrient deficiency has been reported to cause the induction of root phenolic compounds as a stress response [62]. Root respiration, as measured by root oxygen consumption, has also been shown to be reduced by nitrate, phosphate, and potassium deficiencies [63,64]. Given that nutrient deficiency triggered a variety of stress-responsive genes [65,66], nutrient-deficient treatment in our study could also elicit plant stress responses, at least in the roots.

4. Conclusions

Reducing nitrate levels in the edible part of hydroponic vegetables is important for increasing their crop value. Pre-harvest nutritional restrictions have been shown to be a viable method for producing low-nitrate leaf vegetables, even if their growth is restricted [67,68,69]. Our study has shown that this method can also be applied to the root vegetable radish. In contrast to leaf vegetables, the nitrate levels of radish edible roots were reduced without decreasing the biomass by adjusting the timing of the nutrient removal. The sustained growth of the taproots despite nutrient deficiency in NW plants may also contribute to a more efficient production of edible roots that consume less minerals in the nutrient solution.

Author Contributions

Conceptualization, M.S.; formal analysis, M.S.; investigation, M.S. and Y.K.; writing—original draft preparation, M.S.; writing—review and editing, M.S. and T.S. All authors have read and agreed to the published version of the manuscript.

Funding

This research received no external funding.

Institutional Review Board Statement

Not applicable.

Informed Consent Statement

Not applicable.

Data Availability Statement

The data presented in this study are available upon request from the corresponding author.

Conflicts of Interest

The authors declare no conflict of interest.

References

  1. Savvas, D. Hydroponics: A modern technology supporting the application of integrated crop management in greenhouse. J. Food Agric. Environ. 2003, 1, 80–86. [Google Scholar]
  2. Sharma, N.; Acharya, S.; Kumar, K.; Singh, N.; Chaurasia, O.P. Hydroponics as an advanced technique for vegetable production: An overview. J. Soil Water Conserv. 2018, 17, 364–371. [Google Scholar] [CrossRef]
  3. Jones Jr, J.B. Hydroponics: Its history and use in plant nutrition studies. J. Plant Nutr. 1982, 5, 1003–1030. [Google Scholar] [CrossRef]
  4. Yeh, D.M.; Lin, L.; Wright, C.J. Effects of mineral nutrient deficiencies on leaf development, visual symptoms and shoot–root ratio of Spathiphyllum. Sci. Hortic. 2000, 86, 223–233. [Google Scholar] [CrossRef]
  5. Abdel Mohsen, M.A.; Hassan, A.A.; El-Sewedy, S.M.; Aboul-Azm, T.; Magagnotti, C.; Fanelli, R.; Airoldi, L. Biomonitoring of n-nitroso compounds, nitrite and nitrate in the urine of Egyptian bladder cancer patients with or without Schistosoma haematobium infection. Int. J. Cancer 1999, 82, 789–794. [Google Scholar] [CrossRef]
  6. Mensinga, T.T.; Speijers, G.J.; Meulenbelt, J. Health implications of exposure to environmental nitrogenous compounds. Toxicol. Rev. 2003, 22, 41–51. [Google Scholar] [CrossRef]
  7. Broadley, M.R.; Escobar-Gutiérrez, A.J.; Burns, A.; Burns, I.G. Nitrogen-limited growth of lettuce is associated with lower stomatal conductance. New Phytol. 2001, 152, 97–106. [Google Scholar] [CrossRef]
  8. Uribelarrea, M.; Crafts-Brandner, S.J.; Below, F.E. Physiological N response of field-grown maize hybrids (Zea mays L.) with divergent yield potential and grain protein concentration. Plant Soil 2009, 316, 151–160. [Google Scholar] [CrossRef] [Green Version]
  9. Mu, X.; Chen, Q.; Chen, F.; Yuan, L.; Mi, G. Within-leaf nitrogen allocation in adaptation to low nitrogen supply in maize during grain-filling stage. Front. Plant 2016, 7, 699. [Google Scholar] [CrossRef] [PubMed] [Green Version]
  10. Mu, X.; Chen, Y. The physiological response of photosynthesis to nitrogen deficiency. Plant Physiol. Biochem. 2021, 158, 76–82. [Google Scholar] [CrossRef]
  11. Yoneyama, K.; Xie, X.; Kim, H.I.; Kisugi, T.; Nomura, T.; Sekimoto, H.; Yokota, T.; Yoneyama, K. How do nitrogen and phosphorus deficiencies affect strigolactone production and exudation? Planta 2012, 235, 1197–1207. [Google Scholar] [CrossRef] [Green Version]
  12. Meng, X.; Chen, W.W.; Wang, Y.Y.; Huang, Z.R.; Ye, X.; Chen, L.S.; Yang, L.T. Effects of phosphorus deficiency on the absorption of mineral nutrients, photosynthetic system performance and antioxidant metabolism in Citrus grandis. PLoS ONE 2021, 16, e0246944. [Google Scholar]
  13. Kalaji, H.M.; Oukarroum, A.; Alexandrov, V.; Kouzmanova, M.; Brestic, M.; Zivcak, M.; Samborska, I.A.; Cetner, M.D.; Allakhverdiev, S.I.; Goltsev, V. Identification of nutrient deficiency in maize and tomato plants by in vivo chlorophyll a fluorescence measurements. Plant Physiol. Biochem. 2014, 81, 16–25. [Google Scholar] [CrossRef] [PubMed]
  14. Goyeneche, R.; Roura, S.; Ponce, A.; Vega-Gálvez, A.; Quispe-Fuentes, I.; Uribe, E.; Di Scala, K. Chemical characterization and antioxidant capacity of red radish (Raphanus sativus L.) leaves and roots. J. Funct. Foods 2015, 16, 256–264. [Google Scholar] [CrossRef]
  15. Curtis, I.S. The noble radish: Past, present and future. Trends Plant Sci. 2003, 8, 305–307. [Google Scholar] [CrossRef]
  16. Hong, J.; Gruda, N.S. The potential of introduction of Asian vegetables in Europe. Horticulturae 2020, 6, 38. [Google Scholar] [CrossRef]
  17. Al-Kodmany, K. The vertical farm: A review of developments and implications for the vertical city. Buildings 2018, 8, 24. [Google Scholar] [CrossRef] [Green Version]
  18. Tabaglio, V.; Boselli, R.; Fiorini, A.; Ganimede, C.; Beccari, P.; Santelli, S.; Nervo, G. Reducing nitrate accumulation and fertilizer use in lettuce with modified intermittent Nutrient Film Technique (NFT) system. Agronomy 2020, 10, 1208. [Google Scholar] [CrossRef]
  19. Ciriello, M.; Formisano, L.; Pannico, A.; El-Nakhel, C.; Fascella, G.; Duri, L.G.; Cristofano, F.; Gentile, B.R.; Giordano, M.; Rouphael, Y.; et al. Nutrient Solution Deprivation as a Tool to Improve Hydroponics Sustainability: Yield, Physiological, and Qualitative Response of Lettuce. Agronomy 2021, 11, 1469. [Google Scholar] [CrossRef]
  20. Sakamoto, M.; Suzuki, T. Effect of Nutrient Solution Concentration on the Growth of Hydroponic Sweetpotato. Agronomy 2020, 10, 1708. [Google Scholar] [CrossRef]
  21. Lee, J.Y.; Hiyama, M.; Hikosaka, S.; Goto, E. Effects of concentration and temperature of nutrient solution on growth and camptothecin accumulation of Ophiorrhiza pumila. Plants 2020, 9, 793. [Google Scholar] [CrossRef] [PubMed]
  22. Oxborough, K.; Baker, N.R. Resolving chlorophyll a fluorescence images of photosynthetic efficiency into photochemical and non-photochemical components–calculation of qP and Fv’/Fm’; without measuring Fo’. Photosynth. Res. 1997, 54, 135–142. [Google Scholar] [CrossRef]
  23. Sakamoto, M.; Wada, M.; Suzuki, T. Effect of partial excision of early taproots on growth and components of hydroponic carrots. Horticulturae 2020, 6, 5. [Google Scholar] [CrossRef] [Green Version]
  24. Sakamoto, M.; Suzuki, T. Methyl jasmonate and salinity increase anthocyanin accumulation in radish sprouts. Horticulturae 2019, 5, 62. [Google Scholar] [CrossRef] [Green Version]
  25. Sakamoto, M.; Suzuki, T. Effect of root-zone temperature on growth and quality of hydroponically grown red leaf lettuce (Lactuca sativa L. cv. Red Wave). Am. J. Plant Sci. 2015, 6, 2350. [Google Scholar] [CrossRef] [Green Version]
  26. Eguchi, T.; Yoshida, S. A cultivation method to ensure tuberous root formation in sweetpotatoes (Ipomoea batatas (L.) Lam.). Environ. Control Biol. 2004, 42, 259–266. [Google Scholar] [CrossRef]
  27. Kusakawa, T.; Inoue, M. Damage to pot-cultured carrot growth due to a temporarily raised groundwater level and flooding period. Hortic. Res. 2010, 9, 495–500. [Google Scholar] [CrossRef]
  28. Sakamoto, M.; Suzuki, T. Effect of pot volume on the growth of sweetpotato cultivated in the new hydroponic system. Sustain. Agric. Res. 2018, 7, 137–145. [Google Scholar] [CrossRef] [Green Version]
  29. Asao, T.; Kitazawa, H.; Washizu, K.; Ban, T.; Pramanik, M.H.R. Effect of different nutrient levels on anthocyanin and nitrate-N contents in turnip grown in hydroponics. J. Appl. Hortic. 2005, 72, 87–89. [Google Scholar] [CrossRef]
  30. Bulgari, R.; Baldi, A.; Ferrante, A.; Lenzi, A. Yield and quality of basil, Swiss chard, and rocket microgreens grown in a hydroponic system. N. Z. J. Crop. Hortic. Sci. 2017, 45, 119–129. [Google Scholar] [CrossRef]
  31. Black, B.L.; Fuchigami, L.H.; Coleman, G.D. Partitioning of nitrate assimilation among leaves, stems and roots of poplar. Tree Physiol. 2002, 22, 717–724. [Google Scholar] [CrossRef] [PubMed]
  32. Razgallah, N.; Abid, G.; Chikh-Rouhou, H.; Hassen, A.; M’hamdi, M. Nitrate content and expression of putative nitrate transporter genes in lettuce fertilized with nitrogen fertilizers. Int. J. Veg. Sci. 2017, 23, 173–184. [Google Scholar] [CrossRef]
  33. Jia, L.; Qin, Y.; Chen, Y.; Fan, M. Fertigation improves potato production in Inner Mongolia (China). J. Crop. Improv. 2018, 32, 648–656. [Google Scholar] [CrossRef]
  34. Katsuhara, M.; Shibasaka, M. Cell death and growth recovery of barley after transient salt stress. J. Plant Res. 2000, 113, 239. [Google Scholar] [CrossRef]
  35. de Lacerda, C.F.; Cambraia, J.; Oliva, M.A.; Ruiz, H.A. Changes in growth and in solute concentrations in sorghum leaves and roots during salt stress recovery. Environ. Exp. Bot. 2005, 54, 69–76. [Google Scholar] [CrossRef]
  36. Techawongstien, S.; Nawata, E.; Shigenaga, S. Responses of chili pepper cultivars to transient water stress. J. Jpn. Soc. Hortic. Sci. 1992, 61, 85–92. [Google Scholar] [CrossRef]
  37. Suralta, R.R.; Inukai, Y.; Yamauchi, A. Dry matter production in relation to root plastic development, oxygen transport, and water uptake of rice under transient soil moisture stresses. Plant Soil 2010, 332, 87–104. [Google Scholar] [CrossRef]
  38. Monti, A.; Brugnoli, E.; Scartazza, A.; Amaducci, M.T. The effect of transient and continuous drought on yield, photosynthesis and carbon isotope discrimination in sugar beet (Beta vulgaris L.). J. Exp. Bot. 2006, 57, 1253–1262. [Google Scholar] [CrossRef] [Green Version]
  39. Romina, P.; Abeledo, L.G.; Mantese, A.I.; Miralles, D.J. Differential root and shoot biomass recovery in wheat and barley with transient waterlogging during preflowering. Plant Soil 2017, 417, 481–498. [Google Scholar]
  40. Bian, Z.; Wang, Y.; Zhang, X.; Li, T.; Grundy, S.; Yang, Q.; Cheng, R. A review of environment effects on nitrate accumulation in leafy vegetables grown in controlled environments. Foods 2020, 9, 732. [Google Scholar] [CrossRef]
  41. Ding, X.; Jiang, Y.; Zhao, H.; Guo, D.; He, L.; Liu, F.; Zhou, Q.; Nandwani, D.; Hui, D.; Yu, J. Electrical conductivity of nutrient solution influenced photosynthesis, quality, and antioxidant enzyme activity of pakchoi (Brassica campestris L. ssp. Chinensis) in a hydroponic system. PLoS ONE 2018, 13, e0202090. [Google Scholar] [CrossRef]
  42. Fallovo, C.; Rouphael, Y.; Rea, E.; Battistelli, A.; Colla, G. Nutrient solution concentration and growing season affect yield and quality of Lactuca sativa L. var. acephala in floating raft culture. J. Sci. Food Agric. 2009, 89, 1682–1689. [Google Scholar]
  43. Fu, Y.; Li, H.; Yu, J.; Liu, H.; Cao, Z.; Manukovsky, N.S.; Liu, H. Interaction effects of light intensity and nitrogen concentration on growth, photosynthetic characteristics and quality of lettuce (Lactuca sativa L. Var. youmaicai). Sci. Hortic. 2017, 214, 51–57. [Google Scholar] [CrossRef]
  44. Khan, K.A.; Yan, Z.; He, D. Impact of light intensity and nitrogen of nutrient solution on nitrate content in three lettuce cultivars prior to harvest. J. Agric. Sci. 2018, 10, 99–109. [Google Scholar] [CrossRef]
  45. Khan, K.A.; Hussain, N.; Ahmad, M.; ul Haq, M.I.; Ali, S.; Hameed, M.S.; Hussain, M.I.; Ahmad, M.; Noureen, A.; Maqbool, M.; et al. Increased Light Intensity and Diluted NPK solution Significantly Influence Lettuce Nitrate Content. J. Environ. Agric. Sci. 2019, 20, 28–35. [Google Scholar]
  46. Banihani, S.A. Radish (Raphanus sativus) and diabetes. Nutrients 2017, 9, 1014. [Google Scholar] [CrossRef] [PubMed] [Green Version]
  47. Guimarães, G.F.; Gorni, P.H.; Vitolo, H.F.; Carvalho, M.E.A.; Pacheco, A.C. Sweetpotato tolerance to drought is associated to leaf concentration of total chlorophylls and polyphenols. Theor. Exp. Plant Physiol. 2021, 33, 1–12. [Google Scholar] [CrossRef]
  48. Juszczuk, I.M.; Wiktorowska, A.; Malusá, E.; Rychter, A.M. Changes in the concentration of phenolic compounds and exudation induced by phosphate deficiency in bean plants (Phaseolus vulgaris L.). Plant Soil 2004, 267, 41–49. [Google Scholar] [CrossRef]
  49. Hassanpour, H.; Khavari-Nejad, R.A.; Niknam, V.; Najafi, F.; Razavi, K. Effects of penconazole and water deficit stress on physiological and antioxidative responses in pennyroyal (Mentha pulegium L.). Acta Physiol. Plant. 2012, 34, 1537–1549. [Google Scholar] [CrossRef]
  50. Sarker, U.; Oba, S. Salinity stress enhances color parameters, bioactive leaf pigments, vitamins, polyphenols, flavonoids and antioxidant activity in selected Amaranthus leafy vegetables. J. Sci. Food Agric. 2019, 99, 2275–2284. [Google Scholar] [CrossRef] [PubMed]
  51. Locato, V.; Cimini, S.; De Gara, L. Strategies to increase vitamin C in plants: From plant defense perspective to food biofortification. Front. Plant Sci. 2013, 4, 152. [Google Scholar] [CrossRef] [PubMed] [Green Version]
  52. Mogren, L.; Reade, J.; Monaghan, J. Effects of environmental stress on ascorbic acid content in baby leaf spinach (Spinacia oleracea). In Proceedings of the XXVIII International Horticultural Congress on Science and Horticulture for People (IHC2010), Lisbon, Portugal, 22 August 2010; Volume 939, pp. 205–208. [Google Scholar]
  53. Shafiq, S.; Akram, N.A.; Ashraf, M. Does exogenously-applied trehalose alter oxidative defense system in the edible part of radish (Raphanus sativus L.) under water-deficit conditions? Sci. Hortic. 2015, 185, 68–75. [Google Scholar] [CrossRef]
  54. Hayata, Y.; Suzuki, Y. The relationships of plant hormones, sugars and nitrogen to the early development of radish root. J. Jpn. Soc. Hortic. Sci. 1982, 51, 56–61. [Google Scholar] [CrossRef] [Green Version]
  55. Hara, M.; Oki, K.; Hoshino, K.; Kuboi, T. Enhancement of anthocyanin biosynthesis by sugar in radish (Raphanus sativus) hypocotyl. Plant Sci. 2003, 164, 259–265. [Google Scholar] [CrossRef]
  56. Simko, I. Genetic variation in response to N, P, or K deprivation in baby leaf lettuce. Horticulturae 2020, 6, 15. [Google Scholar] [CrossRef]
  57. Muchecheti, F.; Madakadze, C.; Soundy, P. Leaf chlorophyll readings as an indicator of nitrogen status and yield of spinach (Spinacia oleracea L.) grown in soils amended with Luecaena leucocephala prunings. J. Plant Nutr. 2016, 39, 539–561. [Google Scholar] [CrossRef]
  58. El-Nakhel, C.; Giordano, M.; Pannico, A.; Carillo, P.; Fusco, G.M.; De Pascale, S.; Rouphael, Y. Cultivar-specific performance and qualitative descriptors for butterhead Salanova lettuce produced in closed soilless cultivation as a candidate salad crop for human life support in space. Life 2019, 9, 61. [Google Scholar] [CrossRef] [Green Version]
  59. Albornoz, F.; Lieth, J.H. Daily macronutrient uptake patterns in relation to plant age in hydroponic lettuce. J. Plant Nutr. 2016, 39, 1357–1364. [Google Scholar] [CrossRef]
  60. Guiboileau, A.; Sormani, R.; Meyer, C.; Masclaux-Daubresse, C. Senescence and death of plant organs: Nutrient recycling and developmental regulation. C. R. Biol. 2010, 333, 382–391. [Google Scholar] [CrossRef] [PubMed]
  61. Chen, K.; Li, H.; Chen, Y.; Zheng, Q.; Li, B.; Li, Z. TaSCL14, a novel wheat (Triticum aestivum L.) GRAS gene, regulates plant growth, photosynthesis, tolerance to photooxidative stress, and senescence. J. Genet. Genom. 2015, 42, 21–32. [Google Scholar] [CrossRef]
  62. Chishaki, N.; Horiguchi, T. Responses of secondary metabolism in plants to nutrient deficiency. Soil Sci. Plant Nutr. 1997, 43, 987–991. [Google Scholar] [CrossRef]
  63. Galieni, A.; Di Mattia, C.; De Gregorio, M.; Speca, S.; Mastrocola, D.; Pisante, M.; Stagnari, F. Effects of nutrient deficiency and abiotic environmental stresses on yield, phenolic compounds and antiradical activity in lettuce (Lactuca sativa L.). Sci. Hortic. 2015, 187, 93–101. [Google Scholar] [CrossRef]
  64. Luo, J.; Liu, Y.; Zhang, H.; Wang, J.; Chen, Z.; Luo, L.; Liu, G.; Liu, P. Metabolic alterations provide insights into Stylosanthes roots responding to phosphorus deficiency. BMC Plant Biol. 2020, 20, 1–16. [Google Scholar] [CrossRef] [PubMed] [Green Version]
  65. Valdés-López, O.; Yang, S.S.; Aparicio-Fabre, R.; Graham, P.H.; Reyes, J.L.; Vance, C.P.; Hernández, G. MicroRNA expression profile in common bean (Phaseolus vulgaris) under nutrient deficiency stresses and manganese toxicity. New Phytol. 2010, 187, 805–818. [Google Scholar] [CrossRef]
  66. Sirohi, G.; Pandey, B.K.; Deveshwar, P.; Giri, J. Emerging trends in epigenetic regulation of nutrient deficiency response in plants. Mol. Biotechnol. 2016, 58, 159–171. [Google Scholar] [CrossRef] [PubMed]
  67. Wang, L.; Yuan, H.; Wang, B.; Sun, X.; Lu, X.; Yu, W. High quality yield in lettuce in response to low nitrate content can be achieved by reduced nitrogen application. Int. J. Agric. Biol. 2018, 20, 2243–2250. [Google Scholar]
  68. He, J.; Qin, L. Impacts of Reduced Nitrate Supply on Nitrogen Metabolism, Photosynthetic Light-Use Efficiency, and Nutritional Values of Edible Mesembryanthemum crystallinum. Front. Plant Sci. 2021, 12, 686910. [Google Scholar] [CrossRef]
  69. Kyriacou, M.C.; El-Nakhel, C.; Soteriou, G.A.; Graziani, G.; Kyratzis, A.; Antoniou, C.; Ritieni, A.; Pascale, S.D.; Rouphael, Y. Preharvest nutrient deprivation reconfigures nitrate, mineral, and phytochemical content of microgreens. Foods 2021, 10, 1333. [Google Scholar] [CrossRef] [PubMed]
Figure 1. Experimental timeline in this study.
Horticulturae 07 00525 g001
Figure 2. Time-course changes in taproot diameter of hydroponic radishes after the start of the nutrient deficiency experiment. Vertical bars represent the means ± SE (n = 8). WW, nutrient deficiency for 14 days; NN, full nutrient for 14 days; NW, nutrient deficiency for the last 7 days; WN, nutrient deficiency for the first 7 days.
Horticulturae 07 00525 g002
Figure 3. Taproot of hydroponic radishes at 14 days after the start of the experiment. Bar = 2 cm. WW, nutrient deficiency for 14 days; NN, full nutrient for 14 days; NW, nutrient deficiency for the last 7 days; WN, nutrient deficiency for the first 7 days.
Horticulturae 07 00525 g003
Figure 4. Components and DPPH of hydroponic radish taproots at 14 days after the start of the experiment. Taproot nitrate content (A), total phenol content (B), DPPH radical scavenging capacity (C), ascorbic acid content (D), and sugar content expressed by Brix (E). Vertical bars represent the means ± SE (n = 8). Different letters indicate significant differences among the treatments at p < 0.05 by Tukey–Kramer’s test. WW, nutrient deficiency for 14 days; NN, full nutrient for 14 days; NW, nutrient deficiency for the last 7 days; WN, nutrient deficiency for the first 7 days.
Horticulturae 07 00525 g004
Figure 5. Time-course changes in radish leaf SPAD and photosynthetic quantum yield of photosystem II after the start of the nutrient deficiency experiment. SPAD value of old leaves (A) and young leaves (B). Photosynthetic quantum yield of photosystem II (Fv/Fm) of old leaves (C) and young leaves (D). Vertical bars represent the means ± SE (n = 8). WW, nutrient deficiency for 14 days; NN, full nutrient for 14 days; NW, nutrient deficiency for the last 7 days; WN, nutrient deficiency for the first 7 days.
Horticulturae 07 00525 g005
Figure 6. Total phenol content (A) and oxygen consumption (B) of fibrous roots of hydroponic radish at 14 days after the start of the experiment. Vertical bars represent the means ± SE (n = 8). Different letters indicate significant differences among the treatments at p < 0.05 by Tukey–Kramer’s test. WW, nutrient deficiency for 14 days; NN, full nutrient for 14 days; NW, nutrient deficiency for the last 7 days; WN, nutrient deficiency for the first 7 days.
Horticulturae 07 00525 g006
Table 1. Leaf number and shoot/taproot ratio of hydroponic radishes at 14 days after the start of the experiment (n = 8).
Treatment 1Leaf NumberTop/Taproot Ratio
WW6.9 b 20.6 b
NN9.0 a1.1 ab
NW8.9 a0.6 b
WN8.6 a2.0 a
1 WW, nutrient deficiency for 14 days; NN, full nutrient for 14 days; NW, nutrient deficiency for the last 7 days; WN, nutrient deficiency for the first 7 days. 2 Different letters indicate significant differences among the treatments at p < 0.05 by Tukey–Kramer’s test.
Table 2. Fresh and dry weights and water content of hydroponic radishes at 14 days after the start of the experiment (n = 8).
Treatment 1Fresh Weight (g)Dry Weight (g)Water Content (%)
TopTaprootFibrous RootTopTaprootFibrous RootTopTaprootFibrous Root
WW1.9 c 24.2 b0.6 b0.3 c0.5 b0.06 b83.7 b86.8 b90.8 b
NN16.9 a19.7 a0.9 ab1.3 a1.1 a0.07 ab92.7 a94.4 a92.2 a
NW7.3 bc16.5 a0.9 ab0.6 bc1.0 a0.07 ab91.6 a93.5 a92.2 a
WN10.7 ab6.1 b1.4 a0.7 b0.4b0.11 a93.5 a93.1 a92.2 a
1 WW, nutrient deficiency for 14 days; NN, full nutrient for 14 days; NW, nutrient deficiency for the last 7 days; WN, nutrient deficiency for the first 7 days. 2 Different letters indicate significant differences among the treatments at p < 0.05 by Tukey–Kramer’s test.
Publisher’s Note: MDPI stays neutral with regard to jurisdictional claims in published maps and institutional affiliations.