Article

Citizen Science in Vegetable Garden Cultivar Evaluation in Tennessee

by
Virginia R. Sykes
,
Natalie R. Bumgarner
*,
Stefanie Brooke Keadle
,
Aleksandra Wilson
and
Francisco Palacios
Plant Sciences Department, University of Tennessee, Knoxville, TN 37996, USA
*
Author to whom correspondence should be addressed.
Horticulturae 2021, 7(11), 422; https://doi.org/10.3390/horticulturae7110422
Submission received: 28 September 2021 / Revised: 13 October 2021 / Accepted: 14 October 2021 / Published: 21 October 2021
(This article belongs to the Special Issue Consumer Horticulture Advancement)

Abstract

:
Edible food production is a growing area of horticultural interest that can engage multiple generations of rural to urban residents with varying levels of experience. Residential or community garden food production can provide many benefits, including the production of healthy produce, establishment of community or social connections, and increased physical activity. Regardless of experience, food gardeners are interested in growing crops and cultivars well-suited to their region and which provide both productivity and crop quality. This means that cultivar selection is a common question for gardeners. However, formal cultivar evaluation is relatively rare in the non-commercial food production sector due to the number of cultivars, the challenges of replicated trial management, and the scarcity of public researchers focused on consumer horticulture. This limits the information available to support new gardeners, which lowers the chances of overall success including high-quality harvests. Such crop and variety selection questions are common for Extension personnel in the United States as well as many others who work with gardeners. Even with this high level of interest, funding for consumer garden trials is limited and the cost of replicated trials across various geographical sites is high. To fill this gap in research and address the need for high-quality data to support education, University of Tennessee Extension and research faculty have developed a citizen science approach called the Home Garden Variety Trial (HGVT) program. The HGVT is a collaborative effort between Extension and research faculty and educators, who select trials, provide seeds, and compile data, and citizen scientists around the state, who conduct the trials using their usual gardening practices in their own home or community gardens. Beginning in 2017, the collaborators have conducted five years of research involving over 450 individual gardeners in more than half of the counties in Tennessee. The HGVT is a novel and effective tool to introduce gardeners to new crops and cultivars while providing previously unavailable data to researchers. Together, researchers and home gardeners collect and compile data that supports residential and community food production success while engaging new and experienced gardeners in participatory science research.

1. Introduction

Interest in residential food production has risen in recent years, with an estimated 35% of U.S. households gardening for food [1]. Increased interest from younger audiences and new gardeners has contributed to the popularity of vegetable and fruit production in recent years [1,2]. This influx of new gardeners is an exciting opportunity for consumer horticulture retailers, researchers, and educators. However, facilitating gardeners’ success in edible crop production has created an increased demand for information about the selection of crops and cultivars and their production in residential scale growing systems, such as raised beds and containers.
In the United States, land-grant Extension systems serve the vital function of delivering research-based information to the public and meeting the needs of existing and new gardeners. Even with the crowded digital environment and competition within the information sector, Extension is seen as a trusted source of information by horticulture consumers [3]. However, research-based information is lacking for many areas of home food production, including cultivar selection for residential-scale vegetable growing [4]. The number of garden crops and cultivars along with the expense of vegetable crop trials and the small number of consumer horticulture vegetable researchers has resulted in a scarcity of state- or regional-specific vegetable variety performance and selection information. Regionally specific cultivar data are valuable because they can support new gardeners during this time of high interest as well as assist experienced gardeners in utilizing newer disease-resistant cultivars to enhance sustainable management practices and improve crop yield and quality.
It is not just cultivar trials that are needed to support new horticulture practitioners. Research within the area of consumer horticulture overall is challenged by a current personnel focus on consumer education and a lack of funding targeting foundational research in the areas of plant function, performance, and human benefits [5]. A unique solution to funding and personnel challenges in the consumer horticulture research area, and specifically for plant selection and performance evaluation, is the opportunity to engage with stakeholders through citizen science programs. Citizen science involves public participation in research projects where engaged and interested volunteers with a range of expertise take part in data collection or analysis [6,7]. Citizen science has been documented to help study ecosystems in the context of environmental monitoring [6], conservation [8], urban farming [9], and agronomic crop variety selection [10]. In the broader context, citizen science can also contribute to the larger goals of scientific trust and literacy and supporting the resilience of our food systems [11,12]. It has also been studied in the context of behavior change and impact on participants [13], so it can benefit both scientific and individual knowledge.
To address these needs in applied horticulture research, the Home Garden Variety Trial (HGVT) program was begun at the University of Tennessee in 2017. By involving Tennessee home gardeners in a citizen science approach to variety evaluation, variety performance has been collected across many locations. Important data has been gathered on crucial attributes for home gardeners, such as germination, plant health, yield, attractiveness, and flavor. The goal of the Tennessee HGVT program is to answer the question, “which varieties are best suited to Tennessee gardens?” Growing a well-adapted variety can result in higher yields, more flavorful produce, and more success in pest and disease control. In addition to these applied research and outreach objectives, the home garden variety trial program also enables participatory science across experience levels and ages. This engagement builds new avenues for connecting the land-grant university Extension system and stakeholders, while building understanding and valuation of applied horticulture research. This opportunity for Extension and research faculty and educators to collaborate with Tennessee residents and gardeners has been valuable in supporting several key objectives:
  • Collection of variety performance data that is analyzed and compiled to identify varieties with superior performance in Tennessee;
  • Introduction of newer disease resistant varieties to gardeners, which can lead to more productive gardens;
  • Introduction of productive garden crops and cultivars to novice gardeners and youth;
  • Engagement of gardeners in the scientific process through citizen science project participation.
This paper will provide an overview of the University of Tennessee HGVT program from its inception in 2017 through recent pandemic challenges and opportunities. Time at home and food system interruption by the COVID-19 pandemic have further enhanced recent trends in home food production and demand for high-quality gardening information. The year 2020 brought in an estimated 18.3 million new gardeners, while two-thirds of gardeners tried new crops or techniques [2]. This interest, and thus the need for vegetable gardening information, is expected to remain strong with recent surveys showing that most (86–89%) gardeners plan to maintain or increase their gardening efforts in the future [2,14]. The pandemic increased demand for the applied research developed through this program and enhanced the justification and need for such projects. Therefore, the central goal of this paper is to explain the methods of program design, development, data collection, and analysis in order to enable others to understand the potential for citizen science. This paper will focus on the quality and value of citizen science as an applied research tool that can be used to support related Extension outreach. However, the concentration here will be on the participatory cultivar evaluation research rather than the Extension outreach. This approach is intended to support others in developing and deploying similar programs to enhance consumer horticulture research and support residential and community food production success in their regions.

2. Materials and Methods

2.1. Trial Design

The first step in initiating the HGVT was determining the criteria on which cultivars would be trialed and developing the framework of cultivar comparison. Insight on crop and cultivar selection and areas of evaluation was gathered from university faculty conducting similar efforts (Kalb, pers. comm). It was determined that the HGVT would focus on direct-seeded vegetable crops for logistical simplicity compared to transplanted crops. Trials were designed to be paired comparisons within crops, focused on comparing plant performance and quality of the two cultivars across various factors including germination, health, appearance, yield, and flavor. Each year, trial cultivars were selected to understand the performance of well-known and established cultivars compared to new cultivars, disease-resistant selections, and heirlooms. This combination of common garden varieties trialed against promising newly-released varieties that offered disease resistance, flavor, or novel traits was designed to support data collection and to introduce new cultivars that may offer performance benefits to citizen science participants. Selections offered in the HGVT over the past few years were from sources available to home gardeners, including Southern Exposure Seeds, Burpee Seeds, Stokes Seed, Kitchen Garden Seeds, Seed Savers Exchange, HPS Seeds, Gurneys Seed, Outside Pride Seeds, Seeds N Such, Harris Seeds, Johnny’s Selected Seeds, Park Seeds, Territorial Seeds, and Holmes Seed. Industry breeders were allowed to submit entries for recently released or pre-release material, but project PIs selected most trials from available seed sources.
The main crop categories included beans, cucumbers, corn, muskmelons, watermelons, summer squash, winter squash, pumpkins, okra, leafy greens, as well as herbs and flowers, which were added in 2018 and 2019. These were further divided into sub-categories (e.g., bean—green pole, compact green bush), and two cultivars each year were selected to be compared in the trial. Roughly 20 trial categories were selected each year. Trial options have changed year to year based on total participation in each trial type and participant feedback. Trials with lower participation or higher failure rates were reduced or removed and replaced with more promising crops for Tennessee home growers. As more new gardeners utilized raised beds and containers, smaller space options have been an increasing focus in the trial. Additionally, an online roundtable discussion with all interested HGVT participants occurred at the end of each trial season. Feedback from these discussions has contributed to the addition of several vegetable cultivars as well as flower (2019) and herb (2018) trials to support culinary uses as well as pollinator support.
Crop and cultivar selection was designed to provide replication within years, through the broad range of sites represented by individual citizen scientists and across time, by repeating the trialing of cultivars in multiple trial years. Cultivars that performed well in the trial were repeated in later years to ensure their performance was consistent and as comparisons for new cultivars in the trial. Another trial design element to evaluate the reliability of the data was the inclusion of blind trials in 2019 and 2020. Blind trials consisted of removing the cultivar names of several popular trials in order to determine if recognizability influences participant bias when rating the named trial.

2.2. Participant Recruitment and Engagement

Recruitment has been a key focus in the winter to early spring of each trial year following selection of trial crops and cultivars. In 2017, the trial began with Extension Master Gardener (EMG) volunteers as citizen science participants. This enabled the program to be initially evaluated with feedback from experienced gardeners who were familiar with agricultural research and the Extension system. Participants were recruited from the broad population of Tennessee residents in all subsequent years without any knowledge or experience prerequisites. A variety of publicity methods have been used to reach out to current and potential Extension audiences. County Extension offices were used as a site for both promotion and collection of order forms and fees. Promotional videos and flyers for print and social media outreach have been used.
Seed for the trials was purchased prior to opening the program to trial requests. Trial requests were filled on a first come/first served basis, until seed supplies were depleted or seasonal timing was no longer appropriate for the selected trial. On occasion, for trials that quickly depleted supplies early in the request period, additional seeds were purchased. A mid-March deadline has been used to enable the team to fill and ship orders in time for proper planting. A trial fee of USD 2 per trial has been collected to encourage engagement and commitment. Participants can mail in cash or checks and pay fees by credit card through an online ordering system. Families with children under 18 may request one free youth trial per year to encourage young gardeners to gain experience growing vegetable crops and introduce them to new crops. Youth trials have typically focused on crops with greater appeal to younger gardeners, such as yard long beans or Tennessee dancing gourds. Youth trials contain an additional handout explaining the importance and logistics of the trialing process in simplified language. Youth trials are available irrespective of participation in other fee-based trials. Participants are able to request a maximum of five trials each year (excluding blind and youth trials).
All trial orders have been filled, packed, and shipped by Extension faculty, staff, and students at the University of Tennessee-Knoxville campus. Bulk seed is repackaged in coin envelopes to prevent seed company information from influencing participants. Each participant receives a kit containing seed (enough for a 10-foot row) for two varieties for each trial requested, a blank garden map to plan for planting, information specific to the crop species selected (including planting date, plant spacing, nutrient requirements, and other care instructions.), small garden stakes, and an evaluation sheet for each trial.
Individual participants have grown the trials at their residence, a local community garden, school garden, or Extension Master Gardener demonstration garden. All trials have taken place within the state of Tennessee throughout the spring to fall growing season as appropriate for the crops being trialed. Tennessee provides a range of different growing conditions, so participants are advised to plant their trials according to local climate trends. Results are presented on a statewide basis and are not broken down regionally, as this would reduce sample size below the threshold with which meaningful analysis could be conducted. However, this may be a focus in the future for some of the trials with larger participation rates.
Participants manage their garden trials, evaluate characteristics identified in the evaluation sheet, and return data upon completion of the trial. All files and instructions permanently reside on the HGVT web page (tiny.utk.edu/hgvt, accessed on 18 October 2021). When evaluating trials, participants mark which of the two varieties performed better in germination, plant health, first fruit, yield, appearance, and flavor. They also give a performance rating on a scale of 1 to 10, with number one indicating poor performance and number 10 indicating excellent performance, along with an open-ended question about their perception of the performance and desirability of each cultivar. Participants are asked to select whether they would recommend either variety to other home gardeners (Figure 1). Early in the project, evaluations were completed via paper surveys, while in 2019–2021, there was the additional option of online or paper evaluation. Communication has taken place throughout the growing season, with participants being contacted approximately once a month. These email communications have included educational Extension materials, videos, suggestions for successful home gardening, and information and links to the trial resources.

2.3. Data Collection and Analysis

Data has been collected in the fall as participants either mail back paper copies of their trial evaluation forms or fill out an online survey version of the evaluation form (UTK IRB-17-04195). Evaluation forms consisted of 14 questions per trial, including multiple-choice, open-ended, and rating scales. Over the years, online evaluations have increased in popularity while fewer participants mail back paper forms. Participant responses from the paper forms were entered into spreadsheets, and online results downloaded and moved into spreadsheets for analysis. JMP Pro 16 and SAS 9.4 (Cary, NC, USA) were used to analyze data and determine which cultivar participants preferred for each trial. Data were evaluated using a two-tailed chi-square test for categorical variables (germination, health, first fruit, yield, appearance, flavor) and one-way analysis of variance for continuous variables (performance). Both tests used an alpha level of 0.1 to determine significance.
This data was compiled each year into an Extension bulletin detailing which garden cultivars are recommended by home gardeners across the state and complete results from all crops in the trial. Graphs showed the percentage of evaluations in which a variety was marked as superior for a given trait and reported the mean performance score for each variety. Results provided the percentage of gardeners that recommended each cultivar, lists describing why they recommend it, photos of the cultivars, and select comments from growers describing their experience growing each cultivar (Figure 2). These publications can be found online and are the UT Extension document W657 [15,16,17,18].
Data on requested trials, returned data, failure rates, the participant reported methods, and experience level were compiled from 2017 through 2021. Categorical data analyses were performed using JMP (Pro 6.0; Cary, NC, USA), and analyses of variance were performed using SAS (v. 9.4; Cary, NC, USA). An alpha level of 0.1 was used to determine statistical significance. Mean separation was performed using Fisher’s protected LSD.

3. Results and Discussion

3.1. Participation, Management Methods, and Experience of Citizen Scientists

Between 2017 and 2021, a total of 4408 trials were requested by citizen scientist participants (Table 1). The most popular trials, averaging over 100 requests annually, were flowers (211), summer squash (151), tomato (126), and bean (122). The least popular trials, averaging less than 50 requests annually, were carrot (29), corn (3), leafy greens (41), and pumpkin (42). A total of 478 unique individuals have participated in the trial program. Of these, 124 participated in two or more years, while 354 participated in a single year. Participation was capped at 45 individuals in the pilot year (2017). Since 2017 was a pilot year designed to evaluate the program methods, experiences and general program evaluation that helped guide the project are included. However, individual cultivar evaluation data is only presented from the full project years of 2018–2020. The number of participants grew to 135 in 2018 and 171 in 2019. Participation dipped slightly in 2020 due to a recruitment window reduced by COVID-19 restrictions (139 participants) but recovered and was at its highest level in 2021 (186 participants).
On average, 41% of participants returned trial data at the end of the season (Table 2). Return rate ranged from 32% to 55%, depending on the crop. Excluding 2017, which was the program evaluation year, first-time participants tended to have lower average return (33%) rates compared to those who had participated in the program for more than one year (53%) (Table 3). Average return rates were lower in years three and four of the program compared to the preceding years. This is likely due to advertising to a broader demographic, resulting in participants representing a wider range of gardening experience.
Participation numbers and return rates illustrate both the opportunity and the challenge of using a citizen science project to educate and engage participants and efficiently collect trial data and evaluations. Following the 2017 program evaluation year, when participation was limited to EMG volunteers, no set requirements have been placed upon participants. Those interested have been able to request on a first-come, first-served basis, and the only limits have been seed quantities and the number of orders that could be filled and shipped in the early spring to enable arrival before ideal planting dates. This means that as the program has become more well-known and interest in food gardening has increased, new participants and those with less experience have been able to participate.
While the proportion of first-time participants has varied throughout the trial years, the return rate for new participants has lagged those of returning participants (Table 3). This may be due to a lack of complete understanding of the project’s scientific goals or lack of commitment by new gardeners or those less connected to land-grant universities. This fits with similar citizen science programs that have found participant knowledge has increased through citizen science engagement, but participation alone is likely insufficient to provide a foundation for understanding of scientific research and efforts overall [13]. In the 2019, 2020, and 2021 trial years, there has been an increased focus on communicating with participants and providing educational resources through email, video, and social media engagement throughout the growing season. These efforts were designed to support knowledge gain while also explaining the value of the participant role and data in the project. More concerted efforts and formalized processes are needed to introduce new gardeners to both key management practices in the garden and the importance of their follow-through in returning data on both crop successes and failures.
Beginning in 2019, participants were asked to report crop failure that prevented the complete evaluation of a trial. This was done to increase data return rates as it was anticipated that participants might not consider data return relevant to the trial program if a crop had failed. While this did not provide the expected increase in data return rates, it did provide information on which crops were more challenging for citizen scientists and why. Reported crop failure rates varied widely by crop (Table 4). Leafy greens had the highest reported failure (44%), while winter squash had the lowest (2%). While many crop failures were equally spread across germination, human error, insect/disease, and wildlife issues, certain crops exhibited higher rates within specific categories. Pumpkins and corn appeared to be more prone to wildlife issues, corn and flowers to human error, flowers, herbs, and melons to germination issues, and squash and pumpkin to insects/diseases.
These rates and reasons of failure have been used to guide crop and cultivar selection in subsequent years. Over time, pumpkin and sweet corn trials have been replaced by those with higher levels of success and participation. Conversely, flower and herb trials have experienced high enough participation rates to continue to be included despite germination issues. However, as discussed above, more time and communication efforts have been spent in recent years to educate and support gardeners in starting transplants and seeding practices and timing to support better success in trial establishment. It may also be helpful in the future to assess citizen science participant motivation and focus recruitment and engagement efforts based on key motivations, as has been investigated in other citizen science projects [19]. While this project has been designed primarily based on techniques to enhance data gathering and quality, it may be valuable in the future to focus more on the social dimensions.
As the HGVT program grew and expanded, new questions were added to the evaluation to better understand participant techniques and gardening experience and practices. Site and nutrition management data collection began in 2019. These questions included fertility type, site type, and years of gardening experience. Most participants grew their trials in-ground (58%), followed by raised beds (31%) (Table 5). Only 9% of trials were grown in containers. Categorical analysis of crop failure rates by site was not significant (p = 0.8090), with sites averaging a 20% failure rate across all the growing systems. The fact that the failure rate is not significantly different between garden sites supports the inclusion of a range of sites in the trial. The practice of sharing data and cultivar suggestions with gardeners across growing systems is also supported by the results of Crane et al. [4], who found that in-ground performance of cucumber cultivars in trials was similar enough to be useful in suggesting cultivars to gardeners who grow in containers.
Fertility methods were close to equally distributed among compost, compost + organic, synthetic, and none, averaging 22% to 29% of trials (Table 6). Compost + synthetic was a much smaller proportion of trials (4%). Crop failure rates by fertility were not significant (p = 0.1498). While failure rates for compost + synthetic or synthetic averaged 11 to 13%, failure rates were nearly double (19% to 25%) for the remaining categories, which did not include synthetic fertilizer. Questions targeted at better understanding participant fertility use could provide greater insight into impact on crop failure rate as well as indicate if education materials are needed on how to optimally combine compost use with fertilizer to best meet crop nutrient needs.
The majority of participants had 20 to 30 years of gardening experience (27%) (Table 7). Only 8% of participants had less than five years of gardening experience. Crop failure by years of gardening experience was significant (p = 0.0795). Trials executed by participants with less than five years of gardening experience had a failure rate of 45%. This was three times higher than trials executed by those with 10 to 40 or greater than 50 years of gardening experience. While not surprising, the higher level of failure among participants with less gardening experience indicates that more education may be warranted in order to build success among participants and produce a more extensive data set. In future trial years, first-time participants may need to be engaged earlier in the trial and more directly, potentially with an introductory visit or training to best support their first-year experience.

3.2. Crop and Cultivar Evaluations

In the past four years (2017 to 2020), 158 cultivars have been evaluated through the Tennessee Home Garden Variety Trial program. Performance ratings differed (p < 0.0001) among cultivars. 
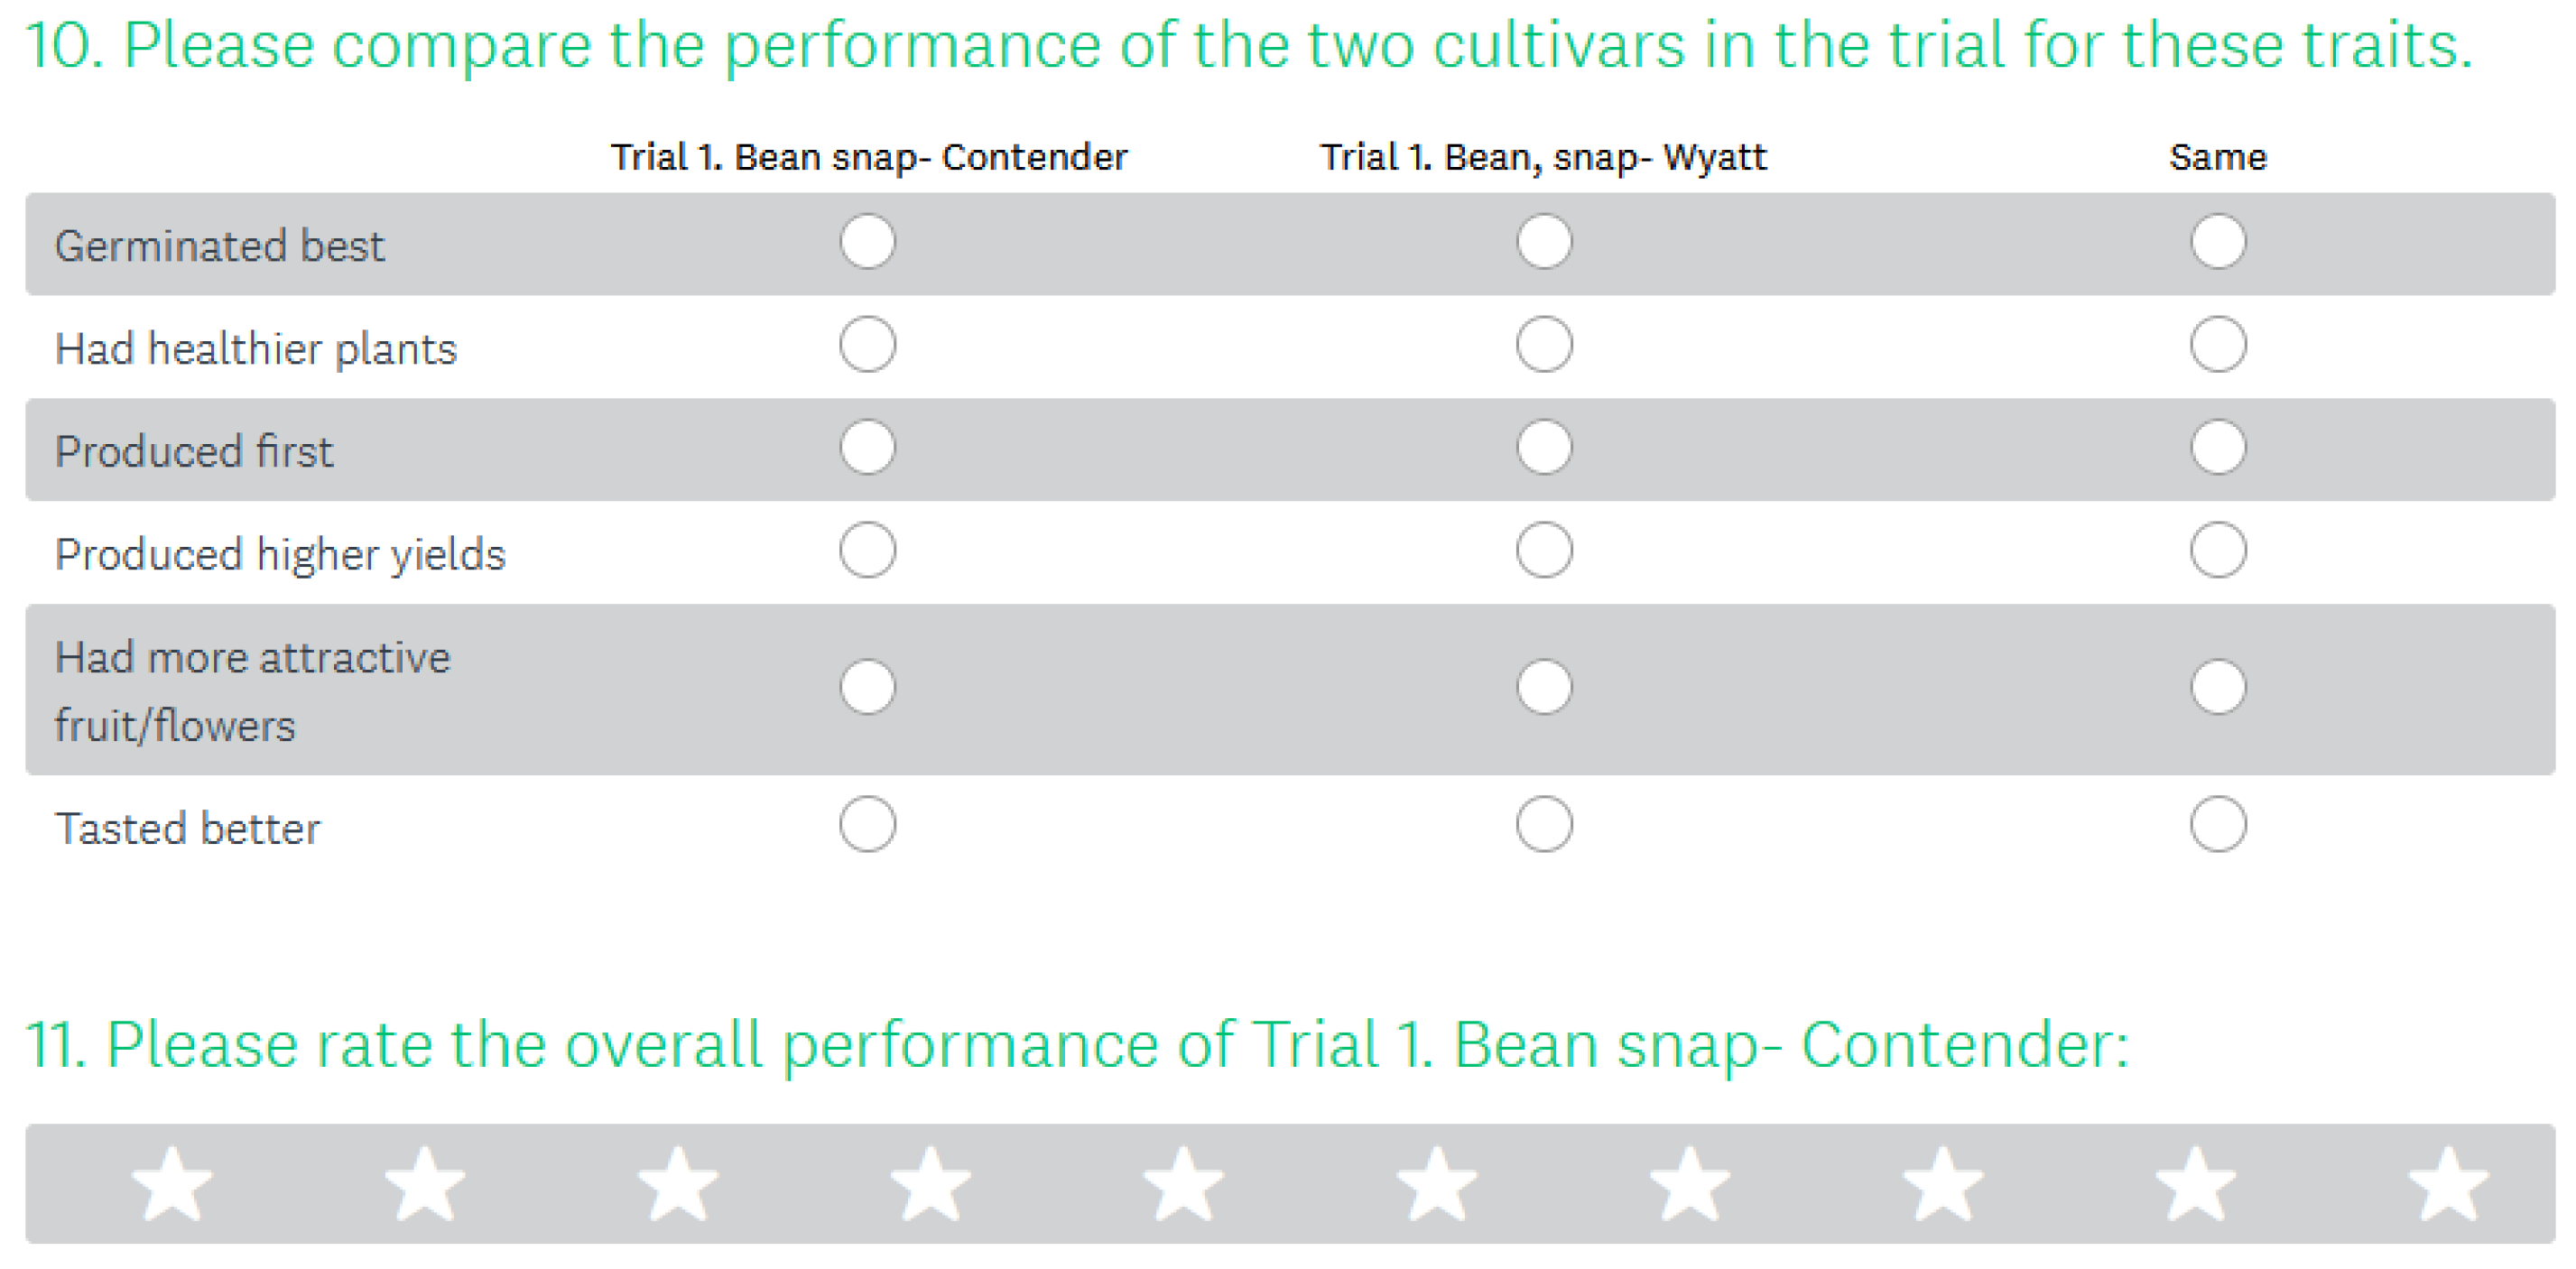
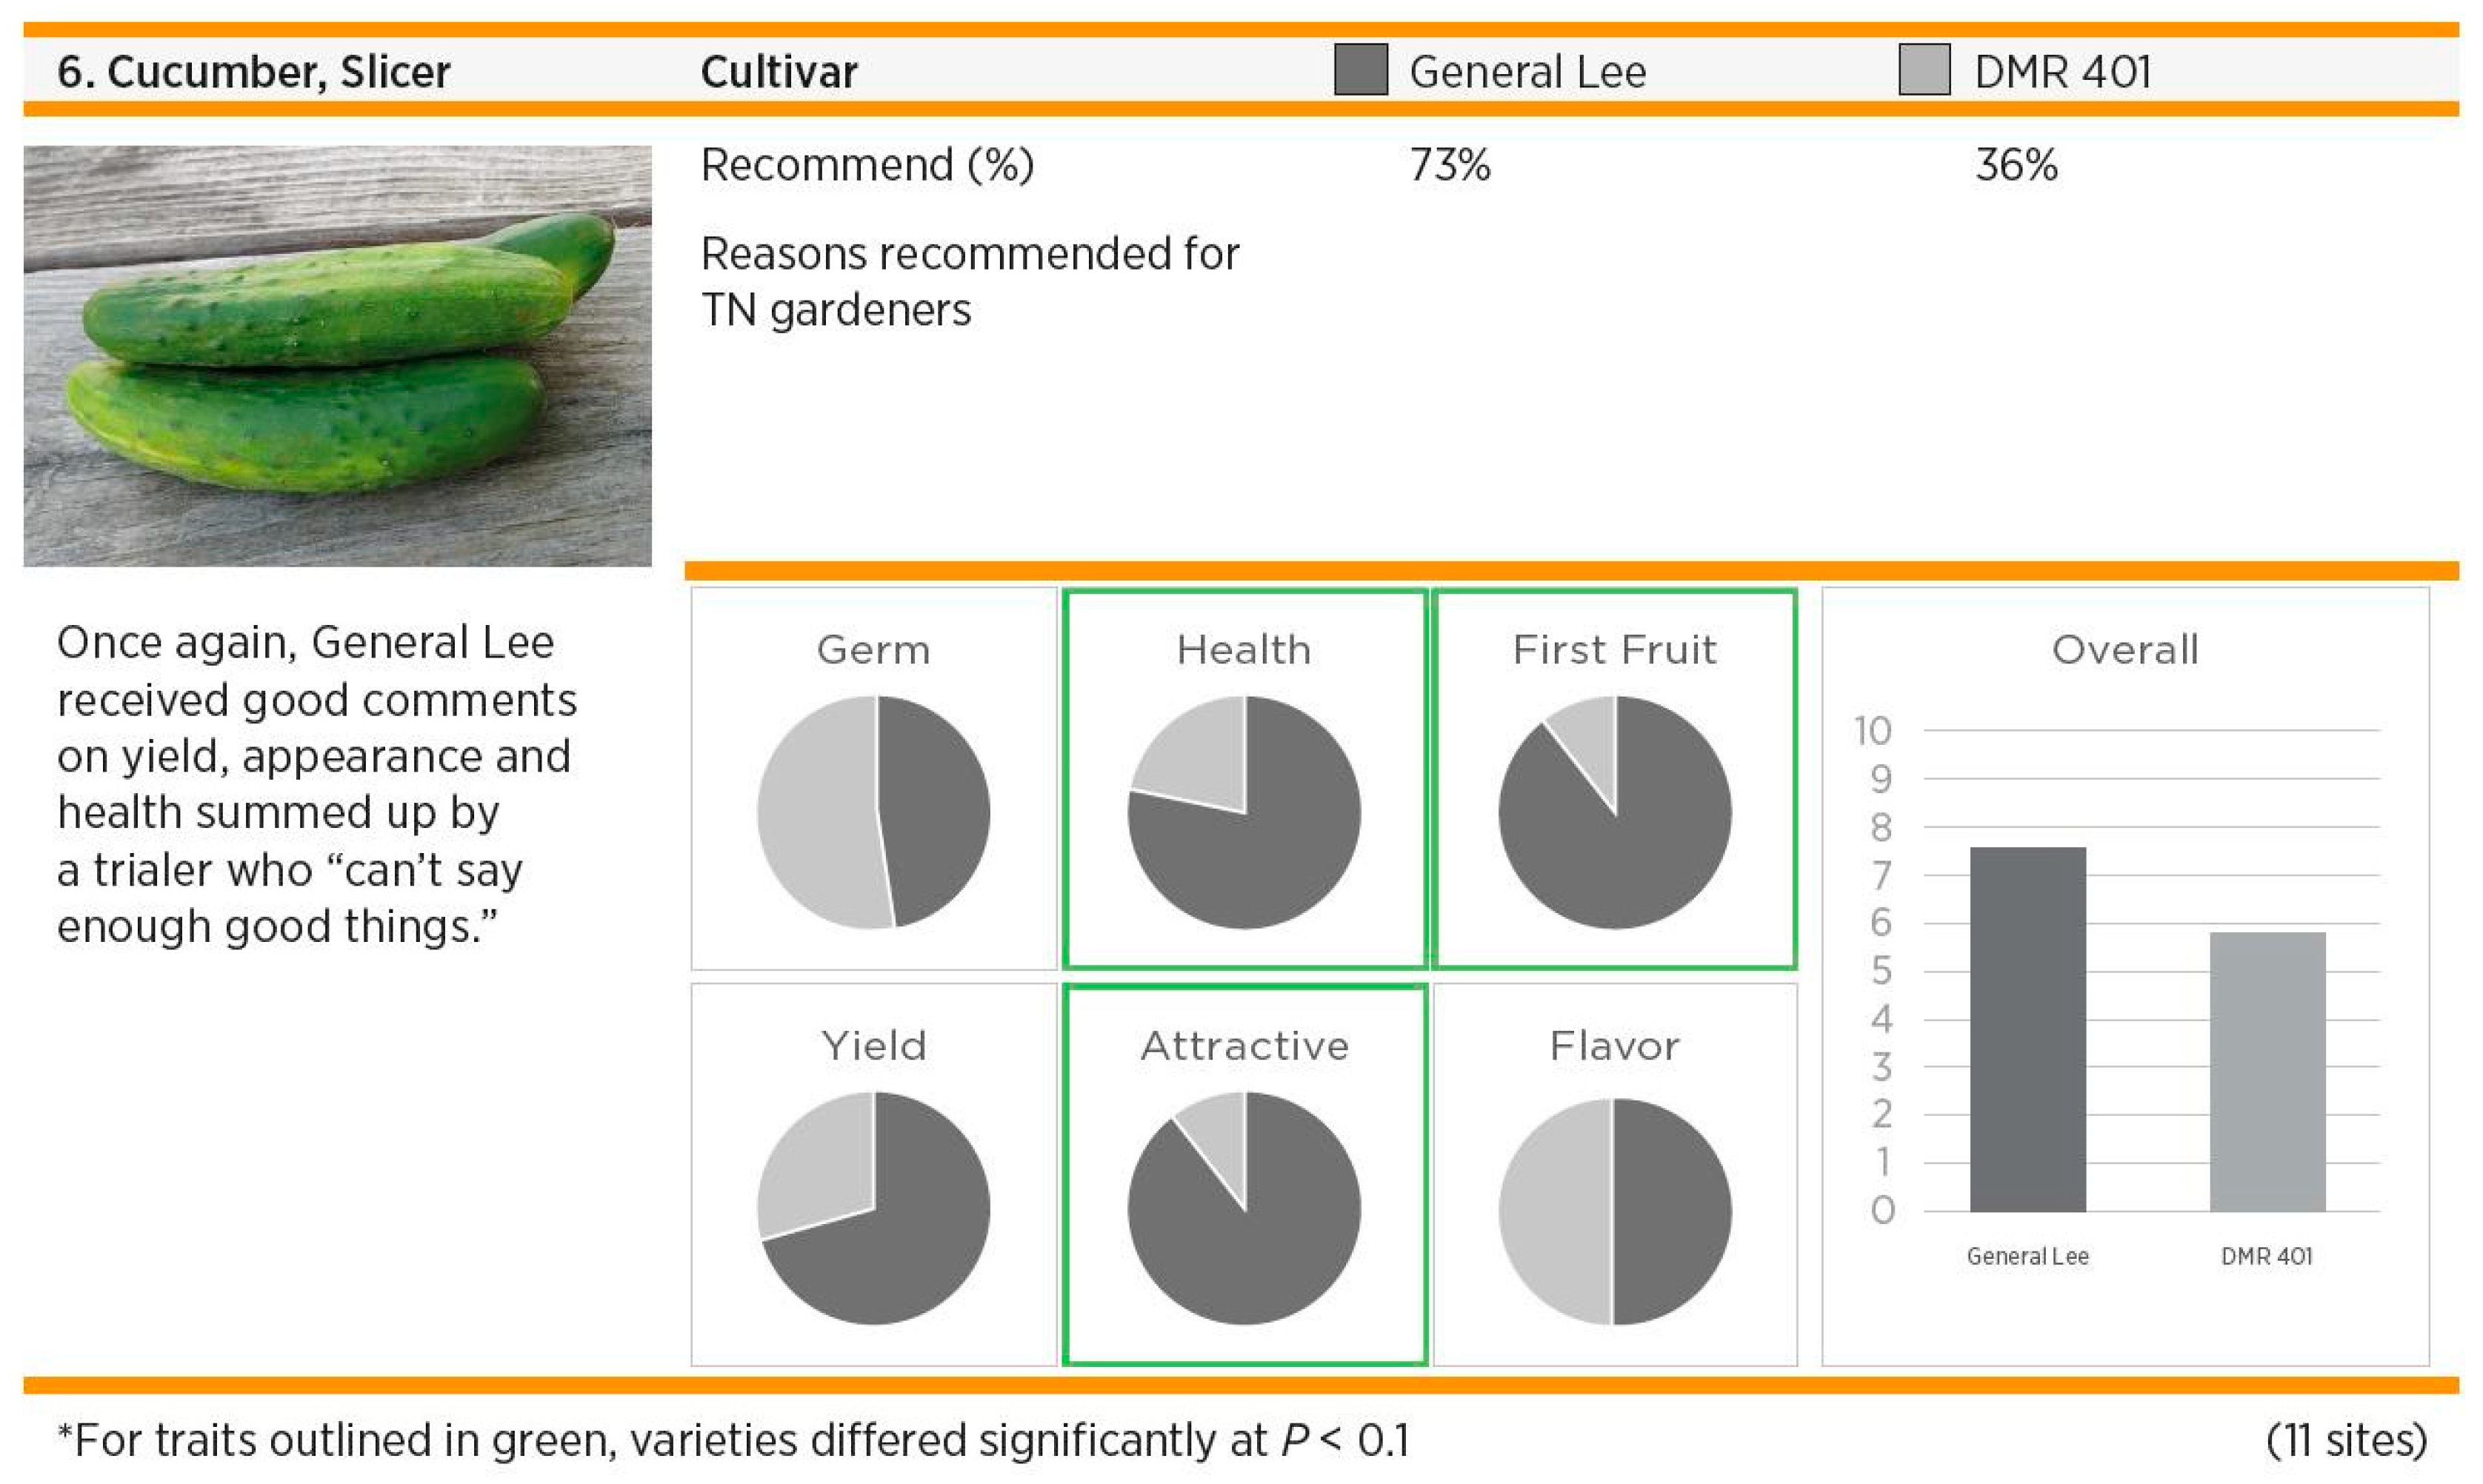
Table 8 provides a summary of cultivar trials as well as statistical analysis for years 2018–2020. Individual cultivar evaluations from program evaluation year 2017 have not been included in the tables below. Performance ratings were on a 1 to 10 scale in all years of the trial, with 1 indicating poor performance and 10 indicating excellent performance. The most highly ranked cultivars across all years, with ratings of 9.0 or greater, were ‘Ambrosia’ (melon), ‘Desert’ (summer squash), and ‘Golden Star’ (summer squash), and ‘Maxibel’ (bean). The least popular cultivars, with ratings of 5.1 or less, were ‘Sugar Baby’ (watermelon), ‘Malibu’ (bean), and ‘Pepitas’ (pumpkin).
The proportion of respondents who stated they would recommend a cultivar to other home gardeners is also presented in Table 8. While this number tended to follow the same trend as performance ratings, a few high-performance scores were matched with a low recommendation and vice versa. This is very interesting and the reason for these dual questions in the evaluation. It is a goal of this evaluation to separate personal preferences for cultivars with overall performance. While it is likely that overall rating and recommendation for others will be similar, it is interesting that some cultivars were rated as better for others than the participant rated their own approval and satisfaction.
Participants were asked to specify qualities that influenced that recommendation in order to provide more insight into why participants preferred or did not prefer cultivars for themselves or others. Reasons listed by the highest proportion of respondents included yield (58%), flavor (55%), appearance (53%), health (51%), and size (42%). Less than 5% of respondents noted other reasons like texture, shape, early maturity, germination, shelf life, canning/cooking, production season length, and vigor. While non-commercial food producers use a range of factors in evaluating cultivars, it is interesting to see that appearance, health, yield, and flavor were all quite similar in the percentage of influence on ratings. These percentages illustrate the importance of trials that evaluate attributes other than yield, the most common data gathered in traditional cultivar trials. These reasons also line up with national surveys of gardeners who often rank taste and quality as high or higher in importance than productivity or money savings related to crop yield [1]. In many ways, these data on appearance, health, and flavor, as rated by real home gardeners, would not be accessible using traditional trial techniques.
Performance ratings by crop also exhibited significant differences (p < 0.0001) (Table 9). Okra, herbs, and summer squash had higher performance ratings (7.5 to 7.9) than flowers, pumpkin, melons, winter squash, and corn (6.4 to 6.9). Cucumber (7.2) and bean (7.1) fell in the middle of these two groups (7.2). The proportion of participants that would recommend cultivars within these groups closely followed rankings of performance scores. Some crops that did not perform well in the program evaluation year were not trialed again. For example, carrots were trialed only in 2017, and there were timing challenges in getting seeds to participants in the spring early enough for good production. As a general trend, longer season and more space consumptive crops, such as pumpkin, winter squash, and corn, tended towards lower ratings overall.
Of the cultivars evaluated, 11 were evaluated over two or more years in 2018–2020 (Table 10). Performance ratings between years within these cultivars were very similar with none of the cultivar rating showing significantly different results in different trial years. Differences between years ranged from 0.1 to 2.2 points, averaging 0.7 points. The strong internal consistency of the data for cultivars across years suggests reliable evaluations within our trial participants even with fluctuations in the individuals participating and the number of evaluations completed in a given trial.
Six cultivars were evaluated in both named and blind trials to determine if cultivar name biased participants evaluations (Table 11). Only Marketmore 76 cucumber exhibited a significant difference in performance rating between the named and blind trial. This cultivar ranked higher (9.1) in the blind trial compared with the named trial (7.8). Among most cultivars, the difference in performance rating between blind and named trials did not exceed 1.3 points. The pumpkin ‘Cinnamon Girl’ exhibited the largest difference, with the blind trial rated at an 8.2 for performance and the named trial rated at a 6. These results indicate name recognition bias appears to be a minor factor.

4. Conclusions

This HGVT project has provided valuable data and information to support home gardeners in Tennessee while also illustrating the effectiveness of novel applied research methods. Internal consistency of cultivar evaluations across years and the lack of significant differences in most named and blind cultivar evaluations do not reveal indications of bias or variability across years. These results build confidence in the evaluations as a tool for consumer horticulture research. These analyses support the evaluations and illustrate the unique aspects of cultivar trialing with a participatory approach. The evaluations go beyond yield and traditional field measures to provide feedback on flavor, quality, appearance, health, preservation, and other aspects of value to gardeners that would never be able to be assessed outside of citizen science systems.
As citizen science methodology becomes better understood, there are likely many methods that could be used to enhance such efforts for the benefit of applied scientific research, participant education, and quality of life. Internet applications and social media tools continue to evolve and provide creative methods to add value to scientific efforts for researchers while expanding the role of citizen scientists beyond data collection to a more integrated role as research collaborators [20]. This continued evolution of the role of the consumer in consumer horticulture research holds the potential for beneficial returns to academics, non-profits, horticulture retailers, and consumers.

Author Contributions

Conceptualization, N.R.B. and V.R.S.; methodology, N.R.B. and V.R.S.; formal analysis, V.R.S.; resources, N.R.B. and V.R.S.; data curation, N.R.B., S.B.K., F.P. and V.R.S.; writing—original draft preparation, N.R.B., S.B.K., V.R.S. and A.W.; writing—review and editing, N.R.B., S.B.K., F.P., V.R.S. and A.W.; supervision, N.R.B. and V.R.S.; project administration, N.R.B. and V.R.S.; funding acquisition, N.R.B. and V.R.S. All authors have read and agreed to the published version of the manuscript.

Funding

This research was funded by participant fees and internal funding requests supplied by University of Tennessee Extension.

Institutional Review Board Statement

The study was conducted according to the guidelines approved by the Institutional Review Board of University of Tennessee- Knoxville (UTK IRB-17-04195) approved 5 March 2018.

Informed Consent Statement

Informed consent was obtained from participants in accordance with the study IRB.

Data Availability Statement

Not applicable.

Acknowledgments

The author team gratefully acknowledges the excellent contributions of our citizen science participants throughout Tennessee, whose dedication makes this project possible.

Conflicts of Interest

The authors declare no conflict of interest.

References

  1. National Gardening Association. 2014. Garden to Table: A 5-Year Look at Gardening in America. Available online: https://garden.org/special/pdf/2014-NGA-Garden-to-Table.pdf (accessed on 25 September 2021).
  2. National Gardening Association. 2021 Survey. Available online: https://garden.org/newswire/view/dave/114/2021-National-Gardening-Survey-released/ (accessed on 25 September 2021).
  3. Yang, C.; Wang, J.; Watkins, E.; Bonos, S.; Nelson, K.; Murphy, J.A.; Meyer, W.; Horgan, B. Consumer preferences for information sources of turfgrass products and lawn care. Agron. J. 2017, 109, 1726–1733. [Google Scholar] [CrossRef]
  4. Crane, M.; Wehner, T.C.; Naegele, R.P. Cucumber Cultivars for Container Gardening and the Value of Field Trials for Predicting Cucumber Performance in Containers. HortScience 2018, 53, 16–22. [Google Scholar] [CrossRef]
  5. Bumgarner, N.; Dorn, S.; McGinnis, E.; Bennett, P.; Bauske, E.; Krishnan, S.; Bradley, L. Consumer Horticulture Advancement: Identifying Critical Research Areas and Cultivating Collaborations. HortTechnology 2019, 29, 769–776. [Google Scholar] [CrossRef] [Green Version]
  6. Shirk, J.L.; Ballard, H.L.; Wilderman, C.C.; Phillips, T.; Wiggins, A.; Jordan, R.; McCallie, E.; Minarchek, M.; Lewenstein, B.; Krasny, M.E.; et al. Public Participation in Scientific Research: A Framework for Deliberate Design. Ecol. Soc. 2012, 17, 29. [Google Scholar] [CrossRef] [Green Version]
  7. Van Vliet, K.; Moore, C. Citizen Science Initiatives: Engaging the Public and Demystifying Science. J. Microbiol. Biol. Educ. 2016, 17, 13–16. [Google Scholar] [CrossRef] [PubMed] [Green Version]
  8. Cooper, C.B.; Dickson, J.; Phillips, T.; Bonney, R. Citizen science as a tool for conservation in residential ecosystems. Ecol. Sci. 2007, 12, 11. [Google Scholar] [CrossRef]
  9. Prudic, K.L.; Wilson, J.K.; Toshack, M.C.; Gerst, K.L.; Rosemartin, A.; Crimmins, T.M.; Oliver, J.C. Creating the urban farmer’s almanac with citizen science data. Insects 2019, 10, 294. [Google Scholar] [CrossRef] [PubMed] [Green Version]
  10. Würschum, T.; Leiser, W.L.; Jähne, F.; Bachteler, K.; Miersch, M.; Hahn, V. The soybean experiment ‘1000 Gardens’: A case study of citizen science for research, education, and beyond. Theor. Appl. Genet. 2019, 132, 617–626. [Google Scholar] [CrossRef] [PubMed] [Green Version]
  11. Ryan, S.F.; Adamson, N.L.; Aktipis, A.; Andersen, L.; Austin, R.; Barnes, L.; Beasley, M.R.; Bedell, K.D.; Briggs, S.; Chapman, B.; et al. The role of citizen science in addressing grand challenges in food and agriculture research. Proc. R. Soc. B Boil. Sci. 2018, 285, 20181977. [Google Scholar] [CrossRef] [PubMed]
  12. Sandhaus, S.; Kaufmann, D.; Ramirez-Andreotta, M. Public participation, trust and data sharing: Gardens as hubs for citizen science and environmental health literacy efforts. Int. J. Sci. Educ. Part B 2018, 9, 54–71. [Google Scholar] [CrossRef] [PubMed]
  13. Jordan, R.C.; Gray, S.A.; Howe, D.V.; Brooks, W.; Ehrenfeld, J.G. Knowledge Gain and Behavioral Change in Citizen-Science Programs. Conserv. Biol. 2011, 25, 1148–1154. [Google Scholar] [CrossRef] [PubMed]
  14. Axiom. 2021 Garden Survey. 2021. Available online: https://axiomcom.com/2021-garden-survey/ (accessed on 25 September 2021).
  15. Bumgarner, N.R.; Sykes, V.R.; Keadle, B. Tennessee Home Garden Variety Trials 2018 Results; UT Extension W 657; UT Extension: Knoxville, TN, USA, 2019. [Google Scholar]
  16. Bumgarner, N.R.; Sykes, V.R.; Keadle, B. Tennessee Home Garden Variety Trials 2020 Results; UT Extension W 657; UT Extension: Knoxville, TN, USA, 2021. [Google Scholar]
  17. Sykes, V.R.; Bumgarner, N.R. Tennessee Home Garden Variety Trials: 2017 Results; UT Extension W 657; UT Extension: Knoxville, TN, USA, 2018. [Google Scholar]
  18. Sykes, V.R.; Bumgarner, N.R.; Keadle, B. Tennessee Home Garden Variety Trials: 2019 Results; UT Extension W 657; UT Extension: Knoxville, TN, USA, 2020. [Google Scholar]
  19. Wright, D.R.; Underhill, R.; Keene, L.G.; Knight, A.T. Understanding the motivations and satisfactions of volunteers to improve the effectiveness of citizen science programs. Soc. Nat. Res. 2015, 28, 1013–1029. [Google Scholar] [CrossRef]
  20. Schafer, T.; Kieslinger, B. Supporting emerging forms of citizen science: A plea for diversity, creativity, and social innovation. J. Sci. Comm. 2016, 15, 1–12. [Google Scholar] [CrossRef] [Green Version]
Figure 1. Example question block from online evaluation form illustrating the comparison of the performance of the two trial cultivars in the 2021 snap bean trial.
Horticulturae 07 00422 g001
Figure 2. Example summary data for the slicer cucumber trial in the 2020 HGVT showing the results and statistical comparison of cultivars ‘General Lee’ and ‘DMR 401′ trialed. Green boxes around the health, first fruit, and attractive fruit comparisons illustrate that ‘General Lee’ was rated as significantly higher (p < 0.1) in those areas versus ‘DMR 401′.
Horticulturae 07 00422 g002
Table 1. Trials requested by crop by year from 2017 to 2021. Data are presented in descending order from the highest yearly average number requested. Crops that do not have data for a specific year were not offered as trials in that year.
CropSum across Years (2017–2021)Yearly Avg.By Year
20172018201920202021
Flower632211--26596271
Summer Squash75715160102222110263
Cucumber6421284311016896225
Tomato126126----126
Bean61212260128138101185
Blind17286--10765-
Herbs27368-52617882
Youth25664-40765783
Winter Squash20551-59362486
Melon2045111817042-
Okra20251-40563373
Pumpkin12542316331--
Leafy Greens8241---1765
Corn9130134335--
Carrot292929----
Sum 4408125224771812657191459
Table 2. Data return rate by crop by year from 2017 to 2020. Data are presented in descending order from the highest yearly average data return rate. Crops that do not have data for a specific year were not offered as trials in that year. Data for youth trials are not presented as these trials were primarily for outreach purposes, and data was not requested in return. Tomato data is also not presented as these trials were first offered in 2021, and data collection and data are incomplete.
CropYearly Avg.By Year
2017201820192020
Carrot55%55%---
Corn54%69%58%34%-
Leafy Greens53%---53%
Okra46%-65%38%36%
Melon46%64%52%36%31%
Cucumber43%67%45%27%32%
Pumpkin43%52%44%32%-
Bean42%53%47%34%33%
Summer Squash42%57%54%25%31%
Herbs39%-46%36%35%
Winter Squash37%-46%39%25%
Flower37%--32%41%
Blind32%--31%34%
Average41%60%46%30%32%
Table 3. Trials requested and data return rate by previous trial experience of participant (new vs. experienced).
Trial YearTrials RequestedData Return Rate (%)
SumProportion (%)
TotalNewExp.NewExp.Avg. NewExp.
20172472470100%0%58%58%
20187186219776%24%47%45%82%
2019126592134457%43%29%27%39%
202071939032937%63%31%26%39%
2021145978367637%63%---
Table 4. Crop failure rate (self-reported) by crop by year from 2019 to 2020 and by reason for crop failure (self-reported). Data are presented in descending order from the highest yearly average data failure rate. Crops that do not have data for a specific year were not offered as trials in that year. Data are not presented for youth trials, as these were for outreach purposes, and data was not collected for trials offered only in years before 2019.
CropYearly Avg.By YearBy Reason for Crop Failure
20192020Germ.HumanInsect/DiseaseWildlifeUnknown
Leafy Greens44%-44%11%0%0%25%25%
Pumpkin40%40%-0%0%0%75%0%
Corn33%33%-0%17%0%25%25%
Flower29%24%33%9%12%3%9%53%
Melon28%32%23%13%4%8%0%73%
Okra25%0%50%3%5%0%17%100%
Blind16%9%23%2%6%14%13%25%
Herbs15%5%26%10%14%0%0%0%
Cucumber15%11%19%5%4%0%27%36%
Summer Squash14%16%12%3%4%9%15%46%
Bean14%15%12%1%2%6%27%73%
Winter Squash4%7%0%0%0%17%0%0%
Average23%18%24%5%7%5%16%44%
Table 5. Crop failure rate (N = no, Y = yes) by trial site as self-reported by trial participants in 2019 and 2020. Categorical analysis of crop failure by site was not significant at an alpha level of 0.1 (p = 0.8090).
SiteCrop FailureTrialsFailure Rate
NYSumProportion
Container3612489%25%
In-Ground2536031358%19%
Raised Bed1483418234%19%
Total437106543100%20%
Table 6. Crop failure rate (N = no, Y = yes) by fertility regime as self-reported by trial participants in 2019 and 2020. Categorical analysis of crop failure by site was not significant at an alpha level of 0.1 (p = 0.1498).
Fertility MethodCrop FailureTrialsFailure Rate
NYSumProportion
Compost1233415729%22%
Compost + Organic1032412724%19%
Compost + Synthetic172194%11%
None872911622%25%
Synthetic1031611922%13%
Total433105538100%20%
Table 7. Crop failure rate (N = no, Y = yes) by participant’s years of gardening experience as self-reported by trial participants in 2019 and 2020. Categorical analysis of crop failure by years of gardening experience was significant at an alpha level of 0.1 (p = 0.0795).
Years Gardening ExperienceCrop FailureTrialsFailure Rate
NYSumProportion
0–5119208%45%
5–102293113%29%
10–202743113%13%
20–3053106327%16%
30–40132156%13%
40–5034134720%28%
50+2553013%17%
Total18552237100%22%
Table 8. Mean performance rating by variety for 2018–2020. Performance was rated on a scale of 1 to 10, with 1 indicating poor performance and 10 indicating excellent performance. The number of participants who returned usable data for each cultivar is reported as “n”.
CultivarCropnMeanSERecommend
(%)
AmbrosiaMelon89.51.0100%
DesertSummer Squash89.40.988%
Golden StarSummer Squash129.30.8100%
MaxibelBean99.00.9100%
Sweetie PieMelon68.81.0100%
Easy Pick Gold IISummer Squash128.60.8100%
RattlesnakeBean148.60.7100%
ProviderBean118.60.8100%
GrandprizeSummer Squash128.50.892%
Marketmore 76Cucumber238.50.5100%
AmethystBean138.40.792%
EverleafBasil218.40.695%
Giesha GarlicChives178.40.894%
JambalayaOkra418.30.591%
ObsessionBasil218.30.6100%
Candle FireOkra268.30.580%
MetroWinter Squash118.30.891%
Golden GlorySummer Squash138.20.785%
TankuroBean98.21.0100%
Sugar CubeMelon258.10.582%
Aroma IIBasil228.00.586%
BlazePumpkin118.00.986%
BristolCucumber238.00.590%
DivaCucumber148.00.775%
Green LightCucumber128.00.891%
KnuckleheadPumpkin68.01.1100%
VolunteerBean48.01.467%
TempestSummer Squash328.00.493%
Double Click PinkFlower347.90.591%
GoldmineSummer Squash137.90.785%
Cool CustomerCucumber87.81.067%
FlashCool Season137.81.092%
Clemson SpinelessOkra457.80.490%
SuccessSummer Squash127.80.883%
Blue Lake Bush 274Blind247.70.579%
SpacemasterCucumber327.70.590%
ChampionCool Season137.71.092%
Sensation MixFlower347.70.588%
Bossa NovaSummer Squash117.60.880%
Dolce FrescaBasil467.60.476%
Kentucky WonderBean97.60.9100%
ZephyrSummer Squash137.50.8100%
SunburstSummer Squash127.50.880%
BruleeWinter Squash117.50.891%
G-StarSummer Squash97.50.889%
Classic MagicFlower227.40.8100%
General LeeCucumber247.40.574%
MoonshinePumpkin107.40.9100%
FlaminoSummer Squash117.40.860%
SaladmoreCucumber387.40.470%
TemptressCorn127.40.875%
CalimaBean177.30.680%
StateBean47.31.433%
Candy MixFlower337.30.576%
Bennings Green TintSummer Squash97.30.889%
RavenSummer Squash217.20.570%
TaveraBlind227.20.567%
SweetnessCorn127.10.975%
AnnihilatorBean117.10.873%
Janue et VerteSummer Squash127.10.880%
Jade IIBean497.10.475%
TigressSummer Squash217.10.555%
Hill Country RedOkra227.00.567%
Honey BearWinter Squash157.00.755%
MamboMelon67.01.080%
MascotteBean177.00.680%
Easy Pick GreenSummer Squash127.00.975%
Cinnamon GirlPumpkin256.90.785%
Choice MixFlower226.90.890%
OlympianCucumber116.90.850%
Roma IIBean96.90.856%
SunlightPumpkin106.90.986%
SeychellesBean96.81.043%
CrockettBean256.80.555%
AmigaCucumber146.80.725%
ItachiCucumber96.80.867%
Queen Lime RedFlower336.70.572%
MuncherCucumber126.70.864%
Chiba GreenBean96.71.088%
DesiSummer Squash66.71.067%
Patio SnackerCucumber236.70.674%
Kentucky BlueBean66.71.083%
HoneynutWinter Squash146.60.775%
Fordhook 242Bean96.60.857%
PantheonSummer Squash126.60.975%
Slik Pik YS 26Summer Squash196.60.653%
Trailing MixFlower276.60.661%
American DreamCorn126.50.840%
SavorMelon86.51.286%
StarlightMelon46.51.225%
Turkey CrawBean126.40.986%
Green MachineSummer Squash86.40.975%
Miniature PopcornCorn116.40.870%
EleonoraBasil246.40.663%
Starry NightWinter Squash156.40.773%
JumboBean96.30.867%
ButterscotchWinter Squash316.20.561%
LemonSummer Squash66.21.067%
Bush CropCucumber176.10.687%
PolyvertChives176.10.888%
Winter LuxuryBlind156.01.185%
Alaska MixFlower275.90.656%
ButterbushWinter Squash175.90.638%
Bush DelicataWinter Squash105.90.850%
Sugar PotMelon195.90.850%
Baby BearPumpkin115.90.929%
H-19 Little LeafCucumber85.81.033%
Baby DollMelon165.80.783%
DMR 401Cucumber135.80.746%
White NiteFlower275.80.660%
New OrchidMelon45.81.250%
Minnesota MidgetMelon175.70.613%
SunshineWinter Squash105.70.850%
GumdropPumpkin65.61.160%
Honey n PearlCorn125.60.840%
Glass GemCorn115.60.850%
SonjaFlower275.60.671%
Mini LoveMelon205.50.825%
Speckled DixieBean95.50.857%
Suyo LongCucumber95.50.878%
TrifectaMelon85.51.017%
Hill Family GreasyBean125.40.957%
Lazy HousewifeBean145.40.764%
Sugar Baby BushMelon165.10.855%
MalibuBean64.81.067%
PepitasPumpkin104.10.933%
Table 9. Mean performance rating by crop for 2018–2020. Performance was rated on a scale of 1 to 10, with 1 indicating poor performance and 10 indicating excellent performance. The number of participants who returned usable data for each cultivar is reported as “n”. Mean separation was performed using Fisher’s Protected LSD with an alpha level of p < 0.1.
CropPerformance Rating (1–10)Recommend (%)
nMeanStandard ErrorMean Separation
Okra1347.90.2A84%
Leafy Greens267.80.7ABCDEF92%
Herb1687.60.2AB85%
Summer Squash2987.50.2ABC 79%
Cucumber2907.20.2BCD74%
Bean3427.10.1CDE75%
Flower2866.90.2DEF79%
Melon1586.60.2EF58%
Pumpkin1056.60.3DEF77%
Winter Squash1346.50.2F63%
Corn716.40.3F57%
Table 10. Mean performance rating by year within cultivars evaluated over multiple years (2018–2020 trials). Performance was rated on a scale of 1 to 10, with 1 indicating poor performance and 10 indicating excellent performance. The number of participants who returned usable data for each cultivar is reported as “n”. Mean separation was performed using Fisher’s Protected LSD with an alpha level of p < 0.1.
CultivarCropYearn Est.SEp Value
ButterscotchWinter Squash2018176.80.8N.S.
2019145.80.6
Cinnamon GirlPumpkin2018108.21.0N.S.
2020156.00.8
Clemson SpinelessOkra2018268.70.8N.S.
2020197.60.4
Dolce FrescaBasil2018247.90.6N.S.
2019227.20.6
General LeeCucumber2018117.50.8N.S.
2020137.40.8
Jade IIBean2018257.20.6N.S.
2019247.00.5
JambalayaOkra2019228.70.7N.S.
2020198.20.4
SaladmoreCucumber2018236.80.8N.S.
2020156.50.7
SpacemasterCucumber2019177.70.5N.S.
2020157.60.6
Sugar CubeMelon2018178.80.9N.S.
202088.00.5
TempestSummer Squash2018198.00.5N.S.
2019137.90.4
Table 11. Mean performance rating by trial (blind, named) within the cultivar in 2019 and 2020 trials. In named trials, seeds were labeled with cultivar names, while blind trials were assigned a code Performance was rated on a scale of 1 to 10, with 1 indicating poor performance and 10 indicating excellent performance. The number of participants who returned usable data for each cultivar is reported as “n”. Mean separation was performed using Fisher’s Protected LSD with an alpha level of p < 0.05.
CultivarCropTrialn Est.SEp Value
Blue Lake BushBeanBlind78.40.6N.S.
Named127.30.5
BristolCucumberBlind108.00.6N.S.
Named108.00.6
Cinnamon GirlPumpkinBlind58.21.0N.S.
Named76.00.8
Jade IIBeanBlind77.60.9N.S.
Named327.00.4
Marketmore 76CucumberBlind119.10.40.0573
Named107.80.5
TaveraBeanBlind127.00.9N.S.
Named77.61.1
Publisher’s Note: MDPI stays neutral with regard to jurisdictional claims in published maps and institutional affiliations.

