Article

Exploring the Ingredient Choices and Maximum Budget for Fresh Food Boxes in Taiwan

1
International Master Program of Agriculture, National Chung Hsing University, No. 145 Xingda Rd., South District, Taichung 40227, Taiwan
2
Department of Applied Economics, Utah State University, Logan, UT 84322, USA
3
Graduate Institute of Bio-Industry Management, National Chung Hsing University, No. 145 Xingda Rd., South District, Taichung 40227, Taiwan
*
Author to whom correspondence should be addressed.
Horticulturae 2021, 7(10), 408; https://doi.org/10.3390/horticulturae7100408
Submission received: 23 August 2021 / Revised: 8 October 2021 / Accepted: 12 October 2021 / Published: 16 October 2021
(This article belongs to the Special Issue Consumer Horticulture Advancement)

Abstract

:
Fresh food boxes have been popular in many countries for providing convenience and supporting local production, while the convenient access of various market channels in Taiwan makes it difficult to develop. The COVID-19 events shed light on the opportunity to promote fresh food boxes. Due to the complexity of consumer preferences, it is important to investigate the market opportunity of fresh food boxes. A total of 748 valid survey data were collected throughout Taiwan from July to September in 2019. The analysis of variance and interval regression model with random utility theory was adopted to explore food product preferences and to elicit the maximum budget for the fresh food box. Results show that marrow vegetables, fruits, and meats are the major categories that must be included in the list of the fresh food box. The average maximum budget for a fresh food box is about NTD 702 (about USD 25), while the highest maximum budget can reach up to NTD 1202 (about USD 43) for some potential consumers. Although fresh food boxes have a market opportunity in Taiwan, the market potential may be more focused on those who have online market shopping experiences. Marketers would need more marketing strategies to enhance more potential shoppers to adopt the online purchase for fresh food boxes.

1. Introduction

The fresh food box scheme is a new term inspired by the vegetable box scheme. The vegetable box schemes, or the box schemes, refer to boxes of locally and freshly grown vegetables that are delivered to consumers [1,2,3]. It was first introduced in the United Kingdom (UK) in 1991 to enhance local food production and improve local farmers’ sustainability [1]. The box schemes have gained more popularity and been delivered to more than 60,000 households [1] and have generate up to GBP 193 million of revenue in the UK alone [4]. In addition, the box schemes have been served to more than 10,000 consumers in the Netherlands [3] and 200,000 customers in France [5]. The ingredients for the box schemes are different depending on seasonal availability and primary demand [6]. Indeed, if consumers have difficulty accessing the fresh food ingredients on time, the vegetable box scheme seems to be a good solution to replace grocery shopping.
Although fresh food boxes have been getting more popular in other countries, the market development of fresh food boxes in Taiwan is not likely the same as other countries. Even though Taiwan is a small island with a population of 23 million with a highly developed infrastructure [7], consumers have been used to convenience in grocery food shopping [8]. The value of convenience for fresh food boxes seems not quite the same as if consumers just go to physical stores to pick up what they want. Normally, Taiwanese consumers prefer to go to physical stores (i.e., traditional markets, supermarkets, hypermarkets, farmers’ markets, street corner grocery stores, etc.) to do their grocery food shopping that includes fresh vegetables, fruits, eggs, meats, fish, and processed food products, while some consumers may obtain some small portion of ready-to-eat food products in the convenient stores. By 2019, there were about 11,429 convenience stores [9], about 909 supermarkets, about 137 hypermarkets [10], and about 834 traditional markets [11] in Taiwan. Thus, it is very interesting to explore the potential market opportunity of fresh food boxes in Taiwan, and the challenges of fresh food box promotions should be further investigated.
Expenses on food are predicted to be the biggest expenditure category for Asian consumers and fresh food expenses account for more than 50% of them [12]. This may also imply that Asian consumers are willing to pay more for what they eat. According to the report from Statista [13], Taiwanese consumers’ spending on food, beverage, and tobacco have increased by about 7% between 2009 and 2019. The similar trend, which has the world’s highest consumption for fresh fruit per capita, exists in Taiwan [14]. Taiwanese consumers have valued freshness and health as the most important attributes when it comes to food [15]. Therefore, it is a potential question whether Taiwanese consumers are also willing to spend the maximum budget for a fresh food box, which is the same as how they spend on grocery food shopping in the physical stores. It has been confirmed that increasing cooking at home helps families to take control over their food supply [16,17,18,19,20], reduce food expenditure [17,18,19,20,21,22,23], and improve social interactions [18,19,20,24]. In addition, cooking at home is proven to be the linkage between the improvement of a healthier diet and nutrient intake [25,26,27,28]. Fresh food box schemes are not only popularly available in many countries, including USA, UK, Italy, France, Denmark, Netherland, Austria, Croatia, Belgium, and Cape Town—South Africa [1,2,3,4,5,6,29,30,31,32,33,34], but also they bring high economic benefits [3,5] to local producers. The underdeveloped fresh food box in Taiwan has raised our attention to explore the potential factors that may enhance consumer preferences through a decision point. Although fresh food boxes receive some attention during the COVID-19 pandemic events in 2021, the business of fresh food boxes in Taiwan is still very immature. Therefore, this study attempts to decode the potential preferences of the fresh food box in Taiwan. In particular, the maximum budget for a fresh food box will be elicited.
In summary, the fresh food box business has matured in other developed countries, while it is still a new niche and fast-growing market in Taiwan because of the pandemic situation. Further, there is no guarantee that consumers will still adopt the fresh food box when the pandemic situation is over. The understanding of consumer behavior for fresh food boxes is necessary. Since the decision-making of fresh food boxes may not be the same as those in physical-store shopping, the adaptation of the consumer theory and random utility theory will further contribute to the literature examples. The originality of this study will help farmers and marketers (i.e., farmers’ market, supermarkets, hypermarkets, traditional markets, and online markets) to approach their potential consumers.

2. Materials and Methods

2.1. Data Collecting

This study utilizes the quantitative method via a consumer survey to achieve the research goals. The survey link was uploaded and managed by SurveyMonkey Inc. (San Mateo city, CA, USA). Although respondents were asked to fill out the survey in a weblink, the sampling method used in this study was simple random sampling [35]. Thus, the samples were collected via street distributing the survey’s posters near supermarkets, traditional markets, and public stations as well as sharing the survey’s weblink online throughout Taiwan during July to September in 2019. One of the biggest concerns relating to the random sampling method was the potential selection bias [35]. Since the targeted respondents are the main food buyers in a household, the screening question is the key design in the survey. The first question is listed as “are you the major food grocery buyer in your household?”. Those who are major food buyers in their households would be qualified and continue their responses for the rest of the survey. As a result, a total of 1226 respondents participated in the survey sampling event, but only 748 responses were valid for this study. Following the sample size calculation based on the acceptable standard including margin of error (5%), confidence level (95%), percentage of a sample having characteristics (50%) [36,37], the total minimum number of the sample size is 385 respondents in this study. However, the extra collected sample will help the consistency and efficiency in data analysis. Meanwhile, in order to guarantee the quality of the sampling data, a total of 150 pieces of 7–11 gift card (valued NTD 50/each) were provided as a lucky draw to encourage respondents to fill out the survey.

2.2. Methodologies

Since the fresh food box business in Taiwan is still relatively new, the consumer preference of fresh food boxes should be identified. In order to decode the potential preferences of the fresh food box in Taiwan, this study attempts to assess the maximum budget for a fresh food box. Further, the factors of consumer family background, grocery purchasing background, reason to buy fresh food box, and the preferences of ingredient choice will be evaluated with the maximum budget via a one-way ANOVA F-test and the interval regression model. Therefore, the objectives of this study are: (1) assessing the maximum budget of a fresh food box in Taiwan; (2) exploring the relationship between the maximum budget of a fresh food box and consumer background; (3) identifying what potential factors can influence the maximum budget of a fresh food box.

2.2.1. One-Way ANOVA F-TEST

Firstly, this study would like to exhibit the outcomes of how the maximum budget for fresh food boxes is relevant to important factors, such as respondents’ family size and total usual shopping time spent in the markets. Since the choice of spending a budget for a fresh food box can be high or low, it would be necessary that consumers with a higher number of family members or those who usually spend more time on shopping are willing to pay more for the budget of a fresh food box. The first hypothesis is that the maximum budget of a fresh food box is positively correlated to the family size or time spent on grocery shopping. On account of this, a one-way ANOVA F-test is used to examine: (1) the relationship between consumers’ family size and the budget for a fresh food box; (2) the relationship between consumers’ time spent on shopping and the budget for a fresh food box. Further, a two-way scatter plot with a predicted fitted line will be demonstrated to see if it matches the outcomes of the one-way ANOVA.

2.2.2. Interval Regression Model

This study, further, attempts to elicit the potential maximum budget for a fresh food box in Taiwan. Especially, respondents may have different attitudes on the maximum budget of the fresh food box based on their original shopping behavior and background. The second hypothesis is that the maximum budget of a fresh food box can be estimated and affected by socio-economic background, grocery shopping background, reason to purchase fresh food box, and preference of ingredient choices. Therefore, this study specifies a decision-making model to explain what factors impact the potential budget to buy fresh food boxes. Since the exact value of budget for a fresh food box may not be observed directly, an interval regression model is adopted to elicit the maximum budget in this study. The interval regression is one type of censored regression, so the interval censoring categories will help us to identify the potential payments for the fresh food box.
In the survey, a fresh food box is defined to respondents as the following: “a fresh food box is a box of fresh fruits, vegetables, meats, and other drinks from food stores or markets. Marketers will deliver the fresh food box to your place. With its convenience, you can order the box online or by phone and receive fresh food ingredients without going out.” Therefore, it is important to show an example picture (shown in Figure 1) of a fresh food box for respondents. In order to estimate the potential maximum budget for the fresh food box, a market field study was approached to find out the appropriate value of a fresh food box in Taiwan. Based on the example in Figure 1, the actual cost is roughly at least NTD 400. Meanwhile, the maximum budget that respondents would have may be varied when respondents have different volumes and varieties in their mind. Respondents were simply asked to choose their maximum budget that ranged from (1) below NTD 400 (≈USD 14 or below), (2) NTD 401–600 (≈USD 14–22), (3) NTD 601–800 (≈USD 14–29), (4) NTD 801–1000 (≈USD 29–36), (5) NTD 1001–1200 (≈USD 36–43), (6) NTD 1201–1400 (≈USD 43–50), and (7) more than NTD 1400 (≈USD 50 or above). Further, these price ranges additionally could be referred to the commercial websites. In addition, previous studies [38,39] on the expenditure of vegetables and fresh food boxes in the market were referred to and included into the questionnaire design.

3. Theory and Calculation

3.1. Random Utility Approach

Although the preference of fresh food boxes should be the same as the preference of grocery food purchasing, the quality of fresh food boxes may not be the same as consumers’ ingredient choice at the physical stores. Therefore, consumer preferences of fresh food boxes can be rational in their decision-making, which means that if their satisfactions were not reached, they may decrease the purchase of fresh food boxes. To draw conclusions about the marketing potential for fresh food boxes and to quantify the maximum budget for a fresh food box, consumer theory and random utility theory were used as theoretical frameworks. Consumer theory introduces the idea that consumer choice is made based on the products’ characteristics or attributes rather than the goods themselves [40], while random utility theory highlights the rationality of consumers’ decisions and mentions that consumers’ rational decisions are made to maximize their utility [41]. Hence, if targeted consumers approach fresh food boxes with rational decision-making, then we are able to identify the consumer preferences of fresh food boxes.
Consumer preferences of fresh food boxes may vary with different pricing levels. Thus, the lower and the upper values of the maximum budget categories in the interval regression model are used to present the budget amount of a fresh food box. The formula of the interval regression [42] utilized in this study can be expressed as:
y * = x β + ε
where y * is a latent variable (exact amount of budget which may not be observed), the vector x includes explanatory variables that could potentially affect respondents’ decision of a fresh food box. Therefore, the random utility theory was applied to specify the interval regression model. The factors related to socio-economic background, grocery shopping behaviors, reasons to buy a fresh food box, and ingredient-choice preferences of the fresh food box are included. The term ε is an idiosyncratic error, and it is normally distributed; ε ~ N ( 0 ,   σ 2 ) .
The interval regression model is similar to the ordered probit/logit model, so the cut points represent the limits from lower to upper values in each interval [43]. Thus, it can be shown as below:
y = 1       i f     y * N T D   400
y = 2       i f     N T D   400 < y * N T D   600
y = J       i f     y * N T D   1401
where y * can be interpreted as the maximum budget, and J can represent the ordered responses that respondents take the discrete choice values (from 0 to J).
Since this study aims to elicit the potential maximum budget for a fresh food box, the maximum budget may show differences if compared to respondents’ usual grocery payment. For instance, the maximum budget of a fresh food box may be higher, same, or lower than respondents’ usual grocery payment. When respondents’ maximum budget of a fresh food box is higher than their usual grocery payment, it may imply that respondents are really interested in the fresh food box, so they are willing to pay higher, and vice versa. Respondents were asked to point out: “How much is your usual budget each time for your grocery shopping?” and “How much is your maximum budget for a fresh food box that you are willing to spend?” Therefore, the elicitation of maximum budget for a fresh food box will further include three more tests based on the budget comparisons: Higher Budget (budget for a fresh food box is higher than grocery budget); Same Budget (budget for a fresh food box is the same with grocery budget); Lower Budget (budget for a fresh food box is lower than grocery budget). As a consequence, it may be observed what other potential factors lead to the differences in the maximum budget for a fresh food box.

3.2. The Estimation of Maximum Budget

In order to interpret research findings directly, the total maximum budget is calculated based on the findings in each model. With the estimated coefficients in each model, the maximum budget of a fresh food box can be estimated as following:
M a x i m u m   B u d g e t H i g h e r = i = 1 β ^ i k x ¯ i k M a x i m u m   B u d g e t S a m e = i = 1 β ^ i k x ¯ i k M a x i m u m   B u d g e t L o w e r = i = 1 β ^ i k x ¯ i k M a x i m u m   B u d g e t A l l   S a m p l e = i = 1 β ^ i k x ¯ i k
where β ^ i k is the estimated coefficient, x ¯ i k is the mean of explanatory variables, and k is the different attributes of the fresh food box. In order to examine how respondents decide the budget to purchase the fresh food box, their budget choices, y , are further segmented by the average usual grocery budget, i.e., (1) budget for a fresh food box is higher than the average usual grocery budget (Higher Budget), (2) budget for a fresh food box is the same with the average usual grocery budget (Same Budget), and (3) budget for a fresh food box is lower than the average usual grocery budget (Lower Budget). As a result, these outcomes of estimated maximum budget for each model will be compared with the estimated maximum budget of the All Sample model.

4. Results and Discussions

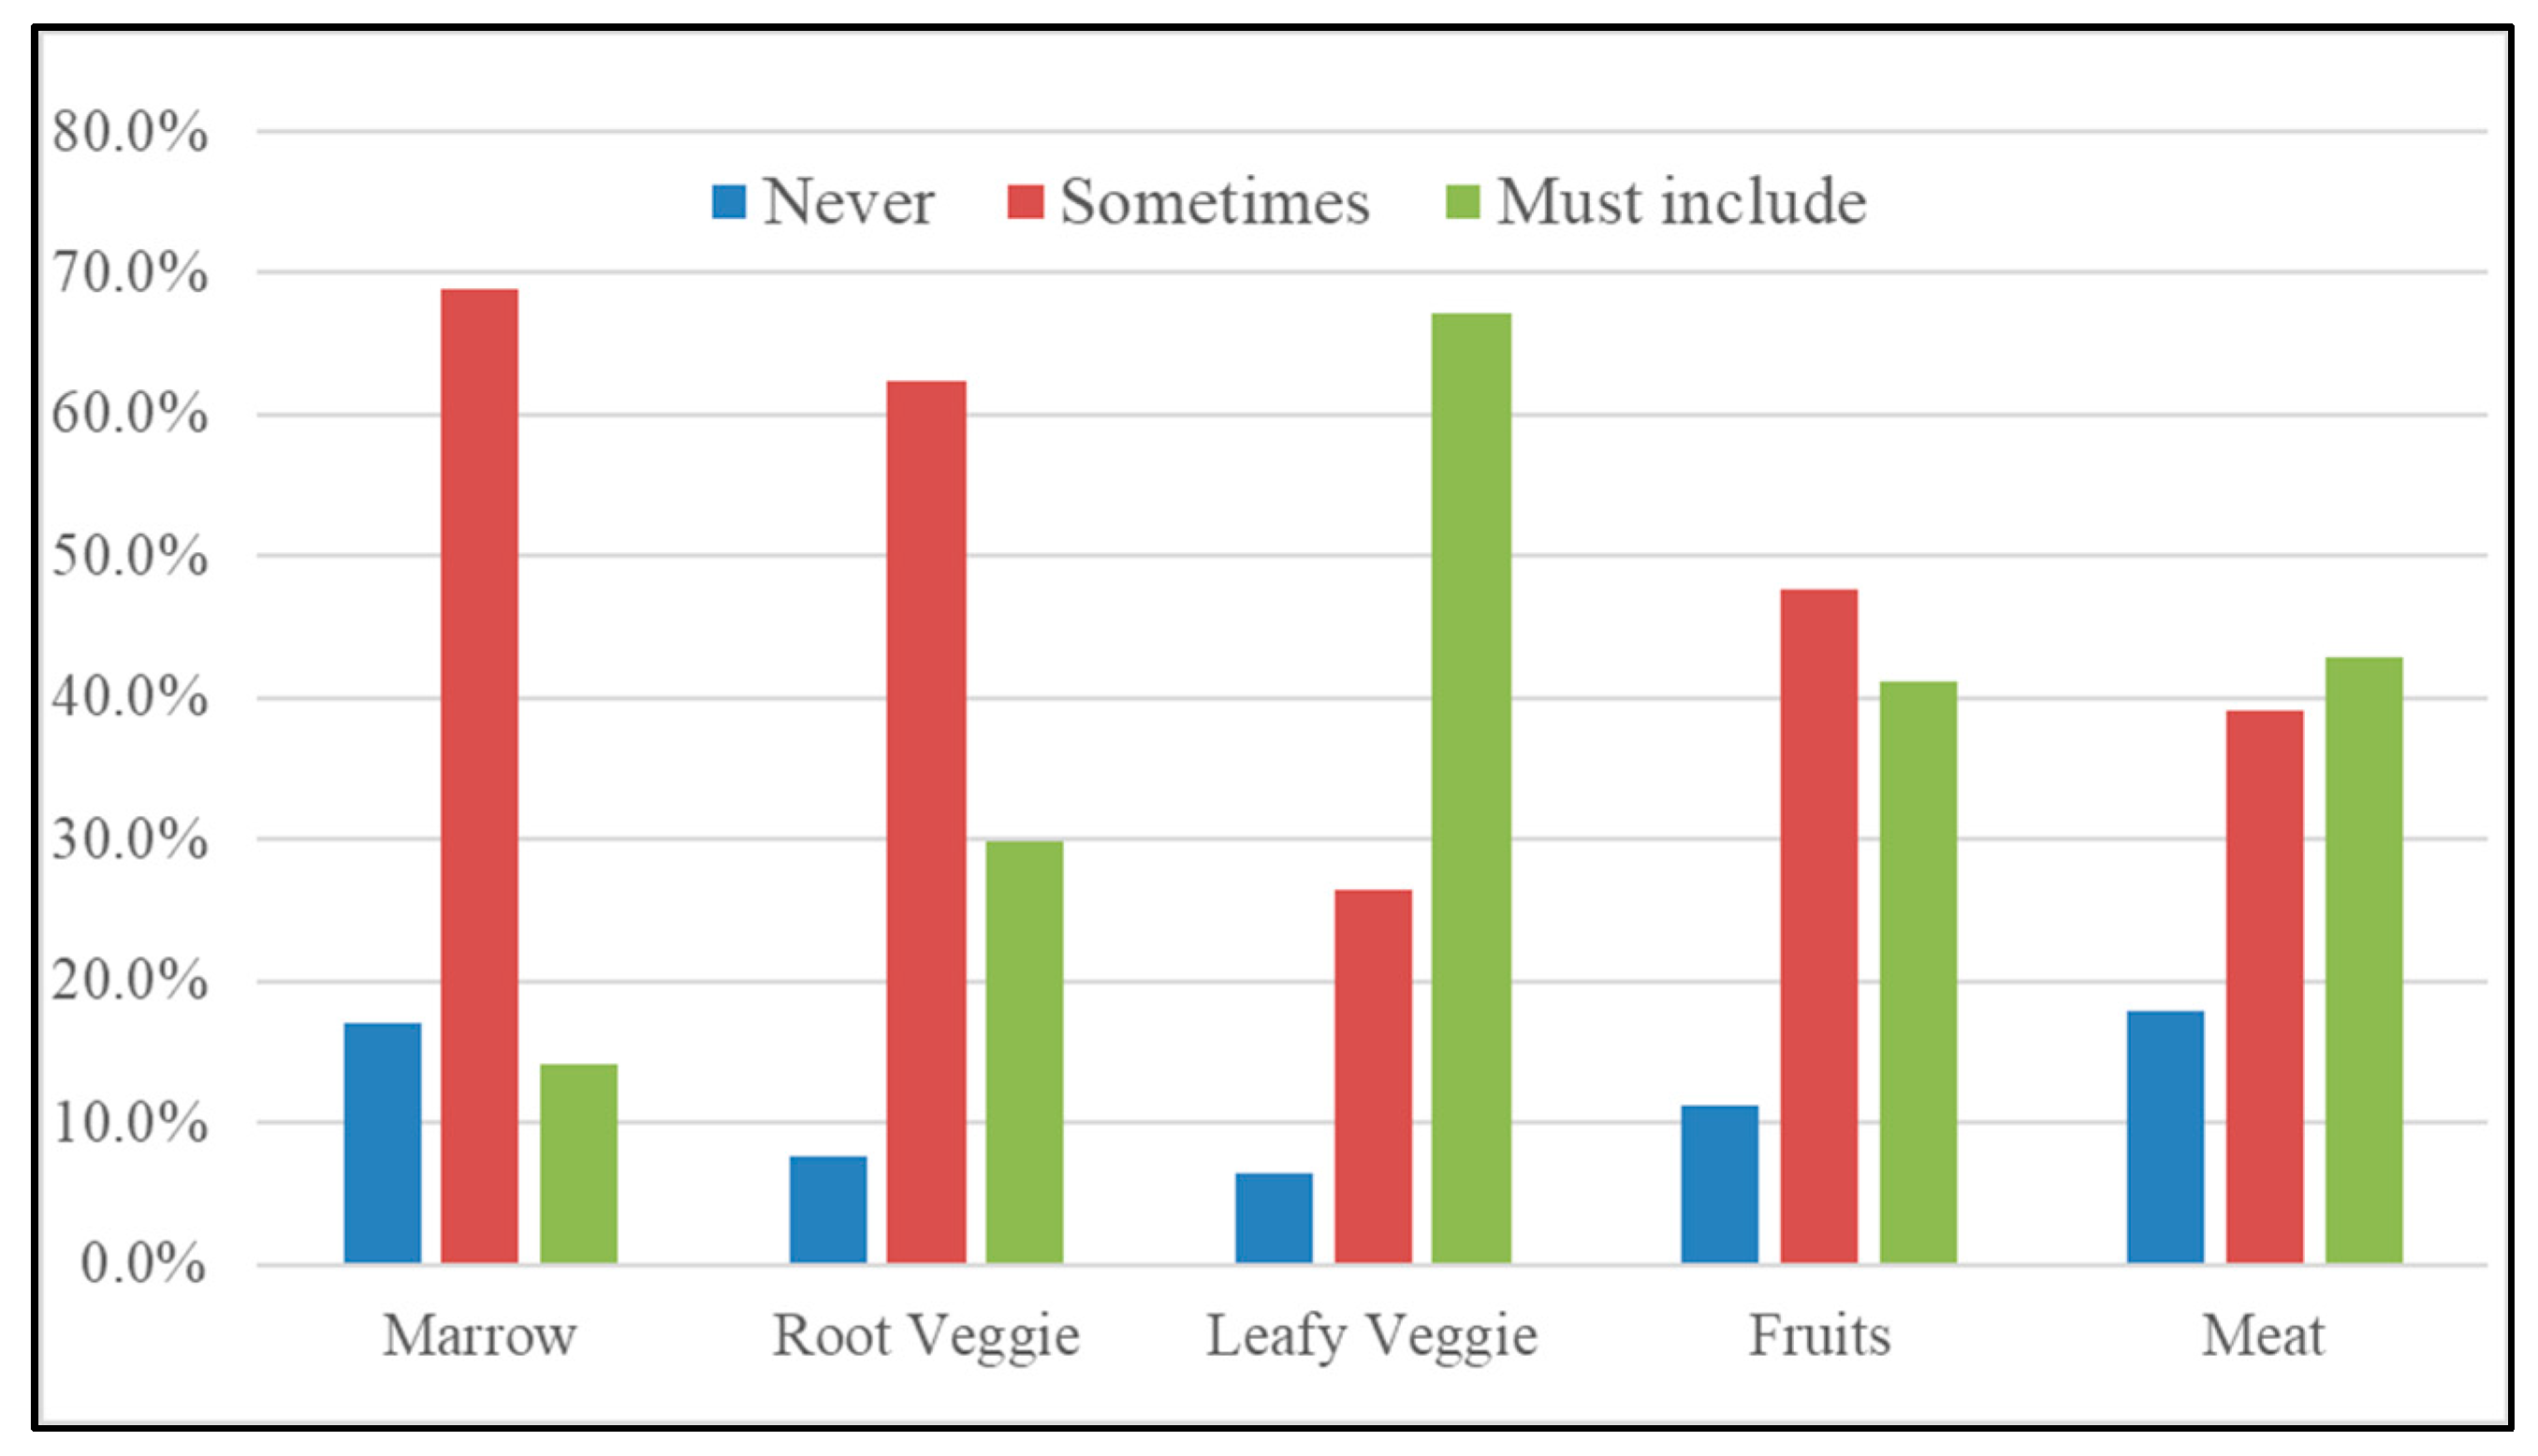
4.1. Descriptive Analysis

The summary of descriptive statistics and variable definition is provided in Table 1. The dependent variables are shown in four different types based on the budget differences and overall sample. When the maximum budget for a fresh food box is higher than the usual grocery budget, the average maximum budget for the fresh food box is NTD 855, and NTD 656 as well as NTD 608 for the same budget and lower budget, respectively. The maximum budget of all samples for a fresh food box is about NTD 749. Within 748 respondents, about 69% of respondents are female and the average age is 32.35 years old. Although the average age in this study may show a bit lower than the population average age at 42 years old [44], the business of fresh food boxes is on the internet or cell phone applications. Therefore, this study still considers that the major potential food buyers are still valid at around 32 years old [15].
About 8% of respondents have an education below high school, which implies that the majority of respondents (92%) have an education above that from an associate degree. The respondents’ average monthly income is about NTD 61,860 (≈USD 2214). In the family structure, the family size is about three people in a household, while the number of children at home is about one child. Therefore, family size in Taiwan is gradually becoming a small family size. Most respondents of this study are from the central region of Taiwan, and about 30% of respondents are from the northern region. It implies that about 20% of respondents are from southern and eastern regions. Approximately, 71% of the respondents live in the urban area. These demographics figures are as similar as studies on the food market in Taiwan [45,46,47].
Results on consumers’ grocery shopping behaviors in this study are further in line with the current change in cooking at home and dining out in Taiwan. More specifically, respondents eat out around 8 times a week, while they cook at home about 5.8 times a week. This indicates that consumers in Taiwan tend to dine out more than they cook at home [12,48,49]. Moreover, respondents spend an average of about 35 min on grocery shopping, and most of them prefer to shop at the supermarket more than other types of markets.
Further, reasons to buy fresh food boxes show that most respondents buy fresh food boxes because of friends’ invitation as group shopping (49%), and the holiday reason only occupied about 16%. The outcomes of ingredient-choice preferences for their fresh food boxes reveal that most respondents are interested in leafy vegetables (68%), meats about 44%, fruits about 42%, root vegetables about 31%, and the marrow vegetables only about 14%. As a result of this, it is more important to see how these factors relate to their maximum budget.

4.2. The ANOVA F-TEST

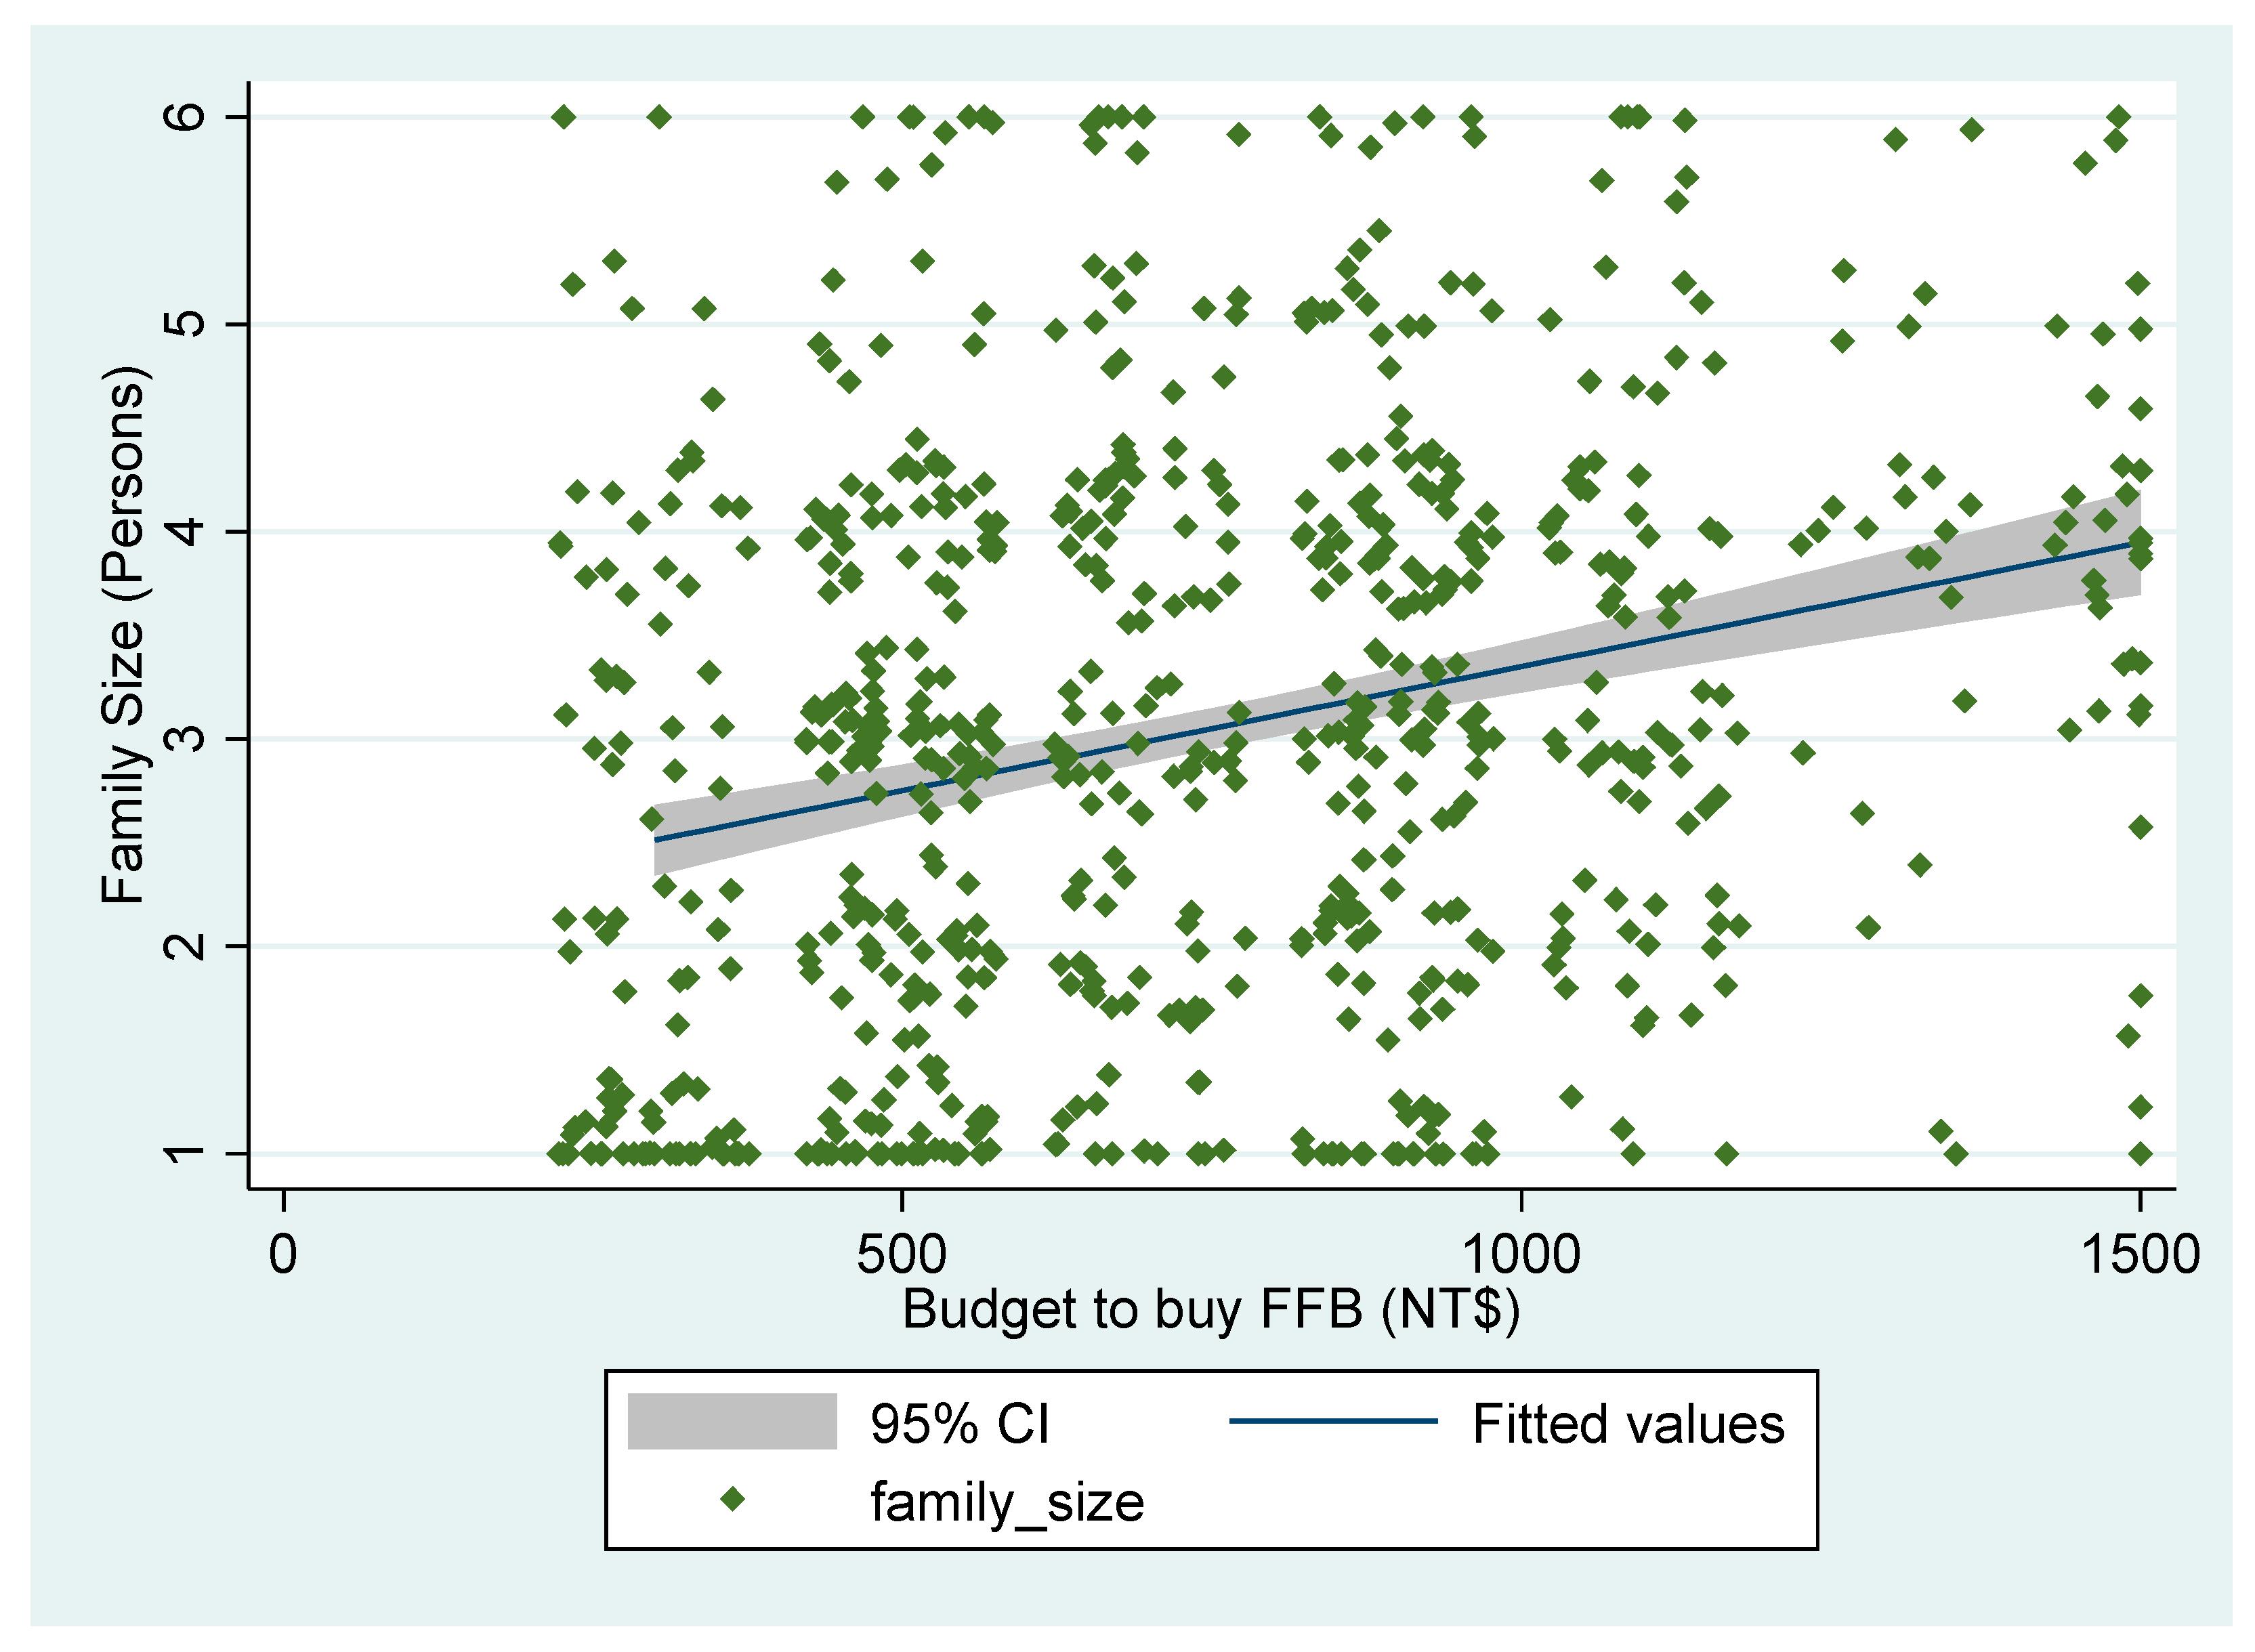
4.2.1. Relationship between Family Size and Fresh Food Box Budget

First of all, how family size and maximum budget for a fresh food box relate to each other should be identified. The finding of ANOVA F-test reveals that the relationship between the family size and the maximum budget for a fresh food box is positively correlated (F statistics = 9.39, p-value = 0.0000). Further, a scatter and fitted line with the confidence interval are presented in Figure 2. The positive relationship between family size and budget for a fresh food box implies that a higher number of family sizes may highly represent a higher maximum budget for a fresh food box. The fitted line shows that on average four family members may pay up to NTD 1500 for their fresh food box budget.

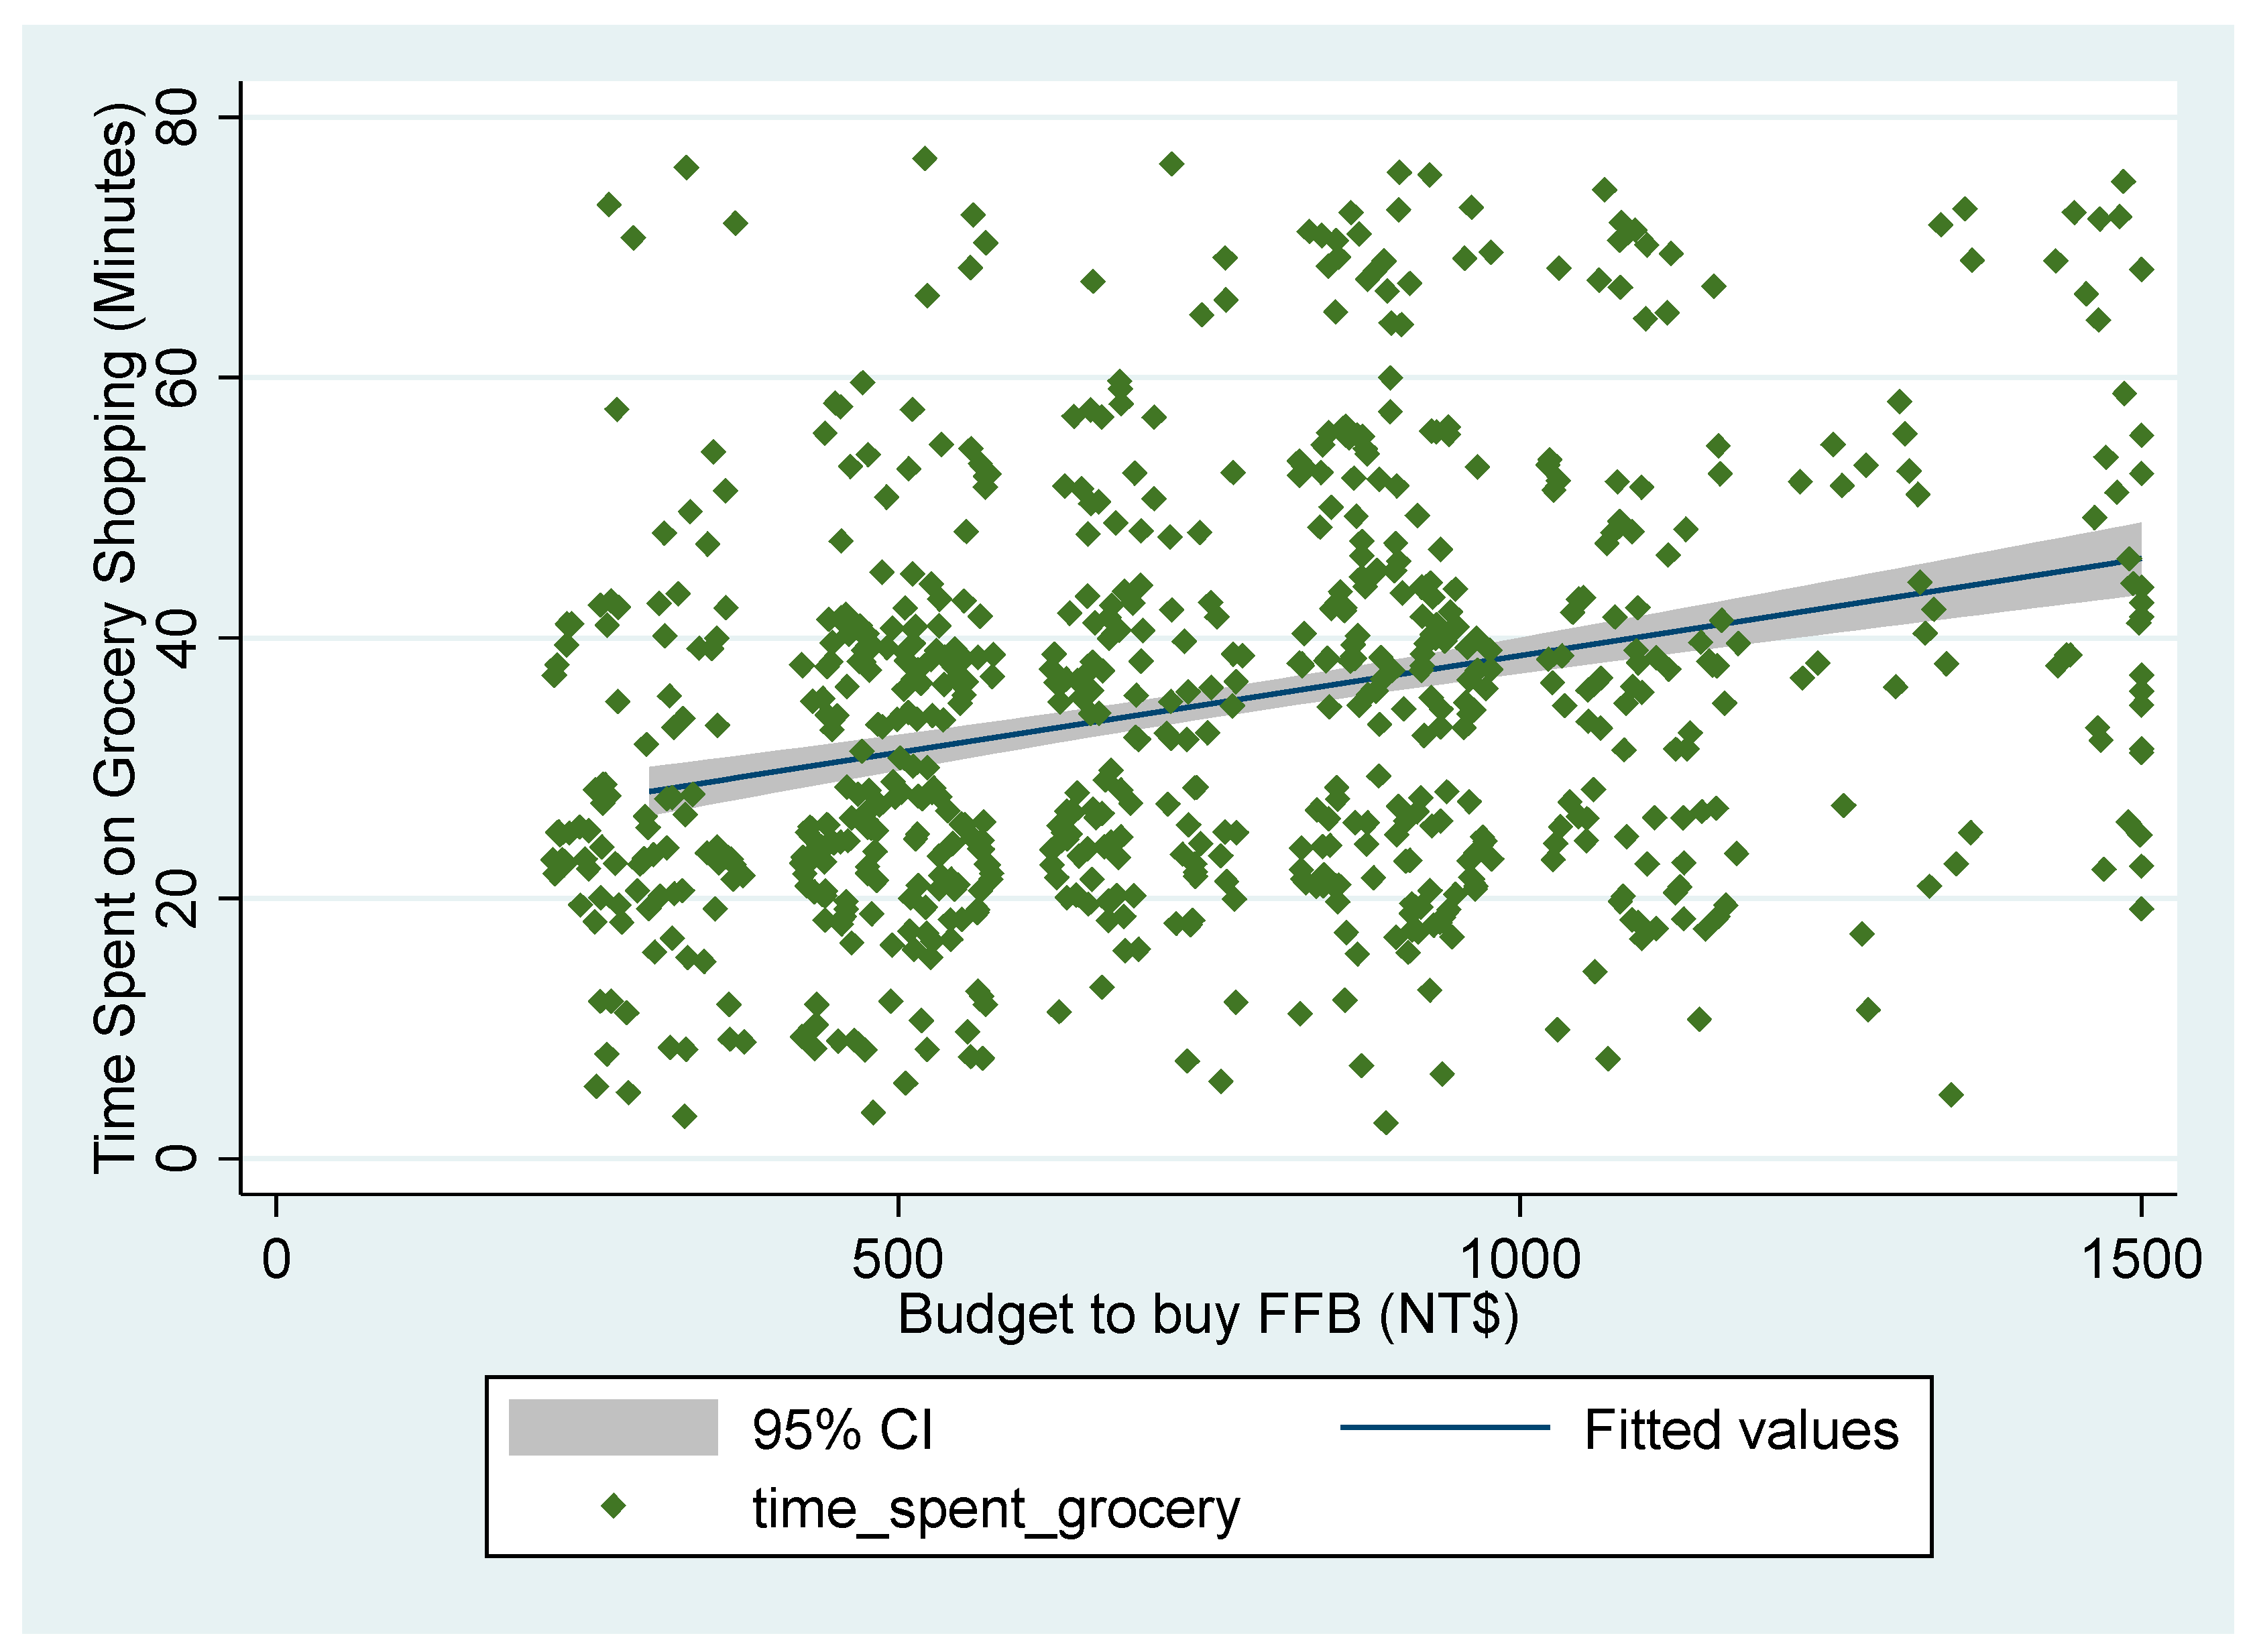
4.2.2. Relationship between Time Spent on Grocery Shopping and Fresh Food Box Budget

Secondly, whether respondents spend more time on shopping, meaning that they would like to pay more for their maximum budget of a fresh food box. The finding of the ANOVA F-test reveals that the relationship between the time spent on grocery shopping and the fresh food box budget is positively correlated (F statistics = 10.97, p-value = 0.0000). The plot consists of scatter and a fitted line with the confidence interval presented in Figure 3. The positive relationship between the time spent on grocery shopping and the fresh food box budget implies that when respondents spent more time on grocery shopping, they may be willing to pay a higher maximum budget for the fresh food box. The fitted line shows that when respondents spent about 50 min on grocery shopping, then they may pay up to NTD 1500 for their fresh food box budget. It makes sense because people currently tend to wisely manage their time. On the other hand, what factors further make the decision-making on their fresh food box budget should be further examined and discussed.

4.3. The Interval Regression Models

Since respondents’ maximum budget for a fresh food box may be varied from their usual grocery shopping budget, the elicitation of maximum budget should be separately examined to avoid the potential bias. Consequently, the usual grocery shopping budget is compared to the maximum budget for a fresh food box. The elicitation of a maximum budget for a fresh food box is divided into four different models: (1) MaxBudgetHigher, (2) MaxBudgetSame, (3) MaxBudgetLower, and (4) MaxBudgetAll Sample. The results of the interval regression models are revealed in Table 2. Surprisingly, 339 participants (45% of total 748 respondents) are willing to spend a higher budget for a fresh food box, while 272 respondents (36%) and 137 respondents (19%) are willing to spend the same budget or lower for a fresh food box, respectively. It implies that the majority of fresh food boxes consumers may be willing to pay a bit higher than their usual grocery shopping budget. The overall examinations of Wald χ2 in interval regression models exhibit a highly significant level. This shows that our model specification is valid to further examine the individual outcomes.
The factors in socio-economic background show differently in each model. Although most respondents who are willing to pay a higher budget for a fresh food box are shown in descriptive analysis, it only shows that respondents with higher age and more family members in their home would be more interested in a fresh food box. When respondents are willing to pay the same budget for a fresh food box, individuals who have higher age, higher income, and more family members in their home are more likely to buy a fresh food box. In particular, respondents are more likely to pay NTD 55 more for adding one more member in their family. Besides, the higher income will contribute almost NTD 3 for a fresh food box when comparing the difference of each NTD 1000 monthly income. For instance, an individual with a monthly income of NTD 50,000 may be willing to pay about NTD 30 more if compared with those with NTD 40,000. This also implies that a 40-year-old individual may be likely to pay about NTD 80 more for a fresh food box if compared to those who are 30 years old. While some respondents are willing to pay a lower budget for a fresh food box, individuals who are older and who live in the central area are more likely to buy a fresh food box with a positive maximum budget. Particularly, respondents who live in the central area are more likely to pay about NTD 110 for a fresh food box compared to those who live in the southern and eastern area. However, the All Sample model shows more variables that have significant levels. These outcomes are notable to pay attention to, as according to previous studies [45,46,47,50]. Especially, respondents that are older males who are from a central area with higher income and family size are more likely to pay a positive maximum budget for a fresh food box. Although the All Sample model receives more variables with significant level in socio-economic background, the final outcomes should adopt the Higher Budget, Same Budget, and Lower Budget models to avoid the potential bias.
The grocery shopping behavior shows a very consistent outcome in these four models. Results show that individuals with more time spent on grocery shopping would like to pay a positive maximum budget for a fresh food box. Especially the model of Same Budget shows the highest estimated parameter of about NTD 8.93. This implies that individuals who spend 60 min on grocery shopping would be willing to pay about NTD 89 more for a fresh food box if compared to those who spend 50 min on shopping. Although this result furthermore corresponds to Figure 2, the slope of 8.93 is steeper than the fitted line in Figure 2. Even so, the behaviors of visiting markets, eating out, and cooking do not show any effect on the maximum budget for a fresh food box. More importantly, respondents who have online market shopping experience would be more likely to pay a positive maximum budget for a fresh food box under the Higher Budget models. It implies that consumers who have online market shopping experience would like to pay a higher budget for a fresh food box than their usual grocery shopping budget. Furthermore, the reason to buy a fresh food box does not show any particular difference in each model. This gives us a hint that the preferences and demand for fresh food boxes is still a very beginning market. People do not have enough shopping background to see the difference.
These four models help us to identify what types of agricultural product categories must be included in their fresh food box. Respondents who are willing to pay a higher budget for a fresh food box are more interested and willing to pay about NTD 104 for marrow vegetables. The marrow vegetable was defined as pumpkin, cucumber, zucchini, etc., in the questionnaire, so respondents with higher interest in this category for their fresh food boxes may be because this type of food ingredients is heavy and easy to identify their product quality. This is why they may just rely on marketers’ sorting and picking for them. Unlike the root and leafy vegetables, these types of vegetables did not show any significant level in these four models. This may reveal that consumers may have more requirements and satisfaction issues on root and leafy vegetables, so it did not show a significant level. Still, the categories of fruits and meats did show a significant level in the Lower Budget and All Sample models. This implies that respondents are still interested in fruits and meats in their fresh food boxes. With these choices of food-ingredient preferences based on their maximum budget, respondents would definitely like marrow vegetables, fruits, and meats in their fresh food boxes.
The choice of food-ingredient preferences is further analyzed in Figure 4. The outcomes of Figure 4 are just descriptive analysis for the preference choice of food ingredients without considering the maximum budget. Accordingly, the choice of “must include” shows that the leafy vegetables, meats, and fruits are the top three options that respondents must include in their fresh food boxes. Nevertheless, if the maximum budget is considered, then the choice of leafy vegetables may not be supported for the preferences. The choice of “sometimes include” shows that the marrow vegetables, root vegetables, and fruits are the top three choices in the fresh food boxes. Nonetheless, if the maximum budget is considered, then only marrow vegetables and fruits would be willing to pay some extra dollars by respondents. Thus, each category may be potential for respondents’ choice, but some categories may not be supported by respondents’ maximum budget.

4.4. The Elicitation of Maximum Budget

This study has shown the potential variables that may influence respondents’ maximum budget. It is doable to elicit the potential maximum budget based on each model. Following Equation (3), the outcomes of maximum budget calculation are presented in Table 3. Each elicitation of the maximum budget is the multiplication of the assumed variable value and estimated parameter. If the variable is a dummy variable, then the assumed variable value is 1; if the variable is a continuous variable, then the assumed variable value is the average (mean) of the sample. Since some variables did not show a significant level, these insignificant variables will not exhibit in Table 3.
The maximum budget calculation in the Higher Budget model shows that respondents are willing to pay up to NTD 1202 (≈USD 43), which is the highest maximum budget if comparing other models. This result shows a potential opportunity for the fresh food box market in Taiwan. Basically, a fresh food box can contain many food ingredient items, and even make it to be more diverse and attractive in the fresh food box design. Since it is the Higher Budget model, it could be the main reason.
The maximum budget calculation in the Same Budget model shows that respondents still have a maximum budget of about NTD 930 (≈USD 33), which is still relatively high, revealing a good potential opportunity for the fresh food box market in Taiwan. In other words, if respondents would like to pay the same budget or a higher budget for a fresh food box compared to their usual grocery shopping budget, it implies that the potential maximum budget for a fresh food box can reach NTD 930 or above. This is an important finding that fresh food boxes have potential market opportunities in Taiwan.
The maximum budget calculation in the Lower Budget model shows that respondents can still be willing to pay about NTD 551 (≈USD 20), which represents the lowest maximum budget for a fresh food box in this study. This probably is because most consumers are willing to pay a fresh food box budget lower than their usual grocery shopping budget. This type of consumer may likewise imply to us that they are tending to dominate their grocery food purchase to be more flexible. Therefore, it may result in paying a lower maximum budget for a fresh food box.
The maximum budget calculation in the All Sample model shows that respondents, on average, are willing to pay about NTD 702 (≈USD 25). This implies that Taiwanese consumers on average would like to pay about NTD 700 for a fresh food box. Therefore, this outcome may show that the fresh food box in Taiwan still has a market opportunity, and the average price may be located at NTD 700. The marketers could set up the fresh food box combination of food-ingredient choices that matches the same value at NTD 700; otherwise, it may lose its market opportunities.

4.5. Discussions

The empirical results show the main reason why Taiwanese consumers are interested in fresh food boxes is because of the length of time spent grocery shopping and the number of family members in a household. The more time consumers spend on grocery shopping, the higher the maximum budget that they would like to spend on fresh food boxes. Further, when respondents have a bigger family with more members in a household, then they would like to pay more for fresh food boxes. Therefore, these outcomes point out that the feature of fresh food boxes is providing more convenience to consumers [9,51]. Increasing convenience is also the shopping behavior of modern consumers [52,53]. Further, the findings in Hashem et al. [31] also demonstrate the importance of convenience in England. How to provide more convenience on food-ingredient purchase will be the future development for fresh food boxes.
Additionally, empirical results further identify that consumers who are elderly, have a higher monthly income, and are from the central area of Taiwan are willing to pay more for fresh food boxes. The result of older people does correspond to those consumers who have higher preferences for more specialized boxes in Germany, Denmark, the Netherlands, and the United Kingdom [3]. However, consumers with a higher income still can be the potential buyers in Taiwan, although few studies [1,54] did not hold the same results in England and France. The details of this information are important for marketers to identify their potential consumer groups, so they can enhance their marketing strategies in targeted consumers. Furthermore, food-ingredient choices were focused on the main categories that may be easy for respondents to choose. Results reveal that consumers are willing to pay more for marrow vegetables, fruits, and meats products that must be included in their fresh food boxes. This result shows new findings relating to consumers’ preference for vegetables as leafy vegetables are reported to be Taiwanese consumers’ top picks [55]. If the maximum budget is not considered, then leafy vegetables, meats, and fruits show a higher preference that must be included in their fresh food boxes. This is essential information for marketers as to what categories of food-ingredient products should be focused on and arranged.
When the elicitation of maximum budget is considered to compare with the usual grocery shopping budget, the empirical results did show a significant level in each model. When consumers are willing to pay a higher budget for fresh food boxes than the usual grocery shopping budget, the maximum budget of a fresh food box can reach up to about NTD 1202 (≈USD 43). The Higher Budget consumers are considered the ones who would like to try and approach more benefits of convenience and quality in the order of a fresh food box. Especially, consumers with online market experience would tend to pay a positive maximum budget for their fresh food box budget. Therefore, enhancing consumers’ online shopping experiences [53,56] would be a key step to maintaining and promoting fresh food boxes in the online service.
The Same Budget consumers are still willing to pay up to about NTD 930 (≈USD 33), which is only about NTD 100 difference with the Higher Budget consumers. Although the Same Budget and Higher Budget consumers have different starting points between their maximum budget and usual grocery shopping budget, their maximum budget for a fresh food box is quite close to each other. However, the Lower Budget consumers are only willing to pay about NTD 551 (≈USD 20) for a fresh food box. The Lower Budget consumers are considered as the temporarily try-out shoppers for fresh food boxes, so their maximum budget was lower than their usual grocery shopping budget. The potential reason may be linked to the uncertainty and limited decision-making [57,58] that only shows a lower budget decision. In the field study, it is confirmed that a fresh food box pricing in the online market during the COVID-19 period ranges about NTD 500–900. Therefore, how to maintain and increase the royalty of these Lower Budget consumers on fresh food boxes will be the major focus in future development.

5. Conclusions

It is important to identify the acceptable price ranges of fresh food boxes at the current stage since the digital food environment is a fast-growing demand for fresh food boxes after COVID-19. Although this study was implemented before the COVID-19 events, the market of fresh food boxes is still growing [59,60,61,62], which is also expected by the outcomes of this study. Further, the current market pricing of fresh food boxes is often a mixture of higher or lower prices, and it could hinder future development if consumers’ preferences are not satisfied. Unfortunately, the studies relevant to the willingness-to-pay or the maximum budget for fresh food boxes or box schemes are very limited, while marketers in Taiwan need more understanding to target and maintain good relationships with their potential customers. There is no guarantee that the market of fresh food boxes in Taiwan still remains in high demand after the COVID-19 issues. Therefore, it is necessary to explore and present this study, and inspire more researchers to pay attention to this growing issue. Since agricultural products have the time and region limitation, marketers often face challenges in finding the appropriate and feasible choice of food-ingredients that are right-product, right-time, and right-quality for consumers. Especially, without an acceptable maximum budget for fresh food boxes it would be more difficult to identify the right choices of food ingredients. Thus, it is important to estimate the maximum budget for fresh food boxes to see how much consumers are willing to pay for it.
The findings in this study provide significant theoretical and managerial implications. Results show that the maximum budget is highly correlated with family size and time spent on grocery shopping. This matches the theoretical implication that consumers’ maximum budget is relevant to their demand (i.e., family size and the ease of shopping). It implies that if marketers can provide more benefits for consumers with larger family size and the ease of shopping via the fresh food box, consumers may be more likely to spend their maximum budget for the services. Thus, it is recommended that marketers may need to provide more choices of fresh food box (such as a larger sized fresh food box) that is highly attracted by consumers with larger family sizes or the preference of shopping convenience.
As for managerial implications, this study provides useful information for farmers and marketers in supermarkets, hypermarkets, traditional markets, farmers’ markets, and online markets. Firstly, marrow products are more important than leafy products when the maximum budget is considered. This could be because marrow products can still be fresh and maintain their appearance quality even through tough transportation and delivery. Unlike the leafy vegetables, marrow vegetables can be kept for longer, so when consumers have a chance to order a fresh food box, the marrow vegetables are likely to be picked rather than the leafy vegetables. Thus, it is recommended that marketers can prepare more choices of marrow vegetables. If it can be provided year-round, it should always be under the customers’ list. Secondly, although results reveal that fresh food boxes have a market opportunity in Taiwan, the market channels, i.e., traditional markets, supermarkets, hypermarkets, and farmers’ markets, did not exhibit a significant level, while the online markets reveal a significant difference if compared to those non-online market channels. This implies that consumers with these frequently visited market channels would not give any maximum budget for a fresh food box, but those who frequently visited online markets would be willing to pay for a fresh food box. Hence, it is recommended that marketers of online markets should continue to promote fresh food boxes, even if the COVID-19 pandemic situation is over.
Particularly, the fresh food box market in Taiwan is still very new to the majority of consumers. There is no guarantee that consumers will still adopt the fresh food box after the pandemic situation, therefore, the contribution of this study provides a basic knowledge about what factors may influence consumers’ preference and maximum budget for fresh food boxes.

6. Limitation

This study only focuses on the bigger scope of the maximum budget estimation, while the details of food-ingredient choice were not particularly included in this study. Actually, the varieties of food ingredients can be a key factor to lead the potential purchasing intention. Thus, it suggests that future studies in relevant topics of fresh food boxes can focus on the combination of food-ingredient choice.

Author Contributions

Conceptualization, M.-T.V.N. and S.-H.Y.; methodology, M.-T.V.N., S.-H.Y. and M.-K.K.; software, M.-T.V.N. and S.-H.Y.; validation, S.-H.Y., and M.-K.K.; formal analysis, M.-T.V.N. and S.-H.Y.; investigation, M.-T.V.N., S.-H.Y. and M.-K.K.; resources, S.-H.Y. and M.-T.V.N.; data curation, M.-T.V.N. and S.-H.Y.; writing—original draft preparation, M.-T.V.N.; writing—review and editing, M.-T.V.N., S.-H.Y. and M.-K.K.; visualization, M.-T.V.N. and S.-H.Y.; supervision, S.-H.Y. and M.-K.K.; project administration, S.-H.Y.; funding acquisition, S.-H.Y. All authors have read and agreed to the published version of the manuscript.

Funding

Ministry of Science and Technology, Taiwan: MOST-105-2410-H-005-003; Council of Agriculture: 110農科-2.2.3-牧-U2.

Acknowledgments

The authors would like to acknowledge the contribution of Kiyokazu Ujiie and Chi-Ming Hsieh for your comments on this study’s questionnaire; and the technical support from Widya Satya Nugraha.

Conflicts of Interest

The authors declare no conflict of interest.

References

  1. Brown, E.; Dury, S.; Holdsworth, M. Motivations of Consumers That Use Local, Organic Fruit and Vegetable Box Schemes in Central England and Southern France. Appetite 2009, 53, 183–188. [Google Scholar] [CrossRef] [PubMed]
  2. Thom, A.; Conradie, B. Urban Agriculture’s Enterprise Potential: Exploring Vegetable Box Schemes in Cape Town. Agrekon 2013, 52, 64–86. [Google Scholar] [CrossRef]
  3. Haldy, H.M. Organic Food Subscription Schemes in Germany, Denmark, the Netherlands and the United Kingdom. Definitions and Patterns of Development in an International Context. Master’s Thesis, Aston Business School, Birmingham, UK, 2004. [Google Scholar]
  4. Soil Association. Organic Market Report 2014. Soil Association Scotland. Available online: https://www.palomaquaculture.com/support-files/palom-aquaculture-soil-association-report-2014_opt.pdf (accessed on 10 March 2021).
  5. Schermer, M. From “Food from Nowhere” to “Food from Here”: Changing Producer–Consumer Relations in Austria. Agric. Hum. Values 2014, 32, 121–132. [Google Scholar] [CrossRef]
  6. Jones, P.; Comfort, D.; Hillier, D. A case study of local food and its routes to market in the UK. Br. Food J. 2004, 106, 328–335. [Google Scholar] [CrossRef]
  7. Economic Development R.O.C (Taiwan). Available online: https://ws.ndc.gov.tw/Download.ashx?u=LzAwMS9hZG1pbmlzdHJhdG9yLzEwL3JlbGZpbGUvNTYwNy83MzEvMDAxOTgyMy5wZGY%3D&n=RWNvbm9taWMgRGV2ZWxvcG1lbnQgUi5PLkMgKFRhaXdhbikoMjAxMykucGRm&icon=..pdf. (accessed on 10 March 2021).
  8. Chen, M.F. Consumer’s trust-in-food-safety typology in Taiwan: Food-related lifestyle matters. Health Risk Soc. 2011, 13, 503–526. [Google Scholar] [CrossRef]
  9. Convenience Store Numbers Rose 5% Last Year: Survey. Taipei Times. 2020. Available online: https://www.taipeitimes.com/News/biz/archives/2020/08/08/2003741290 (accessed on 10 March 2021).
  10. Ho, P.S. The top-10 food retailers in Taiwan: Industry needs a leader. Business Next. 2018. Available online: https://www.bnext.com.tw/article/49319/offline-retail-much-bigger-than-online-in-tw (accessed on 7 October 2021).
  11. Central Region Office, Ministry of Economic Affairs. National Public and Private Traditional Markets Statistics. 2019. Available online: https://www.cto.moea.gov.tw/upload/statistics_upload/%E5%85%A8%E5%9C%8B%E5%85%AC%E6%B0%91%E7%87%9F%E5%82%B3%E7%B5%B1%E9%9B%B6%E5%94%AE%E5%B8%82%E5%A0%B4%E5%8F%8A%E6%94%A4%E8%B2%A9%E9%9B%86%E4%B8%AD%E5%A0%B4%E7%B5%B1%E8%A8%88%E8%A1%A8.pdf. (accessed on 7 October 2021).
  12. Varelala, M.O.; Huang, W.C.; Sanyang, S. Consumer Behavior and Preference in the Fruit Markets of Taiwan. Agric. Econ. Market. J. 2009, 2, 19–28. [Google Scholar]
  13. Statista. Annual Expenditure on Food, Beverage, and Tobacco Per Household in Taiwan from 2009 to 2019. Available online: https://www.statista.com/statistics/922694/taiwan-expenditure-on-food-beverage-tobacco-per-household/ (accessed on 3 August 2021).
  14. Taiwan—Fresh Fruits. Available online: https://www.export.gov/apex/article2?id=Taiwan-Fresh-Fruit (accessed on 10 March 2021).
  15. Yang, E.C.L.; Lattimore, C.K. Food and the Perception of Eating: The Case of Young Taiwanese Consumers. Asia Pac. J. Tour. Res. 2015, 20, 1545–1564. [Google Scholar] [CrossRef] [Green Version]
  16. Boutelle, K.; Fulkerson, J.; Neumark-Sztainer, D.; Story, M.; French, S. Fast food for family meals: Relationships with parent and adolescent food intake, home food availability and weight status. Public Health Nutr. 2007, 10, 16–23. [Google Scholar] [CrossRef] [Green Version]
  17. Pan, W.H.; Wu, H.J.; Yeh, C.J.; Chuang, S.Y.; Chang, H.Y.; Yeh, N.H.; Hsieh, Y.T. Diet and health trends in Taiwan: Comparison of two nutrition and health surveys from 1993–1996 and 2005–2008. Asia Pac. J. Clin. Nutr. 2011, 20, 238–250. [Google Scholar]
  18. Simmons, D.; Chapman, G.E. The significance of home cooking within families. Br. Food J 2012, 114, 1184–1195. [Google Scholar] [CrossRef]
  19. Tiwari, A.; Aggarwal, A.; Tang, W.; Drewnowski, A. Cooking at home: A strategy to comply with US dietary guidelines at no extra cost. Am. J. Prev. Med. 2017, 52, 616–624. [Google Scholar] [CrossRef] [Green Version]
  20. Daniels, S.; Glorieux, I.; Minnen, J.; van Tienoven, T.P. More than preparing a meal? Concerning the meanings of home cooking. Appetite 2012, 58, 1050–1056. [Google Scholar] [CrossRef]
  21. Wolfson, J.A.; Bleich, S.N.; Smith, K.C.; Frattaroli, S. What does cooking mean to you? Perceptions of cooking and factors related to cooking behavior. Appetite 2016, 97, 146–154. [Google Scholar] [CrossRef] [PubMed]
  22. Guthrie, J.F.; Lin, B.H.; Frazao, E. Role of food prepared away from home in the American diet, 1977–1978 versus 1994–1996: Changes and consequences. J. Nutr. Educ. Behav. 2002, 34, 140–150. [Google Scholar] [CrossRef]
  23. Orfanos, P.; Naska, A.; Trichopoulos, D.; Slimani, N.; Ferrari, P.; van Bakel, M.; Deharveng, G.; Overvad, K.; Tjønneland, A.; Halkjaer, J.; et al. Eating out of home and its correlates in 10 European countries. The European Prospective Investigation into Cancer and Nutrition (EPIC) study. Public Health Nutr. 2007, 10, 1515–1525. [Google Scholar] [CrossRef] [PubMed] [Green Version]
  24. Hearst, M.; Pasch, K.; Laska, M. Urban v. suburban perceptions of the neighbourhood food environment as correlates of adolescent food purchasing. Public Health Nutr. 2012, 15, 299–306. [Google Scholar] [CrossRef] [Green Version]
  25. Smith, L.; Ng, S.; Popkin, B. Trends in US home food preparation and consumption: Analysis of national nutrition surveys and time use studies from 1965–1966 to 2007–2008. Nutr. J. 2013, 12, 45. [Google Scholar] [CrossRef] [PubMed] [Green Version]
  26. Wolfson, J.; Leung, C.; Richardson, C. More frequent cooking at home is associated with higher Healthy Eating Index-2015 score. Public Health Nutr. 2020, 23, 2384–2394. [Google Scholar] [CrossRef]
  27. Flesher, M.; Woo, P.; Chiu, A.; Charlebois, A.; Warburton, D.E.; Leslie, B. Self-management and biomedical outcomes of a cooking, and exercise program for patients with chronic kidney disease. J. Renal Nutr. 2011, 21, 188–195. [Google Scholar] [CrossRef]
  28. Chen, R.; Lee, M.; Chang, Y.; Wahlqvist, M. Cooking frequency may enhance survival in Taiwanese elderly. Public Health Nutr. 2012, 15, 1142–1149. [Google Scholar] [CrossRef] [Green Version]
  29. Maguire, E.R.; Burgoine, T.; Monsivais, P. Area deprivation and the food environment over time: A repeated cross-sectional study on takeaway outlet density and supermarket presence in Norfolk, UK, 1990–2008. Health Place 2015, 33, 142–147. [Google Scholar] [CrossRef] [Green Version]
  30. Result of the 2002 Farmer Survey. Available online: https://core.ac.uk/download/pdf/10925154.pdf (accessed on 10 March 2021).
  31. Hashem, S.; Migliore, G.; Schifani, G.; Schimmenti, E.; Padel, S. Motives for buying local, organic food through English box schemes. Br. Food J. 2018, 120, 1600–1614. [Google Scholar] [CrossRef]
  32. Blankenhorn, B.; Demkina, T.; Franzmayr, S.; Funk, A.; Iwanov, G.; Jelović, D.; Lechthaler, S.; Paris, P.; Perrin, A.; Anna, S.; et al. Organic Box Schemes. In Student Report within Lecture “Organic Farming and Regional Development” (Lecture Nr. 933.316), Summer Term 2016; Kummer, S., Ed.; University of Natural Resources and Life Sciences Vienna: Vienna, Austria, 2016; 109p, Available online: https://short.boku.ac.at/643epz (accessed on 10 March 2021).
  33. Milestad, R.; Kummer, S.; Hirner, P. Does Scale Matter? Investigating the Growth of a Local Organic Box Scheme in Austria. J. Rural Stud. 2017, 54, 304–313. [Google Scholar] [CrossRef] [Green Version]
  34. Kummer, S.; Milestad, R. The Diversity of Organic Box Schemes in Europe—An Exploratory Study in Four Countries. Sustainability 2020, 12, 2734. [Google Scholar] [CrossRef] [Green Version]
  35. Wang, X.; Cheng, Z. Cross-sectional studies: Strengths, weaknesses, and recommendations. Chest 2020, 158, S65–S71. [Google Scholar] [CrossRef]
  36. Gill, J.; Johnson, P. Research Methods for Managers, 4th ed.; Sage Publication Ltd.: Thousand Oaks, CA, USA, 2010. [Google Scholar]
  37. Taherdoost, H. Determining sample size; how to calculate survey sample size. Int. J. Econ. Manag. Syst. 2017, 2, 237–239. [Google Scholar]
  38. Hu, M.C.; Chen, Y.H.; Huang, L.C. A sustainable vegetable supply chain using plant factories in Taiwanese markets: A nashcournot model. Int. J. Prod. Econ. 2014, 152, 49–56. [Google Scholar] [CrossRef]
  39. Hsieh, S.C. Organic Farming for Sustainable Agriculture in Asia with Special Reference to Taiwan Experience; Food and Fertilizer Technology Center (FFTC) for the Asian and Pacific Region: Taipei, Taiwan, 2005; Available online: https://www.fftc.org.tw/en/publications/main/1287 (accessed on 10 March 2021).
  40. Barten, A.P.; Böhm, V. Chapter 9 consumer theory. Handbook Math. Econ. 1982, 2, 381–429. [Google Scholar]
  41. McFadden, D. Economic choices. Am. Econ. Rev. 2001, 91, 351–378. [Google Scholar] [CrossRef]
  42. Bruin, J. Interval Regression Stata Data Analysis Examples; UCLA, Statistical Consulting Group: Shenzhen, China, 2006; Available online: https://stats.idre.ucla.edu/stata/dae/interval-regression/ (accessed on 10 March 2021).
  43. Wooldridge, J.M. Econometric Analysis of Cross Section and Panel Data; MIT Press: Cambridge, MA, USA, 2002; pp. 508–509. [Google Scholar]
  44. National Development Council Population Projections for the R.O.C (Taiwan). Available online: https://pop-proj.ndc.gov.tw/main_en/dataSearch.aspx?uid=78&pid=78 (accessed on 10 March 2021).
  45. Shiu, E.C.; Dawson, J.A. Demographic segmentation of shoppers at traditional markets and supermarkets in Taiwan. J. Segm. Mark. 2001, 4, 69–85. [Google Scholar] [CrossRef]
  46. Li, H.; Houston, J.E. Factors affecting consumer preferences for major food markets in Taiwan. J. Food Distrib. Res. 2001, 32, 97–109. [Google Scholar]
  47. Pisarn, P.; Kim, M.K.; Yang, S.-H. A Potential Sustainable Pathway for Community-Supported Agriculture in Taiwan: The Consumer Perspective in a Farmers’ Market. Sustainability 2020, 12, 8917. [Google Scholar] [CrossRef]
  48. Investment Opportunities in the Food Industry in Taiwan. Available online: https://www.roc-taiwan.org/uploads/sites/20/2015/08/48181647971.pdf (accessed on 10 March 2021).
  49. Overview of Statistical Survey Results over the Years. Available online: https://eng.stat.gov.tw/public/Data/4815173411ECWGCXEJ.pdf (accessed on 10 March 2021).
  50. Nugraha, W.S.; Yang, S.-H.; Ujiie, K. The Heterogeneity of Consumer Preferences for Meat Safety Attributes in Traditional Markets. Foods 2021, 10, 624. [Google Scholar] [CrossRef]
  51. Chang, C. Taiwan Retail Foods Report. USDA 2019, TW19022. Available online: https://apps.fas.usda.gov/newgainapi/api/report/downloadreportbyfilename?filename=Taiwan%20Retail%20Foods%20Report_Taipei%20ATO_Taiwan_7-29-2019.pdf (accessed on 10 March 2021).
  52. Fromm, J. Marketing Convenience to the Modern Consumer. Forbes. 2019. Available online: https://www.forbes.com/sites/jefffromm/2019/01/04/marketing-convenience-to-the-modern-consumer/?sh=62e86e1d127f (accessed on 20 September 2021).
  53. Katawetawaraks, C.; Wang, C.L. Online Shopper Behavior: Influences of Online Shopping Decision. Asian J. Bus. Res. 2011, 1, 66–74. [Google Scholar] [CrossRef] [Green Version]
  54. Seyfang, G. New Initiatives for Sustainable Food: A Case Study of an Organic Producerco-Operative (Working Paper EDM 04-11). Centre for Social and Economic Researchon the Global Environment. 2004. Available online: http://hdl.handle.net/10419/80233 (accessed on 28 September 2021).
  55. Nielsen Taiwan. Taiwanese Consumers’ Purchasing Behaviours and Divers of Horticulture Products: Based on Consumer Testing and Focus Group Discussions, as well as In-depth Interviews with Supermarket Managers. Nielsen Holdings N.V.; 2017. Available online: https://www.publications.qld.gov.au/dataset/d1da5ddc-acc1-4801-992d-7dd7f066ef3f/resource/5dbfd0fc-6bda-4aa8-93d7-842f30fba5d1/download/taiwan-purchasing-behaviours-and-drivers-report.pdf (accessed on 9 September 2021).
  56. Broekhuizen, T.; Huizingh, E. Online purchase determinants: Is their effect moderated by direct experience? Manag. Res. News 2009, 32, 440–457. [Google Scholar] [CrossRef]
  57. Thilakarathne, N.; Jayasinghe-Mudalige, U.; Udagama, J.; Edirisinghe, J.; Herath, H. Role of information on women consumer decision making on food quality: An analysis based on visual presentation of dairy quality attributes. J. Agric. Sci. 2015, 10, 109. [Google Scholar] [CrossRef] [Green Version]
  58. Heath, C.; Soll, J.B. Mental budgeting and consumer decisions. J. Consum. Res. 1996, 23, 40–52. [Google Scholar] [CrossRef]
  59. Wu, W. New Vegetable Boxes Available for Delivery in Taiwan. Taiwan News. 2021. Available online: https://www.taiwannews.com.tw/en/news/4207175 (accessed on 9 September 2021).
  60. Chang, H.H.; Meyerhoefer, C.D. COVID-19 and the demand for online food shopping services: Empirical Evidence from Taiwan. Am. J. Agric. Econ. 2020, 103, 448–465. [Google Scholar] [CrossRef]
  61. Evans, C. Coronavirus: Fruit and Veg Box Demand Increases. BBC News. 2020. Available online: https://www.bbc.com/news/uk-wales-52328344 (accessed on 9 September 2021).
  62. Gangloff, C. COVID-19 Pandemic Has Mixed Impact on Fresh Produce Corrugated Box Market. CISION PR Newswire. 2021. Available online: https://www.prnewswire.com/news-releases/covid-19-pandemic-has-mixed-impact-on-fresh-produce-corrugated-box-market-301334796.html (accessed on 9 September 2021).
Figure 1. The example of fresh food box used in the questionnaire (Source: The website of Leezen.com.tw; accessed on 1 July 2019).
Horticulturae 07 00408 g001
Figure 2. The relationship between family size and fresh food box budget. Note: FFB means a fresh food box.
Horticulturae 07 00408 g002
Figure 3. The relationship between time spent on grocery shopping and fresh food box budget. Note: FFB means a fresh food box.
Horticulturae 07 00408 g003
Figure 4. Consumers’ preferences for ingredients included in their fresh food boxes. Note: FFB means a fresh food box. Source: Authors’ calculation.
Horticulturae 07 00408 g004
Table 1. The Summary of Descriptive Statistics and Variable Definition (n = 748).
Dependent VariablesVariable TypeMean
MaxBudgetHigherCV, if FFB max-budget is higher than grocery budget855.16
MaxBudgetSameCV, if FFB max-budget is same with grocery budget656.62
MaxBudgetLowerCV, if FFB max-budget is lower than grocery budget608.61
MaxBudgetAll SampleCV, max-budget for all sample749.20
Independent Variables
Socio-economic background
Gender DV = 1 if one is female0.69
AgeCV, years of age32.35
Monthly income CV, monthly income (unit: NTD 1000)61.86
Junior school graduatedDV = 1 if one graduated from junior school0.01
High school graduatedDV = 1 if one graduated from high school0.07
Family size CV, number of family members (persons)3.05
Number of children CV, number of children at home (persons)1.28
NorthDV = 1 if one lives in the Northern region0.30
CentralDV = 1 if one lives in the Central region0.50
UrbanDV = 1 if one lives in the urban area0.71
SuburbDV = 1 if one lives in the suburb area0.14
Grocery shopping behaviors
Frequency of eating outCV, frequency of eating out per week8.15
Frequency of cookingCV, frequency of cooking at home per week5.84
Time spent on groceryCV, time spent on grocery shopping (minutes)34.91
Frequently visiting traditional marketDV = 1 if one visits traditional market often frequently0.26
Frequently visiting supermarketDV = 1 if one visits supermarket often frequently0.55
Frequently visiting hypermarketDV = 1 if one visits hypermarket often frequently0.27
Frequently visiting farmer marketDV = 1 if one visits farmer market often frequently0.02
Frequently visiting online marketDV = 1 if one visits online market often frequently0.03
Reason to buy FFB
Because of holidaysDV = 1 if one buys FFB because of holidays0.16
Because of group shoppingDV = 1 if one buys FFB because of group shopping0.49
Ingredient-choice preferences of FFB
Must include marrow vegetablesDV = 1 if one must include marrow vegetables in FFB0.14
Must include root vegetables DV = 1 if one must include root vegetables in FFB0.31
Must include leafy vegetablesDV = 1 if one must include leafy vegetables in FFB0.68
Must include fruitsDV = 1 if one must include fruits in FFB0.42
Must include meatsDV = 1 if one must include meat in FFB0.44
Source: Authors’ calculation. Note: DV means the dummy variable; CV means the continuous variable; FFB means a fresh food box.
Table 2. The Estimated Outcomes of the Interval Regression Models (n = 748).
VariablesMaxBudget
Higher
MaxBudget
Same
MaxBudget
Lower
MaxBudget
All Sample
CoefficientCoefficientCoefficientCoefficient
Socio-economic background
Gender−52.39−25.45−7.17−49.94 **
Age6.74 ***8.28 ***4.84 ***5.94 ***
Monthly income 0.632.94 ***1.071.36 ***
Junior school graduated115.60−25.3385.68165.30
High school graduated−35.6038.30−63.932.92
Family size23.27 **55.43 ***−4.7541.98 ***
Number of children3.548.0825.77−9.84
North29.3065.8655.5746.70
Central−3.2382.75110.95 **65.11 **
Urban−6.17−37.21−39.64−1.50
Suburb−39.09−22.48−0.22−10.90
Grocery shopping behaviors
Frequency of eating out−6.69−7.823.19−4.39
Frequency of cooking−7.94−2.955.28−1.67
Time spent on grocery3.95 ***8.93 ***4.97 ***4.54 ***
Frequently visiting traditional market −27.39−12.56−41.26−22.26
Frequently visiting supermarket37.30−18.23−22.4319.09
Frequently visiting hypermarket22.60−55.61−16.90−25.23
Frequently visiting farmer market−28.35169.7655.5341.47
Frequently visiting online market178.34 ***−11.9392.2189.51
Reason to buy FFB
Because of holidays−8.72−3.4633.4540.84
Because of group shopping12.468.1313.8529.01
Ingredient-choice preferences of FFB
Must include marrow vegetables 104.36 **−7.7729.7173.63
Must include root vegetables 9.4977.8053.8629.56
Must include leafy vegetables−19.28−40.31−39.05−37.11
Must include fruits5.7696.10109.79 **70.40 ***
Must include meats24.9043.2422.6353.11 **
Constant492.43 ***−266.0477.49155.09
Wald χ2145.36 ***6570.44 ***2563.48 ***234.11 ***
Number of observations339272137748
Log-Likelihood−539.27−406.16−192.47−1249.43
AIC1134.54866.32438.952554.86
Source: Authors’ calculation. Note: *** and ** denote statically significant at the 1% and 5% level of significance, respectively; FFB means a fresh food box.
Table 3. The Elicitation of Maximum Budget for Each Model.
VariablesAssumed Variable ValueMaxBudget
Higher
(NTD)
MaxBudget
Same
(NTD)
MaxBudget
Lower
(NTD)
MaxBudget
All Sample
(NTD)
Socio-economic background
Gender1 −49.94
Age32.35217.90267.76157.60192.21
Monthly income61.86 181.85 84.31
Family size3.0570.98169.07 128.05
Central1 110.9565.11
Grocery shopping behaviors
Time spending on grocery34.91138.02311.85173.40158.63
Frequently visiting online market1178.34
Ingredient-choice preferences of FFB
Must include marrow vegetables1104.36
Must include fruits1 109.7970.40
Must include meats1 53.11
Constant1492.43
Total of MaxBudget (column sum) 1202930551702
Source: Authors’ calculation. Note: FFB means a fresh food box.
Publisher’s Note: MDPI stays neutral with regard to jurisdictional claims in published maps and institutional affiliations.

