
Quality of ‘Hayward’ Kiwifruit in Prolonged Cold Storage as Affected by the Stage of Maturity at Harvest

Abstract
:1. Introduction
2. Materials and Methods
3. Results
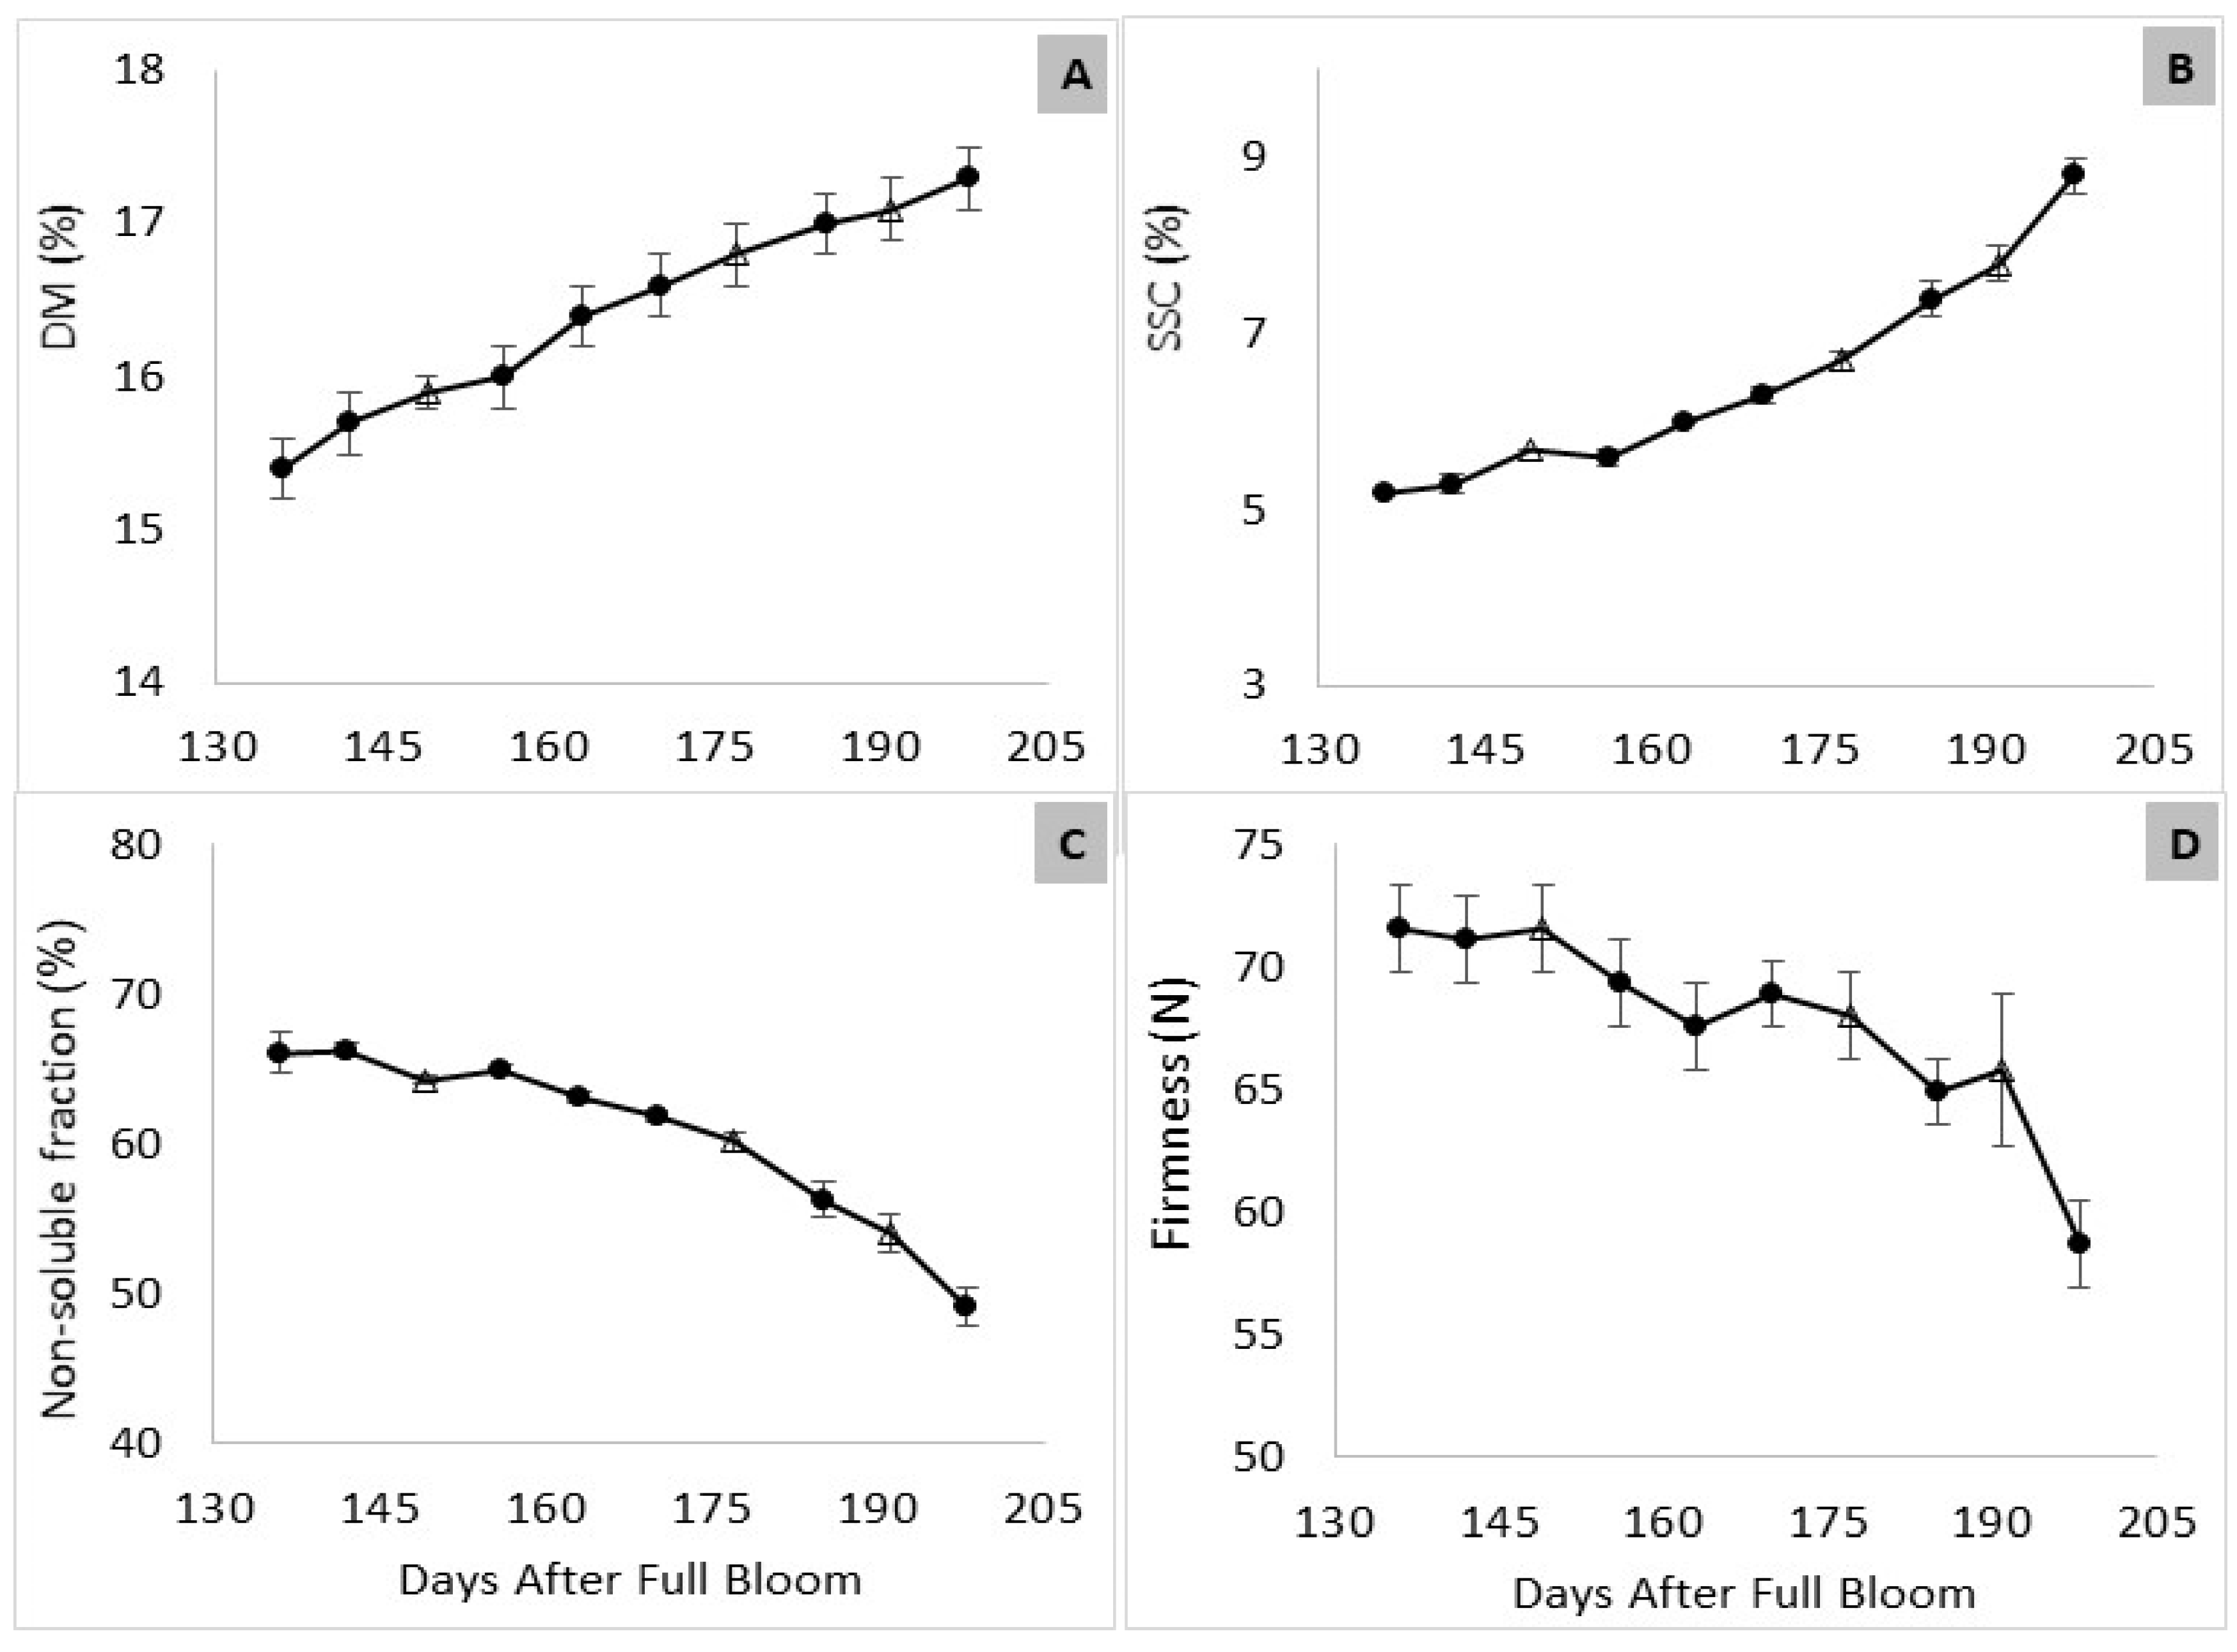
3.1. Maturation in the Orchard
3.2. Fruit Maturity at Harvest
3.3. Changes in Fruit Composition during Storage
3.3.1. RA Storage
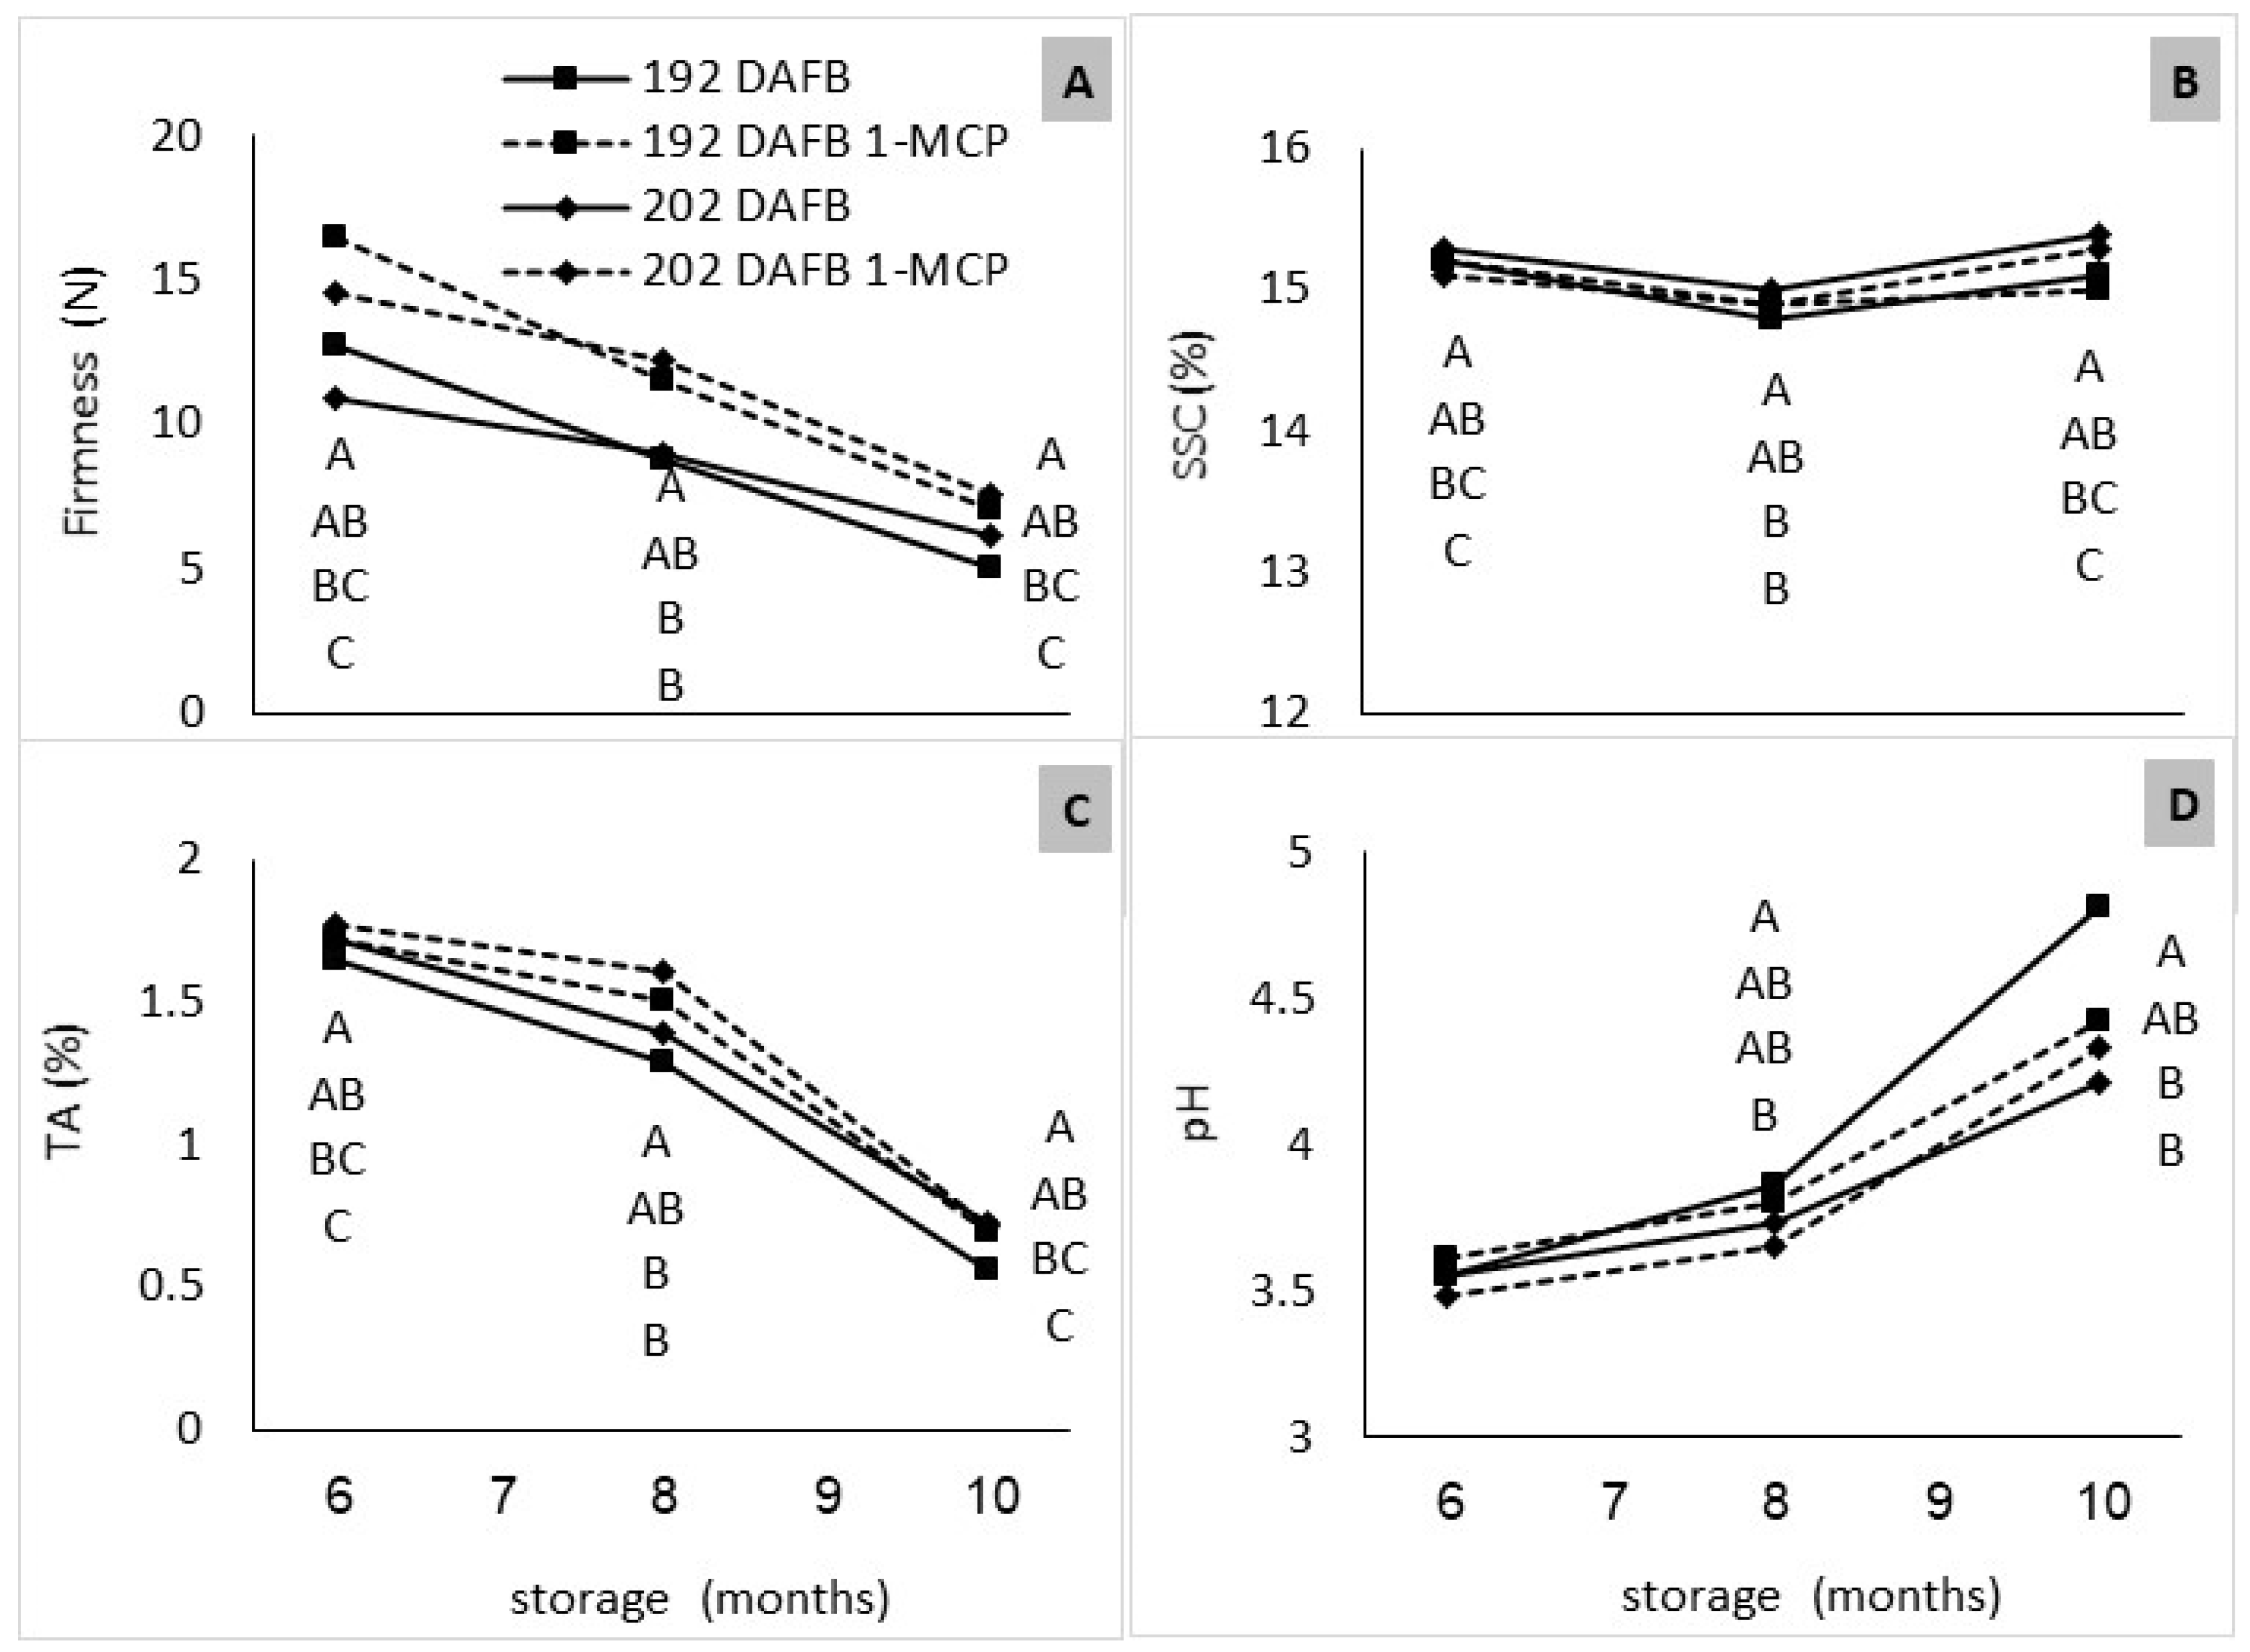
3.3.2. CA Storage
4. Discussion
5. Conclusions
Author Contributions
Funding
Institutional Review Board Statement
Informed Consent Statement
Data Availability Statement
Acknowledgments
Conflicts of Interest
References
- Sfakiotakis, E.; Antunes, M.; Stavroulakis, G.; Niklis, N. Ethylene Biosynthesis. Its Role in Ripening and Quality of ‘Hayward’ Kiwifruit after Harvest, during Storage and Shelf Life. In Crop Management and Postharvest Handling of Horticultural Products; Oxford & IBH Publishing Co. Pvt. Ltd.: New Delhi, India, 2001; Volume 1. [Google Scholar]
- Goldberg, T.; Agra, H.; Ben-Arie, R. Non-destructive measurement of fruit firmness to predict the shelf-life of ‘Hayward’ kiwifruit. Sci. Hortic. 2019, 244, 339–342. [Google Scholar] [CrossRef]
- Macrae, E.A.; Lallu, N.; Searle, A.N.; Bowen, J.H. Changes in the softening and composition of kiwifruit (Actinidia deliciosa) affected by maturity at harvest and postharvest treatments. J. Sci. Food Agric. 1989, 49, 413–430. [Google Scholar] [CrossRef]
- Burdon, J.; Pidakala, P.; Martin, P.; Billing, D.; Boldingh, H. Fruit maturation and the soluble solids harvest index for ‘Hayward’ kiwifruit. Sci. Hortic. 2016, 213, 193–198. [Google Scholar] [CrossRef]
- Choi, H.; Tilahun, S.; Park, D.; Lee, Y.; Choi, J.; Baek, M.; Jeong, C. Harvest time affects quality and storability of kiwifruit (Actinidia spp.) cultivars during long-term cool storage. Sci. Hortic. 2019, 256, 108523. [Google Scholar] [CrossRef]
- Crisosto, G.U.; Mitchell, F.G.; Arpaia, M.L.; Mayer, G. The effect of growing location and harvest maturity on the storage performance and quality of ‘Hayward’ kiwifruit [California]. J. Am. Soc. Hortic. Sci. 1984, 109, 584–587. [Google Scholar]
- Harman, J.E. Kiwifruit maturity [New Zealand]. Orchard. N. Z. 1981, 54, 126–127. [Google Scholar]
- Burdon, J.; Lallu, N.; Pidakala, P.; Barnett, A. Soluble solids accumulation and postharvest performance of ‘Hayward’ kiwifruit. Postharvest Biol. Technol. 2013, 80, 1–8. [Google Scholar] [CrossRef]
- Burdon, J. Subtropical fruits: Kiwifruit. In Controlled and Modified Atmospheres for Fresh and Fresh-Cut Produce, 1st ed.; Gil, M.I., Beaudry, R., Eds.; Academic Press: Cambridge, UK, 2020; pp. 447–454. [Google Scholar]
- Meena, N.; Baghel, M.; Jain, S.K.; Asrey, R. Postharvest biology and technology of kiwifruit. In Postharvest Biology and Technology of Temperate Fruits; Mir, S., Shah, M., Mir, M., Eds.; Springer International Publishing: New York, NY, USA, 2018; pp. 299–329. [Google Scholar]
- Gwanpua, S.G.; Jabbar, A.; Zhao, M.; Heyes, J.A.; East, A.R. Investigating the potential of dual temperature storage as a postharvest management practice to mitigate chilling injury in kiwifruit. Int. J. Refrig. 2018, 86, 62–72. [Google Scholar] [CrossRef]
- Maguire, K.M.; Amos, N.; Kelly, D. Influence of storage temperature and at-harvest maturity on incidence of chill-related disorders in ´Hort16a´ kiwifruit. Acta Hort. 2004, 687, 57–62. [Google Scholar] [CrossRef]
- Costa, G.; Quadretti, R.; Succi, A.; Morigi, M. Influence of harvest time and temperature on fruit quality and storage of kiwifruit (cv Hayward). Acta Hort. 1997, 444, 517–522. [Google Scholar] [CrossRef]
- Famiani, F.; Baldicchi, A.; Farinelli, D.; Cruz-Castillo, J.G.; Marocchi, F.; Mastroleo, M.; Moscatello, S.; Proietti, S.; Battistelli, A. Yield affects qualitative kiwifruit characteristics and dry matter content may be an indicator of both quality and storability. Sci. Hortic. 2012, 146, 124–130. [Google Scholar] [CrossRef]
- Matsumoto, S.; Obara, T.; Luh, B.S. Changes in chemical constituents of kiwifruit during post-harvest ripening. J. Food Sci. 1983, 48, 607–611. [Google Scholar] [CrossRef]
- Wang, M.; Macrae, E.; Wohlers, M.; Marsh, K. Changes in volatile production and sensory quality of kiwifruit during fruit maturation in Actinidia deliciosa ‘Hayward’ and A. chinensis ‘Hort16A’. Postharvest Biol. Technol. 2011, 59, 16–24. [Google Scholar] [CrossRef]
- Nishiyama, I.; Fukuda, T.; Shimohashi, A.; Oota, T. Sugar and organic acid composition in the fruit juice of different Actinidia varieties. Food Sci. Technol. Res. 2008, 14, 67–73. [Google Scholar] [CrossRef] [Green Version]
- Burdon, J.; McLeod, D.; Lallu, N.; Gamble, J.; Petley, M.; Gunson, A. Consumer evaluation of ‘Hayward’ kiwifruit of different at-harvest dry matter contents. Postharvest Biol. Technol. 2004, 34, 245–255. [Google Scholar] [CrossRef]
- Mitchell, F.G.; Mayer, G.; Biasi, W. Effect of harvest maturity on storage performance of ‘Hayward’ kiwifruit. Acta Hort. 1992, 297, 617–626. [Google Scholar] [CrossRef]
- Asiche, W.O.; Gituma, M.E.; Oda, C.; Witere, M.O.; Omondi, O.W.; Ushijima, K.; Nakano, R.; Kubo, Y. Extension of shelf-life by limited duration of propylene and 1-MCP treatments in three kiwifruit cultivars. Hort. J. 2016, 85, 76–85. [Google Scholar] [CrossRef] [Green Version]
- Burdon, J.; Pidakala, P.; Martin, P.; Billing, D. Softening of ‘Hayward’ kiwifruit on the vine and in storage: The effects of temperature. Sci. Hortic. 2017, 220, 176–182. [Google Scholar] [CrossRef]
- Given, N.K. Kiwifruit. In Biochemistry of Fruit Ripening; Seymour, G.B., Taylor, J.E., Tucker, G.A., Eds.; Springer: Dordrecht, The Netherlands, 1993; pp. 235–254. [Google Scholar]
- Koukounaras, A.; Sfakiotakis, E. Effect of 1-MCP prestorage treatment on ethylene and CO2 production and quality of ‘Hayward’ kiwifruit during shelf-life after short, medium and long term cold storage. Postharvest Biol. Technol. 2007, 46, 174–180. [Google Scholar] [CrossRef]
- Crisosto, C.H.; Kader, A.A. Kiwifruit postharvest quality maintenance guidelines. Cent. Val. Post Harvest. Newsl. 1999, 8, 1–11. [Google Scholar]
- Gullo, G.; Dattola, A.; Liguori, G.; Vonella, V.; Zappia, R.; Inglese, P. Evaluation of fruit quality and antioxidant activity of kiwifruit during ripening and after storage. J. Berry Res. 2016, 6, 25–35. [Google Scholar] [CrossRef] [Green Version]
- Burdon, J. Soluble solids revisited: A maturity or harvest index for Kiwifruit. Acta Hort. 2015, 1096, 257–266. [Google Scholar] [CrossRef]
- Burdon, J.; Pidakala, P.; Martin, P.; McAtee, P.A.; Boldingh, H.L.; Hall, A.; Schaffer, R.J. Postharvest performance of the yellow-fleshed ‘Hort16A’ kiwifruit in relation to fruit maturation. Postharvest Biol. Technol. 2014, 92, 98–106. [Google Scholar] [CrossRef]
- Tavarini, S.; Degl’Innocenti, E.; Remorini, D.; Massai, R.; Guidi, L. Polygalacturonase and β-galactosidase activities in ‘Hayward’ kiwifruit as affected by light exposure, maturity stage and storage time. Sci. Hortic. 2009, 120, 342–347. [Google Scholar] [CrossRef]
- Ferrandino, A.; Guidoni, S. Chemical composition of Actinidia deliciosa fruits as influenced by harvest date and storage period. Acta Hort. 1999, 498, 313–318. [Google Scholar] [CrossRef]
- Kim, H.O.; Hewett, E.W.; Lallu, N. The role of ethylene in kiwifruit softening. Acta Hort. 1999, 498, 255–262. [Google Scholar] [CrossRef]
- Atkinson, R.G.; Gunaseelan, K.; Wang, M.Y.; Luo, L.; Wang, T.; Norling, C.L.; Johnston, S.L.; Maddumage, R.; Schroder, R.; Schaffer, R.J. Dissecting the role of climacteric ethylene in kiwifruit (Actinidia chinensis) ripening using a 1-aminocyclopropane-1-carboxylic acid oxidase knockdown line. J. Exp. Bot. 2011, 62, 3821–3835. [Google Scholar] [CrossRef]
- Mworia, E.G.; Yoshikawa, T.; Salikon, N.; Oda, C.; Asiche, W.O.; Yokotani, N.; Abe, D.; Ushijima, K.; Nakano, R.; Kubo, Y. Low-temperature-modulated fruit ripening is independent of ethylene in ‘Sanuki Gold’ kiwifruit. J. Exp. Bot. 2012, 63, 963–971. [Google Scholar] [CrossRef] [Green Version]
- Famiani, F.; Battistelli, A.; Moscatello, S.; Cruz-Castillo, J.G.; Walker, R. The organic acids that are accumulated in the flesh of fruits: Occurrence, metabolism and factors a ffecting their contents. Rev. Chapingo. Ser. Hortic. 2015, 21, 97–128. [Google Scholar] [CrossRef]
- Marsh, K.; Harker, F. Acid metabolism in kiwifruit. In The Kiwifruit Genome; Testolin, R., Huang, H.W., Ferguson, A., Eds.; Springer: Cham, Switzerland, 2016; pp. 179–188. [Google Scholar]
- Gamrasni, D.; Erov, M.; Saar, L.; Raz, A.; Glikman, M.; Sonawane, P.D.; Aharoni, A.; Goldway, M. The isocitrate dehydrogenase 1 gene is associated with the climacteric response in tomato fruit ripening. Postharvest Biol. Technol. 2020, 166, 111219. [Google Scholar] [CrossRef]
- Lu, X.; Nock, J.F.; Ma, Y.; Liu, X.; Watkins, C.B. Effects of repeated 1-methylcyclopropene (1-MCP) treatments on ripening and superficial scald of ‘Cortland’ and ‘Delicious’ apples. Postharvest Biol. Technol. 2013, 78, 48–54. [Google Scholar] [CrossRef]
- Fullerton, C.G. Kiwifruit Softening: A Cell Wall Study. Ph.D. Thesis, University of Auckland, Auckland, New Zealand, 2015. [Google Scholar]
- Gapper, N.E.; McQuinn, R.P.; Giovannoni, J.J. Molecular and genetic regulation of fruit ripening. Plant Mol. Biol. 2013, 82, 575–591. [Google Scholar] [CrossRef] [PubMed]
- Goulao, L.; Oliveira, C. Cell wall modifications during fruit ripening: When a fruit is not the fruit. Trends Food Sci. Technol. 2008, 19, 4–25. [Google Scholar] [CrossRef] [Green Version]
- Posé, S.; Paniagua, C.; Matas, A.J.; Gunning, A.P.; Morris, V.J.; Quesada, M.A.; Mercado, J.A. A nanostructural view of the cell wall disassembly process during fruit ripening and postharvest storage by atomic force microscopy. Trends Food Sci. Technol. 2019, 87, 47–58. [Google Scholar] [CrossRef]
- Jakób, A.; Bryjak, J.; Polakovič, M. Selection of a method for determination of activity of pectinolytic enzymes in berry fruit materials. Chem. Pap. 2009, 63, 677. [Google Scholar] [CrossRef]
- Ross, G.S.; Redgwell, R.J.; MacRae, E.A. Kiwifruit β-galactosidase: Isolation and activity against specific fruit cell-wall polysaccharides. Planta 1993, 189, 499–506. [Google Scholar] [CrossRef]
- Morales-Quintana, L.; Beltrán, D.; Mendez-Yañez, Á.; Valenzuela-Riffo, F.; Herrera, R.; Moya-León, A.M. Characterization of FcXTH2, a Novel Xyloglucan Endotransglycosylase/Hydrolase Enzyme of Chilean Strawberry with Hydrolase Activity. Int. J. Mol. Sci. 2020, 21, 3380. [Google Scholar] [CrossRef]
- Schroder, R.; Atkinson, R.G.; Langenkamper, G.; Redgwell, R.J. Biochemical and molecular characterisation of xyloglucan endotransglycosylase from ripe kiwifruit. Planta 1998, 204, 242–251. [Google Scholar] [CrossRef]
- Bonghi, C.; Pagni, S.; Vidrih, R.; Ramina, A.; Tonutti, P. Cell wall hydrolases and amylase in kiwifruit softening. Postharvest Biol. Technol. 1996, 9, 19–29. [Google Scholar] [CrossRef]
- Soda, I.; Hasegawa, T.; Suzuki, T.; Ogura, N. Detection of polygalacturonase in kiwifruit during ripening. Agric. Biol. Chem. 1986, 50, 3191–3192. [Google Scholar]


| Harvest | DM (%) | SSC (%) | FTA (N) | TA (%) | pH | SSC/TA |
|---|---|---|---|---|---|---|
| 2017 | ||||||
| 152 DAFB | 15.9 ± 0.1 B | 5.7 ± 0.1 C | 71.6 ± 1.3 A | 2.0 ± 0.0 C | 3.3 ± 0.01 A | 2.9 ± 0.1 AB |
| 178 DAFB | 16.8 ± 0.2 A | 6.7 ± 0.1 B | 68.1 ± 1.8 AB | 2.4 ± 0.0 B | 3.0 ± 0.01 C | 2.7 ± 0.1 B |
| 192 DAFB | 17.1 ± 0.2 A | 7.8 ± 0.1 A | 65.8 ± 1.8 B | 2.6 ± 0.0 A | 3.2 ± 0.04 B | 3.1 ± 0.1 A |
| 2018 | ||||||
| 192 DAFB | 17.7 ± 0.2 A | 8.1 ± 0.1 B | 65.4 ± 1.8 A | 2.3 ± 0.0 A | 3.3 ± 0.01 | 3.5 ± 0.1 B |
| 202 DAFB | 16.9 ± 0.2 B | 10.7 ± 0.3 A | 56.0 ± 3.1 B | 2.1 ± 0.0 B | 3.3 ± 0.02 | 5.0 ± 0.1 A |
| Harvest | 1-MCP | FTA (N) | SSC (%) | TA (%) | pH | Overall Taste Index |
|---|---|---|---|---|---|---|
| 2017 RA storage, six months | ||||||
| 152 DAFB | - | 2.1 ± 1.09 C | 12.2 ± 0.29 C | 0.8 ± 0.03 C | 3.6 ± 0.03 A | ND |
| 178 DAFB | - | 2.9 ± 1.33 B | 13.5 ± 0.33 B | 1.1 ± 0.04 B | 3.6 ± 0.03 A | 3.6 ± 2.38 B |
| 192 DAFB | - | 3.3 ± 1.33 A | 14.4 ± 0.30 A | 1.4 ± 0.03 A | 3.3 ± 0.01 B | 8.8 ± 1.92 A |
| 2018 CA storage, eight months; 1-MCP [+]/no 1-MCP [−] | ||||||
| 192 DAFB | - | 6.9 ± 0.36 B | 15.0 ± 0.00 | 1.4 ± 0.02 | 3.8 ± 0.11 | 4.0 ± 1.2 |
| 202 DAFB | - | 7.7 ± 0.44 A | 14.8 ± 0.20 | 1.5 ± 0.03 | 3.8 ± 0.01 | 3.2 ± 1.6 |
| 192 DAFB | + | 9.1 ± 0.40 B | 15.2 ± 0.10 | 1.6 ± 0.02 | 3.7 ± 0.04 | 3.5 ± 0.9 |
| 202 DAFB | + | 10.0 ± 1.02 A | 14.6 ± 0.20 | 1.6 ± 0.05 | 3.6 ± 0.03 | 2.9 ± 1.1 |
Publisher’s Note: MDPI stays neutral with regard to jurisdictional claims in published maps and institutional affiliations. |
© 2021 by the authors. Licensee MDPI, Basel, Switzerland. This article is an open access article distributed under the terms and conditions of the Creative Commons Attribution (CC BY) license (https://creativecommons.org/licenses/by/4.0/).
Share and Cite
Goldberg, T.; Agra, H.; Ben-Arie, R. Quality of ‘Hayward’ Kiwifruit in Prolonged Cold Storage as Affected by the Stage of Maturity at Harvest. Horticulturae 2021, 7, 358. https://doi.org/10.3390/horticulturae7100358
Goldberg T, Agra H, Ben-Arie R. Quality of ‘Hayward’ Kiwifruit in Prolonged Cold Storage as Affected by the Stage of Maturity at Harvest. Horticulturae. 2021; 7(10):358. https://doi.org/10.3390/horticulturae7100358
Chicago/Turabian StyleGoldberg, Tal, Harel Agra, and Ruth Ben-Arie. 2021. "Quality of ‘Hayward’ Kiwifruit in Prolonged Cold Storage as Affected by the Stage of Maturity at Harvest" Horticulturae 7, no. 10: 358. https://doi.org/10.3390/horticulturae7100358
APA StyleGoldberg, T., Agra, H., & Ben-Arie, R. (2021). Quality of ‘Hayward’ Kiwifruit in Prolonged Cold Storage as Affected by the Stage of Maturity at Harvest. Horticulturae, 7(10), 358. https://doi.org/10.3390/horticulturae7100358