
Genetic Variability and Structure of Fragaria nilgerrensis Schlecht. Germplasm in Sichuan Province

 ,
,  and
and 
Abstract
1. Introduction
2. Materials and Methods
2.1. Plant Material
2.2. DNA Isolation
2.3. Molecular Analysis
2.4. Data Analysis
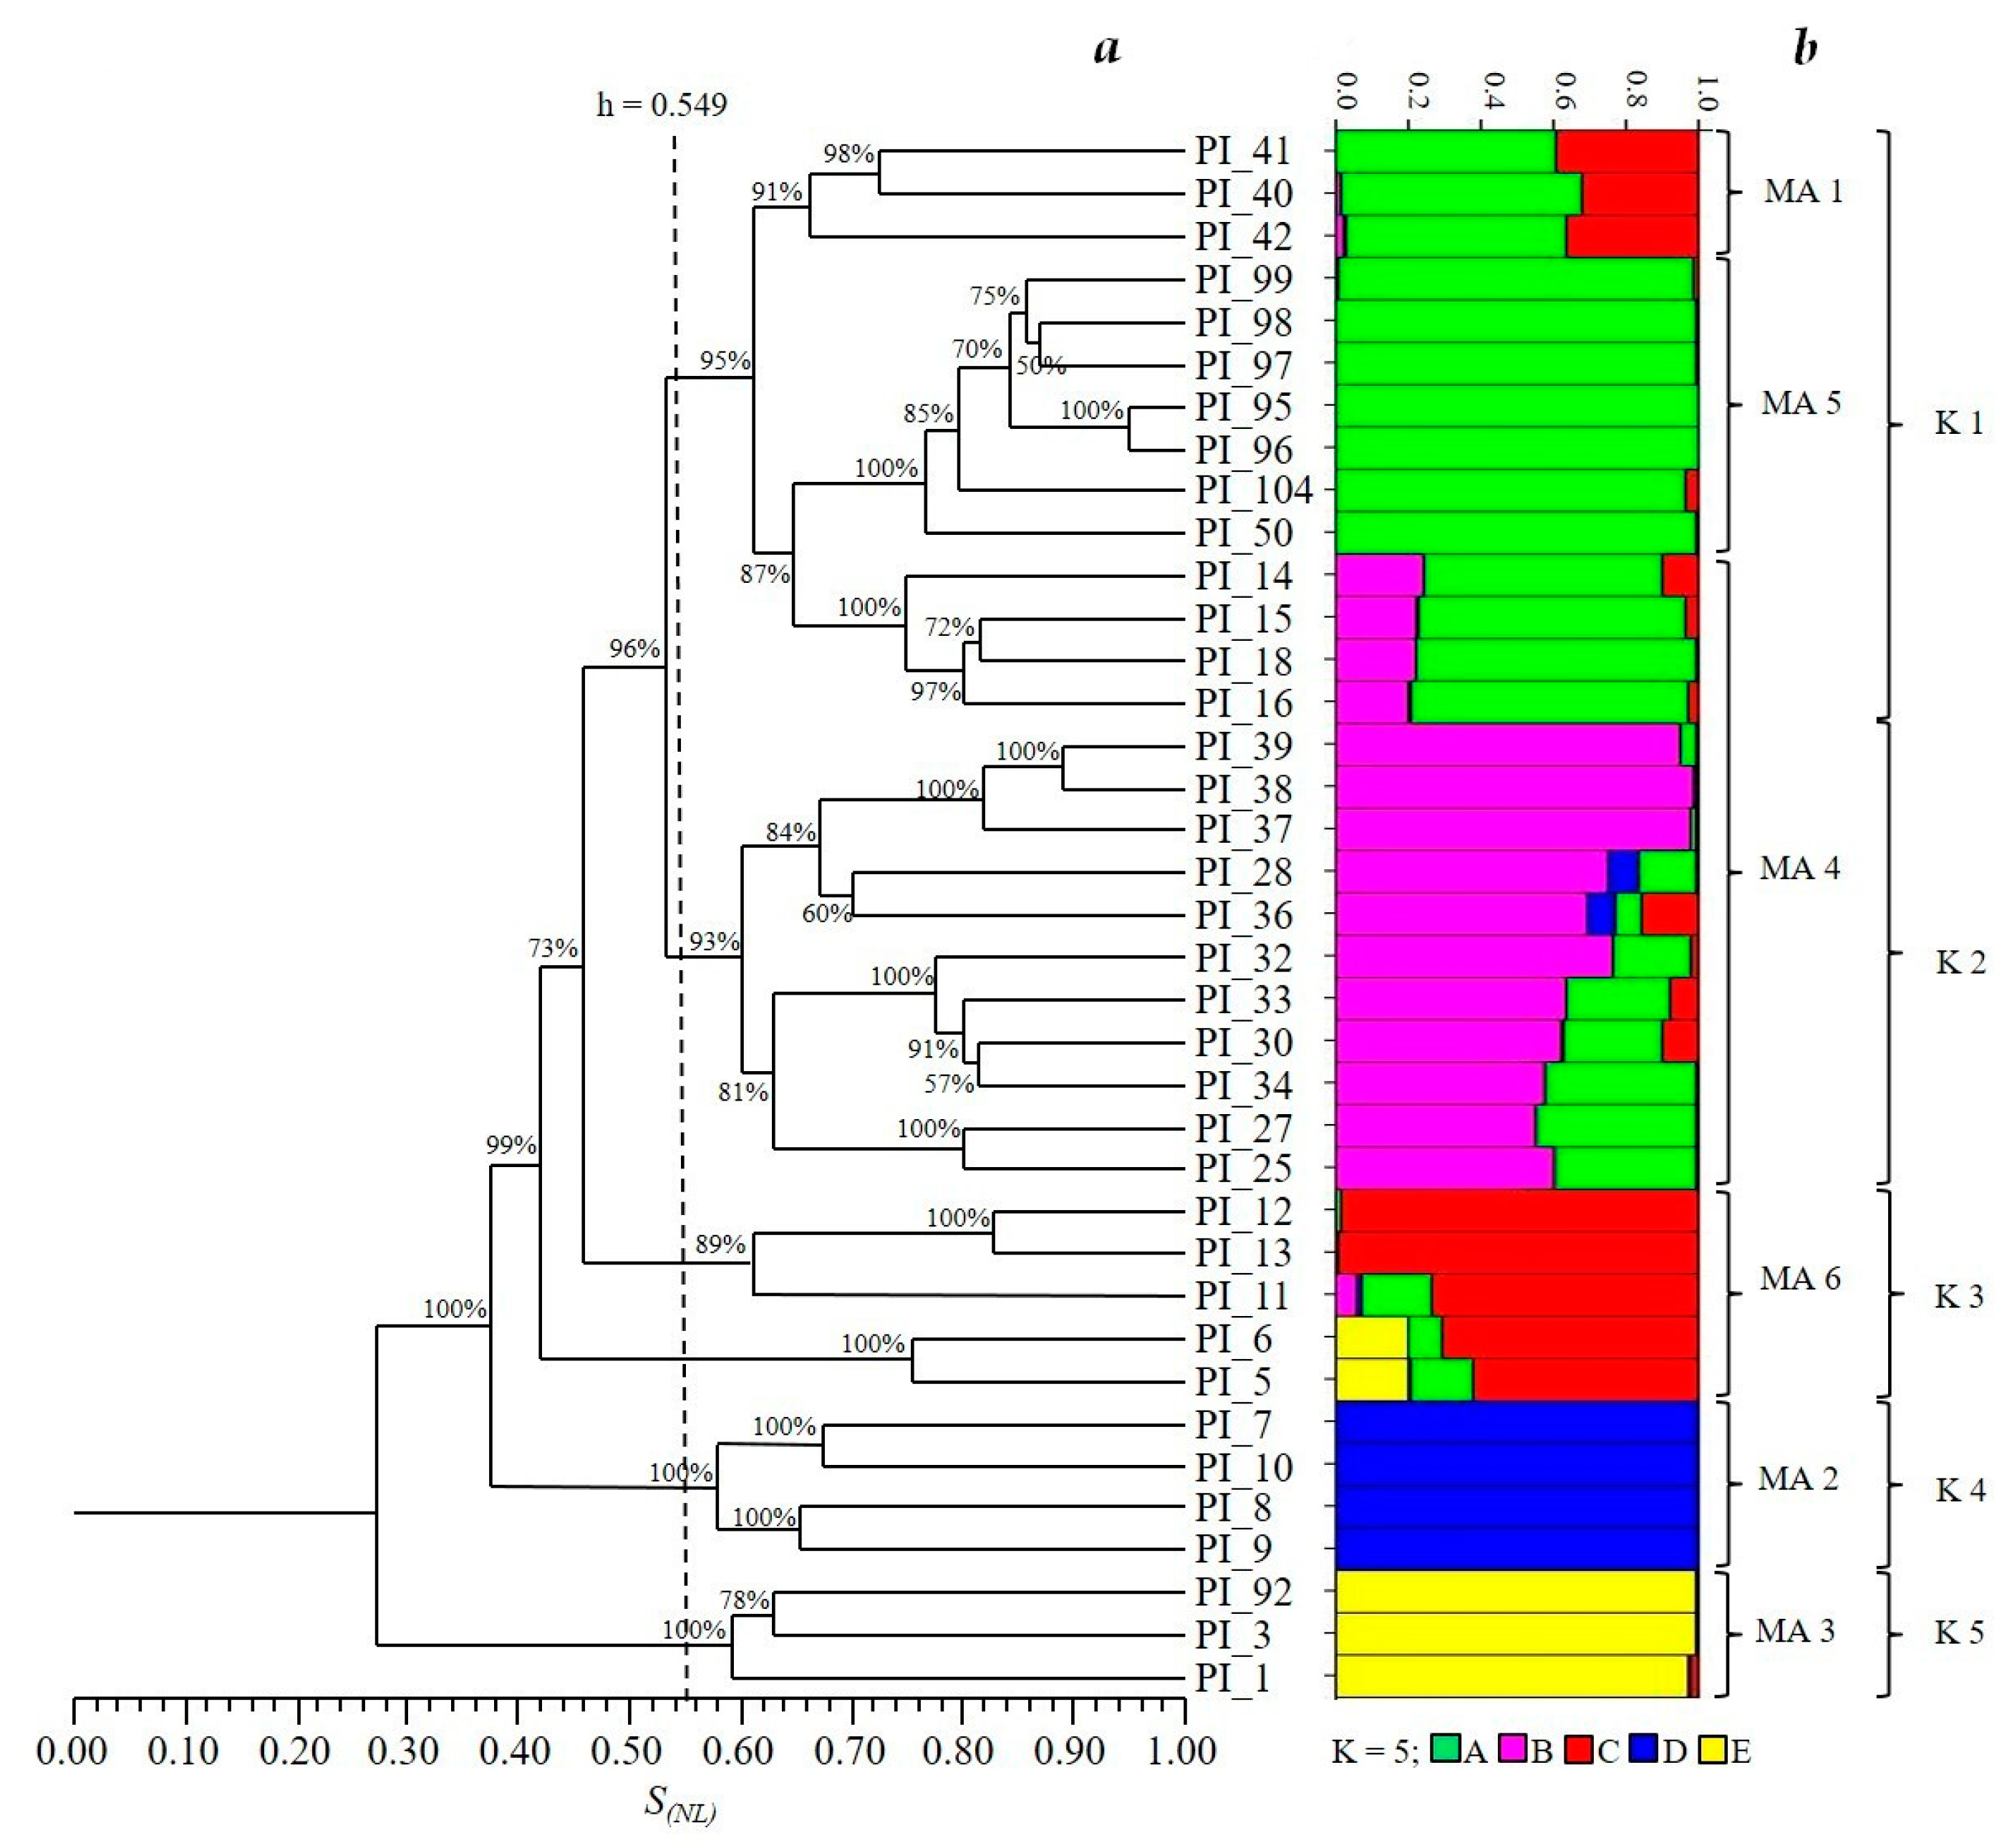
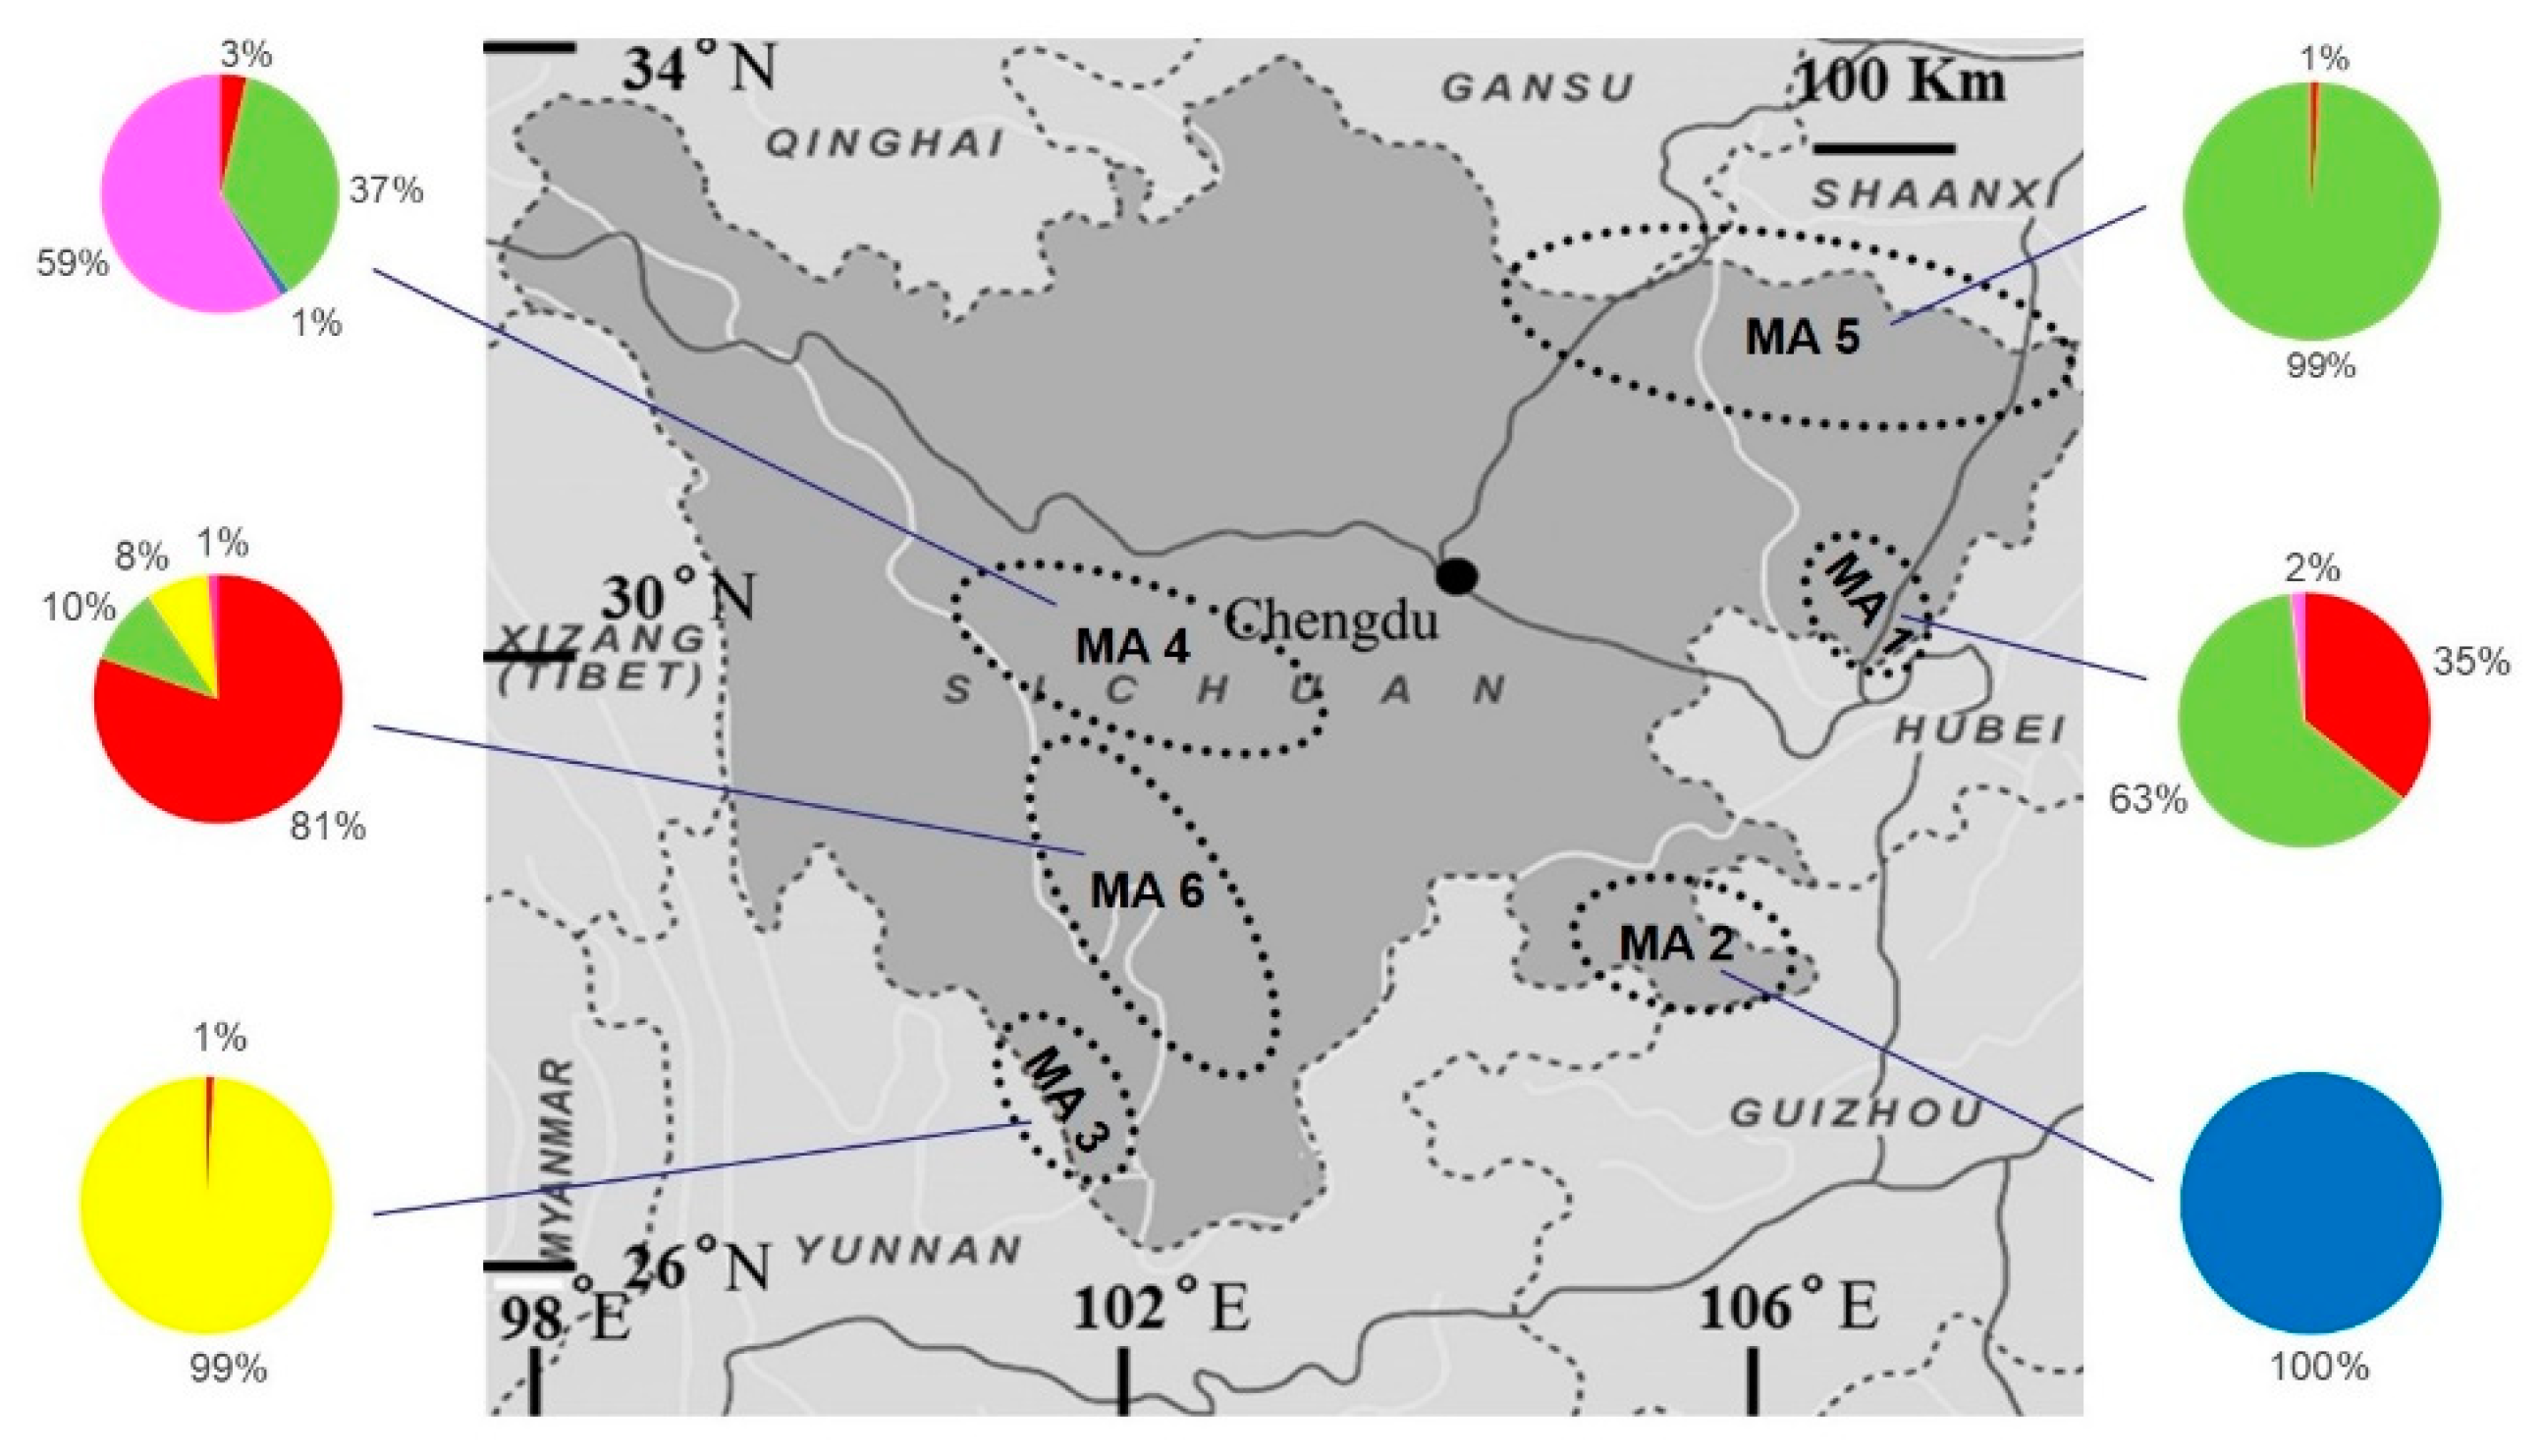
3. Results
4. Discussion
5. Conclusions
Author Contributions
Funding
Conflicts of Interest
References
- Stauct, G. The Species of Fragaria, Their Taxonomy and Geographical Distribution. Available online: http://www.actahort.org/books/265/265_1.htm (accessed on 15 August 2021).
- Guo, R.; Xue, L.; Luo, G.; Zhang, T.; Lei, J. Investigation and taxonomy of wild Fragaria resources in Tibet, China. Genet. Resour. Crop. Evol. 2017, 65, 405–415. [Google Scholar] [CrossRef]
- Lei, J.; Xue, L.; Guo, R.; Dai, H. The Fragaria species native to China and their geographical distribution. Acta Hortic. 2017, 37–46. [Google Scholar] [CrossRef]
- Zhang, J.; Lei, Y.; Wang, B.; Li, S.; Yu, S.; Wang, Y.; Li, H.; Liu, Y.; Ma, Y.; Dai, H.; et al. The high-quality genome of diploid strawberry (Fragaria nilgerrensis) provides new insights into anthocyanin accumulation. Plant Biotechnol. J. 2020, 18, 1908–1924. [Google Scholar] [CrossRef] [PubMed]
- Chao, W.J.; Zhong, X. Studies on resources of wild strawberry in Qing-Ba mountain area. Crop. Var. Resour. 1988, 3, 15–18. [Google Scholar]
- Lei, J.J.; Yang, G.; Dai, H.P.; Wu, L.P.; Deng, M.Q. Strawberry wild resources in China. J. Fruit Sci. 1997, 14, 198–200. [Google Scholar]
- Lei, J.J.; Dai, H.P.; Tan, C.H.; Deng, M.Q.; Zhao, M.Z.; Qian, Y.M. Studies on the taxonomy of the strawberry (Fragaria) species distributed in China. Acta Hortic. Sin. 2006, 33, 1–5. [Google Scholar]
- Qiao, Q.; Xue, L.; Wang, Q.; Sun, H.; Zhong, Y.; Huang, J.; Lei, J.; Zhang, T. Comparative Transcriptomics of Strawberries (Fragaria spp.) Provides Insights into Evolutionary Patterns. Front. Plant Sci. 2016, 7, 1839. [Google Scholar] [CrossRef]
- Rho, I.R.; Hwang, Y.J.; Lee, H.I.; Lee, C.-H.; Lim, K.B. Karyotype analysis using FISH (fluorescence in situ hybridization) in Fragaria. Sci. Hortic. 2012, 136, 95–100. [Google Scholar] [CrossRef]
- Sjulin, T.M.; Dale, A. Genetic Diversity of North American Strawberry Cultivars. J. Am. Soc. Hortic. Sci. 1987, 112, 375–385. [Google Scholar]
- Feng, C.; Wang, J.; Harris, A.J.; Folta, K.M.; Zhao, M.; Kang, M. Tracing the Diploid Ancestry of the Cultivated Octoploid Strawberry. Mol. Biol. Evol. 2021, 38, 478–485. [Google Scholar] [CrossRef]
- Harbut, R.M.; Sullivan, J.A. Breeding Potential of Lower Ploidy Fragaria Species. J. Am. Pom. Soc. 2004, 58, 37–41. [Google Scholar]
- Harbut, R.; Sullivan, J.; Proctor, J. Temperature affects dry matter production and net carbon exchange rate of lower-ploidy Fragaria species and species hybrids. Can. J. Plant Sci. 2010, 90, 885–892. [Google Scholar] [CrossRef]
- Li, H.-W.; Liu, J.-J.; Chen, K.-L.; He, J.; Guan, B.; Wang, J.-H. Investigation and Collection and Evaluation on Wild Strawberry Resources in Sichuan and Neighboring Regions. J. Plant Genet. Resour. 2012, 13, 946–951. [Google Scholar]
- Luo, G.; Xue, L.; Guo, R.; Ding, Y.; Xu, W.; Lei, J. Creating interspecific hybrids with improved cold resistance in Fragaria. Sci. Hortic. 2018, 234, 1–9. [Google Scholar] [CrossRef]
- Park, Y.-J.; Yoon, M.-Y.; Moe, K.T.; Kim, D.-Y.; Rho, I.-R.; Kim, S.; Kim, K.-T.; Won, M.-K.; Chung, J.-W. Genetic diversity and population structure analysis of strawberry (Fragaria x ananassa Duch.) using SSR markers. Electron. J. Biotechnol. 2012, 15. [Google Scholar] [CrossRef]
- Noguchi, Y.; Mochizuki, T.; Sone, K. Breeding of a New Aromatic Strawberry by Interspecific Hybridization Fragaria x ananassa × F. nilgerrensis. J. Jpn. Soc. Hortic. Sci. 2002, 71, 208–213. [Google Scholar] [CrossRef]
- Ma, H.X.; Chen, P.D. Production and cytogentics of interspecific hybrids from the cross of Fragaria nilgerrensis Schlecht. and F. ananassa Duch. Sci. Agric. Sin. 2004, 37, 1966–1970. [Google Scholar]
- Bors, R.; Sullivan, J. Interspecific Hybridization of Fragaria vesca subspecies with F. nilgerrensis, F. nubicola, F. pentaphylla, and F. viridis. J. Am. Soc. Hortic. Sci. 2005, 130, 418–423. [Google Scholar] [CrossRef]
- Sun, J.; Sun, R.; Liu, H.; Chang, L.; Li, S.; Zhao, M.; Shennan, C.; Lei, J.; Dong, J.; Zhong, C.; et al. Complete chloroplast genome sequencing of ten wild Fragaria species in China provides evidence for phylogenetic evolution of Fragaria. Genomics 2021, 113, 1170–1179. [Google Scholar] [CrossRef]
- Edger, P.P.; McKain, M.R.; Yocca, A.E.; Knapp, S.J.; Qiao, Q.; Zhang, T. Reply to: Revisiting the origin of octoploid strawberry. Nat. Genet. 2020, 52, 5–7. [Google Scholar] [CrossRef]
- Chambers, A.; Carle, S.; Njuguna, W.; Chamala, S.; Bassil, N.; Whitaker, V.M.; Barbazuk, W.B.; Folta, K.M. A genome-enabled, high-throughput, and multiplexed fingerprinting platform for strawberry (Fragaria L.). Mol. Breed. 2013, 31, 615–629. [Google Scholar] [CrossRef]
- Yang, Y.; Davis, T.M. A New Perspective on Polyploid Fragaria (Strawberry) Genome Composition Based on Large-Scale, Multi-Locus Phylogenetic Analysis. Genome Biol. Evol. 2017, 9, 3433–3448. [Google Scholar] [CrossRef] [PubMed]
- Iqbal, M.; Shahzad, R.; Shahzad, R.; Bilal, K.; Qaisar, R.; Nisar, A.; Kanwal, S.; Bhatti, M. DNA Fingerprinting of Crops and Its Applications in the Field of Plant Breeding. J. Agric. Res. 2021, 59, 13–28. [Google Scholar]
- Steiger, D.; Nagai, C.; Moore, P.; Morden, C.; Osgood, R.; Ming, R. AFLP analysis of genetic diversity within and among Coffea arabica cultivars. Theor. Appl. Genet. 2002, 105, 209–215. [Google Scholar] [CrossRef] [PubMed]
- Xu, D.H.; Wahyuni, S.; Sato, Y.; Yamaguchi, M.; Tsunematsu, H.; Ban, T. Genetic Diversity and Relationships of Japanese Peach (Prunus persica L.) Cultivars Revealed by AFLP and Pedigree Tracing. Genet. Resour. Crop. Evol. 2006, 53, 883–889. [Google Scholar] [CrossRef]
- Warwick, S.I.; Gugel, R.K.; McDonald, T.M.; Falk, K.C. Genetic Variation of Ethiopian Mustard (Brassica carinata A. Braun) Germplasm in Western Canada. Genet. Resour. Crop. Evol. 2006, 53, 297–312. [Google Scholar] [CrossRef]
- Yang, J.; Qian, Z.-Q.; Liu, Z.-L.; Li, S.; Sun, G.-L.; Zhao, G.-F. Genetic diversity and geographical differentiation of Dipteronia Oliv. (Aceraceae) endemic to China as revealed by AFLP analysis. Biochem. Syst. Ecol. 2007, 35, 593–599. [Google Scholar] [CrossRef]
- Yuan, Z.; Yin, Y.; Qu, J.; Zhu, L.; Li, Y. Population Genetic Diversity in Chinese Pomegranate (Punica granatum L.) Cultivars Revealed by Fluorescent-AFLP Markers. J. Genet. Genom. 2007, 34, 1061–1071. [Google Scholar] [CrossRef]
- Elameen, A.; Fjellheim, S.; Larsen, A.; Rognli, O.A.; Sundheim, L.; Msolla, S.; Masumba, E.; Mtunda, K.; Klemsdal, S.S. Analysis of genetic diversity in a sweet potato (Ipomoea batatas L.) germplasm collection from Tanzania as revealed by AFLP. Genet. Resour. Crop. Evol. 2008, 55, 397–408. [Google Scholar] [CrossRef]
- Li, M. Genetic Diversity and Relationship of Flax Germplasm as Revealed by AFLP Analysis. Acta Agron. Sin. 2011, 37, 635–640. [Google Scholar] [CrossRef]
- Lv, T.; Harris, A.; Liu, Y.; Liu, T.; Liang, R.; Ma, Z.; Su, X. Population genetic structure and evolutionary history of Psammochloa villosa (Trin.) Bor (Poaceae) revealed by AFLP marker. Ecol. Evol. 2021, 11, 10258–10276. [Google Scholar] [CrossRef] [PubMed]
- Graham, J.; McNicol, R.J.; McNicol, J.W. A comparison of methods for the estimation of genetic diversity in strawberry cultivars. Theor. Appl. Genet. 1996, 93, 402–406. [Google Scholar] [CrossRef] [PubMed]
- Benoit, V.; Etienne, C.; Denoyes-Rothan, B. Genetic Diversity of Strawberry Genotypes from Fragaria x Ananassa and F. vesca Revealed by Amplified Fragment Length Polymorphism (AFLP) Analysis. In Proceedings of the 8th Conference, San Diego, CA, USA, 9 January 2000. [Google Scholar]
- Degani, C.; Rowland, L.J.; Saunders, J.A.; Hokanson, S.C.; Ogden, E.L.; Golan-Goldhirsh, A.; Galletta, G.J. A comparison of genetic relationship measures in strawberry (Fragaria × ananassa Duch.) based on AFLPs, RAPDs, and pedigree data. Euphytica 2001, 117, 1–12. [Google Scholar] [CrossRef]
- Tyrka, M.; Dziadczyk, P.; Hortyński, J.A. Simplified AFLP procedure as a tool for identification of strawberry cultivars and advanced breeding lines. Euphytica 2002, 125, 273–280. [Google Scholar] [CrossRef]
- Zhang, Y.T.; Feng, Z.G.; Li, T.Z.; Dong, J.; Wang, G.X.; Zhang, K.C. Genetic Relationships of Strawberry Cultivars by AFLP Analysis. Acta Hortic. Sin. 2006, 33, 1199–1202. [Google Scholar]
- KangHee, C.; IlRae, R.; YongSeop, C.; PueHee, P. Analysis of genetic diversity of strawberry (Fragaria × ananassa Duch.) cultivars using AFLP and SSR markers. Korean J. Breed. Sci. 2007, 39, 447–456. [Google Scholar]
- Njuguna, W. Development and Use of Molecular Tools in Fragaria; Oregon State University: Corvallis, OR, USA, 2010. [Google Scholar]
- Kunihisa, M. Studies Using DNA Markers in Fragaria × ananassa: Genetic Analysis, Genome Structure, and Cultivar Identification. J. Jpn. Soc. Hortic. Sci. 2011, 80, 231–243. [Google Scholar] [CrossRef][Green Version]
- Wang, G.L.; Fang, H.J. Plant Gene Engineering Principles and Techniques; Beijing Science Press: Beijing, China, 1998; pp. 370–375. [Google Scholar]
- Doyle, J.J.; Doyle, J.L. Isolation of Plant DNA from Fesh Tissue. Focus 1990, 12, 13–15. [Google Scholar]
- Vos, P.; Hogers, R.; Bleeker, M.; Reijans, M.; Van De Lee, T.; Hornes, M.; Friters, A.; Pot, J.; Paleman, J.; Kuiper, M.; et al. AFLP: A new technique for DNA fingerprinting. Nucleic Acids Res. 1995, 23, 4407–4414. [Google Scholar] [CrossRef]
- Herrmann, D.; Poncet, B.N.; Manel, S.; Rioux, D.; Gielly, L.; Taberlet, P.; Gugerli, F. Selection criteria for scoring amplified fragment length polymorphisms (AFLPs) positively affect the reliability of population genetic parameter estimates. Genome 2010, 53, 302–310. [Google Scholar] [CrossRef]
- Falush, D.; Stephens, M.; Pritchard, J.K. Inference of population structure using multilocus genotype data: Dominant markers and null alleles. Mol. Ecol. Notes 2007, 7, 574–578. [Google Scholar] [CrossRef] [PubMed]
- Roldàn-Ruiz, I.; Dendauw, J.; Van Bockstaele, E.; Depicker, A.; De Loose, M. AFLP markers reveal high polymorphic rates in ryegrasses (Lolium spp.). Mol. Breed. 2000, 6, 125–134. [Google Scholar] [CrossRef]
- De Riek, J.; Calsyn, E.; Everaert, I.; Van Bockstaele, E.; De Loose, M. AFLP based alternatives for the assessment of Distinctness, Uniformity and Stability of sugar beet varieties. Theor. Appl. Genet. 2001, 103, 1254–1265. [Google Scholar] [CrossRef]
- Dice, L.R. Measures of the Amount of Ecologic Association between Species. Ecology 1945, 26, 297–302. [Google Scholar] [CrossRef]
- Nei, M.; Li, W.-H. Mathematical model for studying genetic variation in terms of restriction endonucleases. Proc. Natl. Acad. Sci. USA 1979, 76, 5269–5273. [Google Scholar] [CrossRef] [PubMed]
- XLSTAT Statistical Data and Data Analysis Solution; Addinsoft: New York, NY, USA, 2021.
- Rohlf, F.J. Exeter Software (Firm) NTSYS-Pc: Numerical Taxonomy and Multivariate Analysis System; Applied Biostatistics, Inc. Exeter Software: Setauket, NY, USA, 2009; ISBN 978-0-925031-31-0. [Google Scholar]
- Falush, D.; Stephens, M.; Pritchard, J.K. Inference of Population Structure Using Multilocus Genotype Data: Linked Loci and Correlated Allele Frequencies. Genetics 2003, 164, 1567–1587. [Google Scholar] [CrossRef]
- Evanno, G.; Regnaut, S.; Goudet, J. Detecting the number of clusters of individuals using the software structure: A simulation study. Mol. Ecol. 2005, 14, 2611–2620. [Google Scholar] [CrossRef]
- Earl, D.A. Structure Harvester: A website and program for visualizing STRUCTURE output and implementing the Evanno method. Conserv. Genet. Resour. 2011, 4, 359–361. [Google Scholar] [CrossRef]
- Pritchard, J.K.; Stephens, M.; Donnelly, P. Inference of population structure using multilocus genotype data. Genetics 2000, 155, 945–959. [Google Scholar] [CrossRef]
- Bonin, A.; Bellemain, E.; Idesen, P.B.; Pompanon, F.; Brochmann, C.; Taberlet, P. How to track and assess genotyping errors in population genetics studies. Mol. Ecol. 2004, 13, 3261–3273. [Google Scholar] [CrossRef]
- Schwarz, G.; Herz, M.; Huang, X.Q.; Michalek, W.; Jahoor, A.; Wenzel, G.; Mohler, V. Application of fluorescence-based semi-automated AFLP analysis in barley and wheat. Theor. Appl. Genet. 2000, 100, 545–551. [Google Scholar] [CrossRef]
- Carrasco, B.; Garcés, M.; Rojas, P.; Saud, G.; Herrera, R.; Retamales, J.B.; Caligari, P.D. The Chilean Strawberry [Fragaria chiloensis (L.) Duch.]: Genetic Diversity and Structure. J. Am. Soc. Hortic. Sci. 2007, 132, 501–506. [Google Scholar] [CrossRef]
- Meng, F.; Liu, L.; Peng, M.; Wang, Z.; Wang, C.; Zhao, Y. Genetic diversity and population structure analysis in wild strawberry (Fragaria nubicola L.) from Motuo in Tibet Plateau based on simple sequence repeats (SSRs). Biochem. Syst. Ecol. 2015, 63, 113–118. [Google Scholar] [CrossRef]
- Lu, J.; Zhang, Y.; Diao, X.; Yu, K.; Dai, X.; Qu, P.; Crabbe, M.J.C.; Zhang, T.; Qiao, Q. Evaluation of Genetic Diversity and Population Structure of Fragaria nilgerrensis using EST-SSR Markers. Gene 2021, 796–797, 145791. [Google Scholar] [CrossRef] [PubMed]


| Mountain Area (MA) Code | Plant Code | Position | Latitude | Longitude | Elevation (m a.s.l) |
|---|---|---|---|---|---|
| MA 1 | PI 40 | E | 30°18′ N | 106°47’E | 1450 |
| PI 41 | E | 30°17′ N | 106°47′ E | 1510 | |
| PI 42 | E | 30°16′ N | 106°47′ E | 1560 | |
| MA 2 | PI 7 | S | 28°12′ N | 105°29′ E | 1454 |
| PI 8 | S | 28°11′ N | 105°43′ E | 1445 | |
| PI 9 | S | 28°11′ N | 105°44′ E | 1368 | |
| PI 10 | S | 28°16′ N | 105°44′ E | 1117 | |
| MA 3 | PI 1 | SW | 26°38′ N | 101°40′ E | 2509 |
| PI 3 | SW | 26°14′ N | 101°43′ E | 2104 | |
| PI 92 | SW | 26°46′ N | 101°31′ E | 2364 | |
| MA 4 | PI 14 | MS | 29°49′ N | 102°11′ E | 1908 |
| PI 15 | MS | 29°42′ N | 102°57′ E | 1486 | |
| PI 16 | MS | 29°41′ N | 102°57′ E | 1718 | |
| PI 18 | MS | 29°38′ N | 102°56′ E | 2698 | |
| PI 25 | MS | 29°32′ N | 103°19′ E | 2835 | |
| PI 27 | MS | 29°31′ N | 103°19′ E | 2850 | |
| PI 28 | MS | 29°31′ N | 103°19′ E | 2878 | |
| PI 30 | MS | 29°31′ N | 103°19′ E | 2901 | |
| PI 32 | MS | 29°32′ N | 103°19′ E | 2950 | |
| PI 33 | MS | 29°32′ N | 103°19′ E | 2963 | |
| PI 34 | MS | 29°32′ N | 103°19′ E | 2983 | |
| PI 36 | MS | 29°32′ N | 103°19′ E | 2991 | |
| PI 37 | MS | 29°32′ N | 103°19′ E | 3013 | |
| PI 38 | MS | 29°32′ N | 103°19′ E | 3030 | |
| PI 39 | MS | 29°32′ N | 103°19′ E | 3051 | |
| MA 5 | PI 50 | NE | 32°50′ N | 104°17′ E | 2906 |
| PI 95 | NE | 32°37′ N | 107°01′ E | 1034 | |
| PI 96 | NE | 32°38′ N | 107°03′ E | 1273 | |
| PI 97 | NE | 32°39′ N | 107°04′ E | 1614 | |
| PI 98 | NE | 32°39′ N | 106°03′ E | 1761 | |
| PI 99 | NE | 32°39′ N | 107°02′ E | 1865 | |
| PI 104 | NE | 32°09′ N | 108°13′ E | 1105 | |
| MA 6 | PI 5 | SW | 27°34′ N | 102°25′ E | 2116 |
| PI 6 | SW | 27°34′ N | 102°25′ E | 2273 | |
| PI 11 | SW | 28°28′ N | 102°25′ E | 2949 | |
| PI 12 | SW | 28°41′ N | 102°31′ E | 1671 | |
| PI 13 | SW | 29°14′ N | 102°16′ E | 1749 |
| Name | Sequence (5′→3′) |
|---|---|
| EcoRI adaptor I | CTCGTAGACTGCGTACC |
| EcoRI adaptor II | AATTGGTACGCAGTC |
| MseI adaptor I | GACGATGAGTCCTGAG |
| MseI adaptor II | TACTCAGGACTCAT |
| Primers for preamplification | |
| EcoRI+A | GACTGCGTACCAATTC+A * |
| MseI+C | GATGAGTCCTGAGTAA+C * |
| Primers for selective amplification | E+AAG/M+CAC |
| (EcoRI-/MseI- primer combination) | E+AAG/M+CTA |
| E+ACA/M+CAG | |
| E+ACC/M+CTT | |
| E+AGA/M+CAT | |
| E+AGT/M+CAG |
| AFLP Primer Combination | Total Number of Fragments | Number and Percentage (%) of Polymorphic Fragments | PIC |
|---|---|---|---|
| E a+AAG/M b+CAC | 206 | 124 (60.2%) | 0.30 |
| E+AGT/M+CAG | 244 | 165 (67.6%) | 0.28 |
| E+AGA/M+CAT | 245 | 182 (74.3%) | 0.26 |
| E+ACC/M+CTT | 210 | 130 (61.9%) | 0.27 |
| E+AAG/M+CTA | 190 | 105 (55.3%) | 0.29 |
| E+ACA/M+CAG | 207 | 112 (54.1%) | 0.31 |
| Total | 1302 | 818 | - |
| Average | 217 | 136.3 (62.8%) | 0.29 |
Publisher’s Note: MDPI stays neutral with regard to jurisdictional claims in published maps and institutional affiliations. |
© 2021 by the authors. Licensee MDPI, Basel, Switzerland. This article is an open access article distributed under the terms and conditions of the Creative Commons Attribution (CC BY) license (https://creativecommons.org/licenses/by/4.0/).
Share and Cite
Li, H.; Bolarić, S.; Vokurka, A.; He, J.; Wang, D.; Li, X.; Mešić, A.; Wang, J.; Duralija, B. Genetic Variability and Structure of Fragaria nilgerrensis Schlecht. Germplasm in Sichuan Province. Horticulturae 2021, 7, 353. https://doi.org/10.3390/horticulturae7100353
Li H, Bolarić S, Vokurka A, He J, Wang D, Li X, Mešić A, Wang J, Duralija B. Genetic Variability and Structure of Fragaria nilgerrensis Schlecht. Germplasm in Sichuan Province. Horticulturae. 2021; 7(10):353. https://doi.org/10.3390/horticulturae7100353
Chicago/Turabian StyleLi, Hongwen, Snježana Bolarić, Aleš Vokurka, Jian He, Dong Wang, Xufeng Li, Aleksandar Mešić, Jianhui Wang, and Boris Duralija. 2021. "Genetic Variability and Structure of Fragaria nilgerrensis Schlecht. Germplasm in Sichuan Province" Horticulturae 7, no. 10: 353. https://doi.org/10.3390/horticulturae7100353
APA StyleLi, H., Bolarić, S., Vokurka, A., He, J., Wang, D., Li, X., Mešić, A., Wang, J., & Duralija, B. (2021). Genetic Variability and Structure of Fragaria nilgerrensis Schlecht. Germplasm in Sichuan Province. Horticulturae, 7(10), 353. https://doi.org/10.3390/horticulturae7100353