Abstract
Matrix-assisted laser-desorption and ionization time-of-flight mass spectroscopy (MALDI-TOF MS) is a flexible technique for the analysis of protein-containing biological samples. Simple and inexpensive methods have previously been developed for MALDI-TOF MS sample preparation that are able to discriminate between Impatiens species that are closely related and also between regional biotypes of the invasive weed Impatiens glandulifera (Himalayan balsam) with leaf material and also seed material. The current article investigates whether MALDI-TOF MS, through acid-soluble protein ‘fingerprinting’, can be used to analyze plant seeds that result from intensive commercial plant-breeding activity. As an initial proof-of-concept study, tomato seeds from eleven seed-catalogue varieties (F1 Pink Baby Plum, F1 Fantasio, F1 Lizzano, F1 Sungold, F1 Tumbler, Faworyt, Golden Sunrise, Hundreds and Thousands, Indigo Rose, Moneymaker, and Red Alert), listed as Solanum lycopersicum or under the synonym Lycopersicon esculentum were analyzed using MALDI-TOF MS. Whilst peak-rich and highly-reproducible spectra were obtained, with very high Bruker comparison scores and low MALDI-TOF MS variance, sample-preparation variance, and seed-to-seed variance, the spectral differences between varieties were only slightly greater than the above combined variances, indicating very close similarity between all eleven varieties studied. These results are discussed in comparison with those previously observed with the naturally-evolving invasive species I. glandulifera.
1. Introduction
Matrix-assisted laser-desorption and ionization time-of-flight mass spectroscopy (MALDI-TOF MS) is well established as a laboratory technique for analyzing protein-containing samples, with the notable advantage that it is both rapid and particularly inexpensive in terms of reagent usage and the time required for sample processing. In MALDI-TOF MS, the MALDI soft-ionization process [1] allows proteins to be desorbed that are intact in the gas phase and which also mostly carry a single positive charge [2]. The time-of-flight of a charged protein along a tube held at high vacuum, after it has been accelerated in an electrical field, is proportional to the square root of the mass-over-charge ratio for the particular protein and, from this relationship, a mass spectrum can be generated from the time-of-flight values of the protein components within a particular biological sample [3]. The mass spectrum of a subset of the proteome (normally the highly expressed acid-soluble proteins [4]) is frequently employed for the identification and/or characterization of materials of interest.
The majority of MALDI-TOF MS sample-preparation methods developed to date that are based upon acid-soluble protein ‘fingerprinting’ [3,5,6,7] result from activities directed towards human clinical microbiology, particularly the diagnosis of bacterial and yeast infections [4]. Many of the above methods are not, however, particularly well-suited to work with plant materials [8] and so Reeve et al. have developed an inexpensive and simple method for MALDI-TOF MS sample preparation that can be applied to bacteria, fungi, insects, and plants [9,10]. Using the above method, Reeve et al. [10] have discriminated, using leaf material, between a number of closely-related Impatiens species, and also between four regional biotypes of Impatiens glandulifera originating from within the UK that have different susceptibility to the biological control agent Himalayan balsam rust (Puccinia komarovii var. glanduliferae). Still with a focus on optimizing the matching of biological control agents to susceptible (regional) target-plant biotypes but extending the scope of the method to include seed material, Reeve and Pollard [11] have also developed a simple and inexpensive method that generates highly-reproducible peak-rich MALDI-TOF MS spectra of acid-soluble seed proteins, and have been able to discriminate successfully between the same four regional biotypes of I. glandulifera. This latter method extracts acid-soluble seed proteins in 100 µL of acetonitrile/TFA/water/matrix, followed by further dilution (ideally 20-fold to 100-fold) in the same reagent in order to obtain high-quality spectra.
Whilst focusing on optimizing the matching of biological control agents to susceptible (regional) target-plant biotypes, the above studies demonstrate the high resolving power of MALDI-TOF MS. Given such resolving power (capable of discriminating between regional biotypes within a single species) in combination with a very simple and inexpensive sample-preparation methodology, the current article investigates whether MALDI-TOF MS can be applied to the analysis of plant seeds that, rather than evolving naturally in the field, result from intensive commercial plant-breeding activity. The intention was to investigate whether MALDI-TOF MS could provide a useful means for discriminating between seeds and could perhaps provide molecular-weight markers that could be linked to beneficial traits, thereby potentially enabling seed selection eventually without recourse to growing plants to maturity. As an initial proof-of-concept study, seeds from tomato (Solanum lycopersicum L., synonym Lycopersicon esculentum Mill.), with eleven varieties sourced from a commercial on-line seed catalogue [12], were analyzed by MALDI-TOF MS. The seeds were selected in order to incorporate as much morphological and pigmentation diversity as possible, ranging in size from ‘cherry’ to ‘beefsteak’ morphologies; ranging in pigmentation across yellow, orange, red, pink, and purple/black; and incorporating both trailing and standard growth forms. The results obtained are compared with those previously observed with the naturally-evolving invasive species I. glandulifera.
2. Materials and Methods
Seeds for listed S. lycopersicum or L. esculentum varieties F1 Pink Baby Plum, F1 Fantasio, F1 Lizzano, F1 Sungold, F1 Tumbler, Faworyt, Golden Sunrise, Hundreds and Thousands, Indigo Rose, Moneymaker, and Red Alert were purchased from Suttons Seeds (Paignton, UK).
≥98% (TLC-grade) α-cyano-4-hydroxycinnamic acid (HCCA) matrix, LC-MS-grade acetonitrile, 99% ReagentPlus®-grade TFA, and mass-spectrometry grade (50% (v/v) acetonitrile, 2.5% (v/v) TFA, and 47.5% (v/v) water) were purchased from Sigma (Gillingham, UK). CHROMASOLVTM LC-MS-grade water was purchased from Fluka (Loughborough, UK).
Single seeds were initially macerated in 100 µL of (50% (v/v) acetonitrile, 2.5% (v/v) TFA, and 47.5% (v/v) water) using the blunt end of a plastic inoculating loop. Seed debris was then pelleted by centrifugation at 14,100 g for one minute in a miniSpin® plus centrifuge (Eppendorf, Stevenage, UK). One microliter of supernatant was mixed with 100 µL of (11 mg/mL HCCA matrix in 65% (v/v) acetonitrile, 2.5% (v/v) TFA, and 32.5% (v/v) water), and 1 µL was then pipetted onto the Bruker sample plate, air dried, and loaded into the spectrometer.
Mass spectrometry covering the range 2 kDa to 20 kDa was carried out using a Bruker Microflex LT linear-mode instrument running the MALDI Biotyper 4.0 applications (Bruker Daltonik, Bremen, Germany), using a 60 Hz frequency and 3 ns pulse-duration nitrogen laser (70 µJ, with maximum output 225 µJ), with a wavelength of 337 nm and spot size of 100 µm, with 240 laser shots per sample. The laser settings were Global Attenuator Offset (0%), Attenuator Offset (25%), and Attenuator Range (30%), and the ion-source voltage was 19.98 kV. Bruker MBT Biotarget 96 plates (Bruker ref. 1840375) were used for all samples in this study. Calibration was carried out using the manufacturer’s ‘BTS’ controls (Escherichia coli proteins supplemented with ribonuclease A and myoglobin), using peaks with masses at 3637.8; 5096.8; 5381.4; 6255.4; 7274.5; 10,300.2; 13,683.2, and 16,952.3 for calibration according to the manufacturer’s instructions. Spectra were acquired using MALDI Biotyper RTC Version 4.0 (Build 19) using the manufacturer’s standard settings (Centroid peak-detection algorithm and TopHat baseline subtraction). Database entries were made as single-spectra MSPs using the Bruker Online Client software suite (Version 4.0.19, Bruker Daltonik, Bremen, Germany), again using the manufacturer’s standard settings. For spectral comparisons, Bruker identification scores were derived using the standard Bruker algorithm. This first converts raw mass spectra into peak lists, which are then compared between spectra. Three separate values are computed: the number of peaks in the reference spectrum that have a closely-matching partner in the test spectrum (value range 0–1), the number of peaks in the test spectrum that have a closely-matching partner in the reference spectrum (value range 0–1), and the peak-height symmetry of the matching peaks (value range 0–1). The above three values are multiplied together and normalized to 1000, and the base-10 logarithm is then taken to give the final Bruker score (range 0–3). Bruker scores of scores between 2.3 and 3.0 indicate very close relatedness, scores between 2.0 and 2.3 indicate close relatedness, and scores below 1.7 indicate low relatedness.
Triplicate ‘reference’ sample preparations were carried out as indicated for each of the seed varieties, from which a database of reference spectra was generated. For spectral comparison, triplicate ‘test’ samples for each variety were compared against the database of reference spectra and Bruker identification scores were generated as described above. These were then averaged for each of the reference-sample variety samples, with results shown as the mean and error bars depicting one standard deviation either side of the mean.
3. Results
Figure 1 shows the acid-soluble seed-protein MALDI-TOF MS spectra from triplicate test-sample seeds and triplicate reference-sample seeds for S. lycopersicum/L. esculentum varieties F1 Pink Baby Plum, F1 Fantasio, F1 Lizzano, F1 Sungold, F1 Tumbler, Faworyt, Golden Sunrise, Hundreds and Thousands, Indigo Rose, Moneymaker, and Red Alert.
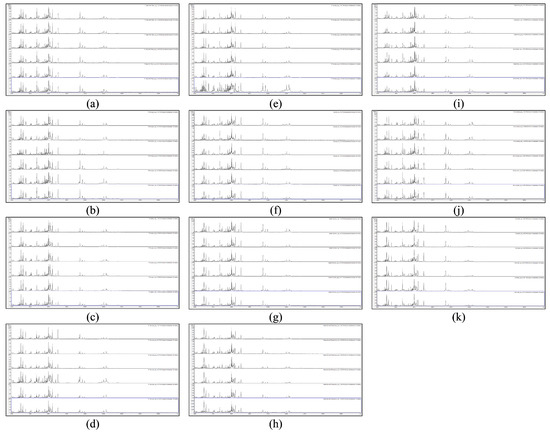
Figure 1.
Acid-soluble seed-protein MALDI-TOF MS spectra from triplicate test-sample seeds (top) and triplicate reference-sample seeds (bottom) for S. lycopersicum/L. esculentum varieties (a) F1 Pink Baby Plum, (b) F1 Fantasio, (c) F1 Lizzano, (d) F1 Sungold, (e) F1 Tumbler, (f) Faworyt, (g) Golden Sunrise, (h) Hundreds and Thousands, (i) Indigo Rose, (j) Moneymaker, and (k) Red Alert.
As can be seen from Figure 1, peak-rich and very reproducible MALDI-TOF MS spectra were obtained from all six replicates of all eleven varieties. Table 1 shows the average Bruker scores against triplicate reference spectra for the test-samples for S. lycopersicum/L. esculentum varieties F1 Pink Baby Plum, F1 Fantasio, F1 Lizzano, F1 Sungold, F1 Tumbler, Faworyt, Golden Sunrise, Hundreds and Thousands, Indigo Rose, Moneymaker, and Red Alert.

Table 1.
Average Bruker scores against triplicate reference spectra for the test-samples for S. lycopersicum/L. esculentum varieties F1 Pink Baby Plum, F1 Fantasio, F1 Lizzano, F1 Sungold, F1 Tumbler, Faworyt, Golden Sunrise, Hundreds and Thousands, Indigo Rose, Moneymaker, and Red Alert.
Table 1 shows very high Bruker scores (with a maximum value of 2.742, a minimum value of 2.450, an average value of 2.643, and a standard deviation of 0.052) for all 363 spectral comparisons. In only 15 of 33 cases (45%), however, was the highest average Bruker score that of the correct variety. From the data in Table 1, average values for each test-sample variety were calculated, and these are shown in Figure 2 and Figure 3. Error bars indicate one standard deviation either side of the mean.
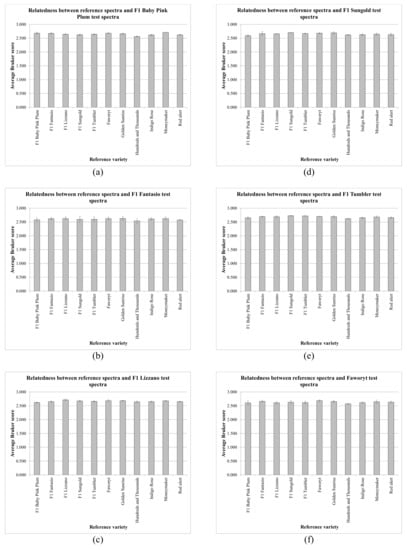
Figure 2.
Average values from the data in Table 1 for each test-sample variety, where the error bars indicate one standard deviation either side of the mean, for S. lycopersicum/L. esculentum varieties (a) F1 Pink Baby Plum, (b) F1 Fantasio, (c) F1 Lizzano, (d) F1 Sungold, (e) F1 Tumbler, and (f) Faworyt.
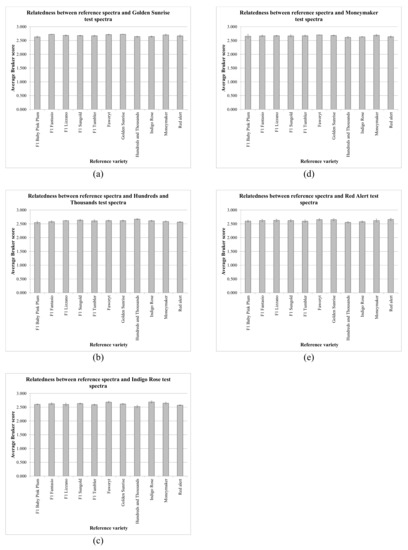
Figure 3.
Average values from the data in Table 1 for each test-sample variety, where the error bars indicate one standard deviation either side of the mean, for S. lycopersicum/L. esculentum varieties (a) Golden Sunrise, (b) Hundreds and Thousands, (c) Indigo Rose, (d) Moneymaker, and (e) Red Alert.
Figure 2 and Figure 3 show that, for all 121 spectral comparisons, the average Bruker scores obtained were consistently very high, with low variance, but the spectra of the various S. lycopersicum/L. esculentum varieties were very closely related. In order to assess the variance of the MALDI-TOF MS process, one sample (Faworyt replicate 1) was pipetted six times onto the sample plate. Using the first three replicates as reference samples and the second three replicates as test samples, the average Bruker score obtained was 2.756 (from individual scores 2.750, 2.766, and 2.752), with a standard deviation of 0.009. Expressing variance as CV (coefficient of variance), defined as the percentage (100*standard deviation/mean), the CV for the MALDI-TOF MS process is 0.327%. Table 2 shows CVs for the variance, for each variety, of the MALDI-TOF MS process combined with the variance between sample preparations and the variance between individual seeds within each variety.
Table 2.
Variance, expressed as CV = (100*standard deviation/mean) for each variety, of the MALDI-TOF MS process combined with the variance between sample preparations and the variance between individual seeds within each variety.
The CVs in Table 2 range between a maximum value of 1.618 (F1 Fantasio) and a minimum value of 0.148 (Golden Sunrise), with an average CV of 0.966%, implying that the average value for variance between sample preparations combined with variance between individual seeds was 0.966%−0.327% = 0.639%. For the entire set of comparisons between varieties, the average Bruker score was 2.639, with a standard deviation of 0.041. The average CV for all such comparisons was therefore 1.562%, the significance of which will be discussed below.
4. Discussion
Numerous analytical techniques are available for the characterization of and/or comparison between biological samples. Nucleic-acid-based techniques include DNA barcoding [13,14] and next-generation sequencing [15], in particular reversible-terminator sequencing [16,17] and nanopore sequencing [18,19]. Many proteome-analytical techniques [20], reviewed in [21], are also available. From the above, MALDI-TOF MS-based ‘fingerprinting’ of acid-soluble proteins has been selected because inexpensive and rapid methods have been developed for sample preparation [9] that can discriminate, using leaf samples, between closely-related species and between regional biotypes within a species [10]. Similar discrimination has also been demonstrated using seed material [11]. Given such resolving power, in combination with inexpensive and cheap sample-preparation methodology, an interesting and potentially-beneficial extrapolation was to investigate whether MALDI-TOF MS-based ‘fingerprinting’ of acid-soluble proteins can be applied to the analysis of plant seeds that result from intensive commercial plant-breeding activity, with the intention of investigating whether this could eventually provide easily-derived and inexpensive molecular-weight markers that could perhaps be linked to beneficial traits, thereby potentially enabling seed selection on this basis.
For the MALDI-TOF MS analysis of seed material, Reeve and Pollard [11] describe the extraction of acid-soluble seed proteins in 100 µL of acetonitrile/TFA/water/matrix, followed by further dilution (ideally 20-fold to 100-fold) in the same reagent in order to obtain high-quality spectra. In the current article, this method has been slightly modified, with the initial extraction carried out in (50% (v/v) acetonitrile, 2.5% (v/v) TFA, and 47.5% (v/v) water), which is readily available pre-formulated, and which reduces the usage of MALDI matrix.
As an initial proof-of-concept study, seeds from tomato (S. lycopersicum/L. esculentum) were chosen for analysis by MALDI-TOF MS, with varieties sourced from a commercial on-line seed catalogue [12]. Tomato was chosen because this crop spans both commercial agriculture and domestic gardening/food production, and the varieties chosen (F1 Pink Baby Plum, F1 Fantasio, F1 Lizzano, F1 Sungold, F1 Tumbler, Faworyt, Golden Sunrise, Hundreds and Thousands, Indigo Rose, Moneymaker, and Red Alert) were selected so as to incorporate a wide range of the morphological and pigmentation diversity found within this species (ranging in size from ‘cherry’ to ‘beefsteak’ morphologies; ranging in pigmentation across yellow, orange, red, pink, and purple/black; and incorporating both trailing and standard growth forms).
Peak-rich and highly-reproducible MALDI-TOF MS spectra were obtained from all six replicates of all eleven varieties. The high spectral quality obtained using this method with seed material is further supported by the data in Table 1, which shows very high Bruker scores (with a maximum value of 2.742, a minimum value of 2.450, an average value of 2.643, and a standard deviation of 0.052) for all 363 spectral comparisons. The data presented in Figure 2 and Figure 3 also show very high average Bruker scores, with low variance.
In spite of the high quality of the spectra obtained, however, in only 15 of 33 cases (45%) was the highest average Bruker score generated that of the correct variety. Whilst the data presented in Figure 2 and Figure 3 indicates very high average Bruker scores with low variance, the very close spectral similarity between the varieties was also evident, posing the question of whether varietal discrimination is possible, requiring that the spectral variance between varieties is significantly greater than sources of technical variance (the MALDI-TOF MS process and the sample-preparation procedure) and biological seed-to-seed variance within each variety. Expressing variance as CV (coefficient of variance), the CV for the MALDI-TOF MS process was found to be 0.327%, and the average variance between sample preparations combined with the variance between individual seeds was found to be 0.639%, indicating a combined variance of 0.966%. Given that the average CV for all inter-varietal comparisons was found to be 1.562%, this is only slightly greater than the combined technical and seed-to-seed CV of 0.966%, which provides a ready explanation for the above identification results.
It is interesting to compare the above with previous studies focused on the invasive weed I. glandulifera, where discrimination between regional biotypes within the species has been demonstrated using both leaf and seed material [10,11], despite working with field-sourced materials. For I. glandulifera seeds collected from the field at four different sites within the UK, the CV for the combined MALDI-TOF MS, sample-preparation, and seed-to-seed variance was 7.539% (largely because seeds collected derive from a wild population of plants growing under uncontrolled conditions) but, for all inter-biotypical comparisons, the average Bruker score was 1.530, with a standard deviation of 0.327. The average CV for all such comparisons was therefore 21.373%, which was significantly greater than the above figure of 7.539%, thereby allowing discrimination between regional biotypes.
Whilst seed-to-seed variance was relatively high with I. glandulifera, the spectral variance for acid-soluble seed proteins between regional biotypes within the species was large. In sharp contrast, for the eleven varieties of S. lycopersicum/L. esculentum studied, seed-to-seed variance was very low but spectral variance for acid-soluble seed proteins between varieties was also comparably low, despite these varieties resulting from intensive plant-breeding efforts aimed at diversifying morphology, disease resistance, pigmentation, nutrition, and flavor. It is possible that, in spite of such breeding efforts, only a limited repertoire of genes linked to key desirable traits have been altered and then selected for, and that these may not be expressed (or genetically linked with genes that are expressed) in seeds. Another possibility is that changes resulting from plant breeding are not represented in the acid-soluble fraction of seed proteins, which forms the basis of the above MALDI-TOF MS analysis. Alternatively, or perhaps in addition, invasive species such as I. glandulifera may evolve unusually rapidly as they invade new ecosystems, or they may be the result of separate introductions and/or invasions.
In conclusion, using the exquisite resolving power of MALDI-TOF MS in combination with very simple and inexpensive sample-preparation methodology, MALDI-TOF MS-based acid-soluble protein ‘fingerprinting’ analysis has been carried out on plant seeds that result from intensive commercial plant-breeding activity. As an initial proof-of-concept study, S. lycopersicum/L. esculentum seeds from a commercial seed catalogue were analyzed. Whilst peak-rich and highly-reproducible spectra were obtained, with very high Bruker comparison scores and low MALDI-TOF MS, sample-preparation, and seed-to-seed variance, the spectral differences between varieties were only slightly greater than the above combined variances, indicating very close similarity between all eleven varieties studied, a result that is in sharp contrast with those previously observed with regional biotypes from within the naturally-evolving invasive species I. glandulifera.
Funding
The Bruker Microflex mass spectrometer and time spent on these studies was kindly funded by Crop Health and Protection Limited (CHAP).
Acknowledgments
CABI is an international, intergovernmental organization and we gratefully acknowledge the core financial support from our member countries (and lead agencies) including the United Kingdom (Department for International Development), China (Chinese Ministry of Agriculture), Australia (Australian Centre for International Agricultural Research), Canada (Agriculture and Agri-Food Canada), Netherlands (Directorate-General for International Cooperation), and Switzerland (Swiss Agency for Development and Cooperation). See https://www.cabi.org/about-cabi/who-we-work-with/key-donors/ for full details.
Conflicts of Interest
The author declares no conflicts of interest.
References
- Karas, M.; Bachmann, D.; Hillenkamp, F. Influence of the wavelength in high-irradiance ultraviolet laser desorption mass spectrometry of organic molecules. Anal. Chem. 1985, 57, 2935–2939. [Google Scholar] [CrossRef]
- Knochenmuss, R. Ion formation mechanisms in UV-MALDI. Analyst 2006, 131, 966–986. [Google Scholar] [CrossRef] [PubMed]
- Clark, A.E.; Kaleta, E.J.; Arora, A.; Wolk, D.M. Matrix-assisted laser desorption ionization–time of flight mass spectrometry: A fundamental shift in the routine practice of clinical microbiology. Clin. Microbiol. Rev. 2013, 26, 547–603. [Google Scholar] [CrossRef] [PubMed]
- Singhal, N.; Kumar, M.; Kanaujia, P.K.; Virdi, J.S. MALDI-TOF mass spectrometry: An emerging technology for microbial identification and diagnosis. Front. Microbiol. 2015, 6, 791. [Google Scholar] [CrossRef] [PubMed]
- Fraser, M.; Brown, Z.; Houldsworth, M.; Borman, A.M.; Johnson, E.M. Rapid identification of 6328 isolates of pathogenic yeasts using MALDI-ToF MS and a simplified rapid extraction procedure that is compatible with the Bruker Biotyper platform and database. Med. Mycol. 2016, 54, 80–88. [Google Scholar] [CrossRef] [PubMed]
- Bader, O. MALDI-TOF-MS-based species identification and typing approaches in medical mycology. Proteomics 2013, 13, 788–799. [Google Scholar] [CrossRef] [PubMed]
- Cassagne, C.; Ranque, S.; Normand, A.C.; Fourquet, P.; Thiebault, S.; Planard, C.; Hendrickx, M.; Piarroux, R. Mould routine identification in the clinical laboratory by matrix-assisted laser desorption ionization time-of-flight mass spectrometry. PLoS ONE 2011, 6, e28425. [Google Scholar] [CrossRef] [PubMed]
- Mehta, A.; Silva, L.P. MALDI-TOF MS profiling approach: How much can we get from it? Front. Plant Sci. 2015, 6, 184. [Google Scholar] [CrossRef] [PubMed]
- Reeve, M.A.; Buddie, A.G.; Pollard, K.M.; Varia, S.; Seier, M.K.; Offord, L.C.; Cock, M.J.W. A highly-simplified and inexpensive MALDI-TOF mass spectrometry sample-preparation method with broad applicability to microorganisms, plants, and insects. J. Biol. Methods 2018, 5, e103. [Google Scholar] [CrossRef]
- Reeve, M.A.; Pollard, K.M.; Kurose, D. Differentiation between closely-related Impatiens spp. and regional biotypes of Impatiens glandulifera using a highly-simplified and inexpensive method for MALDI-TOF MS. Plant Methods 2018, 14, 60. [Google Scholar] [CrossRef] [PubMed]
- Reeve, M.A.; Pollard, K.M. Discrimination between regional biotypes of Impatiens glandulifera using a simple MALDI-TOF MS-based method for use with seeds. Plant Methods 2019, 15, 25. [Google Scholar] [CrossRef] [PubMed]
- Tomato Seeds. Available online: https://www.suttons.co.uk/Gardening/Vegetable+Seeds/Popular+Vegetable+Seeds/Tomato+Seeds/list.htm (accessed on 19 December 2018).
- Hebert, P.D.N.; Cywinska, A.; Ball, S.L.; deWaard, J.R. Biological identifications through DNA barcodes. Proc. R. Soc. Lond. Ser. B Biol. Sci. 2003, 270, 313–332. [Google Scholar] [CrossRef] [PubMed]
- Chase, M.W.; Soltis, D.E.; Olmstead, R.G.; Morgan, D.; Les, D.H.; Mishler, B.D.; Duvall, M.R.; Price, R.A.; Hills, H.G.; Qiu, Y.L.; et al. Phylogenetics of seed plants: An analysis of nucleotide sequences from the plastid gene rbcL. Ann. MO Bot. Gard. 1993, 80, 528–580. [Google Scholar] [CrossRef]
- Bentley, D.R. Whole-genome re-sequencing. Curr. Opin. Genet. Dev. 2006, 16, 545–552. [Google Scholar] [CrossRef] [PubMed]
- Canarda, B.; Sarfati, R.S. DNA polymerase fluorescent substrates with reversible 3-tags. Gene 1994, 148, 1–6. [Google Scholar] [CrossRef]
- Bentley, D.R.; Balasubramanian, S.; Swerdlow, H.P.; Smith, G.P.; Milton, J.; Brown, C.G.; Hall, K.P.; Evers, D.J.; Barnes, C.L.; Bignell, H.R.; et al. Accurate Whole Human Genome Sequencing using Reversible Terminator Chemistry. Nature 2008, 456, 53–59. [Google Scholar] [CrossRef] [PubMed]
- Stoddart, D.; Maglia, G.; Mikhailova, E.; Heron, A.J.; Bayley, H. Multiple base-recognition sites in a biological nanopore: Two heads are better than one. Angew Chem. Int. Ed. 2010, 49, 556–559. [Google Scholar] [CrossRef] [PubMed]
- Manrao, E.A.; Derrington, I.M.; Pavlenok, M.; Niederweis, M.; Gundlach, J.H. Nucleotide Discrimination with DNA Immobilized in the MspA Nanopore. PLoS ONE 2011, 6, e25723. [Google Scholar] [CrossRef] [PubMed]
- James, P. Protein identification in the post-genome era: The rapid rise of proteomics. Q. Rev. Biophys. 1997, 30, 279–331. [Google Scholar] [CrossRef] [PubMed]
- Aslam, B.; Basit, M.; Nisar, M.A.; Khurshid, M.; Rasool, M.H. Proteomics: Technologies and Their Applications. J. Chromatogr. Sci. 2017, 55, 182–196. [Google Scholar] [CrossRef] [PubMed]
© 2019 by the author. Licensee MDPI, Basel, Switzerland. This article is an open access article distributed under the terms and conditions of the Creative Commons Attribution (CC BY) license (http://creativecommons.org/licenses/by/4.0/).