Article

Vermiliquer (Vermicompost Leachate) as a Complete Liquid Fertilizer for Hydroponically-Grown Pak Choi (Brassica chinensis L.) in the Tropics

by
Elena V. Churilova
and
David J. Midmore
*,‡
School of Health, Medical and Applied Sciences, Central Queensland University, Rockhampton, QLD 4702, Australia
*
Author to whom correspondence should be addressed.
Current Address: Water Management and Use, Department of Natural Resources and Mines, Queensland Government, 209 Bolsover Street, Rockhampton, QLD 4700, Australia.
Current Address: School of Agriculture, Policy and Development, University of Reading, Earley Gate, Whiteknights Road, Reading RG6 6AR, UK.
Horticulturae 2019, 5(1), 26; https://doi.org/10.3390/horticulturae5010026
Submission received: 5 November 2018 / Revised: 25 February 2019 / Accepted: 6 March 2019 / Published: 15 March 2019

Abstract

:
The processing of organic wastes and composts by worms results in castes and vermiliquer (i.e., vermicompost leachate). Both castes and vermiliquer contain plant available nutrients, the latter better suited to hydroponic operations, but the optimum pH for worm productivity and vermiliquer production makes the latter too alkaline for hydroponics. We show that under optimal hydroponic management practices, the growth and yield of pak choi (Brassica chinensis) based entirely on pH buffered vermiliquer collected after 8–10 weeks of vermicomposting was comparable with those treated with a conventional inorganic hydroponic fertiliser. Nitric acid proved to be a superior pH buffer compared with orthophosphoric acid. The total fresh weight in the nitric acid buffered vermiliquer treatments ranged from 70% to 98% of the total fresh weight of the control. However, the non-buffered hydroponic production of pak choi using off-line (batch) vermiliquer or direct linkage with vermifarms was not successful. There were no statistically significant differences between pak choi yields using vermiliquer from kitchen wastes or composted paunch materials. A 50% dilution of vermiliquer led to yield loss, but less proportionately than the dilution, and the use of pot hydroponics rather than nutrient film technique (NFT) hydroponics led to a better performance of pak choi under less favourable conditions. This is the first report of comparable yields between vermiliquer treatments and an inorganic nutrient source and highlights the feasibility and commercial potential of this hydroponic practice.

Graphical Abstract

1. Introduction

The benefits of using traditional vermicompost products, such as worm casts, in agriculture have been well documented [1]. Another less researched product of vermiculture, vermiliquer (vermicompost leachate, also known colloquially as ‘worm tea’), is a nutrient-enriched liquid that drains through worm-beds containing vermicomposted wastes, bedding materials and worm populations. Vermiliquer has been reported to be rich in nutrients required for plant growth and positively influences growth and mineral uptake by plants [2,3,4]. Besides much organic and inorganic material dissolved in water, vermiliquer contains complex micro-biota, plant growth regulators and humic acids [5,6].
These and other reports suggest that for maximum plant growth nutrient solutions derived from compost and manure products, including vermiliquer, may need to be (a) amended through pH adjustment (generally downward), (b) diluted, (c) supplemented with nutrients and (d) even desalinated, both in soil culture [2,6,7] and soilless culture [3,8,9]. The need for adjusting pH downwards in nutrient solutions derived from aquaculture has also been reported [10], although those from compost and manure products generally are of higher electrical conductivity (EC) and nutrient concentrations than those from aquaculture. Further, high pH may, besides impacting nutrient availability, also lead to ammonia toxicity, especially at high EC [8] and high pH [11]. Set against this need to counteract alkalinity is the tendency for C mineralisation and soil respiration to decline with lower pH [12], with possible concomitant reductions in the availability of inorganic nutrients in the solution, particularly NO3 which is better microbially transformed from NH4 at high pH.
The high productivity of hydroponic systems reflects the farmer’s ability to provide plants with optimal conditions for growth. These include water and nutrients (and the concentration of the nutrient solution), as well as temperature and oxygen, which have profound effects on the processes of transpiration, nutrient uptake and photosynthesis [13]. The best growth rates are achieved when the plants are exposed to their optimal night and day air temperatures, which range from 5 °C to 25 °C for temperate vegetable species such as potato (Solanum tuberosum L.) to 12 °C–15 °C to 35 °C for tropical species such as bitter melon (Momordica charantia L.) [14]. A high ambient temperature promotes some detrimental biochemical and morphological changes in temperate vegetable species [15]. In heading Chinese cabbage (Brassica rapa L. ssp. pekinensis), for example, it causes the development of loose heads [14], reduces growth rate, increases the bitterness and toughness of leaves, and causes tip burn, thus reducing the commercial value of the product. In the tropics, out of necessity, growers implement diverse cooling practices to lower the temperature of the greenhouse and nutrient solution, especially for temperate species.
It has frequently been reported that temperature in the root zone is even more important for plant growth than the surrounding ambient air temperature. For many plant species, growth is inefficient with root temperatures below 20 °C and above 30 °C [13]. A high solution temperature results in an increased respiration rate of the roots and a concomitant increased requirement for oxygen, which is unfortunate since the oxygen carrying capacity of water decreases with a rise in water temperature. As an illustration, fully saturated water at 20 °C holds 9.1 mg/L dissolved oxygen but only 7.5 mg/L dissolved oxygen at 30 °C. Experiments on heat-sensitive pak choi conducted in Singapore under hot equatorial conditions showed that plants growing in a nutrient solution chilled by a few degrees from >30 °C in the control to 26 °C performed significantly better than plants in the control [16]. At high EC (3 vs. 1 dS/m) a solution temperature above 30 °C vs. 26 °C is considered detrimental for the productivity of hydroponically grown lettuce [17]. Therefore, reducing excessive solution temperatures ensures better root health and function.
The forced aeration of nutrient solutions is one method in hydroponics to increase the availability of oxygen to roots. The mucilage and ultrastructure of roots are greatly enhanced by the aeration of the nutrient solution and bacterial colonizations within the roots are reduced [18]. The benefits of aeration of the root zone have been recognized for various crops under soilless culture [19,20]. For example, Holtman et al. [20] reported a 17% increase in the root biomass and leaf area in cucumber (Cucumis sativus L.) as a response to increased dissolved oxygen concentrations (reaching 12 mg/L in the treated solution compared to 8 mg/L in the control).
One of the reasons the nutrient film technique (NFT) was designed was to aerate roots bathed in nutrient solution by providing a relatively large surface to volume ratio for the uptake of oxygen over the thin film of solution and temporal exposure of roots to air. The NFT enables the quick replacement from the air of oxygen in the solution as it is taken up by plants. The problems with NFT have been discussed by several authors. Bugbee [21] discussed the importance of flow rate and of maintaining adequate root-zone oxygen concentrations, especially at the lower end of the channel. Slow flow rates in NFT may cause channeling of the solution and reduced flow to areas with dense roots, which may become anaerobic. To overcome the problem, some growers put the pumps on cycles, effectively flooding and draining the NFT system while some administer regular H2O2 at a low concentration of 90 mg/L to the reservoirs containing nutrient solution [22].
With an integrated vermiculture-hydroponic system, vermiliquer may act as a complete organic fertiliser for hydroponic vegetable production under tropical conditions. Further to the issues of high pH and EC, those of temperature and dissolved oxygen in the nutrient solution become of great importance. As well as inorganic material dissolved in water, vermiliquer contains diverse organic compounds and complex micro-biota [6], the metabolism and dynamics of which are greatly regulated by temperature and the concentration of dissolved oxygen.
Presently, vermiliquer has little economic value other than for sale as a soil amendment. An earlier lack of knowledge on the use of vermicompost leachate for hydroponic plant production stimulated this research. We set out to comprehensively test the hypothesis that vermiliquer is an economically viable and sustainable liquid fertiliser for hydroponic plant production in the tropics. We evaluated the effect of pH and EC adjustments, of cooling practices (such as insulation and pot vs. NFT set-ups), and of aeration of the solution together with alternative sources of vermiliquer on plant productivity, specifically pak choi. If successful, vermiliquer has the potential to become an alternative organic nutrient solution for hydroponics, using nutrients that might otherwise go to waste or be less effectively used/captured when applied to the soil.

2. Materials and Methods

2.1. Location and Weather

The study was carried out at CQUniversity Campus in Rockhampton, Australia, at latitude: 23°23′ S; longitude: 150°28′ E; elevation: 10 m above sea level. Studies were conducted from May 2008 to September 2009 encompassing all tropical seasons. Daytime monthly maxima from November to April averaged 31.0 °C, with minimum 20.6 °C and average monthly rainfall of 89 mm. In the cooler ‘winter’, average monthly maxima from May to October were 25.5 °C, with minimum 13.0 °C and average monthly rainfall of 37 mm.

2.2. Infrastructure

Two major pieces of infrastructure, matching commercial systems with minor adaptation, were employed: vermifarms and hydroponics.
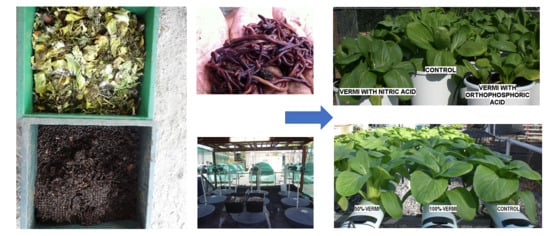
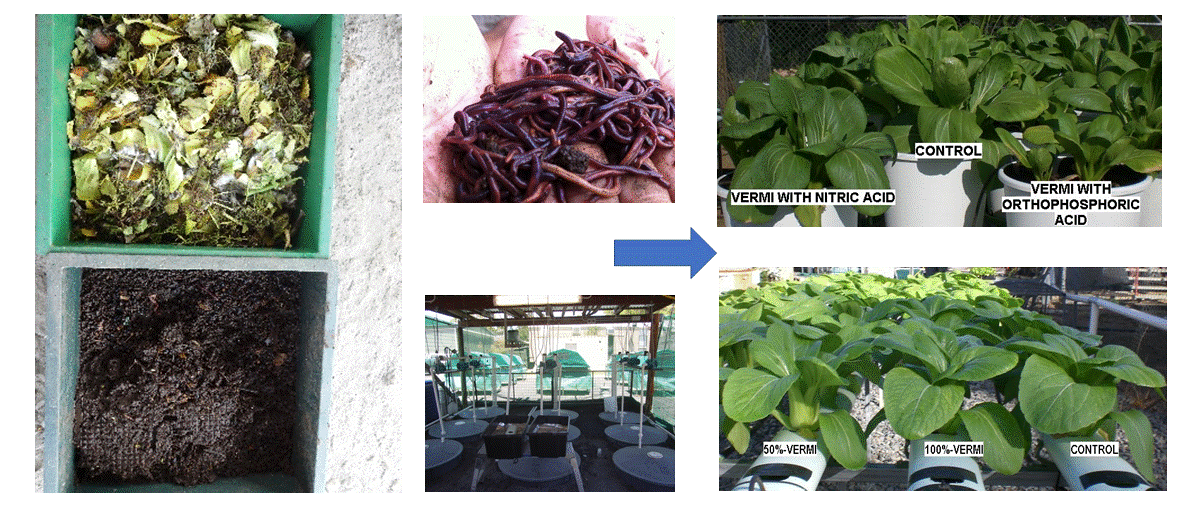
2.2.1. Vermifarms

Vermifarms were comprised of nine individual worm-beds each with a tarpaulin canopy (Vermicrobe International Pty, Eungella, NSW, Australia). Each bed comprised a 1000 mm × 1500 mm wooden box, 400 mm deep and elevated 750 mm from the ground. A drainage line from each bed was linked to an individual 380 L collecting tank sunken 300 mm in the ground. The recirculating system for watering to maintain ca. 80% moisture content in the worm-bed was serviced by a 40 L/min peripheral vane turbine pump (Mitron QB-60), set to sprinkle over each bed for 5 min every hour.
Worm-beds were filled with organic materials (in most studies 50 kg composted paunch material, i.e., windrow-composted plant material contained in the first stomach of a cow, a slaughterhouse waste), 15 kg milled newspaper bedding material and 160 L water. They were supplied initially (at 3 kg per bed) with proportional populations of three commercial earthworm species Eisenia fetida, Lumbricus rubellus and Perionyx excavatus, but later predominated by Eisenia fetida. To produce vermiliquer the following technique was used. All worm-beds were each fed 20 L of the feed source every 7 to 10 days. Loosening of the composted material accompanied each feeding. Feed was placed in the pit to a depth of 25 mm and an air gap to ensure aeration was maintained approximately 100 mm around the edge of the pit. Vermicompost leachate (vermiliquer) as used in the studies reached ‘maturity’ in approximately 8–10 weeks.
The vermiliquer for off-line (also called batch) studies was collected from the 380 L tanks and stored in a 1475 L batch storage tank, and was kept aerated by 2 × 65 mm air stones per tank, supplied by air from an aquaculture system at 1 m3/min using a constant vane air blower. For in-line ‘live’ trials vermiliquer was directly circulated from the 380 L tanks through the hydroponics units and back to the worm-beds.

2.2.2. Hydroponics Systems

The hydroponics systems used the recirculating commercial Ell-Gro© nutrient film technique (NFT) and/or pot systems. The three hydroponic blocks each comprised six 6 m long closed channels (at 26 cm centre-to-centre channel spacing, and 19.5 cm orifice-to-orifice along the channels) in which each NFT-channel was isolated and linked to an individual 100 L tank with either control source nutrients or off-line (batch) vermiliquer. Recirculation was provided by a 1200 L/h Aqua-world magnetic impeller pump feeding each NFT channel through a 13 mm feed line with a 4 mm outlet to each channel. All batch nutrient solutions were constantly aerated by Hiblow Hp80 air pumps, one per 100 L tank. In the in-line trials each in-line treatment channel was connected directly to the 380 L vermifarm collecting tank.
Magnetic impeller pumps were pre-set to work in alternating modes of 30 min pumping and 30 min rest. Of the eight studies undertaken, nutrient solution reservoirs were not insulated in Study I, but were in all other studies. Pipes were painted white to reflect solar radiation. In studies employing in-line sources of nutrients, the storage tanks were partly submerged and therefore partly insulated and were under shade.
Additionally, to address the negative effects of high mid-summer temperatures with NFT, parts of the NFT were converted into a low-pressure drip irrigation pot system (25 cm diameter pots with perlite media) with one pot in every second orifice. Each pot was individually fed using an open-ended 400 mm length, 4 mm internal diameter dripper pipe. The pot system was compared with the NFT system in two studies, Study I and Study VIII.

2.3. Nutrient Sources Used in the Studies

The control used Boxsell© Hydroponic inorganic nutrient (N:P:K ratio 5.8:1.0:9.1) which consisted of part A (g/L): 20.49 Ca, 16.90 N, 0.74 Fe, and part B (g/L): 18.39 N, 6.06 P, 55.32 K, 5.69 Mg, 7.55 S, 0.027 B, 0.045 Zn, 0.0058 Mn, 0.009 Cu, 0.004 Mo. The application ratio was 3.4 L of part A and 3.4 L of part B per 1000 L of reverse osmosis (RO) water.
Vermiliquer was obtained from ‘paunch’ materials fed to the worms. However, two studies were conducted comparing vermiliquer derived from ‘paunch’ or vege-liquer derived from semi-processed institutional kitchen waste.
The nutrient concentration of vermiliquer was analysed at CSBP Ltd., an accredited soil and plant analysis laboratory in Western Australia. Analyses were as follows: total nitrogen (Leco FP528 series, Saint Joseph, MI, USA), nitrate nitrogen and Cl (LaChat QC8000 segmented flow analyser, Hach Company, 5600 Lindbergh Dr. Loveland, CO, USA); total P, S, K, Ca, Mg, Na, Cu, Zn, Mn, Fe and B (Thermo IRIS Intrepid II – XDL Dual View ICP-OES, Thermo Scientific, Waltham, MA, USA). Some principal properties of vermiliquer are presented in Table 1.

2.4. Plant Material

One seed of the open pollinated Asian vegetable pak choi (Brassica chinensis L. cv. Shanghai) was sown per cell to the depth of ca. 1 mm–2 mm in deep trays (cells 4 cm × 4 cm × 10 cm) with vermiculite. Seedlings were kept moist with RO water until the appearance of the second true leaf. They were then fed with a 10% concentration Boxsell solution until one week before their transplanting into the hydroponic system. For the final week before transplanting they were watered with RO water only. Seedlings were manually transplanted into the hydroponic system: one seedling per orifice in the NFT system and mostly two (three or four in some studies) seedlings per pot in the pot system. On average, seedlings were 25 days old when studies began.

2.5. Experimental Designs

Hydroponic treatments were set up in a randomised split-block design. In most studies each treatment was replicated four (in some studies two or three) times (individual NFT channels and linked 100 L tanks). Each replicate contained 10–16 plants in the NFT system or 6 pots (containing 2, 3, or 4 plants) for the pot system. Details of the experimental period, number of replicates and plants per pot, type of hydroponics, and treatment and buffer type for each of the studies are presented in Table 2.
Study I compared off-line (batch) vermiliquer with the control, in NFT and pots using orthophosphoric acid as pH buffer, with two replicates each containing 24 plants (in 6 pots) for the pot treatment and 12 plants in the NFT treatment.
Study II investigated the effect of pH, with nitric acid as pH buffer, compared with the control, all in a pot setup using batch vermiliquer, with four replicates each containing 18 plants (in 6 pots) per treatment.
Study III compared different pH buffers, using pot hydroponics with batch vermiliquer, with four replicates each containing 12 plants (in 6 pots) per treatment.
Study IV compared in-line vermiliquer (hydroponic units directly linked to the vermifarms), without manipulating the pH, with a buffered control, using pot hydroponics with two replicates each containing 12 plants (in 6 pots) per treatment.
Study V compared in-line and off-line (batch) vermiliquer treatments, the latter with or without buffer, using pot hydroponics with two replicates each containing 12 plants (in 6 pots) per treatment.
Study VI compared off-line (batch) vermiliquer from different organic sources, with an NFT setup, with four replicates each containing 16 plants per treatment.
Study VII compared different organic in-line vermiliquer sources, with an NFT setup, with four replicates each containing 16 plants per treatment.
Study VIII quantified effects of dilution of off-line (batch) vermiliquer against that of the inorganic nutrient control solution when used with NFT and pot systems, with three replicates each containing 12 plants (in 6 pots) for the pot treatment and 10 plants in the NFT treatment.

2.6. Measurements

The pH and EC of vermiliquer in each trial was measured daily with a TPS FL-90 meter in each 100 L tank or 380 L collecting tank, depending upon whether the treatment was batch or in-line, respectively. At five day intervals solution concentrations of K+ and NO3 were measured with calibrated Horiba Cardy c-131 K+ and Horiba Cardy c-141 NO3 meters, respectively, and weekly sap concentration of K+ and NO3 were measured with the same apparatus. Leaf chlorophyll concentration on three uppermost youngest fully expanded leaves in each replicate was estimated weekly with a Konica Minolta Soil Plant Analysis Development (SPAD) 502.
At harvest, the above and below-ground parts of plants were separated. Roots were washed with tap water to remove remaining media. After washing, excess water was removed with paper towels. Separated parts were surface dried, weighed, and dried for six days in a forced draft oven set at 60 °C. For the NFT-plants, roots were separated and weighed on a per plant basis. It was impossible to separate roots of different plants in a single pot, so the weight of the roots was based on an average of the number of plants per pot used in each study.
Analysis of nutrient concentration in shoot tissues was conducted at the same accredited laboratory in Western Australia as for vermiliquer. Dry shoots of all harvested plants from each treatment were ground with a rotary grinder (ZM1000, Retsch, Haan, Germany) fitted with a 0.1 mm mesh and packed in 50 mL falcon tubes. A composite sample was considered to be optimally representative for each treatment in terms of nutrient composition.

2.7. Statistical Analysis

All data were analysed with an appropriate ANOVA model using Genstat (2007) software and comparisons of regression slopes and intercepts were undertaken where required. The treatment and interaction means were separated using the least significant difference (LSD) or Duncan’s multiple range tests at a significance level of p ≤ 0.05.

3. Results

3.1. Properties of the Vermiliquer

The initial EC of the ‘mature’ vermiliquer without dilution varied between 1.5 dS/m and 2.6 dS/m across the hydroponic studies (Table 1). Dilution lowered EC values (e.g., Study VIII, 0.9 dS/m for 50% dilution compared to 1.5 dS/m for undiluted vermiliquer), and the EC was lower for in-line vermiliquer studies (e.g., Study IV). These values generally compared favourably with an initial EC of 1.7 dS/m in the control.
Total N values for vermiliquer treatments were almost always higher than those for the control (Table 1), but N in the control was in the inorganic form, immediately available for plant uptake, whereas N in the vermiliquer was in both the organic and inorganic forms and the former is more slowly available.
Potassium in vermiliquer (Table 1) varied greatly between studies (from a strangely low 2 mg/L to 236 mg/L) encompassing values for the control (189 mg/L). The concentration of total P was two to three times higher in vermiliquer treatments than in the control, Ca and Mg were in the same order of magnitude but Na was considerably higher in the vermiliquer than in the control. Total Na ranged between 425 mg/L to 1080 mg/L, reflecting its concentration in the waste source and the tap water used to irrigate worm-beds, compared to RO-based control chemical fertiliser solution.

3.2. Study I

Study I compared the inorganic control with the batch vermiliquer treatment using both the NFT and pot setup. NFT yielded significantly less total fresh weight per unit area (on average by one half) than the pot setup whether with inorganic control or vermiliquer, and vermiliquer buffered to pH 7.0 with orthophosphoric acid yielded on average one quarter that of the inorganic control (Table 2). Shoot fresh weight showed the same effect, but root fresh weight was greatest in the NFT control. Differences between NFT and pot treatments in dry weight were significant but less marked. Plants in the pot system with vermiliquer did not show signs of nutrient deficiency until 19 days after transplanting, compared to two days after transplanting in the NFT (data not presented). In the poorest performing treatment (NFT with vermiliquer) the root:shoot ratio was greatest (Table 2).

3.3. Study II

Study II investigated the effect of pH of the vermiliquer, buffered with nitric acid to either pH 7.0 or pH 5.5, in comparison to the inorganic control at pH 5.5. The shoot fresh weight was almost identical in vermiliquer buffered to pH 5.5 and the control (Table 2), with vermiliquer at pH 7.0 about 17% less than the control. Although differences in root weight (fresh or dry) were not significant between treatments and the advantage of the lower pH on shoot fresh weight was not evident in shoot dry weight, in all further studies where buffering was employed, all vermiliquer batch treatments were maintained at pH 5.5.
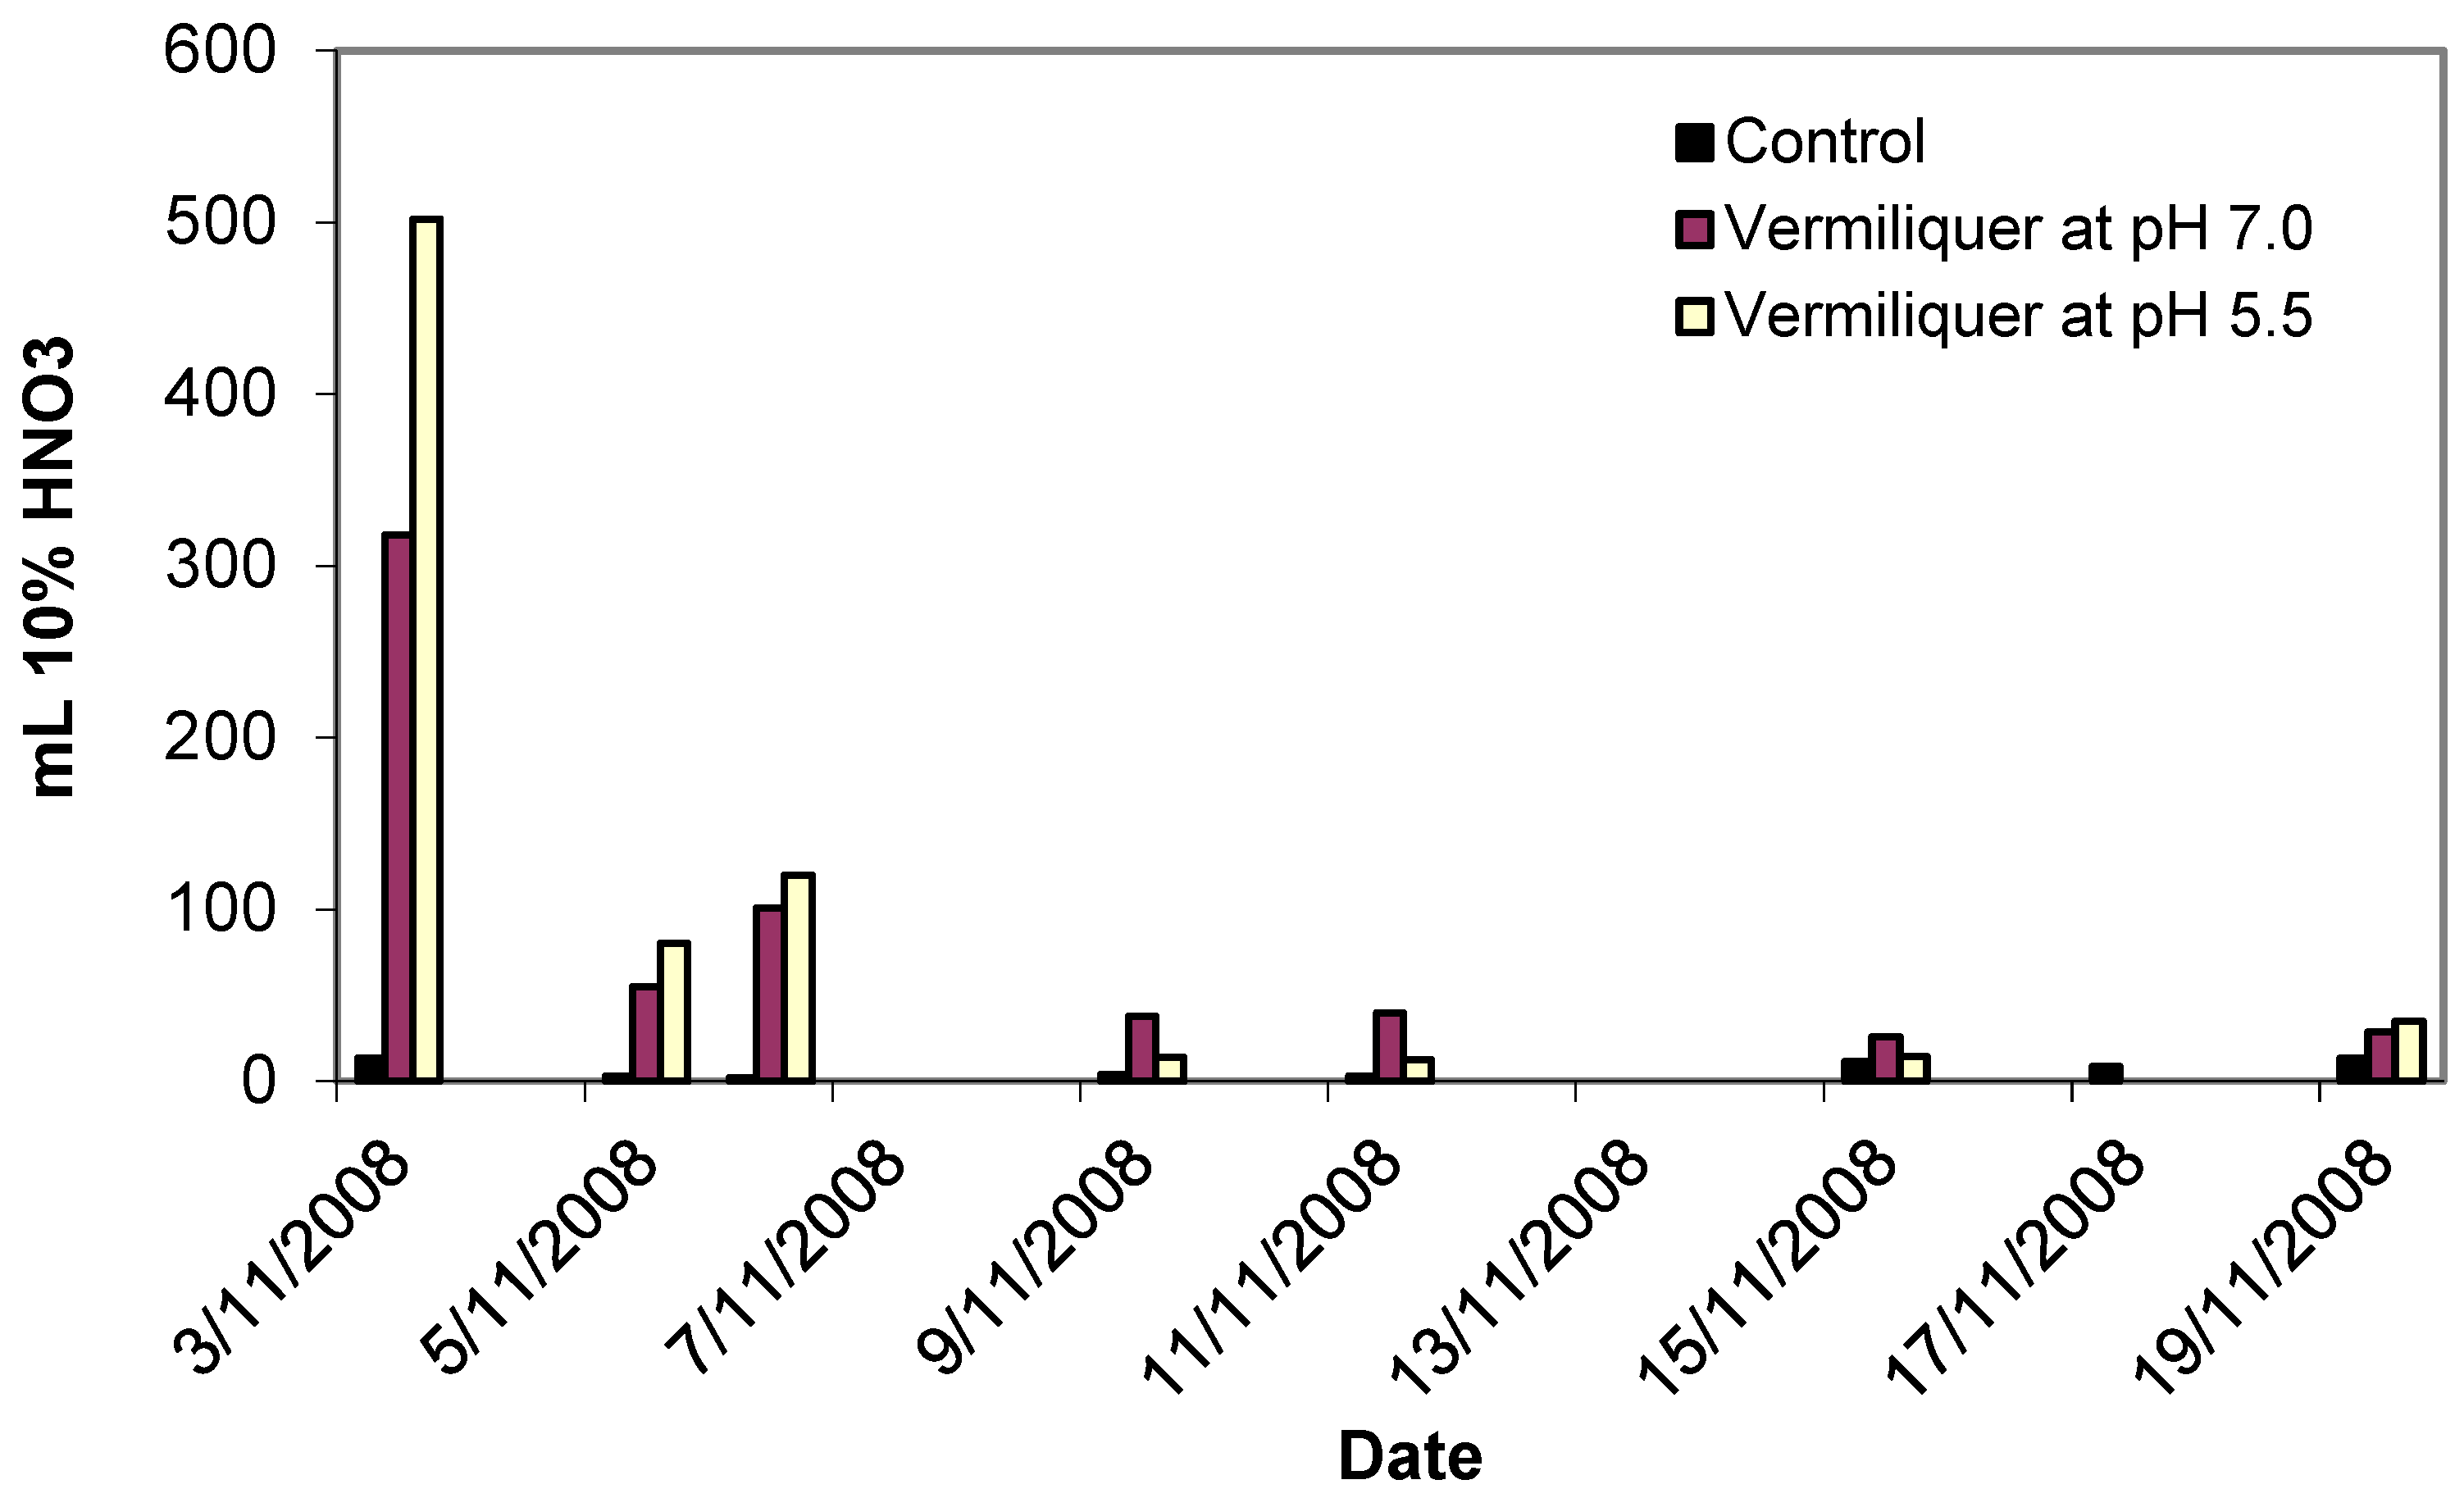
An example of the actual timing for the addition of acid is given in Figure 1. Initial buffering required larger amounts of the buffer (up to half a litre of 10% nitric acid per 100 litres of vermiliquer), producing long-term result in terms of pH reduction and further corrective buffering of the system required only small amounts of buffer.
The initial concentration of nitrate was considerably higher in the vermiliquer solutions than the control (ca. 1200 mg/L compared to ca. 400 mg/L—Figure 2). By the end of the study, nitrate in vermiliquer declined to ca. 800 mg/L, whereas in the control it declined steadily with growth to an almost immeasurable quantity (Figure 2). The positive effect of lower pH on leaf chlorophyll (estimated through SPAD measurements) was evident and after one week SPAD values for the control and pH 5.5 treatments were 43.5–44.0 compared to 40.5 for the pH 7.0 treatment (LSD p < 0.05 = 2.0) despite the pH 7.0 treatment having higher nitrate concentration than in the control (Figure 2).
Concentration of nitrate in shoot tissue at harvest was greater in the control and with vermiliquer at pH 5.5 than at pH 7.0. (Table 3) as was P and Na while Fe and Mg were higher with vermiliquer.

3.4. Study III

Study III was run with different buffers to determine if poorer performance in Study I (using orthophosphoric acid) than Study II (using nitric acid) was related to the source of buffer. Vermiliquer treatments were therefore buffered to pH 5.5 with either acid and the inorganic control was buffered with nitric acid only.
Fresh and dry shoot weight in the vermiliquer buffered with nitric acid matched that of the control, and fresh weights were ten times greater than that buffered with orthophosphoric acid (Table 2). Nitrate and total N in shoot tissue were greatest in the vermiliquer treatment buffered with nitric acid, and phosphate was greatest in the treatment using orthophosphoric acid buffer (Table 3). Potassium, Ca, Mg, S, Cu, FE and B concentrations were greatest in the control, and generally least in the treatment with orthophosphoric acid buffer.
Buffering with orthophosphoric acid, the poorest performing treatment, led to a greater root:shoot ratio of 0.618 compared to 0.192 with nitric acid (Table 1) reflecting the lower investment in roots in the latter.

3.5. Study IV

Study IV was set up to compare the performance of pak choi in the inorganic control with pak choi grown in direct linkage of the hydroponics system to the vermifarms. The in-line linkage with vermiliquer started with a relatively low EC (0.92 dS/m) and rose over a ten day period and remained at ca. 2 dS/m until the end of the study (data not presented). The pH of this treatment showed a steady level of pH ca. 8.0 throughout the study, whereas the control was buffered to ca. pH 5.5.
Fresh and dry yields in the in-line vermiliquer treatment were significantly less (only one quarter) than that of the control (Table 2). Root:shoot ratio was greater in the non-buffered vermiliquer compared to the inorganic control (Table 2).
The nitrate concentration in the in-line vermiliquer treatment was initially considerably lower than in the control solution (ca. 40 mg/L vs. ca. 380 mg/L) but reversed by the end of the study (ca. 6 mg/L vs. ca. 130 mg/L). The steady decline in nitrate concentration in the solution in the control reflected the nutrient uptake by plants. However, in-line vermiliquer led to a very low N and NO3 concentration in shoot tissues (compared with control in other studies—Table 3). Concentrations of other minerals in shoot tissue was similar to other in-line treatments in other studies (Table 3) and chlorophyll, as in in-line treatments in other studies, was lower than in the control (26 vs. 37 SPAD units, p < 0.01).
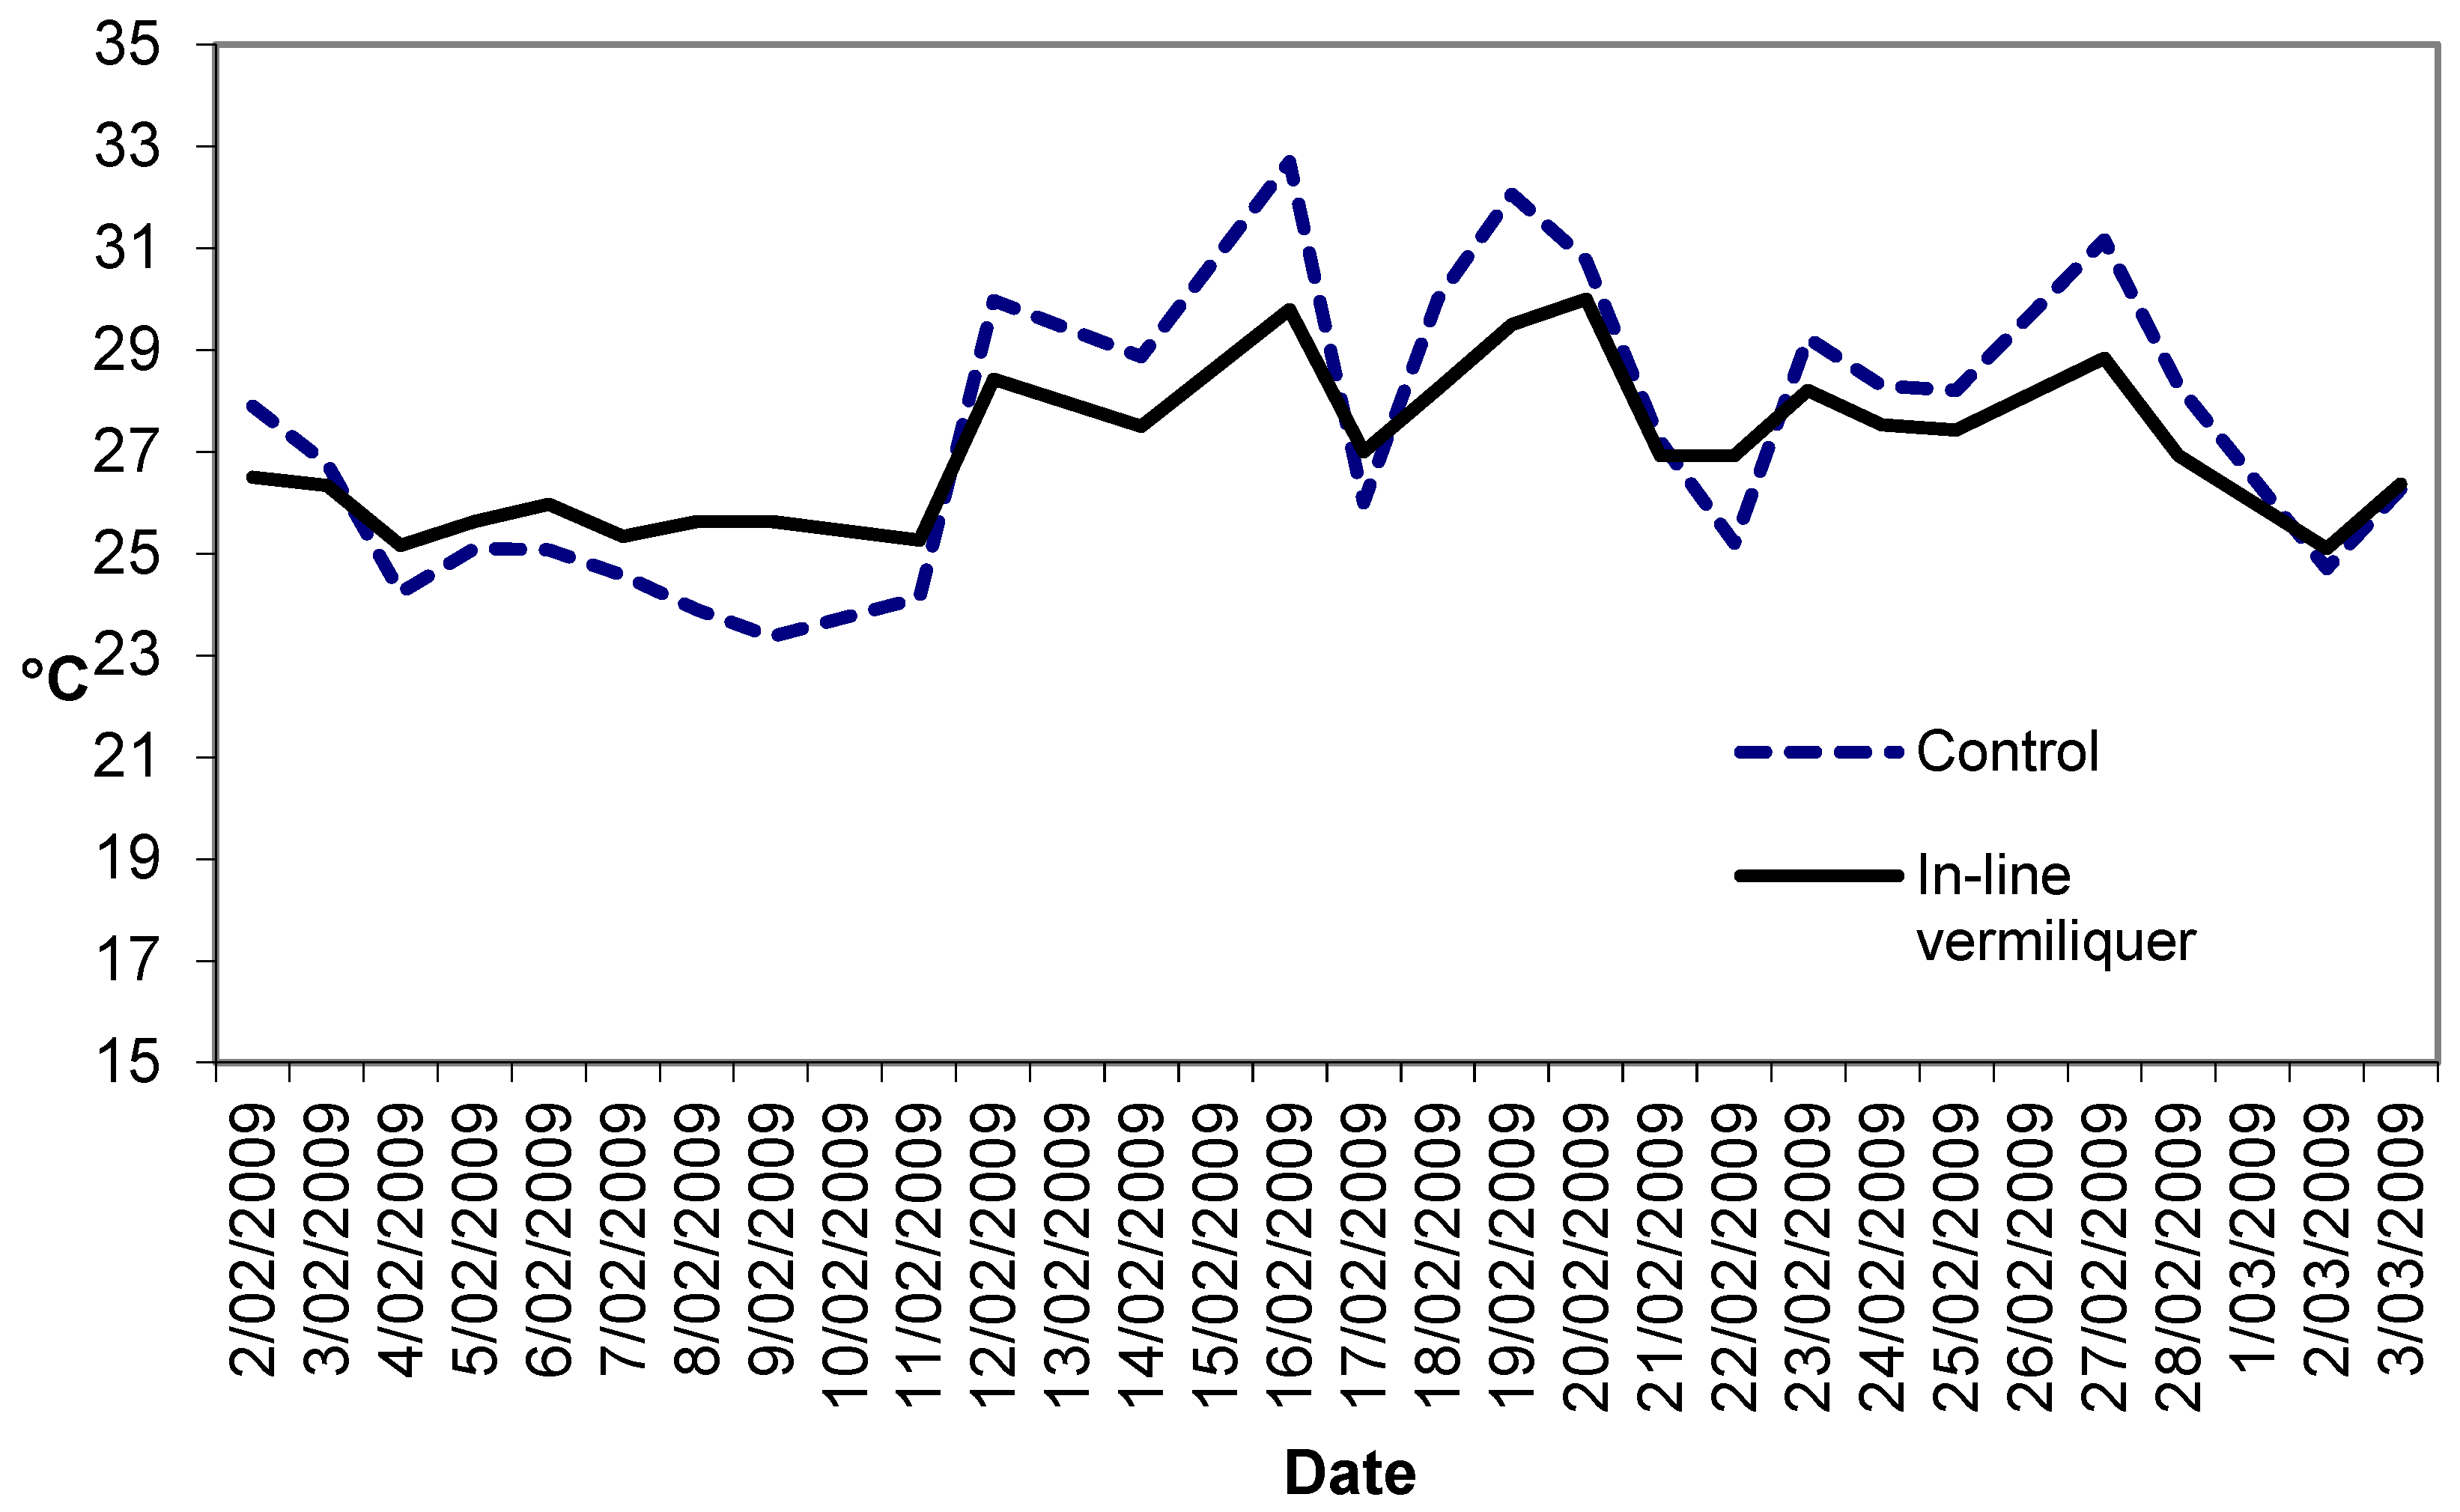
Figure 3 illustrates the solution temperatures in this study. The dampened range of daily temperature in the in-line vermiliquer may have been due to the greater heat sink capacity in that treatment compared to the control (380 L versus ca. 100 L in the control).
Dissolved oxygen was regressed against nutrient solution temperature and the relationship differed according to nutrient source (Figure 4); at a given temperature between 23 °C and 34 °C dissolved oxygen was greater in the control than in vermiliquer, suggesting that background consumption of oxygen by vermiliquer was greater than in the inorganic control and/or that aeration was more effective in the control. There was notably more variation in dissolved oxygen at a given temperature in vermiliquer, especially at higher temperature.

3.6. Study V

Study V was set up to compare the performance of pak choi between in-line (not buffered) and off-line (buffered and unbuffered) vermiliquer treatments.
Solution pH was very high in the in-line and the unbuffered off-line (batch) treatments (ca. pH 8.5) compared to ca. pH 5.6–7.3 for the buffered treatment (data not presented).
Fresh and dry total yield in the in-line and the buffered batch treatments did not differ markedly (Table 2), despite the difference in solution pH, and they both significantly exceeded the yield of the non-buffered batch vermiliquer treatment.
The nitrate concentration of the buffered batch vermiliquer was greater on average (600 mg/L) than the unbuffered batch vermiliquer (434 mg/L) or the in-line vermiliquer (414 mg/L). However, by the end of the study nitrate concentration in sap in both the batch treatments was similar (ca. 6200 mg/L) and nearly double that of the stunted plants in the in-line treatment (ca. 3600 mg/L). In accord with this, nitrate concentration in the shoot (Table 3) of plants in the buffered vermiliquer treatment was four times that of the non-buffered vermiliquer and eight times greater than that of the in-line vermiliquer treatment. Uptake of Na, Ca, Mg, Cu, Fe and B were all less in treatments with no buffer (Table 3), while K and S and to some extent P were higher in non-buffered treatments.
SPAD readings in the in-line and unbuffered vermiliquer treatments were comparable and from 19 days after transplanting significantly less than in the buffered batch vermiliquer (Figure 5).

3.7. Study VI

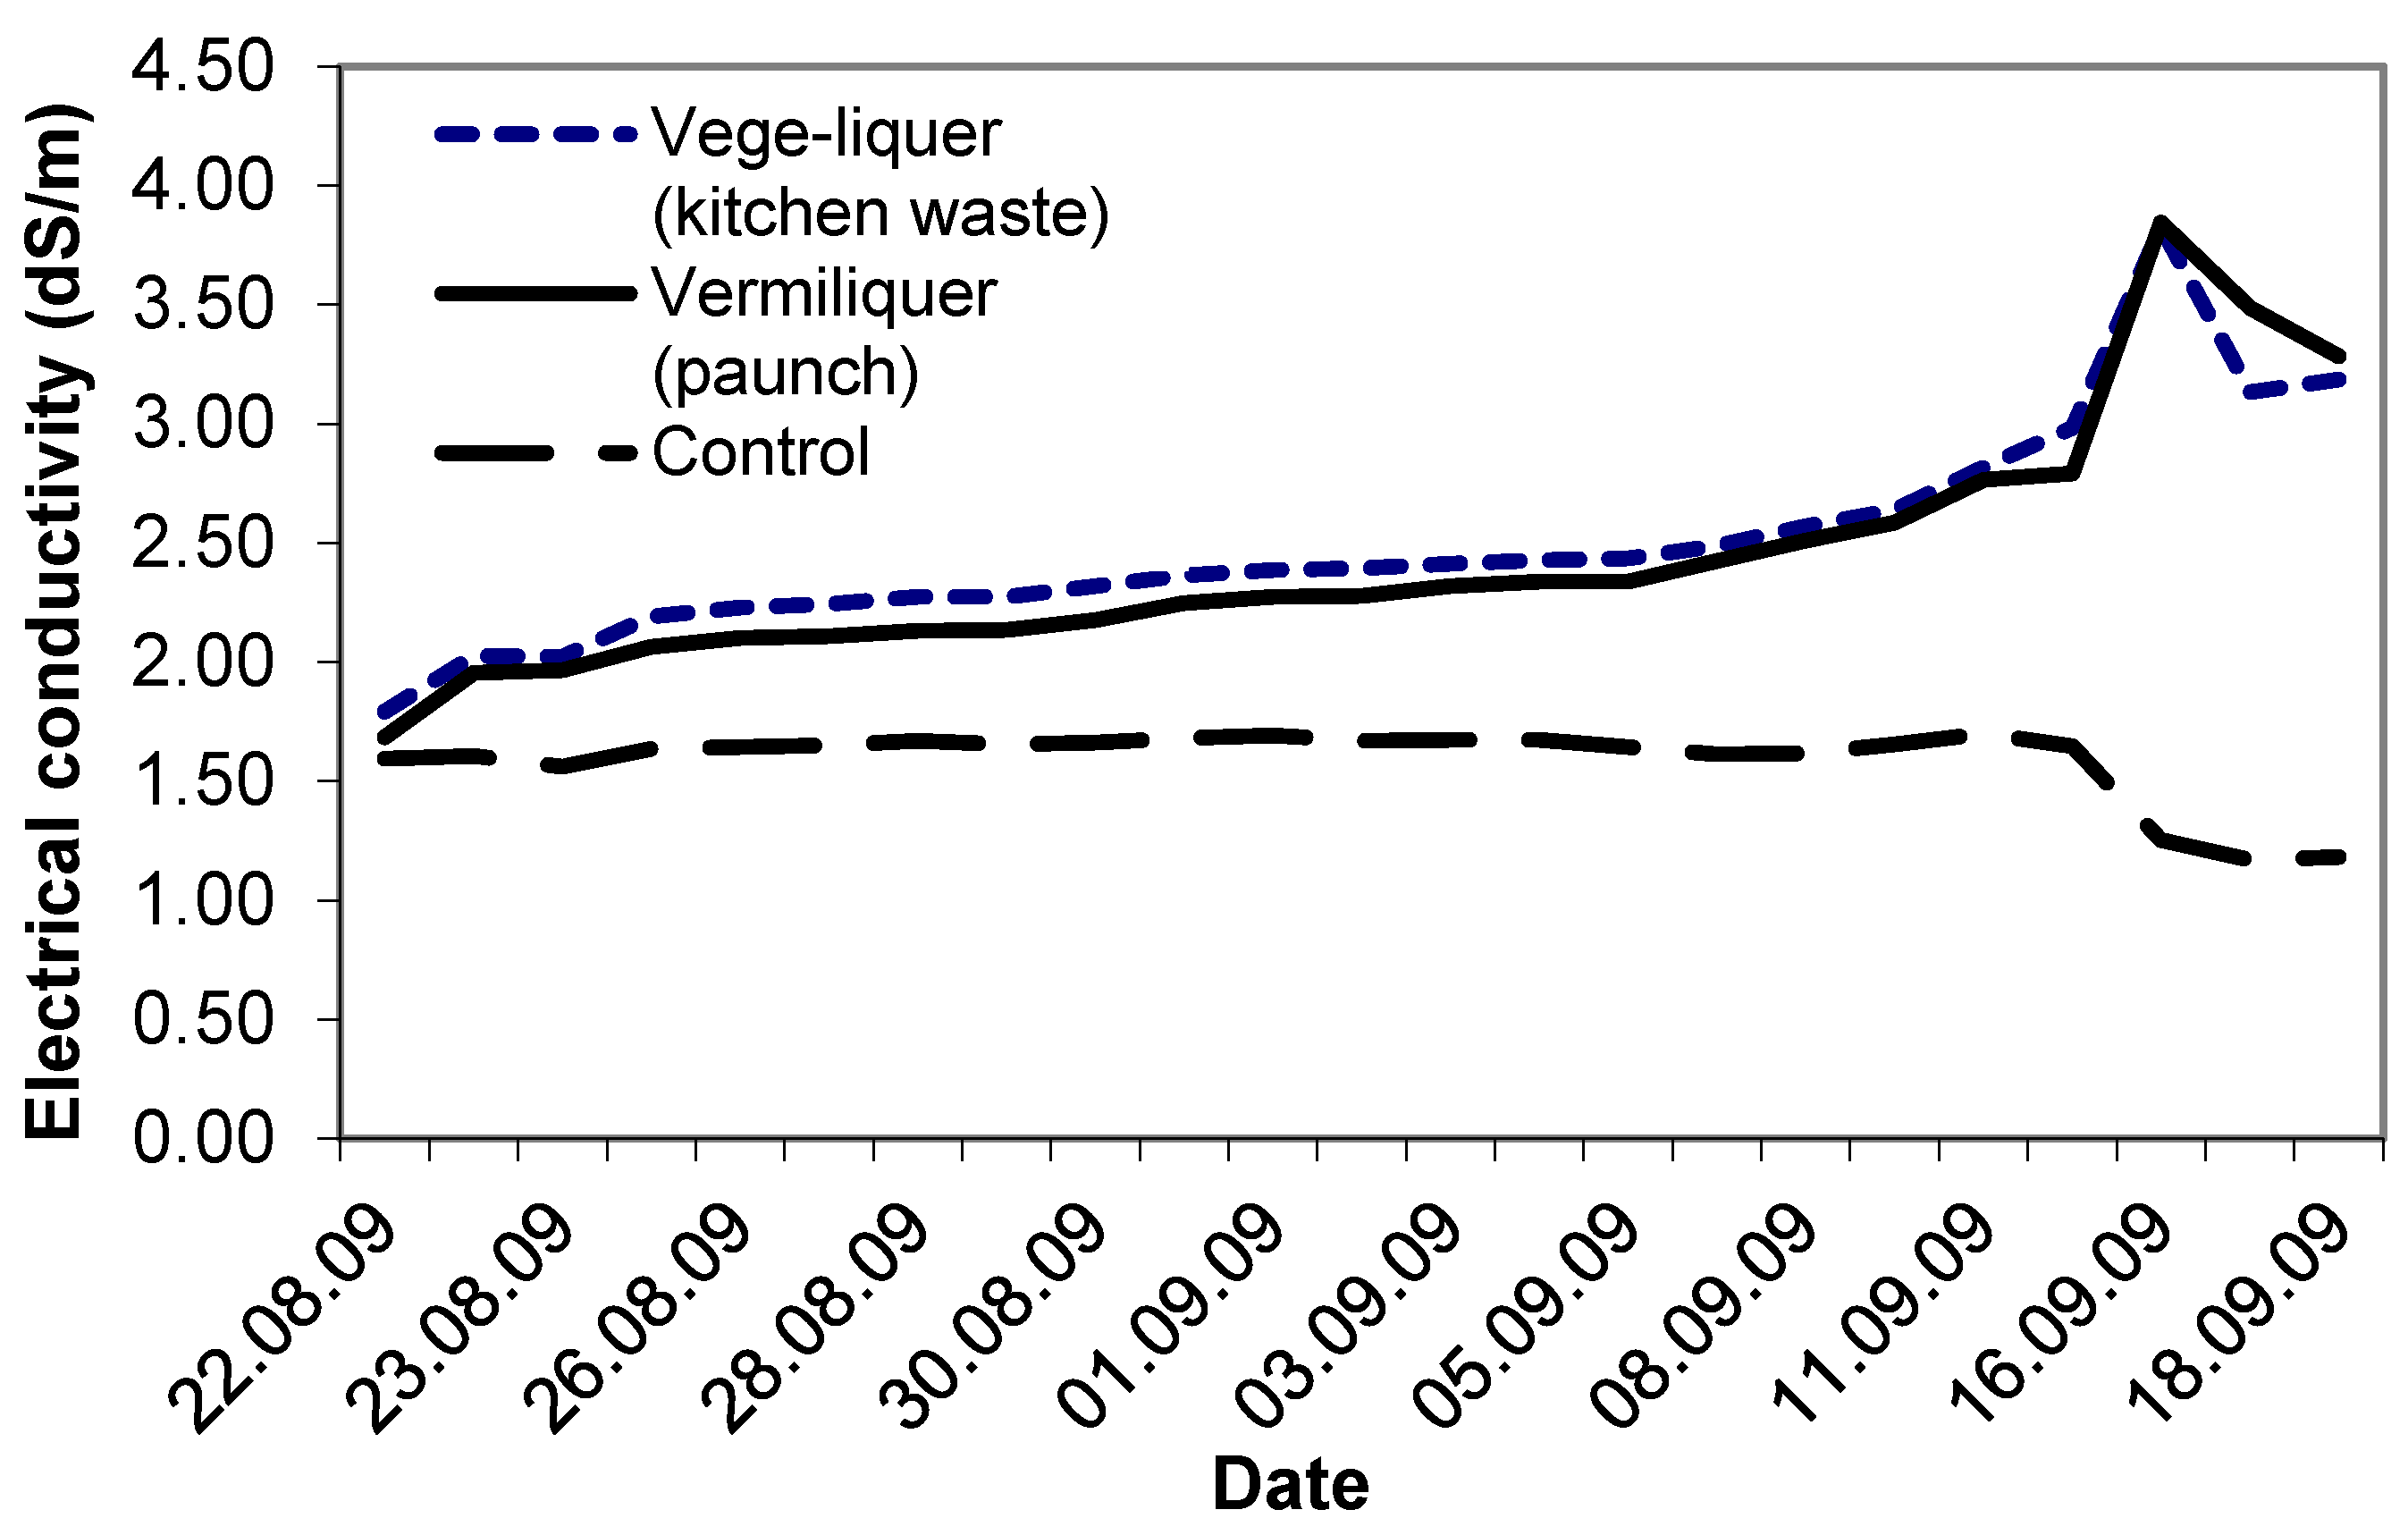
Study VI compared the performance of two different sources of batch organic wastes: vermiliquer from paunch material and the vege-liquer from kitchen waste. Electrical conductivity in each, and in the control, started at ca. 1.6 dS/m–1.8 dS/m. As in other studies, the EC in both vermiliquer treatments steadily increased (Figure 6). After four weeks the EC exceeded 3.5 dS/m and the vermiliquer solutions were diluted with some RO water to reduce the EC. The EC in the control remained stable for three weeks and after that decreased. The vege-liquer treatment required approximately 23% more acid buffer during the study than the ‘paunch’ vermiliquer treatment (data not presented).
There were no significant differences among any treatments for yield, although that with vege-liquer was lower than in the ‘paunch’ vermiliquer treatment, and both lower, on average by ca. 20%, than that of the inorganic control (Table 2). Total N in the pak choi at harvest was highest for the control, and least for the vege-liquer. However, SPAD readings were least for the control at harvest time and equally high in the vermiliquer treatments (25 vs. 41–45, p < 0.01), and nitrate in the solution followed a similar pattern, with no nitrate measurable in the control.
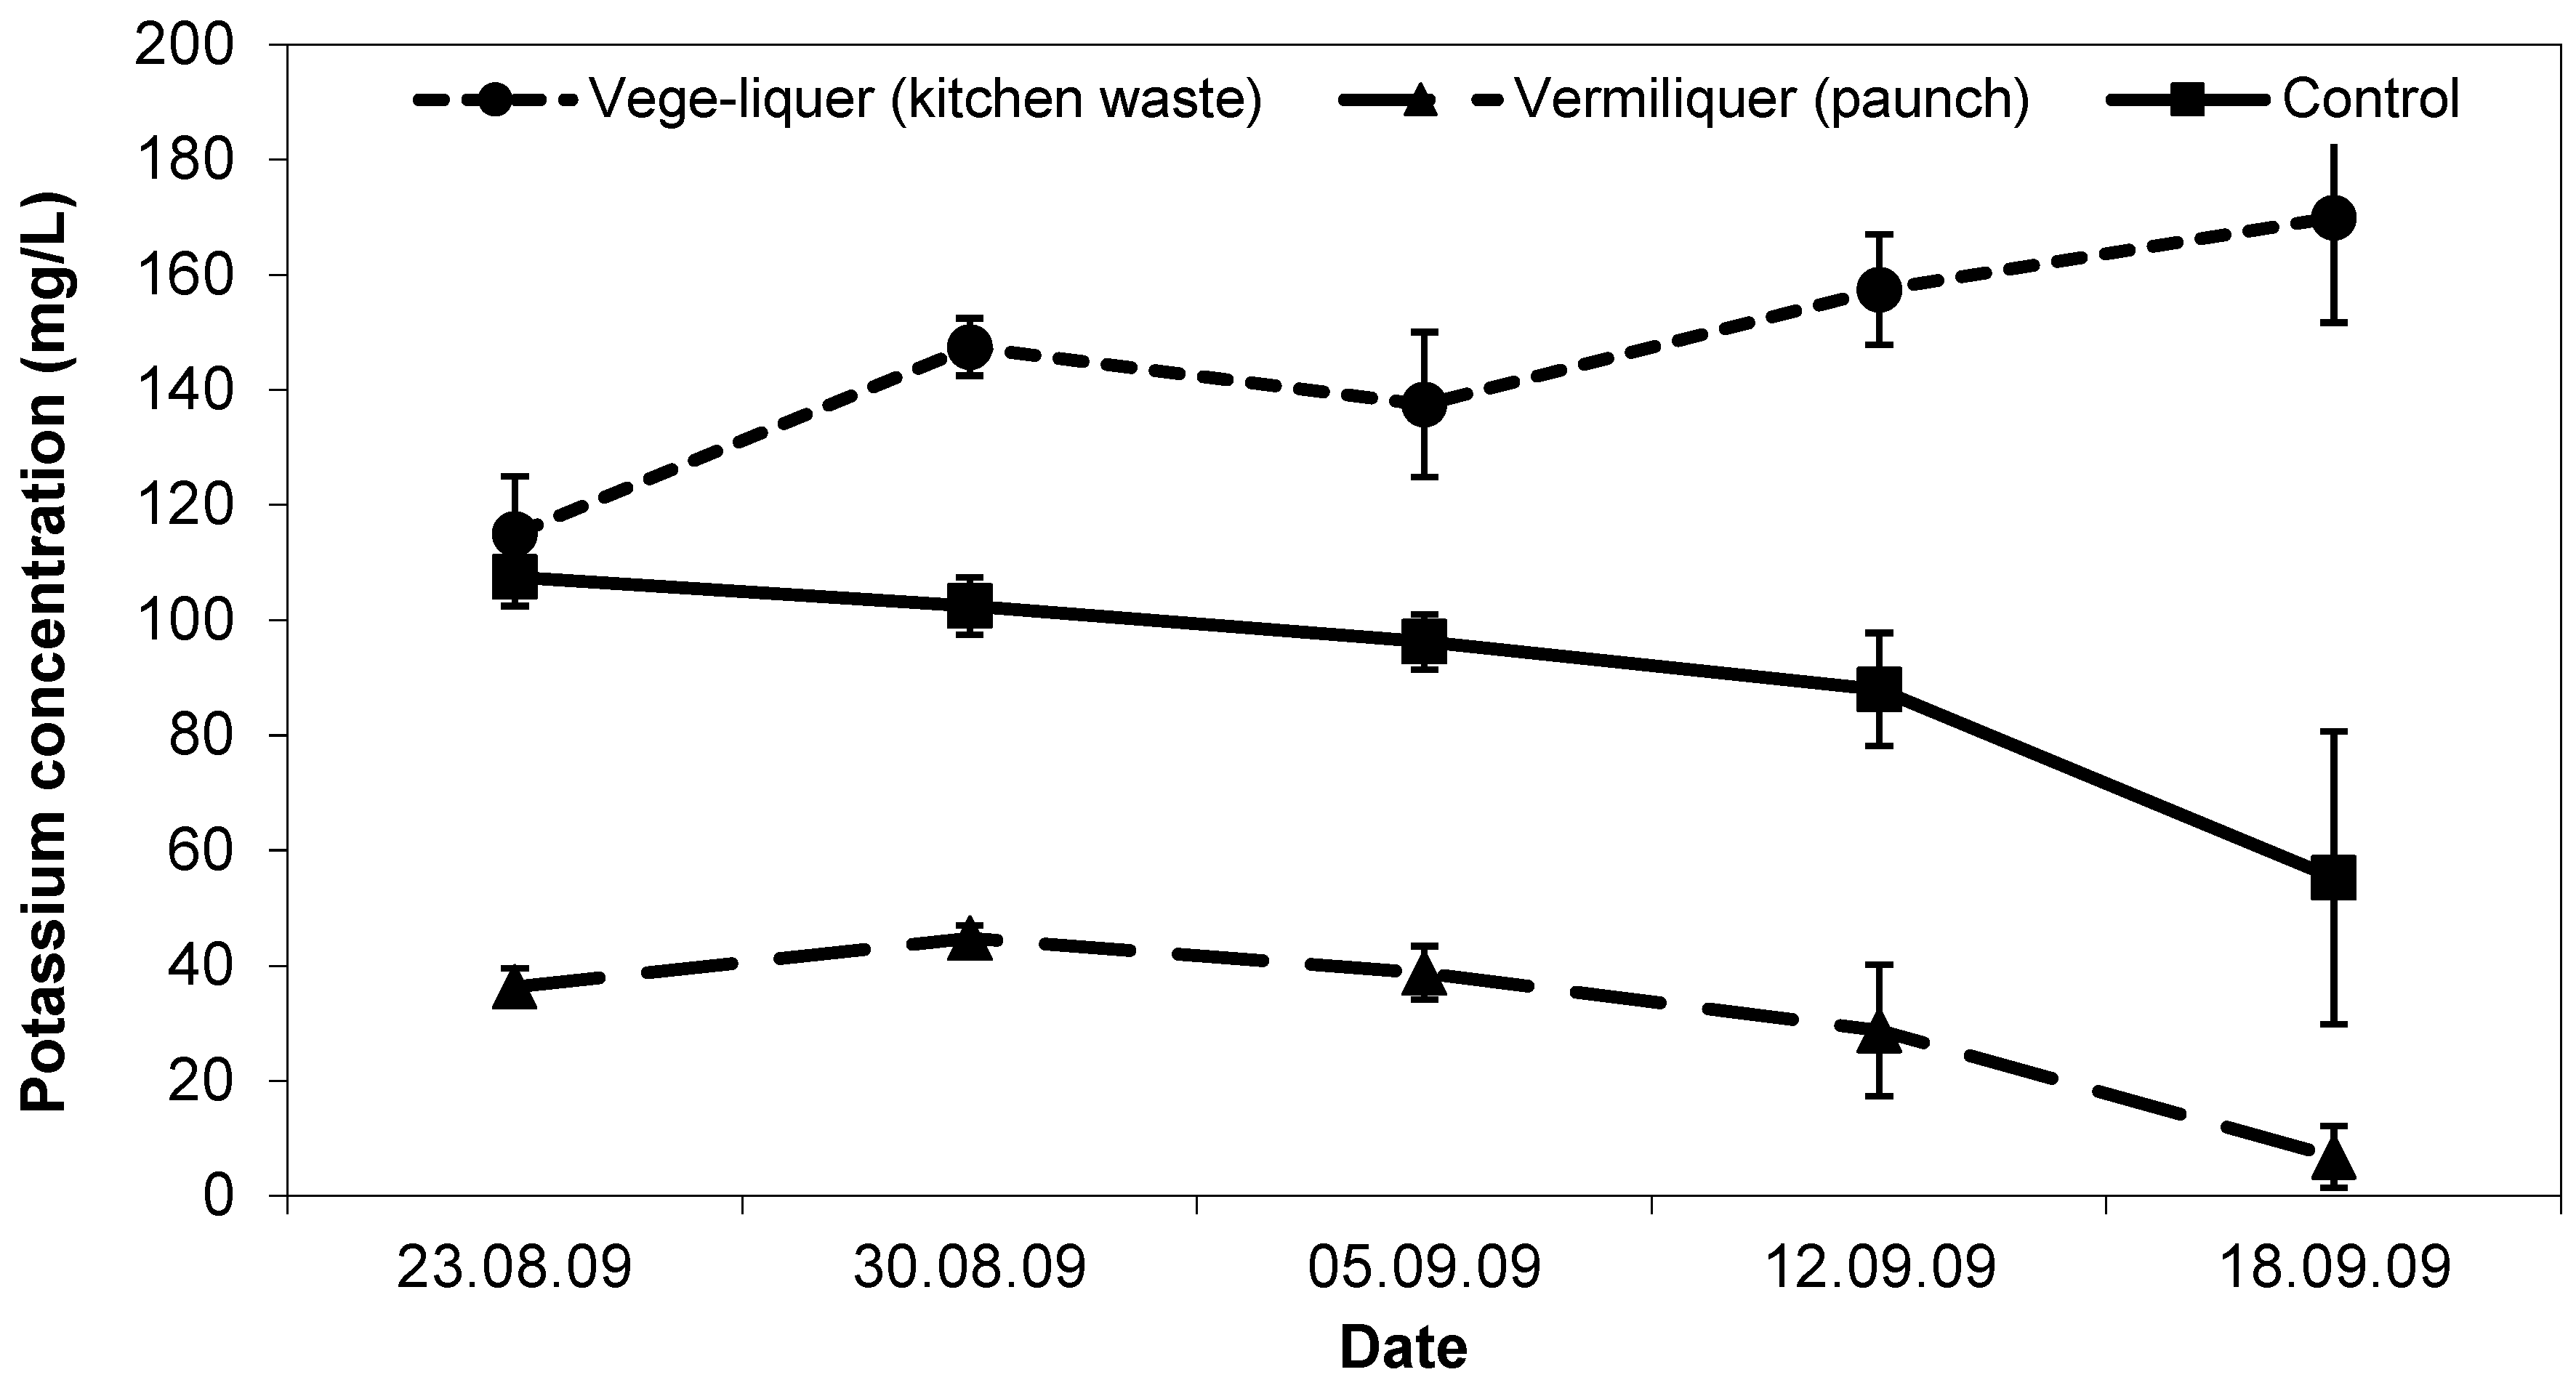
Initial potassium concentration in the vege-liquer (with kitchen waste) solution was the same (ca. 110 mg/L) as in the control (Figure 7). Potassium in the vermiliquer obtained from ‘paunch’ was significantly lower (ca. <40 mg/L) than in the other two treatments. During the study, potassium concentration decreased in the control and dropped close to immeasurable in the ‘paunch’ vermiliquer (as it did in other studies), while in the vege-liquer it increased (Figure 7). Potassium in sap was greatest in the control and vege-liquer (200–300 mg/L) compared with the vermiliquer (140–180 mg/L) and likewise in the harvested pak choi potassium concentration was highest in the control and least in the vermiliquer (Table 3).
The highest concentration of calcium in the pak choi shoots across all studies was observed in the vermiliquer treatment run on the kitchen waste (i.e., 3.07% Ca compared to 2.32% for paunch vermiliquer).

3.8. Study VII

Study VII compared the performance of the same two sources of organic wastes as in Study VI, but with plants grown in-line. The solution pH in both the in-line treatments was high (ca. 8.5–9.0) throughout the study.
Yields in both treatments were very low, 10–15 times less than batch treatments in Study VI using the same original solution (Table 2). In absolute terms, the vege-liquer treatment yielded one half of the yield in the vermiliquer treatment, but statistically, as in Study VI, there was no difference between treatments.
Despite nitrate concentration in the vermiliquer being significantly higher than in the vege-liquer (280–730 mg/L vs. 180–380 mg/L) sap nitrate was significantly higher in the vege-liquer (ca. 8000 pm vs. ca. 1200–1400 pm), as was total N in shoots at harvest, but SPAD was higher at harvest for vermiliquer (33 vs. 10 units, p < 0.01).
Potassium concentration in the vege-liquer was, as in Study VI, three to four times higher than potassium in vermiliquer throughout the Study, and accordingly potassium concentration in sap in the vege-liquer treatment was three-four times higher than that in plants from the paunch liquer (data not presented).
A comparison between Study VI and VII shows that both in-line vermiliquer treatments in Study VII contained less calcium concentration in the shoots than the corresponding batch treatments with managed pH in synchronous Study VI. This indicates that overall susceptibility to stress may reduce calcium uptake in plants. Likewise, in Study VII, the in-line vege-liquer (with kitchen waste) with the exceptionally stunted growth and very low SPAD-chlorophyll surprisingly showed the highest magnesium concentration across all studies (Table 3). The in-line vege-liquer with kitchen waste accumulated more zinc than the in-line vermiliquer on paunch material, while in the synchronous Study VI the same off-line (batch) treatments showed the opposite pattern. This may possibly be related to the effect of pH on the mechanism of zinc accumulation (higher pH reduced uptake).

3.9. Study VIII

Study VIII investigated the effect of dilution of vermiliquer, and the interaction with growing plants in pots or in NFT. Commencing the study, the EC in the unbuffered 100% vermiliquer was identical to that in the control treatment (ca. 1.5 dS/m) and more than 50% higher that the EC in the 50% vermiliquer treatments (ca. 0.9 dS/m). With initial buffering in both vermiliquer treatments, EC increased to ca. 2.1 dS/m and ca. 1.2 dS/m, respectively, and from that time remained stable in all treatments for three weeks. Thereafter, EC in the control treatment began to gradually decrease (to 0.5 dS/m by harvest) which indicated nutrient depletion whereas EC in the vermiliquer treatments increased at that time to 3.5 dS/m and 1.7 dS/m, respectively.
Fresh shoot yield in the 100% vermiliquer treatment was ca. 80% and in the 50% vermiliquer treatment one half of that in the control (Table 2), but root fresh and dry weights did not differ between nutrient solution treatments. Plants in the NFT-system had a higher yield than in the pot system but not significantly so, although root fresh and particularly dry weights were greater in plants grown in NFT than in pots.
The dynamics of nitrate concentrations in the solutions reflected the inorganic and organic sources and dilutions. In the beginning, nitrate concentration was similarly higher in the 100% vermiliquer and the control treatments (ca. 500 mg/L), and double that of the 50% diluted vermiliquer. Over time the nitrate concentration in the control steadily decreased, as expected for a finite amount of nutrient in an inorganic solution. By the end of the study there was practically no nitrate left in the control treatment. Nitrate concentration in both the vermiliquer treatments also declined with time but remained above 250 mg/L. In accord with the nitrate concentration in solution, the first sampling sap nitrate concentration was highest for the control (Figure 8). At the final sampling sap nitrate was least for the control (ca. 1670 mg/L), intermediate for the diluted vermiliquer (ca. 2800 mg/L) and highest for the 100% vermiliquer (ca. 3650 mg/L). In a similar manner, early SPAD readings were significantly lower in the 50% vermiliquer treatment and did not differ significantly between the control and the 100% vermiliquer treatments (data not presented). However, SPAD values in the 100% vermiliquer treatment remained high throughout the study (ca. 42), slightly increasing from 34 to 38 in the 50% vermiliquer treatment and decreasing from 41 to 36 in the control.
Shoot total N% at harvest, in both NFT and pot grown plants, was greatest in the 50% vermiliquer and least in the control (Table 3) perhaps due to dilution in the higher yielding control. There was no difference in total shoot N% between pot-grown and NFT-grown plants.
As in Study VI, concentration of potassium in the nutrient solution in the control at the start of the study (ca. 145 mg/L) was three times higher than in the 100% vermiliquer treatment, and, in accord with dilution, over five times higher than in the 50% vermiliquer treatment. Remaining stable for the first two weeks, potassium concentration in all three treatments declined and by the end of the study was undetectable. The concentration of K in the sap was always higher in the control (ca. 3100 mg/L) and nearly double that of the vermiliquer treatments (again as in all studies), and final concentration of K in shoots was highest in the control, with values twice as high as in the 100% vermiliquer and even higher than that in the 50% vermiliquer (Table 3).
There was a tendency for the potassium concentration in the shoot tissues to be higher in the pot system than in the NFT (Table 3), especially with commercial hydroponic nutrients, which agrees with potassium concentrations in the sap of plants (data not presented). With limited potassium in the solution and the higher yield in the NFT system (Table 2), the result can be interpreted as a simple re-distribution and dilution of potassium within the tissues of the higher yielding plants.
For phosphorus in harvested shoots, concentration in 100% and 50% vermiliquer treatments was essentially the same, and both markedly higher than the control (Table 3), with a slight tendency for plants in the NFT system to accumulate more phosphorus in shoot tissue than in the pot system. Calcium and especially sulphur were both higher in the control than vermiliquer treatments, and in NFT than pot-grown plants. For zinc the reverse was evident (Table 3).
The concentration of magnesium in the shoots was higher in the 50% vermiliquer treatment than in the 100% vermiliquer treatment (Table 3), suggesting that even when diluted, vermiliquer appeared to provide an adequate source of magnesium for hydroponically-grown plants. Manganese concentration in the 50% vermiliquer treatment was four times less than in the 100% vermiliquer (Table 3), which did not correspond to the dilution rate.
Plants across all studies showed comparable boron concentration in plant tissues, with some tendency for the NFT plants to accumulate more boron than the pot plants in Study VIII (Table 3).

4. Discussion

4.1. Properties of the Vermiliquer

The initial EC of the ‘mature’ vermiliquer (Table 1) was similar to other published values for EC in leachate from vermiculture [7]. Measured values of 1.5 dS/m–2.6 dS/m generally compared favourably with values of inorganic hydroponic systems [13]. The EC is often used as a surrogate for nutrient concentration (i.e., the strength of the nutrient solution [13]), although it does not account for the individual losses or retention of specific ions in the solution. It is possibly also a suitable surrogate for nutrient concentration in vermiliquer-based hydroponics, for while the EC in the inorganic control treatments fell below 0.4 dS/m by harvest, indicating near depletion of nutrients, for vermiliquer EC did not drop and indeed by the end of most studies it increased (e.g., Study VI, Figure 6).
Total N values differed between treatments, with more in vermiliquer treatments than in the controls but we did not measure nitrate nor ammonium in initial samples. There is no definitive agreement on the availability of NO3 or NH4+ ions in vermiliquer, with some studies reporting more NO3 (e.g., 250 mg/L NO3 vs. 0 mg/L NH4+ [3] and 247 mg/L vs. 0 mg/L [2]), and others more NH4+ (e.g., 34 mg/L NH4+-N vs. 0 mg/L NO3 [9]), presumably reflecting differences in aeration, in the preparation and storage of the vermiliquer, and in acidification [11].
Other nutrients were normally within the required range by plants. Concentration of Na was considerably higher in the vermiliquer than in the control. High Na in liquid cattle manure extract (2520 mg/L [11]), vermiliquer from chicken manure (2000 mg/L [4]) and vermicompost (3360 μg/g [23]) has been reported which contributes to high EC but such high concentrations are not necessary for plant growth [24]. Lesser values have been reported (60 mg–80 mg Na/L) for cow vermiliquer [8] and 85 mg–160 mg for mushroom and composted wastes [9].

4.2. Buffering of the Vermiliquer

Of note, the pH of vermiliquer before buffering (Table 1) was always high (pH 7.8–9.2) and remained so in un-buffered vermiliquer. High solution pH leads to deficiency of nutrients, particularly Fe and P, and associated chlorosis and loss of market appeal in leafy vegetables and yield. Our pH values of un-buffered vermiliquer are within the pH range of vermiliquer reported by Frederickson [7] and close to that of Garcia-Gomez et al. [2]. The pH of the batch vermiliquer in the off-line studies was reduced below neutrality according to treatment. Limitations to adjusting pH in the vermiliquer collecting tanks with ‘live’ vermiliquer recirculating through worm-beds were due both to the need to buffer a relatively larger volume in the vermibed/tank system (>400 L compared to a smaller volume, ca. 100 L, in the batch hydroponics setups), and to the possible adverse effect of low pH on worms [25].
Although different studies were conducted on different vermiliquers at different times of the year and were subject to different ambient temperatures and other environmental factors, only a two-fold range of volume of HNO3 across studies was needed to adjust down a 100 L vermiliquer reservoir to pH 5.5, requiring for example less than 1 L of 10% HNO3 (Figure 1) equivalent to 222 mg/L N. The total amount of 10% nitric acid applied to the control treatment throughout the studies was at least 10 times less, ranging from 3 mL to 58 mL. The stability of pH following the initial addition of acid is considered as one of the major advantages for future use of vermiliquer as a liquid fertiliser in hydroponics. As expected, statistical analysis confirmed strong relationships between the amount of initial buffer added to the nutrient solutions and change in pH (r2 = 0.966, p < 0.01 in Study II).
Required quantities of buffer did differ somewhat according to the type of vermiliquer, to the acid used for buffering, and to the dilution of vermiliquer. In Study VI where vermiliquer was obtained from ‘paunch’ material and kitchen waste, the paunch required 25% less buffer than the kitchen-waste vermiliquer (541 vs. 708 mL per 100 L). Vermiliquer treatments buffered with H3PO4 required about thirty percent more buffer than with HNO3. This is expected because HNO3 is a stronger acid than H3PO4 [26].

4.3. Effect of Buffer and Its Type, pH, and Source of Vermiliquer on Root:Shoot Ratio, Nutrient Concentration in Solution, Sap and Shoots, and Yield and Quality

Investment in root growth was relatively greater in poorer performing treatments, in general those with non-buffered vermiliquer compared to the inorganic control (e.g., root:shoot ratios were 0.297 for the inorganic control vs. 0.472 for the vermiliquer treatment in Study IV—Table 2). Likewise, the root:shoot ratio of the non-buffered inline treatments of Study VII was much greater (1.382) than those buffered in the concurrent Study VI (0.349). Buffering with phosphoric acid in Study III led to a greater root:shoot ratio of 0.618 compared to 0.192 with nitric acid reflecting the lower investment in roots in the latter. However, the greater root investment characteristic of poor nutrient availability [27] did not always lead to a better uptake and concentration of nutrients in the shoot of the poorer performing treatments (Table 3). The root:shoot ratio was not affected by pH per se (Study II—Table 2) nor consistently according to type of vermiliquer, whether from food wastes or paunch materials.
In our studies there was surprisingly still much nitrate in vermiliquer at the end of each study. Figure 2 shows that there was always >600 mg/L of nitrate in vermiliquer, compared to negligible amounts present by harvest in the control. Despite this abundance of nitrate in solution by harvest, nitrate in sap (which was not always proportional to concentration in the solution) declined with time in all treatments, suggesting that besides availability of nitrate in solution the capacity of plants to utilise nitrate was governed largely by maturity. In general, total nitrogen concentration in the shoot was in accordance with the total amount of nitrogen contained in the nutrient solution, however it did not necessarily correspond to the nitrate concentration in the plant tissues. This suggests that the mechanism of nitrogen utilisation by plants, though promoted by the higher nitrogen/nitrate availability in the nutrient solution, was constrained by factors other than availability and agrees with the earlier reports [28] on poor correlations between total N and nitrate in some vegetables. Evidence suggests that plants can take up organic forms of N [29], but this is unlikely to satisfy much plant demand immediately.
Nitrogen concentration in shoots, both as total N and as NO3, was greater at lower pH and when nitric rather than orthophosphoric acid was used as buffer (Table 3). Kitchen wastes led to a greater concentration of N (and Fe and B) in harvested plants than did paunch-derived vermiliquer in Study VII but differed less in Study VI (Table 3). Non-buffered treatments (e.g., in Studies IV and V) led to low N and NO3 concentration in shoot tissues, and even more severely reduced biomass (Table 2) when compared to that with the buffered vermiliquer. For example, data from Study V show that the buffered vermiliquer (maintained at pH 5.5–6.5) had 43% higher tissue N and double the tissue NO3 (Table 3) and out-yielded the non-buffered vermiliquer (at pH > 8.0) by five times in fresh weight and four times in dry weight (Table 2). Likewise, in Study V leaf SPAD readings were higher for the buffered than non-buffered vermiliquer and increased over time (ranging over time from 27 to 32 in the non-buffered treatments, and from 30 to 38.5 in the buffered vermiliquer).
Quite clearly higher tissue N% was linked with higher biomass within and across (r2 = 0.41*) all studies but Study VII and VIII. This is in line with data presented for marigold (Tagetes erecta L.) and to a lesser extent for tomato (Lycopersicon esculentum Mill.) [9].
Phosphorus concentration was markedly greater with orthophosphoric acid buffer (Study II) and in the buffered vermiliquer treatments in Study VIII when compared to the control (Table 3). It was also 50% higher at pH 5.5 than at pH 7.0 (Study II), possibly due to formation and precipitation of insoluble phosphate at the higher pH.
In general, the potassium concentration in control and vermiliquer solutions declined with time (Figure 7), matched by a slight decline in concentration of K in sap (data not presented). Of interest, the vege-liquer treatment led to an increase in solution K over time compared to the control and vermiliquer treatments, both in the batch and in-line studies (Studies VI and VII) with higher concentrations of K in sap and shoots (Table 3). Nevertheless, concentrations of K (and S) were always higher in the control than vermiliquer treatments. Trends between vermiliquer treatments for Ca, Mg, Zn and Mn were not apparent, although higher zinc concentrations were apparent with nitric acid buffer (Studies II and III), as reported before [30].
Our data clearly indicate direct effects of pH per se, and of source of pH buffer. Yield was greater at pH 5.5 than at pH 7.0 and nitric acid was superior to orthophosphoric acid. In Study I, the total dry weight in the vermiliquer treatment buffered with orthophosphoric acid was seven times lower than in the control for the NFT system and twice to three times as low in the pot system. This is consistent with published data [21] that concentrations of phosphorus in phosphoric acid required to stabilize pH might be toxic to plants. In Study III (Table 2) total dry weight at harvest for the vermiliquer treatment buffered with nitric acid was four times greater than for that buffered with orthophosphoric acid, and even more so for fresh weight. Consequently, only 10% nitric acid was used as a pH buffer for subsequent studies. However, a mixture of nitric and phosphoric acids (2:1 ratio) has been recommended for acidification of liquid extract of cattle manure to pH 5.5–6.0 for tomato production [8].
The yield in the in-line vermiliquer treatments varied between studies, but it was always lower than in the corresponding batch vermiliquer buffered with nitric acid. For example, average shoot fresh weight in Study V was 2828 g/m2 in the in-line vermiliquer treatment compared with 3706 g/m2 in the buffered batch vermiliquer (Table 2). The difference in yield was more evident from the comparison between the buffered batch vermiliquer treatments in Study VI (6311 and 7244 g/m2 shoot fresh weight for vege-liquer and paunch-vermiliquer, respectively) and the in-line (not buffered) vermiliquer treatments in Study VII run at the same time (454 and 842 g/m2 fresh shoot weight for vege-liquer and paunch-vermiliquer respectively). Thus, in the worst case conditions for in-line vermiliquer production, the batch vermiliquer treatment buffered with nitric acid out-yielded the in-line vermiliquer treatment with unadjusted pH, by up to a tenfold difference.
Comparisons of yield between different sources of feedstock for worms, and therefore for vermiliquer, showed large variation but no significant differences, with yields greater for paunch than vegetable sources, especially with in-line treatments (Studies VI and VII in Table 2) and therefore further studies of this are implicated.

4.4. Yield Comparison between Vermiliquer and Control Treatments

Even though yields for the most successful vermiliquer treatments in most studies were somewhat less, though not always statistically so, than those in the control, our data show more promising outcomes than most previous reports on hydroponic plant production using organic fertilisers, vermiliquers or aquaculture liquid wastes [9,24,31].
The total fresh weight in the off-line (batch) vermiliquer treatments buffered with nitric acid ranged from 75% to 98% of the total fresh weight in the control (Studies II, III, VI and VIII—Table 2). For example, the total fresh weight of plants in the vermiliquer treatment buffered with nitric acid in the pot setup in Study II was 98% that of the control. In Study III the vermiliquer treatment buffered with nitric acid reached 87% of total fresh weight of the control treatment. Of interest, root weight was less sensitive to buffer source and pH than was shoot weight, perhaps in the same manner that root growth is well known to be less sensitive to drought and salinity than is shoot growth.

4.5. Dilution of Vermiliquer

The dilution of vermiliquer to reduce plant damage attributable to high concentrations of some minerals has been studied [2]. They showed that dilution necessary to offset inhibition of cress seed germination must be accompanied by an additional supply of NPK for maximum growth. In Study VIII we diluted vermiliquer to stretch its use and to reduce buffer requirements. A 50% dilution reduced the amount of buffer required by one half, with initial EC at just under 1 dS/m compared to 1.5 dS/m without dilution. The concentration of nitrate in the diluted solution and in plant sap (Figure 8) in that treatment, and SPAD readings (data not presented) were likewise lower (but not as low as the control). For example, sap nitrate dropped from ca. 6700 mg/L at two weeks to ca. 3750 mg/L at harvest in the full vermiliquer and from 7000 mg/L to ca. 3000 mg/L in diluted vermiliquer (and from 7250 mg/L to ca. 2000 mg/L in the control), although SPAD readings did not drop in the vermiliquer treatments over the course of the study (but they did in the control [32]). Values for potassium in the control solution were higher than vermiliquer treatments (ca. 130 mg/L for the first three weeks of growth, compared to ca. 45 mg/L for 100% and ca. 40 for the 50% treatments), in sap (reaching a maximum of 3500 mg/L, compared to 2100–2600 mg/L for the vermiliquer treatments) and in shoots at harvest (Table 3). Values of K in the sap at harvest ranged from 1300 mg/L to 1900 mg/L across treatments which compare well to acceptable values for leafy vegetables close to harvest (1900–2600 mg/L [33]). Concentrations of K in shoots at harvest were consistently higher for the control than for the vermiliquer treatments, and higher for the diluted vermiliquer than full strength (Table 3).
Fresh yields with diluted vermiliquer were 65–71% of those for undiluted vermiliquer and dry yields 79%–90% of undiluted vermiliquer (Study VIII—Table 2), and in similar studies fresh yields were at least 80% of undiluted vermiliquer [32]. The yield reductions and SPAD values are comparable to those reported [10] working with a 75% dilution low EC-high pH/high EC-low pH comparison.

4.6. Effect of Solution Temperature on Dissolved Oxygen and of Thermo-Insulation on Temperature

4.6.1. Temperature and Dissolved Oxygen

The control and the vermiliquer treatments in our studies were continuously aerated in the vermifarm collecting tanks, batch store tank and individual reservoirs with nutrient solutions for the batch hydroponics.
A close relationship was evident between the dissolved oxygen concentration and the temperature of the solution within the reservoir, highlighting the importance of insulation for an enhanced supply of oxygen (Figure 4). The separate relationships between temperature and dissolved oxygen for control and vermiliquer is akin to the reported difference in dissolved oxygen concentration between pure water and vermicompost tea made from chicken manure [4].

4.6.2. Thermo-Insulation

The amplitude of temperature fluctuations in the non-insulated reservoirs was considerably greater than in the insulated reservoirs. Solution temperature reached 34 °C in the day and dropped to 23 °C at night in non-insulated containers but if insulated did not exceed 29 °C with minimum night temperature ca. 26 °C, a range considered suitable for pak choy [16]. The greater cushioning effect of the in-line than batch treatment on solution temperature was also evident (e.g., Figure 3).

4.7. Comparisons of NFT and Pots

4.7.1. Yield

A direct comparison of yield of pak choi in NFT and pots, with inorganic or vermiliquer nutrient sources, was possible in Studies I and VIII. Total fresh yield was greatest in the control with pots followed by the control with NFT in Study I (Table 2). The use of vermiliquer reduced yields in both, but more so in NFT. Plants in this treatment combination showed chlorosis in the first week of the experiment [32], whereas those with vermiliquer in pots did not show symptoms until 18 days of treatment. Dry weights showed a similar trend to those of fresh weight, but there was no difference between NFT and pots with inorganic (control) nutrients (Table 2). Nevertheless, in Study I overall yields with pots were greater than with NFT.
In the cooler conditions of Study VIII, fresh weight was greatest in the inorganic control with NFT followed by the inorganic control with pots. With complete vermiliquer, fresh yields were 77% and 84% of the control in pots and NFT, respectively. Again, plant total dry weight showed similar trends, although NFT with vermiliquer yielded more than the control with pots, but the difference was not significant. In essence, the influence of nutrient source was significant, but less so with NFT than pots in Study VIII.
A greater proportion of total dry weight was invested in roots with NFT than with pots, whether with inorganic or vermiliquer sources of nutrients (Table 2). For example, in Study VIII root dry weight on average was 57% that of shoot dry weight with pots compared to 92% for NFT.
Performance of pak choi under less favourable conditions (i.e., hotter in Study I) was better with pots than with NFT, and more so if with vermiliquer. The pot system helped to compensate for stress-factors such as nutrient deficiencies, high temperatures and interrupted supply of the nutrient solution, but off-setting this clumping of plants in pots compared to equidistant spacing in NFT would favour yield in the latter.

4.7.2. Nutrient Concentration in the Shoot Tissues of NFT and Pot Systems

There were no consistent differences in Study VIII between the NFT and pot systems in the concentration in the shoot tissues of nitrogen (N) although phosphorus (P) was higher when vermiliquer was the nutrient source (Table 3). Of note, uptake of B, Ca, Mg, Mn, S and Zn was higher in the NFT system across all treatments. Potassium (K) was consistently higher in the pot system; but this is not consistent with the relatively greater root system in NFT.

4.8. WUE

WUE was always higher in the control compared with the vermiliquer treatments (Table 4). Half-diluted vermiliquer used almost as much water as did full-strength vermiliquer in Study VIII, but yield was somewhat lower with half-diluted vermiliquer, hence its WUE was also lower. Variation in plant yield, more so than in water consumption, was responsible for the observed treatment effects on WUE. Therefore, the treatment with vermiliquer sourced from the kitchen waste was less water-efficient than vermiliquer obtained from the paunch material (Study VI) and in Study V the WUE in the non-buffered vermiliquer treatment was one half that in the buffered vermiliquer treatment. WUE in these experiments was closely comparable with published data for hydroponic systems [34].

5. Conclusions

The importance of adjusting the pH of vermiliquer downwards in order for it to be used as a liquid hydroponic fertiliser, giving fresh yields of pak choi comparable to an inorganic nutrient source, has been demonstrated. Nitric acid was superior to orthophosphoric acid as a pH buffer. The performance of pak choi in vermiliquer grown in hydroponic pots was superior to that in NFT when ambient conditions were less favourable for crop growth. The dilution of vermiliquer, or the direct linkage of vermifarms with hydroponics, were both considerably less productive than the control or 100% batch vermiliquer. Certified organic production currently excludes hydroponics, but when it does, alternative acids to nitric acid will be required and research on this is called for.

Author Contributions

D.J.M. conceptualised the study, E.V.C. undertook all experiential studies and the initial statistical analyses and draft preparation, D.J.M. reviewed and edited.

Funding

This research was funded by the Rural Industries Research and Development Corporation grant number PRJ-000657.

Acknowledgments

We thank W. McDonald for technical support and numerous improvements to the vermiculture and hydroponic systems; Boxsell Hydroponics and Vermicrobe International Ltd. for generously supplying infrastructure; and to Drs Roe, Bhattarai and Reid and other staff and students of the Centre for Plant and Water Science CQUniversity for their valuable input.

Conflicts of Interest

The authors declare no conflict of interest.

References

  1. Edwards, C.A.; Bohlen, P.J. Biology and Ecology of Earthworms; Chapman and Hall: London, UK, 1996. [Google Scholar]
  2. Garcia-Gomez, R.C.; Dendooven, L.; Gutierrez-Miceli, F.A. Vermicomposting leachate (worm tea) as liquid fertilizer for maize (Zea mays L.) forage production. Asian J. Plant Sci. 2008, 7, 360–367. [Google Scholar]
  3. Gutierrez-Miceli, F.A.; Garcia-Gomez, R.C.; Rincon, R.R.; Abud-Archilla, M.; Oliva, L.M.A.; Marcos, J.G.C.; Dendooven, L. Formulation of a liquid fertilizer for sorghum (Sorghum bicolor (L.) Moench) using vermicompost leachate. Bioresour. Technol. 2008, 99, 6174–6180. [Google Scholar] [CrossRef] [PubMed]
  4. Pant, A.P.; Radovich, T.J.K.; Hue, N.V.; Talcott, S.T.; Krenek, K.A. Vermicompost extracts influence growth, mineral nutrients, phytonutrients and antioxidant activity in pak choi (Brassica rapa cv. Bonsai, Chinensis group) grown under vermicompost and chemical fertiliser. J. Sci. Food Agric. 2009, 89, 2383–2392. [Google Scholar] [CrossRef]
  5. Atiyeh, R.M.; Lee, S.; Edwards, C.A.; Arancon, N.Q.; Metzger, J.D. The influence of humic acids derived from earthworms-processed organic wastes on plant growth. Bioresour. Technol. 2002, 84, 7–14. [Google Scholar] [CrossRef]
  6. Zhai, Z.; Ehret, D.L.; Forge, T.; Helmer, T.; Lin, W.; Dorais, M.; Papadopoulas, A.P. Organic fertilizers for greenhouse tomatoes: Productivity and substrate microbiology. HortScience 2009, 44, 800–809. [Google Scholar] [CrossRef]
  7. Frederickson, J. Vermicomposting Trial at the Worm Research Centre: Part 1. Technical Evaluation. Integrated Waste Systems; Integrated Waste Systems, Open University: Milton Keynes, UK, 2002. [Google Scholar]
  8. Capulin-Grande, J.; Nunez-Escobar, R.; Sanchez-Garcia, P.; Martinez-Garza, A.; Soto-Hernandez, M. Tomato production with liquid extract of cattle manure, acidulated with organic and inorganic acids. Terra Latinoam. 2005, 23, 241–247. (In Spanish) [Google Scholar]
  9. Jarecki, M.K.; Chong, C.; Voroney, R.P. Evaluation of compost leachates for plant growth in hydroponic culture. J. Plant Nutr. 2005, 28, 651–667. [Google Scholar] [CrossRef]
  10. Wortman, S.E. Crop physiological response to nutrient solution electrical conductivity and pH in an ebb-and-flow hydroponic system. Sci. Hort. 2015, 194, 34–42. [Google Scholar] [CrossRef]
  11. Capulin-Grande, J.; Nunez-Escobar, R.; Etchevers-Barra, J.; Baca-Castillo, G. Evaluación del extracto líquido de estiércol bovino como insumo de nutrición vegetal en hidroponía. Agrociencia 2001, 35, 287–299. [Google Scholar]
  12. Rousk, J.; Brookes, P.C.; Bååth, E. Contrasting soil pH effects on fungal and bacterial growth suggest functional redundancy in carbon mineralization. Appl. Environ. Microbiol. 2009, 75, 1589–1596. [Google Scholar] [CrossRef] [PubMed]
  13. Benton Jones, J., Jr. Complete Guide for Growing Plants Hydroponically; CRC Press, Taylor & Francis Group: Boca Raton, FL, USA, 2014. [Google Scholar]
  14. Midmore, D.J. Principles of Tropical Horticulture; CABI: Wallingford, UK, 2015. [Google Scholar]
  15. Pramanik, M.H.R.; Nagai, M.; Asao, T.; Matsui, Y. Effects of temperature and photoperiod on phytotoxic root exudates of cucumber (Cucumis sativus) in hydroponic culture. J. Chem. Ecol. 2000, 26, 1953–1967. [Google Scholar] [CrossRef]
  16. Leow, A.C.T.; Wong, S.R. Chilling the root zone: Revolutionary energy cost-saving chilling system for temperate plant production in tropical climates. Pract. Hydroponics Greenh. Mag. 2006, 91, 20–26. [Google Scholar]
  17. Cometti, N.N.; Bremenkamp, D.M.; Galon, K.; Hell, L.R.; Zanotelli, M.F. Cooling and concentration of nutrient solution in hydroponic lettuce crop. Hortic. Brasil. 2013, 31, 287–292. [Google Scholar] [CrossRef] [Green Version]
  18. Trolldenier, G.; Hect-Buchholz, C. Effect of aeration status of nutrient solution on microorganisms, mucilage and ultrastructure of wheat roots. Plant Soil 1984, 80, 381–390. [Google Scholar] [CrossRef]
  19. Urrestarazu, M.; Mazuela, P.C. Effect of slow release oxygen supply by fertigation on horticultural crops under soilless culture. Sci. Hort. 2005, 106, 484–490. [Google Scholar] [CrossRef]
  20. Holtman, W.; van Duijn, B.; Blaakmeer, A.; Blok, C. Optimalization of oxygen levels in root systems as effective cultivation tool. Acta Hort. 2005, 697, 57–64. [Google Scholar]
  21. Bugbee, B.G. Nutrient management in recirculating hydroponic culture. Acta Hort. 2004, 648, 99–112. [Google Scholar] [CrossRef]
  22. Winterborne, J. Hydroponics. Indoor Horticulture; Pukka Press Ltd.: Guildford, Surrey, UK, 2005. [Google Scholar]
  23. Arancon, N.Q.; Edwards, C.A.; Bierman, P.; Metzger, J.D.; Lucht, C. Effects of vermicomposts, produced from cattle manure, food waste and paper waste on the growth and yield of peppers in the field. Pedobiologia 2005, 49, 297–306. [Google Scholar] [CrossRef]
  24. Williams, K.A.; Nelson, J.S. Challenges of using organic fertilizers in hydroponic production systems. Acta Hort. 2016, 1112, 365–370. [Google Scholar] [CrossRef]
  25. Gunadi, B.; Edwards, C.A. The effects of multiple applications of different organic wastes on the growth, fecundity and survival of Eisenia fetida (Savigny) (Lumbricidae). Pedobiologia 2003, 47, 321–329. [Google Scholar] [CrossRef]
  26. Housecroft, C.E.; Sharpe, A.G. Inorganic Chemistry; Pearson: Harlow, UK, 2005. [Google Scholar]
  27. Brouwer, R. Nutritive influences on the distribution of dry matter in the plant. Neth. J. Agric. Sci. 1962, 10, 361–376. [Google Scholar]
  28. Lyons, D.J.; Rayment, G.E.; Nobbs, P.E.; McCallum, L.E. Nitrate and nitrite in fresh vegetables from Queensland. J. Sci. Food Agric. 1993, 64, 279–281. [Google Scholar] [CrossRef]
  29. Paungfoo-Lonhienne, C.; Lonhienne, T.G.; Rentsch, D.; Robinson, N.; Christie, M.; Webb, R.I.; Gamage, H.K.; Carroll, B.J.; Schenk, P.M.; Schmidt, S. Plants can use protein as a nitrogen source without assistance from other organisms. Proc. Natl. Acad. Sci. USA 2008, 105, 4524–4529. [Google Scholar] [CrossRef] [PubMed] [Green Version]
  30. Sonneveld, C.; Voogt, W. Plant Nutrition of Greenhouse Crops; Springer Sciences and Business Media: London, UK, 2009. [Google Scholar]
  31. Rakocy, J.E.; Bailey, D.S.; Danaher, J.J. Preliminary evaluation of organic waste from two aquaculture systems as a source of inorganic nutrients for hydroponics. Acta Hort. 2007, 742, 201–207. [Google Scholar] [CrossRef]
  32. Midmore, D.J.; Churilova, E.; Roe, B. Roof-Top Gardens: An Option for Green Roof-Tops and Self-Sufficient Fresh Food Production; RIRDC Publication No. 11/067; Rural Industries Research and Development Corporation: Barton, ACT, Australia, 2011. [Google Scholar]
  33. Parks, S. Improving nutrient management through using on-farm meters and interpreting nutrient analysis—Crop nutrition from the point of view of the plant. In Proceedings of the National Conference of the Australian Hydroponics & Greenhouse Industry, Homebush, Australia, 19–22 July 2009; pp. 108–110. [Google Scholar]
  34. Bhattarai, S.P.; Salvaudon, C.; Midmore, D.J. Oxygation of the rockwool substrate for hydroponics. Aquaponics J. 2008, 49, 29–33. [Google Scholar]
Figure 1. Quantity and timing of pH buffer (10% HNO3) used in Study II to achieve different pH of vermiliquer nutrient solution, transplanted 31 October 2008.
Horticulturae 05 00026 g001
Figure 2. Nitrate concentration (mg/L) in nutrient solutions over time during Study II, with different pH of vermiliquer solutions, transplanted 31 October 2008. Vertical bars represent SD of the mean.
Horticulturae 05 00026 g002
Figure 3. Temperature (°C) in the control and in-line vermiliquer nutrient solutions in Study IV, measured in the early morning.
Horticulturae 05 00026 g003
Figure 4. Relationship between dissolved oxygen (DO—mg/L) and nutrient solution temperature (°C) for vermiliquer and control (Boxell inorganic nutrient) sources in Study IV. Regression analysis indicated parallel lines (b = 0.283 ± 0.016), with different intercepts, Vermiliquer: y = 15.44 − 0.283x, Control y = 15.70 − 0.283x, R2 = 0.680 for combined regressions.
Horticulturae 05 00026 g004
Figure 5. Trend in SPAD readings (arbitrary units) over time in the in-line, the buffered and unbuffered batch vermiliquer treatments in Study V, transplanted 26 March 2009. Vertical bars represent SD of the mean.
Horticulturae 05 00026 g005
Figure 6. Trend in EC (mS/m) over time in the control, vermiliquer and vege-liquer solutions in Study VI, transplanted 22 August 2009.
Horticulturae 05 00026 g006
Figure 7. Trend in potassium concentration (mg/L) in the control, vermiliquer and vege-liquer solutions over time in Study VI, transplanted 22 August 2009. Vertical bars represent SD of the mean.
Horticulturae 05 00026 g007
Figure 8. Trend in nitrate concentration (mg/L) in sap in the control, 100% and 50% vermiliquer treatments over time in Study VIII, transplanted 29 June 2009. Vertical bars represent SD of the mean.
Horticulturae 05 00026 g008
Table 1. Chemical composition and other properties of control and vermiliquer solutions before buffering at the start of Studies II-V and start and end of Study VIII.
StudypHEC (dS/m)Total N (mg/L)K (mg/L)Total P (mg/L)Ca (mg/L)Mg (mg/L)Na (mg/L)
Control6.501.70120189217019<1
II8.502.56134236405426504
III8.462.08227154528226523
IV7.690.9214573526214454
V9.201.9814181476216425
VIII—start8.41.494642?87129361080
VIII—post harvest6.203.48182<1293712398
Table 2. Yield and plant biomass parameters of pak choi at harvest (g/m2) in each of the studies. The batch system was used unless stated otherwise. Paunch compost was used unless kitchen waste (k/w) is indicated.
StudyPeriodReps/Plants per potPot/nftTreatment—Type of BufferFresh WeightDry WeightRoot: Shoot Ratio% of Highest Total Dry Weight Yield or of Control
ShootsRootsTotalShootsRootsTotal
I08/08/08–05/09/082/4PotControl—pH 7.0 OP x5899 a z192 a6091 a210 a8 a218 a0.038100%
Vermiliquer—pH 7.0 OP1886 c68 c2014 c101 b7 a108 b0.06950%
2/-NFTControl—pH 7.0 OP3466 b252 a3718 b194 a16 a210 a0.082100%
Vermiliquer—pH 7.0 OP472 d128 b540 d25 c5 a30 c0.20014%
II31/10/08–26/11/084/3PotControl—pH 5.5 NA y 9398 a447 a9844 a379 a41 a420 a0.108100%
Vermiliquer—pH 7.0 NA7785 b322 a8108 b272 b24 a296 b0.08868%
Vermiliquer—pH 5.5 NA9306 a331 a9634 a287 b24 a311 b0.08471%
III05/12/08–30/12/084/2PotControl—pH 5.5 NA6205 a663 a6867 a341 a97 a437 a0.284100%
Vermiliquer—pH 5.5 OP481 b193 c675 c55 b34 c89 c0.61820%
Vermiliquer—pH 5.5 NA5538 a444 b5980 b306 a59 b366 b0.19384%
IV02/02/09–05/03/092/2PotControl—pH 5.5 NA8202 a913 a9116 a531 a158 a688 a0.297100%
In-line vermiliquer—no buffer1597 b319 b1917 b108 b51 b161 b0.47223%
V26/03/09–27/04/092/2PotVermiliquer—pH 5.5 NA3706 a316 a4150 a182 a59 a241 a0.324100%
Vermiliquer—no buffer687 b121 a808 b44 b17 b61 b0.38625%
In-line vermiliquer—no buffer2828 a514 a3342 a145 ab67 a212 a0.46288%
VI22/08/09–19/09/094/-NFTControl—pH 5.5 NA9394 a980 a10372 a373 a124 a495 a0.332100%
Vege-liquer (k/w)—pH 5.5 NA6311 a901 a7212 a278 a97 b375 a0.34976%
Vermiliquer—pH 5.5 NA7244 a1016 a8260 a298 a118 a416 a0.39684%
VII22/08/09–20/09/094/-NFTIn-line vege-liquer (k/w)—none454 a233 a688 a34 a47 a81 a1.382100%
In-line vermiliquer—no buffer842 a416 a1272 a71 a69 a140 a0.97258%
VIII29/06/09–31/07/093/2PotControl—pH 5.5 NA9998 a757 b10752 ab253 a 110 b362 bc0.434100%
50% Vermiliquer—pH 5.5 NA5095 c769 b5864 d138 c105 b243 d0.76167%
100% Vermiliquer—pH 5.5 NA7476 b793 b8275 bc177 bc91 b269 d0.51474%
3/-NFTControl—pH 5.5 NA11107 a944 a12054 a267 a199 a466 a0.745100%
50% Vermiliquer—pH 5.5 NA5674 c945 a6621 cd150 c162 a312 c1.08064%
100% Vermiliquer—pH 5.5 NA9076 b994 a10097 ab205 b190 a396 ab0.92783%
x 10% orthophosphoric acid (OP); y 10% nitric acid (NA). z Means within a column and a study followed by the same letter do not differ at p ≤ 0.05.
Table 3. Summary of the concentration of some macro and micro-nutrients in shoot tissues in different studies, expressed on a dry weight basis. Batch system unless stated otherwise. Paunch compost unless k/w = kitchen waste.
StudyElement NNO3PKNaCaMgClSCuZnMnFeB
Treatment—Type of pH BufferPot/nft%mg/kg%%%%%%%mg/kgmg/kgmg/kgmg/kgmg/kg
IIControl—pH 5.5 NA ypot4.6412,7720.8194.2792.7741.5920.5920.8780.6355.39234.0227.0154.835.8
Vermi—pH 7.0 NApot3.9268390.5144.9690.2851.7130.8470.6370.6085.78173.8826.91007.140.3
Vermi—pH 5.5 NApot4.9918,7530.7633.6562.1691.8370.7490.7260.5276.67143.9219.3803.229.7
IIIControl—pH 5.5 NApot3.8492730.4644.9990.1802.0780.6490.4620.7143.4251.9715.970.638.5
Vermi—pH 5.5 OP xpot1.537080.7862.7140.7050.8570.3271.0680.5802.9957.3542.656.118.4
Vermi—pH 5.5 NApot5.0822,0850.5793.9582.2701.4130.5190.4580.4733.21135.6272.367.827.7
IVIn-line Vermi—no bufferpot2.9430800.6474.6901.4261.5240.4912.2670.5303.7994.7348.4346.529.2
VBatch Vermi—pH 5.5 NApot5.2318,3100.6363.3332.7661.6540.6081.5020.5944.33132.7724.5108.730.3
Batch Vermi—no bufferpot3.6591200.7004.8602.1831.2970.5582.3840.6633.2871.1810.247.123.5
In-line Vermi—no bufferpot4.2526410.6004.2131.6611.2880.3371.3290.6043.5390.6741.661.929.8
VIControl—pH 5.5 NAnft5.80 0.5807.9401.5602.3800.870 1.0206.18109.2770.1194.478.9
Vege-liquer k/w—pH 5.5 NAnft3.27 0.5807.4501.0303.0701.050 1.0804.5072.2840.8219.768.4
Vermiliquer—pH 5.5 NAnft4.21 0.7105.0202.9002.3200.770 0.7105.29137.8153.1159.355.6
VIIIn-line vege-liquer k/w—no buffernft5.13 0.8309.3001.2501.9400.890 1.3105.9185.9637.0183.658.5
In-line vermiliquer—no buffernft2.25 0.5502.2702.2701.2000.320 0.5002.1561.2352.489.331.8
VIIIControl—pH 5.5 NApot4.09 0.4606.2600.3702.2900.840 0.7003.8133.3415.6176.844.0
50% Vermi—pH 5.5 NApot5.70 0.6702.5002.8502.0800.650 0.2804.6990.4288.0210.337.5
100% Vermi—pH 5.5 NA acidpot4.42 0.6101.8902.1901.9800.810 0.1704.1697.2115.1174.148.3
Control—pH 5.5 NAnft4.22 0.4504.5800.2702.6200.830 0.7703.6842.5119.1183.952.4
50% Vermi—pH 5.5 NAnft5.14 0.7102.2603.6002.4600.780 0.2904.81133.1397.3186.849.1
100% Vermi—pH 5.5 NA acidnft4.71 0.6901.6992.1202.1800.930 0.2404.79173.7022.5208.962.1
x 10% orthophosphoric acid (OP); y 10% nitric acid (NA).
Table 4. Water use efficiency (WUE), calculated as total dry weight (root plus shoot) per unit of accumulated water used by evapo-transpiration in three studies.
StudyGrowth PeriodDaysSystem (Pot/NFT)TreatmentWUE (g/L)
V26/03/09–27/04/0933PotBatch vermiliquer, buffered1.63
Batch vermiliquer, non-buffered0.87
VI22/08/09–19/09/0929NFTControl2.29
Vege-liquer (kitchen waste)1.95
Vermiliquer (paunch)2.25
VIII26/06/09–31/07/0932Pot/NFTControl2.08
50% vermiliquer1.74
100% vermiliquer1.87

