Abstract
Monitoring the maturation process of Satsuma mandarin (Citrus unshiu Marc.) by determining the soluble solids (SS) and acid content non-destructively is needed. Fluorescence components potentially offer such means of accessing fruit maturity characteristics in the orchard. The aim of this study was to determine the potential of fluorescence spectroscopy for monitoring the stage of citrus maturity. Four major fluorescent components in peel and/or flesh were found including chlorophyll-a (excitation (Ex) 410 nm, emission (Em) 675 nm) and chlorophyll-b (Ex 460 nm, Em 650 nm),polymethoxyflavones (PMFs) (Ex 260 nm and 370 nm, Em 540 nm), coumarin (Ex 330 nm, Em 400 nm), and a tryptophan-like compound (Ex 260 nm, Em 330 nm). Our results indicated a significant (R2 = 0.9554) logarithmic ratio between tryptophan-like compoundsExEm and chlorophyll-aExEm with the SS:acid ratio. Also, the log of the ratio of PMFs from the peel (ExExEm was significantly correlated with the SS:acid ratio (R2 = 0.8207). While the latter correlation was not as strong as the former, it does demonstrate the opportunity to develop a non-destructive field measurement of fluorescent peel compounds as an indirect index of fruit maturity.
1. Introduction
After bananas and apples, citrus has been the third most popular fruit consumed in Japan since 1975. Among the various citrus cultivars grown in Japan, Satsuma mandarin (Citrus unshiu Marc.) is one of the most popular. Around 90 percent of Satsuma mandarin produced in Japan is consumed fresh, 7 percent is juice, and 3 percent is canned [1]. To provide high-quality citrus, an accurate estimation of optimum maturity for harvest is required. If over-mature citrus are harvested, they are more susceptible to mechanical damage during handling, which can lead to abundant rotten fruit. On the other hand, harvesting immature fruit will result in unmarketable products, with unpleasant flavor, since the fruit is not yet physiologically mature. Thus, maturity index is an important quality parameter for determining the time of harvest.
As noted above, the most important factor determining fruit quality is maturity [2], defined as the phase of development leading to the attainment of physiological or horticultural maturity. In other words, maturity is the final stage of natural growth and development [3]. In this respect, a maturity index can quantify whether a certain product is mature, providing the fruit grading industry with a trade rule or trading strategy, as well as efficient use of resources [3]. There are several parameters commonly used to determine maturity, such as color change [4]; soluble solids (SS)-to-acid ratio [5]; and firmness, size, and shape [3,6]. Among these parameters, the SS:acid ratio is the most important since it determines the flavor of the products.
Conventionally, farmers determine citrus maturity by physical inspection, observing color and SS content measurements, or chronologically (calculation of growth period since post-anthesis period). However, observations of color, or through calendar calculations, are subjective and inaccurate methods of determining maturity. Furthermore, SS and acid content measurements are destructive, can only be applied to a few samples, and are labor-intensive.
Considerable efforts have gone into developing alternative maturity detection methods, such as the electronic nose, machine vision systems, and visible-near infrared (VIS-NIR). One such successful method for monitoring mandarin ripeness and quality attributes (firmness, SS, and acidity) is use of an electronic nose technique [7]. However, this technique requires strict environmental controls due to sensitivity to humidity, and is expensive to implement. Furthermore, a machine vision system for maturity determination based on color information and the ratio of total SS to titratable acidity (TA) has been developed [8], but requires complicated artificial lighting in a closely controlled dark room. Portable VIS-NIR spectroscopy has also been successfully developed to estimate mandarin maturity status based on total SS and (TA) [9]. Like the other methods however, this method is relatively expensive.
In contrast, fluorescence spectroscopy, a sensitive, cheap, fast, and easily applied technique [10], has the potential to detect information from rich fluorophore dynamics in order to monitor changes in plant tissue compounds. Fruit maturity in Satsuma mandarin may be related to the medium fluorescence emissions [11], which are relatively easy to detect. Recently, fluorescence spectroscopy has been used to indicate the maturity of fruits such as apples and grapes by using a multiplex sensor [12,13]. To the best our knowledge, however, there is no research investigating the potential of fluorescence techniques for maturity determination in citrus. Thus, the aim of this research was to investigate the potential of fluorescence spectroscopy for estimating the stage of maturity in Satsuma mandarin. The fluorescence characteristics were monitored during the growth and maturation stages (stage II and stage III) and compared with a standard maturity index (SS/acid ratio).
2. Materials and Methods
2.1. Materials
At each monthly sampling time, 22 Satsuma mandarins (cv. Miyagawa Wase) located at the top of the canopy (exposed to sunlight) were harvested from June 2016 (30 days after anthesis) to December 2016 (210 days after anthesis) from 35-year-old trees grown in the Ehime Research Plant orchard, Ehime Prefecture, Japan.
2.2. Methods
2.2.1. Sample Preparation
The harvested fruit were sorted manually based on peel appearance, wherein undamaged fruit were chosen. A color image of these fruit was captured using a color camera equipped with a polarized filter and illuminated by four halogen lamps. From these 22 samples, based on color value (red/green) ratio (Python 2.7.12 with OpenCV library), 10 fruit were selected to minimize variability (those fruit with the closest R/G ratios). The 10 selected fruit were divided into five groups for data replication. All fruit chosen for subsequent measurement were cleaned using an ultrasonic cleaner (As-One US-2A, As-One, Osaka, Japan) for 5–10 min to remove dust and dirt, then wiped dry and kept at room temperature (25 °C) overnight in order to reach equilibrium temperature before extraction.
2.2.2. Peel and Flesh Extraction
Sampled fruit were divided into two main parts: peel (including albedo and flavedo) and flesh (including juice sacs and segments), as shown in Figure 1. Citrus peel contains a number of volatile oils [14]. These volatile oils can be easily dissolved in organic solvents [11]. In this experiment, the fluorescent substances were extracted using chloroform as a solvent (Wako Pure Chemical Industries, Osaka, Japan).
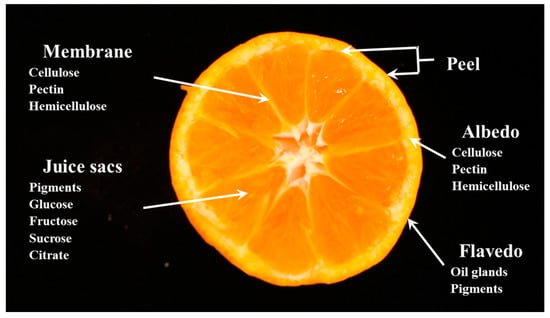
Figure 1.
Diagrammatic equatorial cross-section of citrus fruit [15].
For June and July samples, since the peel and flesh could not be separated, the whole fruit was extracted. The crushed citrus was weighed (Shimadzu AUW-220D, Shimadzu Co., Kyoto, Japan) and mixed with chloroform at a ratio of 1:3 (1 g by 3 mL chloroform), then homogenized and macerated for 60 min using a mechanical shaker (Wakenyaku 2240, Wakenbtech Co., Ltd., Kyoto, Japan). This extracted fluorescence compounds. Afterward, liquid extracts were filtered (Whatman No. 41) and placed directly into a vial. June and July data for the peel and flesh were referred to as the peel).
For the August to December samples, the peel was separated from the flesh. For peel extraction, four pieces of peel with an area of 100 square mm (10 mm × 10 mm) from different locations around the bottom part of the fruit were sampled, weighed, and their thickness was measured using a Vernier caliper (Mitutoyo PCX-15, Mitutoyo Co., Kanagawa, Japan). Peel and flesh were extracted separately. Peel samples were cut into small segments using scissors and mixed with chloroform at a ratio of 1:5 (1 unit area by 5 mL chloroform). Fleshwas also cut into small segments and mixed at a ratio of 1:3 (1 g by 3 mL chloroform). Then, both were separately macerated and homogenized for 60 min, filtered, and extracts placed directly into a vial.
2.2.3. Soluble Solid Content and Acidity Measurement
Brix, which is sugar or SS content, and acids (acidity) are the most important quality parameters used to represent the sweetness and acidity of fresh citrus fruit. The ratio of SS to acidity (SS/acid) is widely used as a maturity criterion for non-climacteric fruit. SS and acidity were measured using a hand-held digital refractometer (Atago PAL-BX|ACID F5, Atago Co., Ltd., Tokyo, Japan). From the flesh of each sample, juice was squeezed by hand and filtered (Whatman No. 41 filter paper). Then, a 0.2-mL clear liquid aliquot of the filtered juice was directly pipetted onto the sensor and SS content (% Brix) measured. Once the Brix value was recorded, the sample was diluted by adding distilled water—up to 10 mL—on the sensor, and the acidity was measured.
2.2.4. Fluorescence Spectrum Measurement
Fluorescence measurements were conducted sequentially the following day. Liquid samples were placed into four clear fluorescence quartz glass cuvettes with a 10-mm path length, and their spectra were measured. For this spectral measurement, a spectrofluorophotometer (Jasco FP-8300, Jasco Co., Tokyo, Japan) was used to scan the excitation (Ex) and emission (Em) wavelengths. The instrument was connected to a computer, which had special software (SpectraManagerTM Tokyo, Japan) for spectra capture and analysis. The excitation (Ex) wavelength was scanned from 200 to 550 nm at 10-nm increments and the emission (Em) wavelength was scanned from 210 to 750 nm at 1-nm increments. The excitation and emission slits were maintained at 5 nm, with a scan speed of 5000 nm/min and response time of 50 ms for all measurements.
2.2.5. Data Processing
All raw spectrum results were captured and corrected by Rhodamine B and a halogen light source using SpectraManagerTM application software, after which the intensity was normalized using the Raman scatter peak of water [16]. Finally, the peak finder in the SpectraManagerTM application software was used to find desirable fluorescence intensity peaks. The statistical analyses were conducted on averaged raw data using Microsoft Excel 2013. A t test used, and the significance threshold was set at 0.001.
3. Results and Discussion
3.1. Fruit Growth and Development
Citrus fruit growth and development follows a typical sigmoid growth curve, divided into three stages [17], as shown in Figure 2. The first stage involves rapid cell division and then a period of slow growth. The growth is controlled by indole acetic acid (IAA) and indoleacetamide (IAM) [18]. Physiological fruit abscission also occurs through this period, which is caused by hormonal imbalance [19]. During this stage, peel tissue undergoes intensive changes with production of a large number of cells, causing the peel volume to be much greater than that of the pulp. Moreover, citrus juice in this period is exiguous and the activities of the enzymic systems and chlorophyll content also abundant [20]. After reaching a peak, the peel thickness diminishes in proportion to the internal tissue.

Figure 2.
Growth and development stages of Satsuma mandarin in Japan.
In stage II, rapid cell enlargement takes place as the fruit enlarges physically and liquid begins to accumulate. This cell enlargement is commonly promoted by auxins [5], controlling fruit size. During this stage, the volume of juice sacs rises, developing their distinctive liquids. This liquid component is high in organic acids and low in SS; the main organic acid in citrus juice is citric acid. Furthermore, citric acid is generated in the mitochondria of juice cells by the Krebs cycle and stored in the vacuoles [15].
At the beginning of liquid accumulation, the high citric acid concentration is one of the reasons for the resulting low SS/acid ratio. During fruit growth th e ratioincreases due to catabolism of citric acid, while SS content increases due to the high amount of soluble carbohydrates. In this stage, the citrus fruit peel undergoes a color change from green to yellow or orange—a process that is characterized by the progressive loss of chlorophyll, which is accompanied by formation of other pigments such as anthocyanins or carotenoids. The color conversion results from the differentiation of chloroplasts to chromoplasts, and is influenced by many factors, including hormones, environmental conditions, and nutrient availability. Moreover, exogenous ethylene accelerates chlorophyll degradation and increases chlorophyllase activity [21]. This natural color change is associated with the accumulation of sugars and the degradation of acids [22].
Finally, stage III or the maturing period starts around 5 months after the start of fruit growth. In this period, growth is mostly complete and fruit ripening is a non-climacteric process. This process is economically important since the color of citrus fruit is a crucial quality parameter for consumers. During this process, Satsuma color becomes orange, growth is minimized, and metabolic shifts occur to integrate biochemical and physiological changes that eventually render the flesh edible. Farmers harvest the fruit a onth to 6 weeks later, in early to mid-November, at the optimum maturity stage based on SS content determined by random sampling. After harvest, the maturing process will cease, accompanied by respiration, major changes in flavor, and senescence.
Our results demonstrated that in November, the SS:acid ratio reached a maximum value (Figure 3). Furthermore, postponing harvest until December did not change the ratio. However, a physiological disorder such as puffing between peel and flesh may form and could result in mechanical damage while handling, which is caused by the collision between fruit [23].
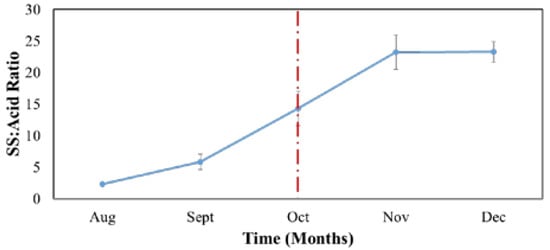
Figure 3.
Ratio of soluble solid (SS)/acid content in juice during the growth and maturing stages. Each data point is the mean ± S.D. of five replications.
3.2. Suspected Compound in Satsuma Mandarin (unshiu) Excitation and Emission Matrices (EEM) during Maturing Period
Stage II and III are critical periods in citrus quality determination, since citrus liquid accumulates in these stages. Therefore, this paper focuses on these two stages. The EEM data, shown in Figure 4, illustrates the six main peaks observed at the beginning of water accumulation. The first and second peaks are a1 (Ex 460 nm and Em 650 nm) and a2 (Ex 410 nm and Em 675 nm) for both the peel and flesh, which is suspected to be chlorophyll (a1 is a chlorophyll-b and a2 is a chlorophyll-a) [24].
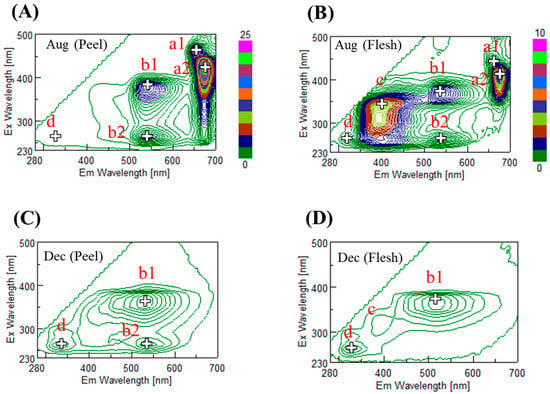
Figure 4.
Fluorescence excitation and emission matrices (EEM) of Satsuma mandarin during the maturing period from August to December: (A) peel in August; (C) in December; (B) flesh in August; (D) in December. The color bars show the fluorescent intensity in Raman units.
The third and fourth peaks are b1 (Ex 370 nm, Em 540 nm) and b2 (Ex 260 nm, Em 540 nm), which correspond to polymethoxyflavones (PMFs) [25]. PMFs are a subclass of flavonoids, which are richer in the peel than in the flesh. The fifth peak is c (Ex 330 nm, Em 400 nm); this peak corresponds to coumarin [26]. Coumarin is a secondary plant metabolite that is a native inhibitor, also known to be a plant growth regulator. Finally, the sixth peak is d (Ex 260 nm, Em 330 nm), identified by Sun et al. (2010) as being related to a tryptophan-like compound from Citrus aurantium L. [27].
3.3. Time Series Fluorescence during the Growth and Maturing Periods
Chlorophyll present mainly in the peel can be visually identified (Figure 2). In contrast, there was no significant level of chlorophyll detected in the flesh. During maturation, chlorophyll degrades with the alteration of chloroplasts to chromoplasts, which is controlled by internal and external factors, such as plant hormones [28], SS, and temperature [29].
Chlorophyll in the peel significantly decreased from June to September (Figure 5) and slowly disappeared in October. The degradation associated with color change revealed previously masked pigments. This may be caused by the activity of chlorophyllase and chemical reactions [15]. Chlorophyll in citrus consists of chlorophyll-a and chlorophyll-b. Chlorophyll-a is the most common type of chlorophyll, predominant in all oxygen-evolving photosynthetic organisms. Furthermore, chlorophyll-a is used in food processing as an appearance control agent for colors. Chlorophyll-b is a yellow-green chlorophyll, and its function is to absorb blue light energy.
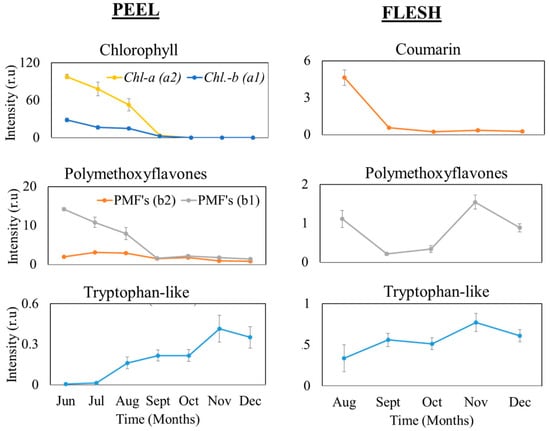
Figure 5.
Fluorescence compound dynamics by time on citrus peel and flesh. Each data point is the mean ± S.D. of five replications. No coumarin was detected in the peel and no chlorophyll was detected in the flesh, so neither are shown.
PMFs are major fluorescence compounds in citrus; they are well-known as plant defensive components against pathogens. Moreover, PMFs are a constituent of bitter flavor of citrus fruit, although they do not contribute to the taste of citrus juice at their natural concentration range [30]. During the maturation period, PMFs in the peel significantly decreased from June to September, then their concentration declined slightly until December. On the other hand, PMFs in the flesh fluctuated unsteadily, declining in August, stabilizing in September–October, and suddenly increasing again in November, which might be caused by changes in acid content. In addition, the solubility of PMFs in the water phase of biological systems increases with acidity [31].
The tryptophan-like compound appears in both tissues, with both showing similar patterns. The levels of this compound slowly increased from June to reach a peak at harvest (November), and decreased in December in the over-mature stage. In plant tissue, tryptophan is a precursor to IAA and plays a crucial role in plant growth, [32,33].
Coumarins have significant biological functions, such as chemoprevention against pathogens in plant tissue, regulation of abiotic stress, oxidative stress, and probably hormonal regulations [34,35]. As shown in Figure 5, coumarin was only observed in the flesh. The lowest intensity was in September, which might be caused by the hormonal regulation of coumarin itself, as it could inhibit plant growth [36]. Therefore, in September, coumarin was present with a weak intensity as the fruit was entering the maturing period, and its levels remained relatively stable until December, and while citrus diameter was relatively stable from September until December.
The decrease in size observed from November to December in some data might be caused by postponing the harvest, which makes the citrus more mature with a subsequent decline in quality; another reason could be the season turning to winter and the resulting sudden low temperatures in the tree environment.
3.4. Soluble Solid and Acid Metabolism during the Maturing Period
Citrus juice contains SS measured as (% Brix) and acidity measured as a % citric acid. These are the main internal quality parameters that have commonly been used in many fields. Furthermore, the ratio of Brix to acidity in the fruit juice is the most common method to estimate the maturity level of citrus fruit and is reflected in the flavor [37]. More than 75% of the total SS is sucrose, which increases during fruit maturation on the tree (Figure 6) and is further utilized for the synthesis of various polysaccharides, including pectin. The decrease in acidity (mostly organic acid) is considered to be due to a dilution effect as the fruit increases in size and accumulates water. Organic acids are respiratory substrates in the fruit; a high respiratory quotient indicates the utilization of acid through the tricarboxylic acid (TCA) cycle, which is oxidized and produces ATPs (adenosine triphosphates) for the synthesis of new compounds [35]. The change of concentration of SS in Satsuma mandarin was low from August to September, but rapidly increased in October and reached the maximum in November.
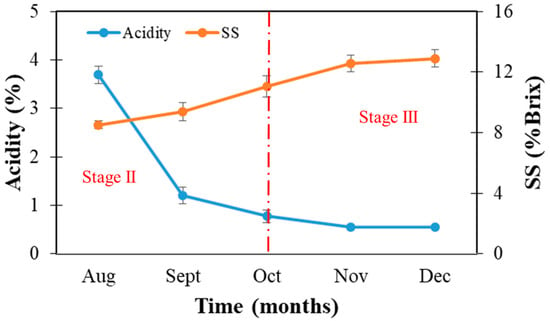
Figure 6.
Soluble solids (SS) and acidity (as % citric acid) during the growth and maturing stages.
3.5. Potential Maturity Indices in Satsuma Mandarin
Chlorophyll content is commonly used as a quality indicator in many fruits and vegetables. For example, many researchers have suggested using measurement of chlorophyll content to evaluate the quality of grapes and apples. They used a ratio of chlorophyll a and b and correlated it with physical or chemical properties. The advantage of this method is the lower dependence on orientation and distance, and it has a potential to be used as a future measurement. Furthermore, chlorophyll has also been proposed as an internal quality parameter, by calculating the correlation between chlorophyll with SS:acid ratio and fruit firmness to evaluate the ripening stage in apples. Those had a quite good correlation of 0.699 and 0.674, respectively [12]. Moreover, previous researchers also succeeded in promoting the chlorophyll fluorescence technique as a non-destructive evaluation for flavonols and anthocyanins in grapes [13].
During the maturing period, chlorophyll in the citrus peel gradually decreased. In the present work, chlorophyll fluorescence intensity was compared with the SS:acid ratio. Our data demonstrated that chlorophyll-a and -b were weakly correlated with the SS:acid ratio, R2 = 0.441 and 0.474, respectively. Furthermore, the chlorophyll-a and -b ratio also showed a very low correlation with the SS:acid ratio (R2 = 0.0593). However, citrus have slightly different fluorescent compounds compared to those in apples and grapes, creating an opportunity to utilize fluorescent compounds as a maturity index A modofied index from the peel is presented because the fluorescent peel compounds could provide a convenient way to determine the quality of citrus quickly.
Besides chlorophyll, the log of the ratio of PMFs was considerd because they were more abundant in the citrus peel compared to the flesh. In the present results (Figure 4), they appeared at two different excitation wavelengths (260 nm and 370 nm) and one emission wavelength (540 nm). The ratio of these two wavelengths potentially could be used as an index; it is dimensionless and an independent measurement. The log of the ratio between two PMFs (Ex 370 nm, Em 540 nm divided by Ex 260 nm, Em 540 nm) were derived, and a significant linear correlation (P < 0.001) with SS and acid ratio (R2 = 0.8207) was found, as shown in Figure 7. In August and September (the final growth period), the citrus color was mostly green and the citrus juice was acidic. Then, the PMFs versus SS/acid ratio gradually increased during the maturing period, stabilizing at the end of October.
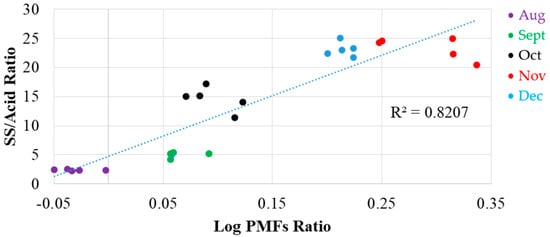
Figure 7.
Correlation between log of the ratio of polymethoxyflavones (PMFs) (Ex 370 nm/Ex 260 nm) and SS/acid ratio.
Another possible index is the logarithmic ratio between tryptophan-like compound and chlorophyll-a, as shown in Figure 8. The logarithmic ratio exhibited a skewness towards high values, which demonstrated multiplicative factors. There was a significant correlation (P < 0.001) with SS and acid content (R2 = 0.9554), where both the SS:acid ratio as well as the tryptophan-like compound to chlorophyll-a ratio increased during the maturing period.
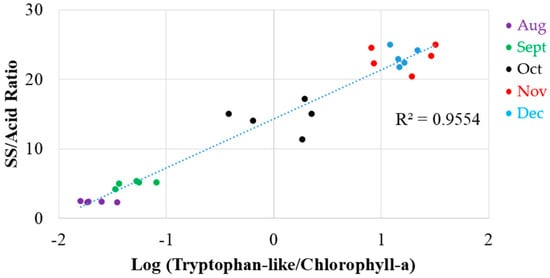
Figure 8.
Logarithmic correlation between the ratio of tryptophan-like/chlorophyll-a (Ex 260 nm and Em 330 nm divided Ex 410 nm and Em 675 nm) and SS/acid ratio.
4. Conclusions
Fluorescence excitation-emission matrices (EEM) were used in this study to identify fluorescence peaks at Ex 410 nm and Em 675 nm suspected to be associated with chlorophyll-a, and fluorescence peaks at Ex 460 nm and Em 650 nm suspected to be associated with chlorophyll-b. The compounds which had peaks at Ex 260 nm and 370 nm and Em 540 nm (in the peel) and Ex 260 nm and Em 530 nm (in the flesh) corresponded to PMFs. The fluorescence peak at Ex 330 nm and Em 380 nm was suspected to be coumarin and, finally, the fluorescence peak at Ex 260 nm and Em 330 nm corresponded to tryptophan-like compound. Several index candidates showed potential as maturity indices. These include the logarithmic ratio between tryptophan-like compound and chlorophyll-a, which were significantly correlated (R2 = 0.9554), and the log of the ratio between two PMFs, which was also significantly correlated (R2 = 0.8207).
Acknowledgments
We would like to thank the Ministry of Agriculture of the Republic of Indonesia for granting the scholarship during this study, thanks to Supporting Program for InteRaction-Based Initiative Team Studies (SPIRITS) for funding this research, and thanks to Garry Piller for proof-reading this manuscript.
Author Contributions
N.K. was the project supervisor. M. designed the experiments presented in this paper, and performed the experiments and analysis with the assistant of D.F.A.R., Y.S. and K.I., M. wrote and edited the manuscript with the assistance of D.F.A.R., T.S., M.K., Y.S., and K.I.
Conflicts of Interest
The authors declare no conflict of interest.
References
- Kurai, T. 2016 Japan Citrus Annual; USDA Foreign Agricultural Service: Tokyo, Japan, 2016.
- Kader, A.A. Fruit maturity, ripening, and quality relationships. Acta Hortic. 1999, 57, 203–208. [Google Scholar] [CrossRef]
- Reid, M.S. Definition of Maturity. Postharvest Technol. Hortic. Crops 2002, 3311, 55. [Google Scholar]
- Cary, P.R. Citrus Fruit Maturity Vol-26; MPKV: Maharastra, India, 1974. [Google Scholar]
- Iglesias, D.J.; Cercós, M.; Colmenero-Flores, J.M.; Naranjo, M.A.; Ríos, G.; Carrera, E.; Ruiz-Rivero, O.; Lliso, I.; Morillon, R.; Tadeo, F.R.; et al. Physiology of citrus fruiting. Braz. J. Plant Physiol. 2007, 19, 333–362. [Google Scholar] [CrossRef]
- Crisosto, C.H. Stone fruit maturity indices: A descriptive. Postharvest News Inf. 1994, 5, 65N–68N. [Google Scholar]
- Gómez, A.H.; Wang, J.; Pereira, A.G. Mandarin ripeness monitoring and quality attribute evaluation using an electronic nose technique. Trans. ASABE 2007, 50, 2137–2142. [Google Scholar] [CrossRef]
- Yibin, Y.; Rao, X.; Ma, J. Methodology for Nondestructive Inspection of Citrus Maturity with Machine Vision–Transactions of The Chinese Society of Agricultural Engineering. Available online: http://en.cnki.com.cn/Article_en/CJFDTOTAL-NYGU200402034.htm (accessed on 6 April 2017).
- Antonucci, F.; Pallottino, F.; Paglia, G.; Palma, A.; D’Aquino, S.; Menesatti, P. Non-destructive estimation of mandarin maturity Status through portable VIS-NIR spectrophotometer. Food Bioprocess Technol. 2011, 4, 809–813. [Google Scholar] [CrossRef]
- Christensen, J.; Povlsen, V.T.; Sørensen, J. Application of Fluorescence Spectroscopy and Chemometrics in the Evaluation of Processed Cheese During Storage. J. Dairy Sci. 2003, 86, 1101–1107. [Google Scholar] [CrossRef]
- Momin, M.A.; Kondo, N.; Kuramoto, M.; Ogawa, Y.; Yamamoto, K.; Shiigi, T. Investigation of excitation wavelength for fluorescence emission of citrus peels based on UV-VIS spectra. Eng. Agric. Environ. Food 2012, 5, 126–132. [Google Scholar] [CrossRef]
- Betemps, D.L.; Fachinello, J.C.; Galarça, S.P.; Portela, N.M.; Remorini, D.; Massai, R.; Agati, G. Non-destructive evaluation of ripening and quality traits in apples using a multiparametric fluorescence sensor. J. Sci. Food Agric. 2012, 92, 1855–1864. [Google Scholar] [CrossRef] [PubMed]
- Ghozlen, N.B.; Cerovic, Z.G.; Germain, C.; Toutain, S.; Latouche, G. Non-destructive optical monitoring of grape maturation by proximal sensing. Sensors 2010, 10, 10040–10068. [Google Scholar] [CrossRef] [PubMed]
- Song, H.S.; Lan Phi, N.T.; Park, Y.-H.; Sawamura, M. Volatile profiles in cold-pressed peel oil from korean and japanese shiranui (Citrus unshiu Marcov. × C. sinensis Osbeck × C. reticulata Blanco). Biosci. Biotechnol. Biochem 2006, 70, 737–739. [Google Scholar] [CrossRef] [PubMed]
- Seymour, G.B.; Taylor, J.E.; Tucker, G.A. Biochemistry of Fruit Ripening; Springer: Dordrecht, The Netherlands, 1993; ISBN 978-94-010-4689-3. [Google Scholar]
- Lawaetz, A.J.; Stedmon, C.A. Fluorescence intensity calibration using the raman scatter peak of water. Appl. Spectrosc. 2009, 63, 936–940. [Google Scholar] [CrossRef] [PubMed]
- Bain, J.M. Morphological, anatomical, and physiological changes in the developing fruit of the Valencia orange, Citrus sinensis (L.) Osbeck. Aust. J. Bot. 1958, 6, 1–23. [Google Scholar] [CrossRef]
- Igoshi, M.; Yamaguchi, I.; Takahashi, N.; Hirose, K. Plant growth substances in the young fruit of Citrus unshiu. Agric. Biol. Chem. 1971, 35, 629–631. [Google Scholar] [CrossRef]
- Takahashi, N.; Yamaguchi, I.; Kono, T.; Igoshi, M.; Hirose, K.; Suzuki, K. Characterization of plant growth substances in Citrus unshiu and their change in fruit development. Plant Cell Physiol. 1975, 16, 1101–1111. [Google Scholar] [CrossRef]
- Goren, R.; Monselise, S.P. Inter-relations of hesperidin, some other natural components and certain enzyme systems in developing shamouti orange fruits. J. Hortic. Sci. 1965, 40, 83–99. [Google Scholar] [CrossRef]
- Fujii, H.; Shimada, T.; Sugiyama, A.; Nishikawa, F.; Endo, T.; Nakano, M.; Ikoma, Y.; Shimizu, T.; Omura, M. Profiling ethylene-responsive genes in mature mandarin fruit using a citrus 22K oligoarray. Plant Sci. 2007, 173, 340–348. [Google Scholar] [CrossRef]
- Fidelibus, M.W.; Koch, K.E.; Davies, F.S. Gibberellic acid alters sucrose, hexoses, and their gradients in peel tissues during color break delay in “Hamlin” orange. J. Am. Soc. Hortic. Sci. 2008, 133, 760–767. [Google Scholar]
- Agustí, M.; Martinez-Fuentes, A.; Mesejo, C. Citrus fruit quality. Physiological basis and techniques of improvement. Agrociencia 2002, 6, 1–16. [Google Scholar]
- Ustin, S.L.; Gitelson, A.A.; Jacquemoud, S.; Schaepman, M.; Asner, G.P.; Gamon, J.A.; Zarco-Tejada, P. Retrieval of foliar information about plant pigment systems from high resolution spectroscopy. Remote Sens. Environ. 2009, 113, S67–S77. [Google Scholar] [CrossRef]
- Li, S.; Lo, C.-Y.; Ho, C.-T. Hydroxylated polymethoxyflavones and methylated flavonoids in sweet orange (Citrus sinensis) peel. J. Agric. Food Chem. 2006, 54, 4176–4185. [Google Scholar] [CrossRef] [PubMed]
- Fujii, K.; Iyi, N.; Hashizume, H.; Shimomura, S.; Ando, T. Preparation of integrated coumarin/cyanine systems within an interlayer of phyllosilicate and fluorescence resonance energy transfer. Chem. Mater. 2009, 21, 1179–1181. [Google Scholar] [CrossRef]
- Sun, Y.; Zhang, H.; Sun, Y.; Zhang, Y.; Liu, H.; Cheng, J.; Bi, S.; Zhang, H. Study of interaction between protein and main active components in Citrus aurantium L. by optical spectroscopy. J. Lumin. 2010, 130, 270–279. [Google Scholar] [CrossRef]
- El-Otmani, D.M.; Lovatt, C.J.; Jr, C.W.C.; Agustí, M. Plant growth regulators in citriculture: Factors regulating endogenous levels in Citrus tissues. Crit. Rev. Plant Sci. 1995, 14, 367–412. [Google Scholar] [CrossRef]
- Takagi, T.; Mukai, H.; Ichikawa, T.; Suzuki, T. Effects of temperature and sugar accumulation in fruits on color development of satsuma mandarin. J. Jpn. Soc. Hortic. Sci. 1994, 62, 725–731. [Google Scholar] [CrossRef]
- Veldhuis, M.K.; Swift, L.J.; Scott, W.C. Fully-methoxylated flavones in Florida orange juices. J. Agric. Food Chem. 1970, 18, 590–592. [Google Scholar] [CrossRef]
- Musialik, M.; Kuzmicz, R.; Pawłowski, T.S.; Litwinienko, G. Acidity of hydroxyl groups: An overlooked Influence on antiradical properties of flavonoids. J. Org. Chem. 2009, 74, 2699–2709. [Google Scholar] [CrossRef] [PubMed]
- Murch, S.J.; KrishnaRaj, S.; Saxena, P.K. Tryptophan is a precursor for melatonin and serotonin biosynthesis in in vitro regenerated St. John’s wort (Hypericum perforatum L. cv. Anthos) plants. Plant Cell Rep. 2000, 19, 698–704. [Google Scholar] [CrossRef]
- Radwanski, E.R.; Last, R.L. Tryptophan biosynthesis and metabolism: Biochemical and molecular genetics. Plant Cell 1995, 7, 921–934. [Google Scholar] [CrossRef] [PubMed]
- Gutierrez, M.-C.; Parry, A.; Tena, M.; Jorrin, J.; Edwards, R. Abiotic elicitation of coumarin phytoalexins in sunflower. Phytochemistry 1995, 38, 1185–1191. [Google Scholar] [CrossRef]
- Ladaniya, M. Citrus Fruit: Biology, Technology and Evaluation; Academic Press: Croydon, UK, 2010; ISBN 978-0-08-055623-9. [Google Scholar]
- Thimann, K.V.; Bonner, W.D. Inhibition of plant growth by protoanemonin and coumarin, and its prevention by BAL. Proc. Natl. Acad. Sci. USA 1949, 35, 272–276. [Google Scholar] [CrossRef] [PubMed]
- Olmo, M.; Nadas, A.; García, J.M. Nondestructive methods to evaluate maturity level of oranges. J. Food Sci. 2000, 65, 365–369. [Google Scholar] [CrossRef]
© 2017 by the authors. Licensee MDPI, Basel, Switzerland. This article is an open access article distributed under the terms and conditions of the Creative Commons Attribution (CC BY) license (http://creativecommons.org/licenses/by/4.0/).