Article

Evaluation of Ornamental Traits and Their Associations with Genomic Simple Sequence Repeat Markers in Globba sherwoodiana

1
Guangdong Provincial Key Lab of Ornamental Plant Germplasm Innovation and Utilization, Environmental Horticulture Research Institute, Guangdong Academy of Agricultural Sciences, Guangzhou 510640, China
2
College of Horticulture and Landscape Architecture, Zhongkai University of Agriculture and Engineering, Guangzhou 510225, China
3
School of Landscape Architecture, Beijing Forestry University, Beijing 100083, China
*
Authors to whom correspondence should be addressed.
These authors contributed equally to this work.
Horticulturae 2026, 12(9), 1135; https://doi.org/10.3390/horticulturae12091135
Submission received: 11 August 2026 / Revised: 3 September 2026 / Accepted: 4 September 2026 / Published: 7 September 2026
(This article belongs to the Topic Genetic Breeding and Biotechnology of Garden Plants)

Abstract

Globba spp. is a perennial herbaceous plant of the Zingiberaceae family, characterized by its unique floral architecture and diverse coloration with high ornamental and medicinal value. However, research on the genetic basis of Globba is still insufficient, and only a limited number of molecular markers have been developed so far, which has greatly hampered the progress of its molecular breeding. Herein, we performed the first deep identification of genome-wide SSR markers based on the whole-genome data of G. sherwoodiana. A total of 276,809 SSR loci were identified with an average density of 189.24–297.49 SSRs/Mb within each chromosome. Mononucleotide repeat loci were most abundant, accounting for 58.95% of all SSRs, with dinucleotide and trinucleotide repeats accounting for 19.83% and 19.27%, respectively. Using G. sherwoodiana ‘MJ16’ and G. winitii C.H. Wright as parental lines, we constructed a hybrid F1 population containing 173 individual plants. The coefficient of variation (CV) of the 10 phenotypic traits ranged from 13.09% to 27.43%, exhibiting a normal distribution. Phenotypic traits including terminal leaf width, inflorescence length, inflorescence width, secondary-inflorescence pedicel length, number of ornamental bracts, and basal inflorescence-bract length showed abundant variation, with all CV values exceeding 20%. Moreover, 27 polymorphic genomic SSRs (gSSR) were screened from the synthesized 192 primer pairs, amplifying a total of 203 alleles. On average, each marker detected 7.52 polymorphic loci, with a mean effective allele number of 3.63 and a mean polymorphism information content of 0.64, reflecting a relatively rich genetic diversity within the population. Through phenotype–marker association analysis, six gSSR loci were found to be significantly associated with six phenotypic traits. The highest interpretation ratio (16.86%) was observed for basal inflorescence-bract width. Three loci (gSSR48, gSSR105 and gSSR184) were simultaneously associated with more than two phenotypic traits, indicating a pattern consistent with pleiotropy or linkage. The informative gSSR markers and the association analysis results in this study provide an effective theoretical basis for germplasm identification, genetic diversity evaluation, and marker-assisted breeding of Globba.

1. Introduction

Globba belongs to the family Zingiberaceae and is a perennial rhizomatous herb. The genus Globba is the third-largest genus in Zingiberaceae, comprising more than 100 species worldwide. It is mainly distributed in tropical and subtropical regions of Asia [1], with Southeast Asia as the primary distribution center [2]. In China, Globba species are mainly distributed in the southwestern and southern provinces. Plants of the genus Globba have short, thick underground rhizomes, erect and clustered aerial stems, and drooping panicles. The colors of their bracts vary among species, including white, pink, purplish red, and purple. They have high ornamental value and are suitable for use as cut flowers, potted plants, and garden plants. Their rhizomes can also be used medicinally [3], indicating broad application prospects. Globba has abundant wild germplasm resources; however, only a limited number of horticultural cultivars are currently available on the market, and cultivar diversity remains limited. Conventional hybridization remains the primary breeding method, and a molecular marker-assisted breeding system has not yet been established.
Simple sequence repeats (SSRs) are tandemly repeated DNA motifs that provide codominant, highly polymorphic, and reproducible molecular markers. They are widely used for genetic analysis in ornamental plants [4,5]. Because alleles at an SSR locus can be distinguished in heterozygous individuals, these markers are particularly useful for parentage analysis, diversity assessment, and cultivar identification [6]. According to their sequence origin, SSR markers are generally divided into two categories: genomic simple sequence repeat (gSSR) markers and expressed sequence tag–simple sequence repeat (EST-SSR) markers. EST-SSRs are developed from transcribed sequences and thus they are specifically targeted at expressed regions. Since coding sequences are relatively evolutionarily conserved, EST-SSRs typically exhibit lower polymorphism but higher cross-species transferability [7,8]. This sequence conservation can enhance the transferability of markers among related taxa, though it may reduce the resolution of analysis within a single population. By contrast, gSSRs are developed from whole-genome sequences and may occur in both coding and noncoding regions. Their broader genome coverage and often higher polymorphism can improve the detection of genetic variation and population differentiation [9,10,11]. Consequently, gSSRs complement EST-SSRs when dense, genome-wide marker coverage is required. SSR markers have now been developed for numerous plant species. In Curcuma alismatifolia Gagnep., analysis of whole-genome data identified 257,032 SSR loci, from which 38 highly polymorphic gSSR markers were selected. These markers supported the construction of a 66-accession core collection and the establishment of DNA barcodes for 178 germplasm resources [12]. In Weigela Thunb., 20 gSSR markers developed from whole-genome sequence data detected 111 unique alleles among 18 cultivars; only six markers were required to construct a cultivar-identification key [13]. Molecular research on Globba has also advanced in recent years. The chloroplast genome of G. racemosa has been sequenced, and studies have addressed genetic diversity, phylogeny, and functional genes [14,15,16]. Nevertheless, genetic research on Globba remains limited. Few molecular markers are currently available, constraining the development of molecular breeding in this species.
Accordingly, this study developed gSSR molecular markers based on the whole-genome data of G. sherwoodiana and tested associations between these markers and major ornamental traits, including plant height, bract color, and inflorescence length, to identify markers associated with target traits. The results of this study address the limited availability of trait-associated molecular markers for ornamental traits in Globba and provide a foundation for germplasm resource evaluation and the molecular marker-assisted breeding system.

2. Materials and Methods

2.1. Experimental Materials and DNA Extraction

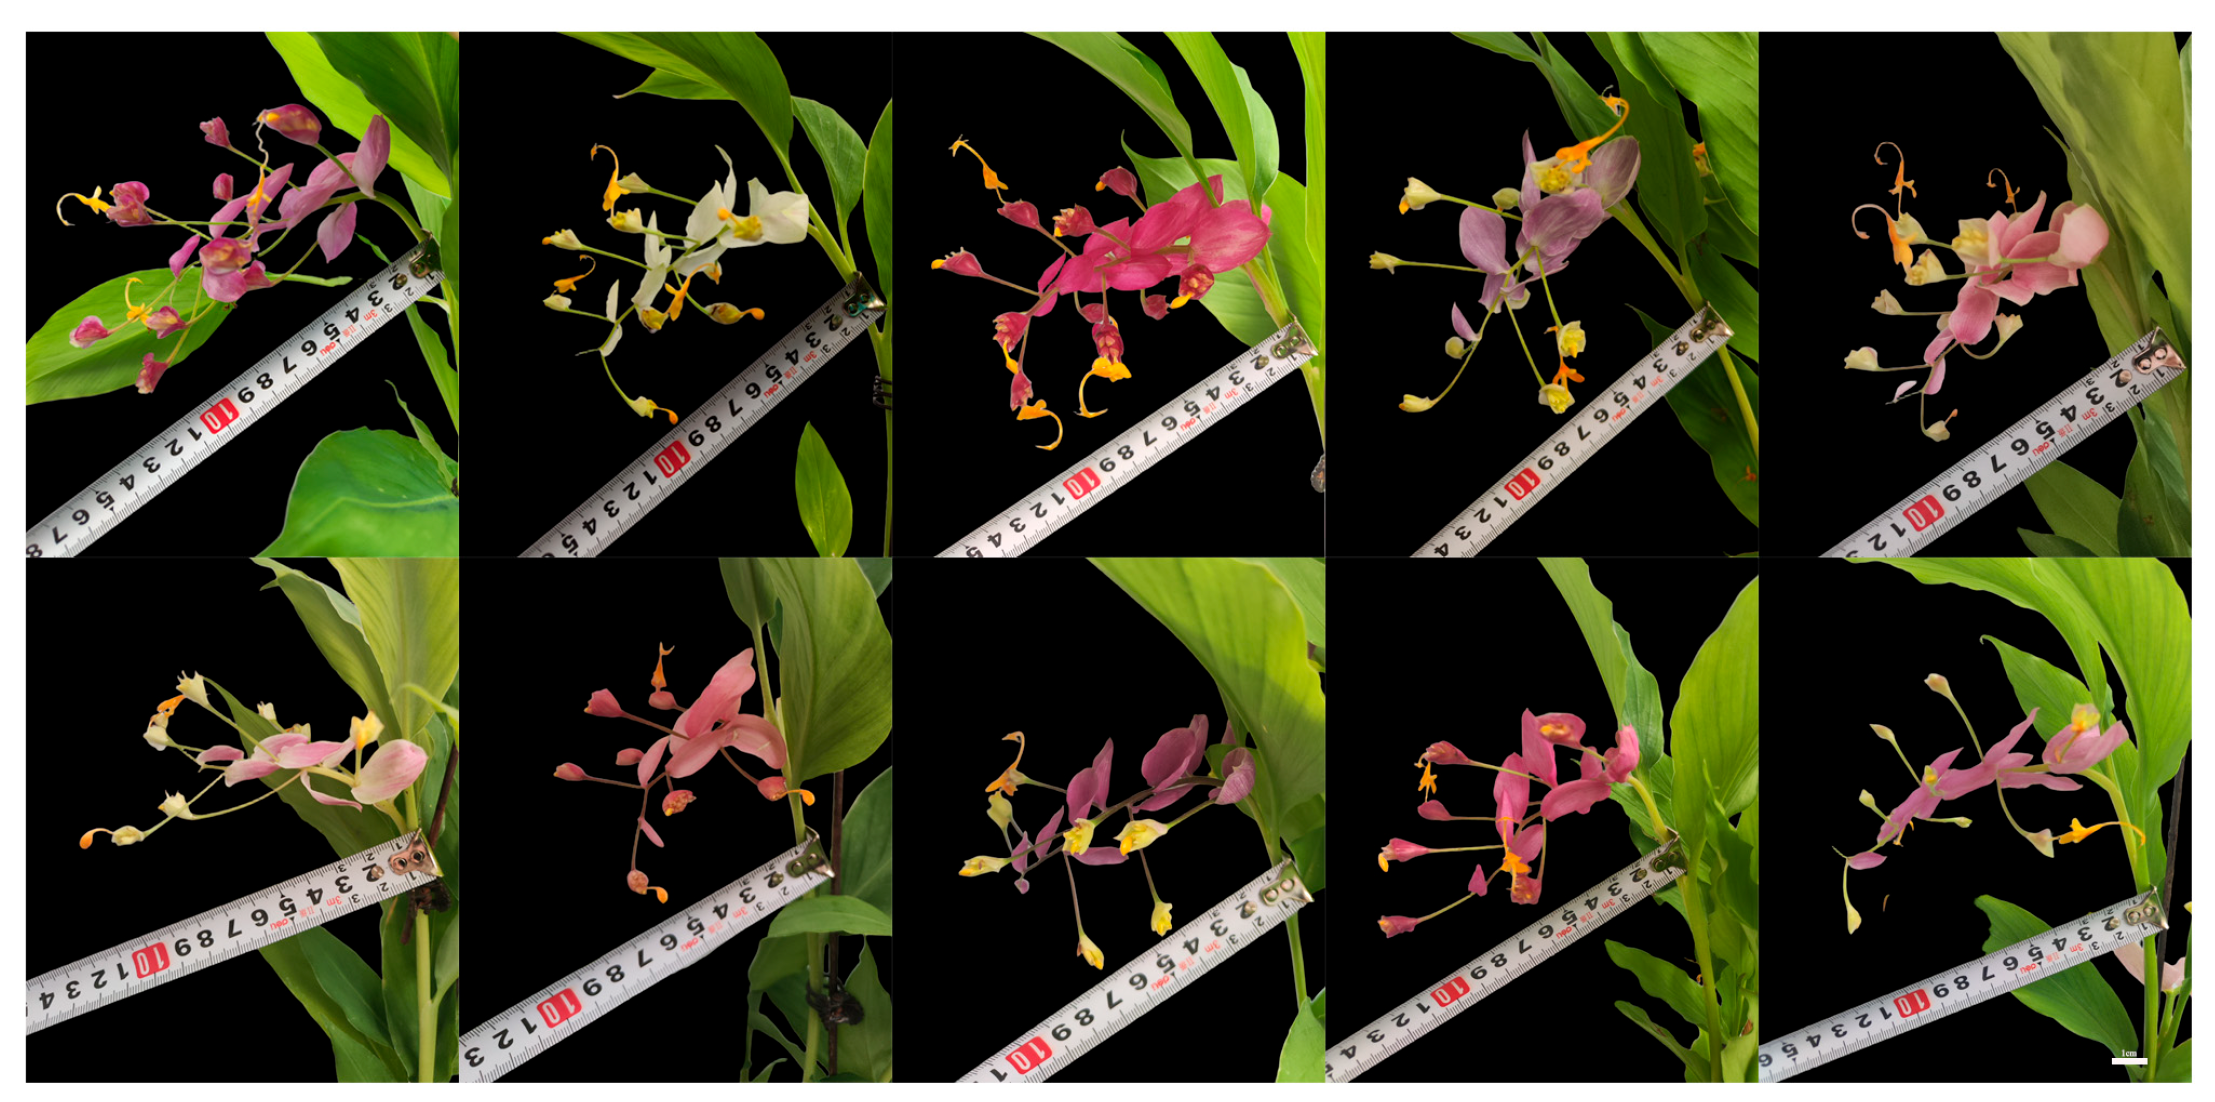
The experiment was conducted at the Baiyun Base Germplasm Resource Nursery of Zingiberaceae at the Institute of Environmental Horticulture, Guangdong Academy of Agricultural Sciences. G. sherwoodiana ‘MJ16’ was used as the female parent, and G. winitii C.H. Wright was used as the male parent. Artificial pollination was performed to obtain hybrid seeds, which were subsequently sown for seedling emergence. A total of 173 hybrid progeny were obtained to establish the F1 population (Figure 1). Young leaves and bracts were collected from healthy, symptom-free plants. Genomic DNA was extracted using the Tiangen Plant Genomic DNA Extraction Kit (Beijing, China) according to the manufacturer’s instructions. The DNA concentration was determined using an ultraviolet spectrophotometer.

2.2. Development of Whole-Genome gSSR Markers and Primer Design in G. sherwoodiana

The MIcroSAtellite identification tool (MISA) was used to identify SSR loci in the genome of G. sherwoodiana (unpublished). Detailed information on genome assembly quality is provided in Supplementary Table S1. The minimum repeat thresholds for mono-, di-, tri-, tetra-, penta-, and hexanucleotide repeats were set at 12, 7, 6, 5, 4, and 4, respectively. We analyzed the characteristics of SSR loci using SPSS 24.0 and generated the density distribution plot of genomic SSRs via Tbtools software (Tbtools 2.0). We further conducted statistical analyses of the number of SSRs and their distribution density using the R language and performed a general linear regression analysis to explore the association between chromosome length and SSR count. Primer 3.0 software (Primer3) was used to design 192 pairs of primers for the identified gSSR loci. The main parameters were set as follows: the length of forward and reverse primers ranged from 15 to 25 bp, the difference in annealing temperature between the two primers was minimized and maintained between 50 and 60 °C, the GC content ranged from 40% to 60%, and the expected amplicon size ranged from 100 to 300 bp. The primers were synthesized by Sangon Biotech Co., Ltd. (Shanghai, China). Detailed information on all primers is provided in Supplementary Table S2.

2.3. gSSR Primer Screening and Hybrid Identification

DNA samples from the two parents and two progenies with large phenotypic differences (No. 18 and No. 158) were used as templates for polymerase chain reaction (PCR) amplification. The amplification stability was evaluated using 1.5% agarose gel electrophoresis, and polymorphism was further detected using the three-primer (TP-M13) [8] fluorescent labeling method. Based on the screening results, primers with high polymorphism were selected for PCR amplification of DNA samples from the parents and 173 hybrid progenies. The sizes of amplified fragments were determined by capillary electrophoresis using an ABI 3730 DNA Analyzer. Individuals showing male-parent-specific fragments among the amplification products were identified as true hybrids.

2.4. Determination of Ornamental Traits in Hybrid Progenies

The phenotypic ornamental traits of the parents and 173 hybrid progeny were measured and recorded during the peak flowering period from June to July 2025. Plants with vigorous growth, consistent growth status, and no pest or disease damage were selected. A total of 11 traits were measured, including plant height, flowering-branch height, terminal leaf length, terminal leaf width, inflorescence length, inflorescence width, secondary-inflorescence pedicel length, number of ornamental bracts, bract length at the base of the inflorescence, bract width at the base of the inflorescence, and the presence or absence of hairs on the abaxial leaf surface. With the exception of two traits—plant height and presence of pubescence on the abaxial leaf surface—the remaining nine traits were measured three times on the same individual from different perspectives. The final phenotypic data were calculated as the average of these repeated measurements.

2.5. Data Processing and Analysis

(1)
Excel was used to calculate descriptive statistics, including maximum value, minimum value, mean value, and standard deviation, from the original data. Analysis of variance was performed using SPSS (SPSS 12.0), and bar charts and frequency-distribution plots were generated using Origin 2024.
(2)
GeneMapper v4.0 was used to determine the fragment sizes of SSR amplicons. PowerMarker v3.25 was used to calculate and evaluate the polymorphism levels of each marker locus [17].
(3)
TASSEL 4.0 software was used to conduct marker–trait association analysis using the mixed linear model (MLM). The kinship matrix (K matrix) calculated from the 27 SSR markers was included as a random effect to account for relatedness among individuals. A threshold of p < 0.01 was used to define significant associations, and the Benjamini–Hochberg false discovery rate (FDR) correction (Q < 0.05) was subsequently applied to control for false positives [18,19].

3. Results

3.1. Number and Distribution Characteristics of Whole-Genome SSR Loci in G. sherwoodiana

The research group performed whole-genome sequencing of G. sherwoodiana and successfully assembled and annotated the first reported G. sherwoodiana genome. The whole-genome size was 1.05 Gb, and six types of gSSR repeat motifs with different motif lengths were identified. Statistical analysis of the nucleotide proportions of different repeat types showed that the mononucleotide repeat type had the highest total nucleotide proportion, accounting for 58.95%, followed by dinucleotide repeats and trinucleotide repeats, which accounted for 19.83% and 19.27%, respectively. The nucleotide proportions of all repeat types were ranked in descending order as mononucleotide repeats, dinucleotide repeats, trinucleotide repeats, tetranucleotide repeats, hexanucleotide repeats, and pentanucleotide repeats. Overall, the G. sherwoodiana genome exhibited a distribution pattern in which the nucleotide contribution declined as repeat-motif length increased.
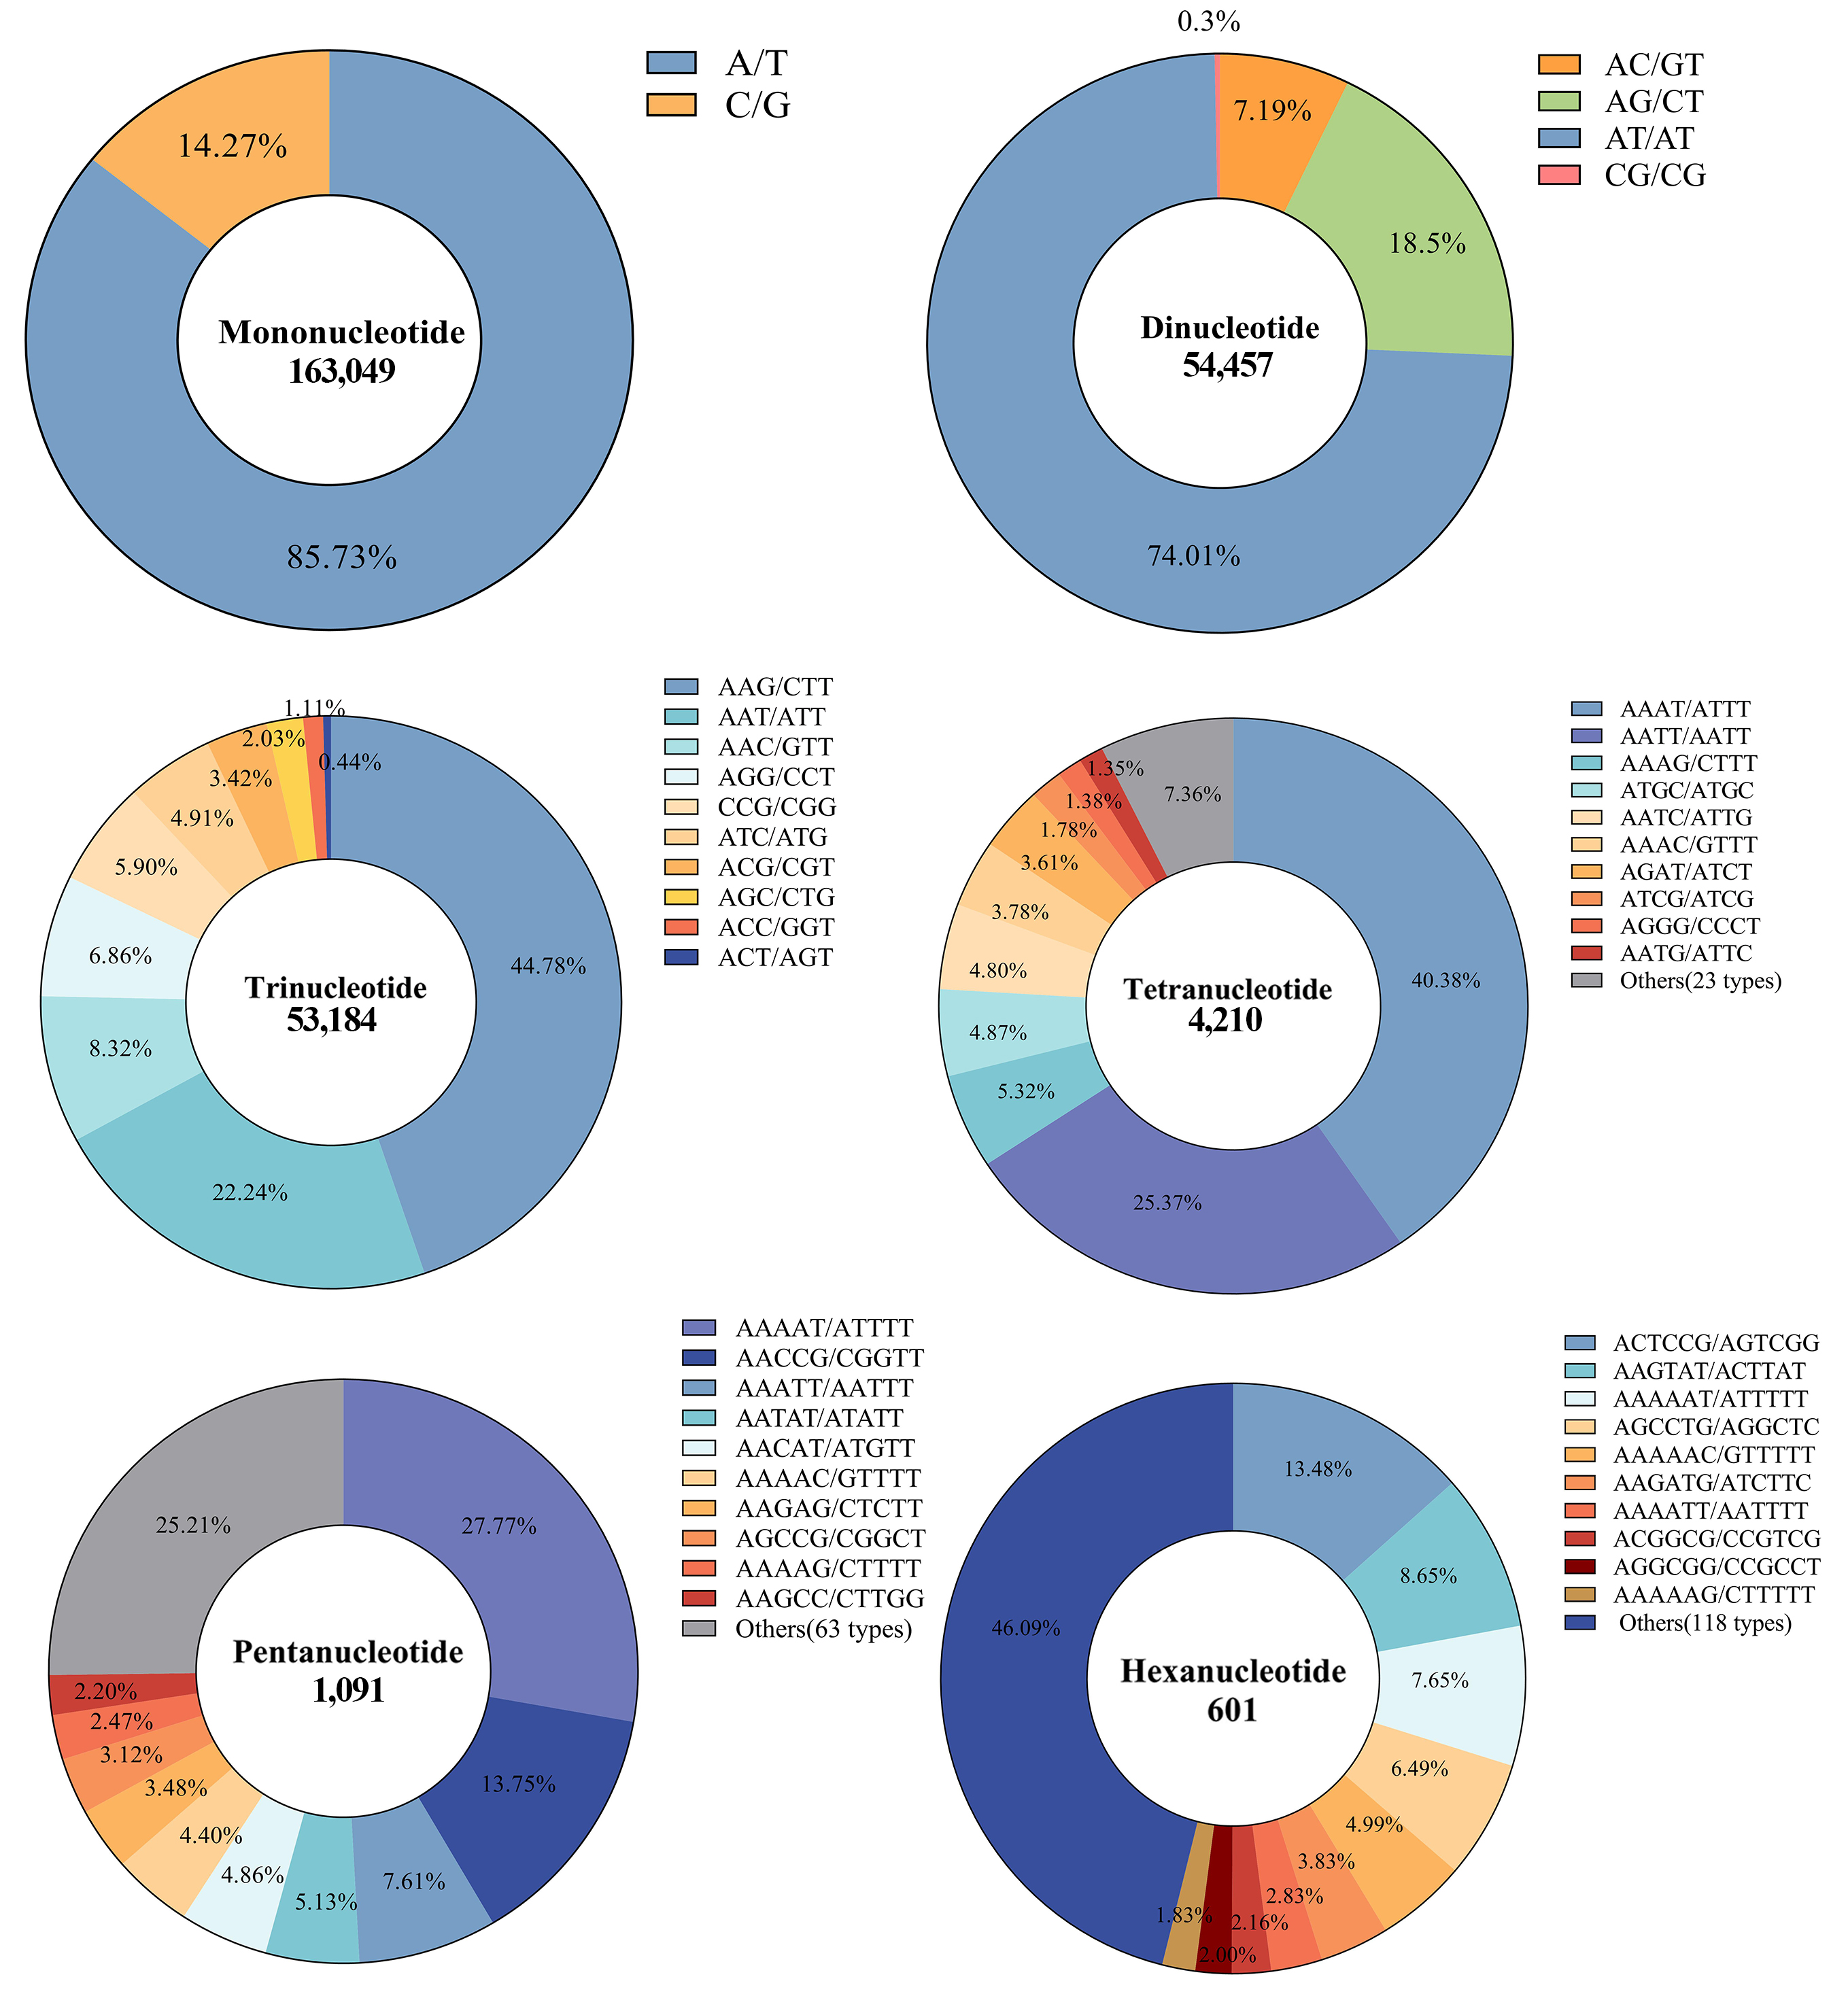
Statistical analysis of the 46 gSSR motif types with the highest abundance (Figure 2) revealed that among repeat motifs containing one to six nucleotides the most abundant repeat sequences were A/T, AT/AT, AAG/CTT, AAAT/ATTT, AAAAT/ATTTT, and ACTCCG/AGTCGG, accounting for 85.73%, 74.01%, 44.78%, 40.38%, 27.77%, and 13.48%, respectively. Other relatively abundant motifs included C/G, AG/CT, AAT/ATT, AATT/AATT, and AACCG/CGGTT, accounting for 14.27%, 18.50%, 22.24%, 25.37%, and 13.75%, respectively, with distribution frequencies generally ranging from 10% to 25%. Overall, AT-rich motifs predominated, whereas GC repeat motifs were less abundant.

3.2. Distribution of Whole-Genome SSR Loci on Different Chromosomes of G. sherwoodiana

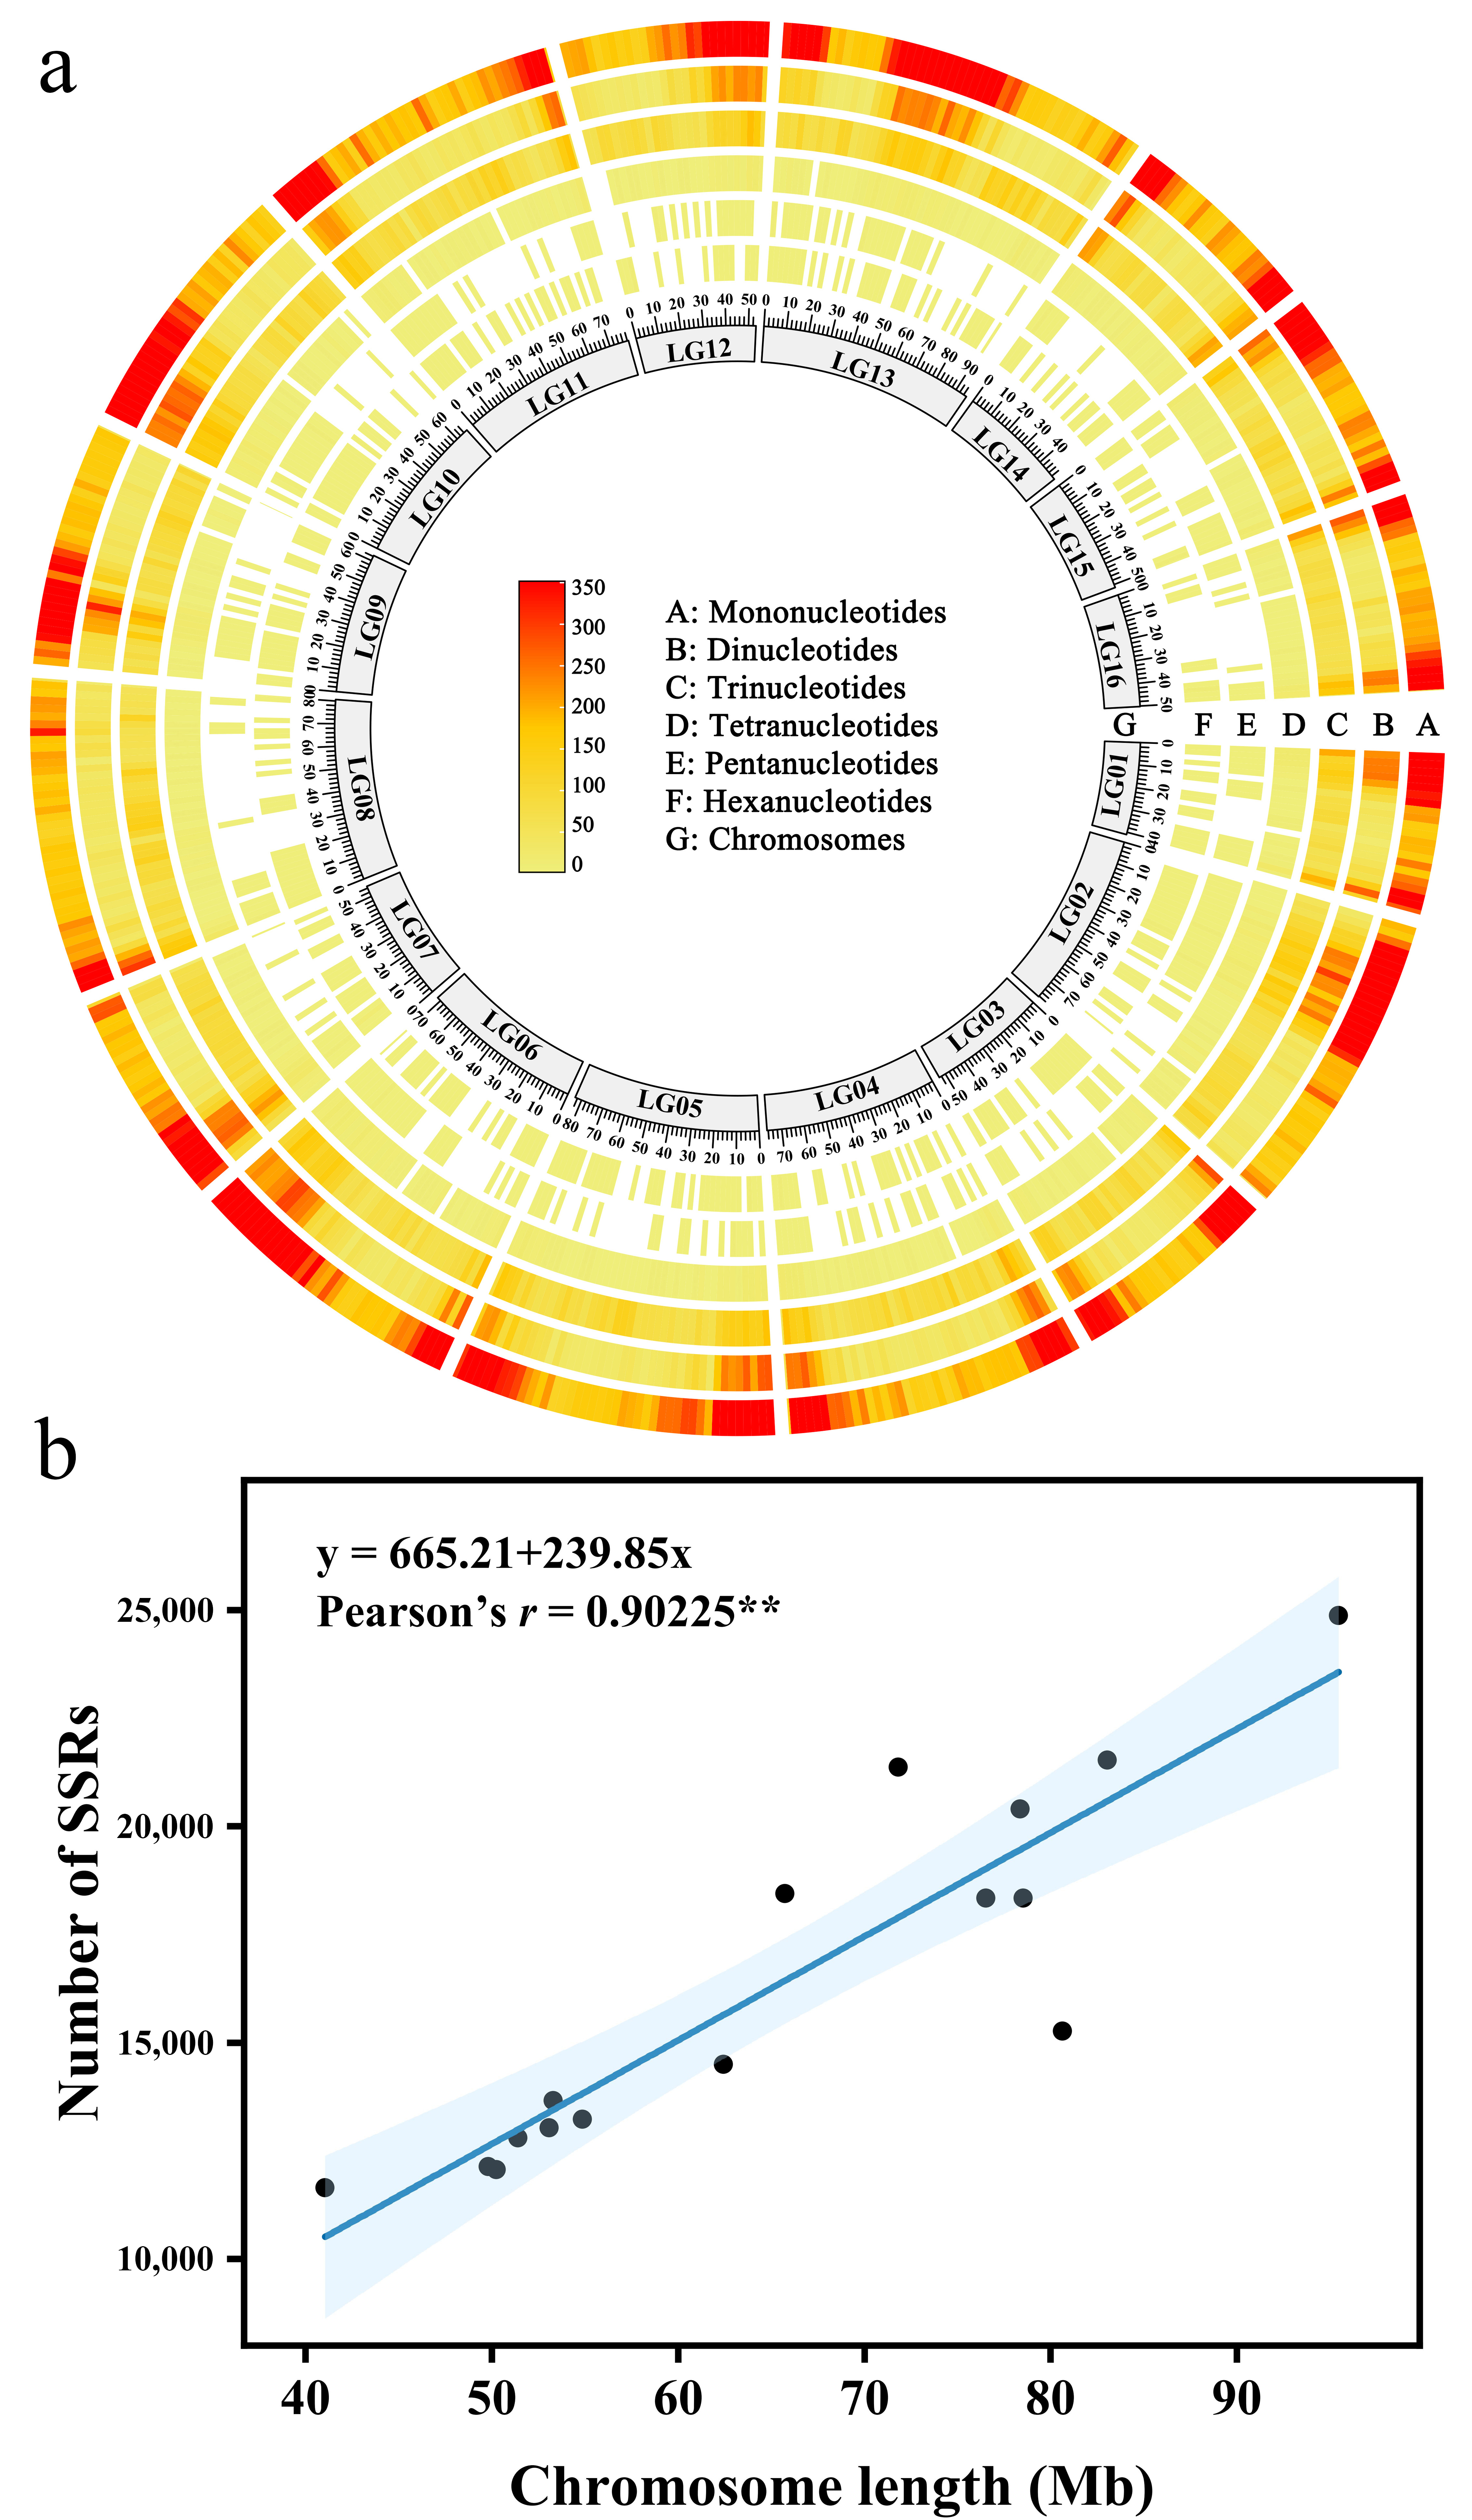
The LG13 chromosome contained the highest number of SSR loci (24,869), followed by LG05 and LG06, with 21,533 and 21,366 loci, respectively (Supplementary Table S3). Statistical analysis showed that the chromosomes of G. sherwoodiana contained an average of 189.24–297.49 SSR loci per Mb. LG06 exhibited the highest SSR density, with an average distance of only 3.36 kb between adjacent loci. In contrast, LG08 had a relatively lower SSR density and an average distance of 5.28 kb between adjacent loci.
SSRs were unevenly distributed across the chromosomes of G. sherwoodiana, with most loci concentrated at both chromosomal ends. Mononucleotide, dinucleotide, and trinucleotide SSR loci were distributed more densely than pentanucleotide and hexanucleotide SSR loci. The overall heatmap of distribution density displayed an obvious decreasing layered-ring structure, with the lowest distribution density observed for pentanucleotide and hexanucleotide SSR loci. Linear regression analysis revealed a positive relationship between chromosome length and the number of SSR loci in G. sherwoodiana. A univariate regression equation was established to describe this relationship: y = 665.21 + 239.85x (Pearson r = 0.90225) (Figure 3). The correlation coefficient of 0.902 indicated that chromosome length was significantly and positively correlated with the number of SSR loci.

3.3. Screening of Polymorphic gSSR Primers

Based on the genome data of G. sherwoodiana, 192 primer pairs were randomly selected from the designed primers and synthesized. The two parents and two progenies were used for preliminary screening. The results showed that 27 of the 192 primer pairs produced polymorphic amplicons in the tested samples. The primer melting temperatures ranged from 57.7 to 60.35 °C, and the expected product sizes ranged from 103 to 280 bp (Supplementary Table S4). These primers could be used for subsequent experiments involving the hybrid-progeny population and hybrid identification.
The 27 selected polymorphic primer pairs were used for PCR amplification of the parental materials and 173 hybrid progeny. Genetic diversity analysis of the 27 polymorphic primer pairs was performed using PowerMarker (Table 1). The results showed that the 27 primer pairs amplified a total of 203 alleles, with an average of 7 polymorphic loci per marker. The effective number of alleles (Ne) ranged from 1.69 to 7.14, with an average value of 3.63. The observed heterozygosity (Ho) ranged from 0.16 to 0.97, with an average value of 0.69. The expected heterozygosity (He) ranged from 0.41 to 0.86, with an average value of 0.69. The polymorphism information content (PIC) values of most gSSR loci were higher than 0.5, ranging from 0.34 to 0.85, with an average value of 0.64. Among them, gSSR109 exhibited the highest PIC value of 0.85. These results indicated that the selected primers showed high polymorphism and that the selected hybrid-progeny materials of Globba contained substantial genetic diversity at the molecular level.

3.4. Identification of Hybrid Progenies

Individuals showing male-parent-specific fragments in the amplification products were identified as true hybrids, whereas individuals showing only female-parent fragments without male-parent-specific bands were identified as false hybrids [20]. Based on the amplification results of the 27 primer pairs, molecular hybrid identification was performed for the F1 population derived from the cross between G. sherwoodiana ‘MJ16’ and G. winitii (Supplementary Table S5). The results showed that all 173 hybrid progeny were true hybrids, with a hybrid-identification success rate of 100%. Except for gSSR22, the true hybrid-identification rates of the other 26 primer pairs ranged from 26.59% to 99.42%, indicating that it was not feasible to distinguish all true and false hybrids using a single marker alone. Considering that gSSR50 showed a true hybrid-identification rate of 99.42%, with only one individual not successfully identified, a dual-marker combination was further applied. The results showed that multiple combinations could successfully identify all hybrid progenies, achieving an identification rate of 100%.

3.5. Determination of Phenotypic Ornamental Traits in Hybrid Progenies

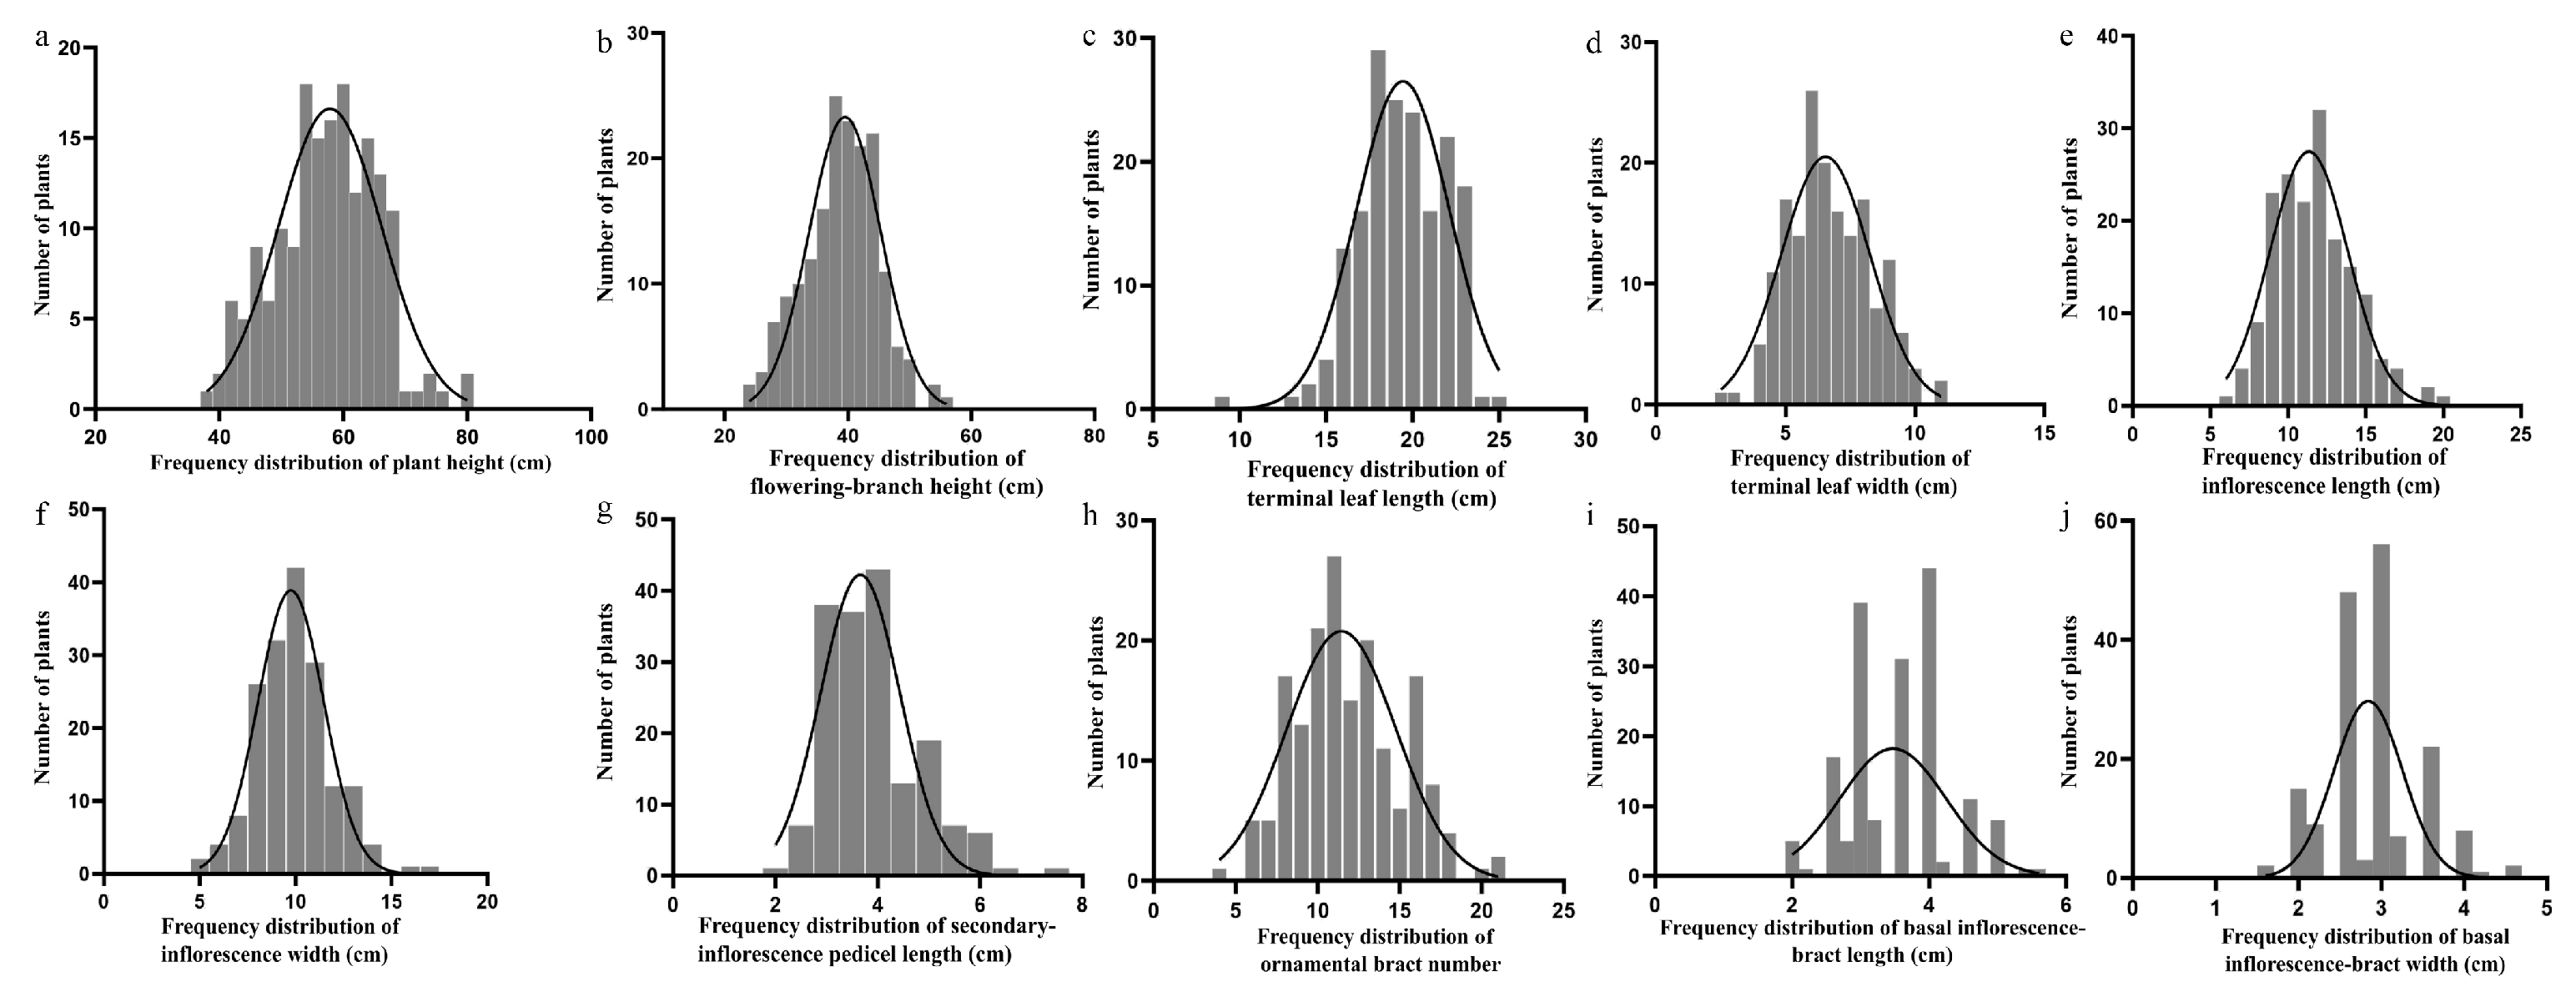
The quantitative traits of the hybrid progeny are summarized in Table 2 and Table 3. All traits varied substantially, with coefficients of variation (CVs) ranging from 13.09% to 27.43%. Variation of this magnitude indicates that the progeny population contains useful phenotypic diversity across vegetative and floral characters. Terminal leaf length had the lowest CV (13.09%). Terminal leaf width averaged 6.72 cm and ranged from 2.50 to 11.00 cm, with a standard deviation of 1.62 and a CV of 24.09%, which was significantly greater than the CV for leaf length. This pattern indicates extensive recombination of leaf shape and length-to-width ratio in the progeny population. The stronger relative variation in width than in length also suggests that the two leaf dimensions did not vary to the same extent. The CVs for floral traits, including inflorescence length, inflorescence width, secondary-inflorescence pedicel length, number of ornamental bracts, and basal inflorescence-bract length, were all above 20%. The number of ornamental bracts had the highest CV (27.43%), indicating pronounced variation in inflorescence morphology and floral organs. These floral traits may therefore offer a comparatively broad scope for phenotypic selection. Plant height and flowering-branch height had CVs of 14–16%, representing moderate variation. These plant-architecture traits therefore combined relative stability with scope for differentiation and may be useful indicators of architectural stability. Their more moderate CVs should nevertheless be interpreted as population-specific estimates rather than evidence of genetic stability by themselves. Frequency histograms for all 10 quantitative traits approximated normal distributions. Skewness describes distributional asymmetry, whereas kurtosis describes tail weight and peakedness; both statistics were used here to assess departures from normality. Absolute skewness values were below 1 (−0.46 to 0.85), as were absolute kurtosis values, which were also below 1 (−0.35 to 0.88). Plant height, flowering-branch height, and terminal leaf length were negatively skewed, whereas the remaining traits were positively skewed. Plant height, flowering-branch height, terminal leaf width, number of ornamental bracts, and basal inflorescence-bract length had negative kurtosis; the remaining traits had positive kurtosis. Collectively, these distributional statistics were consistent with approximately normal phenotypic data and supported subsequent statistical analyses and core-germplasm construction.
The phenotype distribution analysis of qualitative traits in the hybrid progeny is shown in Figure 4. The results indicated that the population exhibited significant heterogeneity in trait distribution. Among the hybrid progenies derived from G. sherwoodiana ‘MJ16’ and G. winitii, the frequencies of individuals with and without hairs on the abaxial leaf surface were relatively similar, indicating limited variation and a comparatively balanced distribution of this trait.

3.6. Association Analysis Between Ornamental Traits and gSSR Molecular Markers in Hybrid Progenies

Based on the MLM, association analysis was conducted between gSSR genotypes and ornamental traits in hybrid progenies (Table 4). After applying the false discovery rate (FDR) correction with a significance threshold of Q < 0.05, a total of six gSSR loci were found to be significantly associated with seven phenotypic ornamental traits of the hybrid progenies. The phenotypic variance explained (R2) ranged from 7.78% to 16.86%, with a mean proportion explained of 11.40%. Among these loci, gSSR48 showed the highest phenotypic variance explained for basal inflorescence-bract width, reaching 16.86%, followed closely by gSSR184 for the same trait (16.09%) and gSSR109 for secondary-inflorescence pedicel length (14.16%). In contrast, gSSR105 showed the lowest phenotypic variance explained among the significant associations for terminal leaf length, with an R2 value of 7.78%.
Several gSSR markers were associated with multiple ornamental traits, which could be a pattern consistent with pleiotropy or linkage. Marker–trait associations alone cannot distinguish a single pleiotropy or linkage causal factor from several linked factors within the same genomic region. Under the Q < 0.05 threshold, gSSR105 was associated with three traits: basal inflorescence-bract width, terminal leaf width, and terminal leaf length. gSSR109 was associated with secondary-inflorescence pedicel length (Q = 0.001). gSSR184 was associated with basal inflorescence-bract width and terminal leaf width (Q < 0.05) as well as terminal leaf length and secondary-inflorescence pedicel length at p < 0.01. gSSR48 was associated with basal inflorescence-bract width (Q < 0.001), basal inflorescence-bract length (Q = 0.026) and terminal leaf width (Q = 0.037). gSSR113 was associated with basal inflorescence-bract width (Q = 0.026). The recurrence of these significant markers across traits identifies genomic regions that warrant further validation and biological investigation. Conversely, several markers were significantly associated with the same trait. Basal inflorescence-bract width was associated with four markers passing the Q < 0.05 threshold: gSSR48, gSSR105, gSSR113, and gSSR184. Terminal leaf width was also associated with three markers exceeding the FDR threshold: gSSR48, gSSR105 and gSSR184. Additionally, three markers were significantly associated with terminal leaf length at the Q < 0.05 level only when considering gSSR105, while gSSR184 and gSSR64 showed nominal significance (p < 0.01). These patterns are consistent with polygenic architectures involving multiple loci of modest effect. They do not demonstrate that the markers themselves control the traits, because an associated marker may instead be linked to a causal variant. Thus, the trait-associated gSSR markers in Globba included putatively pleiotropic or linked loci that may support simultaneous selection for several traits, as well as multiple associated loci for individual complex traits. Validation in independent populations will be required before these markers can be used reliably for simultaneous trait selection.

4. Discussion

4.1. Development of Whole-Genome gSSR Molecular Markers in G. sherwoodiana

Simple sequence repeat markers are widely used to identify plant germplasms and characterize genetic diversity because they are abundant, broadly distributed, highly polymorphic, and codominant [21]. SSR loci may occur within or near genes that influence plant traits, and variation in some SSRs can contribute to quantitative phenotypic variation and adaptive responses. However, SSR-locus abundance alone is not a direct measure of genetic differentiation; its value lies primarily in providing a dense source of informative markers.
The 1.05-Gb G. sherwoodiana genome contained 276,809 gSSR loci, equivalent to approximately one locus every 4.03 kb and a mean density of about 250.75 SSRs/Mb. Among related Zingiberaceae species, this density was similar to that reported for Curcuma alismatifolia, whose approximately 0.99-Gb genome contains 257,032 SSR loci and chromosome-specific densities of 216.1–367.3 SSRs/Mb [12]. The similar genome sizes and locus counts provide a direct basis for comparing SSR abundance between these two taxa. Genome assembly of Hedychium spicatum Buch.-Ham. ex Smith identified 60,695 candidate SSR loci across nuclear, chloroplast, and mitochondrial genome components [22]. A MiCAPs study of 14 Zingiberaceae species indicated that the genetic background of Zingiber was more conserved than that of Curcuma, suggesting group-specific differences in SSR distribution within the family [23]. The SSR density of G. sherwoodiana was intermediate among the Zingiberaceae taxa considered, indicating an abundant marker resource for future genetic diversity studies. Polyploidization is frequent in Zingiberaceae, and variation in chromosome number and genome size is positively associated with taxonomic diversity; these features may contribute to differences in SSR density among taxa [22]. Differences in genome assembly completeness, repeat-detection criteria, and motif thresholds may also affect comparisons of reported SSR abundance. Mononucleotide repeats were the most common motif class in the G. sherwoodiana genome (58.95%), followed by dinucleotide (19.83%) and trinucleotide (19.27%) repeats. Pentanucleotide and hexanucleotide repeats were rare, each representing less than 0.25%. Thus, motif frequency generally declined as repeat-unit length increased, consistent with patterns reported for C. alismatifolia [12] and Arabidopsis thaliana (L.) Heynh. [24], as well as across 12 sequenced plant genomes [25]. This inverse relationship provides a consistent descriptive feature for cross-species comparison of SSR composition. The G. sherwoodiana genome was dominated by AT-rich motifs: A/T represented 85.73% of mononucleotide repeats, AT/AT represented 74.01% of dinucleotide repeats, and AAG/CTT represented 44.78% of trinucleotide repeats, whereas GC-rich motifs were uncommon. A similar AT-rich bias has been reported in C. alismatifolia [12] and A. thaliana [24]. Its occurrence in several taxa suggests that nucleotide composition and repeat-generation processes may contribute to shared motif preferences. SSR loci were also unevenly distributed among the 16 chromosomes of G. sherwoodiana. LG13 contained 24,869 loci, more than twice the 11,644 loci on LG01; a comparable chromosome-level imbalance was reported for C. alismatifolia [12]. Mononucleotide repeats predominated on every G. sherwoodiana chromosome (56.57–60.43%), followed by dinucleotide and trinucleotide repeats. This chromosome-level pattern mirrored the genome-wide distribution, indicating that motif-class composition was broadly conserved across chromosomes. Together, the abundance, motif diversity, and chromosomal coverage of these loci support their use in marker development and genetic analysis of Globba.
In this study, 27 pairs of polymorphic primers were selected. Seven primer pairs showed hybrid-identification rates above 80%, and gSSR50 exhibited the highest identification rate (99.42%). In Hedychium species, 62 candidate SSR primers were ultimately used to identify 20 markers, and 11 markers were successfully genotyped in 99 germplasm resources [22]. The identification efficiency of gSSR50 in G. sherwoodiana was comparable to that reported in Hedychium. These results indicated that gSSR markers developed based on whole-genome data could effectively support parentage verification in hybrid populations and provide reliable tools for germplasm resource identification and future marker-assisted breeding programs.

4.2. Genetic Diversity of Phenotypic Ornamental Traits

Phenotypic ornamental traits are outcomes of interactions between genetic factors and environmental conditions, exhibiting both stability and variability [26]. Variability is manifested by the highly diverse phenotypic traits observed in hybrid offspring, while stability is typically defined by maintaining its characteristics across multiple environments, with no significant alterations to key ornamental characteristics. This in fact describes the core requirement of breeding new varieties, which must maintain stability, specificity and consistency of traits. Characterizing ornamental phenotypes helps quantify diversity and identify traits with breeding potential. By assessing diversity indicators of plant phenotypic ornamental traits, the degree of genetic variation among plants can be rapidly evaluated within a short period [27,28]. The coefficient of variation (CV) is an indicator used to measure the degree of dispersion of phenotypic traits. A higher CV value indicates greater differences among varieties, whereas the diversity index reflects the distribution equilibrium of these variations [29]. Previous studies have shown that when the CV of phenotypic traits exceeds 10%, appreciable variation may exist among germplasm resources [30,31,32]; this threshold is not a statistical significance test.
Analysis of 11 ornamental phenotypic traits in 173 hybrid progeny showed that CVs for the 10 quantitative traits ranged from 13.09% to 27.43%. Terminal leaf length had the lowest CV, whereas ornamental-bract number had the highest, indicating greater variation and greater potential response to selection for bract number in this population. Because CV is scale-independent, it also permits comparison of relative dispersion among traits measured in different units. The 10 quantitative traits also showed approximately normal distributions, consistent with polygenic inheritance. For the qualitative trait—presence or absence of leaf back hairiness—the reported distribution frequency ranged from 2.31 to 53.76. This qualitative trait should be interpreted separately from the CV-based comparisons of quantitative traits. Overall, every quantitative trait had a CV above 10%, indicating broad phenotypic variation among the 173 hybrid progeny. This variation provides useful material for selecting and developing superior germplasm and supports further utilization of the population. Its value for selection should be confirmed across environments because observed phenotypes can reflect both genetic and environmental effects.

4.3. Association Analysis Between Phenotypic Traits and gSSR Markers

Association analysis tests for nonrandom relationships between marker genotypes and target traits, often while accounting for linkage disequilibrium (LD) and population relatedness. Marker effects are commonly summarized as phenotypic variance explained (R2), which estimates the proportion of trait variation statistically attributable to a marker in the fitted model. This statistic is specific to the model, population, marker set, and environment and should not be interpreted as a universal effect size. In this study, an MLM was used to test associations between gSSR markers and ornamental traits. After applying the FDR correction with a stringent Q < 0.05 threshold to control for multiple testing, a total of six gSSR loci were significantly associated with seven phenotypic traits. The R2 values for these significant associations ranged from 7.78% to 16.86%, with a mean of 10.40%. Among these loci, gSSR48 had the largest estimated effect, explaining 16.86% of the variation in basal inflorescence-bract width. This was closely followed by gSSR184, which explained 16.09% of the variation for the same trait, and gSSR109, which explained 14.16% of the variation in secondary-inflorescence pedicel length. We found several gSSR markers were associated with multiple ornamental traits, which could be a pattern consistent with pleiotropy or linkage. However, markers associated with several traits should not be interpreted as evidence of pleiotropy because the same pattern may result from linkage, relatedness within the population, or false-positive associations. These estimates were broadly comparable to values reported for association analyses in sea island cotton (Gossypium barbadense L.) [33], barley (Hordeum spontaneum L.) [34], and daylily (Hemerocallis spp.) [35]. Such comparability supports the potential relevance of the detected loci but does not, by itself, establish causality. An association may arise because the marker is in linkage disequilibrium with a causal variant rather than because the marker has a direct functional effect. Because the largest R2 was 16.86%, more than 83% of phenotypic variation remained unexplained by any single reported marker. No single marker therefore captured most of the observed variation in its associated trait. This outcome is typical for plant quantitative traits for at least two reasons. First, ornamental traits are often influenced by many loci of small effect, so each marker accounts for only a limited portion of variation [36]. Second, epistasis and genotype-by-environment interactions can contribute substantially to phenotypic variation [37]. Limited marker density can also leave causal genomic regions insufficiently represented. Both multi-trait and multi-marker association patterns were observed. Under the more stringent Q < 0.05 criterion, gSSR184 was significantly associated with two traits. In contrast, gSSR48 and gSSR105 each showed significant associations with three traits. These patterns suggest that the corresponding genomic regions may contain pleiotropic genes, linked genes, or regulatory elements involved in multiple developmental processes. Distinguishing among these alternatives will require denser mapping and functional evidence. Comparable patterns have been reported in other species. For example, Xgwm468.1 and Xgwm538.1 were each associated with grain iron and zinc concentrations in wheat (Triticum aestivum L.) [38]. In sorghum (Sorghum bicolor (L.) Moench), pleiotropic quantitative trait loci (QTLs) for multiple insect-resistance traits have been identified [39], and several barley chromosome regions have been reported to influence multiple traits. Conversely, basal inflorescence-bract width was associated with four gSSR loci (gSSR48, gSSR105, gSSR113, and gSSR184) that all passed the FDR threshold, while terminal leaf width was associated with three markers (gSSR48, gSSR105 and gSSR184) meeting the Q < 0.05 criterion. Terminal leaf length, basal inflorescence-bract length and secondary-inflorescence pedicel length each had at least one highly significant marker, and additional loci were nominally associated at the p < 0.01 level. These findings are consistent with polygenic architectures involving multiple loci of modest effect. Overall, the ornamental traits appear to reflect a complex genetic architecture comprising the detected marker effects together with numerous undetected genetic and environmental effects. The multi-trait markers provide starting points for investigating floral-organ development and plant morphology and may assist marker validation and fine mapping. The six markers that passed the FDR correction, along with three additional loci showing nominal significance, should therefore be described as preliminary candidate loci rather than markers ready for breeding applications. Their value for marker-assisted selection can only be established after validation in independent populations, across multiple environments, and using an appropriate statistical model with correction for multiple testing. Future work will integrate fine mapping, candidate-gene analysis, and functional testing to identify robust markers for breeding. For practical selection, marker effects and predictive performance should also be evaluated across breeding populations and production environments.

5. Conclusions

This is the first report on genome-wide mining of SSR markers in G. sherwoodiana. A total of 276,809 SSR loci were identified with an average density of 189.24–297.49 SSRs/Mb within each chromosome. Phenotypic traits were investigated for the 173 individual plants, indicating the coefficient of variation of the 10 phenotypic traits ranged from 13.09% to 27.43%. We then synthesized 192 primer pairs and screened 27 pairs of g-SSR markers with high polymorphism, amplifying a total of 203 alleles. Moreover, marker–trait association analysis suggested that six gSSR loci were found to be significantly associated with six phenotypic traits, exhibiting the highest interpretation ratio (16.86%) between gSSR48 and basal inflorescence-bract width. The identification of large-scale g-SSR markers will provide valuable references for germplasm resource evaluation and molecular breeding of Globba.

Supplementary Materials

The following supporting information can be downloaded at https://www.mdpi.com/article/10.3390/horticulturae12091135/s1, Table S1. The detailed information on genome assembly quality of Globba sherwoodiana; Table S2. Detailed information of 192 pairs of primers; Table S3. The number of nucleotides in the whole genome chromosome of G. sherwoodiana; Table S4. 27 pairs of polymorphic gSSR information; Table S5. Identification of true hybrid F1 plants using gSSR primers.

Author Contributions

Methodology, Y.Y.; software, Y.Z.; formal analysis, Y.Y.; investigation, J.C., P.C. and J.T.; resources, L.H.; data curation, Y.Z.; writing—review and editing, J.C. and Y.Y.; visualization, Y.Z.; supervision, T.Z.; project administration, Y.Y. All authors have read and agreed to the published version of the manuscript.

Funding

This research was funded by the Guangzhou Science and Technology Program Project (grant number 2025D04J0098); the Guangdong Provincial Forestry Science and Technology Project (grant number 2024KJQT0013); and the Special Funding for the Construction of the High-Level Academy of Agricultural Sciences (grant number NYQS202611).

Data Availability Statement

The original contributions presented in this study are included in the article/Supplementary Materials. Further inquiries can be directed to the corresponding author(s).

Conflicts of Interest

The authors declare no conflicts of interest.

References

  1. Talip, N.; Basir, S.; Amri, C.N.A.C.; Ghazalli, M.N.; Zohar, A.F.; Juhari, M.A.A.A.; Rahman, M.R.A.; Bunawan, H. Taxonomic Significance of Leaf Anatomical Characteristics of Selected Globba L. (Zingiberaceae) Species in Peninsular Malaysia. Trop. Life Sci. Res. 2025, 36, 59–82. [Google Scholar] [CrossRef] [Scilit] [PubMed]
  2. Gowda, V.; Kress, W.J.; Htun, T. Two New Species of Gingers (Zingiberaceae) from Myanmar. PhytoKeys 2012, 13, 5–14. [Google Scholar] [CrossRef] [Scilit] [PubMed]
  3. Doungchawee, J.; Kulsing, C.; Suekaew, N.; Pombejra, S.N.; Chavasir, W.; Plabutong, N.; Thammahong, A.; Khotavivattana, T. Volatile Chemical Composition, Antibacterial and Antifungal Activities of Extracts from Different Parts of Globba schomburgkii Hook. F. Chem. Biodivers. 2019, 16, e1900057. [Google Scholar] [CrossRef] [Scilit] [PubMed]
  4. Wang, Z.T.; Pan, Y.B.; Luo, J.; You, Q.; Xu, L.P.; Zhang, H.; Que, Y.X. SSR-based Genetic Identity of Sugarcane Clones and its Potential Application in Breeding and Variety Extension. Sugar Tech 2020, 22, 367–378. [Google Scholar] [CrossRef] [Scilit]
  5. Savadi, S.; Muralidhara, B.M.; Venkataravanappa, V.; Adiga, J.D.; Manjunatha, K.; Patil, B. De Novo Transcriptome Assembly and its Utility in Development and Characterization of the First Set of Genic SSR Markers in Cashew. Ind. Crop. Prod. 2022, 189, 115734. [Google Scholar] [CrossRef] [Scilit]
  6. Kalia, R.K.; Rai, M.K.; Kalia, S.; Singh, R.; Dhawan, A.K. Microsatellite Markers: An Overview of the Recent Progress in Plants. Euphytica 2011, 177, 309–334. [Google Scholar] [CrossRef] [Scilit]
  7. Ye, Y.J.; Xu, Y.C.; Li, D.M.; Tan, J.J.; Liu, J.M. Characterization of EST-SSR Markers in Curcuma kwangsiensis S.K. Lee & C.F. Liang based on RNA Sequencing and its Application for Phylogenetic Relationship Analysis and Core Collection Construction. Genet. Resour. Crop. Evol. 2021, 68, 1503–1516. [Google Scholar] [CrossRef] [Scilit]
  8. Ye, Y.J.; Fu, H.P.; Zhou, Y.W.; Zhang, S.X.; Wang, Z.H.; Tian, L.H.; Tan, J.J.; Zhu, G.F.; Liu, J.M.; Xu, Y.C. Establishment of DNA Molecular Fingerprint of Caladium Core Collections. Agriculture 2023, 13, 200. [Google Scholar] [CrossRef] [Scilit]
  9. Varshney, R.K.; Graner, A.; Sorrells, M.E. Genic Microsatellite Markers in Plants: Features and Applications. Trends. Biotechnol. 2005, 23, 48–55. [Google Scholar] [CrossRef] [Scilit] [PubMed]
  10. Wang, L.N.; Gao, W.; Wang, Q.Y.; Qu, J.B.; Zhang, J.X.; Huang, C.Y. Identification of Commercial Cultivars of Agaricus bisporus in China Using Genome-wide Microsatellite Markers. J. Integr. Agr. 2019, 18, 580–589. [Google Scholar] [CrossRef] [Scilit]
  11. Tao, L.L.; Ting, Y.J.; Chen, H.R.; Wen, H.L.; Hui, X.I.E.; Luo, L.Y.; Huang, K.L.; Zhu, J.Y.; Liu, S.R.; Wei, C.L. Core Collection Construction of Tea Plant Germplasm in Anhui Province Based on Genetic Diversity Analysis Using Simple Sequence Repeat Markers. J. Integr. Agr. 2023, 22, 2719–2728. [Google Scholar] [CrossRef] [Scilit]
  12. Ye, Y.J.; Tan, J.J.; Lin, J.Y.; Zhang, Y.; Zhu, G.F.; Nie, C.R.; Huang, L.S.; Zhou, Y.W.; Xu, Y.C. Genome-wide Identification of SSR Markers for Curcuma alismatifolia Gagnep., and Their Potential for Wider Application in this Genus. J. Appl. Res. Med. Aroma. 2024, 42, 100572. [Google Scholar] [CrossRef] [Scilit]
  13. Hamm, T.P.; Boggess, S.L.; Kandel, J.S.; Staton, M.E.; Huff, M.L.; Hadziabdic, D.; Shoemaker, D.E.; Adamczyk, J.J.; Nowicki, M.; Trigiano, R.N. Development and Characterization of 20 Genomic SSR Markers for Ornamental Cultivars of Weigela. Plants 2022, 11, 1444. [Google Scholar] [CrossRef] [Scilit] [PubMed]
  14. Sunisa, S.; Tomáš, F.; Jessada, D.; Newman, M.F. Phylogeny of Globba Section Nudae and Taxonomic Revision of the New Globba Subsection Pelecantherae. Plant Syst. Evol. 2022, 308, 5. [Google Scholar] [CrossRef] [Scilit]
  15. Zhou, Y.W.; Tan, J.J.; Huang, L.S.; Xu, Y.C.; Ye, Y.J. Decoding the Color Palette in the Ornamental Bracts of Globba spp.: Insights from Phenotypic, Metabolomic, and Transcriptomic Analyses. Planta 2025, 262, 11. [Google Scholar] [CrossRef] [Scilit] [PubMed]
  16. Shen, J.S.; Liao, W.H.; Rong, X.L.; Wei, C.H.; Zhang, M.L. Characterization of the Complete Chloroplast Genomes of Globba racemosa Smith in the Family Zingiberaceae. Mitochondrial DNA Part B 2026, 11, 237–240. [Google Scholar] [CrossRef] [Scilit] [PubMed]
  17. An, X.; Luo, X.H.; Liu, T.T.; Li, W.L.; Zou, L.N. Development and Application of Fruit Color-related Expressed Sequence Tag-simple Sequence Repeat Markers in Abelmoschus esculentus on the Basis of Transcriptome Sequencing. Front. Plant Sci. 2022, 13, 907895. [Google Scholar] [CrossRef] [Scilit] [PubMed]
  18. Zuo, Q.M.; Wen, Z.X.; Zhang, S.Y.; Hou, J.F.; Gai, J.Y.; Yu, D.Y.; Xing, H. QTL Identification of the Insensitive Response to Photoperiod and Temperature in Soybean by Association Mapping. J. Integr. Agr. 2013, 12, 1423–1430. [Google Scholar] [CrossRef] [Scilit]
  19. Jaganathan, D.; Gibbs, J.M.; Thomas, N.; McAvoy, T.; Azad, M.; Tian, M.Y.; Lozada, N.D.; Railey, W.H.; Nankar, A.N. Morphological and Simple Sequence Repeat (SSR)-Based Diversity of Capsicum Germplasm Characterizes Population Structure and Enables Marker-Assisted Selection for Phytophthora Capsici Resistance. Euphytica 2026, 222, 50. [Google Scholar] [CrossRef] [Scilit]
  20. Khan, H.; Sivalingam, P.N.; Chauhan, S.; Awasthi, O.P.; More, T.A. Improved Crossing Technique and Identification of True F1 Hybrids of Ziziphus Mauritiana Lam. by Molecular Markers. Sci. Hortic. 2013, 150, 164–171. [Google Scholar] [CrossRef] [Scilit]
  21. Song, Q.J.; Shi, J.R.; Singh, S.; Fickus, E.W.; Costa, J.M.; Lewis, J.; Gill, B.S.; Ward, R.; Cregan, P.B. Development and Mapping of Microsatellite (SSR) Markers in Wheat. Theor. Appl. Genet. 2005, 110, 550–560. [Google Scholar] [CrossRef] [Scilit] [PubMed]
  22. Xavier, A.; Gowda, V. Characterization of SSR Markers From Draft Genome Assembly and Genotypic Data in Hedychium spicatum (Zingiberaceae). Data Brief. 2024, 55, 110568. [Google Scholar] [CrossRef] [Scilit] [PubMed]
  23. Shi, M.; Tanaka, K.; Rivera, M.P.; Thein, M.S.; Ngure, G.M.; Watanabe, K.N. Comprehensive SSR Study of 14 Zingiberaceae Species Based on Microsatellite Capture Sequencing (MiCAPs). Front. Plant Sci. 2025, 16, 1693622. [Google Scholar] [CrossRef] [Scilit] [PubMed]
  24. Lawson, M.J.; Zhang, L.Q. Distinct Patterns of SSR Distribution in the Arabidopsis thaliana and Rice Genomes. Genome Biol. 2006, 7, R14. [Google Scholar] [CrossRef] [Scilit] [PubMed]
  25. Tóth, G.; Gáspári, Z.; Jurka, J. Microsatellites in Different Eukaryotic Genomes: Survey and Analysis. Genome Res. 2000, 10, 967–981. [Google Scholar] [CrossRef] [Scilit] [PubMed]
  26. Hou, J.; Liu, M.; Yang, K.; Liu, B.; Liu, H.H.; Liu, J.Q. Genetic Variation for Adaptive evolution in Response to Changed Environments in Plants. J. Integr. Plant Biol. 2025, 67, 2265–2293. [Google Scholar] [CrossRef] [Scilit] [PubMed]
  27. Ye, Y.J.; Wu, J.Y.; Feng, L.; Ju, Y.Q.; Cai, M.; Cheng, T.R.; Pan, H.T.; Zhang, Q.X. Heritability and gene effects for plant architecture traits of crape myrtle using major gene plus polygene inheritance analysis. Sci. Hortic. 2017, 225, 335–342. [Google Scholar] [CrossRef] [Scilit]
  28. Liu, C.; Xu, H.; Li, Z.; Wang, Y.K.; Zhang, J.X.; Qiao, S.W.; Zhang, H. From Map to Blueprint: The Plant Pan-Genome Unraveling Genetic Mysteries and Powering Precision breeding. Front. Plant Sci. 2025, 16, 1673637. [Google Scholar] [CrossRef] [Scilit] [PubMed]
  29. Qu, L.Q.; Yuan, B.Y.; Wen, X.H.; Guo, J.; Luo, J.R.; Shi, X.H. Analysis of Phenotypic Diversity and Comprehensive Evaluation of 51 Helleborus L. Hybrid Individuals. Plants 2025, 14, 3226. [Google Scholar] [CrossRef] [Scilit] [PubMed]
  30. Guo, Q.; Liu, J.; Li, J.K.; Cao, S.; Zhang, Z.J.; Zhang, J.T.; Zhang, Y.S.; Deng, Y.P.; Niu, D.S.; Su, L.Z.; et al. Genetic Diversity and Core Collection Extraction of Robinia pseudoacacia L. Germplasm Resources Based on Phenotype, Physiology, and Genotyping Markers. Ind. Crop. Prod. 2022, 178, 114627. [Google Scholar] [CrossRef] [Scilit]
  31. Zhang, Y.P.; Liu, J.F.; Jing, L.H.; Ding, D.H.; Chang, W.; Cao, L.L.; Zhang, W.; Chen, J.B.; Yang, S.Q. Genetic diversity analysis of seed phenotypic traits of 302 mung bean germplasm resources. Cienc. Rural 2024, 54, e20230542. [Google Scholar] [CrossRef] [Scilit]
  32. Osei, C.Y.; Lee, S.; Desta, K.T.; Kim, E.G.; Yoo, E.; Lee, J.E.; Lee, G.A. Diversity in agro-morphological traits and phytochemical content of amaranth germplasm. Hortic. Enviro. Biotechnol. 2026, 67, 235–249. [Google Scholar] [CrossRef] [Scilit]
  33. Ma, Q.; Zhao, J.; Lin, H.; Ning, X.Z.; Liu, P.; Deng, F.J.; Si, A.J.; Li, J.L. Association Between SSR Markers and Fibre Traits in Sea Island Cotton (Gossypium barbadense) Germplasm Resources. J. Genet. 2017, 96, e55–e63. [Google Scholar] [CrossRef] [Scilit] [PubMed]
  34. Abou-Elwafa, S.F. Association Mapping for Yield and Yield-Contributing Traits in Barley Under Drought Conditions With genome-Based SSR Markers. Comptes Rendus. Biol. 2016, 339, 153–162. [Google Scholar] [CrossRef] [Scilit] [PubMed]
  35. Ye, Y.J.; Zhou, Y.W.; Tan, J.J.; Liu, J.M.; Wan, X.X.; Jin, H.; Xu, Y.C. EST-SSR Markers Development and Association Analysis of Flowering Traits in Hemerocallis Accessions. Mol. Plant Breed. 2023, 1–17. (In Chinese) [Google Scholar]
  36. Ingvarsson, P.K.; Street, N.R. Association Genetics of Complex Traits in Plants. New Phytol. 2011, 189, 909–922. [Google Scholar] [CrossRef] [Scilit] [PubMed]
  37. Dwivedi, S.L.; Heslop-Harrison, P.; Amas, J.; Ortiz, R.; Edwards, D. Epistasis and Pleiotropy-Induced Variation for Plant Breeding. Plant Biotechnol. J. 2024, 22, 2788–2807. [Google Scholar] [CrossRef] [Scilit] [PubMed]
  38. Kumar, J.; Singh, P.; Ahmed, S.; Garg, N.; Sharma, H.; Singh, R.; Kumar, R.; Sheikh, I.; Roy, J. Genotype × Environment Interaction, Marker-Trait Association, and SSR Validation for Grain Micronutrient Content and Yield in Wheat (Triticum aestivum L.). J. Cereal Sci. 2025, 124, 104227. [Google Scholar] [CrossRef] [Scilit]
  39. Apotikar, D.B.; Venkateswarlu, D.; Ghorade, R.B.; Wadaska, R.M.; Patil, J.V.; Kulwal, P.L. Mapping of Shoot Fly Tolerance Loci in Sorghum Using SSR Markers. J. Genet. 2011, 90, 59–66. [Google Scholar] [CrossRef] [Scilit] [PubMed]
Figure 1. Flower photos of partial hybrid F1 population.
Horticulturae 12 01135 g001
Figure 2. The distribution frequency of different base-type repeats.
Horticulturae 12 01135 g002
Figure 3. Distribution of gSSR loci on the chromosomes of G. sherwoodiana. (a) Heatmap showing microsatellite density across the 16 chromosomes. (b) Number and density of different SSR motif types in the 16 chromosomes. (** indicates p < 0.01).
Horticulturae 12 01135 g003
Figure 4. Distribution frequency of quantitative traits of hybrid offspring. (a) Frequency distribution of plant height. (b) Frequency distribution of flowering-branch height; (c) frequency distribution of terminal leaf length; (d) frequency distribution of terminal leaf width; (e) frequency distribution of inflorescence length; (f) frequency distribution of inflorescence width; (g) frequency distribution of secondary-inflorescence pedicel length; (h) frequency distribution of ornamental bract number; (i) frequency distribution of basel inflorescence-bract length; (j) frequency distribution of basel inflorescence-bract width.
Horticulturae 12 01135 g004
Table 1. Diversity analysis of 27 pairs of SSR polymorphic primers.
PrimerNumber of Alleles (Na)Effective Number of Alleles (Ne)Observed Heterozygosity
(Ho)
Expected Heterozygosity (He)Polymorphic Information Content (PIC)
gSSR693.850.820.740.69
gSSR15125.560.930.820.80
gSSR1962.780.970.640.58
gSSR2273.230.910.690.64
gSSR34175.880.840.830.82
gSSR3531.690.170.410.37
gSSR3842.220.760.550.47
gSSR3984.170.550.760.73
gSSR4064.000.910.750.71
gSSR4863.700.670.730.68
gSSR5041.750.610.430.34
gSSR6462.780.950.640.59
gSSR72113.850.710.740.70
gSSR76114.550.640.780.75
gSSR85123.570.550.720.68
gSSR8752.860.760.650.58
gSSR103135.880.540.830.81
gSSR10543.030.680.670.61
gSSR10663.230.970.690.63
gSSR109127.140.890.860.85
gSSR11383.570.570.720.67
gSSR11842.080.400.520.40
gSSR13164.350.730.770.74
gSSR14542.170.720.540.48
gSSR15754.550.820.780.74
gSSR16952.500.160.600.52
gSSR18492.940.360.660.60
Total203.0097.8818.5918.5217.18
Mean7.523.630.690.690.64
Table 2. Comparison of quantitative trait data and coefficient of variation of 173 hybrid offspring.
Quantitative TraitMinimumMaximumMeanStandard Deviation (SD)SkewnessKurtosisCoefficient of Variation (CV) (%)
Plant height (cm)378056.868.19−0.03−0.1914.41
Flowering-branch height (cm)235638.526.09−0.11−0.0315.81
Terminal leaf length (cm)8.52519.302.53−0.460.8813.09
Terminal leaf width (cm)2.5116.721.620.23−0.3524.09
Inflorescence length (cm)62011.602.570.470.3022.13
Inflorescence width (cm)4179.811.970.410.8520.08
Secondary-inflorescence pedicel length (cm)27.53.920.920.850.8823.37
Number of ornamental bracts42111.883.260.34−0.2427.43
Basal inflorescence-bract length (cm)25.53.500.730.25−0.2620.84
Basal inflorescence-bract width (cm)1.54.52.860.550.410.2119.36
Table 3. Classification of quality traits and resource distribution of hybrid offspring.
Qualitative TraitTrait DescriptionNumber of IndividualsFrequency (%)
Presence or absence of leaf back hairinessWith hairs9353.76
Without hairs8046.24
Table 4. gSSR markers significantly associated with phenotypic traits based on mixed linear model analysis (* Indicates p < 0.05).
TraitgSSR MarkerF Valuep ValueQ ValueExplained Variance (R2)
Plant height (cm)gSSR344.7580.00320.0657.79%
Terminal leaf length (cm)gSSR1057.1710.00100.034 *7.78%
gSSR1844.6420.00380.0607.61%
gSSR644.9950.00780.0975.55%
Terminal leaf width (cm)gSSR1847.1651.48 × 10−40.009 *11.28%
gSSR1057.7126.22 × 10−40.031 *8.32%
gSSR485.5100.00120.037 *8.91%
gSSR394.9380.00250.0598.06%
Presence or absence of leaf back hairinessgSSR1696.1840.00250.0636.78%
gSSR1064.7040.00350.0657.71%
gSSR1054.7670.00960.1155.31%
Flowering-branch height (cm)gSSR1094.8450.00290.0627.92%
gSSR154.3440.00560.0797.16%
gSSR344.2870.00600.0787.07%
Inflorescence length (cm)gSSR1094.2920.00600.0817.08%
Secondary-inflorescence pedicel length (cm)gSSR1099.2931.01 × 10−50.001 *14.16%
gSSR1844.6460.00370.0637.62%
gSSR1055.6290.00420.0646.21%
Basal inflorescence-bract length (cm)gSSR485.9477.04 × 10−40.026 *9.55%
gSSR385.1750.00190.0528.41%
gSSR394.6670.00360.0647.65%
Basal inflorescence-bract width (cm)gSSR4811.4287.33 × 10−70.00022 *16.86%
gSSR18410.8061.56 × 10−60.00023 *16.09%
gSSR10511.0713.02 × 10−50.002 *11.52%
gSSR1136.0086.50 × 10−40.028 *9.64%
Disclaimer/Publisher’s Note: The statements, opinions and data contained in all publications are solely those of the individual author(s) and contributor(s) and not of MDPI and/or the editor(s). MDPI and/or the editor(s) disclaim responsibility for any injury to people or property resulting from any ideas, methods, instructions or products referred to in the content.