Article

Identification of Cell Wall and Carbon Metabolism Associated Changes in Autotetraploid Grapevine Through Phenotypic, Transcriptomic and Metabolomic Analyses


1
The Key Laboratory of Special Fruits and Vegetables Cultivation Physiology and Germplasm Resources Utilization of Xinjiang Production and Construction, Department of Horticulture, Agricultural College of Shihezi University, Shihezi 832003, China
2
Shanghai Collaborative Innovation Center of Agri-Seeds, School of Agriculture and Biology, Shanghai Jiao Tong University, Shanghai 200240, China
*
Authors to whom correspondence should be addressed.
Horticulturae 2026, 12(8), 992; https://doi.org/10.3390/horticulturae12080992
Submission received: 15 June 2026 / Revised: 31 July 2026 / Accepted: 8 August 2026 / Published: 11 August 2026
(This article belongs to the Special Issue Research Progress on Grape Genetic Diversity)

Abstract

Polyploidization can generate morphological and physiological variation in plants, but the molecular basis underlying leaf trait changes after genome doubling in grapevine remains insufficiently understood. This study aimed to characterize phenotypic, physiological, transcriptomic, and metabolomic differences between diploid and induced autotetraploid plants of ‘Thompson Seedless’ and to identify biological processes potentially associated with the observed leaf trait variation. In this study, autotetraploid plants were induced from axillary buds of ‘Thompson Seedless’ using colchicine treatment, and ploidy levels were confirmed by flow cytometry and chromosome counting. Phenotypic, physiological, transcriptomic, and metabolomic analyses were performed to compare diploid and tetraploid plants. Compared with diploids, tetraploids exhibited enlarged leaves, reduced plant stature, larger but less dense stomata, increased chloroplast number in guard cells, and higher total chlorophyll and carotenoid contents. Fv/Fm remained unchanged, whereas increased Vj and decreased ψEo and φEo suggested differences in electron transport-related characteristics beyond QA. Transcriptomic analysis identified 1564 differentially expressed genes, and metabolomic profiling detected 618 differentially accumulated metabolites. Integrated analyses highlighted coordinated molecular differences associated mainly with cell-wall processes, secondary metabolism, redox-related functions, and carbon-related pathways. These findings identify candidate biological processes for future functional validation and provide a basis for evaluating the potential value of autotetraploid germplasm in grapevine breeding.

1. Introduction

Polyploidization is a major evolutionary process and an important source of phenotypic variation in plants [1,2,3]. Whole-genome duplication can arise naturally or be induced through antimitotic treatments that disrupt chromosome segregation during mitosis. [1,4]. In plant breeding, colchicine and related compounds are commonly applied to meristematic tissues to generate polyploid germplasm [4,5,6]. Genome doubling is frequently associated with increased cell size, altered organ morphology, larger but less dense stomata, and changes in plant physiological characteristics [3,7,8].
Grapevine (Vitis vinifera L.) is a high-value perennial fruit crop, and the development of improved germplasm remains an important objective in grapevine breeding [9]. Induced tetraploid grapevines have been obtained by antimitotic treatment of axillary buds, shoot apices, micropropagated plantlets, and somatic embryos [5,6,10,11]. Autotetraploid regenerants have also been recovered through somatic embryogenesis, including both antimitotic induction and spontaneous ploidy variation during plant regeneration [11,12]. Comparative studies have reported larger stomata with lower density, reduced shoot and internode growth, thicker stems, more compact root systems, and marked changes in mature leaf morphology in tetraploid grapevine materials [6,12,13]. Collectively, these studies demonstrate the feasibility of generating grapevine autotetraploids and document substantial variation in growth, leaf morphology, stomatal traits, and other agronomic characteristics. However, much of the available research has focused on induction procedures, ploidy verification, and phenotypic characterization, whereas coordinated transcriptomic and metabolomic differences associated with induced autotetraploid grapevine leaves remain comparatively less characterized.
Beyond visible morphological changes, induced autopolyploidization can be accompanied by species- and tissue-dependent differences in gene expression and metabolite accumulation [14,15,16,17]. Integrated transcriptomic and metabolomic studies in several autopolyploid systems have identified broad molecular differences involving primary and specialized metabolic pathways [14,16,17]. In synthetic Solanum autotetraploids, comparative transcriptomic and metabolomic profiling identified extensive changes in transcripts and metabolites following genome doubling, although the magnitude and direction of these changes differed between species [14]. Analyses of Arabidopsis autopolyploids have demonstrated ploidy-associated differences in plant growth and cell-wall composition, including changes in cellulose, lignin, matrix polysaccharides, and cell-wall sugar composition [15]. Studies in autotetraploid Isatis indigotica and rice have further identified transcript and metabolite differences associated with phenylpropanoid and lignan biosynthesis, starch and sucrose metabolism, amino acid metabolism, and other secondary-metabolic pathways [16,17,18,19,20,21].
However, comparable integrated transcriptomic and metabolomic evidence remains limited for induced autotetraploid grapevine leaves. Although previous grapevine studies have documented differences in leaf morphology, stomatal traits, and plant architecture, it remains unclear whether these phenotypes are accompanied by coordinated differences in gene expression and metabolite accumulation. It is particularly important to determine whether transcript and metabolite differences associated with autotetraploid grapevine involve cell-wall organization, carbohydrate metabolism, glycosylation, redox-related functions, secondary metabolism, and carbon-related pathways. Integrated transcriptomic and metabolomic analyses can therefore be used to identify pathway-level associations between gene expression, metabolite accumulation, and leaf trait variation in diploid and induced autotetraploid grapevines. Such analyses provide molecular associations but do not directly establish changes in enzyme activity or metabolic flux. Accordingly, this study aimed to induce and confirm autotetraploid plants of ‘Thompson Seedless’ and to compare their morphological, anatomical, and physiological characteristics with those of diploid plants. We further integrated transcriptomic and metabolomic data to identify biological processes and pathway-level molecular differences associated with leaf trait variation between diploid and tetraploid plants.

2. Materials and Methods

2.1. Plant Materials and Polyploid Induction

Axillary buds of Vitis vinifera ‘Thompson Seedless’ cultured in vitro for 40 days were used as initial explants. Following the method described [5], a 10% (w/v) colchicine stock solution was prepared, filter-sterilized, and added to autoclaved MS medium to obtain final concentrations of 0.05%, 0.10%, 0.15%, 0.20%, and 0.30% (w/v). Explants were cultured on colchicine-containing media for 48 or 72 h, then transferred to colchicine-free medium for recovery. After growth resumption, ploidy levels were determined.
All surviving axillary buds obtained from the colchicine treatments were individually screened by flow cytometry. Plants showing a diploid peak, both diploid and tetraploid peaks, or a single tetraploid peak were classified as diploid, mixoploid, or putative tetraploid plants, respectively. Following ploidy screening, 22 independently derived autotetraploid lines were obtained (Table 1). Among these, the autotetraploid line QW91, which originated from treatment with 0.10% (w/v) colchicine for 72 h, was selected for subsequent analyses. QW91 was clonally propagated through three successive subculture cycles, after which its ploidy was re-examined and confirmed to be tetraploid. Untreated in vitro-propagated plantlets of diploid ‘Thompson Seedless’ were used as the diploid controls. No mock-treated regenerants or colchicine-exposed explants that remained diploid were included as additional controls. All subsequent morphological, anatomical, physiological, chlorophyll fluorescence, RNA-seq, metabolomic, and RT-qPCR analyses were performed using clonally propagated plants derived from these same diploid and tetraploid source materials. Separate clonal plants were allocated to the different analyses.

2.2. Ploidy Verification and Morphological Characterization

Ploidy levels were screened by flow cytometry using diploid and tetraploid standards [22]. Putative tetraploids were confirmed by somatic chromosome counting from root tip cells [23]. Following ploidy confirmation, the autotetraploid line QW91 and untreated diploid ‘Thompson Seedless’ controls were clonally propagated for subsequent experiments. Plants derived from these two source materials were used consistently throughout the morphological, anatomical, physiological, and molecular analyses. Plant height, stem diameter, fresh weight, and dry weight were recorded after 40 days. Leaf area was measured using ImageJ (version 1.54). Stomatal size and density were assessed from epidermal imprints, and chloroplast number per guard cell was determined using confocal microscopy.

2.3. Growth Conditions, Sampling, and Physiological Measurements

All diploid and autotetraploid materials were clonally propagated under sterile in vitro conditions. After 40 days of in vitro culture, plantlets with a similar growth status were selected and transplanted individually into plastic pots containing a 1:1 (v/v) mixture of peat and vermiculite. The plants were maintained under controlled growth conditions with a 16 h light/8 h dark photoperiod, a light intensity of approximately 8000 lux, day/night temperatures of 25/20 °C, and a relative humidity of approximately 60%. During substrate cultivation, the plants were irrigated every 10 days. No additional fertilizer was applied during the experimental period. The pots were arranged randomly and repositioned weekly to minimize possible positional effects.
Following transplantation, the plants were acclimatized and maintained under the controlled conditions described above for 40 days. Fully expanded functional leaves were then collected from diploid and autotetraploid plants for physiological measurements, chlorophyll fluorescence analysis, RNA-seq, metabolomic analysis, and RT-qPCR. Fully expanded leaves from diploid and tetraploid plants were used for physiological measurements. Leaf relative water content was determined according to standard protocols. Photosynthetic pigment contents, including chlorophyll a, chlorophyll b, total chlorophyll, and carotenoids, were measured using mature leaves. The chlorophyll a/b ratio was calculated based on chlorophyll a and chlorophyll b contents [24,25].
Chlorophyll fluorescence transients were recorded from fully expanded leaves after dark adaptation. OJIP fluorescence curves were obtained, and selected JIP-test parameters were calculated from the fluorescence transients, including Fo, Fm, Fv/Fm, Vj, Vi, ABS/RC, TRo/RC, ψEo, φEo, ABS/CSo, TRo/CSo, ABS/CSm, TRo/CSm, and PIabs. The definitions and physiological interpretations of the fluorescence parameters are listed in Supplementary Table S1 [26].

2.4. Stomatal and Chloroplast Observations

Fully expanded leaves from diploid and tetraploid plants were selected for epidermal imprint analysis. Clear nail polish was applied to the abaxial surface of the leaves, and after drying, the imprints were carefully peeled off and used for microscopic observation. Stomatal size (length and width) was measured using an Olympus BX51 microscope (Olympus Corporation, Tokyo, Japan) equipped with a 40× objective lens. For each sample, 30 stomata were randomly selected and measured [27].
To observe chloroplasts in guard cells, fresh leaf discs were prepared and examined using a Nikon confocal laser scanning microscope (Nikon Corporation, Tokyo, Japan) under excitation at 560 nm. The number of chloroplasts per guard cell was quantified accordingly [28].

2.5. RNA Sequencing and Transcriptome Analysis

For RNA-seq analysis, fully expanded functional leaves were collected from clonally propagated plants of the untreated diploid control and the confirmed autotetraploid line QW91. Total RNA was extracted from each biological sample and used for library construction. RNA concentration and integrity were evaluated using an Agilent 2100 Bioanalyzer (Agilent Technologies, Santa Clara, CA, USA). RNA libraries were constructed using the Hieff NGS® Ultima Dual-mode RNA Library Prep Kit (Premixed version; Yeasen Biotechnology (Shanghai) Co., Ltd., Shanghai, China) following the manufacturer’s protocol. For each ploidy group, fully expanded functional leaves were collected from three independently grown plants, with each plant constituting one biological replicate. Six libraries were constructed from three independently grown diploid plants and three independently grown clonal plants of the autotetraploid line QW91, with each plant representing one biological replicate. The libraries were sequenced on a DNBSEQ platform (MGI Tech Co., Ltd., Shenzhen, China) to generate paired-end reads. Raw reads were quality-filtered using fastp to remove adapter-containing and low-quality reads. Read pairs were discarded when either read contained more than five undetermined bases or when bases with a Phred quality score ≤ 15 accounted for more than 40% of the read length. The resulting clean reads were aligned to the Vitis vinifera reference genome version 2.1 (PN40024) using HISAT2 (version 2.2.1). Gene-level read counts were generated using featureCounts (version 2.0.8). Reads with a mapping-quality score below 10, unpaired reads, and reads mapped to multiple genomic locations were excluded. Gene expression levels were normalized as fragments per kilobase of transcript per million mapped reads (FPKM). Quantitative real-time PCR (qRT-PCR) was performed to validate the reliability of the RNA-seq results. Gene-specific primers were designed (Supplementary Table S2), and amplification was conducted using a SYBR Green-based fluorescence detection system (Vazyme Biotech Co., Ltd., Nanjing, China) according to the manufacturer’s instructions. Reactions were carried out on a CFX96 Touch real-time PCR system (Bio-Rad Laboratories, Hercules, CA, USA) [29]. Relative expression levels were calculated using the 2−ΔΔCt method, with ACTIN2 used as the internal reference gene. Differential expression analysis was performed using DESeq2 (version 1.46.0) based on raw read counts. Count data were normalized using the DESeq method, and differential expression was evaluated using a negative-binomial model. p-values were adjusted for multiple testing using the Benjamini–Hochberg procedure. Differentially expressed genes (DEGs) were identified using an adjusted p-value ≤ 0.05 and |log2 fold change| ≥ 1. Gene Ontology and Kyoto Encyclopedia of Genes and Genomes (KEGG) enrichment analyses were performed to determine significantly enriched functional categories [30]. Terms or pathways with an adjusted p-value < 0.05 were considered significantly enriched. For heatmap visualization, FPKM values of selected DEGs were transformed using log2(FPKM + 1) and then Z-score normalized by row. The normalized values were used to compare relative expression patterns between diploid and tetraploid samples.

2.6. Metabolomic Analysis

Leaf samples for metabolomic analysis were collected from the same biological replicate plants used for RNA-seq analysis. The samples were freeze-dried and extracted with 70% methanol. The extracts were analyzed using an ultra-high-performance liquid chromatography–tandem high-resolution mass spectrometry system consisting of a UHPLC instrument coupled to a quadrupole-Orbitrap mass spectrometer (Thermo Fisher Scientific, Waltham, MA, USA) [31,32]. Metabolites features were annotated by matching retention times and MS1 and MS/MS spectra against authentic standards, public spectral libraries, and theoretical spectral libraries. Relative metabolite abundance was determined from normalized chromatographic peak areas. Principal component analysis (PCA), correlation analysis, and hierarchical clustering analysis were performed to evaluate sample consistency and metabolite accumulation patterns. PCA was performed using SIMCA (version 18.0) (Sartorius Stedim Data Analytics AB, Umeå, Sweden) after logarithmic transformation and mean-centering of the normalized data. Hierarchical clustering was based on Euclidean distances using the complete-linkage method. Orthogonal partial least squares–discriminant analysis (OPLS-DA) was performed using SIMCA after logarithmic transformation and unit-variance scaling. Model robustness was evaluated using seven-fold cross-validation and 200 permutation tests. VIP values were obtained from the first predictive component of the OPLS-DA model. Differentially accumulated metabolites (DAMs) were identified based on VIP ≥ 1.0 and p < 0.05, with p-values calculated using a two-sided Student’s t-test. DAMs were annotated and subjected to pathway enrichment analysis using the KEGG database. Pathways with p-value < 0.05 were considered significantly enriched [30].
For heatmap visualization, the relative abundance values of selected DAMs were normalized by row and used to compare metabolite accumulation patterns between diploid and tetraploid samples.

2.7. Integrated Transcriptome–Metabolome Analysis

DEGs and DAMs were mapped to the KEGG database to identify metabolic pathways represented in both the transcriptomic and metabolomic datasets. Overlapping KEGG pathways between DEGs and DAMs were compared to identify shared metabolic categories between the two datasets [33,34]. Selected DEGs and DAMs related to cell wall-associated processes, carbohydrate metabolism, glycosylation, redox-related activities, and shared metabolic pathways were used for heatmap visualization. Carbon metabolism was selected for integrated visualization because it was detected in both transcriptomic and metabolomic KEGG enrichment results. The mapped DEGs and DAMs were compared between diploid and tetraploid leaves to provide a pathway-level overview of transcript–metabolite differences. The integrated analysis in this study was limited to the identification of shared KEGG pathways and pathway-level co-mapping of DEGs and DAMs. No gene–metabolite correlation or network analysis was performed; therefore, the results were interpreted as exploratory pathway-level associations rather than as a mechanistic regulatory network.

2.8. Statistical Analysis

Unless otherwise stated, three independently grown plants were used as three biological replicates for each ploidy group. The diploid replicates consisted of untreated in vitro-propagated plants of ‘Thompson Seedless’, whereas the tetraploid replicates consisted of clonally propagated plants derived from the confirmed autotetraploid line QW91. Each biological replicate represented one independent plant. Repeated measurements performed on leaves, stomata, or tissues collected from the same plant were treated as within-plant subsamples or technical measurements, as appropriate, and were averaged to obtain one biological replicate value. Morphological, anatomical, physiological, chlorophyll fluorescence, and RT-qPCR data are presented as the mean ± standard deviation (SD). Differences between diploid and tetraploid plants were evaluated using an independent-samples Student’s t-test, and p < 0.05 was considered statistically significant. These data were analyzed using IBM SPSS 19, and figures were generated using Origin 2021.

3. Results

3.1. Effects of Colchicine Treatment on Axillary Buds of Grape

To determine the optimal colchicine concentration and treatment duration for polyploid induction in ‘Thompson Seedless’ grape, explants were treated with different colchicine concentrations and exposure times. The results showed that colchicine treatment induced abnormal development of axillary buds (Supplementary Figure S1). Explant survival generally decreased with increasing colchicine concentration and longer exposure duration. At higher colchicine concentrations, survival declined sharply, and no explants survived after treatment with 0.3% colchicine for 72 h.
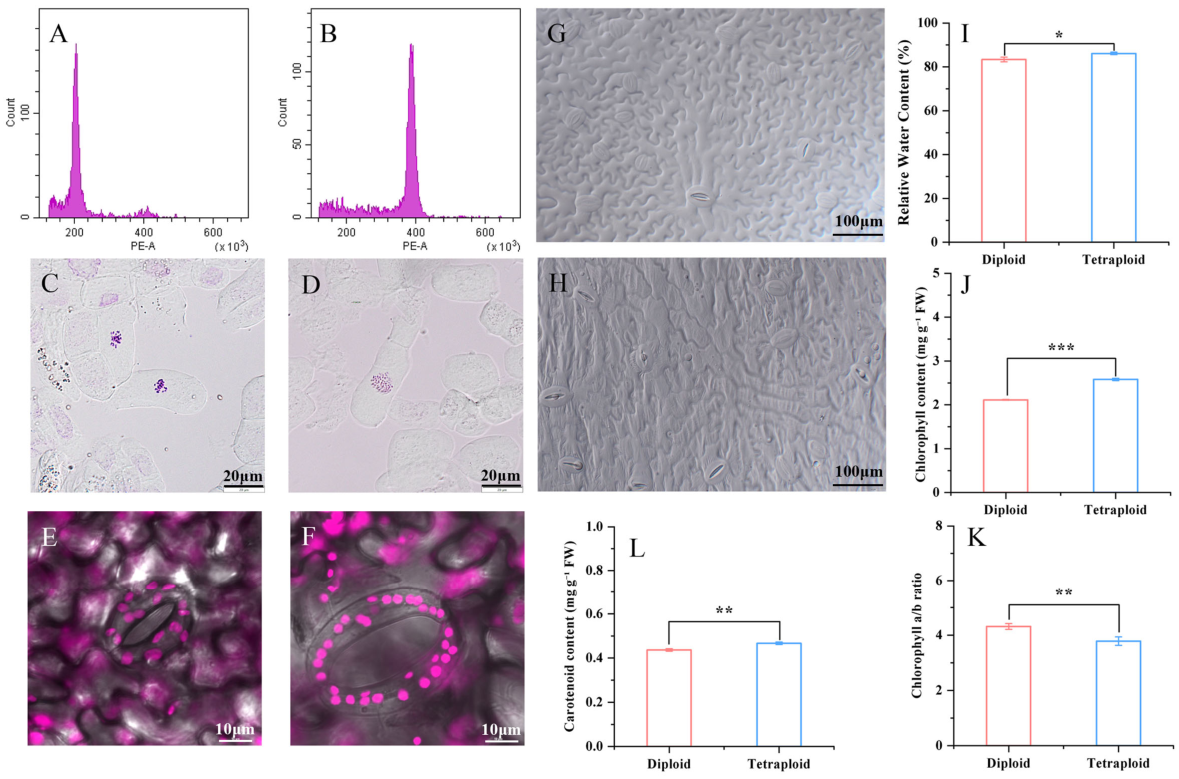
Flow cytometry analysis of leaf tissues revealed distinct ploidy patterns. Diploid plants exhibited a major fluorescence peak at approximately 200 (Figure 1A), whereas tetraploid plants showed a peak at approximately 400 (Figure 1B). Chimeric plants displayed two peaks at both 200 and 400 (Supplementary Figure S2). All axillary buds that survived colchicine treatment were individually screened by flow cytometry, and the resulting numbers of diploid, mixoploid, and putative tetraploid plants were used to calculate the induction results shown in Table 1. In total, 22 independently derived autotetraploid lines were obtained across the different treatments. The frequency of tetraploid induction varied with colchicine concentration and treatment duration. The highest tetraploid induction rate (30%) was achieved after treatment with 0.1% colchicine for 72 h (Table 1).

3.2. Determination of Ploidy Level and Analysis of Morphological Variation

To further confirm the ploidy levels of selected plants from the mutant population, somatic chromosome counting was performed to distinguish diploid and tetraploid individuals. The chromosome number of diploid plants was 2n = 2x = 38 (Figure 1C), whereas tetraploid plants exhibited 2n = 4x = 76 chromosomes (Figure 1D). To evaluate the effects of ploidy level on phenotypic variation, confirmed diploid and tetraploid plants were mass-propagated via tissue culture. Observations of mature leaves revealed pronounced differences in stomatal traits between diploid plants and autotetraploid plants. Stomatal length and width increased by 27.28% and 23.00%, respectively, representing two of the largest quantified anatomical responses (Supplementary Figure S3A,B). The number of chloroplasts per guard cell also increased by 119.44% in tetraploid leaves (Figure 1E,F; Supplementary Figure S3C).
Stomatal density per unit leaf area decreased by 30.76% in tetraploid leaves (Figure 1G,H; Supplementary Figure S3D), showing an opposite response to the increase in stomatal dimensions. Leaf relative water content increased by 3.32%, whereas total chlorophyll and carotenoid contents increased by 22.08% and 6.87% (Figure 1I,J,L). In contrast, the chlorophyll a/b ratio decreased by 12.28% (p < 0.01; Figure 1K).
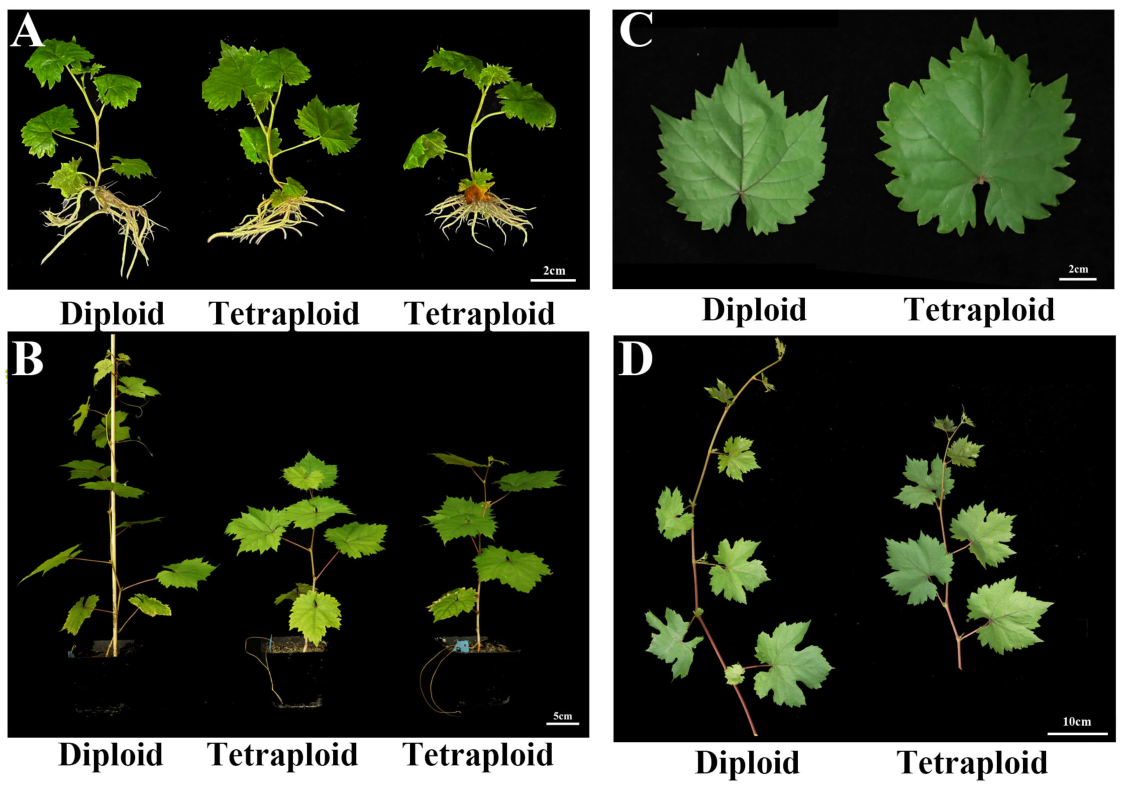
After acclimatization, the micropropagated plants were transferred to substrate cultivation to gradually adapt to field conditions. Compared with diploid plants, tetraploid plants showed a 34.30% reduction in plant height, a 8.63% increase in stem diameter, a 56.98% increase in leaf area, and a 31.98% reduction in internode length (Figure 2, Supplementary Figure S4). Among these whole-plant traits, leaf area showed the largest relative response. Thus, the most conspicuous phenotypic changes in tetraploid plants involved leaf enlargement, altered plant stature, and coordinated changes in stomatal size and density. Taken together, stomatal enlargement, reduced stomatal density, leaf enlargement, and altered plant stature represented the most conspicuous phenotypic differences between diploid plants and autotetraploid plants.

3.3. Chlorophyll Fluorescence Analysis Identified Differences in PSII-Related Characteristics Between Diploid and Tetraploid Leaves

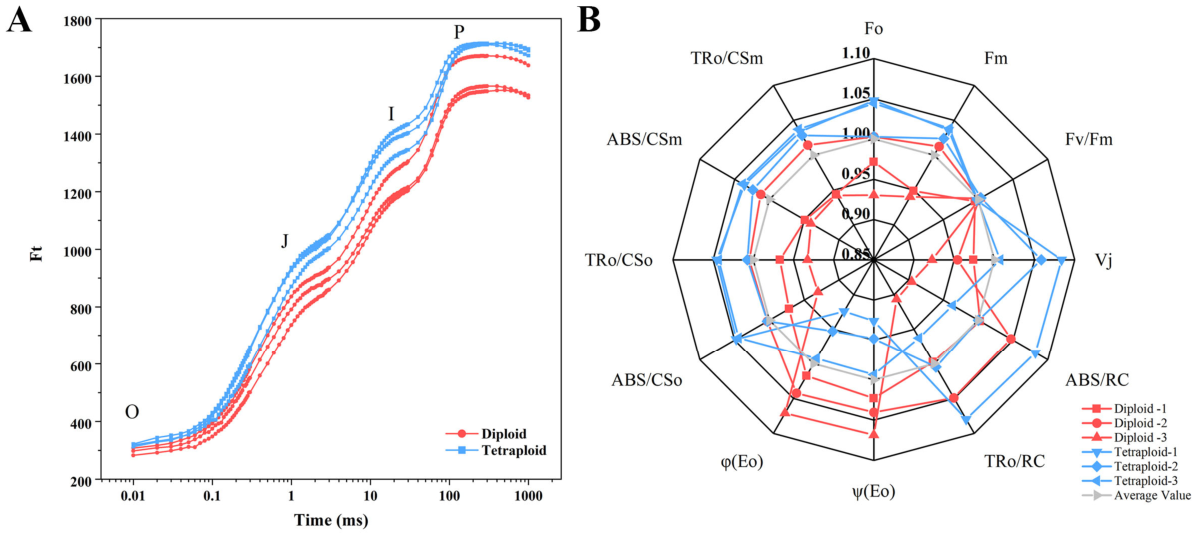
Chlorophyll fluorescence transients were recorded to compare PSII-related fluorescence characteristics between diploid and tetraploid grape leaves. Both diploid and tetraploid plants showed typical OJIP fluorescence transients. Compared with diploid leaves, tetraploid leaves exhibited higher absolute fluorescence signals throughout the OJIP curve, particularly from the J step to the P step (Figure 3A). The initial fluorescence Fo and maximum fluorescence Fm increased by 6.55% and 6.79%, respectively, in tetraploid leaves. However, Fv/Fm did not differ significantly between diploid and autotetraploid plants. Further analysis of JIP-test parameters showed that Vj was significantly higher in tetraploid leaves, while ψEo and φEo were significantly lower than those in diploid leaves. Compared with diploid leaves, Vj increased by 10.31% in tetraploid leaves, whereas ψEo and φEo decreased by 8.42% and 8.37%, respectively. At the cross-section level, ABS/CSo, TRo/CSo, ABS/CSm, and TRo/CSm showed higher mean values in tetraploid leaves, whereas parameters at the reaction-center level, including ABS/RC and TRo/RC, showed no significant differences between diploid and tetraploid leaves. In addition, PIabs was numerically lower in tetraploid leaves, although the difference was not significant (Figure 3B).
Together, these results indicate that tetraploid leaves had higher absolute fluorescence signals, higher F0 and Fm values, no significant difference in Fv/Fm, higher Vj, and lower ψEo and φEo values than diploid leaves.

3.4. Quality Assessment of Transcriptomic and Metabolomic Datasets

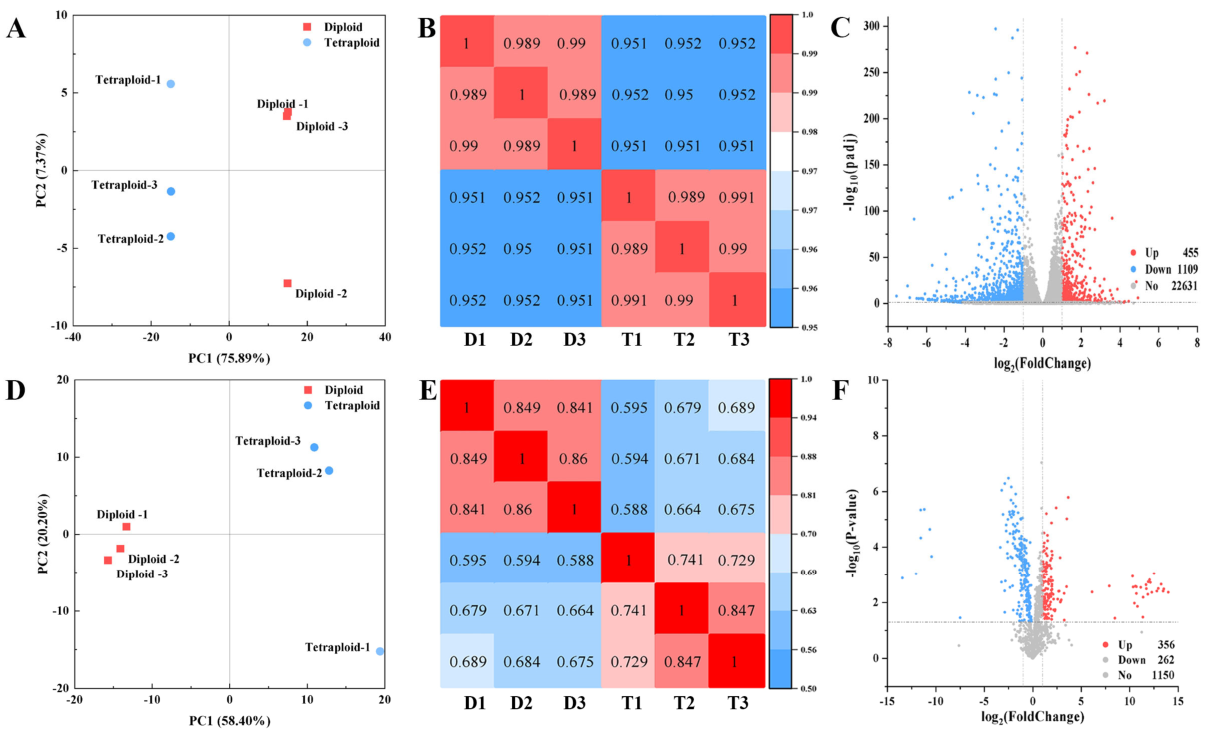
To investigate ploidy-dependent gene expression patterns, RNA sequencing (RNA-seq) was performed using fresh leaf tissues from diploid and tetraploid plants. A total of 38.15 Gb of clean data was generated from six leaf samples. The clean reads exhibited Q30 values exceeding 96.29% and GC contents higher than 45.69%, indicating high sequencing quality (Supplementary Table S3). The clean reads were mapped to the grape reference genome (v2.1), with mapping efficiencies ranging from 95.30% to 95.75% (Supplementary Table S4). To evaluate sample reliability, expression distribution, correlation among replicates, and principal component analysis (PCA) based on FPKM values were conducted. The results showed high correlations among biological replicates, and distinct gene expression patterns were observed between different ploidy levels (Figure 4A–C). In total, 22,631 genes were detected, of which 455 were up-regulated and 1109 were down-regulated in tetraploids compared with diploids. Notably, downregulated genes accounted for 70.91% of the total DEG set and were approximately 2.44-fold more numerous than upregulated genes, showing a marked predominance of genes with lower transcript abundance in tetraploid leaves. To validate the reliability and accuracy of the RNA-seq data, eight genes were randomly selected for quantitative real-time PCR (qRT-PCR) analysis. The expression trends obtained from qRT-PCR were highly consistent with those observed in the RNA-seq data (Supplementary Figure S5).
In parallel, to characterize ploidy-dependent metabolic variation, untargeted metabolomic profiling was performed using fresh leaf tissues from diploid and tetraploid plants. Six leaf samples were analyzed, and high-quality metabolomic data were obtained after data preprocessing. Principal component analysis (PCA) of the six biological samples showed an overall separation between diploid and tetraploid samples (Figure 4D). Correlation analysis further demonstrated high consistency among biological replicates. PCA and hierarchical clustering analysis (HCA) based on metabolite abundance data revealed a clear separation between diploid and tetraploid samples, indicating distinct metabolic profiles associated with different ploidy levels (Figure 4E). A total of 1150 metabolites were identified, among which 356 were up-regulated and 262 were down-regulated in tetraploids relative to diploids (Figure 4F). Collectively, these results indicate that both the transcriptomic and metabolomic datasets are of high quality and suitable for subsequent integrated analyses.

3.5. Functional Enrichment Analysis of Differentially Expressed Genes and Metabolites

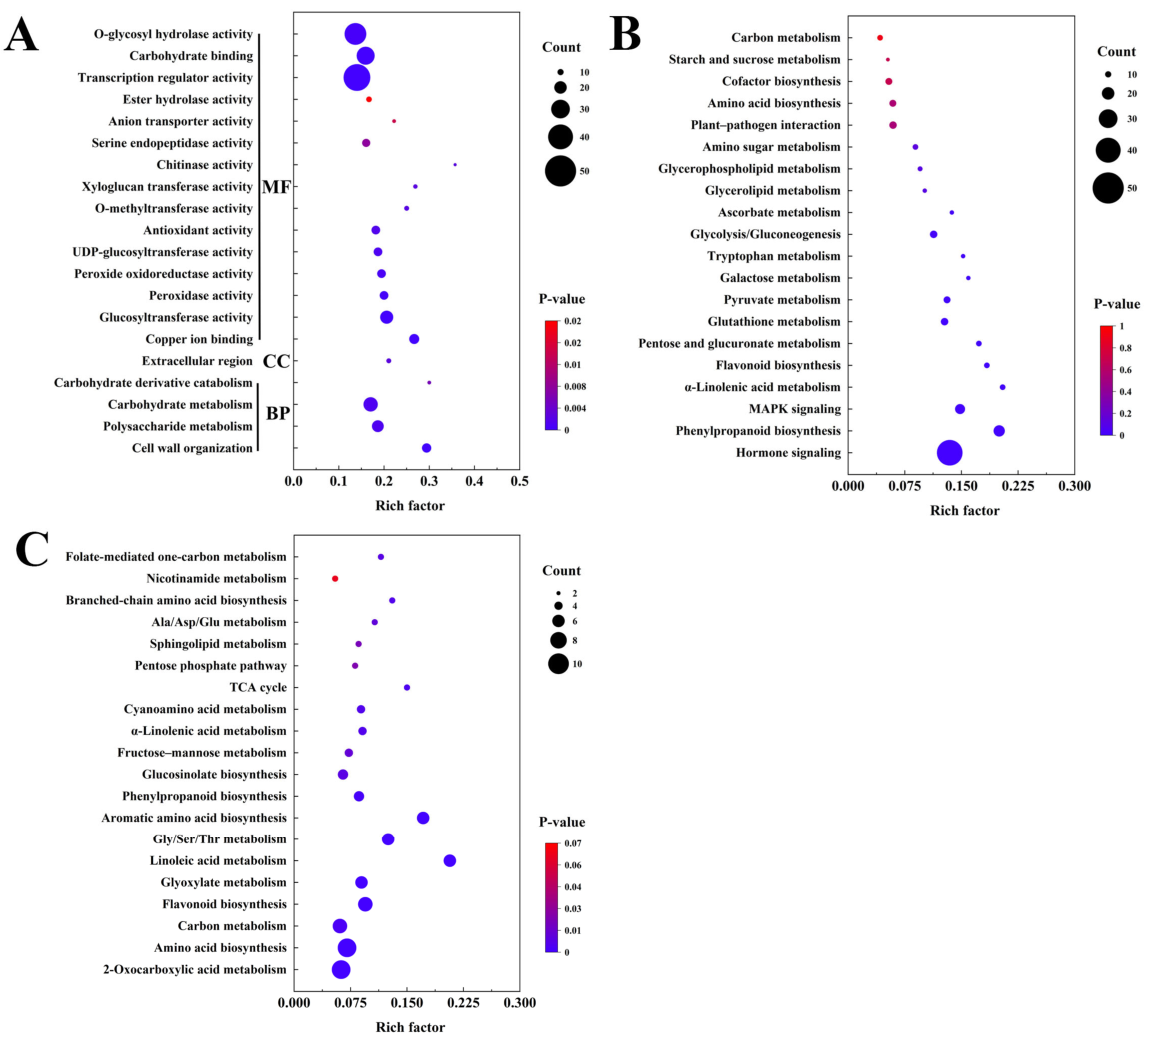
To identify functional categories statistically overrepresented among the DEGs between diploid and tetraploid plants, all differentially expressed genes were subjected to GO enrichment analysis. The enriched GO terms covered biological process, molecular function, and cellular component categories (Figure 5A). In the biological process category, DEGs were mainly enriched in terms related to cell wall organization, polysaccharide metabolism, carbohydrate metabolism, and carbohydrate derivative catabolic processes. In the molecular function category, enriched terms included carbohydrate binding, glycosyltransferase-related activities, peroxidase/antioxidant-related activities, chitinase activity, xyloglucan transferase activity, and transcription regulator activity. In the cellular component category, DEGs were enriched in the extracellular region. Together, these GO results showed that DEGs were statistically overrepresented in functional categories associated with cell wall-related processes, carbohydrate metabolism, glycosylation, and redox-related activities.
KEGG enrichment analysis of DEGs identified multiple enriched metabolic and signaling pathways (Figure 5B). The enriched pathways included carbon metabolism, starch and sucrose metabolism, cofactor biosynthesis, amino acid biosynthesis, amino sugar metabolism, glycolysis/gluconeogenesis, galactose metabolism, pyruvate metabolism, glutathione metabolism, and pentose and glucuronate interconversions. In addition, pathways related to lipid metabolism, flavonoid biosynthesis, phenylpropanoid biosynthesis, plant hormone signaling, MAPK signaling, and plant–pathogen interaction were also enriched. Together, these enrichment results showed that DEGs were overrepresented in pathways associated with primary metabolism, secondary metabolism, and signaling-related processes. At the metabolomic level, KEGG enrichment analysis identified pathways that were overrepresented among the differentially accumulated metabolites (Figure 5C). The enriched pathways included carbon metabolism, amino acid biosynthesis, 2-oxocarboxylic acid metabolism, glyoxylate metabolism, the TCA cycle, the pentose phosphate pathway, fructose and mannose metabolism, and several amino acid-related pathways. In addition, lipid metabolism, phenylpropanoid biosynthesis, flavonoid biosynthesis, and nicotinate metabolism were also represented among the enriched pathways.
Together, the GO and KEGG enrichment analyses identified statistical overrepresentation of DEGs and DAMs in categories and pathways associated with cell wall-related functions, carbohydrate metabolism, amino acid metabolism, lipid metabolism, redox-related processes, and secondary metabolism. In addition, five pathways, including phenylpropanoid biosynthesis, α-linolenic acid metabolism, flavonoid biosynthesis, amino acid biosynthesis, and carbon metabolism, were identified as enriched in both the transcriptomic and metabolomic datasets. These overlapping pathways showed that the same pathway categories contained both DEGs and DAMs, thereby identifying shared pathway-level associations between transcript abundance and metabolite accumulation. These results therefore represent pathway-level associations rather than direct functional evidence for modification of the corresponding biological processes.

3.6. Heatmap Analysis of Selected Functional DEGs and DAMs

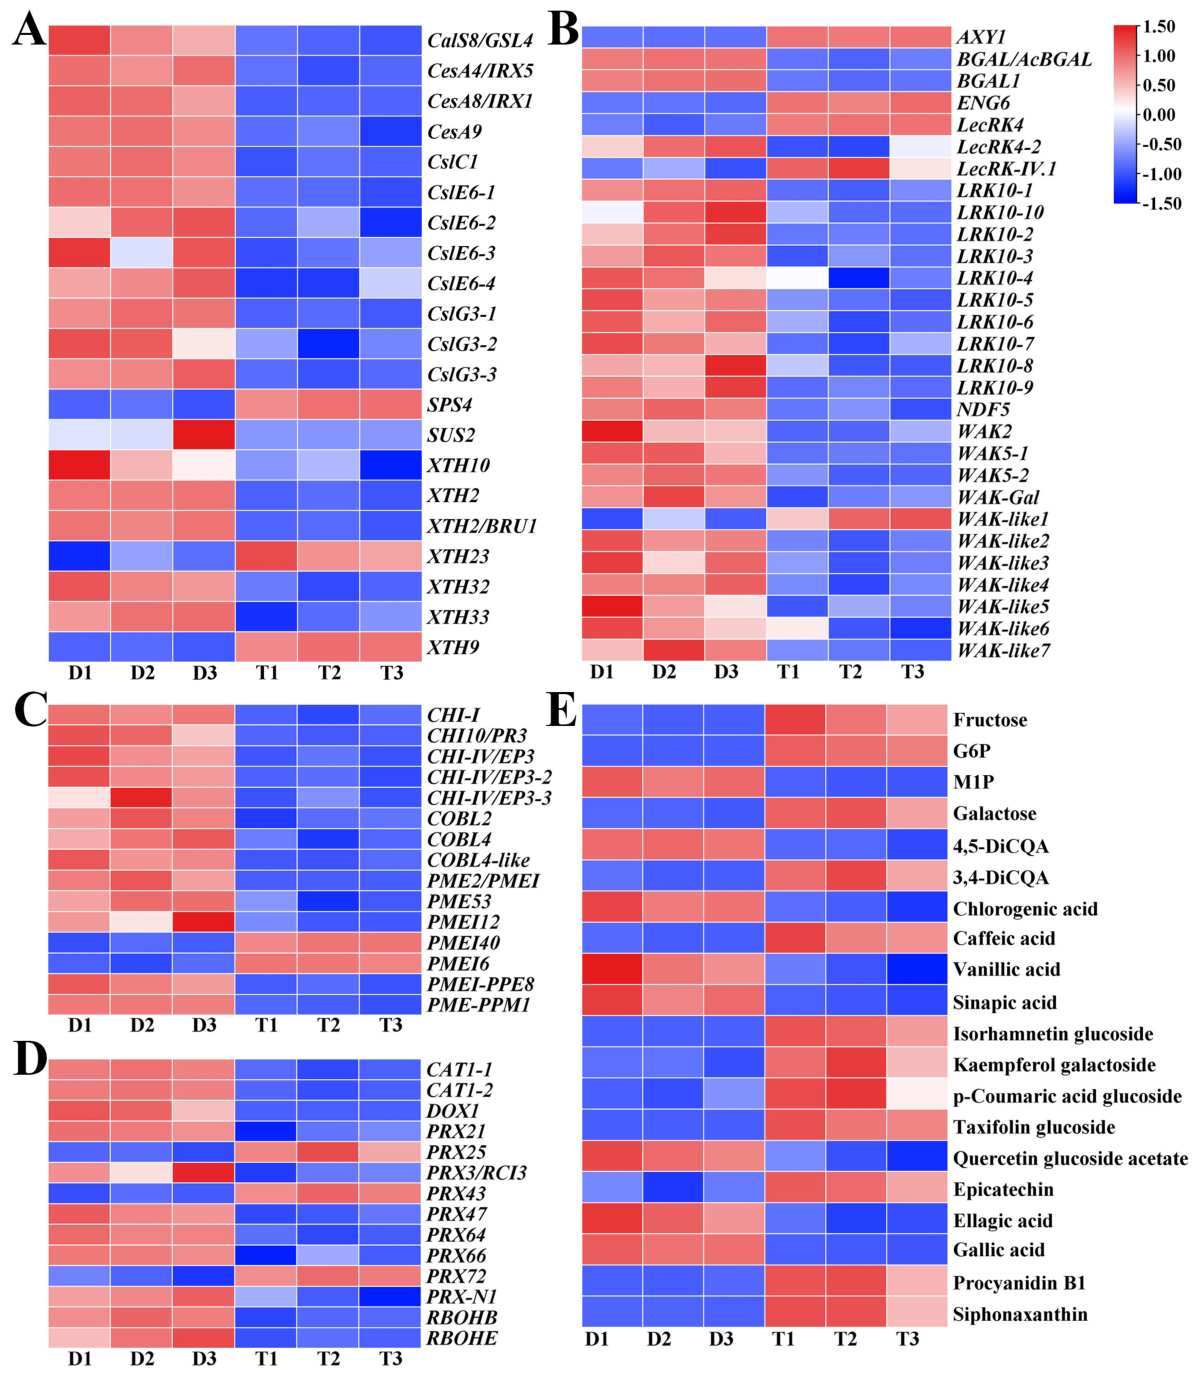
To further visualize molecular differences between diploid and tetraploid leaves, selected DEGs annotated to cell wall organization, glucosyltransferase activity, peroxidase activity, and carbohydrate binding were displayed as heatmaps (Figure 6A–D). In parallel, related DAMs representing sugars and sugar phosphates, phenolic acids, glycosylated flavonoids, antioxidant-related polyphenols, and carotenoid-related metabolites were displayed in Figure 6E. To make the principal patterns easier to follow, a small number of representative genes and metabolites showing clear and consistent differences across the three biological replicates are highlighted below, while the complete set remains presented in Figure 6.
Genes annotated to glucosyltransferase activity and cell wall polysaccharide metabolism showed distinct relative expression patterns between diploid and tetraploid leaves (Figure 6A). Among these genes, CesA4/IRX5, which encodes a cellulose synthase catalytic subunit, showed consistently lower relative expression in tetraploid leaves. In contrast, XTH23, which encodes a xyloglucan endotransglucosylase/hydrolase, showed consistently higher relative expression in tetraploid leaves. These two representative genes illustrate that DEGs within the same broad cell wall polysaccharide-associated category did not show a uniform direction of change; the complete expression patterns of the remaining genes are presented in Figure 6A.
Genes annotated to carbohydrate binding also showed clear relative expression differences between diploid and tetraploid leaves (Figure 6B). WAK5-1, a representative wall-associated receptor kinase gene, showed consistently lower relative expression in tetraploid leaves. In contrast, AXY1, annotated as an α-xylosidase-related gene, showed consistently higher relative expression in tetraploid leaves and was selected as a representative example of the opposing pattern in this panel.
Genes annotated to cell wall organization also showed distinct relative expression patterns between diploid and tetraploid leaves (Figure 6C). Among the pectin-associated genes, PME53 showed consistently lower relative expression in tetraploid leaves. In contrast, the pectin methylesterase inhibitor gene PMEI40 showed consistently higher relative expression in tetraploid leaves, providing a representative example of the opposing pattern within the pectin-associated gene set. Genes annotated to peroxidase and redox-related activities also showed different relative expression patterns between diploid and tetraploid leaves (Figure 6D). CAT1-1 was selected as a representative gene showing consistently lower relative expression in tetraploid leaves. By contrast, PRX43 showed consistently higher relative expression in tetraploid leaves and was selected as a representative peroxidase gene with the opposing expression pattern. At the metabolite level, DAMs from several chemical classes showed distinct relative accumulation patterns between diploid and tetraploid leaves (Figure 6E). Among the carbohydrate-related metabolites, fructose and glucose 6-phosphate showed consistently higher relative accumulation in tetraploid leaves, whereas mannose 1-phosphate showed lower relative accumulation. Among the phenolic acids, caffeic acid showed higher relative accumulation, whereas chlorogenic acid showed lower relative accumulation in tetraploid leaves. Isorhamnetin glucoside was selected as a representative glycosylated flavonoid showing consistently higher relative accumulation in tetraploid leaves.
Overall, the heatmaps showed differences in the relative expression of selected genes and the relative accumulation of selected metabolites annotated to cell wall remodeling, glycosylation, redox processes, and carbohydrate metabolism. Representative examples included CesA4/IRX5 and CAT1 with lower relative expression, XTH23 and PMEI40 with higher relative expression, and fructose, caffeic acid, and chlorogenic acid with distinct relative accumulation patterns in tetraploid leaves. The complete set of selected DEGs and DAMs is presented in Figure 6.

3.7. Integrated Analysis of DEGs and DAMs Mapped to Carbon Metabolism

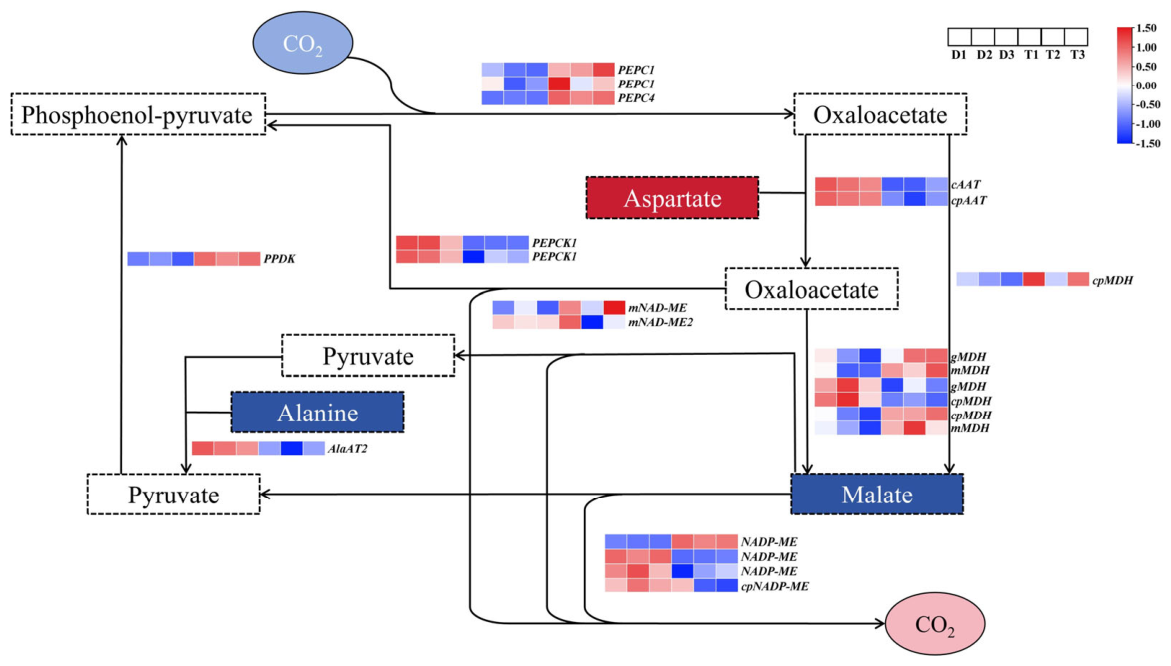
Further analysis of the KEGG enrichment results showed that carbon metabolism (vvi01200) was enriched in both the transcriptomic and metabolomic datasets (Figure 5B,C). Carbon metabolism was selected as a representative shared pathway for integrated visualization because it was enriched in both datasets and contained both mapped DEGs and DAMs (Figure 7). Its selection was intended to provide one illustrative example of pathway-level transcript–metabolite differences rather than to imply that it was the only shared pathway identified in the two datasets. The mapped genes and metabolites were distributed among reactions associated with organic acids, pyruvate, and carbon skeleton interconversion within the pathway.
In the carbon metabolism pathway, several DEGs encoding enzymes annotated to organic acid interconversion and pyruvate-related reactions showed distinct relative expression patterns between diploid and tetraploid leaves. These genes included those encoding phosphoenolpyruvate carboxylase (PEPC), malate dehydrogenase (MDH), NAD(P)-dependent malic enzyme, phosphoenolpyruvate carboxykinase (PEPCK), alanine aminotransferase (AlaAT), and aspartate aminotransferase (AAT). Most PEPC-, MDH-, and malic enzyme-related genes showed higher relative expression in tetraploid leaves, whereas PEPCK-, AlaAT-, and AAT-related genes showed lower relative expression.
At the metabolite level, several DAMs mapped to this pathway also showed different relative accumulation patterns between diploid and tetraploid leaves. Malate and alanine showed lower relative accumulation in tetraploid leaves, whereas aspartate showed higher relative accumulation. These results showed differences between diploid and tetraploid leaves in the relative transcript abundance of carbon metabolism-associated genes and the relative accumulation of mapped metabolites. Overall, this integrated analysis provides a pathway-level overview of differences in transcript abundance and metabolite accumulation between diploid and tetraploid grape leaves. The integrated pathway map represents relative transcript and metabolite differences and should not be interpreted as a direct measurement of carbon flux.

4. Discussion

Polyploidization is well known to induce changes in plant anatomy, cell size, and organ morphology through genome dosage effects and changes in cellular organization [35,36]. Colchicine-induced polyploidy has been widely used in plant breeding because colchicine disrupts microtubule formation during cell division, thereby inducing chromosome doubling. However, the efficiency of polyploid induction is affected by colchicine concentration, exposure duration, explant type, and genotype [37,38]. In the present study, colchicine treatment successfully induced autotetraploid plants from axillary buds of ‘Thompson Seedless’, and the highest tetraploid induction rate was obtained after treatment with 0.1% colchicine for 72 h. The decrease in survival rate under higher colchicine concentrations and/or prolonged exposure indicates that a suitable balance between induction efficiency and explant viability is required for grapevine polyploid induction.
Polyploid-associated morphological changes have been widely documented in horticultural crops, including grapevine, apple, and watermelon. These changes commonly include enlarged leaves, larger stomata, reduced stomatal density, thicker or more compact organs, and altered plant growth patterns. In this study, colchicine-induced autotetraploid grapevines exhibited enlarged leaves, shortened internodes, increased stem diameter, increased chloroplast number in guard cells, larger stomata, and reduced stomatal density. These traits are consistent with previous reports in grapevine and other polyploid crops [6,39,40,41]. Tetraploid leaves also exhibited higher relative water content, total chlorophyll content, and carotenoid content, whereas the chlorophyll a/b ratio was reduced. The increase in pigment content may be related to changes in chloroplast number or leaf anatomical characteristics after chromosome doubling. However, pigment accumulation alone should not be interpreted as direct evidence of enhanced photosynthetic capacity. Instead, these changes indicate that genome doubling altered leaf physiological traits and pigment composition, which may contribute to the distinct appearance and functional status of tetraploid leaves.
Chlorophyll fluorescence is widely used as a non-destructive method to evaluate the functional status of the photosynthetic apparatus, especially PSII. The OJIP fluorescence transient and JIP-test parameters provide information on energy absorption, excitation trapping, electron transport, and energy dissipation in PSII [42,43,44]. These parameters have been widely applied to detect changes in photosynthetic electron transport under different physiological conditions. In polyploid plants, chlorophyll fluorescence analysis has also been used to compare photosystem responses between different ploidy levels [45]. Because pigment content and chloroplast-related traits differed between diploid and tetraploid leaves, chlorophyll fluorescence analysis was further used to compare their PSII-related fluorescence characteristics. In the present study, chlorophyll fluorescence analysis identified differences in PSII-related fluorescence characteristics between diploid and tetraploid grape leaves. Tetraploid leaves displayed higher absolute OJIP fluorescence signals, whereas Fv/Fm did not differ significantly between diploid and tetraploid leaves. In contrast, Vj increased and both ψEo and φEo decreased in tetraploid leaves. Because Vj is related to the relative accumulation of reduced QA, whereas ψEo and φEo reflect electron transport probability and quantum yield beyond QA, the observed changes are consistent with differences in electron transport-related behavior beyond QA. However, these fluorescence parameters alone do not establish the underlying mechanism. Thus, the fluorescence measurements showed differences in PSII-related behavior between diploid and tetraploid leaves without a significant difference in Fv/Fm. These measurements do not directly quantify overall photosynthetic performance or photosynthetic carbon assimilation. Transcriptomic and metabolomic analyses revealed broad molecular differences between diploid and tetraploid leaves. Integrated transcriptomic and metabolomic approaches are useful for linking gene expression changes with metabolite accumulation patterns and for identifying functional pathways associated with plant phenotypic variation [33,46]. In the present study, GO and KEGG enrichment analysis showed that DEGs were statistically overrepresented in functional categories and pathways associated with cell wall-related processes, carbohydrate metabolism, glycosylation, redox-related activities, and secondary metabolism. At the metabolite level, KEGG enrichment analysis showed that DAMs were statistically overrepresented in pathways associated with carbon metabolism, amino acid biosynthesis, phenylpropanoid biosynthesis, flavonoid biosynthesis, and α-linolenic acid metabolism. In addition, α-linolenic acid metabolism is closely related to oxylipin and jasmonate biosynthesis, which participate in plant growth and stress-related signaling processes [47]. Phenylpropanoid biosynthesis, α-linolenic acid metabolism, flavonoid biosynthesis, amino acid biosynthesis, and carbon metabolism were identified as enriched in both the transcriptomic and metabolomic datasets, indicating pathway-level overlap between the DEGs and DAMs. This overlap provides a basis for biological interpretation but does not by itself demonstrate functional modification of the corresponding pathways. Accordingly, these enrichment results should be interpreted as statistically supported pathway-level clues rather than functional validation of the corresponding biological processes or direct evidence for specific metabolic flux changes.
Among the enriched functional categories, cell wall- and carbohydrate-associated terms were statistically overrepresented among the DEGs and may be relevant to the observed differences in leaf morphology and stomatal characteristics. In tetraploid leaves, genes annotated to cellulose and hemicellulose synthesis or modification, pectin modification, glycoside hydrolysis, COBRA-like proteins, and wall-associated receptor kinases showed differential expression patterns. Previous studies have implicated these gene groups in cell wall biosynthesis, modification, and sensing, as well as in cell expansion and plant morphogenesis [48,49,50]. The coordinated expression differences observed here are therefore consistent with the possibility of altered cell wall-associated regulation, but they do not demonstrate that cell wall remodeling occurred. In addition, peroxidase- and redox-related genes, including CAT, RBOH, DOX, and PRX family members, also showed differential expression. Class III peroxidases have been implicated in cell wall modification and lignification, while ROS-related enzymes participate in redox signaling during plant growth and stress responses [51,52]. Accordingly, these transcriptional patterns provide hypotheses for further investigation of the molecular basis of the enlarged leaves, altered stomatal traits, and shortened internodes observed in tetraploid grapevines. However, cell wall composition, structure, and mechanical properties, as well as ROS levels, were not directly measured in this study. Therefore, the observed transcriptional patterns should be interpreted as expression-level evidence rather than direct functional confirmation of cell wall remodeling or redox changes.
At the metabolite level, sugars and sugar phosphates, phenolic acids, glycosylated flavonoids, antioxidant-related polyphenols, and carotenoid-related metabolites showed different relative accumulation patterns between diploid and tetraploid leaves. These metabolites were associated with carbohydrate metabolism, phenylpropanoid and flavonoid metabolism, glycosylation, and redox-related processes based on their pathway annotations. Previous studies have shown that phenylpropanoid and flavonoid pathways produce diverse phenolic compounds that participate in plant development and environmental responses, whereas glycosyltransferases can modify the stability, solubility, transport, and biological activity of small molecules [53,54,55]. Together with the transcriptomic results, these metabolite patterns identify pathway-level associations involving cell wall-associated processes, carbohydrate metabolism, secondary metabolism, and redox-related functions in grape leaves. However, differences in metabolite accumulation alone do not establish whether the activity of the corresponding metabolic pathways increased or decreased. Because enzyme activities and metabolic fluxes were not measured, the possible links between these metabolite patterns and physiological differences should be regarded as hypotheses requiring further validation.
The integrated analysis of DEGs and DAMs mapped to carbon metabolism showed differences in the relative transcript abundance and metabolite accumulation of pathway components associated with organic acids, pyruvate-related reactions, and carbon skeleton interconversion between diploid and tetraploid leaves. Genes encoding PEPC, MDH, and NAD(P)-dependent malic enzyme showed higher relative expression in tetraploid leaves, whereas PEPCK-, AlaAT-, and AAT-related genes showed lower relative expression. PEPC is a widely distributed and highly regulated enzyme in plants, whereas malic enzymes participate in malate metabolism and links organic acid metabolism with pyruvate-related reactions and cellular redox balance [56,57]. At the metabolite level, malate and alanine showed lower relative accumulation in tetraploid leaves, whereas aspartate was numerically higher. Organic acids such as malate and aspartate are important intermediates linking carbon metabolism, amino acid metabolism, and redox balance in plants [58,59]. Together, these transcript and metabolite patterns are consistent with possible differences in organic acid- and carbon skeleton-associated metabolism between diploid and tetraploid leaves. Nevertheless, the present data did not directly measure photosynthetic carbon assimilation, carbon allocation, enzyme activities, or metabolic fluxes. Therefore, the carbon metabolism pathway should be interpreted as a pathway-level overview of differences in transcript abundance and metabolite accumulation rather than evidence for altered carbon allocation or a specific carbon flux model.
Overall, tetraploid plants of ‘Thompson Seedless’ exhibited typical polyploid-associated morphological and anatomical traits, differences in pigment composition and PSII-related fluorescence characteristics, and broad differences in transcript abundance and metabolite accumulation compared with diploid plants. The combined transcriptomic and metabolomic results identified DEGs and DAMs associated with cell wall-related functions, carbohydrate metabolism, glycosylation, redox-related activities, secondary metabolism, and carbon metabolism. These findings provide molecular clues for understanding leaf trait variation in autotetraploid grapevine and offer useful information for the development and evaluation of polyploid germplasm. An important limitation of this study is that all downstream comparisons were conducted within a single grapevine cultivar, ‘Thompson Seedless’, using untreated diploid plants and clonally propagated plants derived from one independently induced autotetraploid line. Thus, the three tetraploid biological replicates represented independently grown clonal plants rather than independent chromosome-doubling events. Although this design enabled comparisons within a common cultivar background, it did not capture the biological variation that may occur among independently induced autotetraploid lines or different grapevine cultivars. Consequently, some of the phenotypic, transcriptomic, and metabolomic differences observed in this study may be specific to the cultivar or induced line examined and should not yet be generalized to autotetraploid grapevines as a whole.
The expression and stability of vegetative traits may also depend on the cultivation environment and its interaction with the plant genotype. Multisite evaluations of saffron, a clonally propagated high-value horticultural crop, have shown that accession or ecotype, cultivation location, and their interactions can influence vegetative growth and productivity [60,61]. These findings emphasize that the relative performance of a particular genotype may vary across cultivation environments. Because the present study evaluated one induced autotetraploid line under a single controlled cultivation regime and at one developmental stage, it remains unknown whether the observed leaf enlargement, reduced plant height, shortened internodes, increased stem diameter, and altered stomatal traits would remain stable under different greenhouse or field environments. Therefore, these vegetative differences should be interpreted within the specific genotype and cultivation conditions examined in this study.
A further limitation is that the diploid controls were untreated in vitro-propagated plants rather than mock-treated regenerants or colchicine-exposed plants that remained diploid. Although both ploidy groups shared the same cultivar and an in vitro propagation background, the present design does not fully separate ploidy-associated differences from possible effects of colchicine exposure, treatment history, or somaclonal variation. Therefore, the observed differences should be interpreted as comparisons between the selected untreated diploid material and the induced tetraploid line rather than as effects caused exclusively by genome doubling. In addition, the integrated transcriptomic and metabolomic analysis performed in this study was exploratory and did not provide direct functional validation of the candidate genes, enzymes, or biological pathways identified. Although RT-qPCR confirmed the expression patterns of selected genes, it did not test their biological functions. Therefore, the proposed links between the observed molecular patterns and the phenotypic or physiological differences should be regarded as working hypotheses rather than demonstrated mechanisms.
Further studies incorporating multiple independently induced autotetraploid lines and additional grapevine cultivars, together with multi-environment greenhouse and field trials, cell wall composition analysis, enzyme activity assays, metabolic flux measurements, ROS detection, and long-term field evaluation, will be needed to determine the stability of the observed vegetative traits, genotype-by-environment interactions, and the functional consequences of these molecular associations identified here.

5. Conclusions

In this study, autotetraploid plants of Vitis vinifera ‘Thompson Seedless’ were successfully generated through colchicine treatment and confirmed by flow cytometry and chromosome counting. Compared with diploid plants, tetraploid plants showed typical polyploid-associated traits, including enlarged leaves, shortened internodes, increased stem diameter, larger stomata with lower density, increased chloroplast numbers in guard cells, and differences in pigment contents. Chlorophyll fluorescence analysis identified differences between diploid and tetraploid leaves, including higher absolute OJIP fluorescence signals, stable Fv/Fm, higher Vj, and lower ψEo and φEo values in tetraploid leaves. Integrated transcriptomic and metabolomic analyses identified broad differences in gene expression and metabolite accumulation between diploid and tetraploid leaves. GO and KEGG enrichment analyses identified functional categories and pathways in which DEGs and/or DAMs were statistically overrepresented, including those associated with cell wall-related processes, carbohydrate-associated metabolism, glycosylation, redox-related processes, secondary metabolism, and carbon metabolism. The integrated carbon metabolism analysis summarized differences in relative transcript abundance and metabolite accumulation but did not directly assess carbon allocation or metabolic flux. Because this study was conducted using a single induced autotetraploid line derived from one grapevine cultivar, some of the observed responses may be cultivar- or line-specific and should not yet be generalized to autotetraploid grapevines as a whole. These findings provide molecular clues and pathway-level associations for understanding leaf trait variation in tetraploid grapevine and may support the future evaluation and utilization of polyploid grape germplasm. However, these associations should not be interpreted as functional evidence that cell wall-related or carbon metabolism related processes mechanistically caused the observed phenotypic differences. Future studies should determine whether the transcriptomic and metabolomic patterns observed here persist at later developmental stages, whether similar responses occur in independently induced autotetraploid lines and other grapevine cultivars, and whether the proposed molecular associations can be confirmed through physiological, biochemical, and targeted functional analyses.

Supplementary Materials

The following supporting information can be downloaded at: https://www.mdpi.com/article/10.3390/horticulturae12080992/s1, Supplementary Table S1. Definitions and explanations of selected JIP-test parameters used in the present study. Supplementary Table S2. The information of qRT-PCR primer sequences. Supplementary Table S3. Summary of RNA-seq Data Quality and Sequencing Metrics for Diploid and Tetraploid Grape Leaf Samples. Supplementary Table S4. Summary of RNA-seq Read Mapping Statistics for Diploid and Tetraploid Grape Leaf Samples. Supplementary Figure S1. Phenotypic images of plants treated with colchicine. Supplementary Figure S2. Flow cytometric peak pattern of grape chimeric plants. Supplementary Figure S3. Analysis of stomatal morphology, stomatal density, and chloroplast number in guard cells of diploid and tetraploid grape plants. Supplementary Figure S4. Comparison of growth traits between diploid and tetraploid plants. Supplementary Figure S5. Comparative Analysis of RNA-seq and qRT-PCR expression patterns for eight selected genes in Diploid and Tetraploid Grape Leaves.

Author Contributions

C.M. and H.L. conceived this experiment and designed this study. Y.T.: Investigation, Data curation, Writing—original draft. L.Z., Y.X., J.L., and D.F. analyzed the data. S.S., Y.S., Z.Z., L.W., Y.L. and Y.M., contributed reagents. M.H., J.H., X.L. and C.D. revised the manuscript. All authors advised on the manuscript. All authors have read and agreed to the published version of the manuscript.

Funding

This research received funding from the National Natural Science Foundation of China (Grant No. 32372673), the Shanghai Agricultural Science and Technology Innovation Program (Grant No. K2023017, T2023208), the Xingdian Talent Support Plan of Yunnan Province Yunling Scholar Program (Certificate No. XDYC-YLXZ-2023-0018) and the earmarked fund for CARS-29.

Data Availability Statement

All data underlying the findings described in this study are available from the corresponding author upon request. The materials used in the research are also available upon reasonable request.

Conflicts of Interest

The authors declare no conflict of interest.

References

  1. Ramsey, J.; Schemske, D.W. Pathways, mechanisms, and rates of polyploid formation in flowering plants. Annu. Rev. Ecol. Syst. 1998, 29, 467–501. [Google Scholar] [CrossRef]
  2. Soltis, P.S.; Soltis, D.E. The role of genetic and genomic attributes in the success of polyploids. Proc. Natl. Acad. Sci. USA 2000, 97, 7051–7057. [Google Scholar] [CrossRef] [PubMed]
  3. Otto, S.P. The evolutionary consequences of polyploidy. Cell 2007, 131, 452–462. [Google Scholar] [CrossRef] [PubMed]
  4. Shariatpanahi, M.E.; Niazian, M.; Ahmadi, B. Methods for chromosome doubling. In Doubled Haploid Technology: Volume 1: General Topics, Alliaceae, Cereals; Springer: Berlin/Heidelberg, Germany, 2021; pp. 127–148. [Google Scholar]
  5. Notsuka, K.; Tsuru, T.; Shiraishi, M. Induced polyploid grapes via in vitro chromosome doubling. J. Jpn. Soc. Hortic. Sci. 2000, 69, 543–551. [Google Scholar] [CrossRef]
  6. Motosugi, H.; Okudo, K.; Kataoka, D.; Naruo, T. Comparison of growth characteristics between diploid and colchicine-induced tetraploid grape rootstocks. J. Jpn. Soc. Hortic. Sci. 2002, 71, 335–341. [Google Scholar] [CrossRef]
  7. Masterson, J. Stomatal size in fossil plants: Evidence for polyploidy in majority of angiosperms. Science 1994, 264, 421–424. [Google Scholar] [CrossRef] [PubMed]
  8. Blatt, M.R.; Jezek, M.; Lew, V.L.; Hills, A. What can mechanistic models tell us about guard cells, photosynthesis, and water use efficiency? Trends Plant Sci. 2022, 27, 166–179. [Google Scholar] [CrossRef] [PubMed]
  9. Gerrath, J.; Posluszny, U.; Melville, L. Humans and grapes. In Taming the Wild Grape: Botany and Horticulture in the Vitaceae; Springer: Berlin/Heidelberg, Germany, 2015; pp. 103–114. [Google Scholar]
  10. Yang, X.M.; Cao, Z.Y.; An, L.Z.; Wang, Y.M.; Fang, X.W. In vitro tetraploid induction via colchicine treatment from diploid somatic embryos in grapevine (Vitis vinifera L.). Euphytica 2006, 152, 217–224. [Google Scholar] [CrossRef]
  11. Sinski, I.; Dal Bosco, D.; Pierozzi, N.I.; Maia, J.D.G.; Ritschel, P.S.; Quecini, V. Improving in vitro induction of autopolyploidy in grapevine seedless cultivars. Euphytica 2014, 196, 299–311. [Google Scholar]
  12. Catalano, C.; Abbate, L.; Motisi, A.; Crucitti, D.; Cangelosi, V.; Pisciotta, A.; Di Lorenzo, R.; Carimi, F.; Carra, A. Autotetraploid emergence via somatic embryogenesis in Vitis vinifera induces marked morphological changes in shoots, mature leaves, and stomata. Cells 2021, 10, 1336. [Google Scholar] [CrossRef] [PubMed]
  13. Ma, X.; Dong, Z.; Zhao, Q.; Li, X.; Tan, W.; Tang, X.; Chen, J. A series of Polyploid grape cultivars and their structural identification of ploidy character. In Proceedings of the XI International Conference on Grapevine Breeding and Genetics; Acta Horticulturae: Leuven, Belgium, 2014; Volume 1082, pp. 63–68. [Google Scholar]
  14. Fasano, C.; Diretto, G.; Aversano, R.; D’Agostino, N.; Di Matteo, A.; Frusciante, L.; Giuliano, G.; Carputo, D. Transcriptome and metabolome of synthetic Solanum autotetraploids reveal key genomic stress events following polyploidization. New Phytol. 2016, 210, 1382–1394. [Google Scholar] [CrossRef] [PubMed]
  15. Corneillie, S.; De Storme, N.; Van Acker, R.; Fangel, J.U.; De Bruyne, M.; De Rycke, R.; Geelen, D.; Willats, W.G.T.; Vanholme, B.; Boerjan, W. Polyploidy Affects Plant Growth and Alters Cell Wall Composition. Plant Physiol. 2019, 179, 74–87. [Google Scholar] [CrossRef] [PubMed]
  16. Zhang, Z.; Tan, M.; Zhang, Y.; Jia, Y.; Zhu, S.; Wang, J.; Zhao, J.; Liao, Y.; Xiang, Z. Integrative analyses of targeted metabolome and transcriptome of Isatidis Radix autotetraploids highlighted key polyploidization-responsive regulators. BMC Genom. 2021, 22, 670. [Google Scholar] [CrossRef] [PubMed]
  17. Xian, L.; Tian, J.; Long, Y.; Ma, H.; Tian, M.; Liu, X.; Yin, G.; Wang, L. Metabolomics and transcriptomics analyses provide new insights into the nutritional quality during the endosperm development of different ploidy rice. Front. Plant Sci. 2023, 14, 1210134. [Google Scholar] [CrossRef] [PubMed]
  18. Song, Q.; Chen, Z.J. Epigenetic and developmental regulation in plant polyploids. Curr. Opin. Plant Biol. 2015, 24, 101–109. [Google Scholar] [CrossRef] [PubMed]
  19. Barker, M.S.; Arrigo, N.; Baniaga, A.E.; Li, Z.; Levin, D.A. On the relative abundance of autopolyploids and allopolyploids. New Phytol. 2016, 210, 391–398. [Google Scholar] [PubMed]
  20. Van de Peer, Y.; Mizrachi, E.; Marchal, K. The evolutionary significance of polyploidy. Nat. Rev. Genet. 2017, 18, 411–424. [Google Scholar] [CrossRef] [PubMed]
  21. Harun, A.; Fang, Z.; Chen, C. The contributions of cytogenetics, genetics, and epigenetics to the stability of plants polyploidy. Discov. Plants 2024, 1, 11. [Google Scholar] [CrossRef]
  22. Pellicer, J.; Powell, R.F.; Leitch, I.J. The application of flow cytometry for estimating genome size, ploidy level endopolyploidy, and reproductive modes in plants. In Molecular Plant Taxonomy: Methods and Protocols; Springer: Berlin/Heidelberg, Germany, 2020; pp. 325–361. [Google Scholar]
  23. Pierozzi, N.I.; Moura, M.F. Karyotype analysis in grapevines. Rev. Bras. Frutic. 2016, 38, 213–221. [Google Scholar] [CrossRef]
  24. Barrs, H.; Weatherley, P. A re-examination of the relative turgidity technique for estimating water deficits in leaves. Aust. J. Biol. Sci. 1962, 15, 413–428. [Google Scholar] [CrossRef]
  25. Lichtenthaler, H.K.; Wellburn, A.R. Determinations of total carotenoids and chlorophylls a and b of leaf extracts in different solvents. Biochem. Soc. Trans. 1983, 11, 591–592. [Google Scholar] [CrossRef]
  26. Stirbet, A. On the relation between the Kautsky effect (chlorophyll a fluorescence induction) and photosystem II: Basics and applications of the OJIP fluorescence transient. J. Photochem. Photobiol. B Biol. 2011, 104, 236–257. [Google Scholar] [CrossRef] [PubMed]
  27. Wu, S.; Zhao, B. Using clear nail polish to make Arabidopsis epidermal impressions for measuring the change of stomatal aperture size in immune response. In Plant Pattern Recognition Receptors: Methods and Protocols; Springer: Berlin/Heidelberg, Germany, 2017; pp. 243–248. [Google Scholar]
  28. Fujiwara, M.T.; Sanjaya, A.; Itoh, R.D. Arabidopsis thaliana leaf epidermal guard cells: A model for studying chloroplast proliferation and partitioning in plants. Front. Plant Sci. 2019, 10, 1403. [Google Scholar] [CrossRef] [PubMed]
  29. Livak, K.J.; Schmittgen, T.D. Analysis of relative gene expression data using real-time quantitative PCR and the 2(-Delta Delta C(T)) Method. Methods 2001, 25, 402–408. [Google Scholar] [CrossRef] [PubMed]
  30. Kanehisa, M.; Goto, S. KEGG: Kyoto encyclopedia of genes and genomes. Nucleic Acids Res. 2000, 28, 27–30. [Google Scholar] [CrossRef] [PubMed]
  31. Sawada, Y.; Akiyama, K.; Sakata, A.; Kuwahara, A.; Otsuki, H.; Sakurai, T.; Saito, K.; Hirai, M.Y. Widely targeted metabolomics based on large-scale MS/MS data for elucidating metabolite accumulation patterns in plants. Plant Cell Physiol. 2009, 50, 37–47. [Google Scholar] [CrossRef] [PubMed]
  32. Chen, W.; Gong, L.; Guo, Z.; Wang, W.; Zhang, H.; Liu, X.; Yu, S.; Xiong, L.; Luo, J. A novel integrated method for large-scale detection, identification, and quantification of widely targeted metabolites: Application in the study of rice metabolomics. Mol. Plant 2013, 6, 1769–1780. [Google Scholar] [CrossRef] [PubMed]
  33. Tohge, T.; Fernie, A.R. Combining genetic diversity, informatics and metabolomics to facilitate annotation of plant gene function. Nat. Protoc. 2010, 5, 1210–1227. [Google Scholar] [CrossRef] [PubMed]
  34. Chong, J.; Xia, J. Using MetaboAnalyst 4.0 for Metabolomics Data Analysis, Interpretation, and Integration with Other Omics Data. Methods Mol. Biol. 2020, 2104, 337–360. [Google Scholar] [CrossRef] [PubMed]
  35. Fox, D.T.; Soltis, D.E.; Soltis, P.S.; Ashman, T.-L.; Van de Peer, Y. Polyploidy: A biological force from cells to ecosystems. Trends Cell Biol. 2020, 30, 688–694. [Google Scholar] [CrossRef] [PubMed]
  36. Bomblies, K. When everything changes at once: Finding a new normal after genome duplication. Proc. R. Soc. B 2020, 287, 20202154. [Google Scholar] [CrossRef] [PubMed]
  37. Dhooghe, E.; Van Laere, K.; Eeckhaut, T.; Leus, L.; Van Huylenbroeck, J. Mitotic chromosome doubling of plant tissues in vitro. Plant Cell Tissue Organ Cult. (PCTOC) 2011, 104, 359–373. [Google Scholar] [CrossRef]
  38. Eng, W.-H.; Ho, W.-S. Polyploidization using colchicine in horticultural plants: A review. Sci. Hortic. 2019, 246, 604–617. [Google Scholar] [CrossRef]
  39. Kara, Z. Induction of polyploidy in grapevine (Vitis vinifera L.) seedlings by in vivo colchicineapplications. Turk. J. Agric. For. 2022, 46, 152–159. [Google Scholar] [CrossRef]
  40. Wójcik, D.; Marat, M.; Marasek-Ciołakowska, A.; Klamkowski, K.; Buler, Z.; Podwyszyńska, M.; Tomczyk, P.P.; Wójcik, K.; Treder, W.; Filipczak, J. Apple autotetraploids—Phenotypic characterisation and response to drought stress. Agronomy 2022, 12, 161. [Google Scholar] [CrossRef]
  41. Feng, Z.; Bi, Z.; Fu, D.; Feng, L.; Min, D.; Bi, C.; Huang, H. A comparative study of morphology, photosynthetic physiology, and proteome between diploid and tetraploid watermelon (Citrullus lanatus L.). Bioengineering 2022, 9, 746. [Google Scholar] [CrossRef] [PubMed]
  42. Strasser, R.J.; Tsimilli-Michael, M.; Srivastava, A. Analysis of the chlorophyll a fluorescence transient. In Chlorophyll a Fluorescence: A Signature of Photosynthesis; Springer: Berlin/Heidelberg, Germany, 2004; pp. 321–362. [Google Scholar]
  43. Tsimilli-Michael, M. Revisiting JIP-test: An educative review on concepts, assumptions, approximations, definitions and terminology. Photosynthetica 2020, 58, 275–292. [Google Scholar] [CrossRef]
  44. Stirbet, A.; Lazár, D.; Kromdijk, J.; Govindjee. Chlorophyll a fluorescence induction: Can just a one-second measurement be used to quantify abiotic stress responses? Photosynthetica 2018, 56, 86–104. [Google Scholar] [CrossRef]
  45. Yan, K.; Wu, C.; Zhang, L.; Chen, X. Contrasting photosynthesis and photoinhibition in tetraploid and its autodiploid honeysuckle (Lonicera japonica Thunb.) under salt stress. Front. Plant Sci. 2015, 6, 227. [Google Scholar] [CrossRef] [PubMed]
  46. Fiehn, O. Metabolomics–the link between genotypes and phenotypes. Plant Mol. Biol. 2002, 48, 155–171. [Google Scholar] [CrossRef]
  47. Wasternack, C.; Feussner, I. The oxylipin pathways: Biochemistry and function. Annu. Rev. Plant Biol. 2018, 69, 363–386. [Google Scholar] [CrossRef] [PubMed]
  48. Cosgrove, D.J. Structure and growth of plant cell walls. Nat. Rev. Mol. Cell Biol. 2024, 25, 340–358. [Google Scholar] [CrossRef] [PubMed]
  49. Qiu, D.; Xu, S.; Wang, Y.; Zhou, M.; Hong, L. Primary cell wall modifying proteins regulate wall mechanics to steer plant morphogenesis. Front. Plant Sci. 2021, 12, 751372. [Google Scholar] [CrossRef] [PubMed]
  50. Wolf, S.; Mouille, G.; Pelloux, J. Homogalacturonan methyl-esterification and plant development. Mol. Plant 2009, 2, 851–860. [Google Scholar] [CrossRef] [PubMed]
  51. Passardi, F.; Penel, C.; Dunand, C. Performing the paradoxical: How plant peroxidases modify the cell wall. Trends Plant Sci. 2004, 9, 534–540. [Google Scholar] [CrossRef] [PubMed]
  52. Baxter, A.; Mittler, R.; Suzuki, N. ROS as key players in plant stress signalling. J. Exp. Bot. 2014, 65, 1229–1240. [Google Scholar] [CrossRef] [PubMed]
  53. Vogt, T. Phenylpropanoid biosynthesis. Mol. Plant 2010, 3, 2–20. [Google Scholar] [CrossRef] [PubMed]
  54. Winkel-Shirley, B. Flavonoid biosynthesis. A colorful model for genetics, biochemistry, cell biology, and biotechnology. Plant Physiol. 2001, 126, 485–493. [Google Scholar] [CrossRef] [PubMed]
  55. Bowles, D.; Lim, E.-K.; Poppenberger, B.; Vaistij, F.E. Glycosyltransferases of lipophilic small molecules. Annu. Rev. Plant Biol. 2006, 57, 567–597. [Google Scholar] [CrossRef] [PubMed]
  56. Chollet, R.; Vidal, J.; O’Leary, M.H. Phospho enol pyruvate carboxylase: A ubiquitous, highly regulated enzyme in plants. Annu. Rev. Plant Biol. 1996, 47, 273–298. [Google Scholar]
  57. Sun, X.; Han, G.; Meng, Z.; Lin, L.; Sui, N. Roles of malic enzymes in plant development and stress responses. Plant Signal. Behav. 2019, 14, e1644596. [Google Scholar] [CrossRef] [PubMed]
  58. Igamberdiev, A.U.; Eprintsev, A.T. Organic acids: The pools of fixed carbon involved in redox regulation and energy balance in higher plants. Front. Plant Sci. 2016, 7, 1042. [Google Scholar] [CrossRef] [PubMed]
  59. Walker, R.P.; Chen, Z.-H.; Famiani, F. Gluconeogenesis in plants: A key interface between organic acid/amino acid/lipid and sugar metabolism. Molecules 2021, 26, 5129. [Google Scholar] [CrossRef] [PubMed]
  60. El Caid, M.B.; Salaka, L.; El Merzougui, S.; Lachguer, K.; Lagram, K.; El Mousadik, A.; Serghini, M.A. Multi-site evaluation of the productivity among saffron (Crocus sativus L.) for clonal selection purposes. J. Appl. Res. Med. Aromat. Plants 2020, 17, 100248. [Google Scholar] [CrossRef]
  61. El Caid, M.B.; Lachheb, M.; Lagram, K.; Wang, X.; Serghini, M.A. Ecotypic variation and environmental influence on saffron (Crocus sativus L.) vegetative growth: A multivariate performance analysis. J. Appl. Res. Med. Aromat. Plants 2024, 43, 100601. [Google Scholar] [CrossRef]
Figure 1. Ploidy identification and leaf anatomical and physiological traits of diploid and tetraploid grape plants. (A,B) Nuclear DNA content of diploid and tetraploid plants determined by flow cytometry. (C,D) Microscopic observation of root tip chromosomes in diploid and tetraploid plants. (E,F) Chloroplast number in guard cells. (G,H) Stomatal density and stomatal morphology. (I) Leaf relative water content. (JL) Total chlorophyll content, chlorophyll a/b ratio, and carotenoid content. Data are shown as mean ± SE. Asterisks indicate significant differences between diploid and tetraploid plants (* p < 0.05; ** p < 0.01; *** p < 0.001).
Horticulturae 12 00992 g001
Figure 2. Morphological changes of diploid and tetraploid plants at different developmental stages. (A) Morphological comparison after 40 days of growth. (B) Morphological comparison after 50 days following transplantation. (C) Morphological comparison of functional leaves. (D) Morphological comparison of shoots after field cultivation.
Horticulturae 12 00992 g002
Figure 3. Chlorophyll fluorescence characteristics of diploid and tetraploid grape leaves. (A) OJIP chlorophyll fluorescence transients in diploid and tetraploid leaves. (B) Radar plot of selected JIP-test parameters derived from the OJIP curves. The parameters reflect PSII energy absorption, trapping, and electron transport characteristics. Red and blue lines indicate diploid and tetraploid biological replicates, respectively. The gray line indicates the average value used for normalization.
Horticulturae 12 00992 g003
Figure 4. Transcriptomic and metabolomic analyses of diploid and tetraploid plants. Principal component analysis (PCA) (A), correlation analysis (B), and statistical analysis of differentially expressed genes (DEGs) (C) based on transcriptomic data from diploid and tetraploid samples. Principal component analysis (PCA) (D), correlation analysis (E), and statistical analysis of differentially accumulated metabolites (F) based on metabolomic data from diploid and tetraploid samples.
Horticulturae 12 00992 g004
Figure 5. Functional enrichment analysis of differentially expressed genes and metabolites between diploid and tetraploid plants. (A) GO enrichment analysis of DEGs. (B) KEGG pathway enrichment analysis of DEGs. (C) KEGG pathway enrichment analysis of DAMs. The x-axis represents the rich factor. The size of each bubble indicates the number of DEGs or DAMs enriched in each term or pathway, and the color indicates the corresponding p-value.
Horticulturae 12 00992 g005
Figure 6. Expression heatmaps of selected functional DEGs and related DAMs between diploid and tetraploid plants. Gene expression heatmaps were generated using Z-score-normalized log2(FPKM + 1) values from the transcriptomic data, and the metabolite heatmap was generated using normalized relative abundance from the metabolomic data. (A) DEGs associated with glucosyltransferase activity and cell wall polysaccharide-related processes. (B) DEGs associated with carbohydrate binding. (C) DEGs associated with cell wall organization. (D) DEGs associated with peroxidase activity. (E) DAMs related to carbohydrate metabolism, phenolic acid metabolism, flavonoid glycosylation, antioxidant-related polyphenols, and carotenoid-related metabolites. Blue indicates low expression or abundance, and red indicates high expression or abundance.
Horticulturae 12 00992 g006
Figure 7. Pathway-level mapping of differentially expressed genes and differentially accumulated metabolites to KEGG carbon metabolism. Differentially expressed genes (DEGs) and differentially accumulated metabolites (DAMs) mapped to the KEGG carbon metabolism pathway were compared between diploid and tetraploid grape leaves. Red indicates higher expression or accumulation in tetraploid leaves, whereas blue indicates lower expression or accumulation in tetraploid leaves. The arrows and reaction connections represent the topology of the KEGG reference pathway and should not be interpreted as experimentally determined reaction directions or carbon fluxes. The figure does not represent direct measurements of enzyme activity, carbon allocation, or metabolic flux.
Horticulturae 12 00992 g007
Table 1. Effects of colchicine treatment on tetraploid induction in V. vinifera ‘Thompson Seedless’.
Colchicine TreatmentNo. of Explant TreatedPloidy LevelsSurvival Rate (%)Tetraploid Induction Rate (%)
Concentration
(%)
Duration
(Hour)
2X
(2n = 38)
2X + 4X4X
(2n = 76)
0.054815(15)12301000
7215(11)73173.336.67
0.14824(14)57258.338.33
7230(15)42950.0030
0.154830(13)36443.3313.33
7224(9)42337.512.5
0.24827(7)43125.923.7
7221(3)11114.284.76
0.34824(3)02112.504.17
7221(0)00000
Values in parentheses indicate the total number of surviving explants after each treatment. Survival rate (%) was calculated as the number of surviving explants divided by the total number of treated explants × 100. Tetraploid induction rate (%) was calculated as the number of tetraploid plants divided by the total number of treated explants × 100.
Disclaimer/Publisher’s Note: The statements, opinions and data contained in all publications are solely those of the individual author(s) and contributor(s) and not of MDPI and/or the editor(s). MDPI and/or the editor(s) disclaim responsibility for any injury to people or property resulting from any ideas, methods, instructions or products referred to in the content.