Article

Red–Blue Light Promotes Potato Minituber Yield by Regulating Hormone Networks and Senescence-Related Pathways


1
State Key Laboratory of Crop Gene Exploration and Utilization in Southwest China, College of Agronomy, Sichuan Agricultural University, Chengdu 611130, China
2
Sichuan Key Laboratory of Green Germplasm Innovation and Genetic Improvement of Grain and Oil Crops, Crop Research Institute of Sichuan Academy of Agricultural Sciences, Chengdu 610066, China
*
Authors to whom correspondence should be addressed.
Horticulturae 2026, 12(8), 954; https://doi.org/10.3390/horticulturae12080954
Submission received: 9 June 2026 / Revised: 22 July 2026 / Accepted: 28 July 2026 / Published: 2 August 2026
(This article belongs to the Section Propagation and Seeds)

Abstract

Aeroponics is an important approach for the production of virus-free seed potatoes. The propagation efficiency of aeroponically grown potatoes is affected by light conditions. However, the effects of different supplemental light conditions on potato yield and their underlying mechanisms remain unclear. Here, multiple light conditions are applied to investigate their influences on potato minituber production. The results show that red–blue light supplementation significantly increases plant yield. Physiologically, it enhances chlorophyll and carotenoid contents, thereby increasing net photosynthetic rate and CO2 utilization efficiency. Red–blue light temporally regulates hormone balance by increasing the GA/ABA ratio at the early stage to promote vegetative growth, and maintaining higher trans-zeatin content at the late stage, potentially sustaining cell division. These synergistic effects may enhance yield by delaying senescence and prolonging the tuberization period. Transcriptomic analysis reveals that red–blue light treatment enriches pathways related to hormone signaling, senescence-associated, and zeatin biosynthesis at the late growth stage, and upregulates key tuberization genes (StSP6A, StSP3D, StFTL1), which may be associated with tuber formation. Red–blue light treatment optimizes photosynthesis, remodels hormone networks, and induces temporal transcriptional reprogramming, while also increasing the yield of virus-free seed potatoes in aeroponic culture. This study provides theoretical and technical support for the efficient aeroponic breeding of virus-free seed potatoes.

1. Introduction

Potato (Solanum tuberosum L.) is an asexually propagated crop. Long-term continuous cultivation can easily lead to the accumulation of viruses in tubers, resulting in varietal degeneration, reduced yield, and declining quality [1]. Therefore, the use of virus-free seed potatoes is essential for restoring desirable agronomic traits and achieving stable, high yields [2]. Compared with conventional substrate culture, aeroponics offers several unique advantages, including precise water and nutrient supply, and a root-zone environment that remains dark, humid, and thermally stable, thereby minimizing direct interference from light and soil-borne pathogens on tuber development. This system facilitates the industrialized and standardized production of minitubers and significantly improves the efficiency and quality of seed potato propagation [3,4].
With the growing demand for seed potatoes, exploring technical approaches to increase the yield of virus-free minitubers under aeroponic conditions has attracted increasing attention. In addition to optimizing water and fertilizer management, the regulation of supplemental light has become a research hotspot in this field. Studies have shown that supplemental lighting with a red: blue: green ratio of 7:1:2 significantly increases the number of tubers per plant, reaching 31 tubers per plant, including 9.26 tubers weighing ≥3 g, representing a 51% increase compared with the control [4]. These findings indicate that exogenous light application can significantly promote tuber formation. Therefore, optimizing light quality ratios under aeroponic conditions and clarifying their regulatory effects and mechanisms in potato tuberization are of great significance for improving seed potato propagation efficiency and achieving high-quality, high-yield protected potato cultivation.
As a core component of light signals, light quality, namely light of different wavelengths, exerts distinct regulatory effects on plant growth and development, depending on its spectral composition and intensity [5]. Red light (620–750 nm) and blue light (400–500 nm) are the primary wavelengths absorbed during photosynthesis. They directly participate in chlorophyll synthesis, photosynthetic electron transport, and carbon assimilation, and also play important roles in regulating plant architecture, including plant height, internode length, and leaf morphology [6]. In terms of yield formation, red light promotes the accumulation of photosynthates and delays leaf senescence, thereby increasing tuber weight during the later growth stage [7]. Blue light mainly regulates leaf expansion and stem elongation, thereby indirectly affecting tuberization [8]. Numerous classical studies have demonstrated that potato tuber growth and development depend not only on a continuous supply of photosynthates from leaves but also on precise regulation by endogenous hormones. Red–blue light irradiation significantly alters the levels of gibberellins, auxins, and cytokinins (CTKs) in potato stems and leaves, indicating that endogenous hormones play critical regulatory roles in tuber formation and bulking [9]. During tuber expansion, cells enlarge through the accumulation of carbohydrates, mineral nutrients, and water, a process that is also finely regulated by the endogenous hormone network. Gibberellins (GAs) inhibit potato tuber formation, whereas abscisic acid (ABA) positively regulates tuberization by downregulating GA levels and increasing the accumulation of tuber-promoting hormones [10]. In addition, auxin (IAA) promotes cell expansion [11], while CTKs promote cell division and proliferation [12]. Supporting evidence has also been reported in other species. For example, red–blue light significantly reduces GA content in tomato seedlings while increasing auxin levels in stems and roots compared with the control [13]. In carnation, blue light downregulates ethylene biosynthesis genes and upregulates ABA biosynthesis genes, thereby delaying petal senescence [14]. Collectively, these findings indicate that different endogenous hormones perform stage-specific functions during plant development and achieve precise regulation through synergistic or antagonistic interactions.
However, the optimal red-to-blue light ratio for potato tuberization remains unclear. Some studies have shown that a low R/B ratio (1:9) significantly promotes tuber formation in potted potatoes after 50 days of treatment [15], whereas others have reported that a 1:1 R/B ratio significantly increases potato yield [7]. In in vitro potato culture, a 7:3 R/B ratio was found to increase the number of tubers per plant as well as individual tuber weight and diameter [16]. Furthermore, a recent study reported that a 7:1 R/B ratio promoted stolon development and tuber formation, thereby improving the proportion of commercial seed potatoes (≥2 g) [17]. In hydroponic potato experiments, the 7:1 R/B ratio resulted in the highest tuberization rate after 80 days of light supplementation, suggesting that this spectral combination is particularly beneficial for late-stage tuber formation [18]. Compared with the 1:9, 1:1, and 7:3 R/B ratios tested in potted or in vitro systems, the 7:1 R/B ratio adopted in this study was derived from a hydroponic seedling system that closely resembles our experimental conditions and therefore provides a more relevant reference. Accordingly, the 7:1 red–blue light treatment was selected for subsequent experiments. White light, with its broad spectrum resembling natural light, was used as a control to increase light intensity alone, allowing evaluation of its effects on plant growth and yield [19]. Far-red light, known to induce shade-avoidance responses including stem elongation and enhanced light capture, was included to determine whether this cultivar exhibits similar responses under aeroponic conditions [19,20].
However, most previous studies have focused on agronomic traits and yield, with limited systematic analysis of the physiological, metabolic, and molecular transcriptional levels underlying potato growth and yield formation. To address this gap, we used aeroponically grown potato plants under natural light (control) and as supplemental treatments with white, far-red, and red–blue light. Our objectives were to evaluate the effects of these treatments on potato growth and to investigate the reasons why the 7R1B treatment enhances propagation efficiency. We selectively measured plant growth, photosynthetic characteristics, hormone accumulation, and transcriptomic responses under the control and 7R1B treatments to assess their effects and explore the potential regulatory network.

2. Materials and Methods

2.1. Plant Material and Culture Conditions

The potato cultivar ‘Chuanyu 56’, provided by the Potato Research Center of the Sichuan Academy of Agricultural Sciences, was used as the experimental material. Plantlets were cultured on solid medium in a tissue culture room for approximately 45 days at 22 °C under a 16 h light/8 h dark photoperiod. The seedlings were then transferred to a hydroponic tank for one week of acclimatization, followed by transplantation into aeroponic chambers. After 30 days of aeroponic cultivation, supplemental light of different qualities was applied for 8 h daily under natural daylight conditions. Based on published studies, the light treatments were far-red light (FR) [21], white light (W, 400–700 nm) [15], and red–blue light (7R1B; red: 660 nm, blue: 450 nm), with natural light serving as the control (CK). Each of the three replicates per treatment was equipped with independent culture chambers (for nutrient supply) and lighting systems. Each chamber contained 65 plants, of which 40 were used for yield assessment, and the remaining 25 were used for sampling and measurement of related indicators. Unlike indoor culture experiments, this study was conducted under natural outdoor sunlight, with supplemental photosynthetic photon flux density (PPFD, 400–700 nm) provided at a uniform intensity of 180 ± 5 μmol·m−2·s−1 (LI-250A light meter, LI-COR, Lincoln, NE, USA). The far-red photon flux density (FR-PFD, 700–750 nm) was 9.7 μmol·m−2·s−1. The supplemental lighting was applied daily from 8:00 to 16:00.
During the experimental period, natural daylight conditions were monitored daily using a spectroradiometer. The average PPFD of natural sunlight was 106.76 ± 3 μmol·m−2·s−1, with a daily light integral (DLI) of approximately 4.61 mol·m−2·d−1 (based on a 12 h photoperiod). The spectral composition of natural light was as follows: PPF-B (400–500 nm) = 27.49 μmol·m−2·s−1, PPF-G (500–600 nm) = 40.35 μmol·m−2·s−1, and PPF-R (600–700 nm) = 38.35 μmol·m−2·s−1, corresponding to a red-to-blue ratio of approximately 1.39.

2.2. Measurement of Agronomic Traits

Plant height was measured as the vertical distance from the shoot tip to the point where the first stolon was attached to the basal stem. Stem diameter was measured at the fifth internode from the top using a vernier caliper, with three replicates per plant. Root length was defined as the linear distance from the point of attachment of the first stolon to the root tip. Stolon number was determined by counting only the primary stolons arising from the stem base. Six plants were randomly selected as replicates (n = 6).

2.3. Measurement of Photosynthetic Parameters

For chlorophyll determination, 0.5 g of fresh leaf disks (from the fourth fully expanded leaf, excluding the main veins) was sampled, frozen in liquid nitrogen, ground into powder, and extracted with 10 mL of 95% ethanol for 6 h until fully decolorized. After centrifugation at 3500× g, the supernatant was collected and diluted to 25 mL. Absorbance was measured at 665 nm, 649 nm, and 470 nm using a spectrophotometer, and pigment contents were calculated accordingly [22]. Photosynthetic parameters, including net photosynthetic rate (Pn), stomatal conductance (Gs), transpiration rate (Tr), and intercellular CO2 concentration (Ci), were measured on sunny days between 8:00 and 10:30 and between 15:30 and 17:00 using a LI-6400 portable photosynthesis system (LI-COR, Lincoln, NE, USA), avoiding the midday period when high temperatures induce stomatal closure. During measurements, the chamber was set to a PPFD of 1000 μmol·m−2·s−1, a reference CO2 concentration of 400 μmol·mol−1, a leaf temperature of 25 ± 1 °C, a relative humidity of 60–70%, and an airflow rate of 500 μmol·s−1. Three technical replicates were recorded per leaf, and three biological replicates were used for each treatment.

2.4. Measurement of Quality-Related Indices

For sugar and starch analyses, 0.5 g of tuber bud tissue was collected, with three biological replicates per treatment. For extraction, samples were incubated in 5 mL of 80% ethanol at 80 °C for 30 min, cooled, and centrifuged at 3500× g for 10 min. The supernatant was collected, and the extraction was repeated twice. The combined supernatants were diluted to 25 mL for the determination of reducing sugar and soluble sugar contents, while the remaining precipitate was used for starch analysis. Reducing sugar content was determined using the 3,5-dinitrosalicylic acid method [23]. Soluble sugar content was measured using the anthrone–sulfuric acid method [24]. Starch content was determined after gelatinization and acid hydrolysis, followed by the same colorimetric assay used for soluble sugar determination [25].

2.5. Tuber Harvest and Yield Measurement

The first harvest was conducted 60 days after the initiation of supplemental lighting, with subsequent harvests performed at 7- to 10-day intervals until plants ceased tuber production. Tubers weighing 5 ± 2 g were collected at each harvest, and all tubers weighing ≥0.5 g were included in the final harvest. Forty plants constituted one replicate, with three replicates in total; all replicates were placed in the same greenhouse but in separate aeroponic chambers. At each harvest, tubers were rinsed to remove residual nutrient solution and air-dried to remove surface moisture. The number of tubers per plant, yield per plant, and average tuber weight were recorded and calculated for each replicate at each time point.

2.6. Gene Expression Analysis

Total RNA was extracted from the fourth fully expanded leaves collected at 30 and 90 days of the supplementary light treatment using Trizol reagent (Coolaber, Beijing, China). RNA concentration and purity were assessed using a NanoDrop spectrophotometer (Thermo Fisher Scientific, Waltham, MA, USA), with A260/A280 ratios of 1.9–2.1 and A260/A230 ratios of 2.0–2.2, and RNA integrity was confirmed by agarose gel electrophoresis. One microgram of total RNA was treated with DNase I to remove genomic DNA contamination and subsequently reverse-transcribed into cDNA using the PrimeScript™ RT reagent Kit (Takara, Kyoto, Japan). qRT-PCR was performed using SYBR GREEN Master Mix (Vazyme, Nanjing, China) on a StepOne Plus Real-Time PCR System (Applied Biosystems, Carlsbad, CA, USA). The thermal cycling conditions were as follows: initial denaturation at 95 °C for 3 min, followed by 40 cycles of denaturation at 95 °C for 15 s and annealing/extension at 60 °C for 30 s. Melting curve analysis was conducted using a temperature gradient from 65 °C to 95 °C with a ramp rate of 0.5 °C·s−1. The StEF1α gene was used as the internal reference, and relative expression levels were calculated using the 2−ΔCt method [26]. Each biological sample was analyzed in triplicate, and the primers used for all genes are listed in Table S1. The candidate genes selected for qRT-PCR validation were primarily those involved in key pathways of auxin, cytokinin, salicylic acid, and abscisic acid signal transduction and that exhibited relatively high fold changes in expression, with a screening threshold of |Fold Change| ≥ 3 and adjusted p < 0.05.

2.7. Measurement of Endogenous Hormones

Samples of the fourth leaves from the top were collected from the CK and 7R1B treatment groups at 30 and 90 days of supplementary light treatment, respectively, with three replicates per treatment. The samples were rapidly frozen, ground in liquid nitrogen, and then 0.05 g of powder from each replicate was weighed into a centrifuge tube and extracted with 1 mL of pre-chilled 50% acetonitrile. After vortexing for 30 s, the samples were extracted on ice at 4 °C for 2 h and then centrifuged at 12,000 rpm for 10 min. The supernatant was collected, and the extraction was repeated once. The combined supernatants were evaporated to near dryness under a nitrogen stream and then re-dissolved in 0.2 mL of methanol for instrumental analysis [27]. The high-performance liquid chromatography (UHPLC) system (Vanquish, Thermo Fisher Scientific, Waltham, MA, USA) coupled with a high-resolution mass spectrometer (Q Exactive, Thermo Fisher Scientific, Waltham, MA, USA) was used for data acquisition. Chromatographic separation was performed on a Waters HSS T3 column (50 × 2.1 mm, 1.8 μm) at 40 °C with a flow rate of 0.3 mL/min and an injection volume of 2 μL. The mobile phases consisted of ultrapure water (A) and acetonitrile (B), with 0.04% acetic acid for positive-ion mode or 0.10% acetic acid for negative-ion mode. The autosampler was maintained at 4 °C, and samples were analyzed in random order to minimize signal fluctuations. Mass spectrometry was operated in Full-MS mode with both positive and negative ion switching, covering a scan range of m/z 100–500 [28].

2.8. Transcriptomic Analysis

Due to the significant effects of the 7R1B treatment on senescence and tuber number, with pronounced phenotypic differences observed at 30 and 90 days of supplemental lighting, total RNA was extracted from samples at these two time points (CK and 7R1B treatments, with three biological replicates each). RNA integrity was assessed using an Agilent 2100 Bioanalyzer (Agilent Technologies, Santa Clara, CA, USA). Poly(A) mRNA was enriched using Oligo(dT) magnetic beads, fragmented, and reverse-transcribed into first-strand cDNA with random primers and M-MuLV reverse transcriptase. Second-strand cDNA was synthesized with DNA polymerase I and dNTPs. The purified cDNA was end-repaired, A-tailed, adapter-ligated, and size-selected (370–420 bp) with AMPure XP beads, and the final library was obtained after PCR amplification [29]. Library concentration was measured using a Qubit 2.0 fluorometer and diluted to 1.5 ng/μL. Insert size was checked using an Agilent 2100 system, and the effective library concentration (>1.5 nM) was accurately quantified by qPCR. The libraries were sequenced on an X-Plus platform (NovaSeq X Plus, Illumina Inc., San Diego, CA, USA) with a paired-end 150 bp (PE150) read configuration, generating approximately 6.6 Gb of raw data per sample. Raw reads were processed using fastp (v0.23.2) for quality control, during which adapter sequences, low-quality reads (Q < 20), and reads with excessive ambiguous bases were removed. The resulting clean reads were aligned to the potato reference genome (DM v6.1) downloaded from SpudDB (https://spuddb.uga.edu/ accessed on 1 June 2025), using HISAT2 (v2.2.1). Gene expression levels were quantified using featureCounts (v2.0.1). Differential expression analysis was performed using DESeq2 (v1.38.0) under a negative binomial distribution model, with the Wald test used to assess statistical significance. p-values were adjusted for multiple testing using the Benjamini–Hochberg procedure, and genes with |log2 fold change| ≥ 3 and adjusted p < 0.05 were considered significantly differentially expressed. Raw count data were normalized using the median-of-ratios method implemented in DESeq2, and genes with low expression (sum of counts across all samples < 10) were filtered out prior to analysis. GO functional annotation and KEGG pathway enrichment analysis were performed using clusterProfiler (v4.6.0) and KEGG Mapper, respectively, with adjusted p < 0.05 considered as the threshold for significant enrichment.

2.9. Statistical Analysis

All data are presented as means ± standard deviation (mean ± SD). Statistical analyses were performed using DPSv21.05 (Hangzhou RuiFeng Technology, Hangzhou, China) and SPSS v29 (SPSS Inc., Chicago, IL, USA) software together. For comparisons at single time points, one-way analysis of variance (ANOVA) was conducted, followed by Fisher’s least significant difference (LSD) test for post hoc multiple comparisons. The significance threshold was set at p < 0.05 for all statistical analyses. Each treatment consisted of three biological replicates, with each replicate corresponding to an independent aeroponic chamber; technical replicates were averaged before statistical analysis.

3. Results

3.1. Effects of Different Light Qualities on Potato Growth and Yield

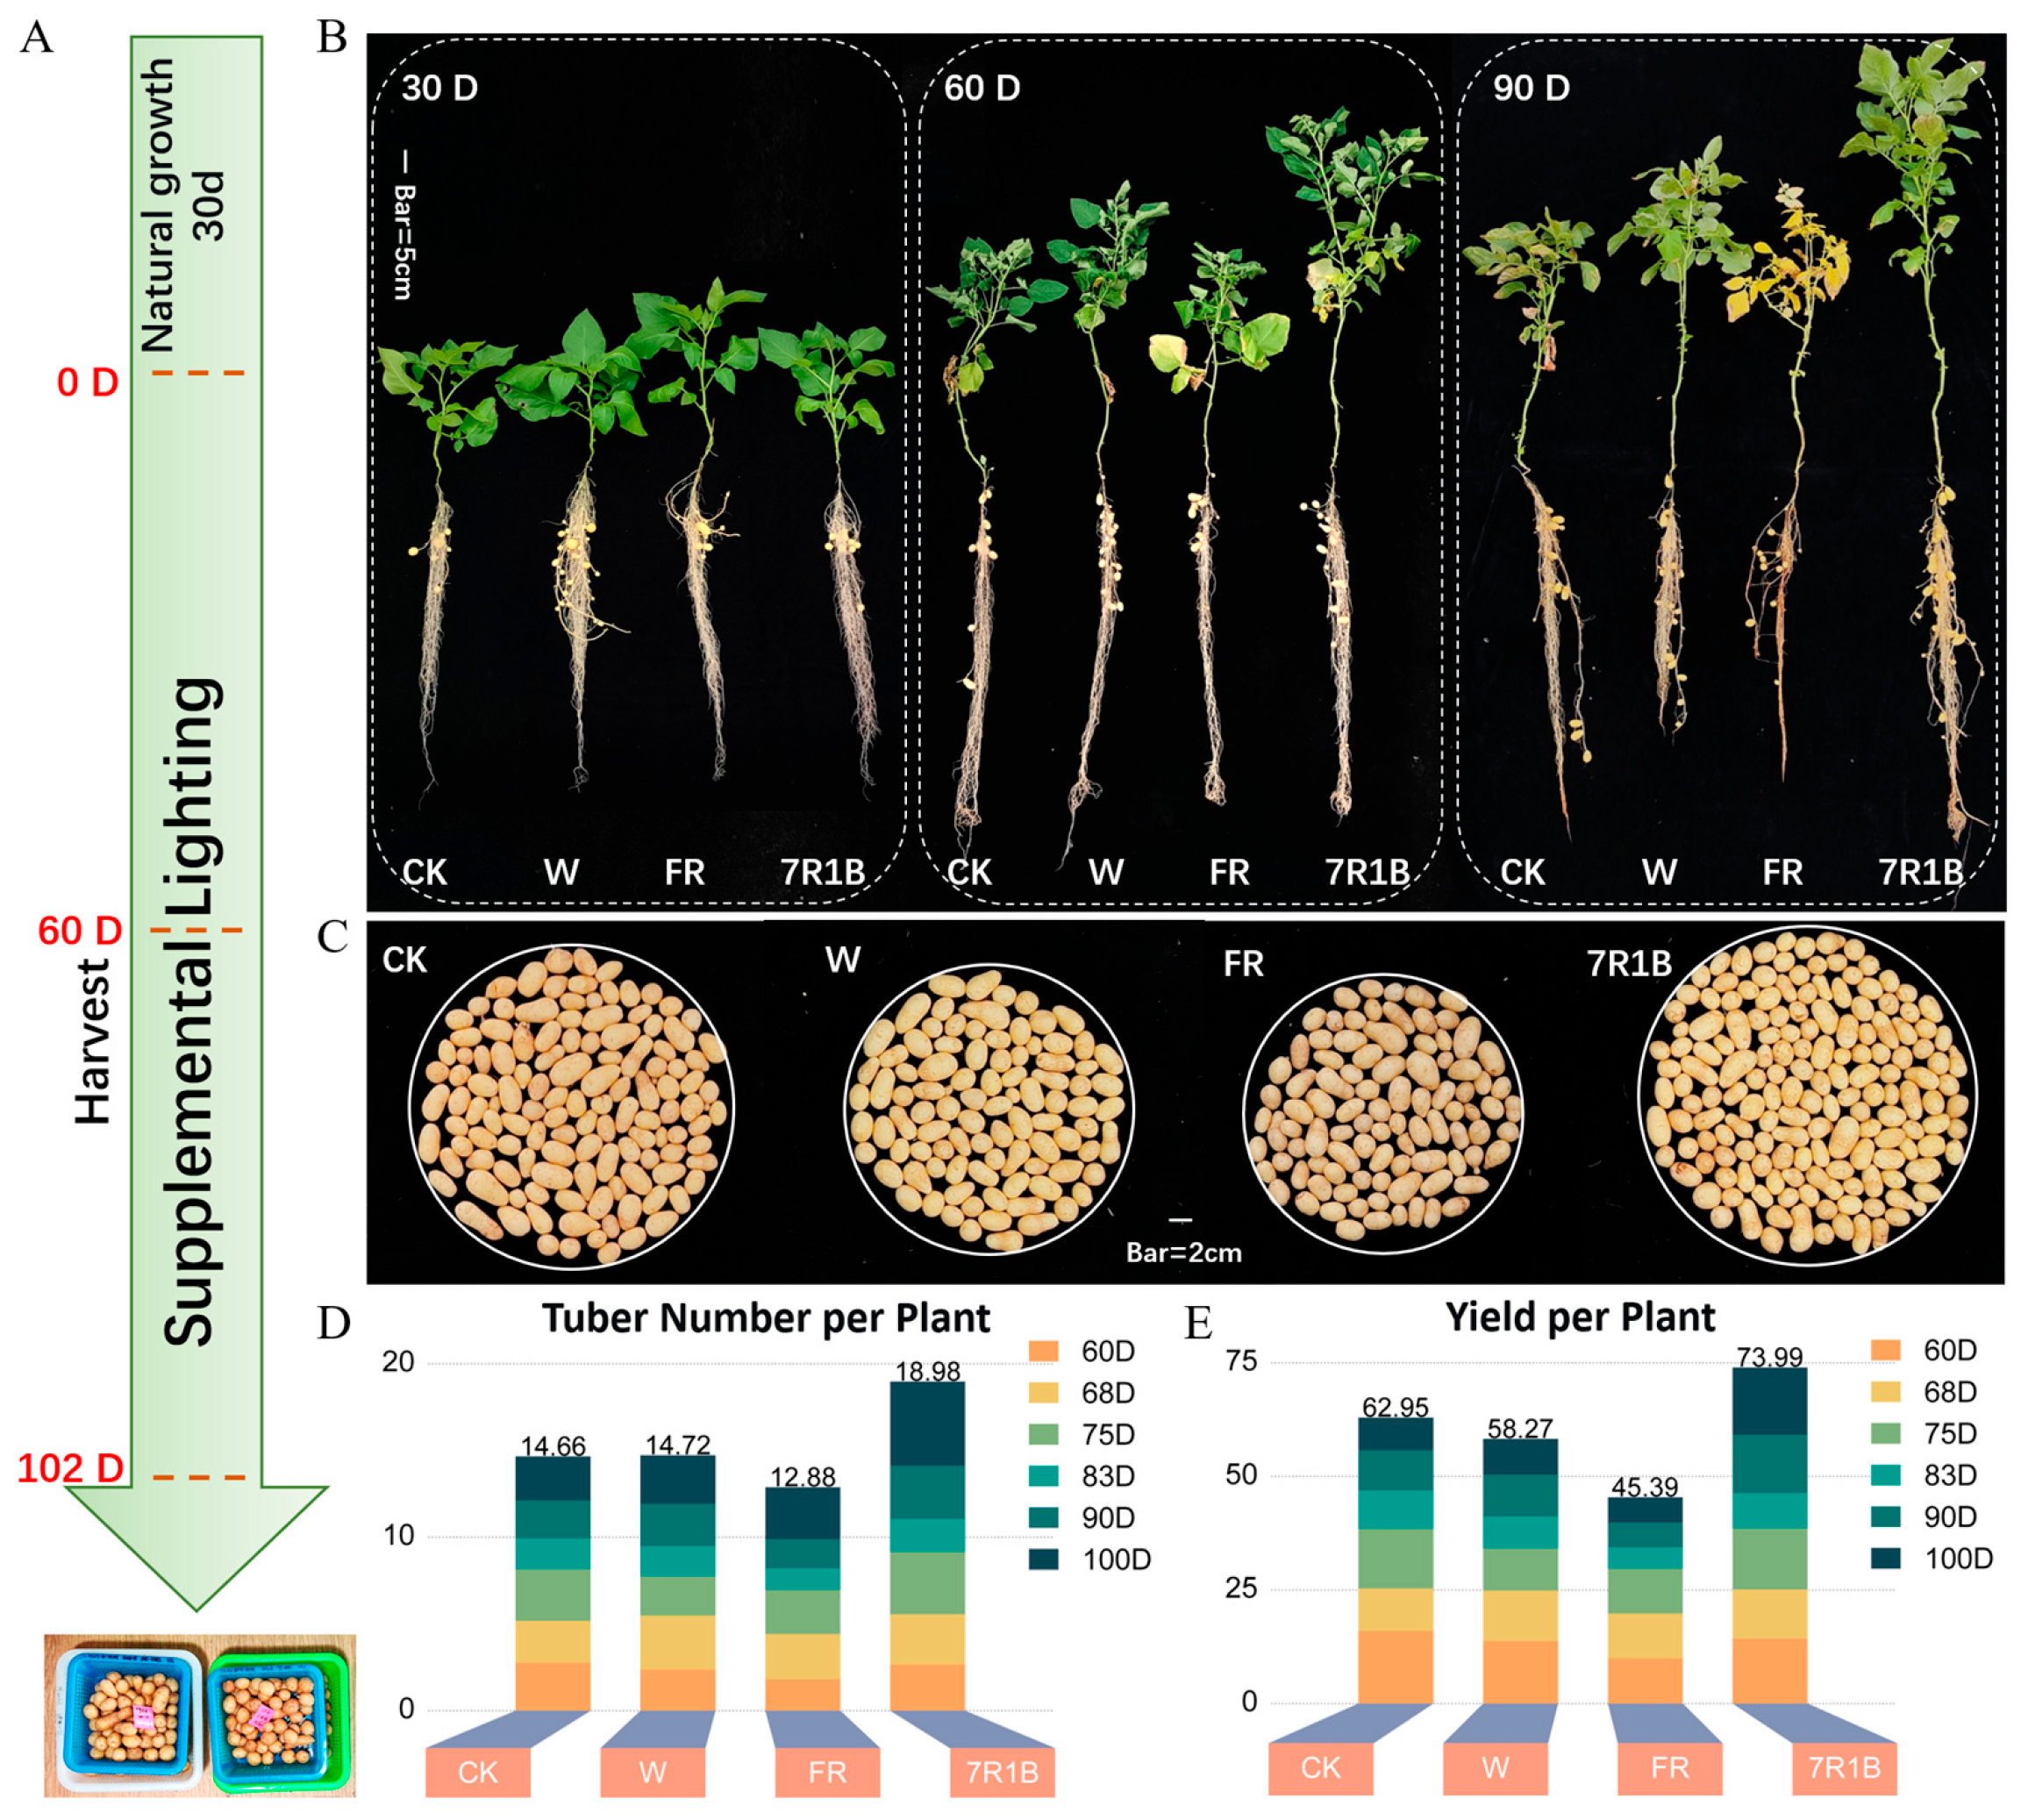
To investigate the effects of different light qualities on the growth and yield of aeroponically grown potatoes, growth performance and final yield were recorded and analyzed for each treatment. The key time points are illustrated in Figure 1A. After 30 days of treatment, clear morphological differences were evident: plants under FR were the tallest but had the smallest stem diameter. Stolons had begun to swell in all treatments but had not reached standard seed tuber size. By 60 days, plant height, stem diameter, and root length were greatest under 7R1B, and were significantly higher than those under CK, W, and FR. At 90 days, CK plants showed leaf senescence and desiccation; FR plants displayed chlorosis and necrosis; and W plants had ceased growth with partial leaf drying. In contrast, 7R1B plants remained green and showed no obvious signs of senescence at harvest, with the largest height and longest roots. Stolon number did not differ significantly among treatments or sampling times (Figure 1B and Figure S1A–D). Detailed numerical values and statistical comparisons for all agronomic traits at each time point are provided in Supplementary Table S2.
To investigate the effect of the 7R1B treatment on potato propagation efficiency, tuber number per plant and yield per plant were recorded for each treatment. In the early growth stage, there were no significant differences in tuber number per plant or yield per plant among treatments compared with the control. However, during the late supplemental lighting period (75–100 days), the 7R1B treatment showed a rapid increase in both tuber number per plant and yield per plant, eventually reaching 18.98 tubers per plant and 73.99 g per plant, which were significantly higher than those of CK (14.66 tubers per plant, 62.95 g per plant), W (14.72 tubers per plant, 58.27 g per plant), and FR (12.88 tubers per plant, 45.39 g per plant) treatments (p < 0.05). The FR treatment exhibited the lowest tuber number and yield per plant among all groups, while the W treatment showed no significant differences compared with the CK (Figure 1C–E, Table S2).

3.2. Effects of Light Quality on Photosynthesis

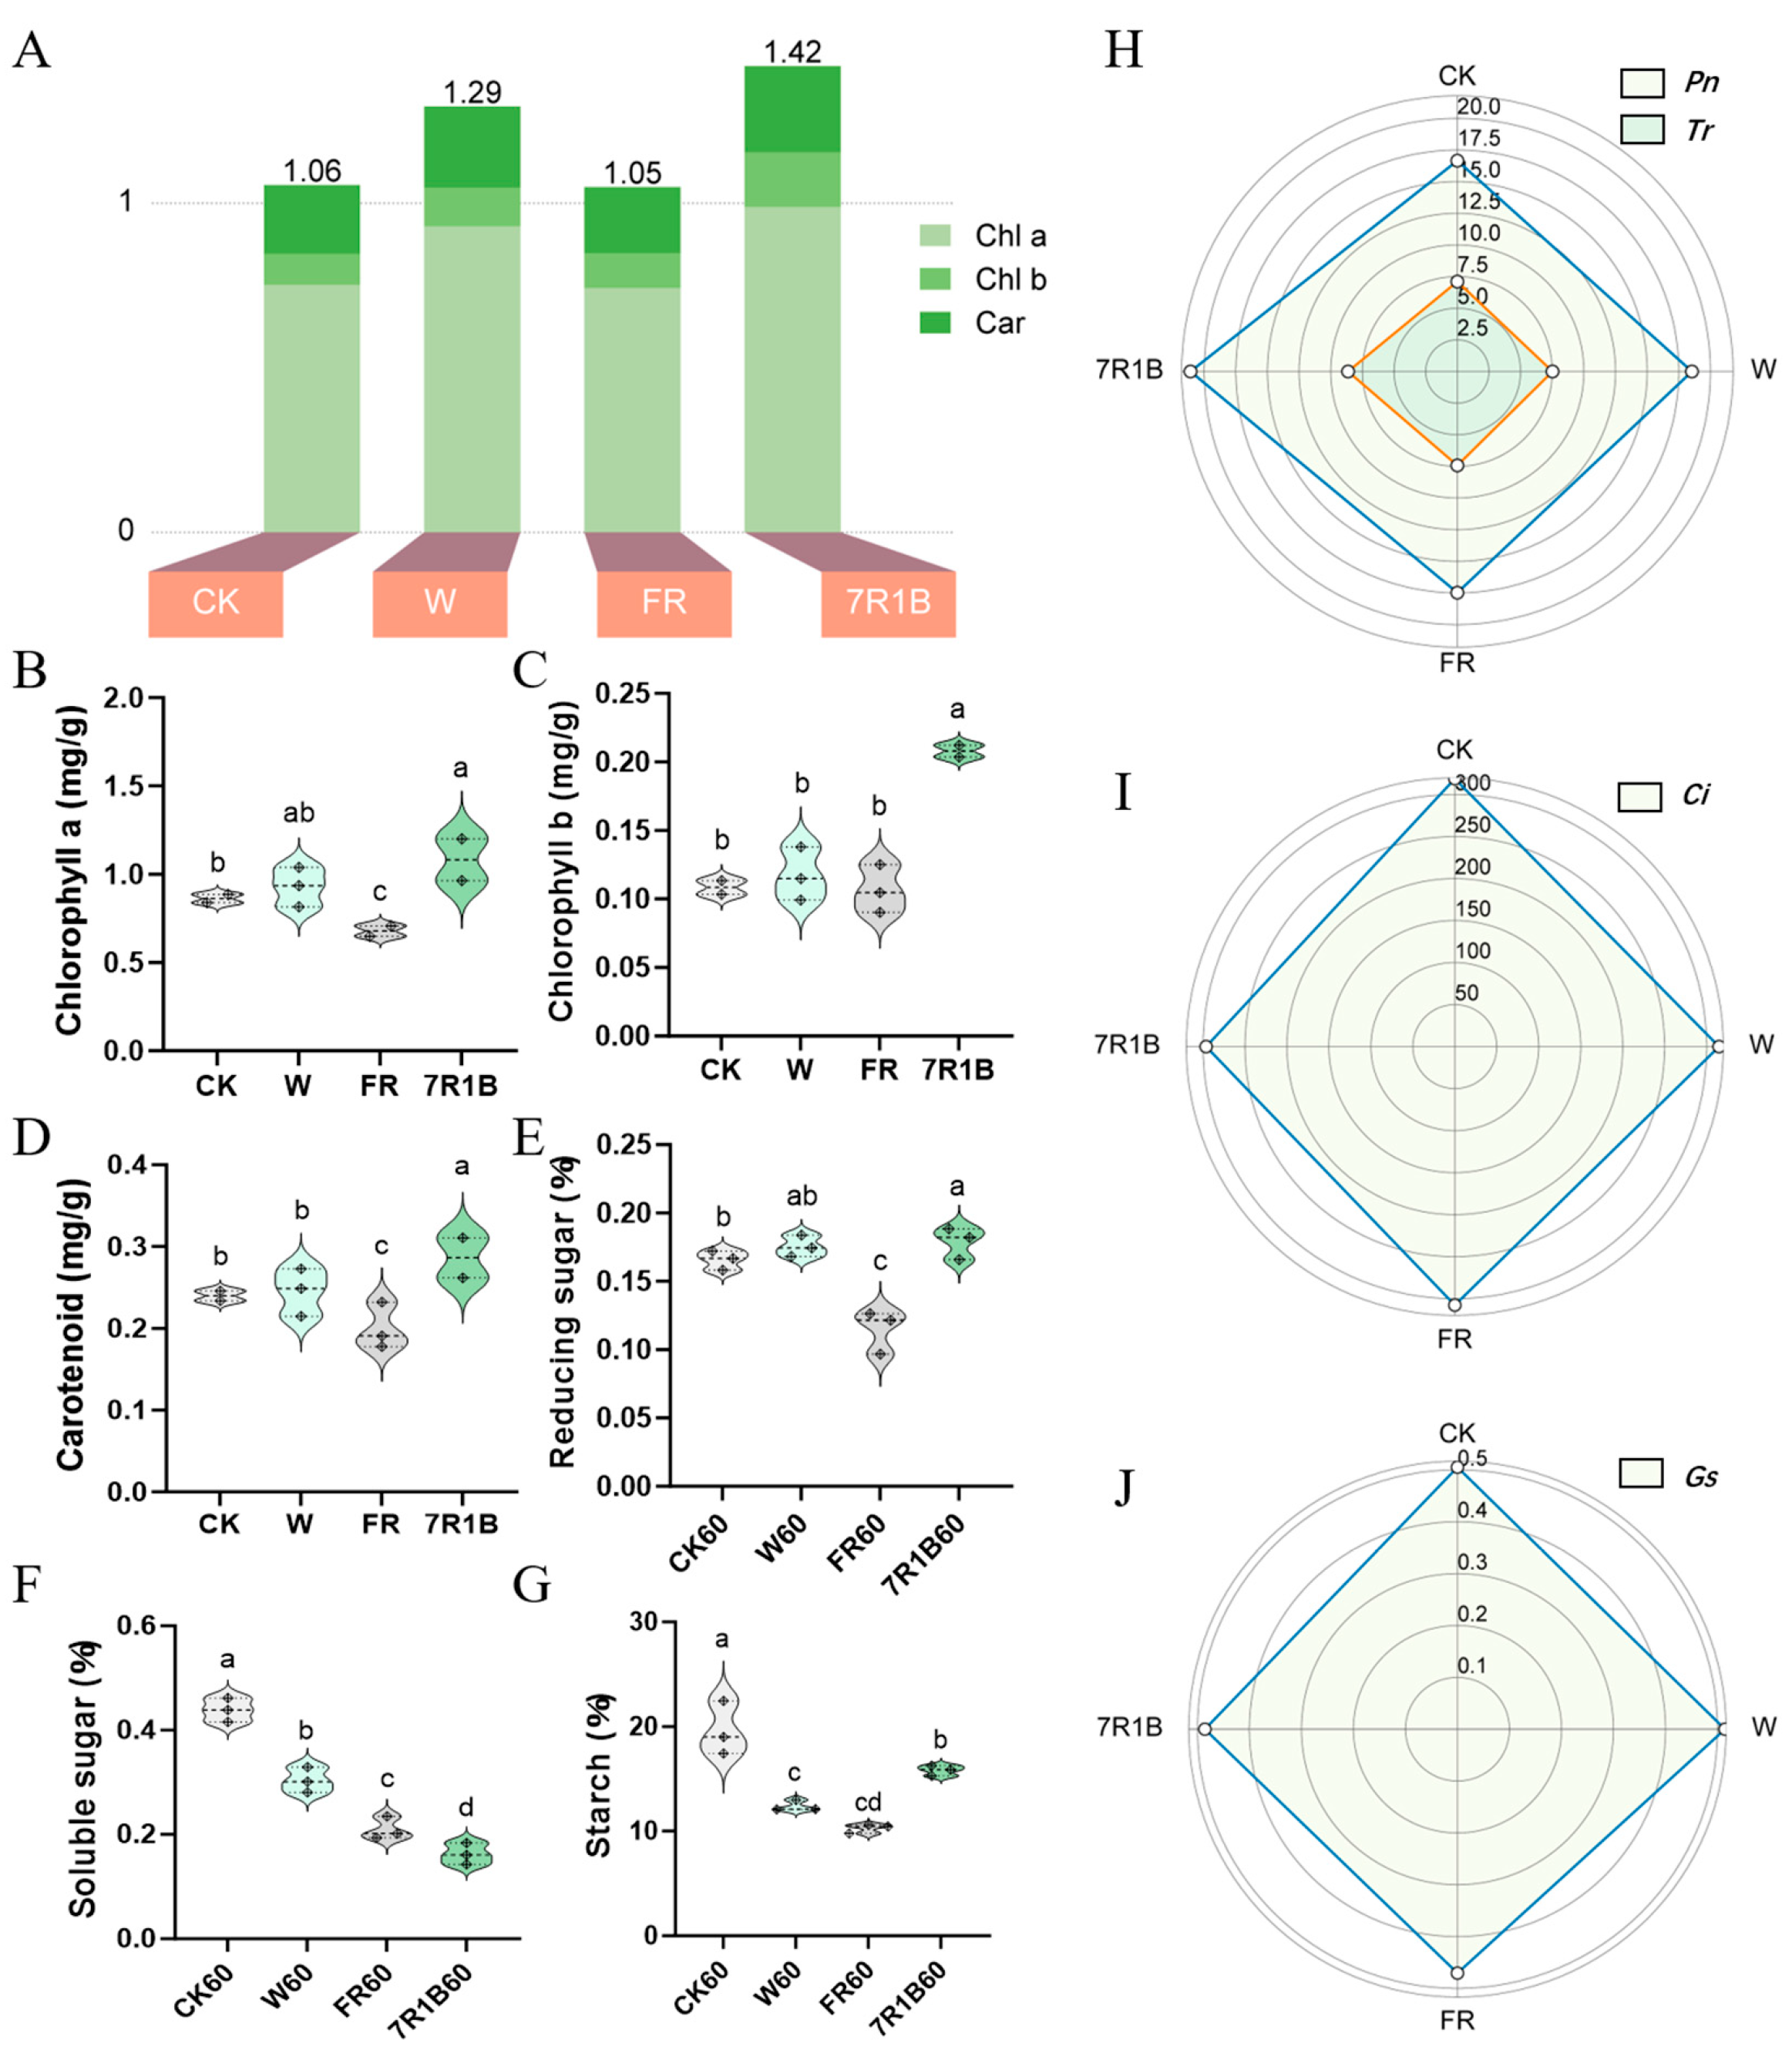
Since different supplemental light treatments significantly affected plant growth and yield, photosynthetic indices were measured to explore the underlying physiological mechanisms. After 30 days of treatment, light quality significantly affected photosynthetic pigment levels. Total pigment content was highest under 7R1B (1.42 mg/g), followed by W (1.29 mg/g); FR and CK did not differ significantly. Compared with CK, 7R1B significantly increased chlorophyll a, chlorophyll b, and carotenoid contents, whereas FR significantly reduced chlorophyll a and carotenoids (Figure 2A–D). Analysis of photosynthetic parameters showed that 7R1B markedly increased the net photosynthetic rate (Pn = 21.085 μmol CO2·m−2·s−1) and decreased intercellular CO2 concentration (Ci = 296.280 μmol·mol−1), while maintaining a transpiration rate (Tr = 8.633 g·m−2·h−1) similar to CK. W increased the net photosynthetic rate relative to CK but had little effect on other parameters. FR significantly decreased net photosynthesis while maintaining a high Ci (307.633 μmol·mol−1), suggesting non-stomatal limitations to photosynthesis. In summary, 7R1B improved photosynthetic performance by enhancing pigment content and CO2 use efficiency; FR accelerated pigment degradation and impaired photosynthetic capacity, and W produced limited benefits (Figure 2H–J).
In addition, to investigate whether different light qualities affect tuber quality, the contents of reducing sugars, soluble sugars, and starch in first-harvested tubers after 60 days of supplemental lighting were measured. The results showed that compared with the CK, the 7R1B treatment group had significantly higher reducing sugar content, but significantly lower soluble sugar and starch contents; the W treatment group showed no significant difference in reducing sugar content compared with the CK, but significantly lower soluble sugar and starch contents; the FR treatment group had significantly lower levels of all measured indicators compared with the CK (Figure 2E–G). Dry matter did not differ at 60 days. At 75 days, dry matter was highest under FR; at 90 days, dry matter was lowest under W, while 7R1B values were similar to CK and FR (Figure S2).

3.3. Effects of Light Quality on Endogenous Hormones

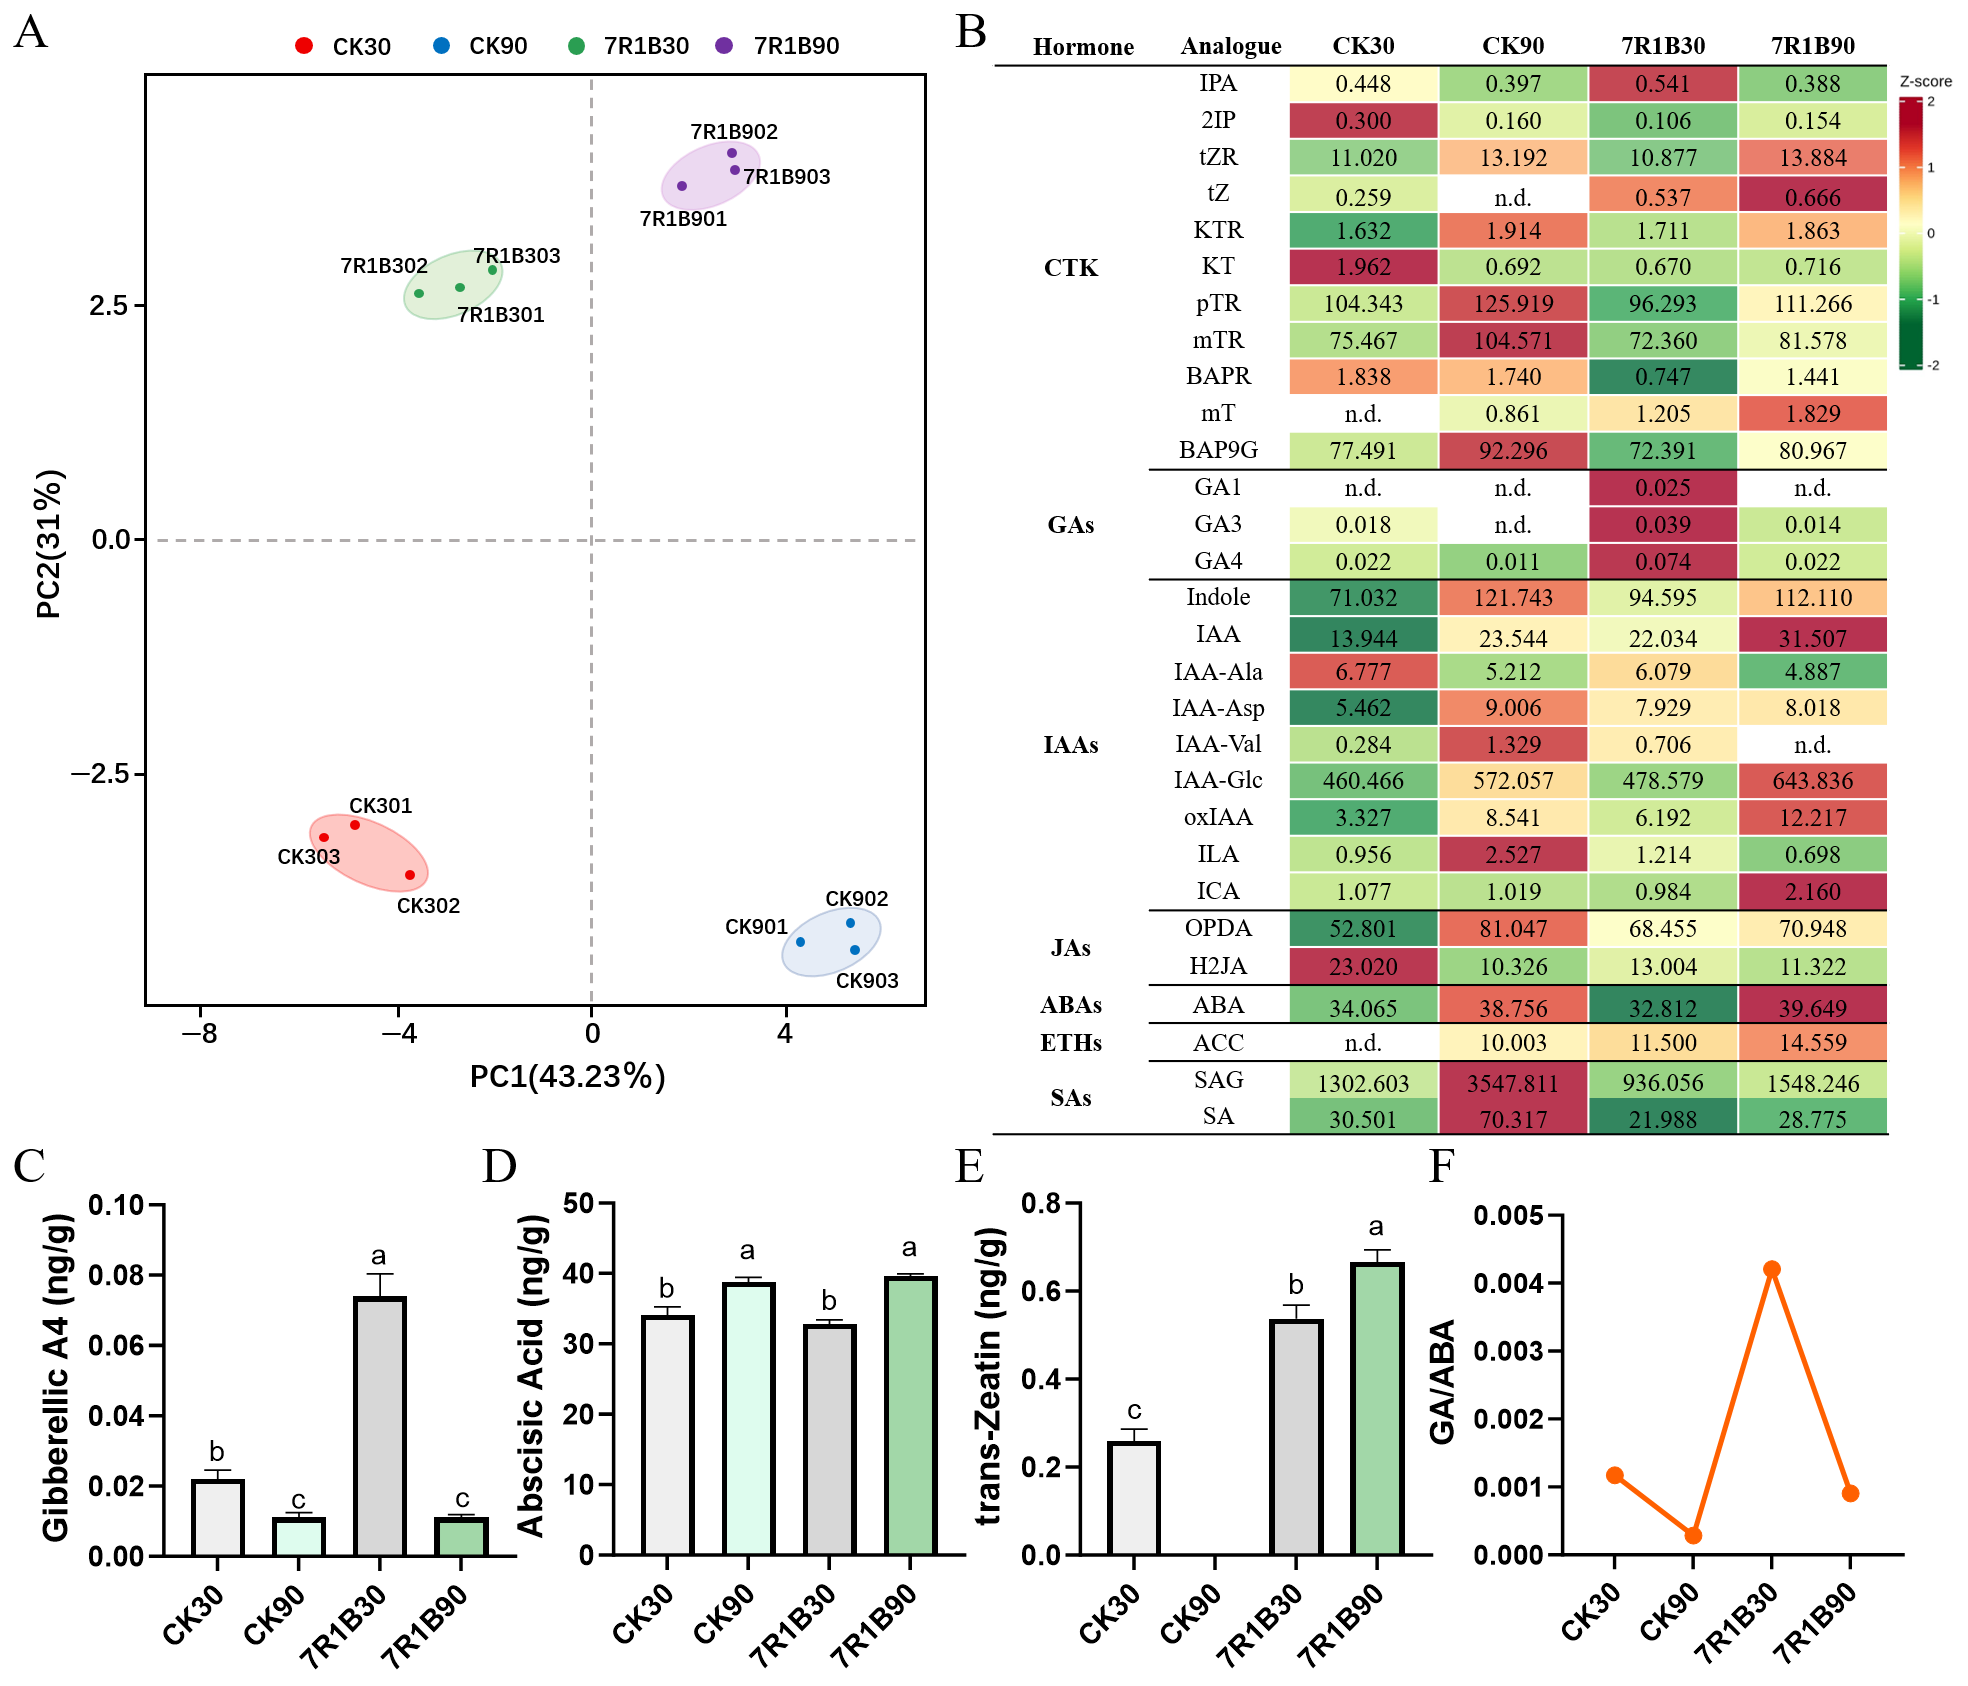
Given that the 7R1B treatment significantly affected plant growth and propagation efficiency, endogenous hormone contents were measured to determine whether this effect originated from changes in hormone levels. PCA showed clear separation among treatments and time points, indicating that both light quality and growth duration affected hormone composition (Figure 3A). Seven hormone classes were quantified: cytokinins (CTK), gibberellins (GAs), auxin, jasmonic acid (JAs), abscisic acid (ABAs), ethylene (ETHs), and salicylic acid (SAs) (Figure 3B). At 30 days, 7R1B significantly increased GA, IAA, and trans-zeatin (tZ) compared with CK, whereas ABA and tZ showed no significant changes. At 90 days, IAA remained higher under 7R1B; ABA remained unchanged. Notably, tZ was undetectable in CK at 90 days but remained at high levels under 7R1B, which may be associated with the reduced tZ content in CK, whereas cell division appeared to be sustained in 7R1B plants (Figure 3C–E). The GA/ABA ratio was highest under 7R1B at 30 days, consistent with strong early growth potential, but declined to control levels at 90 days due to reduced GA (Figure 3F). In addition, at 90 days of treatment, the contents of ABA and the ethylene precursor (1-aminocyclopropane-1-carboxylic acid, ACC) in both CK and 7R1B treatments increased compared with the earlier stage, albeit to different extents, whereas salicylic acid content showed a decreasing trend (Figure 3B).

3.4. Transcriptomic Responses to Light Quality

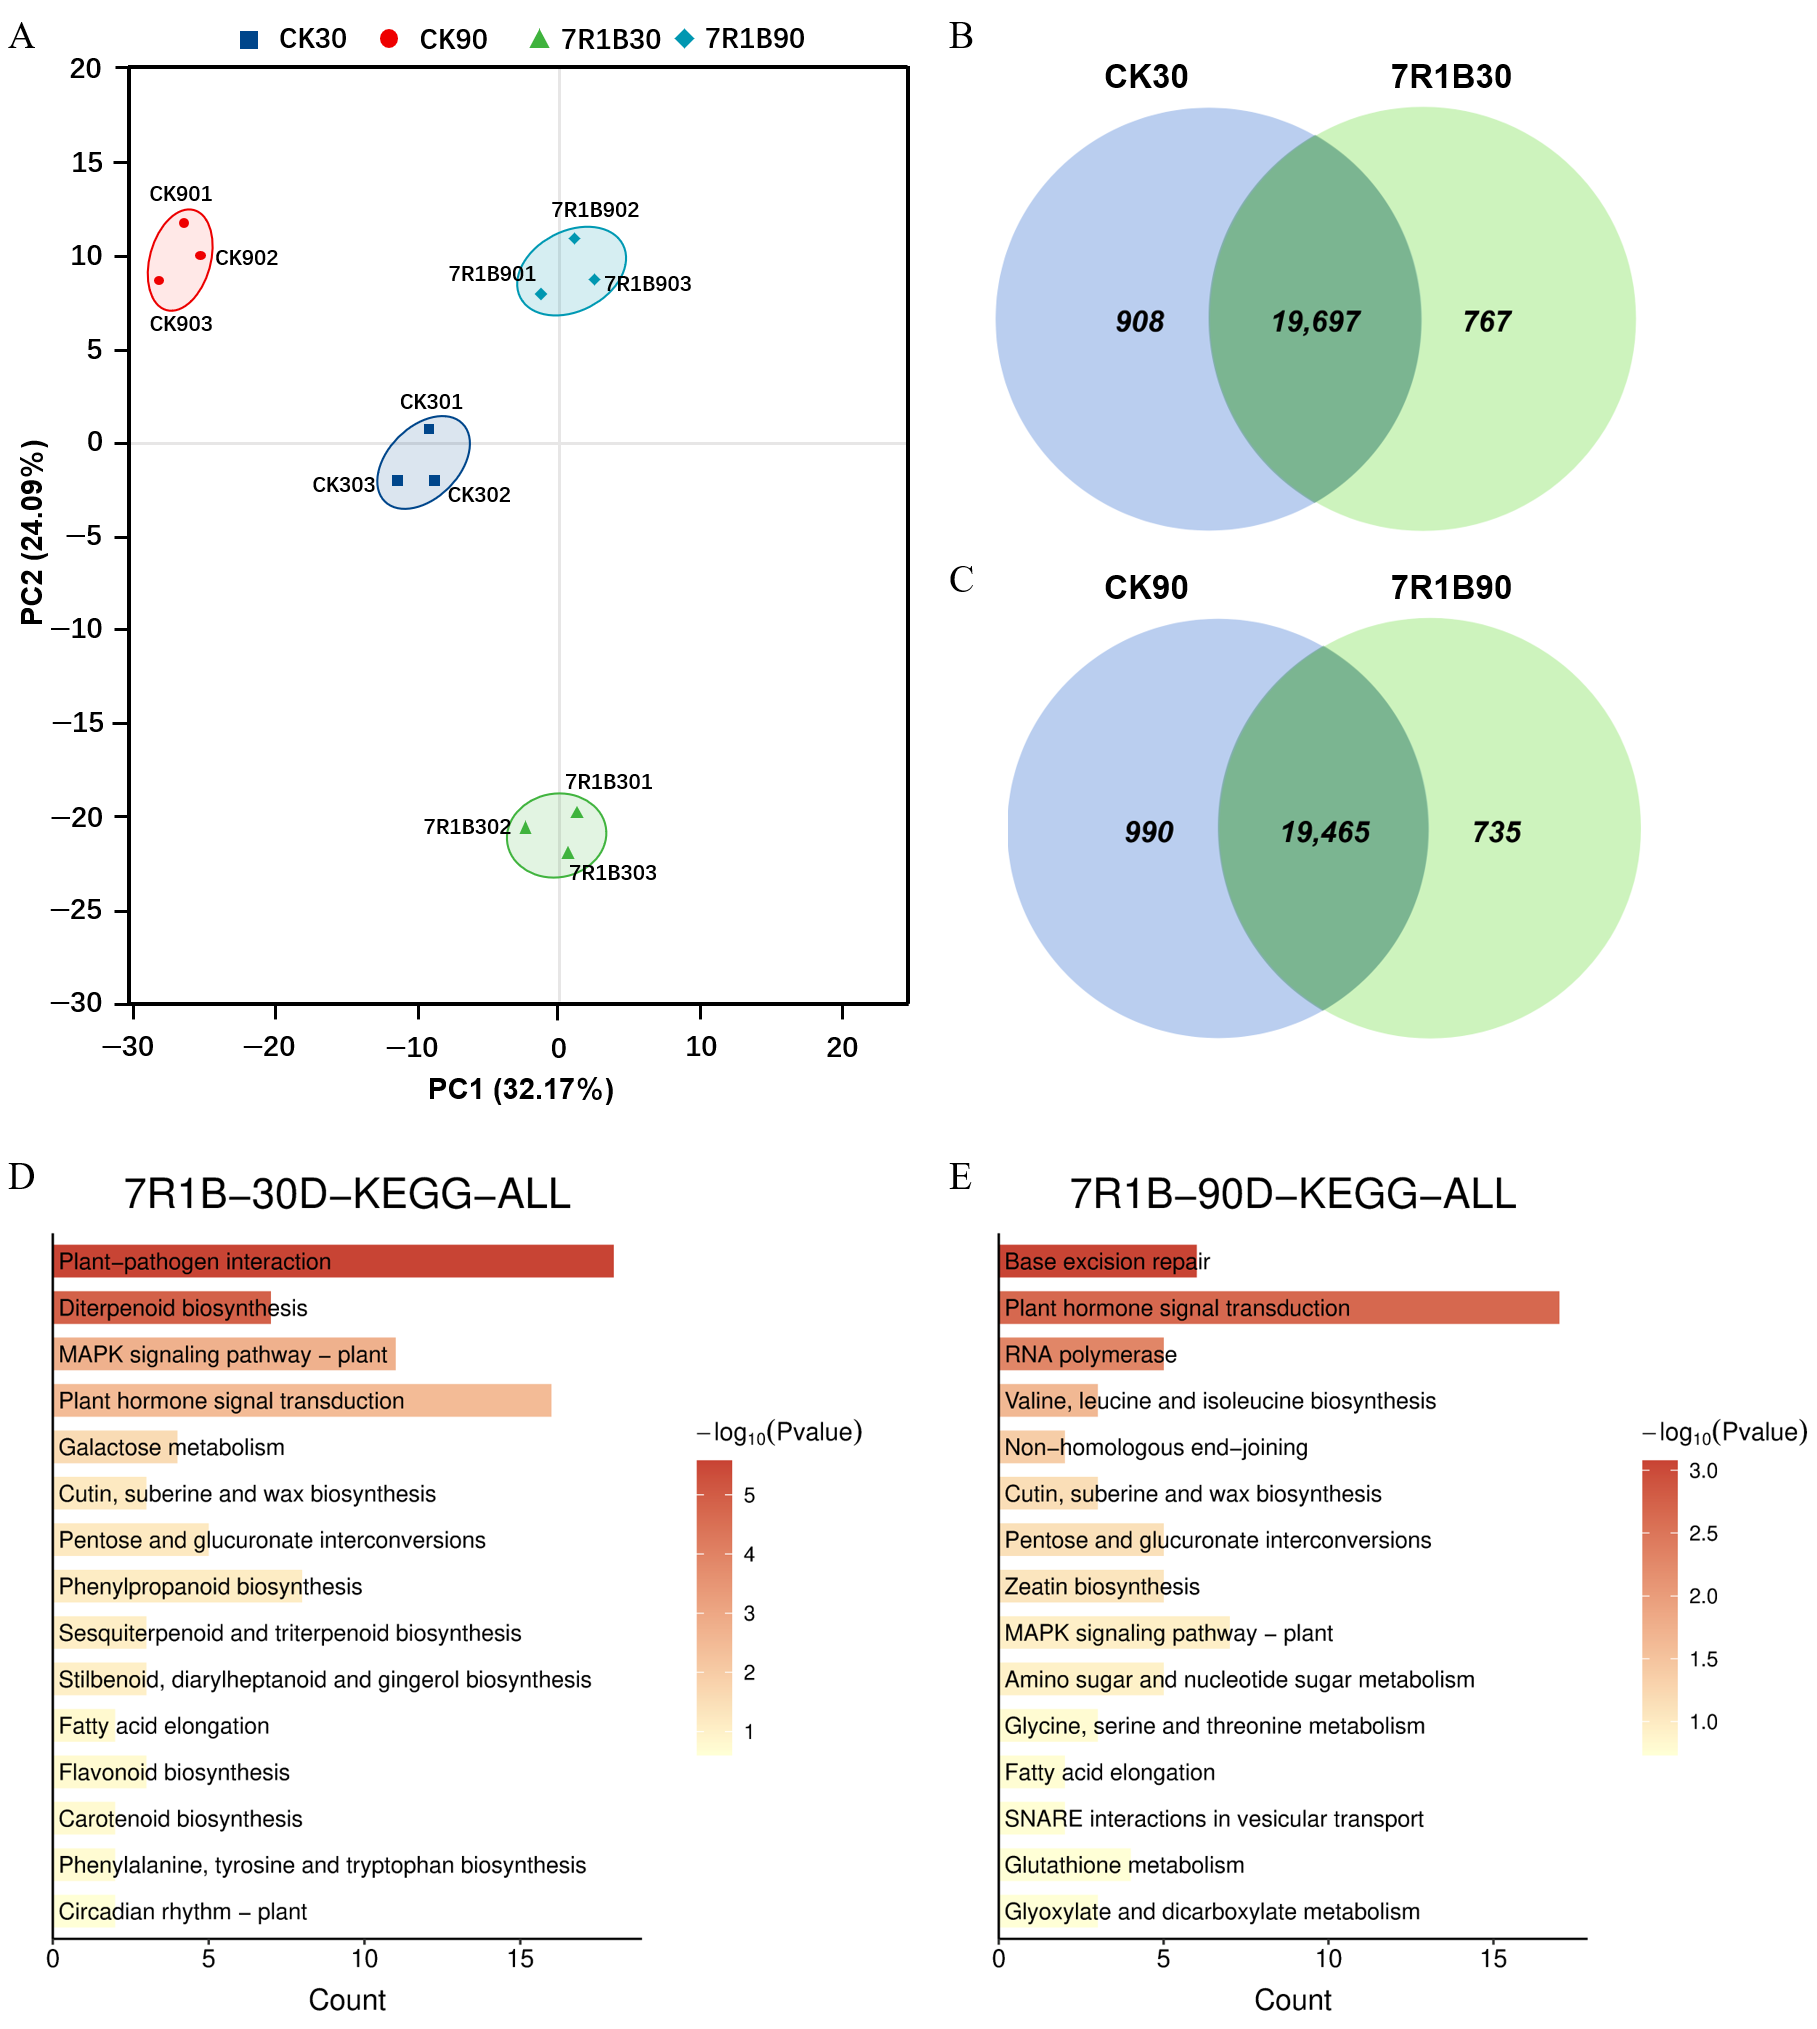
To elucidate molecular mechanisms, transcriptomes were compared at 30 and 90 days. PCA demonstrated tight within-group clustering and clear separation between groups, indicating good reproducibility (Figure 4A). Under the 7R1B treatment, compared with the corresponding CK controls, 767 and 735 treatment-specific differentially expressed genes were identified at 30 and 90 days, respectively (Figure 4B,C). The Venn diagrams illustrate the overlap of expressed genes across treatments, with shared genes in the overlapping regions and treatment-specific genes in the non-overlapping portions. GO enrichment at 30 days indicated DEGs associated with hormone response, multicellular organismal processes, and glucan metabolism; enriched cellular components included cell wall and plasma membrane; molecular functions included transcription regulator activity, glycosyltransferase activity, and transmembrane receptor activity. At 90 days, DEGs were additionally enriched in cell wall biogenesis, with molecular functions such as chitin binding, ribonuclease activity, and transferase activity (Figure S3A,B). KEGG enrichment at 30 days highlighted plant–pathogen interaction, diterpenoid biosynthesis, hormone signal transduction, and cutin/suberin/wax biosynthesis, suggesting active hormone signaling and preparatory defense responses (Figure 4D). At 90 days, hormone signal transduction was the most enriched pathway, together with base excision repair, RNA polymerase, and zeatin biosynthesis, suggesting possible roles in delayed visible senescence and altered hormone profiles (Figure 4E).
To investigate changes in potato plants under natural desiccation, GO and KEGG enrichment analyses were performed on samples grown naturally (CK) for 90 days. Compared with the supplementary light treatment, a total of 990 differentially expressed genes were identified at this stage. GO enrichment analysis revealed that the differentially expressed genes were mainly enriched in biological processes such as cell communication, signal transduction, and cell wall biogenesis; at the cellular component level, these genes were predominantly located in the cell wall and nuclear envelope; in terms of molecular function, they were highly involved in ion binding (copper/zinc ion) and hydrolase activity (Figure S4A). KEGG pathway analysis showed that the differentially expressed genes were significantly enriched in ABC transporters, autophagy, and plant–pathogen interaction pathways, and were also associated with fatty acid metabolism and plant hormone signal transduction (Figure S4B).

3.5. Pathway Analysis

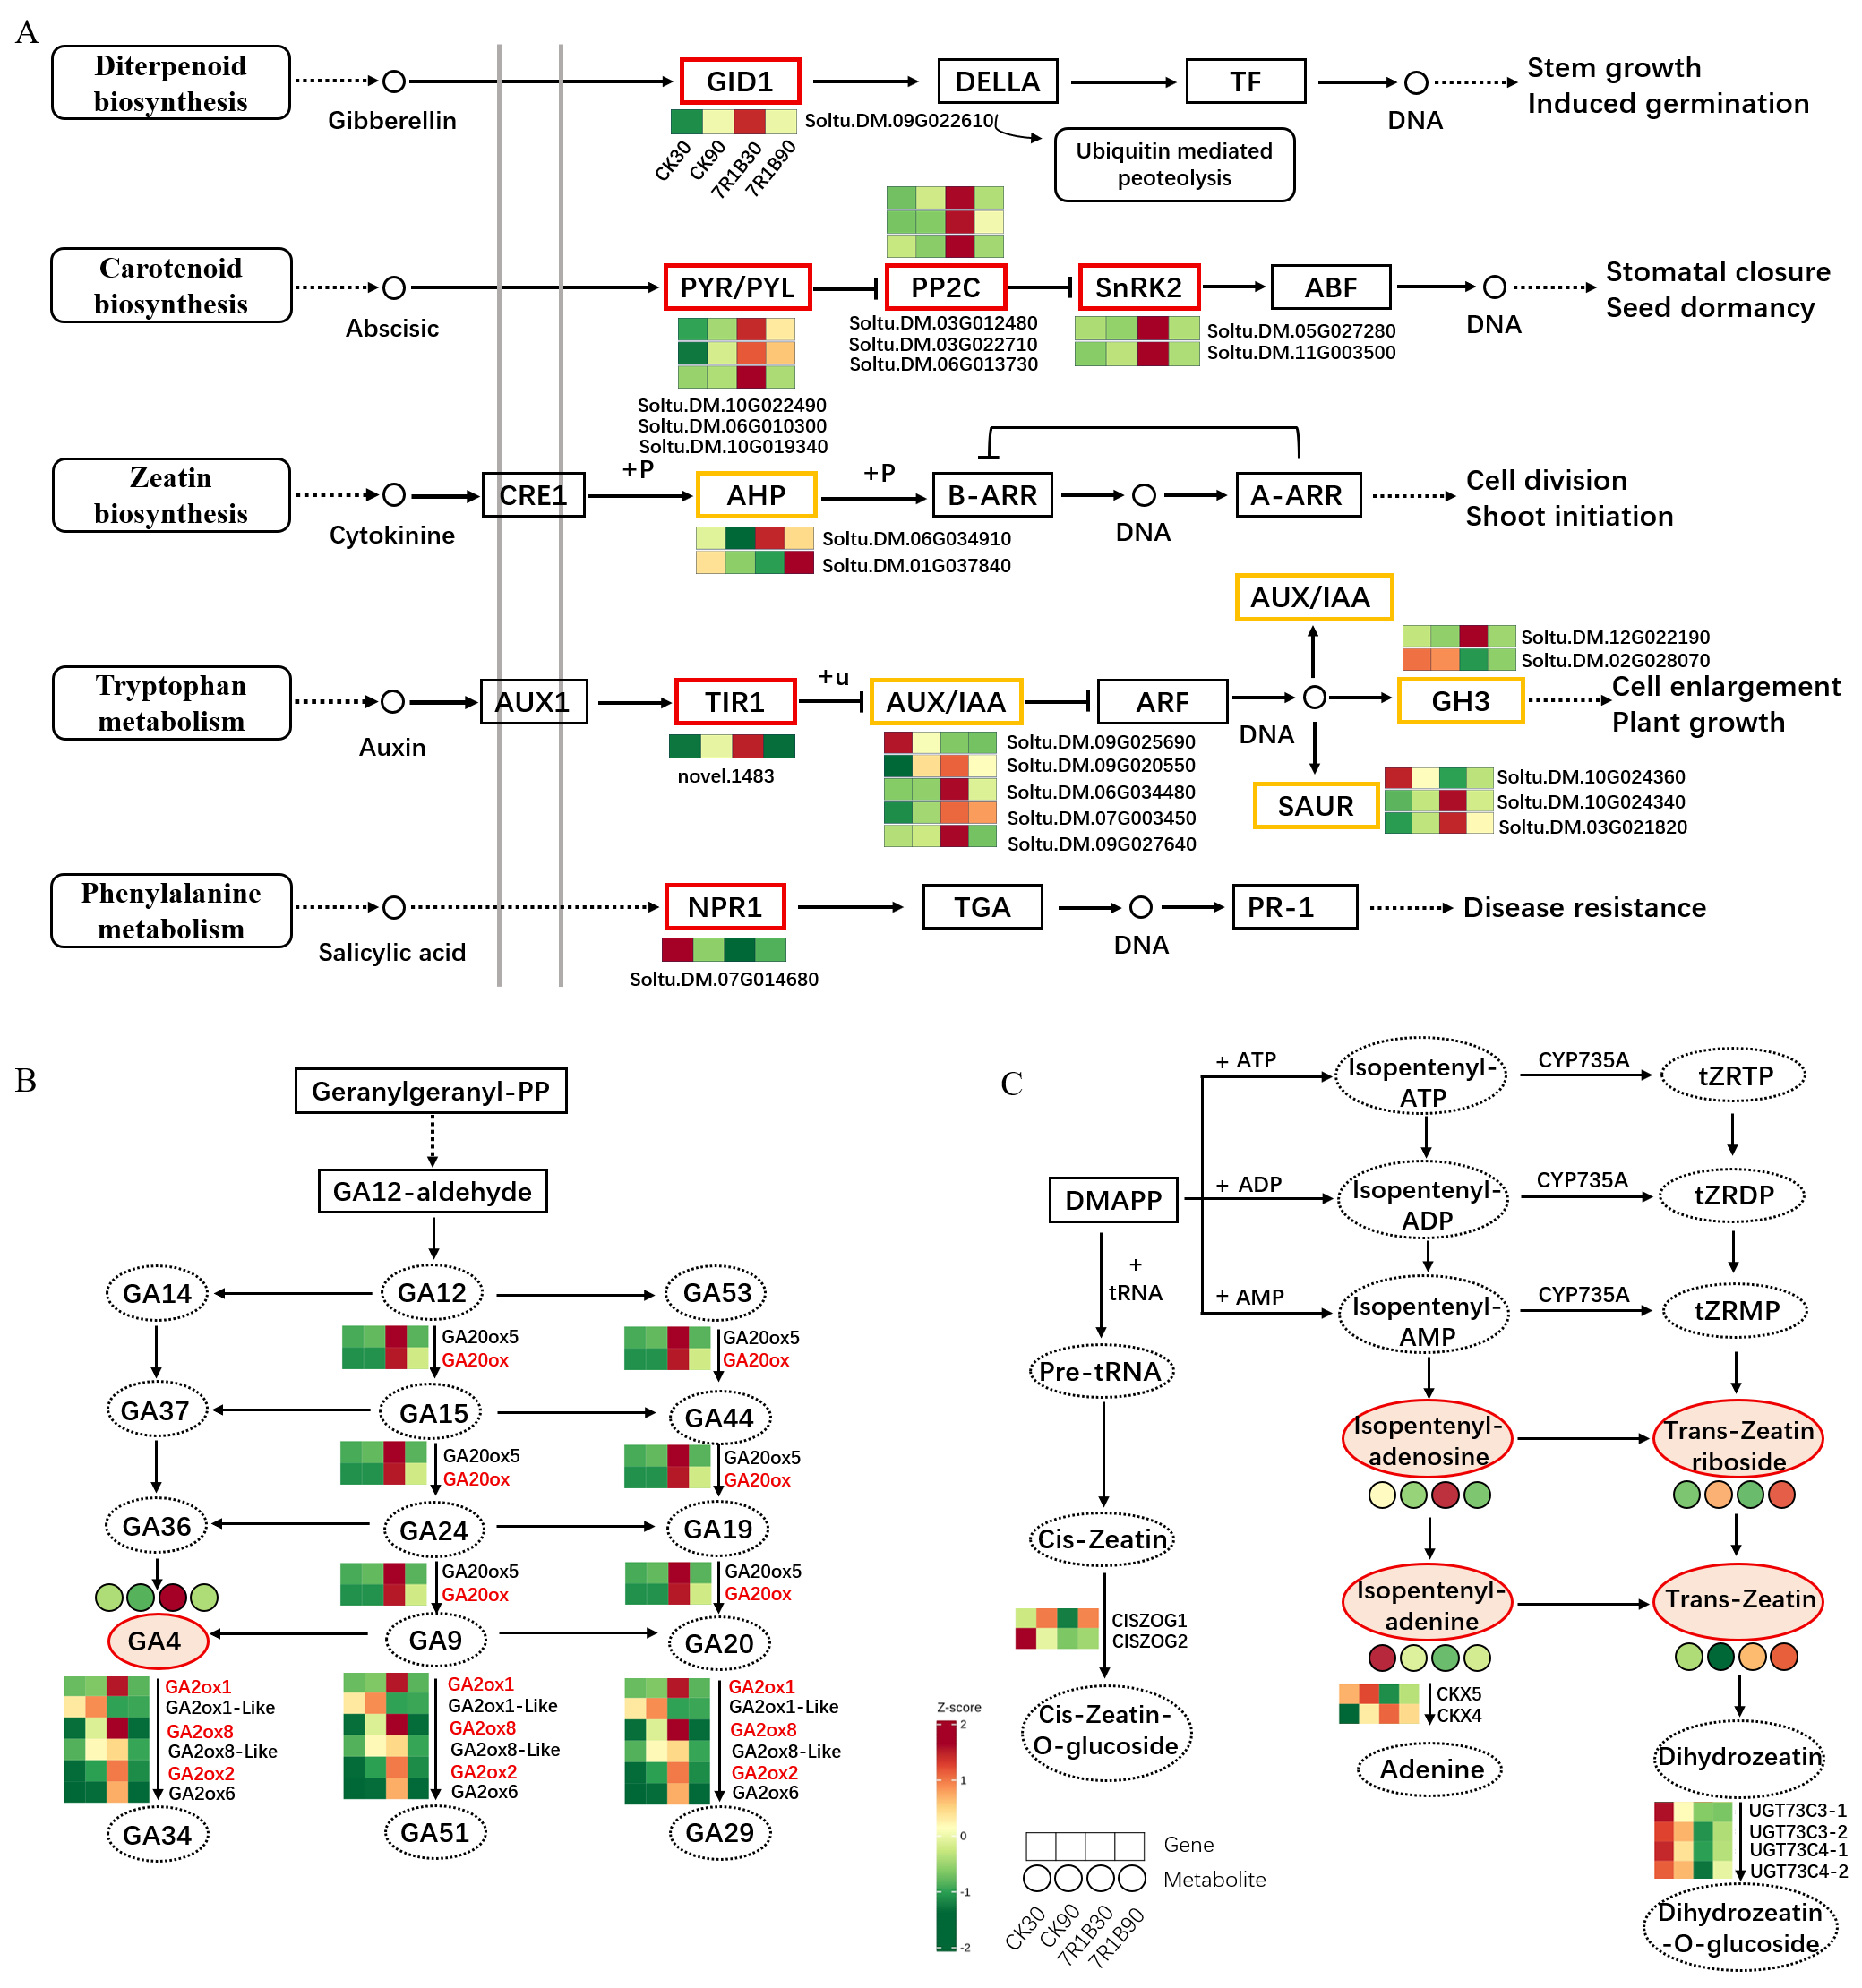
To investigate whether hormonal remodeling and transcriptional changes coordinately regulate yield formation, we performed an integrated analysis of hormone contents and transcriptomic profiles, and visualized the expression levels of genes involved in hormone biosynthesis, degradation, and related signaling pathways. Integrated analysis of hormone signaling-related genes showed that the GA receptor gene GID1 was upregulated in 7R1B at 30 days, a trend that coincided with elevated GA4 content. The expression of ABA signaling genes (PYR/PYL, PP2C, SnRK2) was downregulated at 90 days, potentially suppressing ABA signal transduction. Auxin transport and signaling genes (AUX1, TIR1, AUX/IAA, ARF, GH3, SAUR) were differentially expressed, possibly contributing to cell elongation and stem thickening. The SA receptor NPR1 was upregulated at 30 days, which may be associated with the activation of TGA-PR1 defense responses (Figure 5A). Regarding biosynthesis, GA20ox was upregulated at 30 days and partially downregulated at 90 days, consistent with the dynamic changes in GA4 content (Figure 5B). In zeatin metabolism, the inactivation gene UGT and the degradation gene CKX5 exhibited low expression levels under the 7R1B treatment, suggesting a possible association with the elevated zeatin content during the late supplemental lighting period. In addition, the cis-zeatin inactivation genes (CISZOG1/2) were also downregulated at 30 days (Figure 5C) (Table S3).
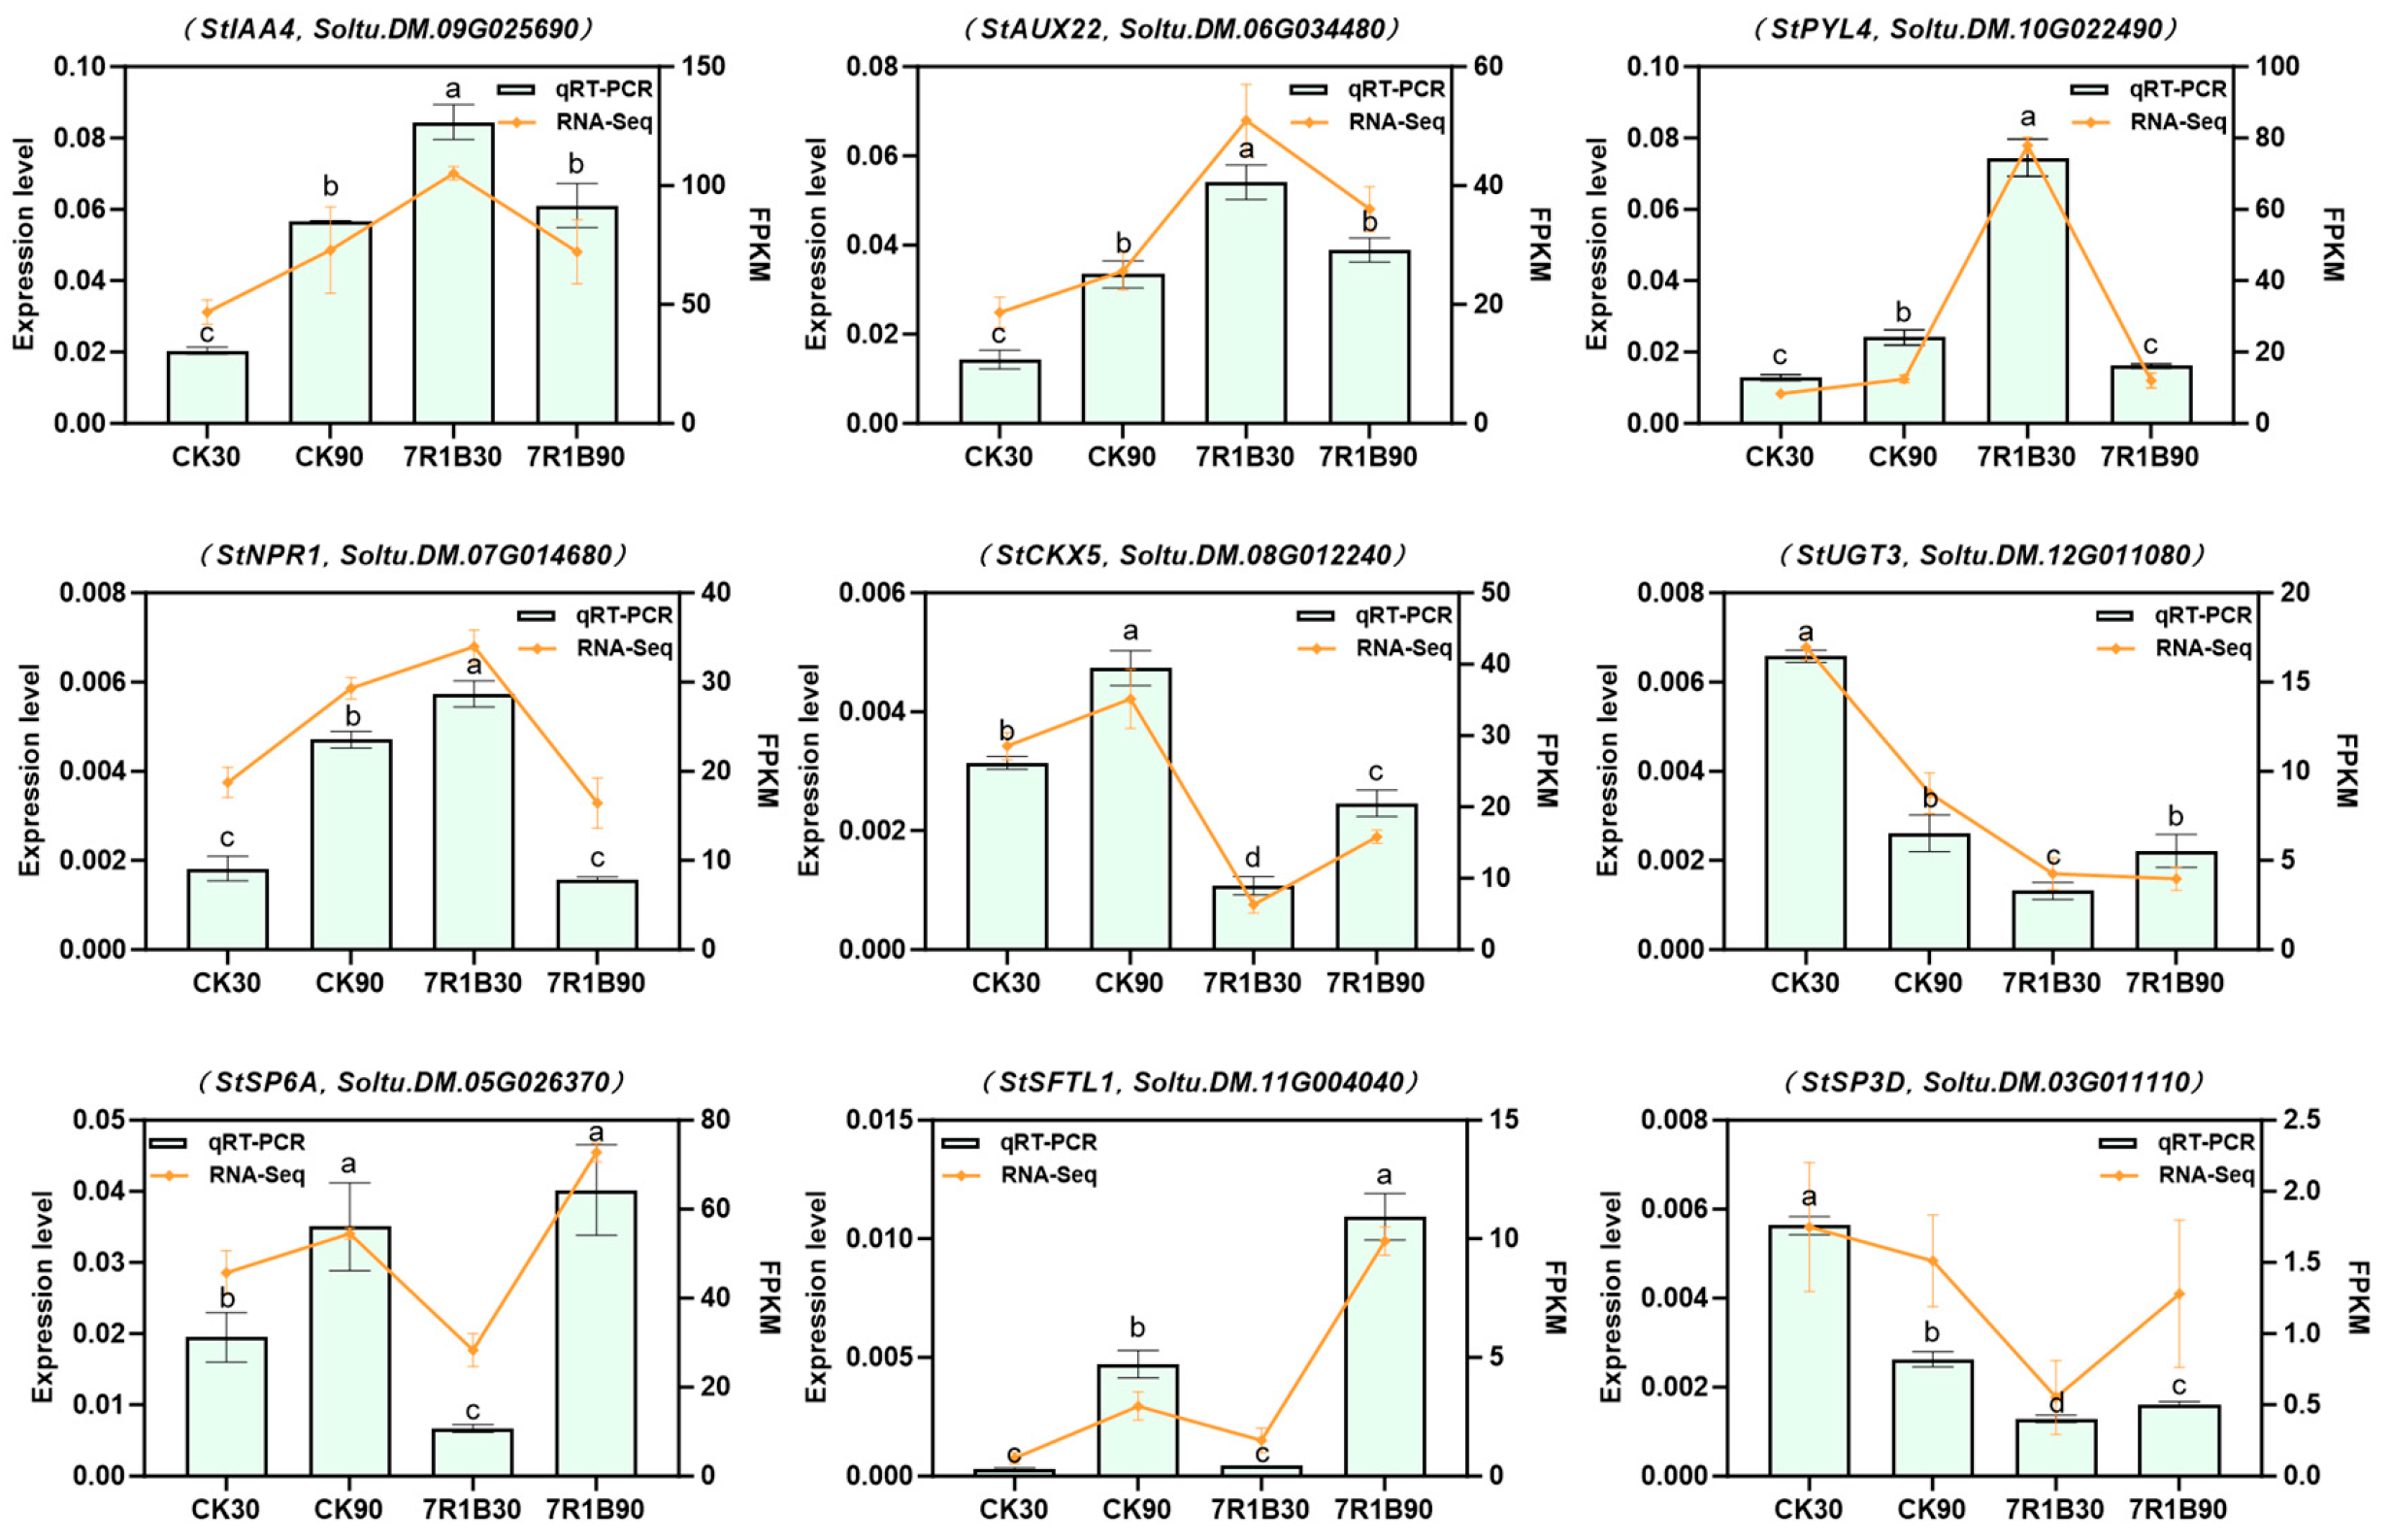
To verify the reliability of the transcriptome data, key genes were selected based on their expression patterns in the three aforementioned pathways (|log2 Fold Change| ≥ 3, adjusted p < 0.05) and subjected to qRT-PCR analysis. The results showed that, as the growth period progressed, the expression of auxin signaling genes (StIAA4, StAUX22), ABA signaling genes (StPYL4), and salicylic acid signaling pathway genes (StNPR1) increased in CK but decreased under the 7R1B treatment, with the highest expression levels observed at 30 days under the 7R1B treatment. The cytokinin inactivation-related gene StCKX5 increased in both CK and 7R1B treatments with advancing growth stage, but its expression level remained consistently lower under 7R1B than under CK. The zeatin inactivation gene StUGT3 decreased in CK, while no significant change was observed under the 7R1B treatment. The expression trends obtained from qRT-PCR were largely consistent with those from RNA-seq, confirming the reliability of the transcriptome expression data. In addition, the tuberization-related genes (StSP6A, StSP3D, and StFTL1) identified in the transcriptome data were also validated by qRT-PCR. The results showed that StSP6A and StFTL1 exhibited relatively low expression at 30 days under both CK and 7R1B treatments, but were significantly upregulated at 90 days, with higher expression levels under 7R1B than in CK. In contrast, StSP3D decreased in CK, while no significant change was observed under the 7R1B treatment. The expression patterns of StSP6A and StFTL1 were consistent with the observed increase in yield during the late growth period under red–blue light treatment, further supporting the conclusions of the previous yield-related analyses (Figure 6).

4. Discussion

4.1. Effects of Different Light Qualities on Growth and Propagation of Aeroponic Potato

This study demonstrated that different light qualities significantly regulate the growth and yield formation of aeroponically grown potato plants. First, plants under far-red (FR) treatment exhibited typical shade-avoidance responses, characterized by significantly increased plant height and reduced stem diameter (Figure 1B, Table S2). This response may be associated with the activation of phytochrome-mediated signaling pathways that prioritize allocating photosynthetic assimilates to stem elongation rather than biomass accumulation. This finding is consistent with previous studies [30] and similar phenomena observed in maize and soybean [31,32]. Under the red–blue light (7R1B) treatment, plants exhibited vigorous growth and increased yield. Previous studies have shown that red–blue light at various ratios promotes tuber formation, and the present study similarly observed increases in tuber number and yield, suggesting a strong correlation between these responses [17,18]. Notably, we also found that the 7R1B treatment extended the duration of leaf greening, a phenomenon that has not been reported in previous studies. Combined transcriptomic and metabolomic analyses suggested that the combination of red and blue light may extend the growth period through the coordinated regulation of photosynthesis-related gene expression, chlorophyll synthesis, and endogenous hormone balance [33], thereby prolonging the tuberization period and ultimately increasing yield [34,35]. In addition, white light has been reported to promote physiological development more evenly than single-spectrum light in other species [36]. In the present study, white light significantly enhanced plant growth compared with the control; however, its effects were less pronounced than those of the 7R1B treatment, and this did not result in a corresponding increase in yield. Interestingly, no significant differences were observed in the number of main stolons among treatments, suggesting that light quality may not directly regulate the initiation of main stolons [35], but rather affect tuber yield by influencing source–sink allocation of photosynthetic assimilates or the number of secondary stolons (Figure 1B and Figure S1A–D). The specific underlying mechanisms remain unclear, which represents a limitation of this study and warrants further investigation.
Notably, although the 7R1B treatment significantly increased yield, it also induced marked changes in tuber quality traits, including significantly lower starch content and significantly higher reducing sugar content compared with the control. For fresh consumption or frying processing, high reducing sugar content is generally considered an undesirable trait [37]. However, since the present study aimed to produce seed potatoes rather than table-stock potatoes—and seed potatoes are not typically consumed directly—the impact of this trait is relatively limited. The reduction in tuber dry matter content under the 7R1B treatment may be attributed to the delayed leaf senescence and sustained aboveground growth during the late tuberization stage, which maintained a strong competitive capacity for assimilates. As a result, a greater proportion of photoassimilates was allocated to aboveground organs rather than transported to tubers. Such an alteration in source–sink relationships may have reduced starch synthesis efficiency in tubers while promoting the accumulation of reducing sugars [38]. Therefore, although the 7R1B treatment significantly increased tuber number and fresh weight yield, its effects on tuber quality should be comprehensively evaluated in the context of seed potato production (Figure 2D–F and Figure S2).

4.2. Red–Blue Light Enhances Photosynthetic Performance and Assimilate Partitioning in Aeroponic Potato

Light quality strongly influences the composition and function of the photosynthetic apparatus, thereby affecting assimilate production and growth. Under 7R1B, chlorophyll a, chlorophyll b, and carotenoid levels increased, net photosynthetic rate improved, and intercellular CO2 concentration decreased, consistent with enhanced pigment synthesis and CO2 use efficiency [39,40]. From the perspective of light perception mechanisms, red light is primarily perceived by phytochromes, which regulate the expression of photosynthesis-related genes, whereas blue light is perceived by cryptochromes and phototropins, mediating stomatal opening and chloroplast movements [41]. The combination of red and blue light may synergistically activate these phototransduction pathways, promoting the upregulation of chlorophyll biosynthesis-related genes (such as HEMA1 and GSA), while optimizing stomatal conductance and light capture efficiency, thereby enhancing photosynthetic rate [42]. These findings align with previous reports that red–blue LEDs elevate chlorophyll content in potato and that a high red fraction can raise photosynthetic and transpiration rates in other crops [16,43]. In contrast, FR treatment reduced pigment content and net photosynthetic rate [44], which may be associated with reduced photosynthetic electron transport chain activity induced by shade avoidance responses triggered by far-red light [45]. In terms of agronomic traits, the 7R1B treatment maintained greater plant height, stem diameter, and root vigor from 60 to 90 days, and exhibited prolonged leaf greening compared with CK and FR. It is therefore inferred that red–blue light may sustain photosynthetic activity for a longer period, thereby generating more assimilates to support tuber development (Figure 2) [46].

4.3. Hormone Network Remodeling and Transcriptional Reprogramming Under Red–Blue Light

Previous studies have shown that higher GA content promotes vegetative growth and stolon elongation [47,48]. In the present study, the 7R1B treatment exhibited higher GA content and GA/ABA ratio at 30 days, which was consistent with the vigorous growth phenotype. At the late growth stage, GA content declined, and ABA signaling was suppressed under this treatment, whereas tZ remained at a relatively high level, suggesting that cytokinin-mediated cell division may have persisted. This is consistent with previous reports on cytokinin-mediated delay of senescence [49,50]. Transcriptomic data support these observations: GID1 was upregulated at 30 days, ABA signaling components were downregulated at 90 days, and cytokinin catabolic genes (CKX5, CISZOG1/2) were repressed under 7R1B, collectively favoring prolonged growth and tuber bulking [51,52]. These findings suggest that 7R1B modulates hormone balance in a stage-specific manner, promoting vegetative growth at the early stage and sustaining cytokinin-driven cell division activity at the late stage, rather than simply upregulating or downregulating a single class of hormones globally.
In addition, the enrichment of DNA repair pathways at 90 days under the 7R1B treatment may be associated with the delayed senescence phenotype. The downregulation of cytokinin inactivation genes and upregulation of signaling-related genes coincided with the sustained accumulation of tZ, which may have provided favorable conditions for continuous tuber bulking [53]. The enrichment of cutin and suberin pathways further suggested a possible enhancement of epidermal barrier function and stress tolerance (Figure 4E) [54]. It should be noted that the transcriptomic differences among treatments at 90 days may partly reflect differences in developmental or senescence stages, rather than being directly attributed solely to spectral quality. Collectively, red–blue light may orchestrate a multi-level regulatory network encompassing light perception, hormonal remodeling, and temporal changes in gene expression, which may be closely associated with the growth and tuberization of aeroponically grown potato plants.

5. Conclusions

This study aimed to compare the regulatory effects of different light qualities on the growth and yield of aeroponically grown potato plants, and to explore the potential mechanisms by which the 7R1B treatment enhances seed potato propagation efficiency. The results showed that the 7R1B treatment increased photosynthetic pigment content and net photosynthetic rate, prolonged leaf greening duration and the effective tuberization period, and simultaneously increased tuber number and yield per plant. Integrated omics analyses revealed that the 7R1B treatment dynamically regulated the balance of GA, ABA, and tZ, delayed the expression timing of tuberization-related genes, and was closely associated with delayed senescence processes. This study has certain limitations, including the use of only one cultivar (Chuanyu 56) and differences in facility conditions and experimental seasons compared with other reports. Nevertheless, these differences may also be considered as innovative aspects of this study. Future research could be extended to functional validation of candidate genes, direct assessment of senescence-related traits, replication across cultivars and seasons, and comprehensive evaluation of energy consumption and economic feasibility. In summary, the 7R1B treatment showed potential to improve minituber yield in aeroponic culture under the present experimental conditions, and its effects may be associated with enhanced photosynthesis, delayed visible senescence, altered hormone profiles, and changed transcriptional regulatory networks. However, its applicability and economic viability in different production systems require further investigation.

Supplementary Materials

The following supporting information can be downloaded at: https://www.mdpi.com/article/10.3390/horticulturae12080954/s1. Figure S1. Dynamic effects of different light quality treatments on growth traits of aeroponically grown potato plants. Figure S2. Effects of different light quality treatments on dry matter content of potato tubers at different growth stages. Figure S3. GO functional enrichment analysis of differentially expressed genes at 30 and 90 days under red–blue light treatment. Figure S4. GO and KEGG enrichment analyses of differentially expressed genes in potato plants of the CK group at 90 days. Table S1. Quantitative real-time PCR primers for differentially expressed genes in the transcriptome. Table S2: Agronomic traits and yield-related parameters. Table S3. Pathway-related gene information.

Author Contributions

Data curation, formal analysis, investigation, writing—original draft, S.T.; investigation, validation, M.T.; investigation, G.W.; investigation, B.L.; investigation, J.F.; resources, J.H.; resources, conceptualization, supervision, K.W.; conceptualization, funding acquisition, project administration, supervision, writing—review and editing, Q.W. All authors have read and agreed to the published version of the manuscript.

Funding

This work was supported by the Sichuan Potato Innovation Team Project of the Chinese Modern Agricultural Industrial Technology System (Grant No. SCCXTD-2026-09), the Open Project Program of Panxi Crop Improvement Key Laboratory of Sichuan Province (Grant No. SZKF2204), and the Pilot-scale Commercialization and Maturation Project of the Sichuan Academy of Agricultural Sciences (2026ZSSFGH02).

Data Availability Statement

The data presented in this study are openly available in the National Genomics Data Center (NGDC; https://ngdc.cncb.ac.cn; CRA041176). Additionally, all other datasets generated for this study are included in the article/Supplementary Materials.

Conflicts of Interest

The authors declare no conflicts of interest.

Abbreviations

The following abbreviations are used in this manuscript:
GAGibberellin
ABAAbscisic acid
IAAAuxin
CTKCytokinin
Chl aChlorophyll a
Chl bChlorophyll b
CarCarotenoid
CKControl
FRFar-red
WWhite
7R1B7Red-1blue
PnPhotosynthetic rate
TrTranspiration
CiCO2 concentration
GsConductance
tZTrans-zeatin
DEGDifferentially expressed gene
PPFDPhotosynthetic photo flux density

References

  1. Dulay, A.C.; Somera-Almerol, C.G.G.; Badua, S.A.; Fabula, J.V.; Mateo, W.C. Influence of led supplemental lighting on aeroponic potato (Solanum tuberosum L.) minitubers production. Asian J. Agric. Rural. Dev. 2025, 15, 502–509. [Google Scholar] [CrossRef]
  2. Naik, P.S.; Buckseth, T. Recent Advances in Virus Elimination and Tissue Culture for Quality Potato Seed Production. In Biotechnologies of Crop Improvement; Gosal, S.S., Wani, S.H., Eds.; Volume 1: Cellular Approaches; Springer International Publishing: Cham, Switzerland, 2018; pp. 131–158. [Google Scholar] [CrossRef]
  3. Sadawarti, M.J.; Singh, S.P.; Buckseth, T.; Kumar, V.; Singh, R.K.; Sharma, A.K.; Katare, S.; Jatav, P.; Deora, D.; Khambalkar, P.; et al. Augmenting seed potato production through integration of aeroponics, apical rooted cuttings and sprout cutting techniques: A comprehensive review. Agric. Res. 2026; in press. [CrossRef]
  4. Rahman, M.H.; Islam, M.J.; Mumu, U.H.; Ryu, B.R.; Lim, J.-D.; Azad, M.O.K.; Cheong, E.J.; Lim, Y.S. Effect of light quality on seed potato (Solanum tuberosum L.) tuberization when aeroponically grown in a controlled greenhouse. Plants 2024, 13, 737. [Google Scholar] [CrossRef] [PubMed]
  5. Oh, J.; Park, E.; Song, K.; Bae, G.; Choi, G. PHYTOCHROME INTERACTING FACTOR8 inhibits phytochrome A-mediated far-red light responses in Arabidopsis. Plant Cell 2020, 32, 186–205. [Google Scholar] [CrossRef] [PubMed]
  6. Yin, C.P.; Shi, Z.J.; Tian, C.; Chen, C.C.; Li, D.X.; Dong, W.X.; Zhang, Y.C. Effects of red and blue light on photosynthetic carbon assimilation and growth-development in plants: A review. Ying Yong Sheng Tai Xue Bao 2025, 36, 2246–2256. [Google Scholar] [CrossRef] [PubMed]
  7. He, W.; Pu, M.; Li, J.; Xu, Z.-G.; Gan, L. Potato tuber growth and yield under red and blue LEDs in plant factories. J. Plant Growth Regul. 2022, 41, 40–51. [Google Scholar] [CrossRef]
  8. Kozai, T.; Niu, G.; Takagaki, M. (Eds.) Plant Factory: An Indoor Vertical Farming System for Efficient Quality Food Production; Academic Press: Cambridge, MA, USA, 2015. [Google Scholar] [CrossRef]
  9. Chen, L.; Wang, H.; Gong, X.; Zeng, Z.; Xue, X.; Hu, Y. Transcriptome analysis reveals effects of red and blue light-emitting diodes (LEDs) on the growth, chlorophyll fluorescence and endogenous plant hormones of potato (Solanum tuberosum L.) plantlets cultured in vitro. J. Integr. Agric. 2021, 20, 2914–2931. [Google Scholar] [CrossRef]
  10. Aksenova, N.P.; Sergeeva, L.; Kolachevskaya, O.O.; Romanov, G.A. Hormonal Regulation of Tuber Formation in Potato. In Bulbous Plants: Biotechnology; Ramawat, K.G., Merillon, J.M., Eds.; CRC Press: New York, NY, USA, 2013. [Google Scholar] [CrossRef]
  11. Wang, J.; Jin, D.; Deng, Z.; Zheng, L.; Guo, P.; Ji, Y.; Song, Z.; Zeng, H.Y.; Kinoshita, T.; Liao, Z.; et al. The apoplastic pH is a key determinant in the hypocotyl growth response to auxin dosage and light. Nat. Plants 2025, 11, 279–294. [Google Scholar] [CrossRef] [PubMed]
  12. Yang, W.; Cortijo, S.; Korsbo, N.; Roszak, P.; Schiessl, K.; Gurzadyan, A.; Wightman, R.; Jonsson, H.; Meyerowitz, E. Molecular mechanism of cytokinin-activated cell division in Arabidopsis. Science 2021, 371, 1350–1355. [Google Scholar] [CrossRef] [PubMed]
  13. Li, Y.; Liu, Z.; Shi, Q.; Yang, F.; Wei, M. Mixed red and blue light promotes tomato seedlings growth by influencing leaf anatomy, photosynthesis, CO2 assimilation and endogenous hormones. Sci. Hortic. 2021, 290, 110500. [Google Scholar] [CrossRef]
  14. Aalifar, M.; Aliniaeifard, S.; Arab, M.; Mehrjerdi, M.Z.; Serek, M. Blue light postpones senescence of carnation flowers through regulation of ethylene and abscisic acid pathway-related genes. Plant Physiol. Biochem. 2020, 151, 103–112. [Google Scholar] [CrossRef] [PubMed]
  15. He, W.; Chai, Q.; Zhang, D.; Li, W.; Zhao, C.; Yin, W.; Fan, H.; Yu, A.; Hu, F.; Fan, Z. Beneficial effects of red and blue light on potato leaf antioxidant capacity and tuber bulking. Physiol. Mol. Biol. Plants 2023, 29, 513–523. [Google Scholar] [CrossRef] [PubMed]
  16. Jiang, L.; Wang, Z.; Jin, G.; Lu, D.; Li, X. Responses of favorita potato plantlets cultured in vitro under fluorescent and light-emitting diode (LED) light sources. Am. J. Potato Res. 2019, 96, 396–402. [Google Scholar] [CrossRef]
  17. Lin, J.; Chen, S.; Xu, Z. Effects of different ratios of red and blue light on tuber formation and yield of potato. Nanjing Agric. Univ. 2023, 46, 447–453. [Google Scholar] [CrossRef]
  18. Tang, D.; Zhang, X.; Wang, J.; Jiang, Y.; Jing, F.; Luo, Y.; Bai, H.; Huang, T.; Shu, J.; Chen, Y. Effect of different LED light qualities on the photosynthesis and tuberization of virus-free potato in hydroponic culture. Acta Hortic. Sin. 2017, 44, 691–702. [Google Scholar] [CrossRef]
  19. Farhangi, H.; Mozafari, V.; Roosta, H.R.; Shirani, H.; Farhangi, S.; Farhangi, M. Optimizing LED lighting spectra for enhanced growth in controlled-environment vertical farms. Sci. Rep. 2025, 15, 30152. [Google Scholar] [CrossRef] [PubMed]
  20. Askari, N.; Ghahremani, R.; Raisi, A.; Sadat-Hosseini, M.; Motlagh, B.P.; Visser, R.G.F. Far-Red Radiation Enhances In Vitro Potato Plantlet Growth by Stimulating Dry Weight Accumulation. Potato Res. 2025, 68, 1849–1868. [Google Scholar] [CrossRef]
  21. Guo, R.; Jin, Y.; Liu, J.; Yang, H.; Cheng, L.; Yu, B. Harnessing light quality for potato production: Red and blue light as key regulators of growth and yield. Plants 2025, 14, 1039. [Google Scholar] [CrossRef] [PubMed]
  22. Chazaux, M.; Schiphorst, C.; Lazzari, G.; Caffarri, S. Precise estimation of chlorophyll a, b and carotenoid content by deconvolution of the absorption spectrum and new simultaneous equations for Chl determination. Plant J. 2022, 109, 1630–1648. [Google Scholar] [CrossRef] [PubMed]
  23. Brunton, N.P.; Gormley, T.R.; Murray, B. Use of the alditol acetate derivatisation for the analysis of reducing sugars in potato tubers. Food Chem. 2007, 104, 398–402. [Google Scholar] [CrossRef]
  24. Fils-Lycaon, B.; Julianus, P.; Chillet, M.; Galas, C.; Hubert, O.; Rinaldo, D.; Mbéguie-A-Mbeguie, D. Acid invertase as a serious candidate to control the balance sucrose versus (glucose+fructose) of banana fruit during ripening. Sci. Hortic. 2011, 129, 197–206. [Google Scholar] [CrossRef]
  25. Fajardo, D.; Jayanty, S.S.; Jansky, S.H. Rapid high throughput amylose determination in freeze dried potato tuber samples. J. Vis. Exp. 2013, 80, e50407. [Google Scholar] [CrossRef] [PubMed]
  26. Tang, X.; Zhang, N.; Si, H.; Calderón-Urrea, A. Selection and validation of reference genes for RT-qPCR analysis in potato under abiotic stress. Plant Methods 2017, 13, 85. [Google Scholar] [CrossRef] [PubMed]
  27. Albaseer, S.S.; Rao, R.N.; Swamy, Y.V.; Mukkanti, K. An overview of sample preparation and extraction of synthetic pyrethroids from water, sediment and soil. J. Chromatogr. A 2010, 1217, 5537–5554. [Google Scholar] [CrossRef] [PubMed]
  28. Glauser, G.; Grund, B.; Gassner, A.-L.; Menin, L.; Henry, H.; Bromirski, M.; Schütz, F.; McMullen, J.; Rochat, B. Validation of the mass-extraction-window for quantitative methods using liquid chromatography high resolution mass spectrometry. Anal. Chem. 2016, 88, 3264–3271. [Google Scholar] [CrossRef] [PubMed]
  29. Parkhomchuk, D.; Borodina, T.; Amstislavskiy, V.; Banaru, M.; Hallen, L.; Krobitsch, S.; Lehrach, H.; Soldatov, A. Transcriptome analysis by strand-specific sequencing of complementary DNA. Nucleic Acids Res. 2009, 37, e123. [Google Scholar] [CrossRef] [PubMed]
  30. Gomez-Ocampo, G.; Cascales, J.; Medina-Fraga, A.L.; Ploschuk, E.L.; Mantese, A.I.; Crocco, C.D.; Matsusaka, D.; Sanchez, D.H.; Botto, J.F. Transcriptomic and physiological shade avoidance responses in potato (Solanum tuberosum .L) plants. Physiol. Plant 2023, 175, e13991. [Google Scholar] [CrossRef] [PubMed]
  31. Wang, H.; Wu, G.; Zhao, B.; Wang, B.; Lang, Z.; Zhang, C.; Wang, H. Regulatory modules controlling early shade avoidance response in maize seedlings. BMC Genom. 2016, 17, 269. [Google Scholar] [CrossRef] [PubMed]
  32. Wang, Q.; Bian, Z.; Wang, S.; Zhao, Y.; Zhan, X.; Yang, Q. Far-red light inhibits soybean biomass and yield by modulating plant photosynthesis. Agronomy 2024, 14, 2684. [Google Scholar] [CrossRef]
  33. Vereshchagin, M.; Pashkovskiy, P.; Tarakanov, I. Adding phyto-LED spectrum to white-LED light increases the productivity of lettuce plants. Horticulturae 2024, 10, 795. [Google Scholar] [CrossRef]
  34. Li, L.; Sugita, R.; Togawa, H.; Terashima, I.; Yamori, W. Beyond peak wavelength: Spectral bandwidth of blue and red-blue laser diodes modulates photosynthesis, canopy architecture, chlorophyll maintenance, and whole-plant growth. Front. Plant Sci. 2026, 17. [Google Scholar] [CrossRef] [PubMed]
  35. Pundir, R.K.; Pathak, A.K.; Upadhyaya, D.C.; Muthusamy, A.; Upadhyaya, C.P. Red and blue light-emitting diodes significantly improve in vitro tuberization of potato (Solanum tuberosum L.). J. Hortic. Res. 2021, 29, 95–108. [Google Scholar] [CrossRef]
  36. Ryu, K.O.; Shin, E.J.; Lee, S.; Lee, J.G.; Cha, E.B.; Sunwoo, Y.; Hong, J.; Yoon, J.E.; Lee, J.H.; Nam, S.Y. Spectral Modulation of Morphophysiological Responses and Plant Quality in Korean White Dandelion (Taraxacum coreanum Nakai) Under Controlled Environmental Conditions. Agriculture 2026, 16, 830. [Google Scholar] [CrossRef]
  37. Verma, V.; Singh, Z.; Gupta, V.K.; Yadav, N. Mitigating Health Risks in French Fries: Understanding Acrylamide and Hydroxymethylfurfural Management Through Potato Variety and Storage Exploration. Future Postharvest Food 2026, 3, 69–80. [Google Scholar] [CrossRef]
  38. Wang, W.; Wu, Q.; Qu, X.; Wang, X.; Zhang, J.; Duan, Y.; He, P. Optimizing nutrient management for various potato varieties based on source–sink relationships. Field Crops Res. 2025, 333, 110074. [Google Scholar] [CrossRef]
  39. Shang, W.; Song, Y.; Zhang, C.; Shi, L.; Shen, Y.; Li, X.; Wang, Z.; He, S. Effects of light quality on growth, photosynthetic characteristics, and endogenous hormones in in vitro-cultured Lilium plantlets. Hortic. Environ. Biotechnol. 2023, 64, 65–81. [Google Scholar] [CrossRef]
  40. Yoshi, K.; Takahashi, M.; Negishi, M. Red and blue laser light drives photosynthesis through dynamic changes of stomatal aperture. Front. Plant Sci. 2026, 17, 1781728. [Google Scholar] [CrossRef] [PubMed]
  41. Zhu, K.; Guo, Q.; Chen, Y.; Bu, X.; Yan, J.; Zhang, Y.; Wang, X.; Sun, X.; Zhang, X.; Ahammed, G.J.; et al. Behind the scenes:the roles of light signaling in stomatal movements. Hortic. Plant J. 2025, 11, 1711–1726. [Google Scholar] [CrossRef]
  42. Li, Y.; Xin, G.; Liu, C.; Shi, Q.; Yang, F.; Wei, M. Effects of red and blue light on leaf anatomy, CO2 assimilation and the photosynthetic electron transport capacity of sweet pepper (Capsicum annuum L.) seedlings. BMC Plant Biol. 2020, 20, 318. [Google Scholar] [CrossRef] [PubMed]
  43. Liu, Q.; Lian, H.F.; Liu, S.Q.; Sun, Y.L.; Yu, X.H.; Guo, H.P. Effects of different LED light qualities on photosynthetic characteristics, fruit production and quality of strawberry. Ying Yong Sheng Tai Xue Bao 2015, 26, 1743–1750. [Google Scholar] [CrossRef]
  44. Tan, T.; Li, S.; Fan, Y.; Wang, Z.; Ali Raza, M.; Shafiq, I.; Wang, B.; Wu, X.; Yong, T.; Wang, X.; et al. Far-red light: A regulator of plant morphology and photosynthetic capacity. Crop J. 2022, 10, 300–309. [Google Scholar] [CrossRef]
  45. Leschevin, M.; Ksas, B.; Baltenweck, R.; Hugueney, P.; Caffarri, S.; Havaux, M. Photosystem rearrangements, photosynthetic efficiency, and plant growth in far red-enriched light. Plant J. 2024, 120, 2536–2552. [Google Scholar] [CrossRef] [PubMed]
  46. Wang, S.; Wang, X.; Shi, X.; Wang, B.; Zheng, X.; Wang, H.; Liu, F. Red and blue lights significantly affect photosynthetic properties and ultrastructure of mesophyll cells in senescing grape leaves. Hortic. Plant J. 2016, 2, 82–90. [Google Scholar] [CrossRef]
  47. Bou-Torrent, J.; Martinez-Garcia, J.F.; Garcia-Martínez, J.L.; Prat, S. Gibberellin A1 metabolism contributes to the control of photoperiod-mediated tuberization in potato. PLoS ONE 2011, 6, e24458. [Google Scholar] [CrossRef] [PubMed]
  48. Roumeliotis, E.; Kloosterman, B.; Oortwijn, M.; Lange, T.; Visser, R.G.; Bachem, C.W. Down regulation of StGA3ox genes in potato results in altered GA content and affect plant and tuber growth characteristics. J. Plant Physiol. 2013, 170, 1228–1234. [Google Scholar] [CrossRef] [PubMed]
  49. Kieber, J.J.; Schaller, G.E. Cytokinin signaling in plant development. Development 2018, 145, dev149344. [Google Scholar] [CrossRef] [PubMed]
  50. Zhang, W.; Peng, K.; Cui, F.; Wang, D.; Zhao, J.; Zhang, Y.; Yu, N.; Wang, Y.; Zeng, D.; Wang, Y.; et al. Cytokinin oxidase/dehydrogenase OsCKX11 coordinates source and sink relationship in rice by simultaneous regulation of leaf senescence and grain number. Plant Biotechnol. J. 2021, 19, 335–350. [Google Scholar] [CrossRef] [PubMed]
  51. Eviatar-Ribak, T.; Shalit-Kaneh, A.; Chappell-Maor, L.; Amsellem, Z.; Eshed, Y.; Lifschitz, E. A cytokinin-activating enzyme promotes tuber formation in tomato. Curr. Biol. 2013, 23, 1057–1064. [Google Scholar] [CrossRef] [PubMed]
  52. Hu, Y.; Shani, E. Cytokinin activity—Transport and homeostasis at the whole plant, cell, and subcellular levels. New Phytol. 2023, 239, 1603–1608. [Google Scholar] [CrossRef] [PubMed]
  53. Shen, Y.; Fan, K.; Wang, Y.; Wang, H.; Ding, S.; Song, D.; Shen, J.; Li, H.; Song, Y.; Han, X.; et al. Red and blue light affect the formation of adventitious roots of tea cuttings (Camellia sinensis) by regulating hormone synthesis and signal transduction pathways of mature leaves. Front. Plant Sci. 2022, 13, 943662. [Google Scholar] [CrossRef] [PubMed]
  54. Xu, J.M.; Liu, Y.; Liu, M.X.; Xu, Z.G. Proteomic, physiological, and anatomical analyses reveal the effects of red, blue, and white light on the growth of potato plantlets under in vitro culture. Russ. J. Plant Physiol. 2022, 69, 139. [Google Scholar] [CrossRef]
Figure 1. Effects of different light qualities on plant growth, development, and propagation efficiency of aeroponically grown potatoes. (A) Experimental timeline. Plantlets were acclimated under natural light for 30 days, followed by supplemental lighting until harvest at 102 days. (B) Representative morphology at 30, 60, and 90 days of light treatment (bar = 5 cm). (C) Minituber morphology at harvest (bar = 2 cm). (D,E) Dynamics of tuber number and yield per plant from 60 to 100 days. CK: natural light control; W: white light; FR: far-red light; 7R1B: red–blue light (7:1).
Horticulturae 12 00954 g001
Figure 2. Effects of different light qualities on photosynthetic parameters. (A) Total pigment composition (Chl a, Chl b, Car). (BD) Quantitative pigment data. Different lowercase letters indicate significant differences (p < 0.05). (EG) Contents of reducing sugars, soluble sugars, and starch in tubers under different treatments. (HJ) Radar plots of net photosynthetic rate (Pn), transpiration rate (Tr), intercellular CO2 concentration (Ci), and leaf stomatal conductance (Gs). CK: control; W: white light; FR: far red; 7R1B: red–blue (7:1).
Horticulturae 12 00954 g002
Figure 3. Effects of different light qualities on endogenous hormones. (A) PCA of hormone profiles at 30 and 90 days (CK30/90: control; 7R1B30/90: 7R1B). (B) Heatmap of hormone contents (CTK: cytokinins; GAs: gibberellins; IAA: auxin; JA: jasmonic acid; ABA: abscisic acid; ETH: ethylene; SA: salicylic acid). (CE) GA4, ABA, and trans zeatin dynamics at 30 and 90 days. F, GA/ABA ratio. Different lowercase letters indicate significant differences (p < 0.05). Error bars represent standard deviation (SD). (F) GA/ABA ratio at 30 and 90 days.
Horticulturae 12 00954 g003
Figure 4. Transcriptomic analysis under different light qualities. (A) PCA of samples at 30 and 90 days. CK30/90: control; 7R1B30/90: red–blue light. (B,C) Venn diagrams of DEGs between CK and 7R1B at 30 and 90 days. (D,E) KEGG enrichment of DEGs under 7R1B at 30 and 90 days (count and −log10P).
Horticulturae 12 00954 g004
Figure 5. Expression patterns of key hormone signaling and biosynthesis genes under 7R1B. (A) Heatmap of genes in GA, ABA, cytokinin, auxin, and SA signaling (red: upregulated; green: downregulated). (B) Heatmap of GA biosynthesis genes. (C) Heatmap of zeatin biosynthesis and metabolism genes (CK30/90: control; 7R1B30/90: red–blue light).
Horticulturae 12 00954 g005
Figure 6. Correlation validation between transcriptome sequencing and qRT-PCR results. Quantitative analysis of 9 key differentially expressed genes by qRT-PCR showed that their expression trends were highly consistent with the FPKM changes from transcriptome sequencing (RNA-Seq), confirming the reliability of the transcriptome data in this study. Error bars represent standard deviation (SD). CK30/90: natural light control for 30/90 days; 7R1B30/90: red–blue light (7:1) treatment for 30/90 days. Different lowercase letters indicate significant differences (p < 0.05). Error bars represent standard deviation (SD).
Horticulturae 12 00954 g006
Disclaimer/Publisher’s Note: The statements, opinions and data contained in all publications are solely those of the individual author(s) and contributor(s) and not of MDPI and/or the editor(s). MDPI and/or the editor(s) disclaim responsibility for any injury to people or property resulting from any ideas, methods, instructions or products referred to in the content.