Article

Effects of LED Light-Quality Ratios on Growth, Rooting, and Hydroponic Acclimatization of Spathiphyllum floribundum ‘Tianjiao’


1
College of Landscape Architecture and Art, Henan Agricultural University, Zhengzhou 450002, China
2
School of Horticulture Landscape Architecture, Henan Institute of Science and Technology, Xinxiang 453003, China
*
Authors to whom correspondence should be addressed.
These authors contributed equally to this work.
Horticulturae 2026, 12(8), 916; https://doi.org/10.3390/horticulturae12080916
Submission received: 2 June 2026 / Revised: 21 July 2026 / Accepted: 22 July 2026 / Published: 24 July 2026
(This article belongs to the Special Issue Sustainable Cultivation and Performance of Ornamental Plants)

Abstract

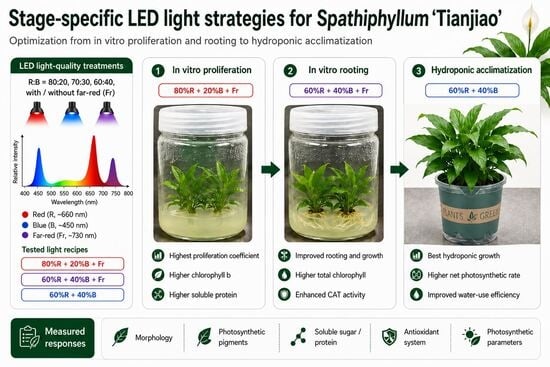
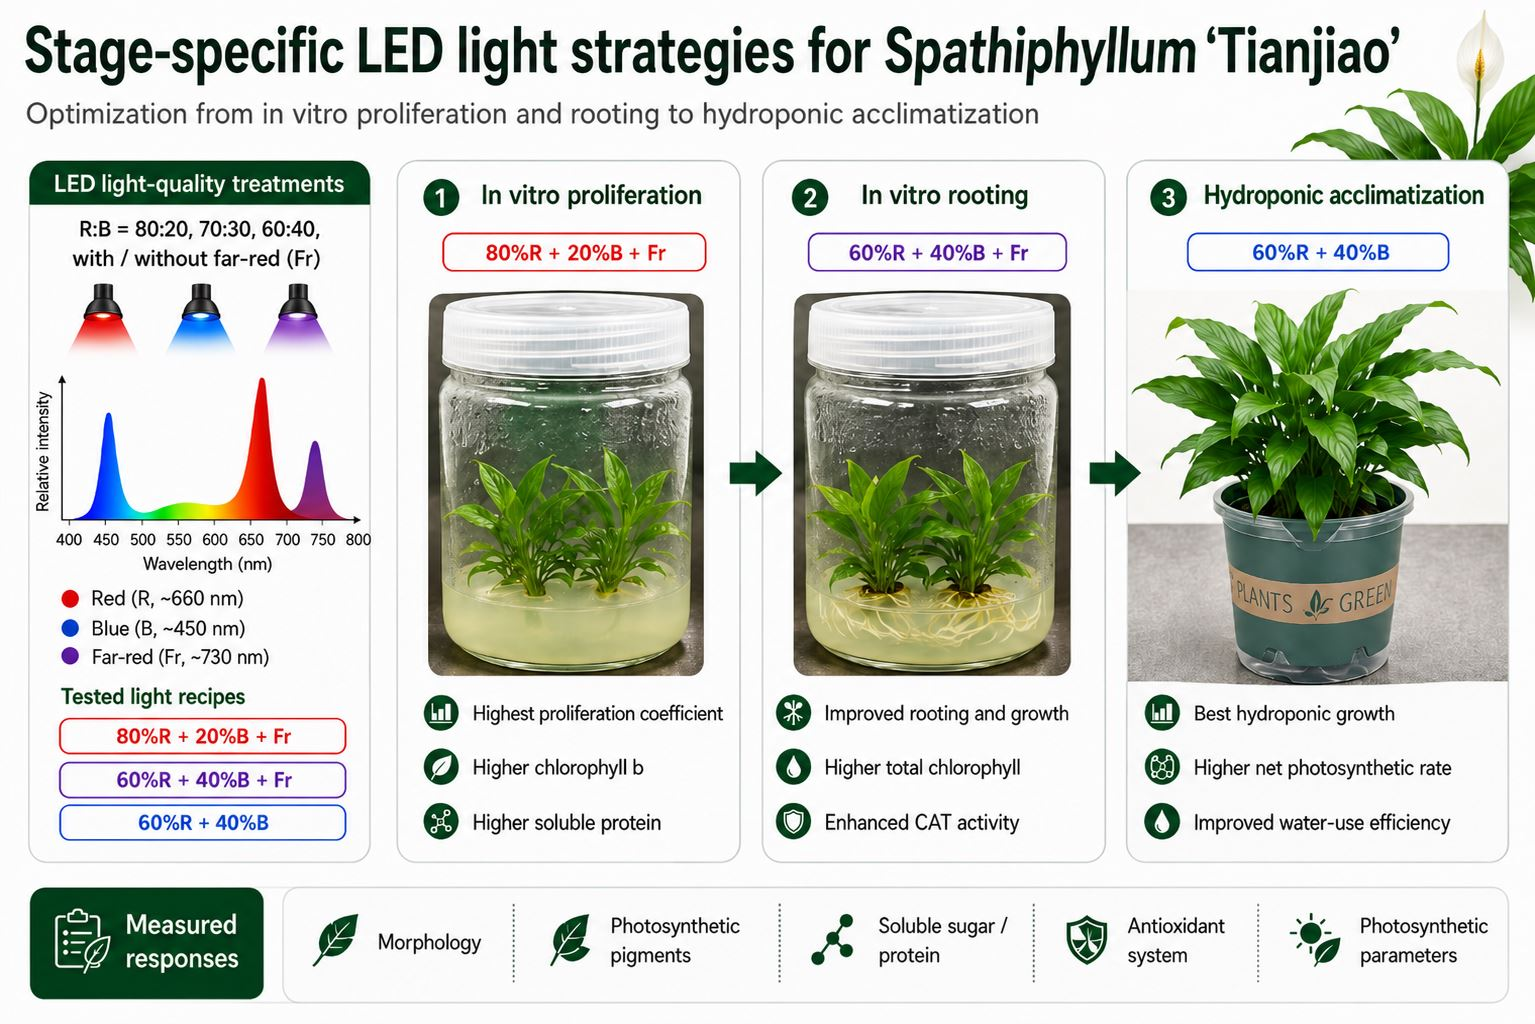
Light quality plays a critical role in regulating plant growth during both in vitro culture and hydroponic stages, attracting increasing research attention. However, comprehensive studies incorporating far-red LED light throughout the entire growth cycle of Spathiphyllum floribundum (Linden & André) N.E.Br. ‘Tianjiao’ remain limited. To investigate the effects of red, blue, and far-red light ratios on proliferation, rooting, and hydroponic acclimatization, six LED treatments were established with red: blue ratios of 80:20, 70:30, and 60:40, each with or without far-red light supplementation. Fluorescent light was used as the control. At each stage, morphological traits, photosynthetic pigments, osmotic compounds, antioxidant enzyme activities, and photosynthetic parameters were measured. The results identified distinct optimal light combinations for each growth phase. The optimal treatment for proliferation was 80%R + 20%B + Fr, which produced significant proliferation coefficients and enhanced chlorophyll b and soluble protein content. For rooting, 60%R + 40%B + Fr was most effective, resulting in the highest total chlorophyll content (0.109 mg·g−1) and improved carotenoid accumulation and CAT activity. During hydroponic acclimatization, 60%R + 40%B without far-red light yielded the best performance, achieving the highest plant height (15.28 cm) and net photosynthetic rate (4.77 μmol·m−2·s−1), along with improved water-use efficiency. These results provide potential LED light strategies for the complete process from tissue culture to hydroponics, offering a theoretical basis for designing specialized LED lighting systems for plant tissue culture and hydroponic production.

Graphical Abstract

1. Introduction

A perennial herbaceous member of the Araceae family, Spathiphyllum floribundum—commonly referred to as peace lily or white crane taro—is widely grown as a premium indoor ornamental, a status conferred by its lush foliage and unique white blooms [1]. With growing market demand, tissue culture has become a routine method for its rapid propagation, enabling large-scale production of uniform plantlets [2]. Previous studies on in vitro culture of this species have focused on explant selection [3], disinfection protocols [4], hormone combinations [5], culture conditions [6,7], cultivation physiology [8], and the production of virus-free or genetically transformed plants [9,10]. Despite these advances, investigations into LED light quality in Spathiphyllum and related Araceae species have tended to concentrate on isolated developmental stages—such as rooting or hydroponic growth—rather than examining the full progression from tissue culture to hydroponic establishment [11,12].
Light quality regulates a wide range of physiological processes, including stem elongation, leaf expansion [13], root development [14], pigment synthesis [15], and antioxidant enzyme activities [16]. Light-emitting diodes (LEDs), with their tunable spectra and high energy efficiency, have become ideal light sources for plant tissue culture and hydroponic systems [17]. Studies have shown that specific combinations of red and blue LED light promote growth in various ornamental and horticultural species, including Dendrobium Sw. [18], Anthurium [19], Vaccinium spp. [20], and Rosa hybrida E.H.L.Krause [21]. Additionally, green LED light can enhance light absorption capacity, thereby improving the quality of lettuce [22], while far-red LED light benefits cut flower chrysanthemums [23]. When added to red–blue spectra, far-red light further enhances stem elongation and leaf area in cut flowers and seedlings. Even so, comprehensive evaluations that integrate red–blue ratios with far-red supplementation across successive developmental stages—from in vitro proliferation and rooting to hydroponic acclimatization—remain relatively scarce.
To address this gap, the present study adopted a parallel experimental design targeting three independent stages: (1) in vitro proliferation, (2) in vitro rooting, and (3) hydroponic acclimatization. For each stage, six LED light treatments were applied (80%R + 20%B, 70%R + 30%B, 60%R + 40%B, and their counterparts supplemented with far-red light), with ordinary fluorescent light serving as the control (CK). Morphological traits, photosynthetic pigment contents, osmotic substances, antioxidant enzyme activities, and photosynthetic parameters were measured at each stage. By systematically comparing the effects of different red:blue:far-red ratios, we aimed to identify the optimal light formula for each stage. These findings provide a reference for stage-specific LED light management during micropropagation and subsequent hydroponic acclimatization of S. floribundum ‘Tianjiao’.

2. Materials and Methods

2.1. Experimental Materials

The cultivar used in this study was Spathiphyllum floribundum ‘Tianjiao’. Young stem segments were used as explants for in vitro culture. Because stem explants of S. floribundum are susceptible to microbial contamination during culture initiation, a short-duration mercuric chloride treatment was used for surface sterilization. The explants were first immersed in 75% ethanol for 30 s, followed by sterilization with 0.1% HgCl2 for 5 min. After sterilization, the explants were rinsed five times with sterile distilled water to remove residual HgCl2, then inoculated onto initiation medium (Murashige and Skoog medium supplemented with 0.2 mg·L−1 6-Benzylaminopurine , 0.1 mg·L−1 Indole-3-butyric acid , and 30 g·L−1 sucrose, pH 5.8). Cultures were maintained under standard fluorescent light (light intensity 40 μmol·m−2·s−1, temperature 24 ± 1 °C, photoperiod 12 h·d−1). After 20 days, uniform plantlets approximately 2.0 cm in height were obtained and served as the common starting material for all subsequent experiments.

2.2. Experimental Design

A parallel experimental design was adopted in which the proliferation, rooting, and hydroponic acclimatization stages were conducted independently, each using sterile plantlets derived from the same source but from different batches. To minimize potential batch variation, plantlets with similar height and developmental status were selected before treatment, and all batches were maintained under identical pre-culture conditions and sampled using the same criteria and procedures.
Six LED light-quality treatments were established (80%R + 20%B, 70%R + 30%B, 60%R + 40%B, and their respective counterparts with far-red light added), with ordinary fluorescent light serving as CK. The light-quality compositions and corresponding peak wavelengths are presented in Table 1. All light treatments were conducted on multilayer culture racks equipped with LED tubes positioned directly above the culture bottles or plantlets. Adjacent light treatments were separated by opaque partitions to minimize light interference between treatments. Photosynthetic photon flux density (PPFD) was adjusted to the same level within each growth stage. For the in vitro proliferation and rooting stages, PPFD was adjusted to 40 μmol·m−2·s−1 and measured at the top of the culture bottles. For the hydroponic acclimatization stage, PPFD was adjusted to 50 μmol·m−2·s−1 and measured at the top of the plantlet canopy directly below the LED tubes. The photoperiod was 12 h·d−1. For the in vitro proliferation stage, single buds excised from the starting sterile plantlets were inoculated onto proliferation medium consisting of MS medium supplemented with 0.5 mg·L−1 6-BA, 0.2 mg·L−1 IBA, and 30 g·L−1 sucrose. The pH of the medium was adjusted to 5.8 before autoclaving. Plantlets were cultured at 24 ± 1 °C under the light treatments described above. For each light treatment, 30 sterile culture bottles were used, with one plantlet cultured in each bottle. Each culture bottle containing one plantlet was considered an independent experimental unit. After 50 days of culture, five plantlets were randomly taken from each replicate for morphological measurements, and three additional plantlets from each replicate were pooled into a single sample for physiological and biochemical assays, with three technical replicates performed for each indicator. For the rooting stage, another set of single buds from the same starting material was inoculated onto rooting medium (1/2MS supplemented with 0.5 mg·L−1 1-naphthaleneacetic acid and 30 g·L−1 sucrose, pH 5.8); the culture conditions were identical to those of the proliferation stage, and the same sampling procedure was followed after 50 days. For the hydroponic acclimatization stage, a separate batch of starting sterile plantlets was used. The roots were gently washed free of agar, and the plantlets were transferred to a substrate mixture of perlite and vermiculite (1:1, v/v) for a 14-day greenhouse acclimatization period under 25 ± 1 °C, 70–80%Relative humidity, and natural light. After acclimatization, the plantlets were transferred to plastic pots with a height of 15 cm and a width of 12.5 cm. One plantlet was placed in each pot, and 30 independent pots were used for each light treatment, giving a total of 30 plantlets per treatment. Each hydroponic vessel was maintained as an independent experimental unit and biological replicate. The light intensity was set to 50 μmol·m−2·s−1, with a temperature of 25 ± 1 °C and a photoperiod of 12 h·d−1. After 60 days of hydroponic culture, the same sampling method as that used in the proliferation stage was applied; photosynthetic parameters were measured only at this stage.

2.3. Measurement Items and Methods

2.3.1. Morphological Indicator Analysis

To assess the morphological responses of plantlets to different light-quality treatments, fifteen individuals were randomly selected from each treatment. A set of growth parameters was recorded, including plant height, leaf number, leaf length and width (measured on the third leaf from the apex), root number, root length, and fresh weight. An electronic balance ((FA2104B, Shanghai Precision Scientific Instrument Co., Ltd., Shanghai, China), precision: 0.001 g) and a digital caliper (Delixi Electric Ltd., Yueqing, Zhejiang, China, precision: 0.01 cm) were used for all quantitative determinations.

2.3.2. Photosynthetic Pigment Content Analysis

Photosynthetic pigments were extracted using a 1:1 (v/v) mixture of anhydrous ethanol and 80% acetone [24]. Three pooled samples were prepared per treatment, and from each sample 0.1 g of fresh leaf tissue was cut into small pieces. The tissue pieces were then soaked in 10 mL of the extraction mixture in the dark for 24 h. After filtration, the absorbance of the extract was measured at 663, 645, and 470 nm using a UV–visible spectrophotometer (UV-1900, Shimadzu, Tokyo, Japan). Based on these absorbance readings, the contents of chlorophyll a, chlorophyll b, total chlorophyll (a + b), and carotenoids were calculated using standard formulae. Chlorophyll a, chlorophyll b, total chlorophyll, and carotenoid concentrations were calculated using the following equations:
Chl a = 12.7A663 − 2.69A645
Chl b = 22.9A645 − 4.68A663
Total chlorophyll = Chl a + Chl b
Carotenoids = (1000A470 − 3.27Chl a − 104Chl b)/229
The pigment content was then expressed on a fresh weight basis using the following equation:
Pigment content (mg·g−1 FW) = C × V/(1000 × W)

2.3.3. Soluble Sugar and Soluble Protein Analysis

Soluble sugar content was determined using the anthrone–sulfuric acid colorimetric method [24]. Three pooled samples were prepared per treatment. From each sample, 0.2 g of leaf tissue was homogenized with 5 mL of 80% ethanol and then extracted in a water bath at 80 °C for 30 min. After centrifugation, the supernatant was collected, mixed with anthrone reagent, and heated in a boiling water bath for 10 min. Following cooling, the absorbance was measured at 620 nm using a UV–visible spectrophotometer (UV-1900, Shimadzu, Tokyo, Japan). For soluble protein determination, the Coomassie Brilliant Blue G-250 staining method was employed [24]. The same sampling scheme was used: three pooled samples per treatment, each from three plantlets. Leaf tissue (0.2 g) was ground on ice with 5 mL of ice-cold phosphate buffer (pH 7.0) and centrifuged at 12,000× g for 15 min at 4 °C. An aliquot (0.1 mL) of the resulting supernatant was mixed with 5 mL of Coomassie Brilliant Blue G-250 solution. After 2 min of incubation, the absorbance was read at 595 nm using a UV–visible spectrophotometer (UV-1900, Shimadzu, Tokyo, Japan).

2.3.4. Root Vigor and Antioxidant Enzyme Activity Analysis

Root vigor was determined using the triphenyl tetrazolium chloride (TTC) reduction method as described by Ryssov-Nielson and Trevors [25]. For antioxidant enzyme assays, superoxide dismutase (SOD) activity was measured by the NBT photochemical reduction method [24], peroxidase (POD) activity by the guaiacol method [24], and catalase (CAT) activity by the ultraviolet absorption method [24]. Malondialdehyde (MDA) content was determined using the thiobarbituric acid (TBA) method.

2.3.5. Photosynthetic and Chlorophyll Fluorescence Analyses

Photosynthetic parameters were measured on the third fully expanded leaf from the top using a CIRAS-3 portable photosynthesis system (PP Systems, Amesbury, MA, USA) between 8:00 and 10:00 am. The recorded parameters included net photosynthetic rate (A), transpiration rate (E), stomatal conductance (gs), intercellular CO2 concentration (Ci), water vapor pressure deficit (VPD), and water-use efficiency (WUE). To minimize potential bias caused by diurnal variation, the measurement order of different treatments was randomized and rotated among biological replicates. Measurements were conducted under the following conditions: atmospheric pressure 102 kPa, leaf temperature 25 ± 1 °C, ambient CO2 concentration 450 μmol·mol−1, and light intensity corresponding to the respective LED treatment (50 μmol·m−2·s−1 for the hydroponic stage). For chlorophyll fluorescence analysis, an M-PEA multifunctional plant efficiency analyzer (Hansatech Instruments Ltd., Pentney, UK) was used. The third leaf from the top was selected, and after 20 min of dark adaptation, the maximum photochemical efficiency of PSII (Fv/Fm) and the performance index based on absorbed light energy (PIabs) were recorded.

2.4. Data Processing

Morphological measurements were performed using five randomly selected plantlets from each treatment, and physiological and biochemical indicators were measured using three biological replicates. Data are presented as means ± standard error (SE). Before ANOVA, the normality of residuals and homogeneity of variance were tested using the Shapiro–Wilk test and Levene’s test, respectively. Data satisfying these assumptions were analyzed by one-way analysis of variance (ANOVA), followed by Duncan’s multiple range test (DMRT) at p < 0.05. Spearman correlation analysis was performed based on treatment means to explore relationships among growth, physiological, biochemical, and photosynthetic traits, and the results were visualized using bubble correlation plots. All statistical analyses were performed using SPSS 27.0 software (SPSS Inc., Chicago, IL, USA).

3. Results

3.1. Effects of Different Light-Quality Ratios on the Proliferation Culture of S. floribundum ‘Tianjiao’ In Vitro

3.1.1. Effects of Different Light-Quality Ratios on Proliferation Coefficients, Fresh Mass, Soluble Sugars and Proteins of Proliferating Plantlets

Different light-quality ratios exerted varying effects on the proliferation coefficient, fresh weight, soluble sugar content, and soluble protein content of proliferation plantlets (Table 2). Compared with the CK, all LED light treatments significantly increased the proliferation coefficient; however, no significant differences were observed among the LED treatments themselves. This indicates that red–blue LED light, in general, is beneficial for the proliferation of tissue-cultured Spathiphyllum plantlets. Regarding biomass accumulation, the highest fresh weight was observed under the 60%R + 40%B treatment, which was significantly higher than those under the 80%R + 20%B, 70%R + 30%B, and CK treatments. This suggests that a higher proportion of blue light in the red–blue combination promotes biomass accumulation in proliferation plantlets. In terms of carbohydrate metabolism, the soluble sugar content was highest under the 70%R + 30%B + Fr treatment, followed by the 80%R + 20%B + Fr treatment, indicating that the addition of far-red light to red–blue combinations enhances soluble sugar accumulation. Furthermore, the soluble protein content reached its maximum under the 80%R + 20%B + Fr treatment and was significantly higher than that under other treatments, suggesting that this light combination effectively promotes nitrogen metabolism and physiological activity in proliferating plantlets.

3.1.2. Effects of Different Light-Quality Ratios on Photosynthetic Pigment Content of Proliferating Plantlets

The photosynthetic pigment contents of proliferated plantlets responded differently to the tested light-quality ratios (Table 3). Chlorophyll a reached its highest value under the 80%R + 20%B treatment. This value was statistically comparable to those observed under 70%R + 30%B, 60%R + 40%B, and 80%R + 20%B + Fr, but was significantly higher than those under 70%R + 30%B + Fr, 60%R + 40%B + Fr, and CK. The lowest chlorophyll a content was recorded in CK, suggesting that LED illumination, as a whole, provided a more favorable light environment for chlorophyll a accumulation than fluorescent light during the proliferation stage. A different response pattern was observed for chlorophyll b. The highest chlorophyll b content occurred under 70%R + 30%B + Fr, followed by 80%R + 20%B + Fr; these two treatments did not differ significantly from each other, but both were significantly higher than CK. Total chlorophyll content remained relatively high under 70%R + 30%B, 80%R + 20%B + Fr, and 80%R + 20%B, indicating that red–blue composite light helped maintain the overall pigment pool in proliferated plantlets. Carotenoid accumulation was most pronounced under 60%R + 40%B + Fr, which was significantly higher than in most other treatments, except 80%R + 20%B + Fr and 70%R + 30%B + Fr. CK again showed the lowest carotenoid content. Taken together, these results indicate that LED light treatments improved photosynthetic pigment accumulation compared with the fluorescent-light control, although the response varied among pigment types.

3.2. Effects of Different Light-Quality Ratios on the Rooting Culture of S. floribundum ‘Tianjiao’ In Vitro Seedlings

3.2.1. Effects of Different Light-Quality Ratios on the Growth of In Vitro-Rooted Plantlets

The growth performance of plantlets after 50 days of rooting culture under different light-quality ratios is presented in Table 4. In the absence of far-red light, plant height increased progressively with increasing proportions of red light. Under the same red–blue light ratio, the addition of far-red light generally reduced plant height, except under the 60%R + 40%B + Fr treatment. The greatest reduction in plant height was observed under the 80%R + 20%B + Fr treatment. Compared with CK, the percentage changes in plant height were limited, ranging from −2.5% to +7.4% among the LED treatments. Specifically, plant height increased by 7.4%, 5.6%, and 3.1% under 80%R + 20%B, 70%R + 30%B, and 80%R + 20%B + Fr, respectively, whereas 60%R + 40%B and 70%R + 30%B + Fr resulted in slight decreases of 1.2% and 2.5%, respectively. Plant height under 60%R + 40%B + Fr was similar to that under CK. These results indicate that the differences in plant height represented relatively small absolute changes and should be interpreted together with other growth and physiological traits. Leaf number initially increased and then decreased as the proportion of red light increased, with the highest value recorded under the 60%R + 40%B treatment. This value was significantly greater than that of CK. Leaf length and leaf width were both significantly affected by light quality. The longest leaves were observed under the 80%R + 20%B + Fr treatment, followed by the 80%R + 20%B treatment, and both values were significantly higher than those of the control. Similarly, the maximum leaf width was recorded under the 80%R + 20%B + Fr treatment, whereas the minimum value occurred under the 60%R + 40%B treatment. Under identical red–blue light ratios, the addition of far-red light significantly increased both leaf length and leaf width. Root length exhibited a decrease–increase trend with increasing red light proportion under treatments without far-red supplementation. Among all treatments, the longest roots were observed under the 70%R + 30%B + Fr treatment, indicating a strong promotive effect of this light combination on root elongation.

3.2.2. Effects of Different Light-Quality Ratios on Root Vigor of In Vitro-Rooted Plantlets

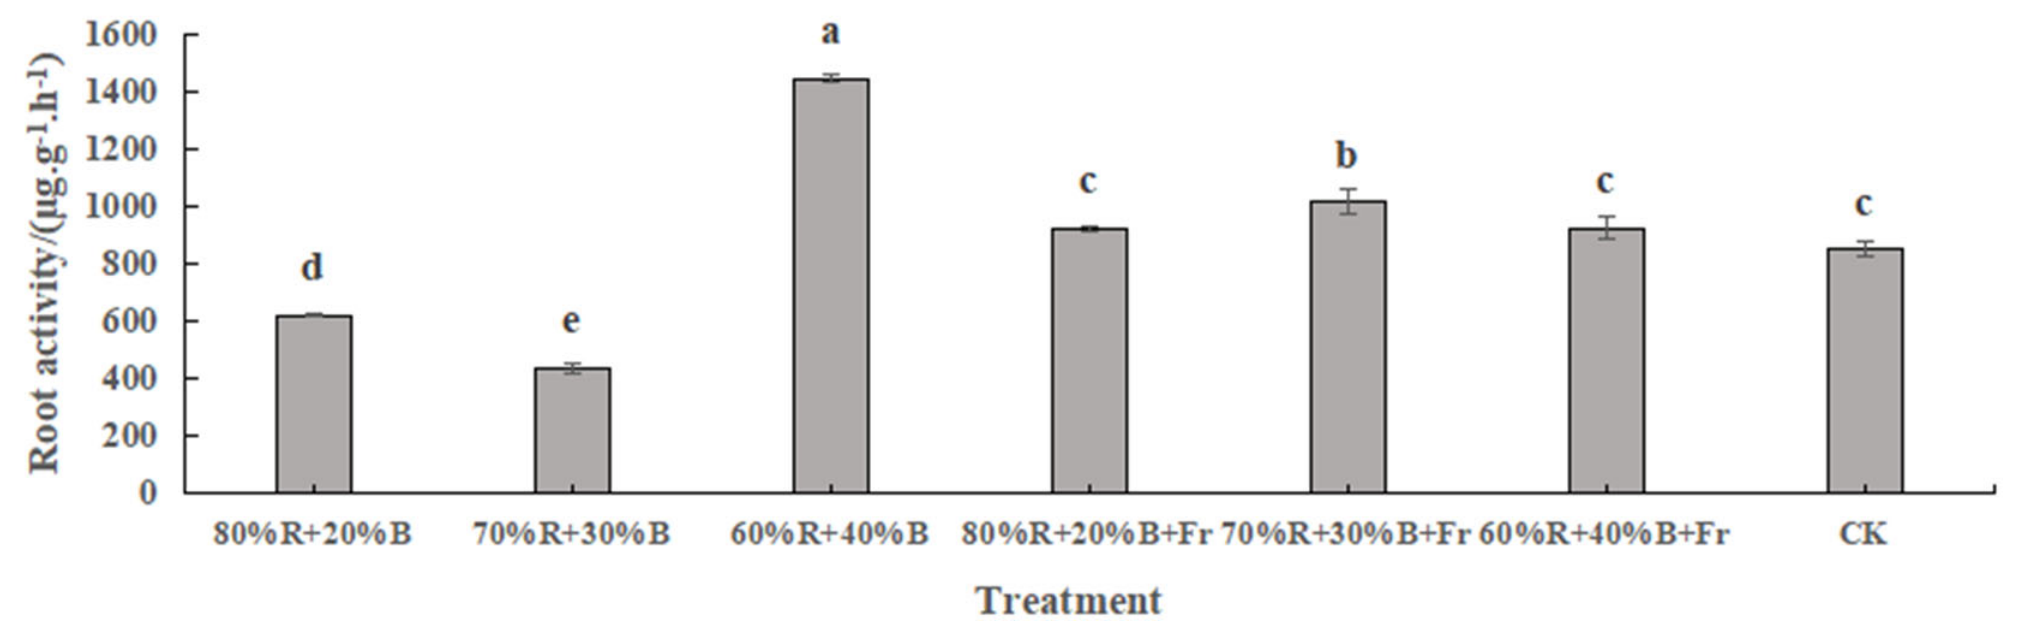
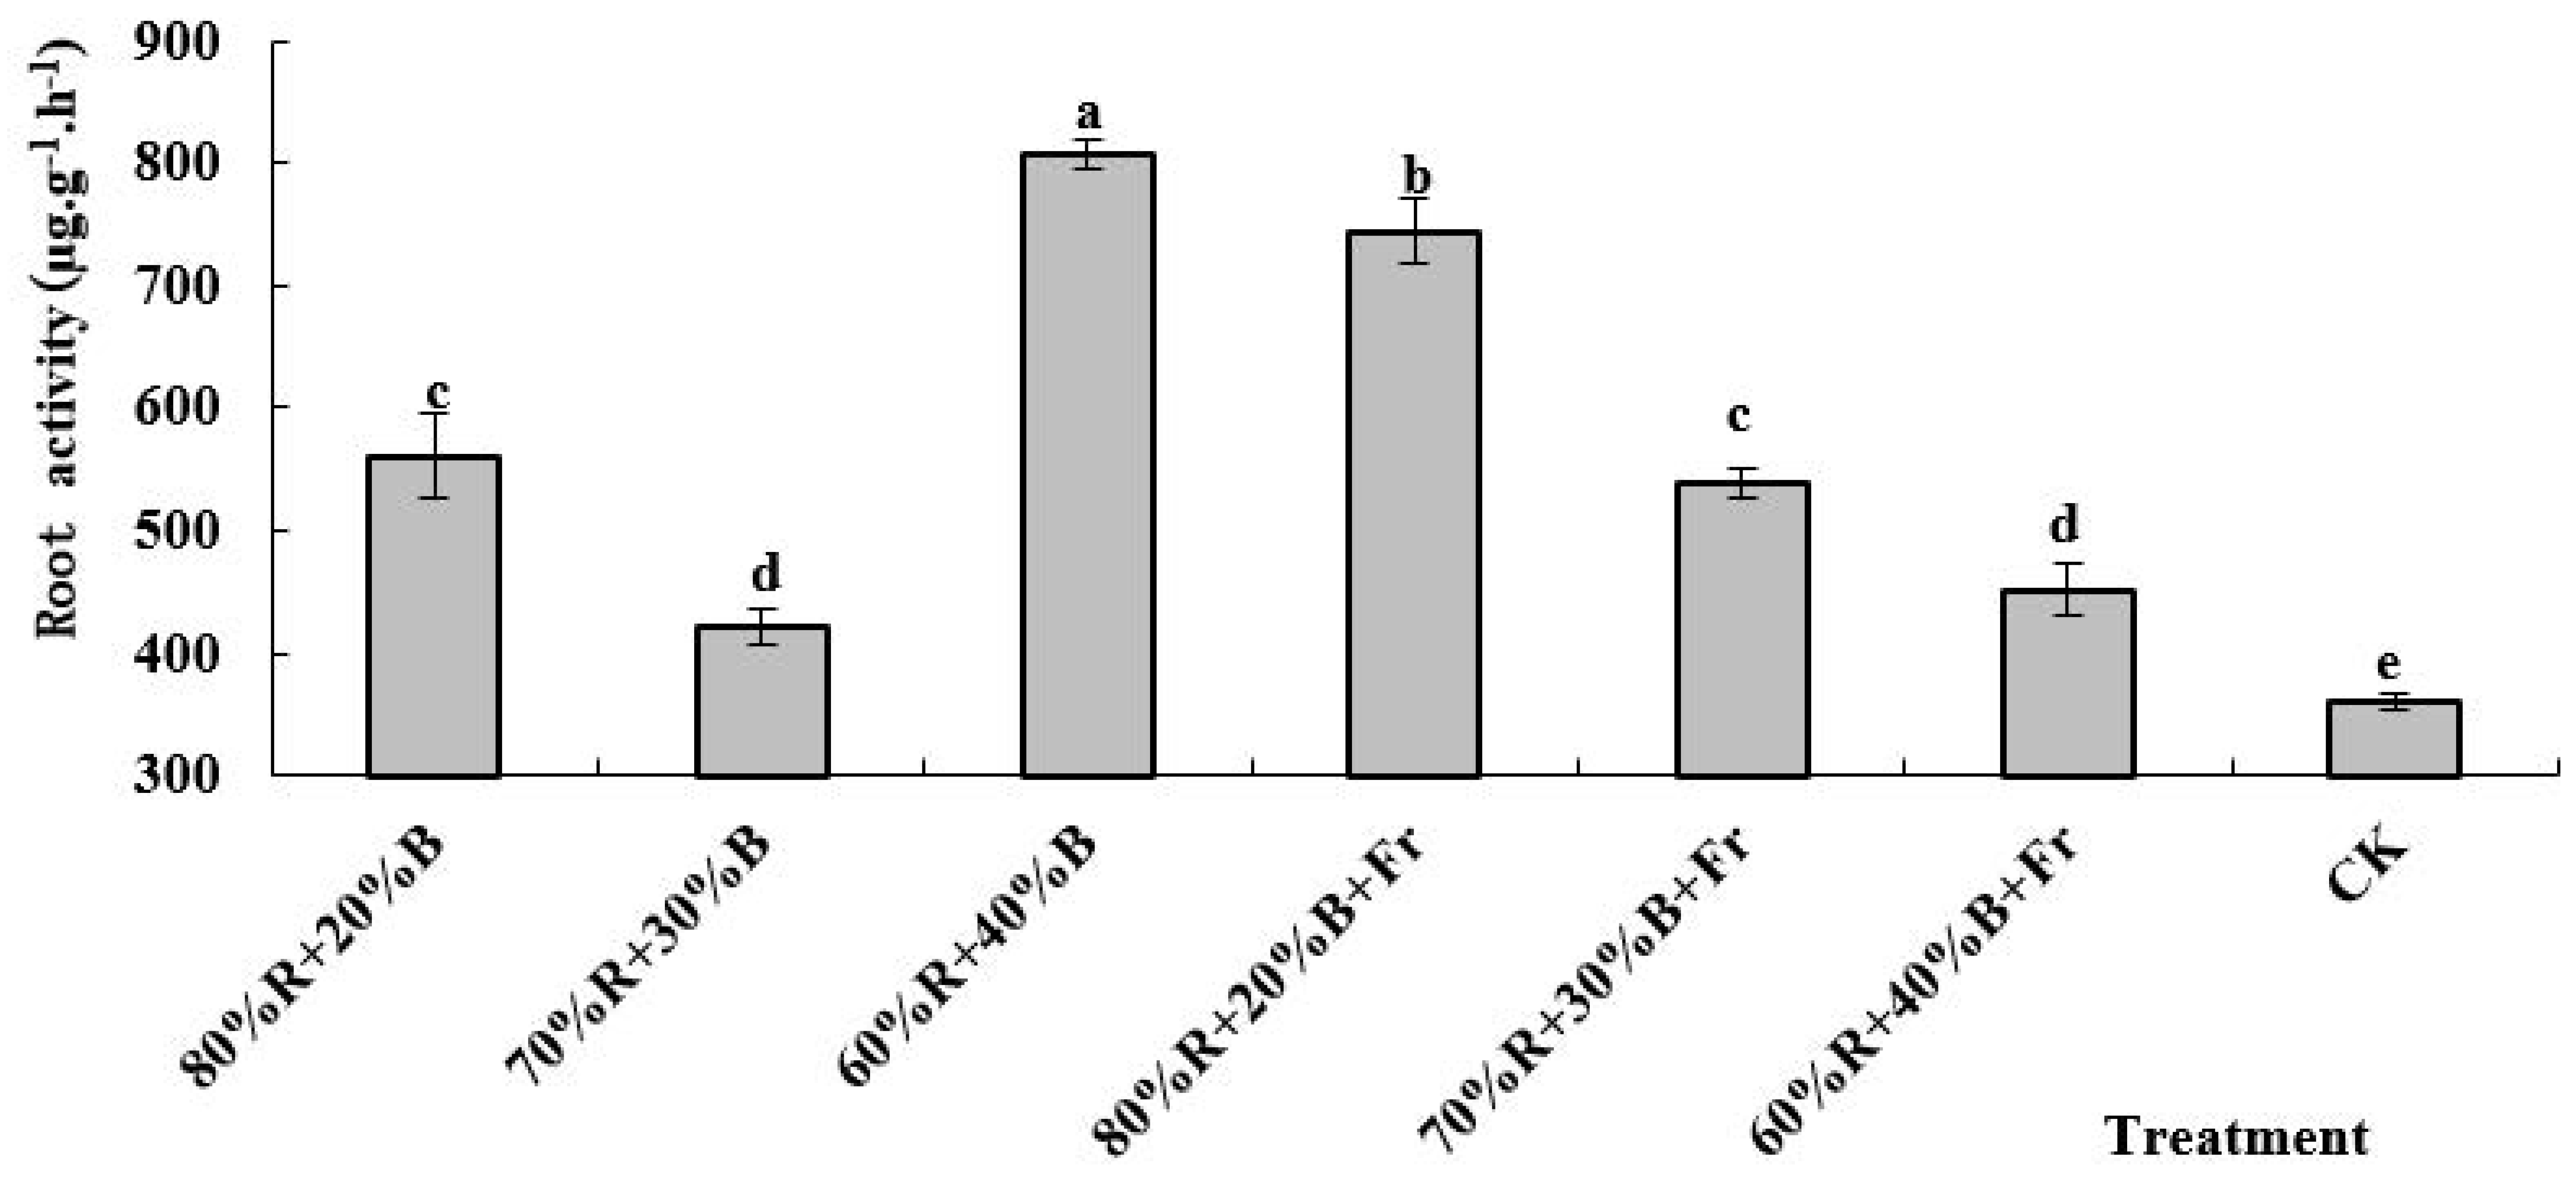
The root vigor of plantlets during the rooting stage exhibited different response patterns under treatments with and without far-red light (Figure 1). In the absence of far-red supplementation, root vigor decreased initially and then increased as the proportion of red light increased. In contrast, under far-red supplementation, root vigor increased initially and subsequently decreased with increasing red light proportion. Under the same red–blue light ratio, the addition of far-red light significantly enhanced root vigor, except in the 60%R + 40%B + Fr treatment. Among all treatments, the highest root vigor was recorded under the 60%R + 40%B treatment, followed by the 70%R + 30%B + Fr treatment, and both values were significantly higher than those observed under the other treatments. Conversely, the lowest root vigor was observed under the 70%R + 30%B treatment, which was significantly lower than that of the control (CK).

3.2.3. Effects of Different Light-Quality Ratios on Photosynthetic Pigment Contents of In Vitro-Rooted Plantlets

The contents of chlorophyll a, total chlorophyll (chlorophyll a + b), and carotenoids decreased initially and then increased as the proportion of red light increased under treatments without far-red supplementation. In contrast, chlorophyll b content gradually declined with increasing red light proportion in the absence of far-red light (Table 5). When far-red light was added to the same red–blue light ratios, the contents of chlorophyll a, chlorophyll b, total chlorophyll, and carotenoids increased significantly compared with treatments lacking far-red light, except for the 80%R + 20%B + Fr treatment. Among all treatments, the highest pigment contents were observed under the 60%R + 40%B + Fr treatment, whereas the lowest levels of chlorophyll a, total chlorophyll, and carotenoids occurred under the 70%R + 30%B treatment.

3.2.4. Effects of Different Light-Quality Ratios on Soluble Sugar and Soluble Protein Contents of In Vitro-Rooted Plantlets

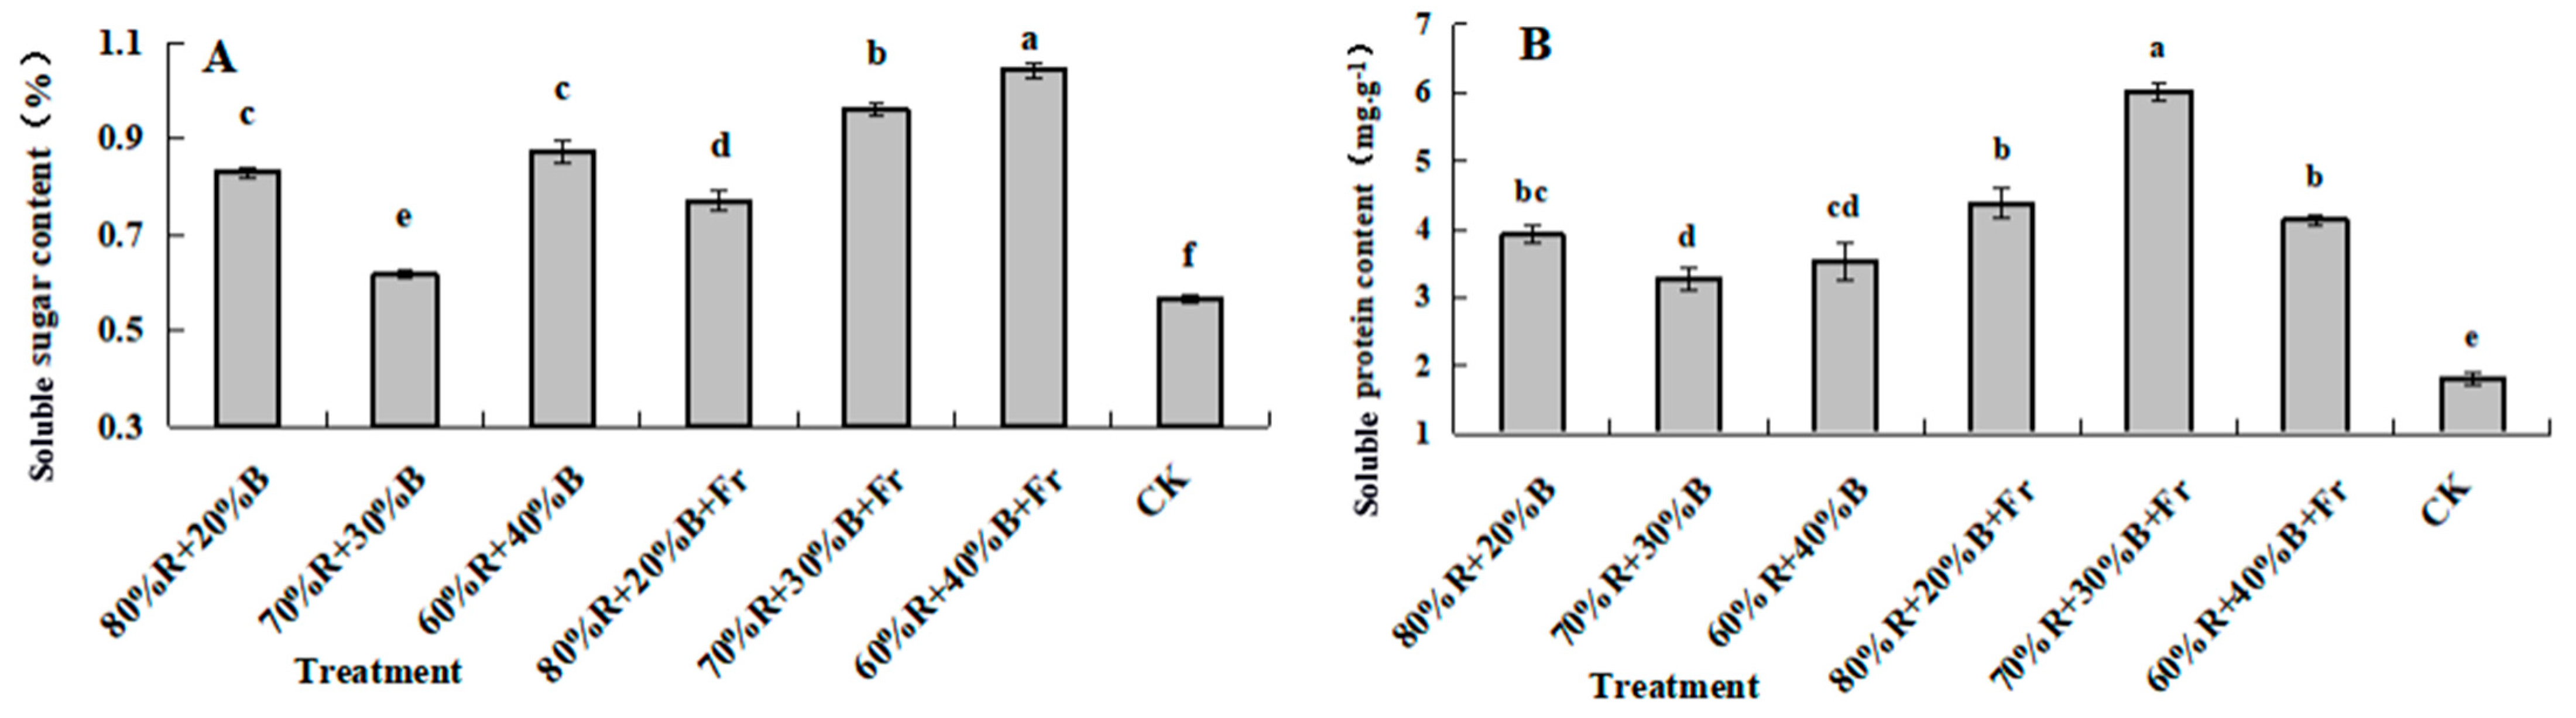
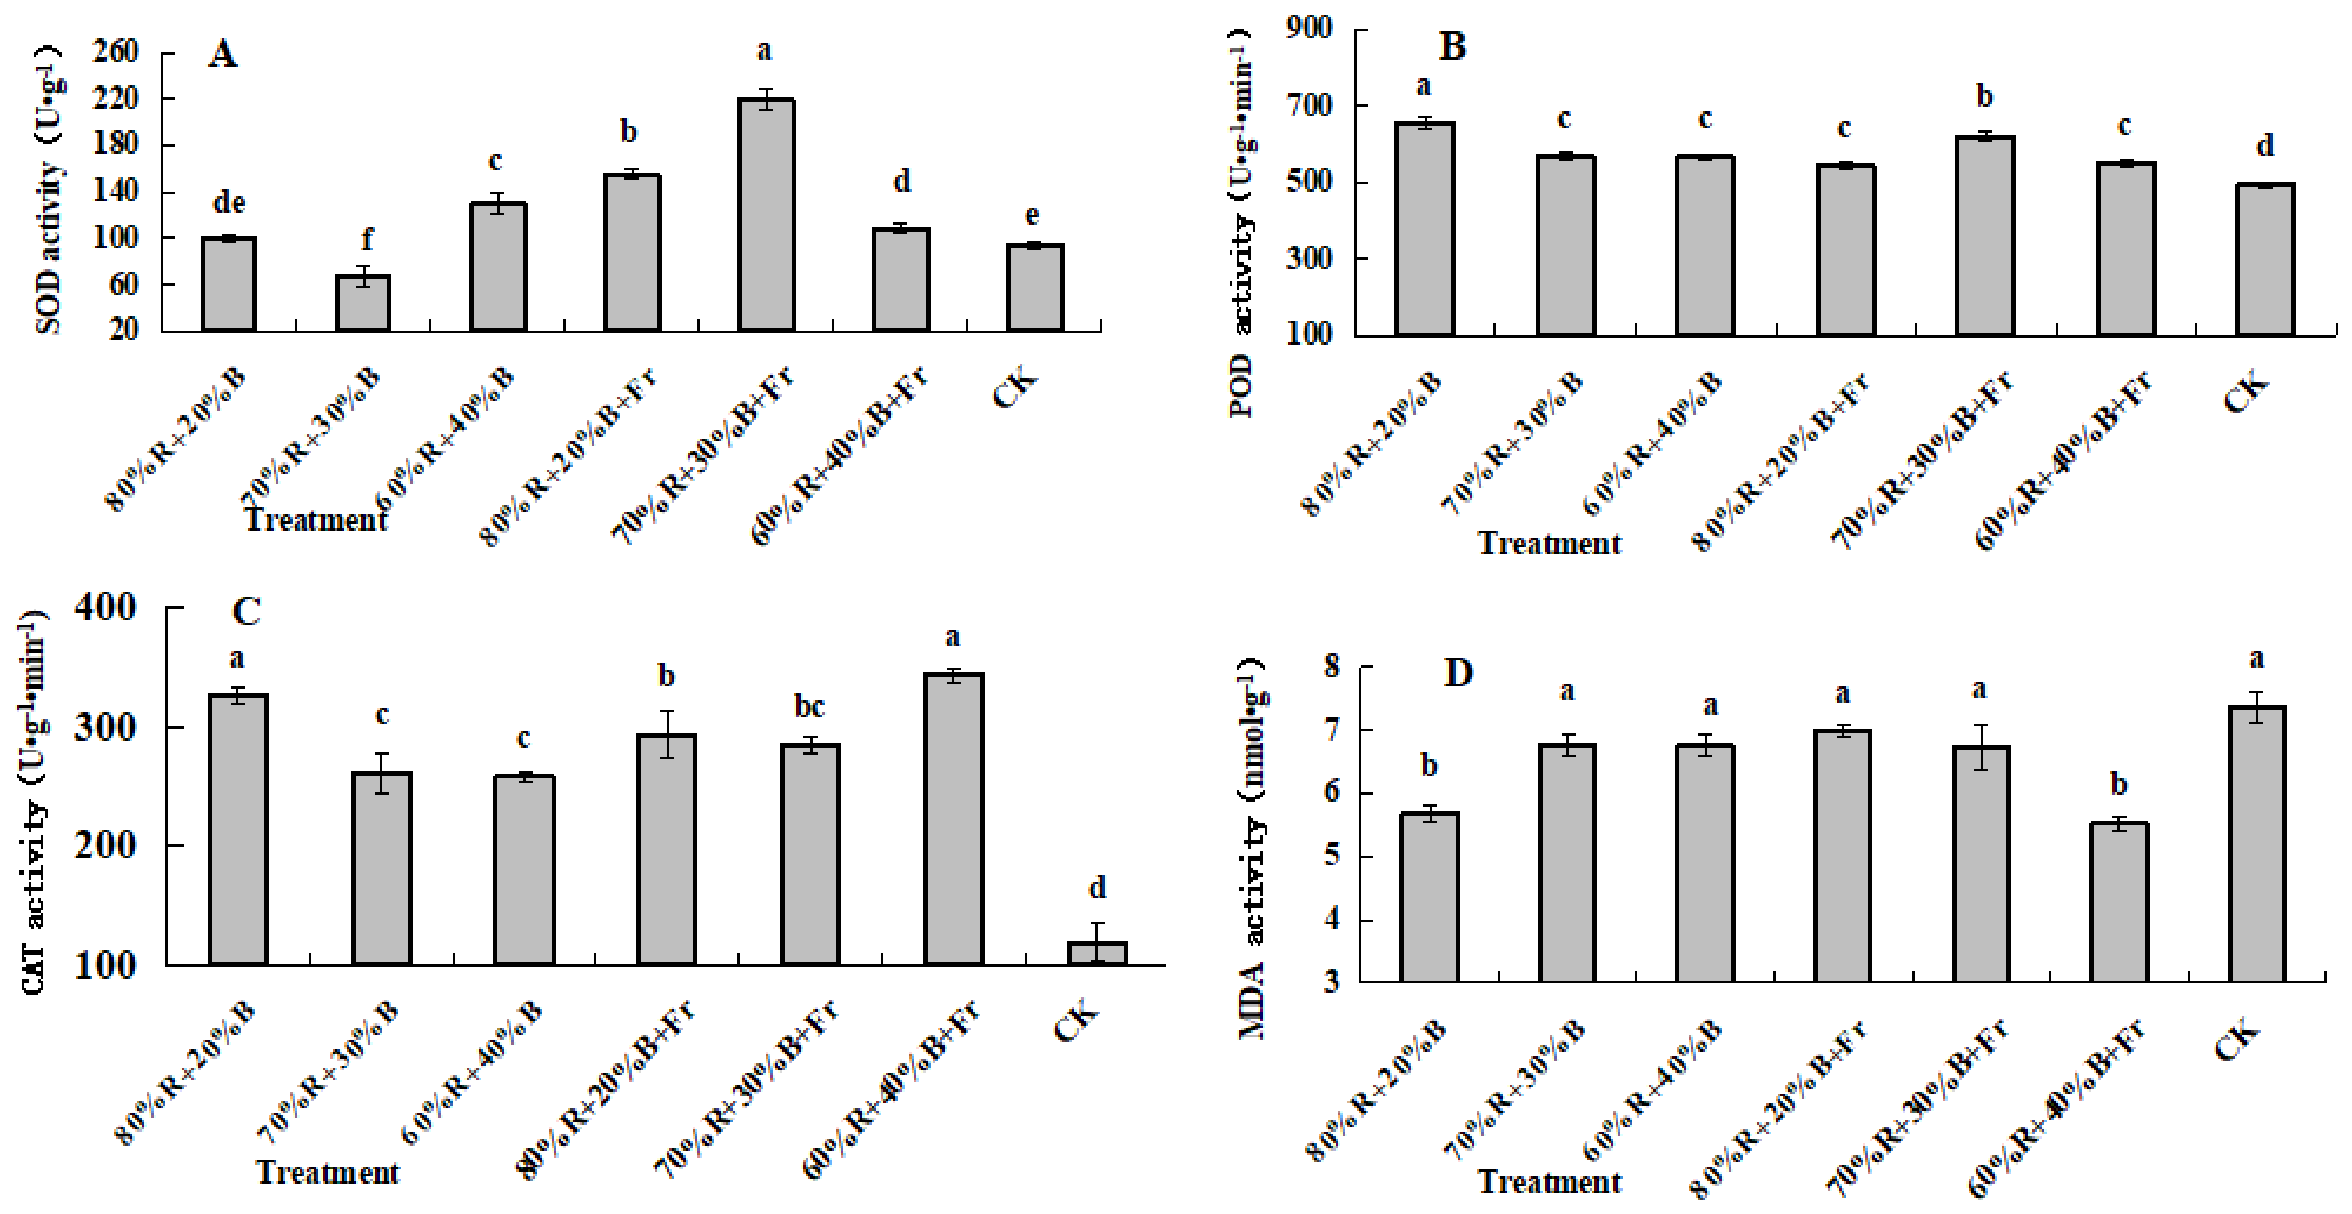
The soluble sugar content of plantlets during in vitro culture exhibited different response patterns depending on the presence of far-red light (Figure 2A). In the absence of far-red supplementation, soluble sugar content decreased initially and then increased as the proportion of red light increased. In contrast, under far-red supplementation, soluble sugar content gradually decreased with increasing red light proportion. Under the same red–blue light ratios, the addition of far-red light significantly enhanced soluble sugar content. Among all treatments, the highest soluble sugar accumulation was observed under the 60%R + 40%B + Fr treatment, whereas the lowest value occurred in the CK treatment. Soluble protein content showed a decrease–increase trend with increasing red light proportion in treatments without far-red supplementation. In contrast, with far-red light addition, soluble protein content increased initially and then decreased. Far-red supplementation significantly enhanced soluble protein accumulation under the same red–blue ratios, with the highest value recorded under the 70%R + 30%B + Fr treatment and the lowest value observed in the CK group (Figure 2B).

3.2.5. Effects of Different Light-Quality Ratios on Antioxidant Enzyme Activities of In Vitro-Rooted Plantlets

The antioxidant enzyme activities and MDA content of plantlets were significantly affected by different light-quality treatments (Figure 3). In treatments without far-red supplementation, SOD activity initially decreased and then increased as the proportion of red light increased. In contrast, under far-red supplementation, SOD activity first increased and then decreased with increasing red light proportion, except for the 60%R + 40%B + Fr treatment. Under the same red–blue light ratios, far-red supplementation significantly increased SOD activity, except in the 60%R + 40%B treatment. The highest SOD activity was observed under the 70%R + 30%B + Fr treatment, whereas the lowest value occurred under the 70%R + 30%B treatment (Figure 3A). POD activity increased progressively with increasing red light proportion in treatments without far-red supplementation (Figure 3B). Among all treatments, the highest POD activity was recorded under the 80%R + 20%B treatment, whereas the lowest value was observed in CK. CAT activity generally increased with increasing red light proportion in treatments without far-red supplementation, except for the 80%R + 20%B + Fr treatment (Figure 3C). Under the same red–blue light ratios, far-red supplementation significantly enhanced CAT activity. The highest CAT activity was observed under the 60%R + 40%B + Fr treatment, whereas the lowest value occurred in CK. In the absence of far-red supplementation, MDA content gradually decreased as the proportion of red light increased. Conversely, under far-red supplementation, MDA content increased progressively with increasing red light proportion (Figure 3D). The highest MDA content was recorded in CK, whereas the lowest value was observed under the 60%R + 40%B + Fr treatment.

3.3. Effect of Different Light-Quality Ratios on the Hydroponic Acclimatization of S. floribundum ‘Tianjiao’ In Vitro Seedlings

3.3.1. Effects of Different Light-Quality Ratios on the Growth of Hydroponically Acclimatized Plantlets

After 60 days of hydroponic cultivation under different light-quality treatments, significant differences were observed in the morphological characteristics of S. floribundum ‘Tianjiao’ plants (Table 6). In treatments without far-red supplementation, plant height gradually decreased as the proportion of red light increased. In contrast, under far-red supplementation, plant height increased initially and then decreased with increasing red light proportion. Under identical red–blue light ratios, the addition of far-red light generally reduced plant height. The greatest plant height was observed under the 60%R + 40%B treatment, whereas the lowest value occurred in CK. Compared with CK, plant height increased by 34.2%, 36.5%, 37.4%, 21.2%, 31.7%, and 20.0% under 80%R + 20%B, 70%R + 30%B, 60%R + 40%B, 80%R + 20%B + Fr, 70%R + 30%B + Fr, and 60%R + 40%B + Fr, respectively. The greatest increase was observed under 60%R + 40%B, indicating that this treatment produced the most pronounced improvement in plant height during hydroponic acclimatization.
Leaf number exhibited a decrease–increase pattern with increasing red light proportion under far-red supplementation, whereas it increased initially and then decreased in treatments without far-red light. Under the same red–blue light ratios, far-red supplementation significantly reduced leaf number. The highest leaf number was recorded under the 70%R + 30%B treatment, while the lowest value was observed in CK. Leaf length was significantly affected by light-quality treatments. Under identical red–blue light ratios, the addition of far-red light reduced leaf length. The longest leaves were observed under the 80%R + 20%B treatment, whereas the shortest leaves occurred in CK. Leaf width increased initially and then decreased with increasing red light proportion, regardless of whether far-red light was supplemented. Among all treatments, the greatest leaf width was recorded under the 70%R + 30%B + Fr treatment, whereas the lowest value was observed in CK. Root length gradually decreased as the proportion of red light increased in treatments without far-red supplementation. In contrast, under far-red supplementation, root length decreased initially and then increased with increasing red light proportion. The longest roots were observed under the 60%R + 40%B treatment, followed by the 60%R + 40%B + Fr treatment.

3.3.2. Effects of Different Light-Quality Ratios on Root Vigor of Hydroponically Acclimatized Plantlets

The root vigor of plantlets exhibited different response patterns depending on the presence of far-red light (Figure 4). In treatments without far-red supplementation, root vigor decreased initially and then increased with increasing red light proportion. In contrast, under far-red supplementation, root vigor increased progressively with increasing red light proportion, except under the 60%R + 40%B + Fr treatment. Under the same red–blue light ratios, far-red supplementation significantly enhanced root vigor. Among all treatments, the highest root vigor was observed under the 60%R + 40%B treatment, followed by the 80%R + 20%B + Fr treatment; both values were significantly higher than those of the other treatments. Conversely, the lowest root vigor was recorded in the CK group.

3.3.3. Effects of Different Light-Quality Ratios on Photosynthetic Pigment Contents of Hydroponically Acclimatized Plantlets

The contents of chlorophyll a, chlorophyll b, total chlorophyll (chlorophyll a + b), and carotenoids in S. floribundum ‘Tianjiao’ generally increased initially and then decreased as the proportion of red light increased (Table 7), except under the 60%R + 40%B + Fr treatment. Under identical red–blue light ratios, far-red supplementation significantly increased the contents of chlorophyll a, chlorophyll b, and total chlorophyll compared with treatments without far-red light, except for the 60%R + 40%B + Fr treatment. Among all treatments, the highest chlorophyll a, chlorophyll b, total chlorophyll, and carotenoid contents were observed under the 70%R + 30%B + Fr treatment.

3.3.4. Effects of Different Light-Quality Ratios on Soluble Sugar and Soluble Protein Contents of Hydroponically Acclimatized Plantlets

The soluble sugar content of S. floribundum ‘Tianjiao’ exhibited distinct responses among different plant organs under varying light-quality treatments (Table 8). In leaves, soluble sugar content increased initially and then decreased as the proportion of red light increased. In contrast, soluble sugar content in stems increased progressively with increasing red light proportion. Among all treatments, the highest soluble sugar contents in both leaves and roots were observed under the 70%R + 30%B + Fr treatment. In stems, the highest soluble sugar content was recorded under the 80%R + 20%B + Fr treatment, whereas the lowest value was observed in CK. Under identical red–blue light ratios, far-red supplementation increased soluble sugar content in leaves, stems, and roots to varying degrees. Soluble protein content in leaves and stems exhibited a decrease–increase pattern with increasing red light proportion. The highest soluble protein content in leaves was observed under the 70%R + 30%B + Fr treatment, whereas the lowest value occurred in CK. In roots, soluble protein content also showed a decrease–increase trend as the proportion of red light increased in treatments without far-red supplementation. However, under far-red supplementation, soluble protein content gradually decreased with increasing red light proportion. Under the same red–blue light ratios, far-red supplementation significantly increased soluble protein content in roots (Table 8).

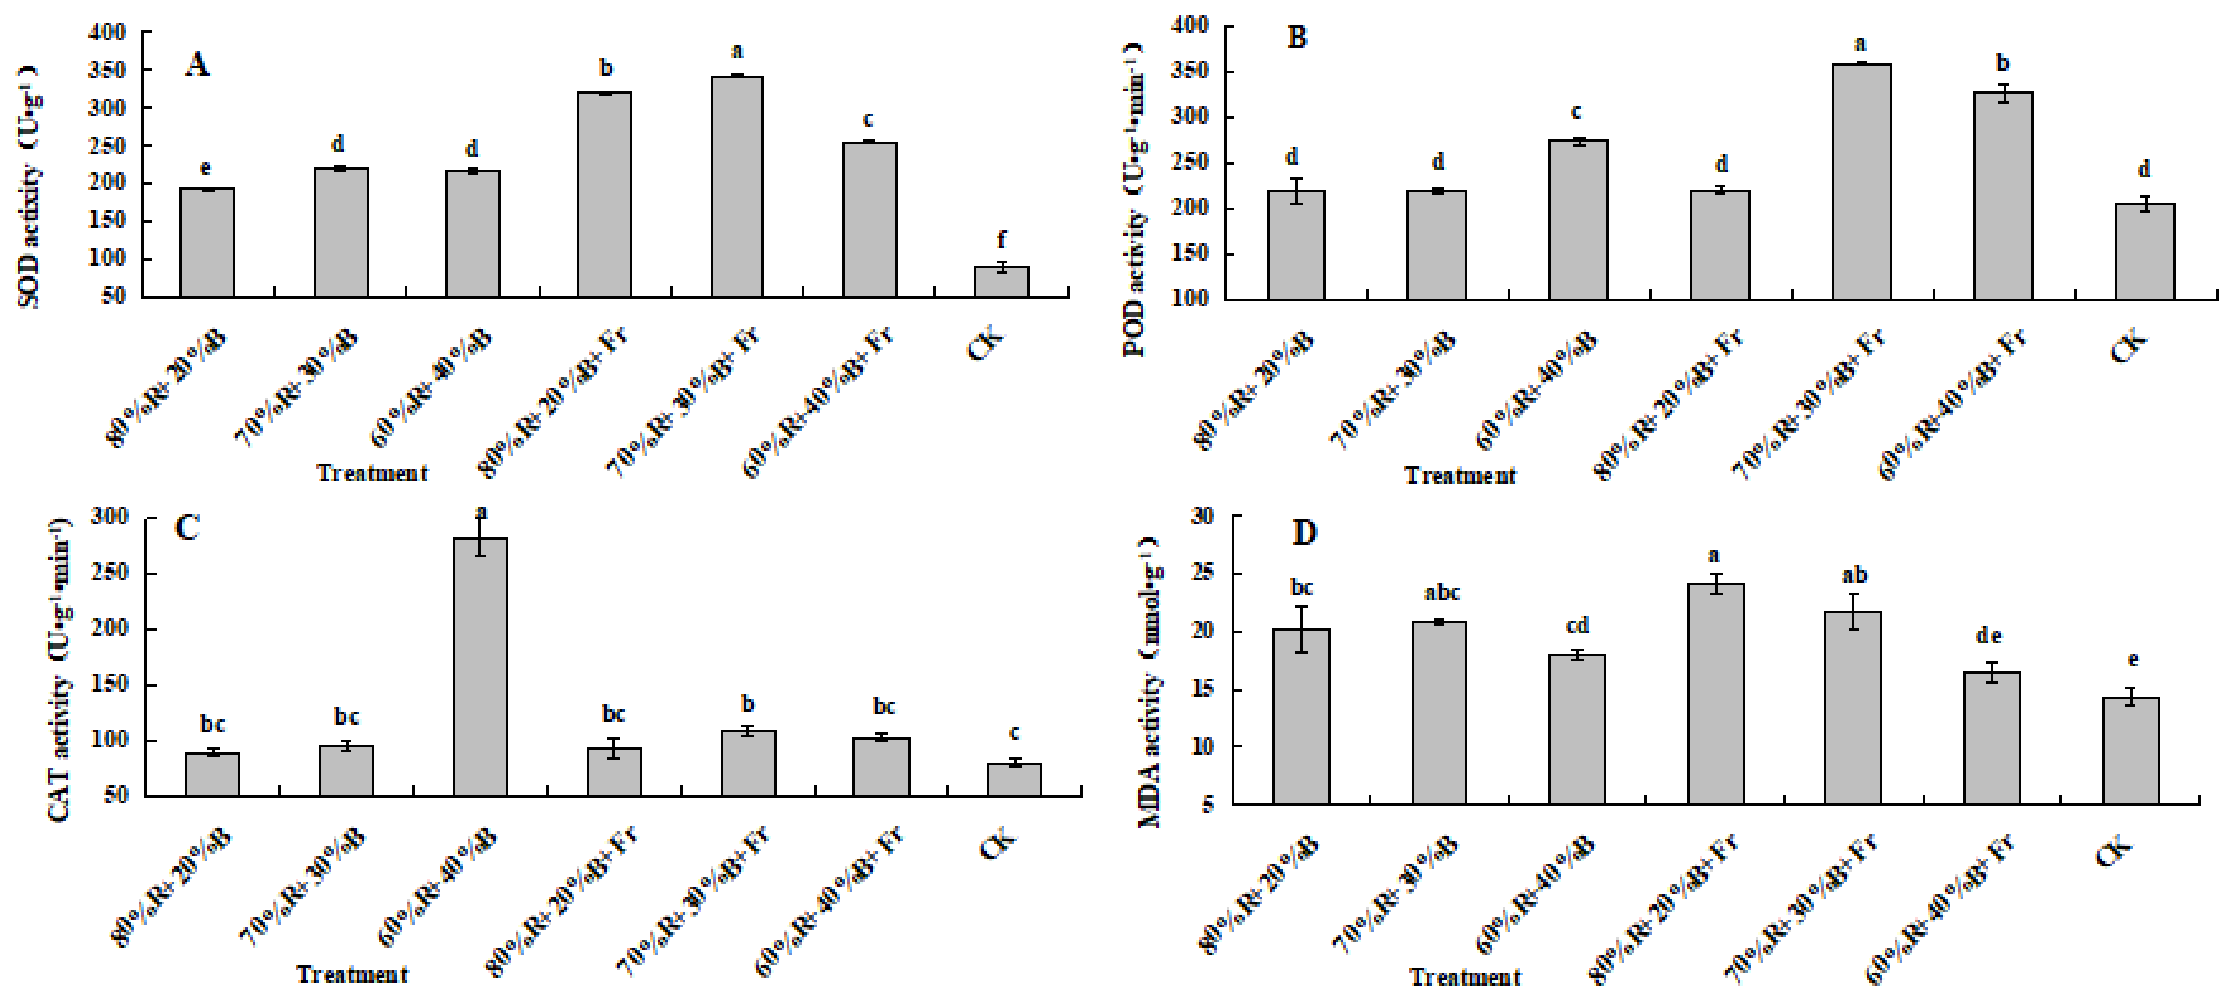
3.3.5. Effects of Different Light-Quality Ratios on Antioxidant Enzyme Activities of Hydroponically Acclimatized Plantlets

The activities of antioxidant enzymes and the malondialdehyde (MDA) content were significantly affected by different light-quality treatments (Figure 5). Under identical red–blue light ratios, far-red supplementation significantly increased SOD activity. As the proportion of red light increased, SOD activity initially increased and then decreased. The highest SOD activity was observed under the 70%R + 30%B + Fr treatment, whereas the lowest value was recorded in CK (Figure 5A). POD activity exhibited different response patterns depending on the presence of far-red light. Under far-red supplementation, POD activity increased initially and then decreased with increasing red light proportion. In contrast, POD activity generally decreased as the proportion of red light increased in treatments without far-red supplementation. Under the same red–blue light ratios, far-red supplementation significantly enhanced POD activity, with the highest value observed under the 70%R + 30%B + Fr treatment and the lowest value recorded in CK (Figure 5B). In treatments without far-red supplementation, CAT activity gradually decreased as the proportion of red light increased. In contrast, under far-red supplementation, CAT activity increased initially and then decreased with increasing red light proportion. The highest CAT activity was observed under the 60%R + 40%B treatment, whereas the lowest value occurred in CK (Figure 5C). MDA content increased initially and then decreased with increasing red light proportion in treatments without far-red supplementation. However, under far-red supplementation, MDA content generally increased as the proportion of red light increased, except under the 60%R + 40%B + Fr treatment. Under identical red–blue light ratios, far-red supplementation significantly increased MDA content. The highest MDA content was observed under the 80%R + 20%B + Fr treatment, whereas the lowest value occurred in CK (Figure 5D).

3.3.6. Effects of Different Light-Quality Ratios on Photosynthetic Parameters of Hydroponically Acclimatized Plantlets

The photosynthetic parameters of S. floribundum ‘Tianjiao’ were assessed after 60 days of hydroponic cultivation under different light-quality treatments (Table 9). In treatments without far-red supplementation, the net photosynthetic rate of leaves gradually decreased as the proportion of red light increased. In contrast, under far-red supplementation, the net photosynthetic rate initially decreased and then increased with increasing red light proportion. The highest net photosynthetic rate was observed under the 60%R + 40%B treatment, followed by the 80%R + 20%B + Fr treatment; both were significantly higher than in other treatments. The lowest value occurred in the control (CK). Transpiration rate showed a gradual decline with increasing red light proportion in treatments without far-red light. In contrast, under far-red supplementation, transpiration rate decreased initially and then increased. The maximum transpiration rate was observed under the 60%R + 40%B treatment, followed by the 60%R + 40%B + Fr treatment, whereas the minimum value occurred in CK. Stomatal conductance decreased gradually with increasing red light in treatments without far-red supplementation, but exhibited an initial decrease followed by an increase when far-red light was added. The highest stomatal conductance was observed under the 60%R + 40%B treatment, and the lowest value occurred in CK. Except for the 80%R + 20%B + Fr treatment, far-red supplementation generally reduced net photosynthetic rate, transpiration rate, and stomatal conductance under identical red–blue ratios. Intercellular CO2 concentration increased initially and then decreased with increasing red light proportion in treatments without far-red supplementation. Under far-red supplementation, intercellular CO2 concentration gradually declined. The highest value was observed in CK, while the lowest occurred under the 80%R + 20%B + Fr treatment. Leaf water vapor pressure deficit was highest in CK and lowest under the 60%R + 40%B treatment. Leaf water-use efficiency decreased gradually with increasing red light in the absence of far-red light, but increased under far-red supplementation. The highest water-use efficiency was observed under the 80%R + 20%B + Fr treatment, and the lowest in CK.

3.4. Correlation Analysis

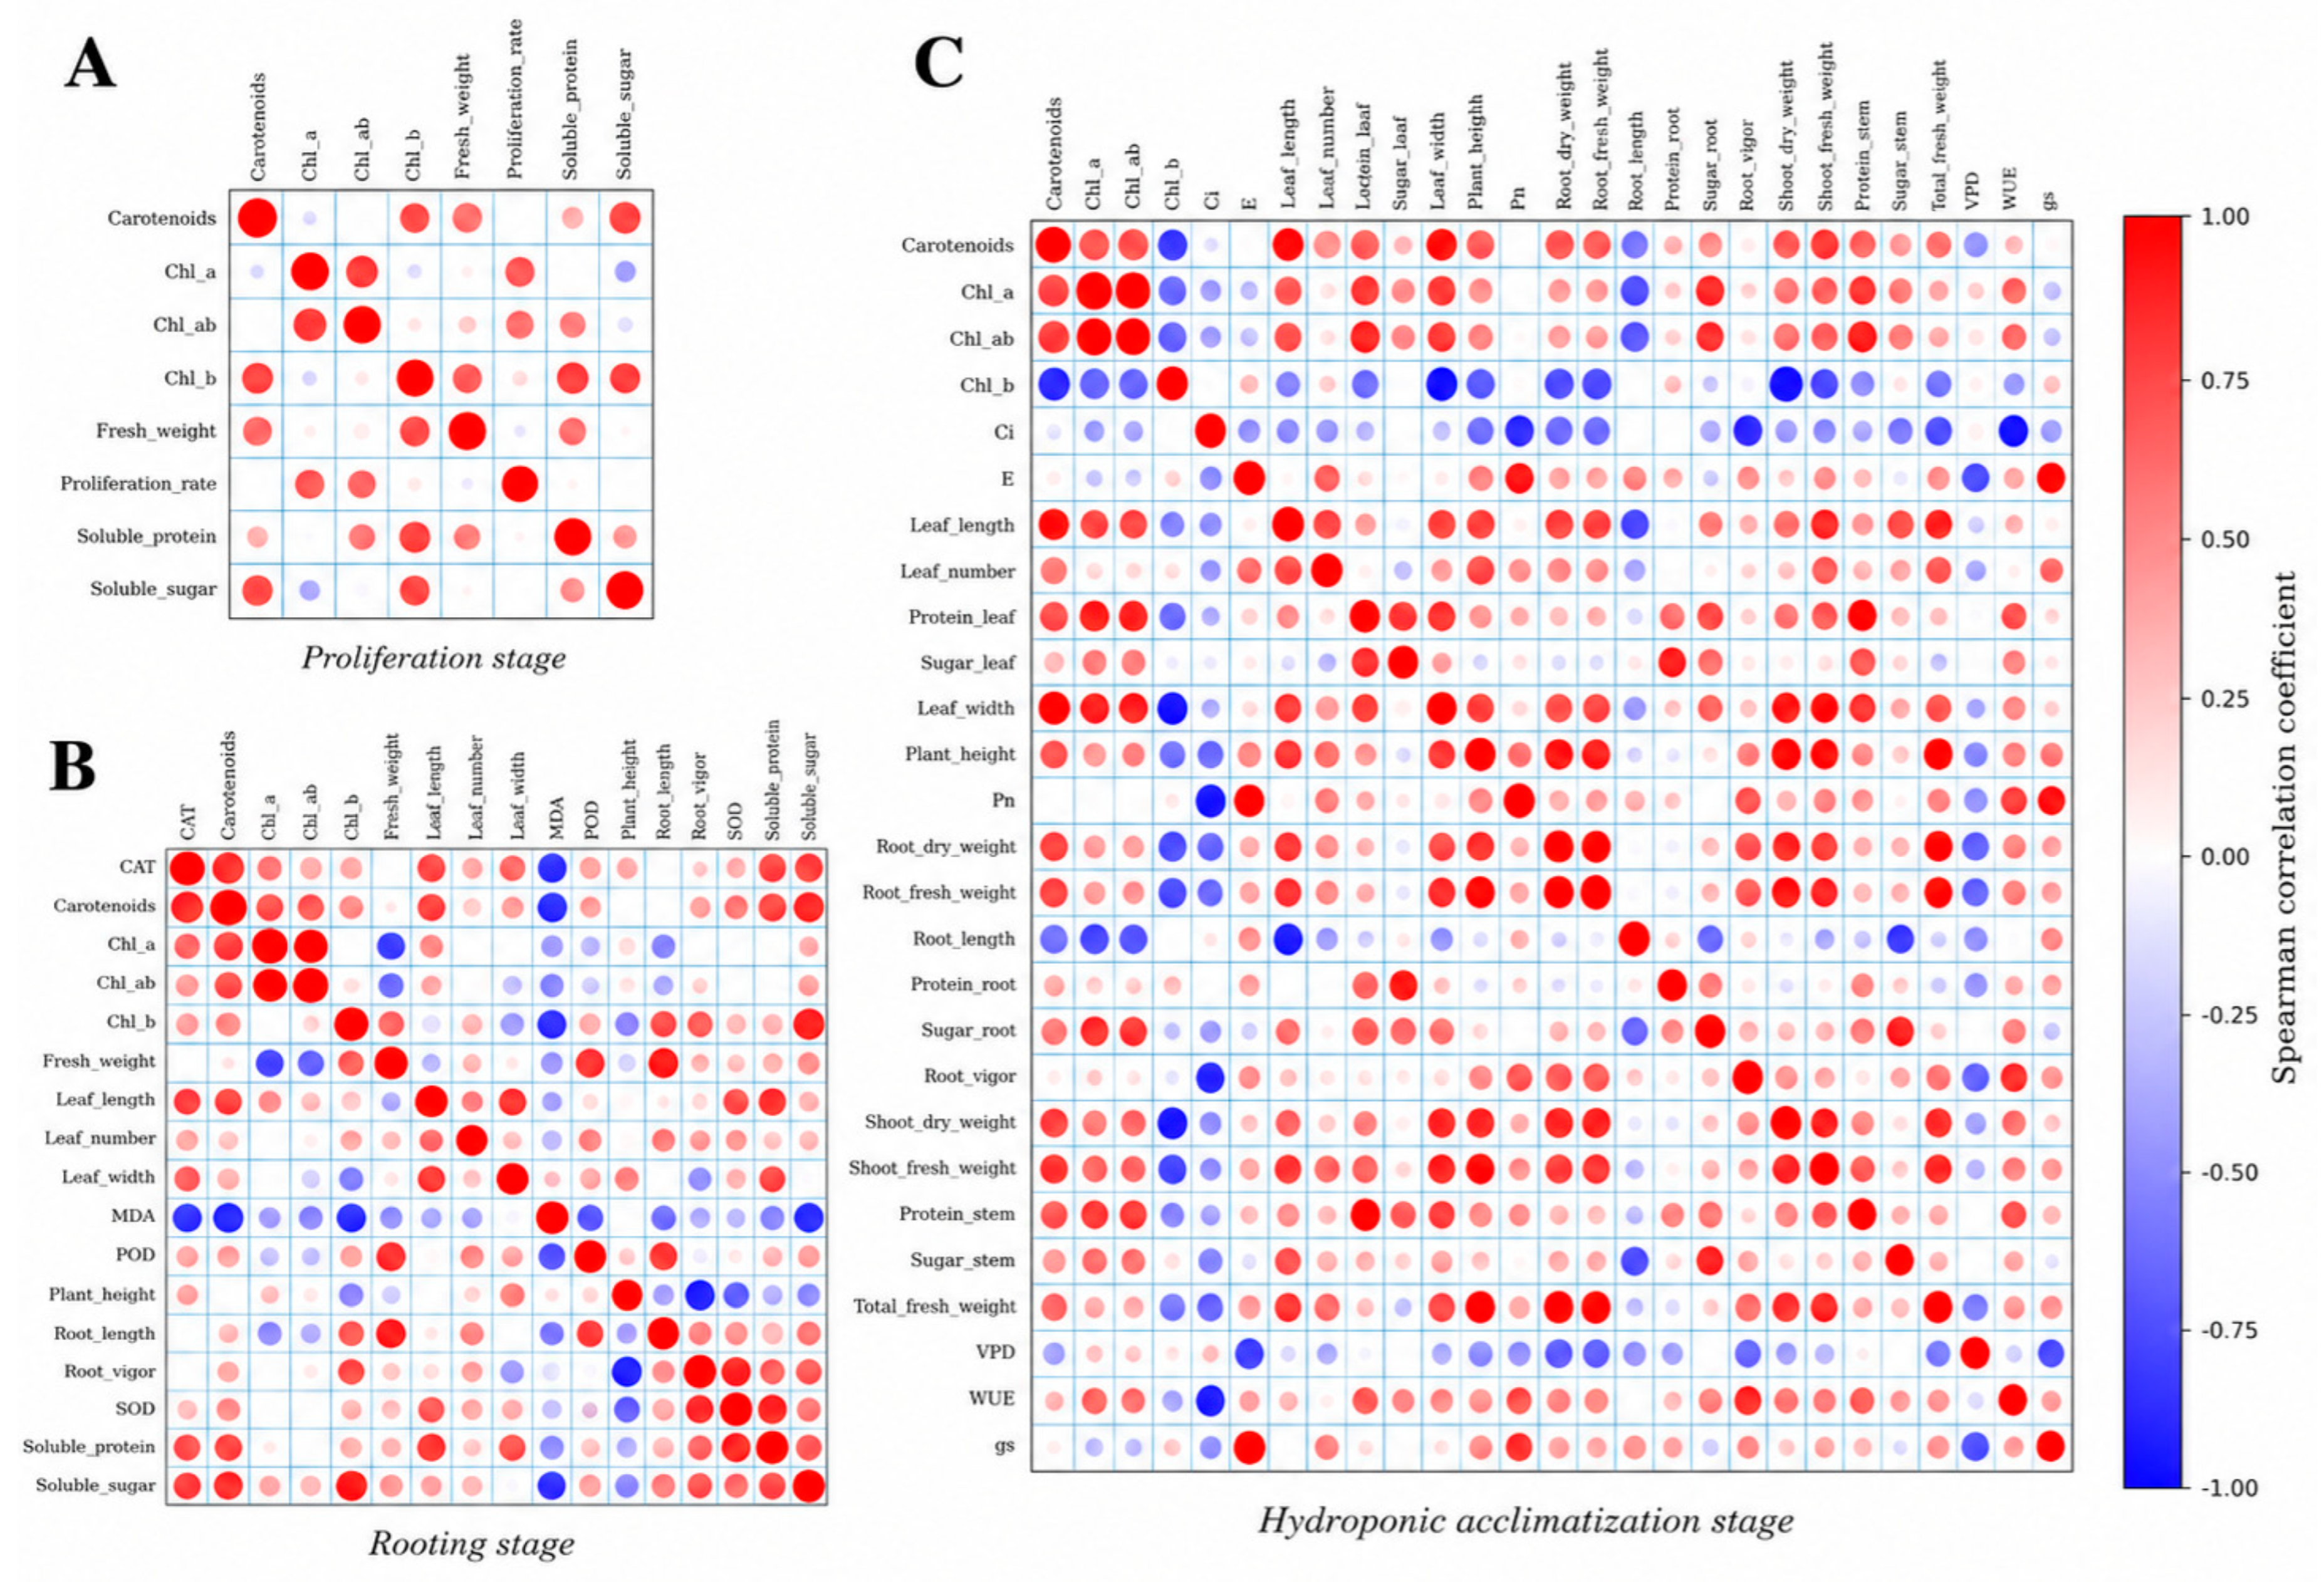
Spearman correlation analysis was performed to explore the relationships among growth, physiological, biochemical, and photosynthetic traits of S. floribundum ‘Tianjiao’ under different LED light-quality treatments (Figure 6). In the proliferation stage, proliferation coefficient and fresh weight were positively associated with photosynthetic pigments and soluble protein content, suggesting that in vitro proliferation was related to coordinated pigment accumulation and nitrogen metabolism. In the rooting stage, leaf length and leaf width showed positive associations, whereas root length displayed a different correlation pattern from most leaf-related traits, indicating that shoot expansion and root elongation responded differently to light-quality treatments. In the hydroponic acclimatization stage, Pn was positively associated with E and gs but negatively associated with Ci, while WUE was negatively associated with Ci. These results suggest that hydroponic acclimatization was closely related to the coordinated regulation of photosynthetic carbon assimilation, stomatal conductance, and water-use efficiency.

4. Discussion

Light quality regulates plant growth not only by providing energy for photosynthesis but also by acting as an environmental signal perceived by specific photoreceptors [26]. Red and far-red light are mainly perceived through the phytochrome system [27], whereas blue light is sensed primarily by cryptochromes and phototropins [28,29]. Therefore, the effects of red, blue, and far-red light on plant morphology, rooting, photosynthetic pigment accumulation, antioxidant metabolism, and photosynthetic performance are not simply additive, but depend on the balance among spectral components, plant species, developmental stage, and culture environment [30]. In the present study, S. floribundum ‘Tianjiao’ showed clearly stage-dependent responses to LED light quality during in vitro proliferation, in vitro rooting, and hydroponic acclimatization, indicating that a single light formula is unlikely to be optimal for the entire production sequence.
Different light qualities can affect stem elongation, leaf development, and biomass accumulation [31]. Previous studies showed that red light promoted stem or internode elongation in chrysanthemum and grape [32,33], whereas blue light promoted stem elongation in marigold [17] and red light inhibited stem elongation in Rehmannia glutinosa [34]. These contrasting responses indicate that red- and blue-light receptors may promote or inhibit elongation depending on the plant species and developmental context. In the present study, the fresh weight of proliferating plantlets was highest under the 60%R + 40%B treatment, and hydroponic plantlets also showed strong growth performance under this treatment. These results suggest that a balanced red–blue spectrum, rather than a high proportion of red or blue light alone, was more favorable for biomass accumulation in S. floribundum ‘Tianjiao’. Leaf number, leaf length, and leaf width were also improved under red–blue mixed light compared with CK, which is consistent with previous observations in Rehmannia glutinosa and cucumber [30,34]. These effects may be related to the complementary roles of red light in photosynthetic energy capture and phytochrome-mediated morphogenesis and blue light in leaf expansion, chloroplast function, and stomatal regulation [27,29].
Far-red light deserves particular attention because its effects are mediated by the red light ratio perceived by phytochromes [35]. A lower red ratio is commonly associated with shade-avoidance signaling, including stem elongation, leaf expansion, and altered biomass allocation [36]. In this study, far-red supplementation did not produce a uniform response across all stages. During the in vitro proliferation stage, 80%R + 20%B + Fr maintained a relatively high proliferation coefficient and produced the highest soluble protein content, suggesting that far-red light may have enhanced physiological activity and nitrogen metabolism under low-light, sucrose-containing in vitro conditions. During the rooting stage, 60%R + 40%B + Fr was favorable for pigment accumulation and antioxidant protection. However, during hydroponic acclimatization, 60%R + 40%B without far-red light showed better overall performance. This stage-specific pattern indicates that far-red light may be more beneficial during early in vitro morphogenesis and rooting than during hydroponic acclimatization, where plantlets need to restore root absorption, stomatal function, and autonomous photosynthesis.
Soluble sugars and soluble proteins are important indicators of carbon and nitrogen metabolism. Soluble sugars function not only as photosynthetic products and osmotic regulators, but also as signaling molecules involved in plant growth, development, maturation, and senescence [37]. Previous studies reported that red light promotes soluble sugar accumulation in upland cotton, lettuce, and grape [31,38,39], whereas blue light can promote protein synthesis and reduce protein degradation [40]. In the present study, soluble sugar content in proliferating and hydroponically acclimatized plantlets was highest under 70%R + 30%B + Fr, whereas in the rooting stage, it was highest under 60%R + 40%B + Fr. These results suggest that far-red supplementation may enhance carbohydrate accumulation under specific red–blue backgrounds. This effect may be associated with far-red-induced changes in leaf expansion and light interception, which can increase photosynthetic assimilation capacity [41]. However, the response was not uniform among stages, indicating that soluble sugar accumulation was regulated by the interaction between spectral composition and developmental status. Soluble protein content also responded differently to red–blue ratios with or without far-red supplementation, supporting the view that red and blue light interact in a complex manner rather than acting as independent or simply additive factors.
Root development is also strongly influenced by light quality, although roots in this study should be interpreted as part of the whole-plant response to shoot-level spectral treatments rather than as organs directly exposed to light. Previous studies showed that red light can promote root vigor, while combined red and blue light is generally more favorable for root induction than monochromatic light [42]. However, the response varies among species and culture systems; for example, Phalaenopsis root growth was promoted by blue light but inhibited by red light [43]. In the present study, mixed red and blue light was more suitable for root development in S. floribundum ‘Tianjiao’ than CK. During the in vitro rooting stage, 60%R + 40%B and 70%R + 30%B + Fr showed favorable root-related responses, whereas during hydroponic acclimatization, 60%R + 40%B promoted root length and root vigor. These results suggest that a moderate proportion of blue light may support root development indirectly by improving shoot photosynthetic capacity, carbohydrate supply, and whole-plant physiological status. This interpretation is also consistent with a recent study on Spathiphyllum cannifolium, in which combined red and blue LEDs improved ex vitro rooting, shoot and root dry weight, photosynthetic performance, and sucrose metabolism in a microponic system [11].
Photosynthetic pigment accumulation is another important response to light quality. Chlorophyll content directly affects light capture and photosynthetic capacity. Blue light has been reported to promote chlorophyll synthesis in some plant materials by enhancing 5-aminolevulinic acid-related processes [44]. However, this response is not universal and may vary depending on plant species, developmental stage, culture conditions, and spectral background [45]. In the proliferation stage of the present study, S. floribundum ’Tianjiao’ plantlets showed relatively higher chlorophyll accumulation under treatments with a higher proportion of red light than under treatments with a higher proportion of blue light. Similar species-dependent responses have also been reported in lettuce [39]. During the rooting stage, the highest chlorophyll a, chlorophyll b, total chlorophyll, and carotenoid contents were observed under 60%R + 40%B + Fr, whereas during hydroponic acclimatization, chlorophyll accumulation was most favorable under 70%R + 30%B + Fr. These findings suggest that chlorophyll accumulation in S. floribundum ’Tianjiao’ is controlled by the red–blue–far-red spectral balance and by developmental stage, rather than by blue light alone. Far-red light may participate in this process through phytochrome-mediated regulation of chloroplast development and leaf expansion, but its effects depend on the background red–blue ratio.
Light quality also regulates antioxidant metabolism. Plants have dynamic light-response systems that integrate reactive oxygen species and hormone signals to optimize light adaptation and stress defense [46]. In the rooting stage of S. floribundum ‘Tianjiao’, SOD activity was highest under 70%R + 30%B + Fr, POD activity was highest under 80%R + 20%B, and CAT activity was highest under 60%R + 40%B + Fr. These results indicate that different antioxidant enzymes responded to different spectral combinations, suggesting that antioxidant protection was regulated by multiple light-signaling pathways [47]. MDA, a product of membrane lipid peroxidation, reflects membrane damage. The relatively high MDA content under CK indicates that fluorescent light was less favorable for maintaining membrane stability than LED treatments. In the hydroponic stage, red–blue mixed light also enhanced antioxidant enzyme activities while maintaining relatively low MDA content, suggesting that balanced LED spectra can improve reactive oxygen species scavenging capacity. Similar responses have been reported in Anthurium hybridum, where red–blue mixed light improved antioxidant enzyme activity and reduced oxidative damage [48].
The improvement in photosynthetic performance under red–blue mixed light may be explained by the complementary roles of red and blue light in photosynthesis and stomatal regulation [49]. Red light efficiently drives photosynthetic electron transport, whereas blue light regulates chloroplast movement, leaf expansion, stomatal opening, and stomatal conductance through phototropin- and cryptochrome-mediated pathways [28,29]. In the hydroponic stage of the present study, the net photosynthetic rate, transpiration rate, stomatal conductance, and water-use efficiency showed favorable responses under 60%R + 40%B. The increase in stomatal conductance with a higher blue light proportion suggests that blue light contributed to stomatal opening and gas exchange, thereby improving CO2 uptake and photosynthetic capacity. Meanwhile, the simultaneous improvement in water-use efficiency indicates that 60%R + 40%B did not merely increase transpiration, but also improved carbon assimilation relative to water loss [50]. Therefore, water-balance-related traits such as transpiration rate, VPD, and WUE should be interpreted together. This is particularly important during hydroponic acclimatization, when plantlets transition from high-humidity in vitro conditions to an environment requiring functional roots, active stomatal regulation, and stable water-use control.
Comparisons with related Araceae species further support the importance of balanced red–blue spectra [51]. In Anthurium andreanum, 7:3 and 6:4 red–blue LED treatments improved morphological traits, chlorophyll content, photosynthetic parameters, and antioxidant enzyme activities under hydroponic culture [48]. Similarly, in Philodendron ‘con-go’, the 6:4 red–blue treatment promoted growth, photosynthetic characteristics, and antioxidant enzyme activity of hydroponic seedlings [12]. Together with the present results, these studies suggest that shade-tolerant Araceae ornamentals generally benefit from balanced red–blue light, but the optimal ratio depends on species, cultivar, and growth stage. For S. floribundum ‘Tianjiao’, far-red supplementation was more useful during in vitro proliferation and rooting, whereas hydroponic acclimatization required a red–blue balance without additional far-red light. This stage-specific response may reflect differences in carbon source availability, humidity, root function, stomatal development, and the degree of dependence on autonomous photosynthesis among the three stages.
The correlation analysis further indicated that the response of S. floribundum ‘Tianjiao’ to LED light quality was stage-dependent. During proliferation, improved growth was associated with pigment accumulation and soluble protein metabolism. During rooting, the different correlation patterns between root length and leaf-related traits suggest that root development and shoot expansion may have different spectral requirements. During hydroponic acclimatization, the close associations among Pn, E, gs, Ci, and WUE indicate that successful acclimatization depended on coordinated photosynthetic gas exchange and water-use regulation. This may partly explain the superior overall performance of the 60%R + 40%B treatment during the hydroponic stage.

5. Conclusions

Taken together, the effects of LED light quality on S. floribundum ‘Tianjiao’ were stage-dependent, and the recommended light-quality treatments differed between proliferation, rooting, and hydroponic acclimatization stages. During the proliferation stage, 80%R + 20%B + Fr was recommended because it maintained a relatively high proliferation coefficient of 4.60, representing a 35.3% increase compared with CK, and produced the highest soluble protein content of 41.51 mg·g−1 FW, representing a 182.6% increase compared with CK. During the rooting stage, 60%R + 40%B + Fr was the most suitable treatment, as it resulted in the highest total chlorophyll content of 0.109 mg·g−1 FW and carotenoid content of 0.026 mg·g−1 FW, which were 137.0% and 225.0% higher than in CK, respectively. During hydroponic acclimatization, 60%R + 40%B without far-red light showed the best overall performance, with plant height reaching 15.28 cm, root length reaching 17.44 cm, and net photosynthetic rate reaching 4.77 μmol·m−2·s−1. Compared with CK, plant height and root length increased by 37.4% and 18.5%, respectively. These results indicate that far-red supplementation was more beneficial during in vitro proliferation and rooting, whereas 60%R + 40%B without far-red light was more suitable for hydroponic acclimatization. Therefore, stage-specific LED light management may provide a practical strategy for improving the efficiency and consistency of this cultivar from tissue culture to hydroponic acclimatization.

Author Contributions

Study conception and design: L.S., Z.W. and Y.S. (Yinglong Song); data collection: W.L. and X.L.; analysis and interpretation of results: W.S., D.H., Y.S. (Yuxiao Shen) and S.H.; draft manuscript preparation: M.Y. and W.L. All authors have read and agreed to the published version of the manuscript.

Funding

This study was financially supported by the Science and Technology Innovation Teams in Colleges and Universities of Henan Province (26IRTSTHN011), the Higher Education Teaching Reform Research and Practice Project of Henan Agricultural University (2026XJGLX05), the University-Industry Cooperation Foundation of Henan Province (Grant No. 162107000068) and the Henan Provincial Post Expert (Grant No. HARS-22-11-G4).

Institutional Review Board Statement

Not applicable.

Informed Consent Statement

Not applicable.

Data Availability Statement

The original contributions presented in this study are included in the article. Further inquiries can be directed to the corresponding authors.

Conflicts of Interest

The authors declare that they have no conflicts of interest to report regarding the present study.

References

  1. Croat, T.B.; Ortiz, O.O. Distribution of Araceae and the diversity of life forms. Acta Soc. Bot. Pol. 2020, 89, 8939. [Google Scholar] [CrossRef]
  2. Qin, H.Y.; Qiu, M.H. Rapid Propagation of S. floribundum. Trop. Agric. Sci. 2008, 28, 32–33. [Google Scholar]
  3. Zhu, G.F. Tissue culture and propagation of Spathiphyllum floribundum ‘Supreme’. Subtrop. Plant Sci. 2004, 33, 53. [Google Scholar]
  4. Bandyopadhyay, T.K.; Bandyopadhyay, M.; da Silva, J.A.T.; Paul, S.; Dam, A.; Ghosh, P.D. An efficient micropropagation protocol to control abnormality in longterm shoot cultures of Spathiphyllum floribundum (L.)‘Petite’. Floric. Ornam. Biotechnol. 2011, 5, 57–63. [Google Scholar]
  5. Ramirez-Malagon, R.; Borodanenko, A.; Barrera-Guerra, J.L.; Ochoa-Alejo, N. Shoot number and shoot size as affected by growth regulators in in vitro cultures of Spathiphyllum floribundum L. Sci. Hortic. 2001, 89, 227–236. [Google Scholar] [CrossRef]
  6. Dewir, Y.H.; Chakrabarty, D.; Hahn, E.J.; Paek, K.Y. A simple method for mass propagation of Spathiphyllum cannifolium using an airlift bioreactor. Vitr. Cell. Dev. Biol. Plant 2006, 42, 291–297. [Google Scholar] [CrossRef]
  7. Song, Y.L.; Shang, W.Q.; Wang, Z.; He, S.L.; Shi, L.Y.; Shen, Y.X.; Lou, X.Y.; Sun, Y.K. Effects of different light-emitting diode qualities on the growth and photosynthetic characteristics of Spathiphyllum floribundum. Can. J. Plant Sci. 2022, 102, 911–925. [Google Scholar] [CrossRef]
  8. Heemers, L.; Oyaert, E.; Van Labeke, M.C.; Volckaert, E.; Debergh, P.; van Staden, J. Seasonal influence on vegetative growth and flower initiation of Spathiphyllum. S. Afr. J. Bot. 2003, 69, 129–134. [Google Scholar] [CrossRef]
  9. Teixeira da Silva, J.A.; Giang, D.D.T.; Tanaka, M. Photoautotrophic micropropagation of Spathiphyllum. Photosynthetica 2006, 44, 53–61. [Google Scholar] [CrossRef]
  10. Yu, B.; Liao, F.X.; Liu, J.M.; Sun, Y.B.; Huang, L.L. Efficient regeneration and transformation of Spathiphyllum cannifolium. Plant Cell Tissue Organ Cult. (PCTOC) 2016, 127, 325–334. [Google Scholar] [CrossRef]
  11. Yu, S.; Li, K.H.; Song, H.L.; Dai, Y.; Jiang, Y.J.; Jin, M.Y.; Piao, X.C.; Lian, M.L. Light-emitting diodes affect plantlet growth of Spathiphyllum cannifolium by regulating photosynthesis and sucrose metabolism during ex vitro rooting. Plant Cell Tissue Organ Cult. (PCTOC) 2025, 160, 57. [Google Scholar] [CrossRef]
  12. Zhu, J.L.; Shang, W.Q.; Li, D.P.; Sun, Y.K.; Liu, W.C.; He, S.L.; Song, Y.L.; Shen, Y.X.; Wang, Z. Effects of LED red and blue light quality on the growth and photosynthetic characteristics of Philodendron’con-go’hydroponic seedlings. Technol. Hortic. 2025, 5, e038. [Google Scholar] [CrossRef]
  13. Hoenecke, M.E.; Bula, R.J.; Tibbitts, T.W. Importance ofBlue’Photon Levels for Lettuce Seedlings Grown under Red-light-emitting Diodes. HortScience 1992, 27, 427–430. [Google Scholar] [CrossRef] [PubMed]
  14. Tripathy, B.C.; Brown, C.S. Root-shoot interaction in the greening of wheat seedlings grown under red light. Plant Physiol. 1995, 107, 407–411. [Google Scholar] [CrossRef] [PubMed]
  15. Heo, J.; Lee, C.; Chakrabarty, D.; Paek, K. Growth responses of marigold and salvia bedding plants as affected by monochromic or mixture radiation provided by a light-emitting diode (LED). Plant Growth Regul. 2002, 38, 225–230. [Google Scholar] [CrossRef]
  16. Aalifar, M.; Aliniaeifard, S.; Arab, M.; Zare Mehrjerdi, M.; Dianati Daylami, S.; Serek, M.; Woltering, E.; Li, T. Blue light improves vase life of carnation cut flowers through its effect on the antioxidant defense system. Front. Plant Sci. 2020, 11, 511. [Google Scholar] [CrossRef] [PubMed]
  17. Dutta Gupta, S.; Jatothu, B. Fundamentals and applications of light-emitting diodes (LEDs) in in vitro plant growth and morphogenesis. Plant Biotechnol. Rep. 2013, 7, 211–220. [Google Scholar] [CrossRef]
  18. Guo, Y.X.; Zhong, Y.F.; Mo, L.W.; Zhang, W.; Chen, Y.Z.; Wang, Y.C.; Chen, H.; Wang, Z.F.; Song, X.Q.; Meng, X.Y. Different combinations of red and blue LED light affect the growth, physiology metabolism and photosynthesis of in vitro-cultured Dendrobium nobile ‘Zixia’. Hortic. Environ. Biotechnol. 2023, 64, 393–407. [Google Scholar] [CrossRef]
  19. Chen, Y.; Wang, Z.; Ji, S.Y.; He, S.L.; Xia, Y.L. Effects of Different Light Quality Ratios of Light Emitting Diode (LED) on the Growth of Anthurium andraeanum Plantlets in Vitro. Acta Agric. Univ. Jiangxiensis 2013, 35, 375–380. [Google Scholar]
  20. Hung, C.D.; Hong, C.H.; Kim, S.K.; Lee, K.H.; Park, J.Y.; Nam, M.W.; Choi, D.H.; Lee, H.I. LED light for in vitro and ex vitro efficient growth of economically important highbush blueberry (Vaccinium corymbosum L.). Acta Physiol. Plant. 2016, 38, 152. [Google Scholar] [CrossRef]
  21. Bergstrand, K.J.; Mortensen, L.M.; Suthaparan, A.; Gislerød, H.R. Acclimatisation of greenhouse crops to differing light quality. Sci. Hortic. 2016, 204, 1–7. [Google Scholar] [CrossRef]
  22. Razzak, M.A.; Asaduzzaman, M.; Tanaka, H.; Asao, T. Effects of supplementing green light to red and blue light on the growth and yield of lettuce in plant factories. Sci. Hortic. 2022, 305, 111429. [Google Scholar] [CrossRef]
  23. Yuan, C.Q.; Ahmad, S.; Cheng, T.R.; Wang, J.; Pan, H.T.; Zhao, L.J.; Zhang, Q.X. Red to far-red light ratio modulates hormonal and genetic control of axillary bud outgrowth in chrysanthemum (Dendranthema grandiflorum ‘Jinba’). Int. J. Mol. Sci. 2018, 19, 1590. [Google Scholar] [CrossRef] [PubMed]
  24. Zhao, S.J.; Cang, J. Laboratory Instruction of Plant Physiology; China Agricultural Science and Technology Press: Beijing, China, 1998; p. 68–72, 123–125. [Google Scholar]
  25. Ryssov-Nielsen, H. Measurement of the inhibition of respiration in activated sludge by a modified determination of the TTC-dehydrogenase activity. Water Res. 1975, 9, 1179–1185. [Google Scholar] [CrossRef]
  26. Mawphlang, O.I.; Kharshiing, E.V. Photoreceptor mediated plant growth responses: Implications for photoreceptor engineering toward improved performance in crops. Front. Plant Sci. 2017, 8, 1181. [Google Scholar] [CrossRef] [PubMed]
  27. Franklin, K.A.; Whitelam, G.C. Phytochromes and shade-avoidance responses in plants. Ann. Bot. 2005, 96, 169–175. [Google Scholar] [CrossRef] [PubMed]
  28. Takemiya, A.; Inoue, S.I.; Doi, M.; Kinoshita, T.; Shimazaki, K.I. Phototropins promote plant growth in response to blue light in low light environments. Plant Cell 2005, 17, 1120–1127. [Google Scholar] [CrossRef] [PubMed]
  29. Inoue, S.I.; Kinoshita, T. Blue light regulation of stomatal opening and the plasma membrane H+-ATPase. Plant Physiol. 2017, 174, 531–538. [Google Scholar] [CrossRef] [PubMed]
  30. Hernández, R.; Kubota, C. Physiological responses of cucumber seedlings under different blue and red photon flux ratios using LEDs. Environ. Exp. Bot. 2016, 121, 66–74. [Google Scholar] [CrossRef]
  31. Li, C.X.; Xu, Z.G.; Dong, R.Q.; Chang, S.X.; Wang, L.Z.; Khalil-Ur-Rehman, M.; Tao, J.M. An RNA-seq analysis of grape plantlets grown in vitro reveals different responses to blue, green, red LED light, and white fluorescent light. Front. Plant Sci. 2017, 8, 78. [Google Scholar] [CrossRef] [PubMed]
  32. Kim, S.J.; Hahn, E.J.; Heo, J.W.; Paek, K.Y. Effects of LEDs on net photosynthetic rate, growth and leaf stomata of chrysanthemum plantlets in vitro. Sci. Hortic. 2004, 101, 143–151. [Google Scholar] [CrossRef]
  33. Poudel, P.R.; Kataoka, I.; Mochioka, R. Effect of red-and blue-light-emitting diodes on growth and morphogenesis of grapes. Plant Cell Tissue Organ Cult. 2008, 92, 147–153. [Google Scholar]
  34. Hahn, E.J.; Kozai, T.; Paek, K.Y. Blue and red light-emitting diodes with or without sucrose and ventilation affect in vitro growth of Rehmannia glutinosa plantlets. J. Plant Biol. 2000, 43, 247–250. [Google Scholar] [CrossRef]
  35. Lei, Y.Q.; Ma, Q.; Zhang, Y.H.; Li, J.L.; Ning, X.Z.; Wang, Y.C.; Ge, X.Y.; Zhao, H.; Lin, H. Functional dissection of phytochrome A in plants. Front. Plant Sci. 2024, 15, 1340260. [Google Scholar] [CrossRef] [PubMed]
  36. Casal, J.J.; Fankhauser, C. Shade avoidance in the context of climate change. Plant Physiol. 2023, 191, 1475–1491. [Google Scholar] [CrossRef] [PubMed]
  37. Koch, K.E.; Ying, Z.; Wu, Y.; Avigne, W.T. Multiple paths of sugar-sensing and a sugar/oxygen overlap for genes of sucrose and ethanol metabolism. J. Exp. Bot. 2000, 51, 417–427. [Google Scholar] [CrossRef] [PubMed]
  38. Li, H.; Xu, Z.; Tang, C. Effect of light-emitting diodes on growth and morphogenesis of upland cotton (Gossypium hirsutum L.) plantlets in vitro. Plant Cell Tissue Organ Cult. (PCTOC) 2010, 103, 155–163. [Google Scholar] [CrossRef]
  39. Wang, J.; Lu, W.; Tong, Y.X.; Yang, Q.C. Leaf morphology, photosynthetic performance, chlorophyll fluorescence, stomatal development of lettuce (Lactuca sativa L.) exposed to different ratios of red light to blue light. Front. Plant Sci. 2016, 7, 250. [Google Scholar] [CrossRef] [PubMed]
  40. Bian, Z.H.; Yang, Q.C.; Liu, W.K. Effects of light quality on the accumulation of phytochemicals in vegetables produced in controlled environments: A review. J. Sci. Food Agric. 2015, 95, 869–877. [Google Scholar] [PubMed]
  41. Lee, M.J.; Son, K.H.; Oh, M.M. Increase in biomass and bioactive compounds in lettuce under various ratios of red to far-red LED light supplemented with blue LED light. Hortic. Environ. Biotechnol. 2016, 57, 139–147. [Google Scholar] [CrossRef]
  42. Budiarto, K. Spectral quality affects morphogenesis on Anthurium plantlet during in vitro culture. AGRIVITA J. Agric. Sci. 2010, 32, 234–240. [Google Scholar]
  43. Shin, K.S.; Murthy, H.N.; Heo, J.W.; Hahn, E.J.; Paek, K.Y. The effect of light quality on the growth and development of in vitro cultured Doritaenopsis plants. Acta Physiol. Plant. 2008, 30, 339–343. [Google Scholar] [CrossRef]
  44. Kamiya, A.; Ikegami, I.; Hase, E. Effects of light on chlorophyll formation in cultured tobacco cells II. Blue light effect on 5-aminolevulinic acid formation. Plant Cell Physiol. 1983, 24, 799–809. [Google Scholar] [CrossRef]
  45. Lin, M.J.; Hsu, B.D. Photosynthetic plasticity of Phalaenopsis in response to different light environments. J. Plant Physiol. 2004, 161, 1259–1268. [Google Scholar] [CrossRef] [PubMed]
  46. Szechyńska-Hebda, M.; Kruk, J.; Górecka, M.; Karpińska, B.; Karpiński, S. Evidence for light wavelength-specific photoelectrophysiological signaling and memory of excess light episodes in Arabidopsis. Plant Cell 2010, 22, 2201–2218. [Google Scholar] [CrossRef] [PubMed]
  47. Manivannan, A.; Soundararajan, P.; Halimah, N.; Ko, C.H.; Jeong, B.R. Blue LED light enhances growth, phytochemical contents, and antioxidant enzyme activities of Rehmannia glutinosa cultured in vitro. Hortic. Environ. Biotechnol. 2015, 56, 105–113. [Google Scholar] [CrossRef]
  48. Song, Y.L.; Shang, W.Q.; Ma, D.D.; Wang, Z.; He, S.L.; Shi, L.Y.; Shen, Y.X.; He, D.; Wang, E.Q.; Wang, X.H. Effect on the growth and photosynthetic characteristics of Anthurium andreanum (‘Pink Champion’,‘Alabama’) under hydroponic culture by different LED light spectra. Horticulturae 2022, 8, 389. [Google Scholar] [CrossRef]
  49. Hogewoning, S.W.; Trouwborst, G.; Maljaars, H.; Poorter, H.; van Ieperen, W.; Harbinson, J. Blue light dose–responses of leaf photosynthesis, morphology, and chemical composition of Cucumis sativus grown under different combinations of red and blue light. J. Exp. Bot. 2010, 61, 3107–3117. [Google Scholar] [CrossRef] [PubMed]
  50. Matthews, J.S.; Vialet-Chabrand, S.; Lawson, T. Role of blue and red light in stomatal dynamic behaviour. J. Exp. Bot. 2020, 71, 2253–2269. [Google Scholar] [CrossRef] [PubMed]
  51. Song, Y.L. Development of LED Hydroponic System and Effects on the Growth of Spathiphyllum floribundum, Anthurium andraeanum and Philodendron. Master‘s Thesis, Henan Agricultural University, Zhengzhou, China, 2016. [Google Scholar]
Figure 1. Effects of different light-quality treatments on root vigor of in vitro-rooted Spathiphyllum floribundum ‘Tianjiao’ plantlets. (Values are means ± SE (n = 3). Means followed by different letters are significantly different according to Duncan’s multiple range test (DMRT) at p < 0.05.)
Horticulturae 12 00916 g001
Figure 2. Effects of different light qualities on soluble sugar (A) and soluble protein (B) in Spathiphyllum floribundum ‘Tianjiao’ tissue culture. (Values are means ± SE (n = 3). Means followed by different letters are significantly different according to Duncan’s multiple range test (DMRT) at p < 0.05.)
Horticulturae 12 00916 g002
Figure 3. Effects of different light qualities on the antioxidant enzyme activity of Spathiphyllum floribundum ‘Tianjiao’ tissue culture. (A) Superoxide dismutase (SOD) activity, (B) peroxidase (POD) activity, (C) catalase (CAT) activity, and (D) malondialdehyde (MDA) content. (Values are means ± SE (n = 3). Means followed by different letters are significantly different according to Duncan’s multiple range test (DMRT) at p < 0.05.)
Horticulturae 12 00916 g003
Figure 4. Effects of different light qualities on root vigor of Spathiphyllum floribundum ‘Tianjiao’ hydroponics. (Values are means ± SE (n = 3). Means followed by different letters are significantly different according to Duncan’s multiple range test (DMRT) at p < 0.05.)
Horticulturae 12 00916 g004
Figure 5. Effects of different light qualities on the antioxidant enzyme activity of Spathiphyllum floribundum ‘Tianjiao’ hydroponics. (A) Superoxide dismutase (SOD) activity, (B) peroxidase (POD) activity, (C) catalase (CAT) activity, and (D) malondialdehyde (MDA) content. (Values are means ± SE (n = 3). Means followed by different letters are significantly different according to Duncan’s multiple range test (DMRT) at p < 0.05.)
Horticulturae 12 00916 g005
Figure 6. Correlation analysis among growth, physiological, biochemical, and photosynthetic traits of Spathiphyllum floribundum ‘Tianjiao’ under different LED light-quality treatments. (A) In vitro proliferation stage; (B) in vitro rooting stage; (C) hydroponic acclimatization stage. The color and size of each circle represent the direction and strength of the Spearman correlation coefficient, respectively.
Horticulturae 12 00916 g006
Table 1. Different light-quality LED treatments.
TreatmentLight QualityPeak Wavelength (nm)
80%R + 20%B 80% red (R) + 20% blue (B)661.2 + 447.0
70%R + 30%B70%Red (R) + 30%Blue (B)661.2 + 447.0
60%R + 40%B 60% red (R) + 40% blue (B)661.2 + 447.0
80%R + 20%B + FrFr 80%Red (R) + 20%Blue (B) + Fr661.2 + 447.0 + 734.6
70%R + 30%B + FrFr 70%Red (R) + 30%Blue (B) + Fr661.2 + 447.0 + 734.6
60%R + 40%B + FrFr 60%Red (R) + 40%Blue (B) + Fr661.2 + 447.0 + 734.6
CK Fluorescent380–750
Table 2. Effects of different light-quality treatments on the proliferation coefficient, fresh weight, soluble sugar content, and soluble protein content of proliferating Spathiphyllum floribundum ‘Tianjiao’ plantlets.
TreatmentPropagation RateFresh Weight
(g)
Soluble Sugar (%)Soluble Protein (mg·g−1)
80%R + 20%B5.20 ± 0.37a1.76 ± 0.06c3.43 ± 0.13c14.90 ± 1.17e
70%R + 30%B5.20 ± 0.37a1.80 ± 0.08c2.84 ± 0.03d29.49 ± 1.16bc
60%R + 40%B5.00 ± 0.45a2.65 ± 0.08a2.05 ± 0.04e27.18 ± 0.56cd
80%R + 20%B + Fr4.60 ± 0.40a2.26 ± 0.07b3.91 ± 0.02b41.51 ± 1.42a
70%R + 30%B + Fr5.20 ± 0.37a2.19 ± 0.07b4.39 ± 0.06a31.20 ± 1.09b
60%R + 40%B + Fr4.80 ± 0.20a2.24 ± 0.05b3.55 ± 0.11c24.00 ± 1.30d
CK3.40 ± 0.24b1.21 ± 0.05d3.36 ± 0.21c14.69 ± 0.59e
Note: Values are means ± SE (n = 3). Means followed by different letters are significantly different according to Duncan’s multiple range test (DMRT) at p < 0.05.
Table 3. Effects of different light-quality treatments on photosynthetic pigment contents of proliferating Spathiphyllum floribundum ‘Tianjiao’ plantlets.
TreatmentChlorophyl
a (mg·g−1)
Chlorophyll
b (mg·g−1)
Chlorophyll
a + b (mg·g−1)
Carotenoids (mg·g−1)
80%R + 20%B0.492 ± 0.020a0.150 ± 0.007d0.642 ± 0.024a0.113 ± 0.004bc
70%R + 30%B0.488 ± 0.018a0.163 ± 0.016cd0.651 ± 0.021a0.100 ± 0.005c
60%R + 40%B0.422 ± 0.033a0.183 ± 0.006bc0.605 ± 0.028ab0.111 ± 0.006bc
80%R + 20%B + Fr0.417 ± 0.037a0.232 ± 0.005a0.649 ± 0.035a0.120 ± 0.004b
70%R + 30%B + Fr0.276 ± 0.027b0.256 ± 0.014a0.532 ± 0.034b0.116 ± 0.007bc
60%R + 40%B + Fr0.212 ± 0.029bc0.195 ± 0.004b0.407 ± 0.027c0.140 ± 0.006a
CK0.180 ± 0.008c0.107 ± 0.005e0.286 ± 0.005d0.030 ± 0.001d
Note: Values are means ± SE (n = 3). Means followed by different letters are significantly different according to Duncan’s multiple range test (DMRT) at p < 0.05.
Table 4. Effects of different light qualities on the growth of Spathiphyllum floribundum ‘Tianjiao’ tissue culture.
TreatmentPlant Height
(cm)
Leaf Number
(no. plant−1)
Leaf Length
(cm)
Leaf Width
(cm)
Root Length
(cm)
80%R + 20%B3.48 ± 0.09a11.00 ± 0.32ab1.82 ± 0.08ab0.98 ± 0.07a4.02 ± 0.09bc
70%R + 30%B3.42 ± 0.09ab10.20 ± 0.58bc1.62 ± 0.04c0.92 ± 0.06a3.64 ± 0.13cd
60%R + 40%B3.20 ± 0.09ab11.60 ± 0.40a1.66 ± 0.07bc0.84 ± 0.02a4.24 ± 0.22ab
80%R + 20%B + Fr3.34 ± 0.07ab10.60 ± 0.24ab1.94 ± 0.07a1.00 ± 0.06a3.36 ± 0.07d
70%R + 30%B + Fr3.16 ± 0.09b10.20 ± 0.37bc1.80 ± 0.03abc0.96 ± 0.04a4.44 ± 0.20a
60%R + 40%B + Fr3.24 ± 0.05ab10.20 ± 0.37bc1.76 ± 0.05bc0.88 ± 0.04a3.56 ± 0.07d
CK3.24 ± 0.11ab9.20 ± 0.58c1.66 ± 0.04bc0.86 ± 0.04a2.66 ± 0.09e
Note: Values are means ± SE (n = 5). Means followed by different letters are significantly different according to Duncan’s multiple range test (DMRT) at p < 0.05.
Table 5. Effects of different light-quality treatments on photosynthetic pigment contents of in vitro-rooted Spathiphyllum floribundum ‘Tianjiao’ plantlets.
TreatmentChlorophyll a (mg·g−1)Chlorophyll b (mg·g−1)Chlorophyll a + b (mg·g−1)Carotenoids
(mg·g−1)
80%R + 20%B0.059 ± 0.004b0.008 ± 0.003bc0.067 ± 0.007b0.021 ± 0.001b
70%R + 30%B0.024 ± 0.004d0.009 ± 0.001bc0.033 ± 0.005c0.007 ± 0.001e
60%R + 40%B0.034 ± 0.002cd0.012 ± 0.001b0.046 ± 0.003c0.010 ± 0.001cd
80%R + 20%B + Fr0.035 ± 0.003c0.008 ± 0.001bc0.043 ± 0.003c0.011 ± 0.001c
70%R + 30%B + Fr0.033 ± 0.002cd0.010 ± 0.002bc0.042 ± 0.003c0.012 ± 0.001c
60%R + 40%B + Fr0.088 ± 0.003a0.021 ± 0.002a0.109 ± 0.005a0.026 ± 0.001a
CK0.040 ± 0.002c0.006 ± 0.001c0.046 ± 0.003c0.008 ± 0.001de
Note: Values are means ± SE (n = 3). Means followed by different letters are significantly different according to Duncan’s multiple range test (DMRT) at p < 0.05.
Table 6. Effects of different light qualities on the morphology of Spathiphyllum floribundum ‘Tianjiao’ hydroponics.
TreatmentPlant Height
(cm)
Leaf Number
(no. plant−1)
Leaf Length
(cm)
Leaf Width
(cm)
Root Length
(cm)
80%R + 20%B14.92 ± 0.12a9.20 ± 0.58ab7.98 ± 0.13a3.02 ± 0.14abc13.94 ± 0.20c
70%R + 30%B15.18 ± 0.23a10.00 ± 0.32a7.88 ± 0.15ab3.18 ± 0.14ab13.96 ± 0.24c
60%R + 40%B15.28 ± 0.08a8.60 ± 0.24bc7.62 ± 0.11ab3.16 ± 0.08ab17.44 ± 0.30a
80%R + 20%B + Fr13.48 ± 0.33b8.40 ± 0.24bc7.42 ± 0.21bc3.00 ± 0.08abc14.60 ± 0.19bc
70%R + 30%B + Fr14.64 ± 0.11a7.80 ± 0.37c7.74 ± 0.09ab3.28 ± 0.04a14.26 ± 0.34c
60%R + 40%B + Fr13.34 ± 0.39b8.60 ± 0.51bc7.08 ± 0.15c2.88 ± 0.11bc15.60 ± 0.09b
CK11.12 ± 0.24c7.40 ± 0.24c6.96 ± 0.19c2.78 ± 0.07c14.72 ± 0.38c
Note: Values are means ± SE (n = 5). Means followed by different letters are significantly different according to Duncan’s multiple range test (DMRT) at p < 0.05.
Table 7. Effects of different light qualities on the pigment content of Spathiphyllum floribundum ‘Tianjiao’ hydroponics.
TreatmentChlorophyll
a (mg·g−1)
Chlorophyll b (mg·g−1)Chlorophyll a + b (mg·g−1)Carotenoids
(mg·g−1)
80%R + 20%B0.83 ± 0.06bc0.19 ± 0.01b1.02 ± 0.06bc0.21 ± 0.01b
70%R + 30%B1.12 ± 0.10a0.28 ± 0.01a1.40 ± 0.09a0.25 ± 0.01a
60%R + 40%B0.75 ± 0.06bc0.17 ± 0.01bc0.91 ± 0.07cd0.20 ± 0.01bc
80%R + 20%B + Fr0.97 ± 0.12ab0.26 ± 0.02a1.23 ± 0.14ab0.17 ± 0.01cd
70%R + 30%B + Fr1.13 ± 0.03a0.29 ± 0.01a1.42 ± 0.03a0.25 ± 0.01a
60%R + 40%B + Fr0.51 ± 0.03d0.15 ± 0.01c0.67 ± 0.04e0.18 ± 0.01cd
CK0.63 ± 0.01cd0.14 ± 0.01c0.77 ± 0.01de0.16 ± 0.01d
Note: Values are means ± SE (n = 3). Means followed by different letters are significantly different according to Duncan’s multiple range test (DMRT) at p < 0.05.
Table 8. Effects of different light-quality treatments on soluble sugar and soluble protein contents in leaves, stems, and roots of hydroponically acclimatized Spathiphyllum floribundum ‘Tianjiao’ plantlets.
TreatmentSoluble Sugar Content (%)Soluble Protein Content (mg·g−1)
LeafStemRootLeafStemRoot
80%R + 20%B1.95 ± 0.03d1.24 ± 0.02a0.87 ± 0.04a34.57 ± 0.85c18.08 ± 0.50c10.95 ± 0.86d
70%R + 30%B2.61 ± 0.04b1.10 ± 0.02bc0.75 ± 0.02b44.95 ± 0.82a22.46 ± 1.39a13.24 ± 0.41bc
60%R + 40%B2.48 ± 0.04b1.09 ± 0.03bc0.68 ± 0.03bc38.03 ± 0.34b19.69 ± 0.64bc11.45 ± 0.64cd
80%R + 20%B + Fr2.90 ± 0.01a1.25 ± 0.03a0.88 ± 0.02a44.43 ± 1.79a21.80 ± 0.45ab15.17 ± 0.25ab
70%R + 30%B + Fr2.93 ± 0.03a1.16 ± 0.02ab0.91 ± 0.01a46.52 ± 0.28a21.88 ± 1.07ab15.67 ± 0.93a
60%R + 40%B + Fr2.87 ± 0.02a1.10 ± 0.02bc0.72 ± 0.01bc35.74 ± 0.59bc19.54 ± 0.68bc15.94 ± 0.69a
CK2.09 ± 0.09c1.04 ± 0.02c0.66 ± 0.05c20.61 ± 0.65d10.95 ± 0.22d8.58 ± 0.67e
Note: Values are means ± SE (n = 3). Means followed by different letters are significantly different according to Duncan’s multiple range test (DMRT) at p < 0.05.
Table 9. Effects of different light qualities on the photosynthetic parameters of Spathiphyllum floribundum ‘Tianjiao’ hydroponics.
TreatmentNet Photosynthetic Rate A (μmol·m−2 s −1)Transpiration Rate E (mmol·m−2·s−1)Stomatal Conductance gs
(mmol·m−2·s −1)
Intercellular CO2 Concentration Ci (ppm)Water Vapor Pressure Deficit (VPD)Water-Use Efficiency WUE (μmol CO2 mmol−1 H2O)
80%R + 20%B2.30 ± 0.06c0.80 ± 0.10b38.00 ± 4.00c339.33 ± 16.83b2.17 ± 0.03bc2.80 ± 0.06b
70%R + 30%B3.17 ± 0.12b1.07 ± 0.07a48.33 ± 4.37b345.00 ± 5.20b2.23 ± 0.03ab3.03 ± 0.18b
60%R + 40%B4.77 ± 0.15a1.23 ± 0.03a63.00 ± 1.15a334.33 ± 5.33bc2.03 ± 0.03d3.90 ± 0.20a
80%R + 20%B + Fr3.40 ± 0.26b0.83 ± 0.12b38.67 ± 2.91c304.00 ± 12.42c2.23 ± 0.07ab4.17 ± 0.17a
70%R + 30%B + Fr1.40 ± 0.10d0.47 ± 0.07c21.67 ± 2.19d350.00 ± 17.01b2.17 ± 0.03bc3.13 ± 0.52b
60%R + 40%B + Fr3.13 ± 0.03b1.20 ± 0.06a55.67 ± 2.73ab367.67 ± 3.84ab2.10 ± 0.06cd2.77 ± 0.03b
CK0.80 ± 0.06e0.40 ± 0.06c16.67 ± 0.33d392.67 ± 3.53a2.33 ± 0.03a1.77 ± 0.09c
Note: Values are means ± SE (n = 3). Means followed by different letters are significantly different according to Duncan’s multiple range test (DMRT) at p < 0.05.
Disclaimer/Publisher’s Note: The statements, opinions and data contained in all publications are solely those of the individual author(s) and contributor(s) and not of MDPI and/or the editor(s). MDPI and/or the editor(s) disclaim responsibility for any injury to people or property resulting from any ideas, methods, instructions or products referred to in the content.