Article

Beyond Vegetation Quantity: The Role of Horticultural Configuration in Shaping Human Perception of Urban Parks


College of Landscape Architecture, Sichuan Agricultural University, Chengdu 611130, China
*
Authors to whom correspondence should be addressed.
Horticulturae 2026, 12(8), 1041; https://doi.org/10.3390/horticulturae12081041
Submission received: 17 July 2026 / Revised: 14 August 2026 / Accepted: 18 August 2026 / Published: 20 August 2026
(This article belongs to the Section Floriculture, Nursery and Landscape, and Turf)

Abstract

Urban park assessment typically emphasizes vegetation quantity, yet spaces with similar greenness may still produce different visual experiences. This study aimed to identify the structural characteristics of horticultural configurations and examine their incremental predictive value for multidimensional visual perception. A total of 500 local landscape scenes were selected from 10 urban parks in Chengdu and presented as standardized photographs. One hundred and fifty participants rated 17 visual attributes on a seven-point scale. Landscape structure metrics, principal component analysis, cluster analysis, cross-park validation, and SHAP analysis revealed that horticultural configurations varied primarily along three gradients: vegetation continuity–fragmentation, geometric complexity, and patch size. These gradients formed three representative states: dense woody, open heterogeneous, and impervious fragmented configurations. Visual perception was organized into three functional domains: restorative immersion, spatial openness, and affective richness. Compared with models containing only the NDVI and greenspace coverage, adding configuration metrics increased the cross-park predictive R2 by 0.257, 0.181, and 0.241 for the three perceptual domains, respectively. Vegetation aggregation and connectivity, mean patch area, and shape complexity were the primary predictors of the respective domains and exhibited stable nonlinear response patterns. This study extends park assessment from vegetation quantity to spatial organization mechanisms, providing an evidence base for perception-oriented horticultural design and helping reduce costly trial-and-error and inefficient investment in park renewal.

1. Introduction

Urban parks are important components of urban ecosystems. They not only improve environmental quality and provide ecosystem services but also contribute to psychological restoration, emotion regulation, and the formation of environmental experiences. Extensive research has shown that exposure to green spaces can facilitate stress recovery, enhance mental health, and improve positive perceptions of urban environments [1,2,3,4,5,6]. Accordingly, the scientific evaluation of urban green-space quality has become an important research topic in landscape ecology, urban planning, and horticultural design.
Urban green-space assessment has long relied primarily on vegetation quantity indicators, such as greenspace coverage, the normalized difference vegetation index (NDVI), and the green view index [7,8]. These indicators describe “how much greenery” a space contains. However, increasing evidence suggests that similar levels of greenery do not necessarily produce comparable visual experiences or psychological responses [9,10,11,12,13]. Such differences may further depend on how vegetation is spatially organized, including its aggregation, connectivity, fragmentation, scale, and form [14,15,16,17]. Therefore, vegetation quantity alone may be insufficient to fully explain perceptual differences among urban parks, highlighting the need to shift attention from “how much greenery there is” to “how greenery is organized”.
In this study, “horticultural configuration” specifically refers to the spatial organization and geometric form of vegetation patches within standardized visual scenes. It is operationalized through fragmentation, aggregation, connectedness, mean patch area, shape complexity, and fractal dimension. The NDVI and greenspace coverage represent vegetation quantity and serve as benchmark predictors.
Landscape ecology has developed metrics such as fragmentation, aggregation, connectedness, patch area, and shape complexity to characterize the spatial relationships among landscape elements [18,19,20]. However, these metrics have primarily been used to investigate ecological patterns and processes, while their explanatory value for human visual perception and horticultural experience remains insufficiently examined [21,22,23]. In particular, it remains unclear whether horticultural configuration provides additional perceptual information beyond overall vegetation quantity and whether different structural attributes correspond to distinct perceptual functions [24,25,26].
This issue is further complicated by the multidimensional nature of landscape perception. Visual experience in urban parks is not a single overall evaluation but may encompass distinct dimensions such as restorativeness, openness, and affective richness. Continuous and aggregated vegetation structures may be associated with perceived naturalness, tranquility, and refuge [27,28,29,30]; larger spatial scales and unobstructed views may correspond to stronger perceptions of openness [31,32,33,34]; and complex boundaries and multilayered planting compositions may enhance visual interest and affective richness [35,36]. Moreover, relationships between horticultural configuration and perception may not be strictly linear. Some structural attributes may exhibit changing marginal effects, specific response ranges, or threshold characteristics [37,38,39,40,41,42,43,44,45,46,47,48]. It is therefore necessary to examine the incremental explanatory value of horticultural configuration, the specificity of its relationships across perceptual dimensions, and its potential nonlinear effects.
To address these research gaps, this study conceptualizes the horticultural environment of urban parks as a multidimensional structural system comprising vegetation composition, spatial organization, and landscape form. By integrating landscape structure analysis, multidimensional perceptual assessment, machine-learning prediction, and model interpretation, the study examines whether horticultural configuration can explain multidimensional landscape perceptions beyond traditional vegetation quantity indicators and whether different perceptual functions correspond to distinct structural characteristics and response patterns. The specific objectives are to:
(1)
Identify the principal structural gradients of horticultural configuration in urban parks and reveal differences in spatial organization among parks and their representative configuration states;
(2)
Determine the latent structure of multidimensional landscape perception and clarify the functional perceptual dimensions associated with different horticultural configurations;
(3)
Compare the independent predictive value of horticultural configuration with that of traditional greenness indicators and identify the key structural predictors of each perceptual domain;
(4)
Reveal nonlinear response patterns in configuration–perception relationships, thereby providing a theoretical basis for function-oriented urban park design.
Accordingly, the following hypotheses are proposed:
H1. 
Urban park horticultural environments exhibit significant spatial structural gradients jointly characterized by aggregation, connectedness, fragmentation, and geometric form.
H2. 
Landscape perception in urban parks has a multidimensional structure, with different perceptual dimensions corresponding to distinct horticultural configuration characteristics.
H3. 
After controlling for traditional vegetation quantity indicators, horticultural configuration provides additional explanatory or predictive information for landscape perception, with key structural variables differing among perceptual dimensions.
H4. 
Some horticultural structural attributes exhibit nonlinear relationships or specific response ranges with landscape perception rather than following entirely simple linear patterns.
By testing these objectives and hypotheses, this study seeks to move beyond the conventional vegetation quantity-centered approach to urban green-space assessment and establish a horticultural environment evaluation framework that shifts from “vegetation quantity” to “spatial configuration.” The findings will deepen understanding of how urban horticultural structures shape human visual experience and provide scientific support for the targeted design of restorative, open, and experientially rich spaces.

2. Materials and Methods

2.1. Study Area and Sampling Design

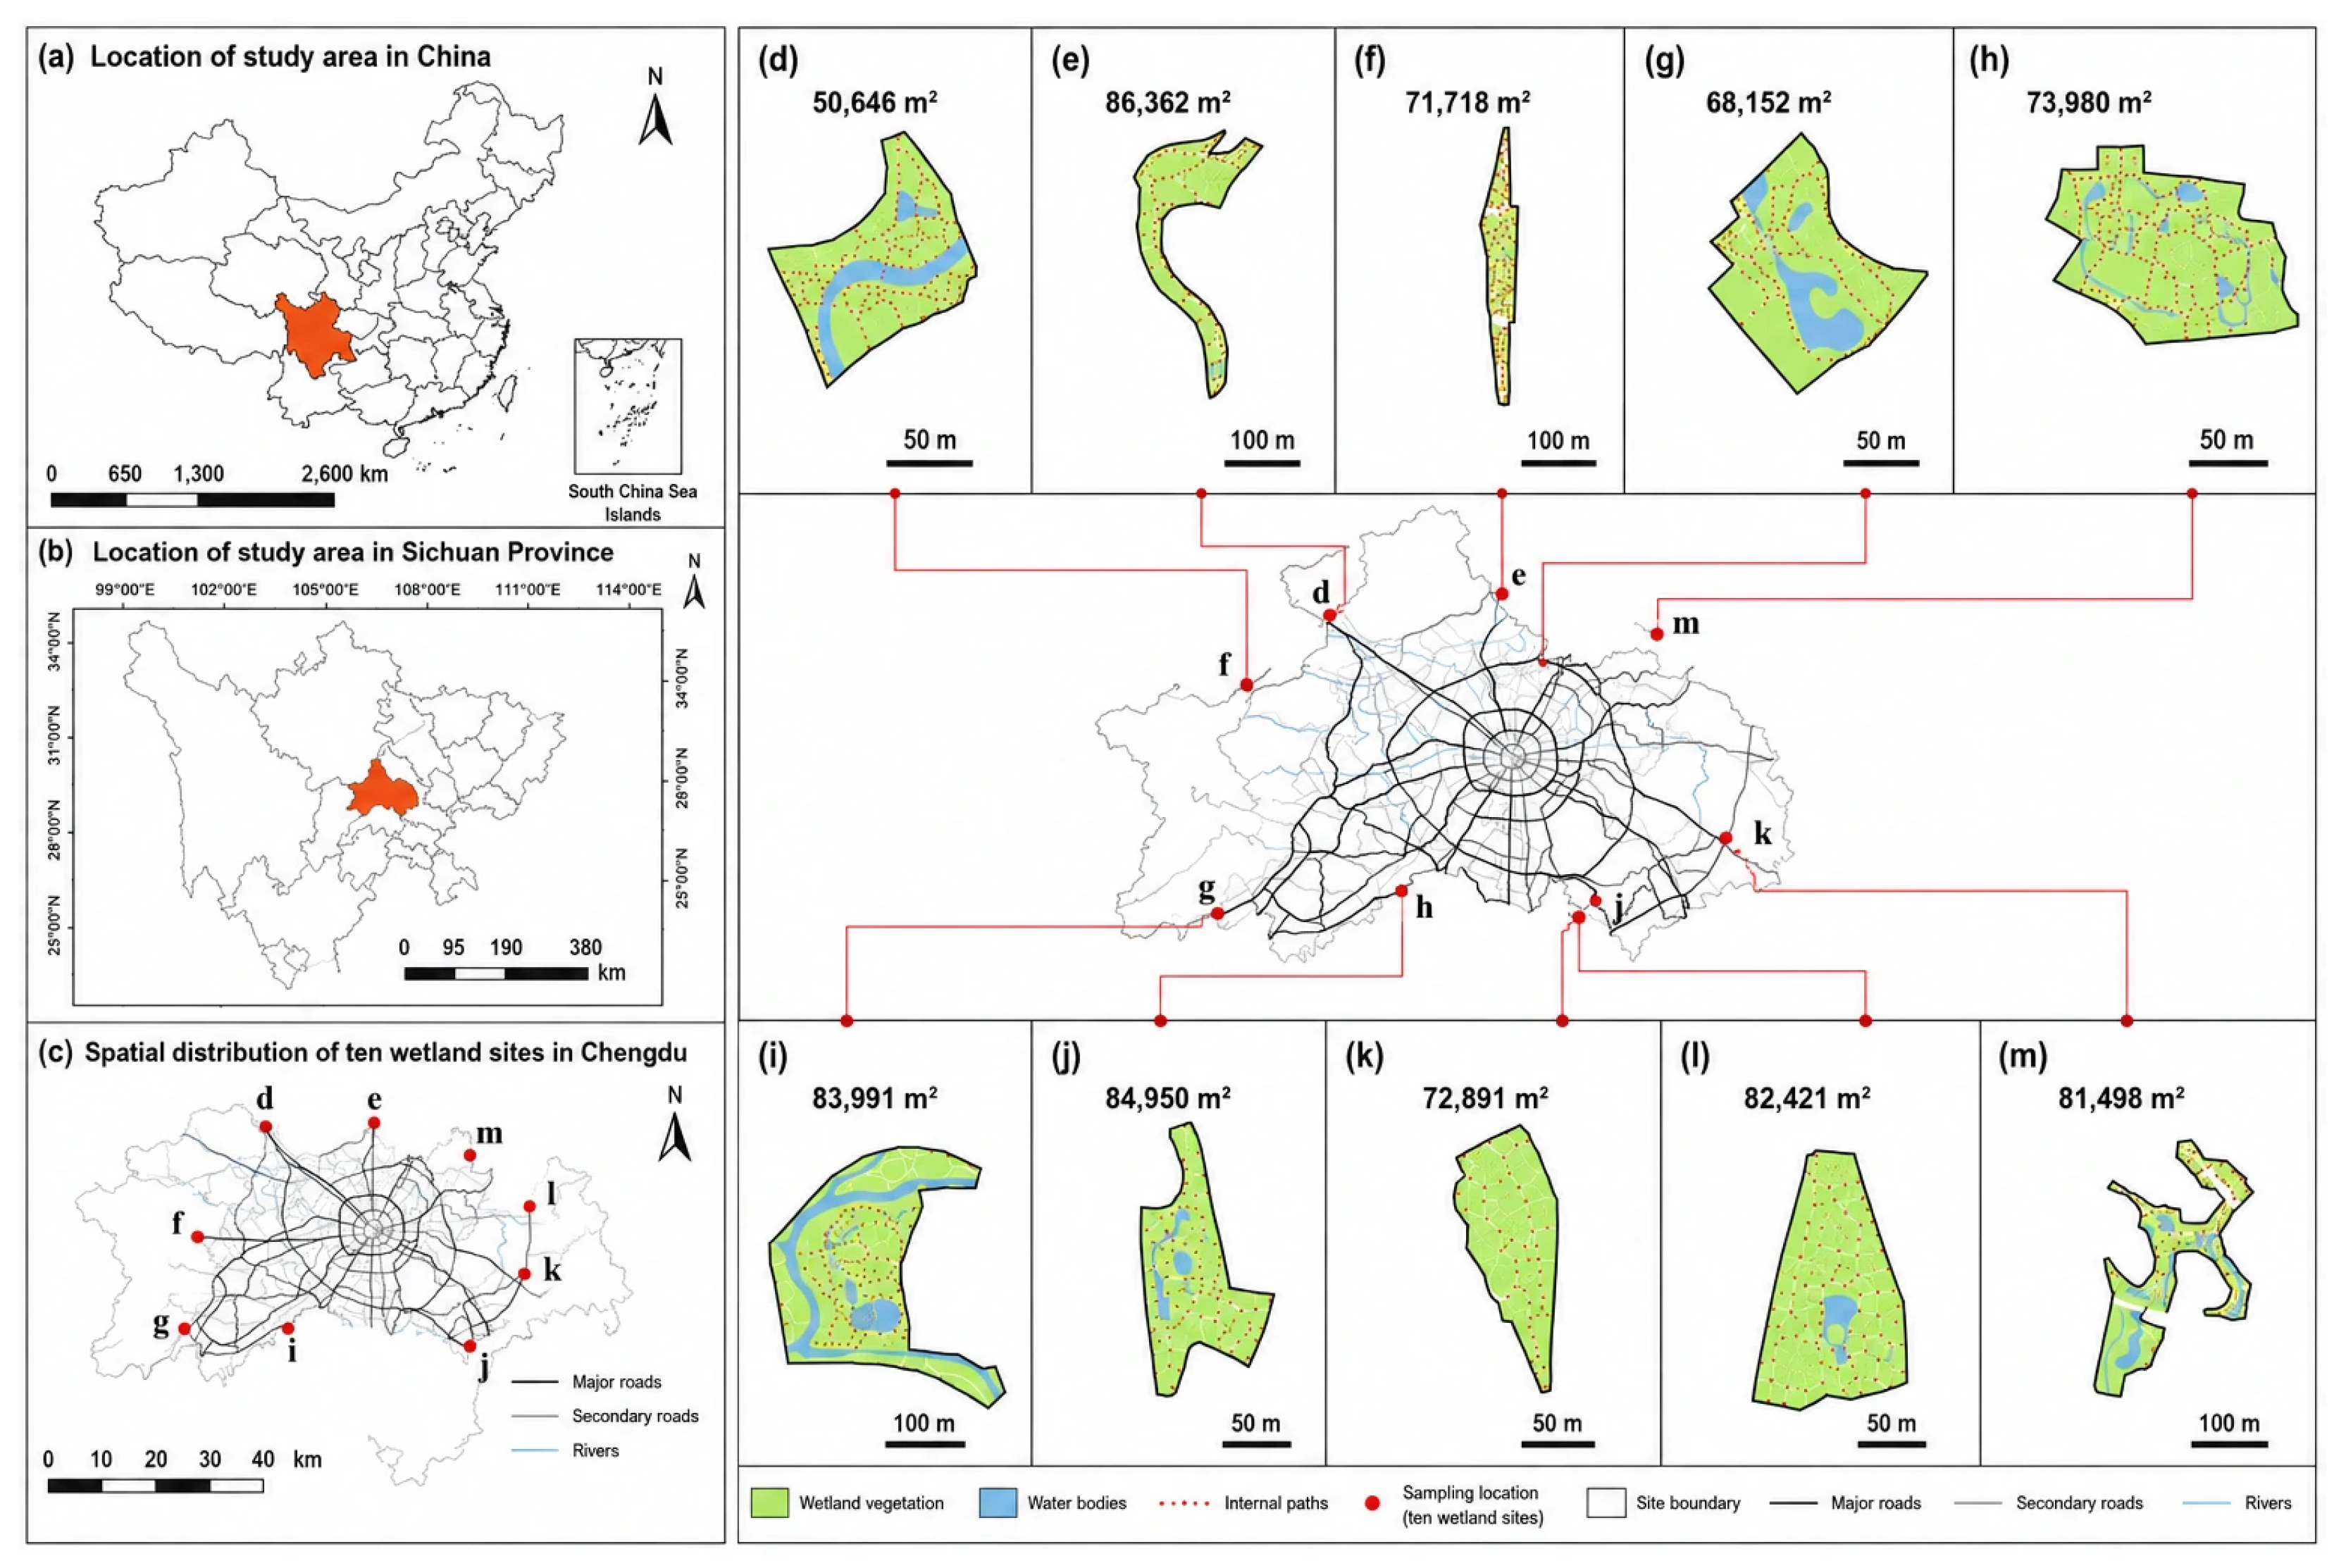
This study selected 10 urban parks in Chengdu, Sichuan Province, China, as the study area (Figure 1). The parks were not selected through simple random sampling but purposively according to predefined criteria for landscape heterogeneity. The principal selection criteria were: (1) relatively stable and mature horticultural landscapes; (2) good routine maintenance, without large-scale construction or evident landscape degradation during the survey period; (3) diverse planting configurations, spatial structures, and landscape compositions; and (4) sufficient size and scene diversity to support standardized visual sampling. This strategy was not intended to generate a probability sample representative of all parks in Chengdu but to obtain horticultural landscape samples with sufficient environmental variation under a shared urban climatic and social context.
The 10 parks differed in their periods of establishment, spatial layouts, and landscape design characteristics, and all were open to the public and under routine maintenance during the survey. In terms of landscape design, the sample included parks dominated by naturalistic plant communities and woodland-understory spaces, parks characterized by open lawns and sparsely wooded areas, parks with prominent waterfront features, and parks containing relatively high proportions of built structures, ornamental planting, and mixed horticultural spaces. Consequently, the parks differed substantially in tree-canopy cover, shrub-layer structure, grassland proportion, plant-community density, water arrangement, impervious surfaces, and spatial openness, thereby providing an environmental gradient for comparing horticultural structures.
The representativeness of these parks does not lie in their statistical representation of all urban parks in Chengdu but in their coverage of the major horticultural spaces and planting configurations commonly found in contemporary high-density Chinese cities. Chengdu has a long tradition of urban landscape construction and has continuously promoted park-city development in recent years. Its urban parks therefore encompass diverse environmental settings, including mature vegetation, designed horticultural configurations, waterfront spaces, open green spaces, and built landscapes. Selecting parks with contrasting horticultural structures within the same city helps reduce confounding associated with regional climate, urban culture, and broader social conditions while expanding the range of landscape structural variation covered by the study.
From an international research perspective, these parks were not selected on the assumption that Chengdu’s parks directly represent urban parks worldwide. Instead, they were treated as empirical cases of mature urban green spaces within a high-density and rapidly urbanizing context. The core variables examined—vegetation cover, vertical vegetation structure, spatial openness, landscape composition and configuration, and visual perception—are not dependent on specific park names or local cultural types but constitute environmental attributes that can be measured and compared across urban green-space studies in different countries. Accordingly, this study emphasizes the transferability of environmental attributes and continuous landscape gradients, rather than the direct international generalization of findings from specific park types.
A standardized scene-sampling method was used to establish 500 sampling units along park paths and within representative landscape areas, with 50 units selected from each park. The sampled scenes included open grasslands, dense woodlands, waterfront spaces, and ornamental planting areas. Adequate distances were maintained between sampling locations to minimize visual repetition. All photographs were taken horizontally at an eye level of 1.5–1.6 m under standardized field-of-view, weather, and lighting conditions. Images substantially affected by dense pedestrian flows, vehicles, or construction activities were excluded, resulting in a standardized image dataset of horticultural landscapes.
A total of 150 participants were recruited from the general public through an open recruitment process to undertake the visual perception assessment. The inclusion criteria were an age of ≥18 years, normal or corrected-to-normal vision, the ability to independently complete the image-viewing and questionnaire tasks, and voluntary participation in the study. The visual perception survey was conducted in November 2024. Before the formal assessment, researchers explained the study purpose, evaluation procedure, and scale-completion method to the participants. The survey was conducted in a relatively quiet indoor environment with stable lighting, using a standardized image-display and evaluation procedure. No feedback was provided by the researchers during the assessment, and participants were not permitted to discuss their ratings with one another. Brief breaks were scheduled according to a predefined procedure to reduce visual fatigue and attention decline caused by continuous image evaluation.
The participants had a mean age of 28.22 ± 5.16 years; 74 were women (49%) and 76 were men (51%).
All participants provided written informed consent. The study protocol was reviewed and approved by the Ethics Committee of Sichuan Forestry Central Hospital (Approval No. 002; 15 September 2024). An a priori statistical power analysis was conducted using G*Power 3.1. With an effect size of 0.50, a significance level of α = 0.05, and statistical power of 0.85, the minimum required sample size was 146 participants. The final sample size therefore met the analytical requirement.

2.2. Multidimensional Characterization of Horticultural Configurations

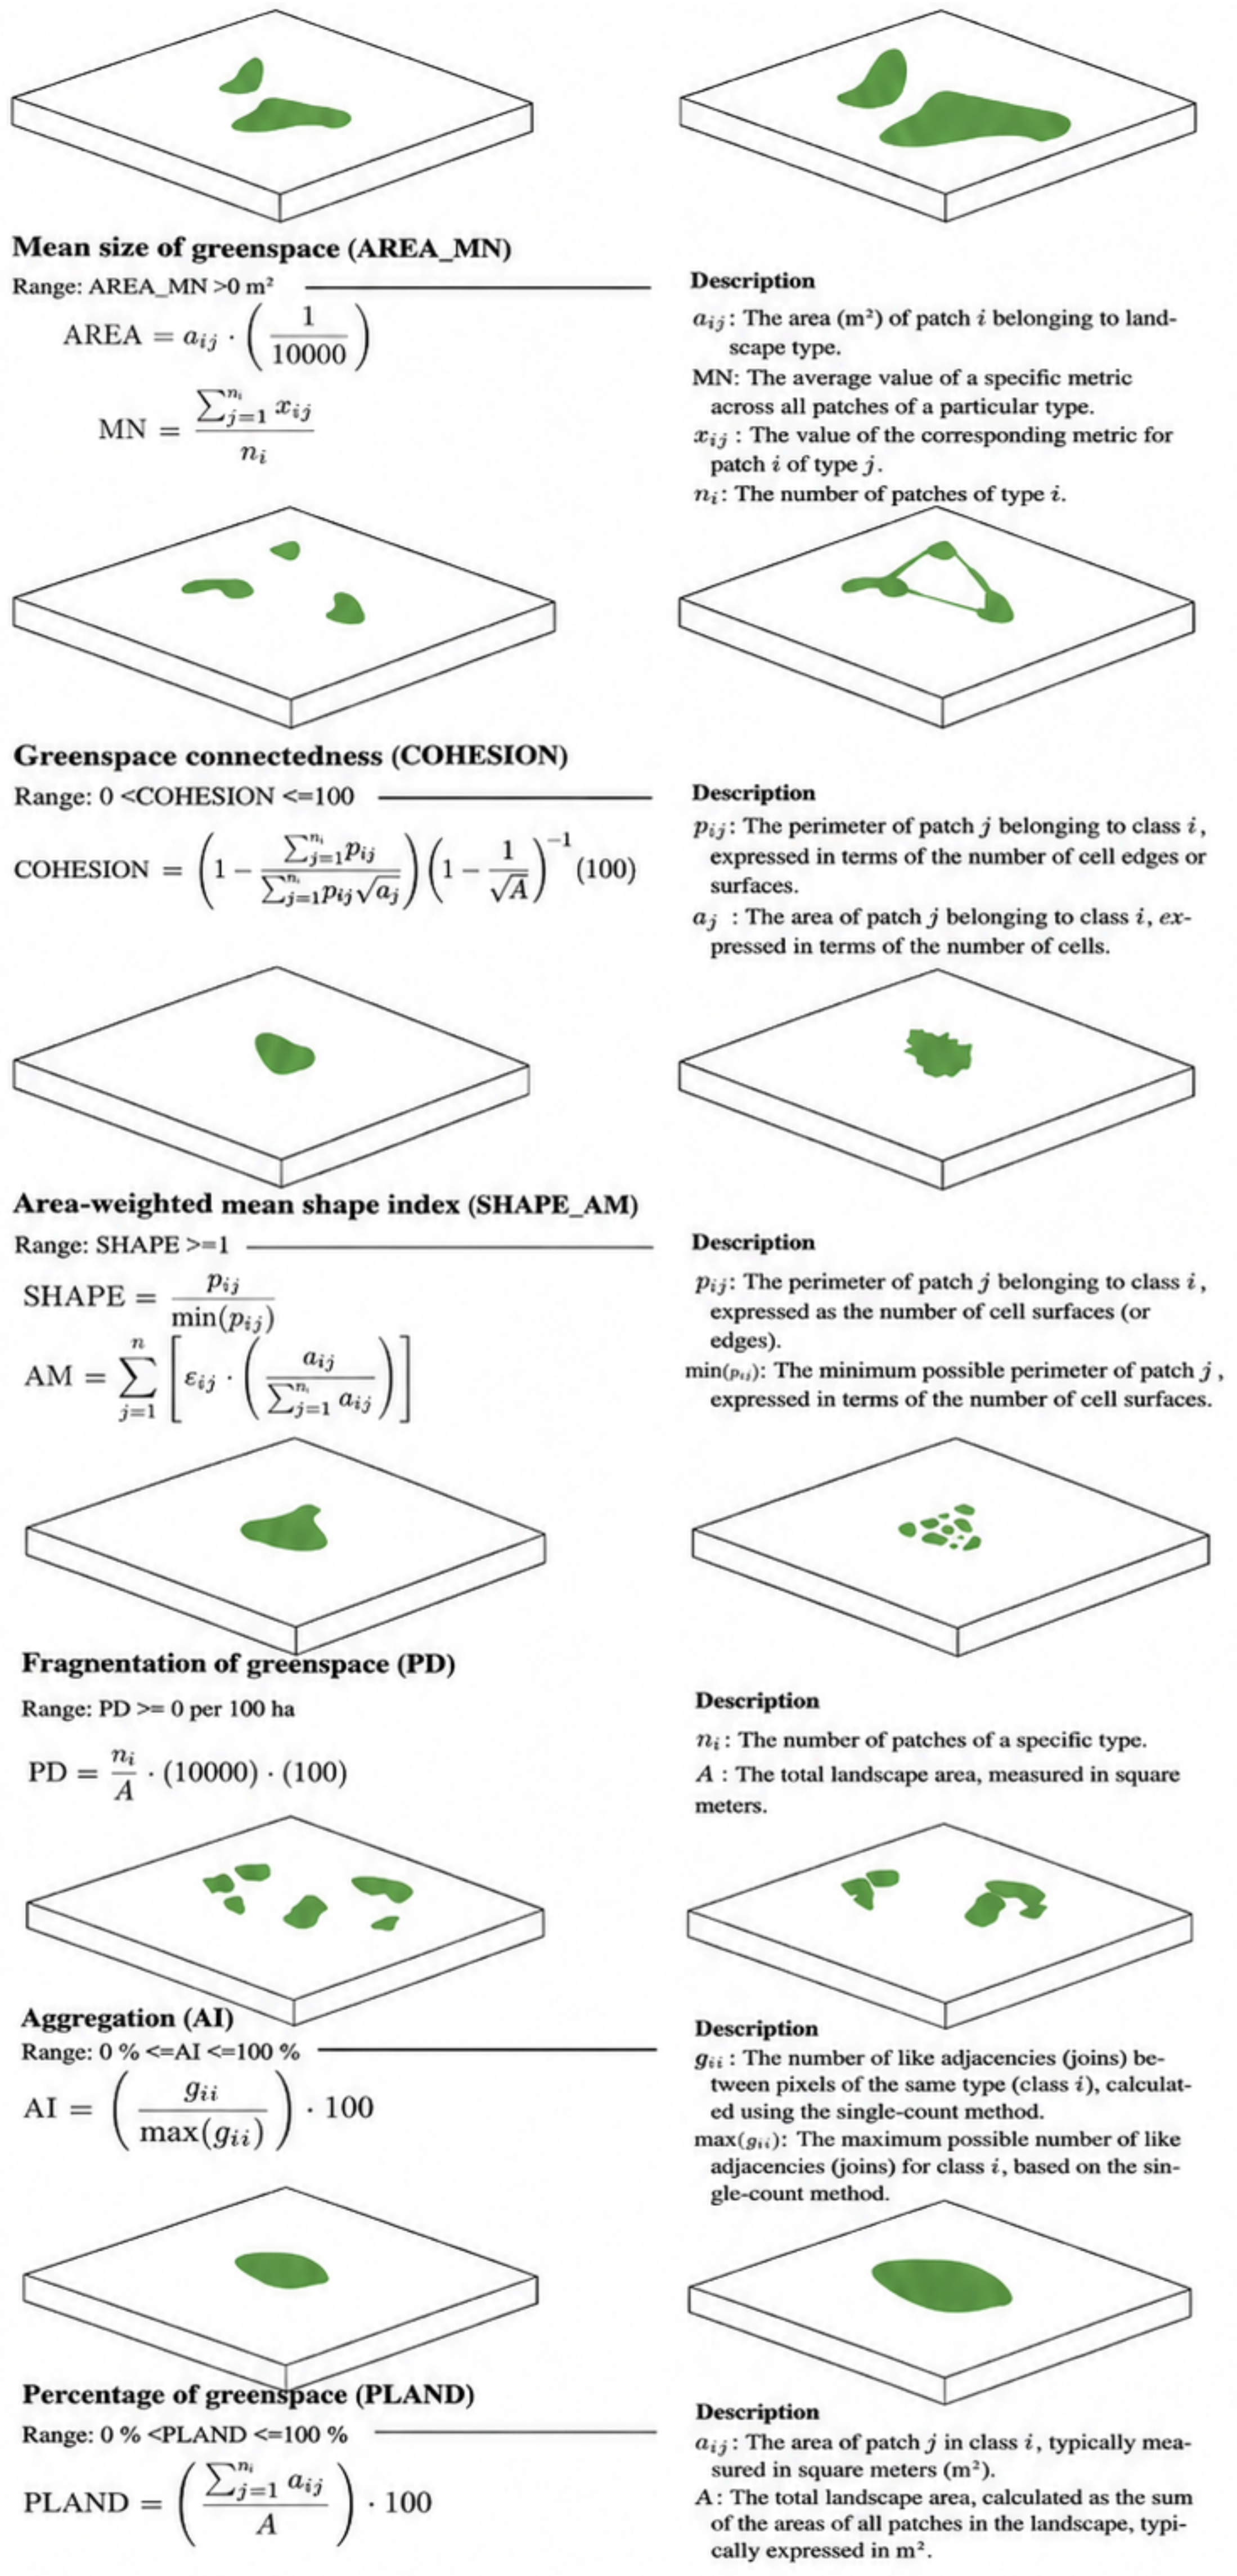
To address the limited ability of conventional greenness indicators to characterize the spatial organization of vegetation, this study developed a horticultural configuration indicator system comprising four dimensions: vegetation quantity, spatial organization, landscape geometry, and spatial scale. Vegetation quantity was represented by greenspace coverage and the normalized difference vegetation index (NDVI). Spatial organization metrics, calculated using FRAGSTATS 4.2, included fragmentation, aggregation, connectedness, and mean patch area. Landscape geometry was characterized by shape complexity and fractal dimension, while spatial scale was represented by park area (Figure 2).
High-resolution spatial data were used to identify vegetation coverage and generate raster-based vegetation patches. The structural metrics were subsequently calculated at the sample-unit scale. This indicator framework comprehensively captured vegetation quantity, patch continuity, spatial aggregation, and boundary complexity, enabling the identification of horticultural scenes with similar greenness levels but distinct spatial configurations. Prior to multivariate analyses, all continuous structural indicators were standardized using Z-score transformation to eliminate differences in measurement units and value ranges. Park area was used to represent park-level spatial scale and was excluded from clustering and predictive modeling conducted at the sample-unit level.

2.3. Identification of Structural Gradients and Representative Configuration States

2.3.1. Multivariate Structural Gradient Analysis

Spearman correlation analysis was conducted to examine associations among structural indicators, with false discovery rate (FDR) correction performed using the Benjamini–Hochberg procedure. Variance inflation factors (VIFs) were additionally calculated to assess potential multicollinearity among variables. Subsequently, principal component analysis (PCA) was performed based on standardized structural indicators to identify latent structural gradients underlying horticultural configurations, with principal components interpreted according to explained variance and variable loadings.
Based on a Euclidean distance matrix derived from standardized structural variables, permutational multivariate analysis of variance (PERMANOVA; 9999 permutations) was applied to test differences in multivariate structural composition among parks. The F statistic, explained variance (R2), and permutation-based significance level (P_perm) were reported. PERMDISP was further conducted to evaluate the homogeneity of multivariate dispersion among groups, thereby distinguishing differences in group centroids from within-group dispersion effects. In addition, omega squared (ω2) was calculated using park identity as the grouping factor to quantify the effect size of individual structural indicators in differentiating horticultural configurations among parks.

2.3.2. Identification of Representative Configuration States and Stability Assessment

K-means clustering was performed on standardized structural indicators at the sample-unit level to identify representative horticultural configuration states along the continuous structural gradients. The candidate number of clusters was set from K = 2 to 6, and clustering performance was evaluated using the Silhouette coefficient, Calinski–Harabasz index, and Davies–Bouldin index to assess within-cluster cohesion and between-cluster separation. The K-means algorithm was initialized using the K-means++ strategy, and multiple random initializations were conducted to reduce the influence of local optima.
Cluster robustness was evaluated through 500 repeated subsampling tests. In each iteration, 80% of the samples were randomly selected without replacement and reclustered. The resulting clustering assignments were compared with the original clustering solution using the overlapping samples, and clustering consistency was quantified using the Adjusted Rand Index (ARI) and Normalized Mutual Information (NMI). After optimal matching of cluster labels, cluster-wise Jaccard similarity was further calculated to assess the stability of individual clusters. Considering the combined evidence from internal validation metrics, resampling stability, sample size balance, and interpretability of structural profiles, K = 3 was retained as the representative configuration-state solution for subsequent analyses. These states were interpreted as representative positions along horticultural structural gradients rather than universal discrete classification categories.

2.4. Quantification of Multidimensional Visual Perception

2.4.1. Perceptual Assessment

This study developed a visual perception assessment framework consisting of three components: basic landscape evaluation, Perceived Sensory Dimensions (PSD), and restorative perception, comprising a total of 17 indicators. Basic landscape evaluation included complexity, openness, enclosure, spatial depth, and color richness, which characterized the visual organization and spatial attributes of landscape environments. PSD assessment included serenity, naturalness, species richness, spatiality, prospect, refuge, sociality, and culturality, capturing the multidimensional perceptual attributes of horticultural environments. Restorative perception consisted of being away, fascination, coherence, and compatibility, which were used to evaluate the potential psychological restorative functions of landscape environments.
All indicators were measured using a 7-point Likert scale, where 1 indicated “strongly disagree” or extremely low perceived intensity, and 7 indicated “strongly agree” or extremely high perceived intensity. Approximately 5% of randomly missing values were imputed using the median value. Internal consistency of the scales was assessed using Cronbach’s α. For each visual sample unit, valid ratings from participants were averaged to generate sample-level perceptual evaluation scores.

2.4.2. Extraction of Latent Perceptual Domains

Principal component analysis (PCA) was performed on the standardized mean ratings of 17 perceptual attributes across the 500 landscape samples. PCA was selected instead of exploratory factor analysis (EFA) because the purpose of this study was not to validate the latent measurement structure of the perceptual scale, but to reduce correlated perceptual indicators to a small number of orthogonal composite dimensions. This approach reduced multicollinearity, retained overall information, and provided stable composite scores for subsequent configuration comparisons and predictive modeling. In contrast, EFA is primarily used to identify latent constructs underlying the common variance among observed variables and to distinguish common variance from specific variance and measurement error, which differs from the data-reduction objective of this study.
Before analysis, the Kaiser–Meyer–Olkin (KMO) test and Bartlett’s test of sphericity were used to assess data suitability. The number of principal components was determined jointly from the eigenvalues, scree plot, and cumulative explained variance. The components were interpreted according to their loading patterns and conceptual consistency with landscape perception theory. Three data-driven functional perceptual dimensions were ultimately extracted: restorative immersion, spatial openness, and affective richness. Each dimension was represented by the standardized sample scores of the corresponding principal component and used in subsequent between-group comparisons and predictive modeling. Importantly, these dimensions represent empirical composite structures derived through PCA rather than latent psychological constructs confirmed through confirmatory factor analysis.

2.5. Perceptual Differentiation Among Configuration States

Because the perceptual domain scores did not satisfy the assumption of normality, the Kruskal–Wallis test was used to compare differences in restorative immersion, spatial openness, and emotional richness among the three representative horticultural configuration states. Effect sizes were quantified using η2H. When significant overall differences were detected, Dunn’s post hoc test was performed for pairwise comparisons, with Benjamini–Hochberg false discovery rate (FDR) correction applied to adjust for multiple comparisons.

2.6. Predictive Modeling and Nonlinear Interpretation of Horticultural Configurations

2.6.1. Model Construction

Extreme gradient boosting regression (XGBoost) was employed to predict scores of the three perceptual domains, thereby characterizing potential nonlinear relationships and interaction effects between landscape variables and visual perception. Three types of models were constructed: the greenness model, which included only the NDVI and green space coverage; the configuration model, which incorporated fragmentation, aggregation, connectedness, shape complexity, fractal dimension, and mean patch area; and the full model, which included all variables from both greenness and configuration models.
The models were trained using a squared error loss function. The main hyperparameters were set as follows: n_estimators = 500, max_depth = 3, and learning_rate = 0.03. The three candidate models were implemented using identical hyperparameter settings and data partitioning strategies to ensure comparability of model performance.

2.6.2. Cross-Validation and Incremental Predictive Contribution

Ten-fold cross-validation was applied to evaluate model performance, with the coefficient of determination (R2) on the test sets used as the primary measure of predictive capability. The three candidate models were evaluated using exactly the same training and testing partitions to enable paired comparisons of predictive performance. The incremental predictive contribution of horticultural configurations beyond traditional greenness metrics was quantified as
Δ R 2 = R full 2 − R green 2
where R full 2 and R green 2 represent the cross-validated R2 values of the full model and the greenness model, respectively.
The 95% confidence intervals and empirical p values of ΔR2 were estimated using 1000 iterations of park-level bootstrap model refitting. In each bootstrap iteration, parks were resampled with replacement as the sampling unit, while all samples within the selected parks were retained. The models were then refitted and their predictive performance was reevaluated using the same cross-validation procedure.

2.6.3. Explainable Machine Learning Analysis

Shapley Additive Explanations (SHAP) was applied to interpret the prediction outcomes of the full models. The overall importance of each predictor variable was quantified using the mean absolute SHAP value. SHAP dependence analysis was further conducted to characterize how variations in predictor values influenced the direction and magnitude of their contributions to model outputs, thereby identifying the dominant structural predictors associated with the three perceptual domains.

2.6.4. Identification of Nonlinear Response Points

Nonlinear response points were identified based on the SHAP dependence relationships of the dominant predictive factors. Locally weighted regression (LOWESS) was used to fit the SHAP dependence curves, and the zero-crossing points where the smoothed contribution curve consistently shifted from negative to positive effects were defined as response points.
The robustness of identified response points was evaluated through 200 iterations of park-level bootstrap model refitting. In each iteration, parks were resampled with replacement as the sampling unit, while all samples within the selected parks were retained. The models were then refitted, SHAP values were recalculated, and response points were reidentified. The 95% confidence intervals were estimated using the 2.5th and 97.5th percentiles of the bootstrap distribution, and the detection frequency of each response point was used to evaluate its stability.

3. Results

3.1. Horticultural Configurations Occupy Multidimensional Structural Gradients Across Urban Parks

3.1.1. Structural Gradients Underlying Horticultural Configurations

Across the 500 sampled scenes, overall greenness varied relatively little among the ten parks: green space coverage ranged from 73.8% to 77.8% and NDVI from 0.497 to 0.563. In contrast, fragmentation, aggregation, connectedness, shape complexity, fractal dimension, and mean patch area varied substantially. Thus, parks with similar amounts of vegetation could still differ markedly in how vegetation was spatially organized.
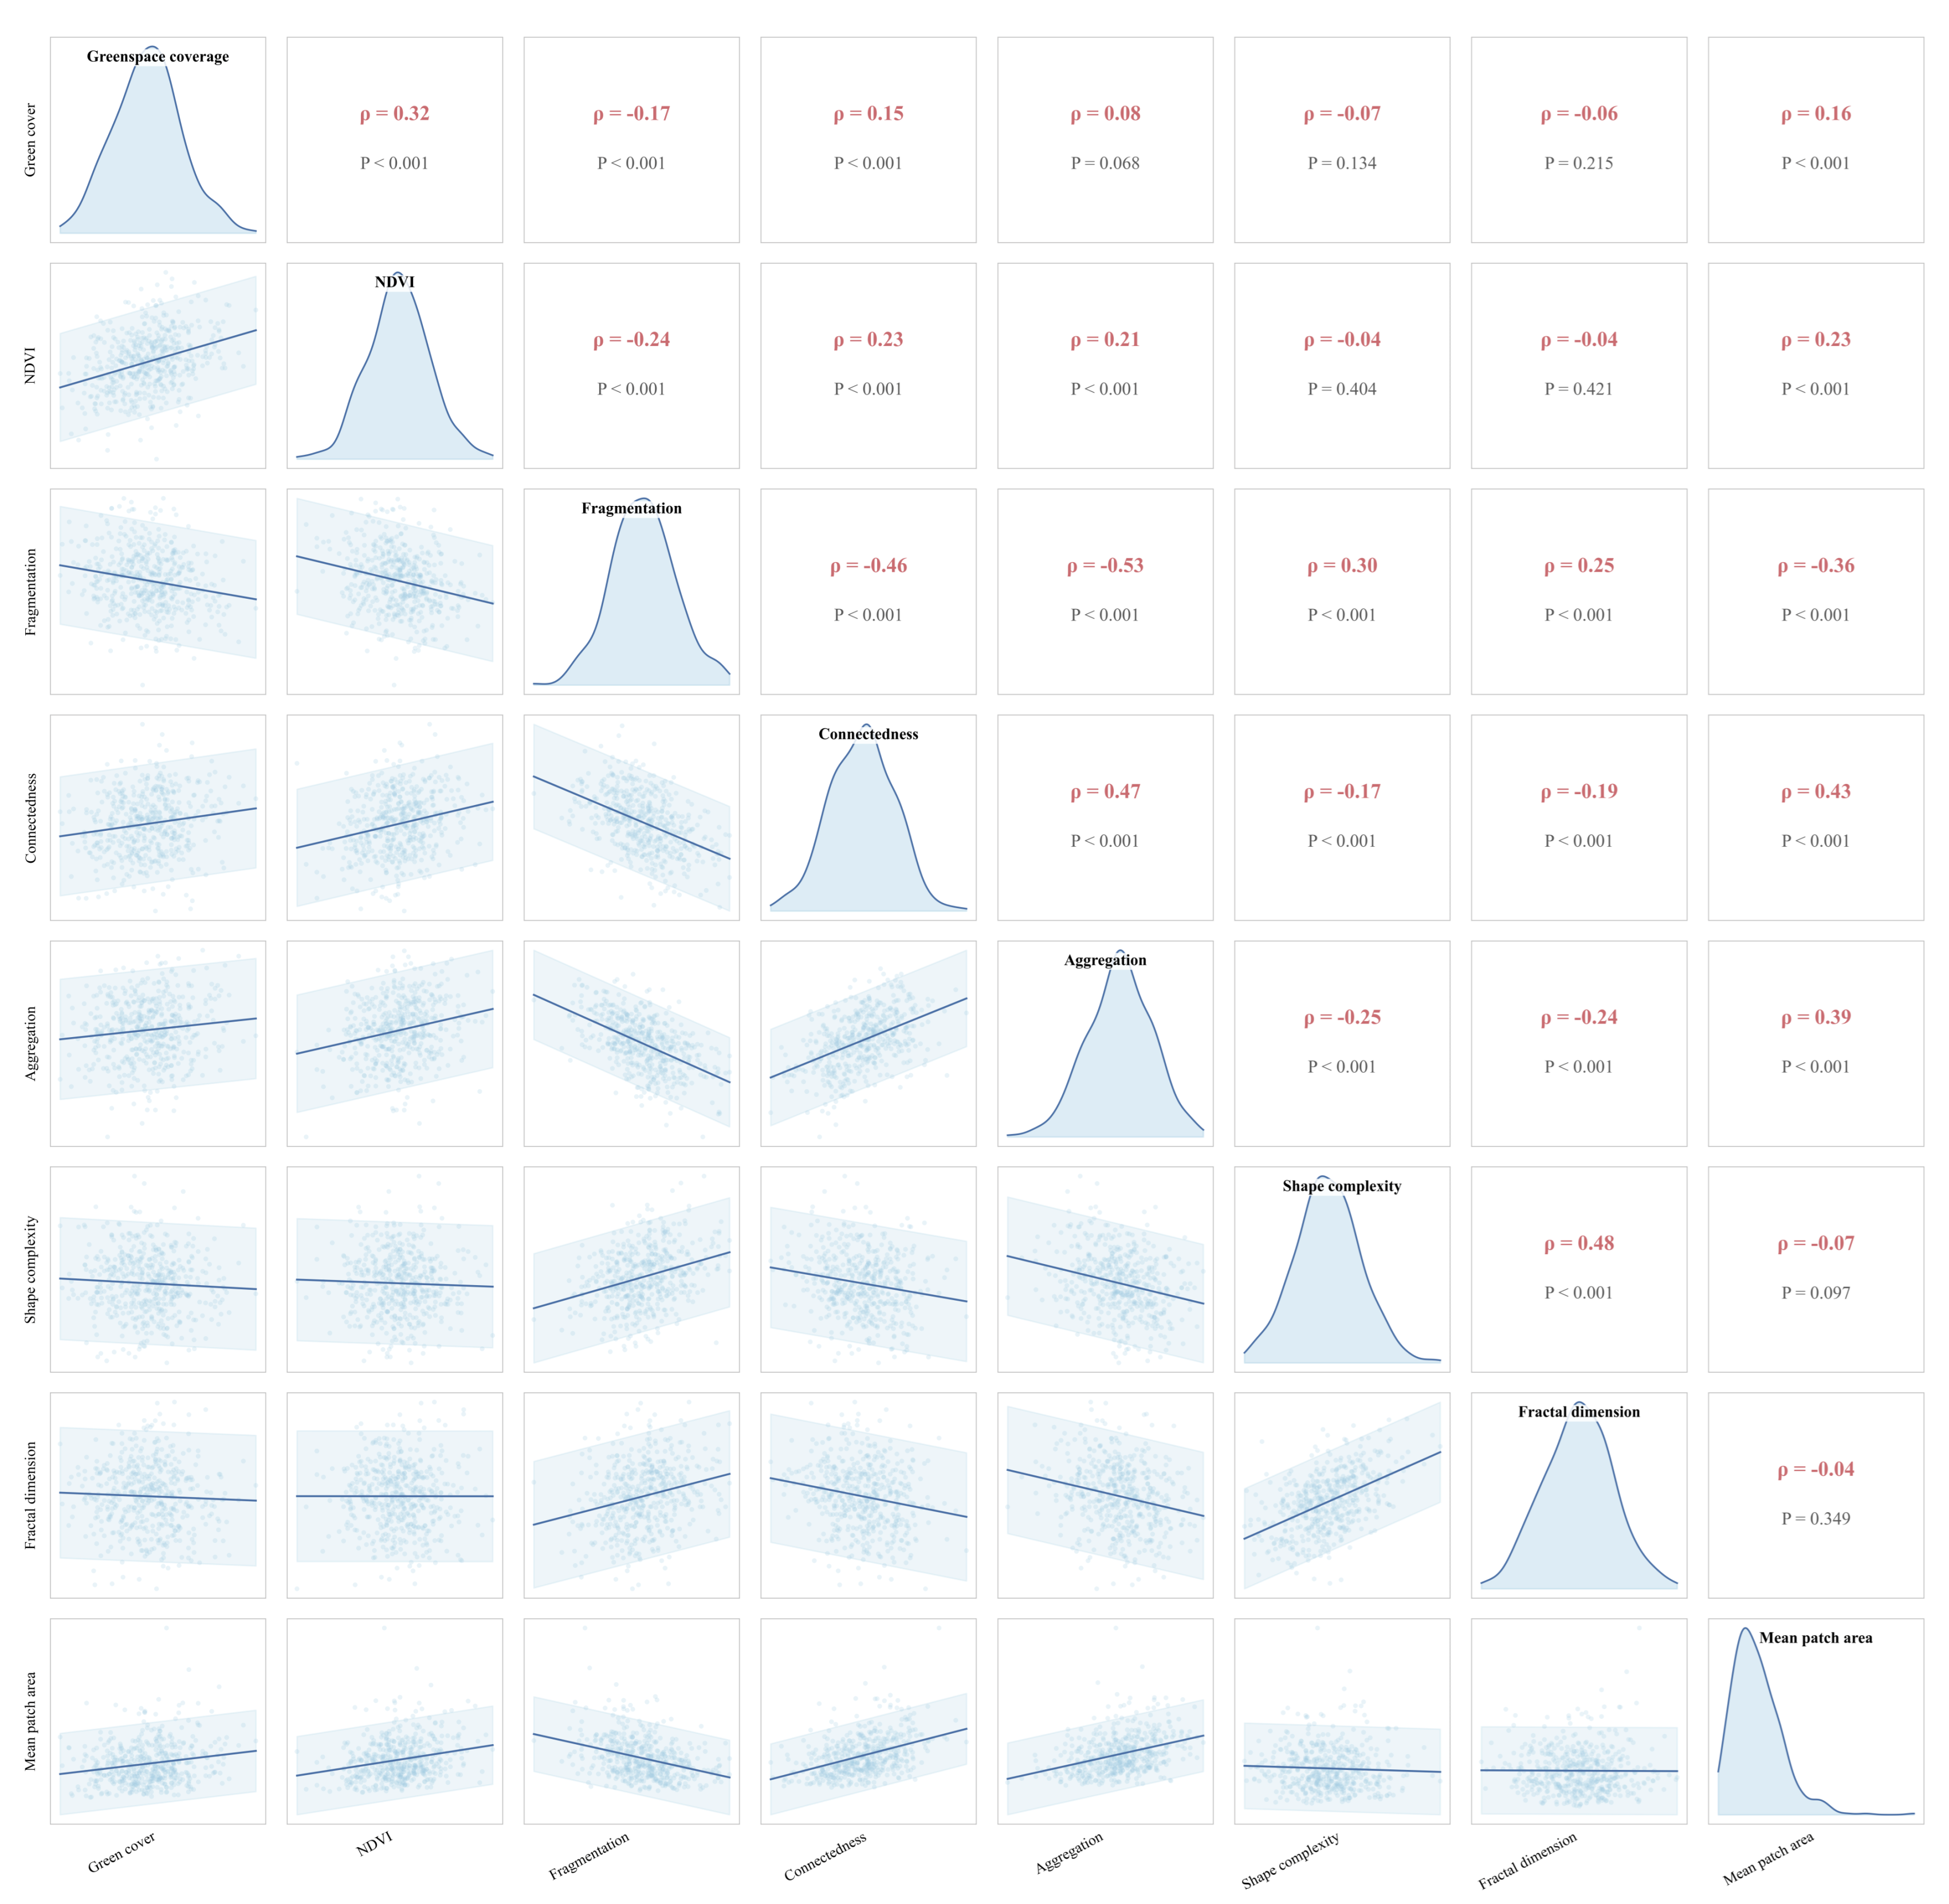
Most structural indicators showed weak-to-moderate correlations (Figure 3), with the strongest relationship occurring between fragmentation and aggregation (ρ = −0.534, FDR-adjusted p < 0.001). No substantial multicollinearity was detected, so all indicators were retained.
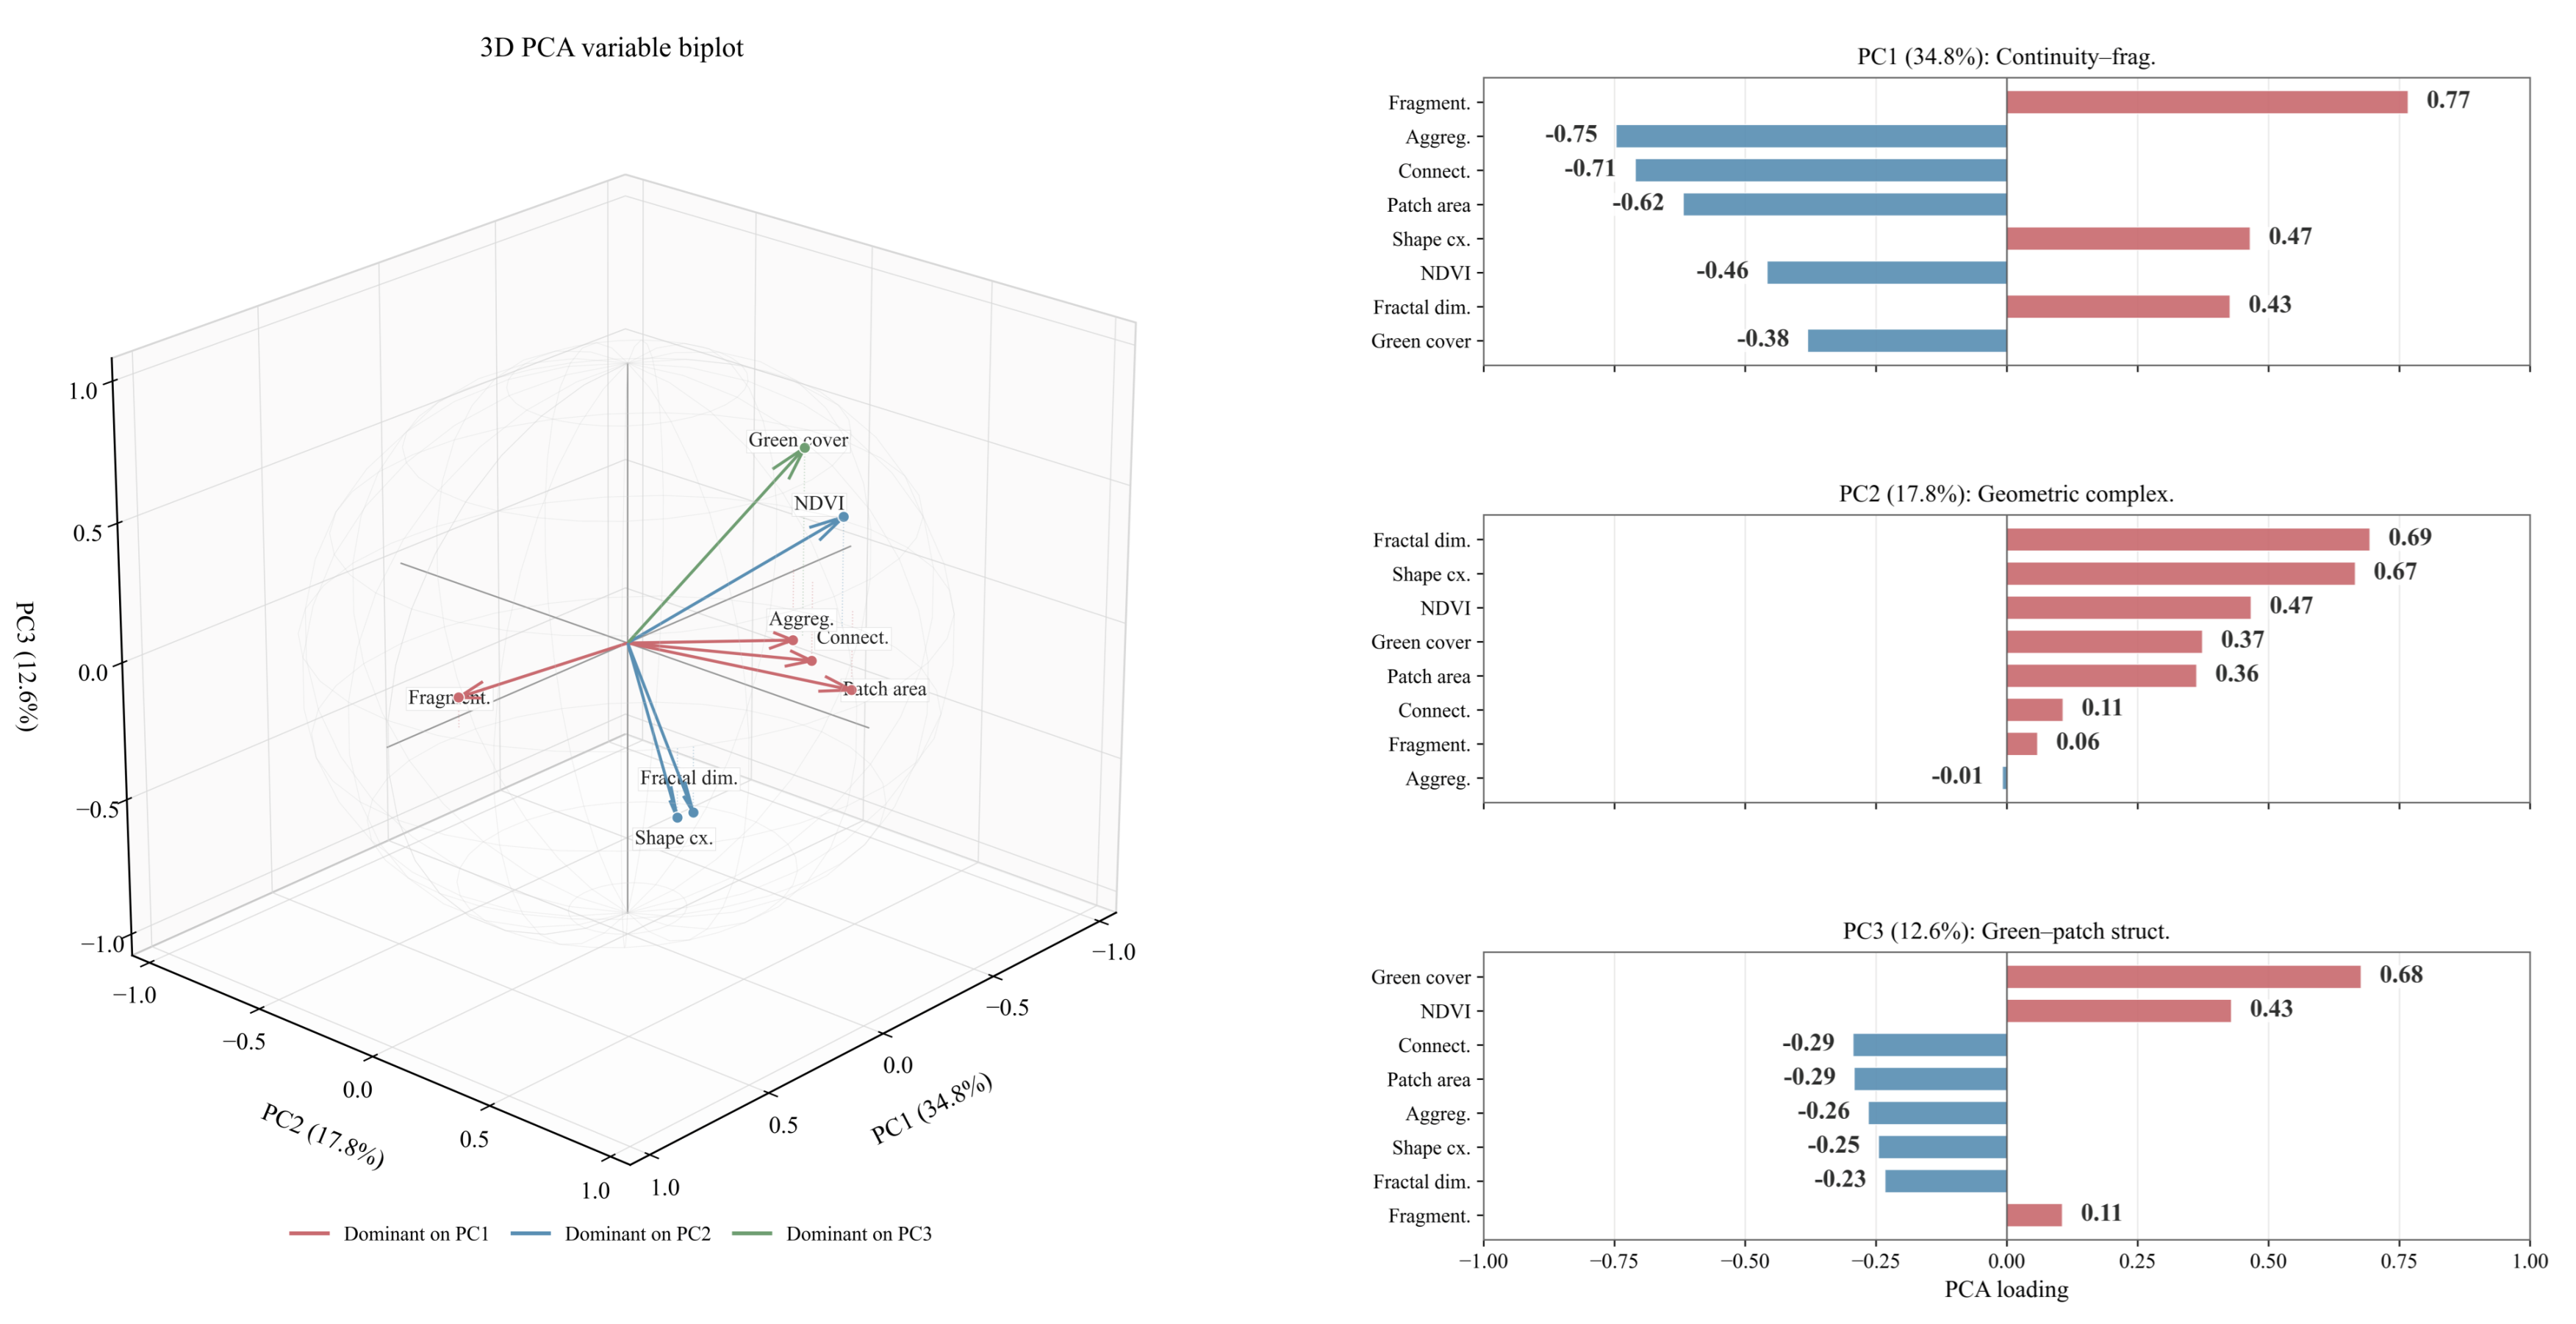
PCA summarized these indicators into three main structural gradients explaining 65.2% of total variation (Figure 4). The first represented a continuity–fragmentation gradient, separating continuous, aggregated vegetation from fragmented vegetation. The second primarily represented geometric complexity, while the third captured differences in patch scale and spatial extent.
The ten parks occupied different positions along these continuous gradients rather than forming completely discrete structural categories. Multivariate analysis confirmed significant differences among parks (PERMANOVA, p < 0.001), with fragmentation, aggregation, shape complexity, and fractal dimension contributing most strongly to this differentiation. Overall, the main structural distinction among horticultural scenes was therefore not vegetation quantity itself, but how vegetation was connected, fragmented, and geometrically organized.

3.1.2. Stability of Representative Configuration States

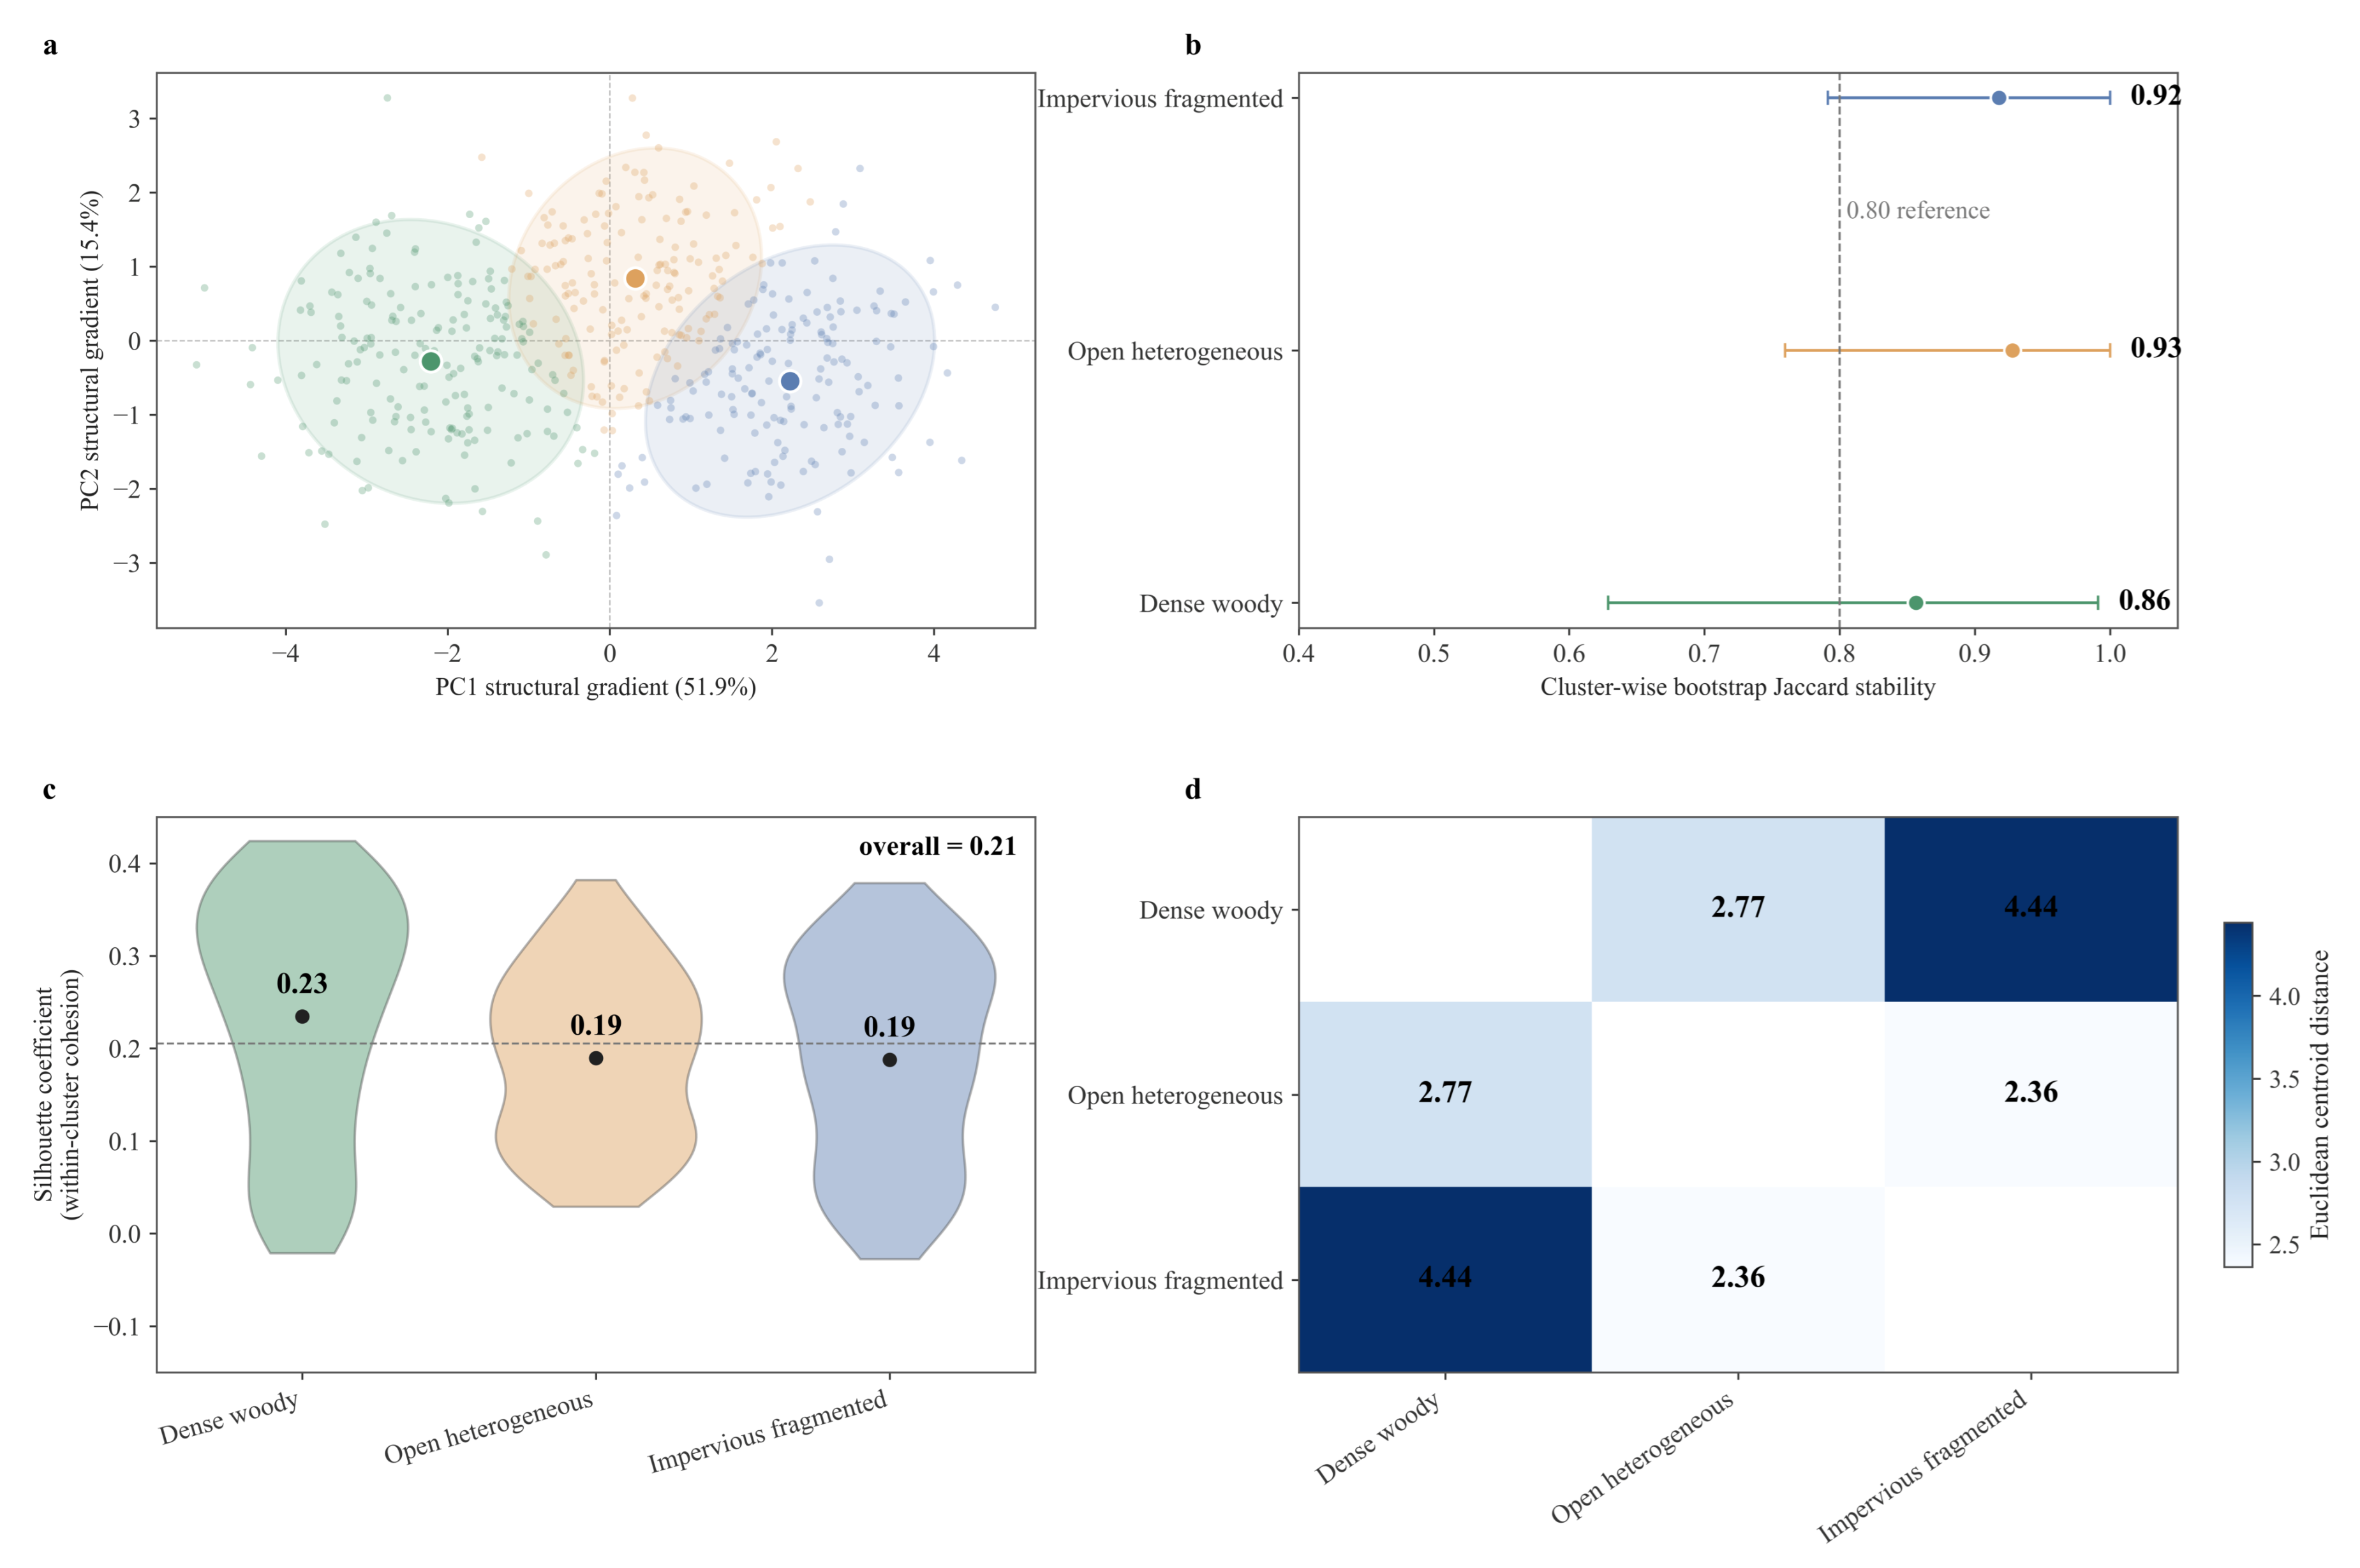
Evaluation of the candidate numbers of clusters showed that K = 2 achieved the highest silhouette coefficient (0.301) and Calinski–Harabasz index (293.943), together with the lowest Davies–Bouldin index (1.255), indicating the statistically optimal partition according to the internal validation metrics. Although the K = 3 solution showed moderate internal performance (silhouette coefficient = 0.205, Calinski–Harabasz index = 214.789, and Davies–Bouldin index = 1.598), it offered greater ecological interpretability by distinguishing three representative configuration states with distinct structural profiles. Specifically, K = 3 produced dense woody, open heterogeneous, and impervious fragmented states, each with a clearly differentiated structural profile and a relatively balanced sample distribution. Bootstrap resampling further yielded Jaccard similarities of 0.86–0.93 across the three clusters and high overall agreement (ARI = 0.853 ± 0.111; NMI = 0.837 ± 0.102), indicating good resampling stability of the three-state structure.
The dense woody configuration was characterized by higher aggregation, connectedness, and mean patch area, together with lower fragmentation, indicating a highly continuous vegetation structure. The open heterogeneous configuration exhibited greater shape complexity and fractal dimension, reflecting increased geometric complexity and spatial heterogeneity. In contrast, the impervious fragmented configuration was characterized by higher fragmentation and lower aggregation and connectedness, indicating a highly fragmented vegetation structure.
Bootstrap resampling demonstrated high stability of the three-state solution. Cluster-wise Jaccard similarities ranged from 0.86 to 0.93 across the three configurations (Figure 5b), while overall clustering consistency remained high (ARI = 0.853 ± 0.111; NMI = 0.837 ± 0.102). Considering structural distinctiveness, sample-size balance, and resampling stability, K = 3 was retained as the representative horticultural configuration typology for subsequent analyses.

3.2. Multidimensional Visual Perception Is Organized into Functional Perceptual Domains

3.2.1. Latent Structure of Multidimensional Visual Perception

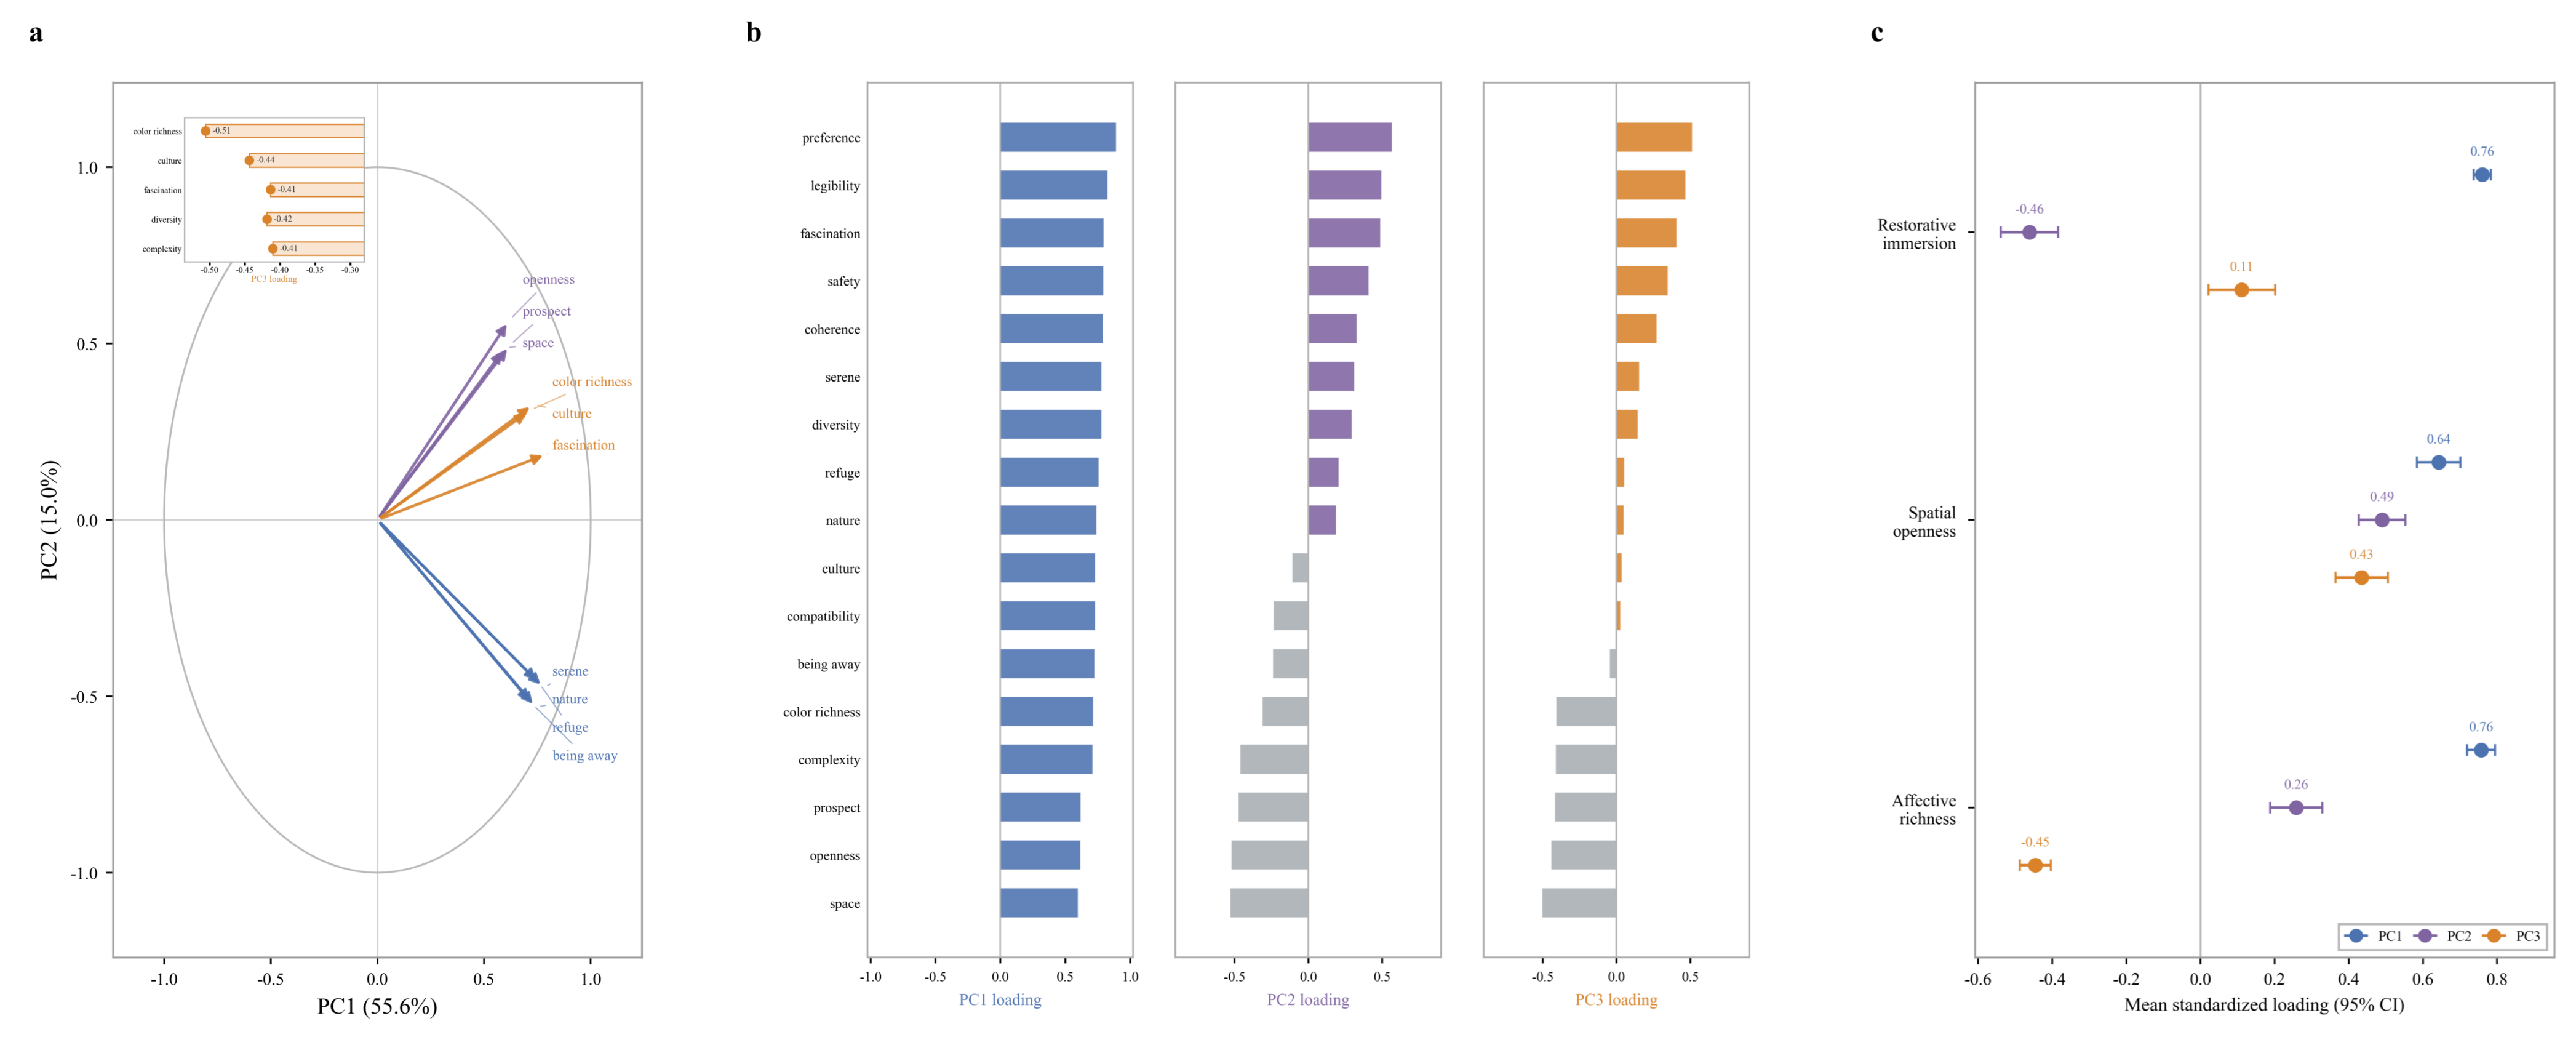
Principal component analysis was conducted on the 17 visual perception indicators. The data showed high suitability for factor analysis (KMO = 0.958; Bartlett’s test of sphericity, p < 0.001). The first three principal components explained 81.64% of the total perceptual variance, with PC1, PC2, and PC3 accounting for 55.63%, 15.04%, and 10.96%, respectively (Figure 6a).
PC1 was primarily defined by restoration-related indicators, including nature, serene, being away, refuge, and coherence, and was interpreted as restorative immersion. PC2 was dominated by spatial-organization indicators, including openness, prospect, space, and compatibility, and was interpreted as spatial openness. PC3 was primarily associated with experiential attributes, including color richness, culture, fascination, diversity, and complexity, and was interpreted as affective richness.

3.2.2. Perceptual Differentiation Across Representative Configuration States

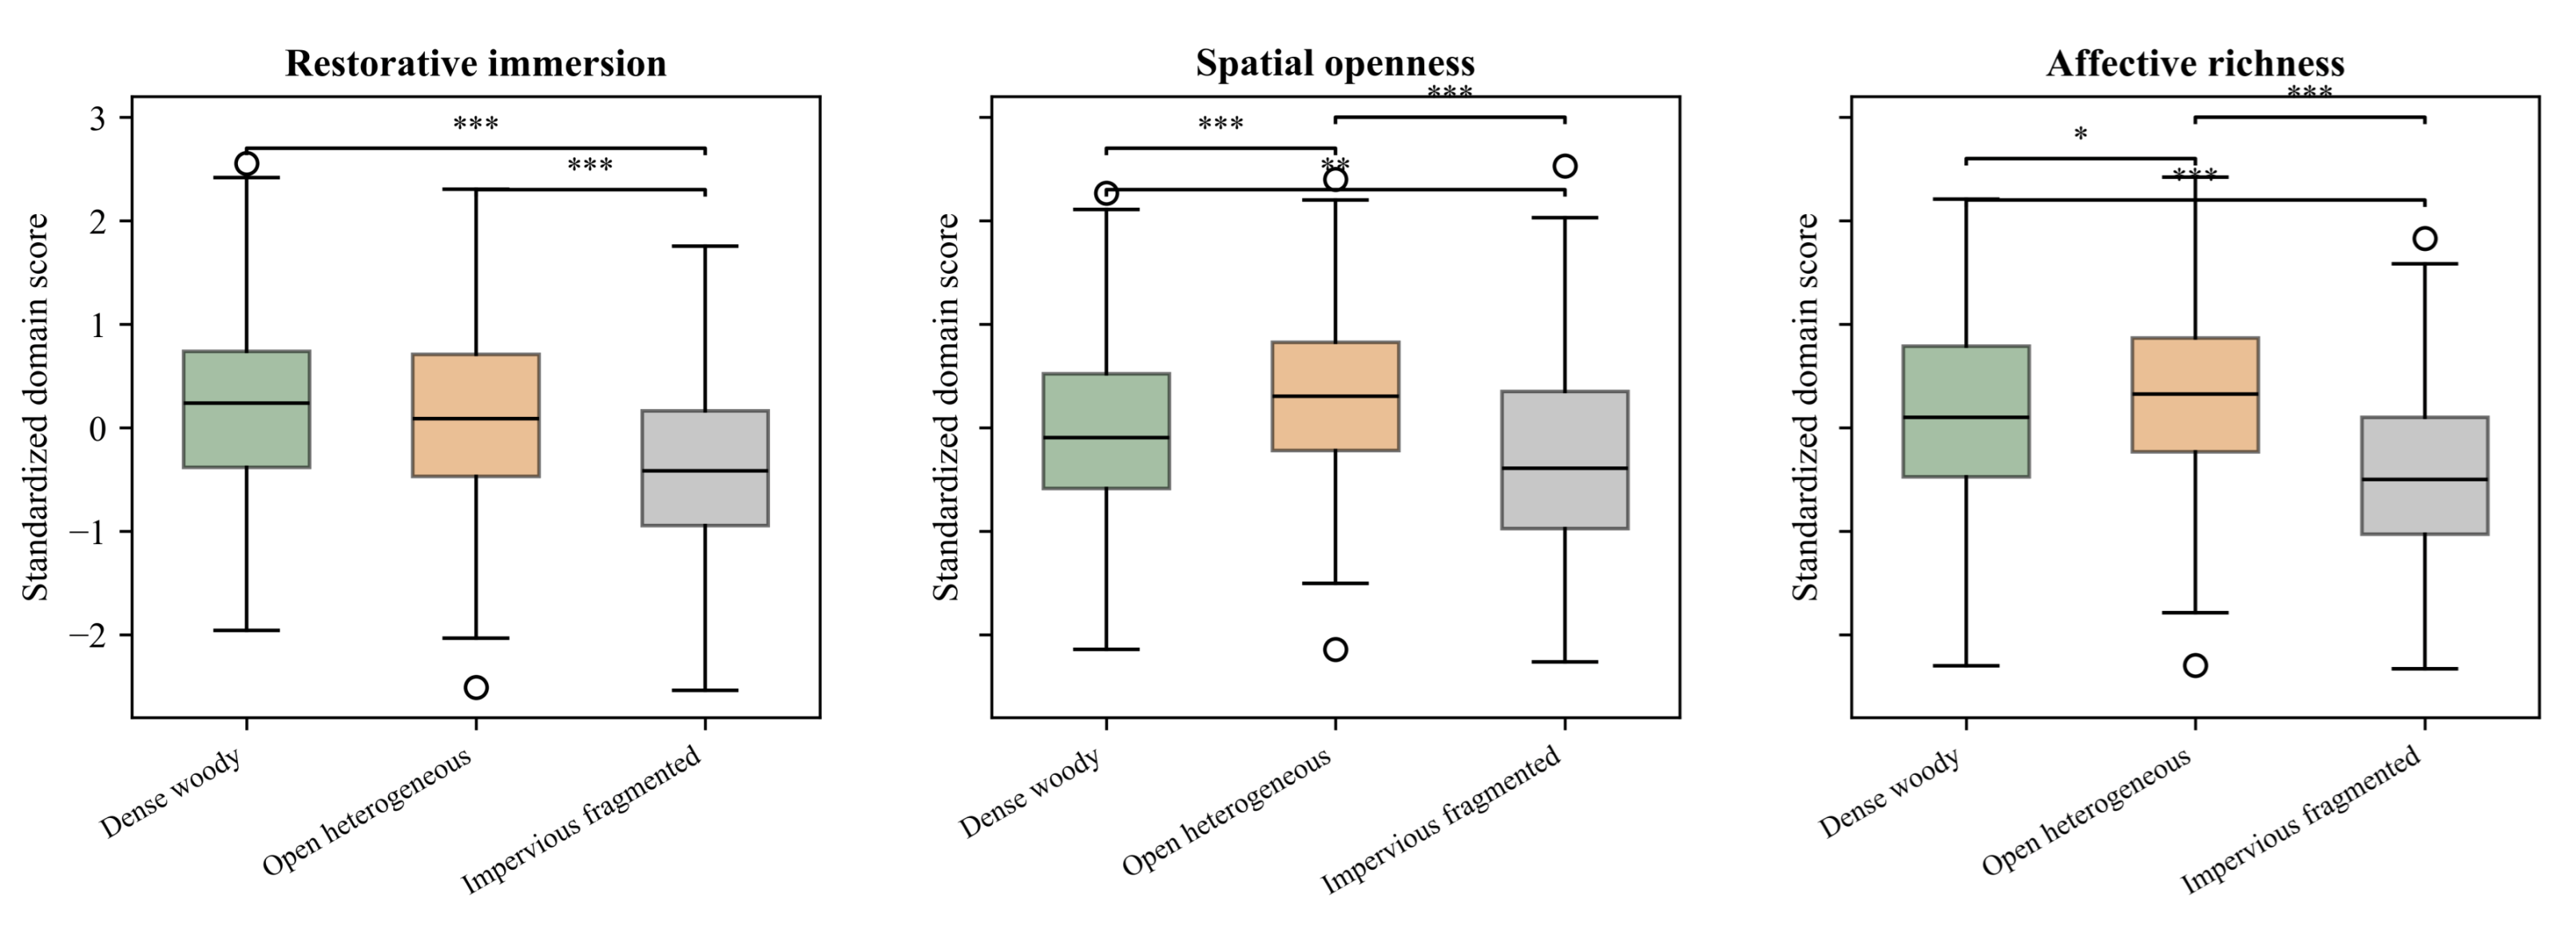
Differences in restorative immersion, spatial openness, and affective richness among the three representative horticultural configurations were assessed using Kruskal–Wallis tests, followed by Dunn’s post hoc pairwise comparisons with Benjamini–Hochberg FDR correction (Figure 7).
Significant differences among the three configurations were observed for restorative immersion (H = 38.495, p < 0.001, η2H = 0.073), spatial openness (H = 39.858, p < 0.001, η2H = 0.076), and affective richness (H = 68.327, p < 0.001, η2H = 0.133). Affective richness showed the strongest differentiation across configuration states.
For restorative immersion, the dense woody and open heterogeneous configurations did not differ significantly ( P F D R = 0.334), whereas both exhibited significantly higher scores than the impervious fragmented configuration (both P F D R < 0.001). Spatial openness followed a clear gradient, with the open heterogeneous configuration scoring highest, followed by the dense woody configuration and then the impervious fragmented configuration; all pairwise differences were significant ( P F D R ≤ 0.005). Affective richness exhibited the same ordering—open heterogeneous, dense woody, and impervious fragmented—with all pairwise comparisons reaching statistical significance ( P F D R ≤ 0.021).

3.3. Configuration Predicts Perception Beyond Greenness

To assess the predictive contribution of horticultural configuration beyond conventional greenness measures, three models were constructed: a greenness model including NDVI and greenspace coverage; a configuration model including fragmentation, aggregation, connectedness, shape complexity, fractal dimension, and mean patch area; and a full model including all predictors. Model performance was evaluated using cross-validated R 2 . Incremental predictive contribution was quantified as the difference in cross-validated R 2 between the full and greenness models ( Δ R 2 ), with 95% confidence intervals estimated using model-refitting bootstrap resampling (Figure 8).

3.3.1. Incremental Predictive Contribution of Horticultural Configuration

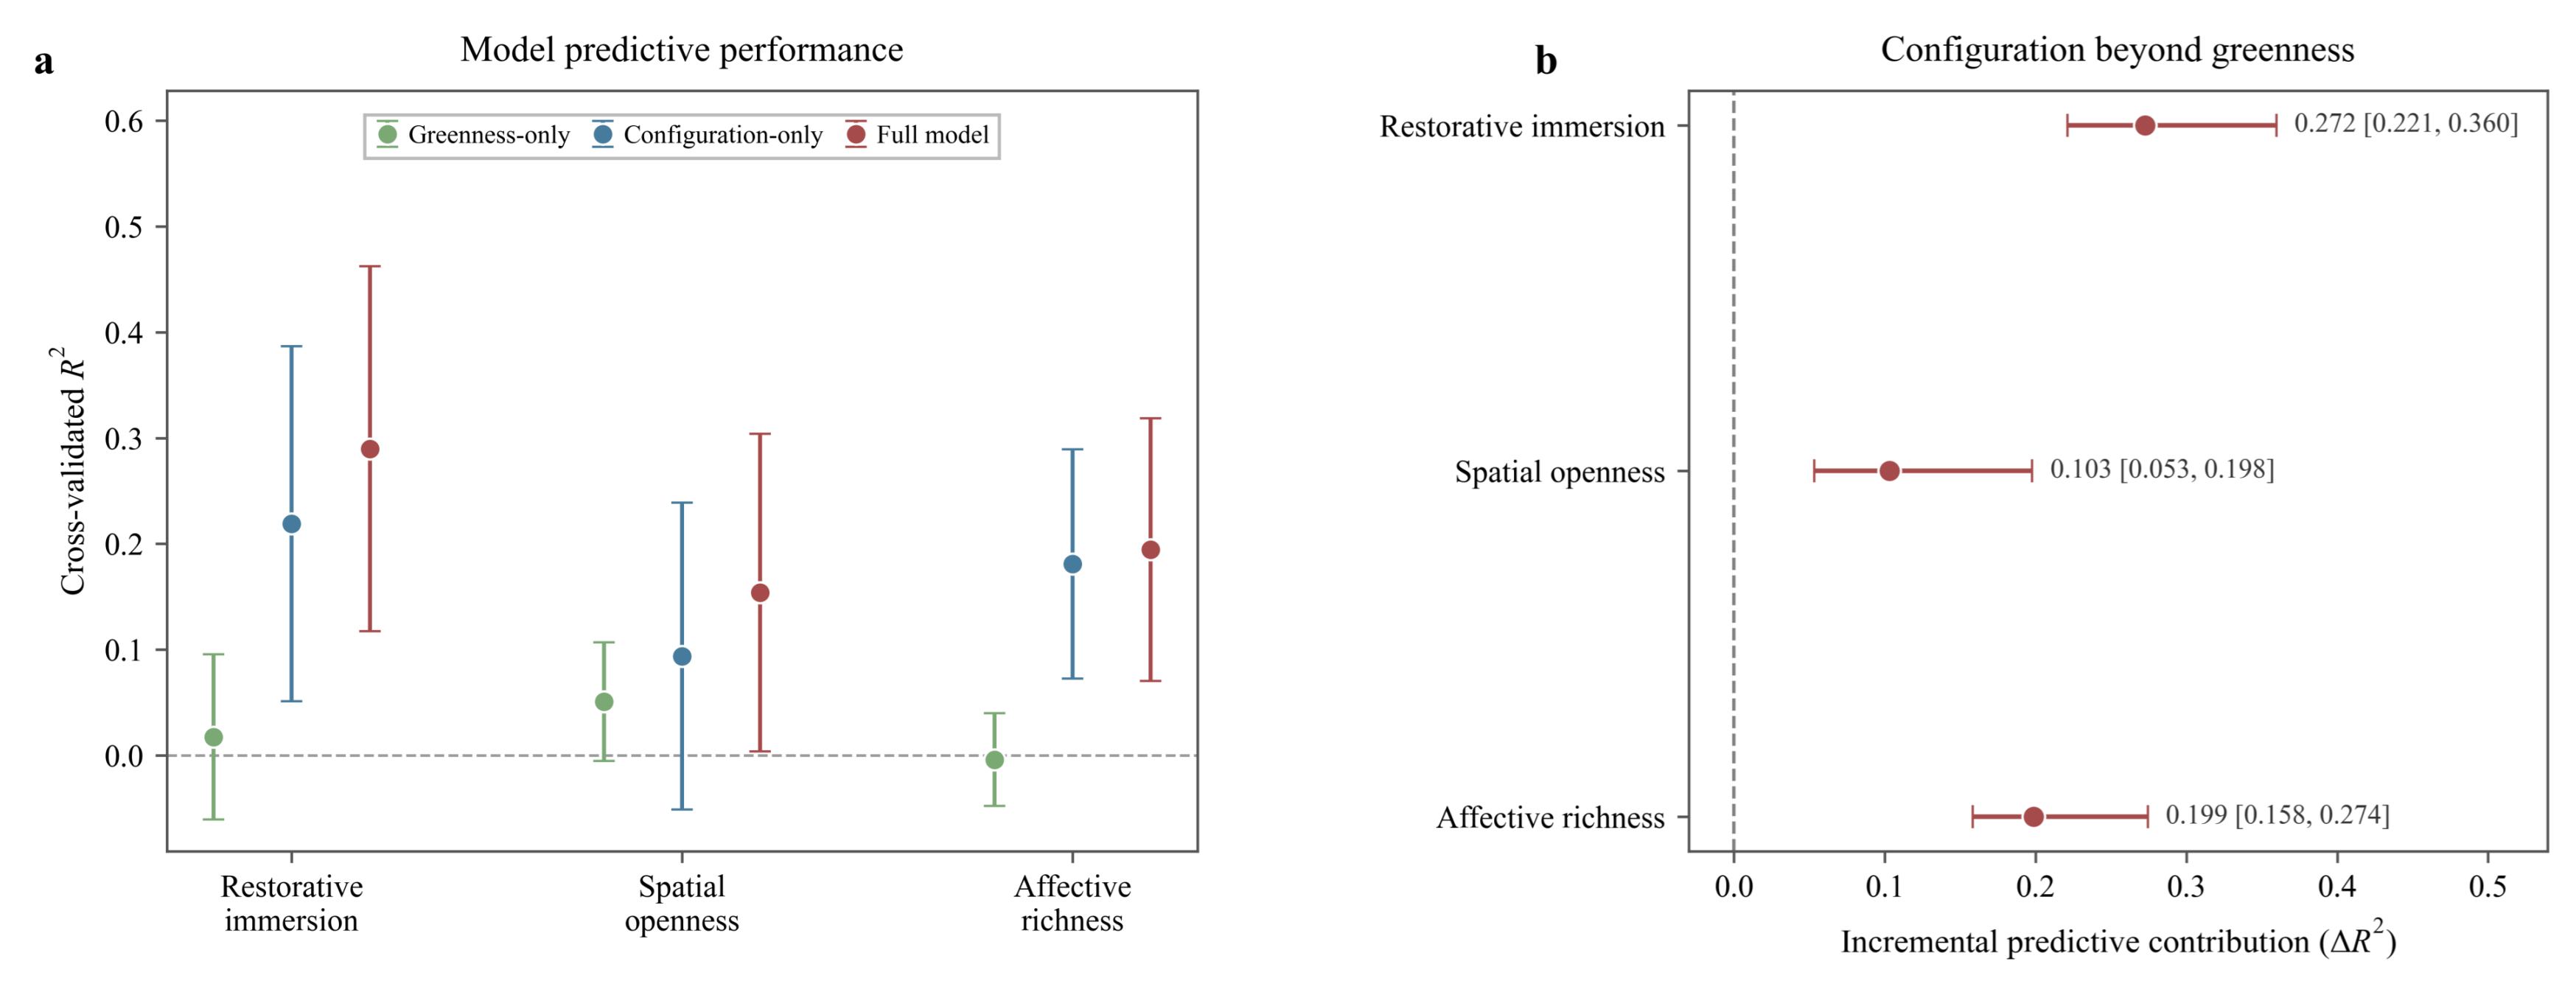
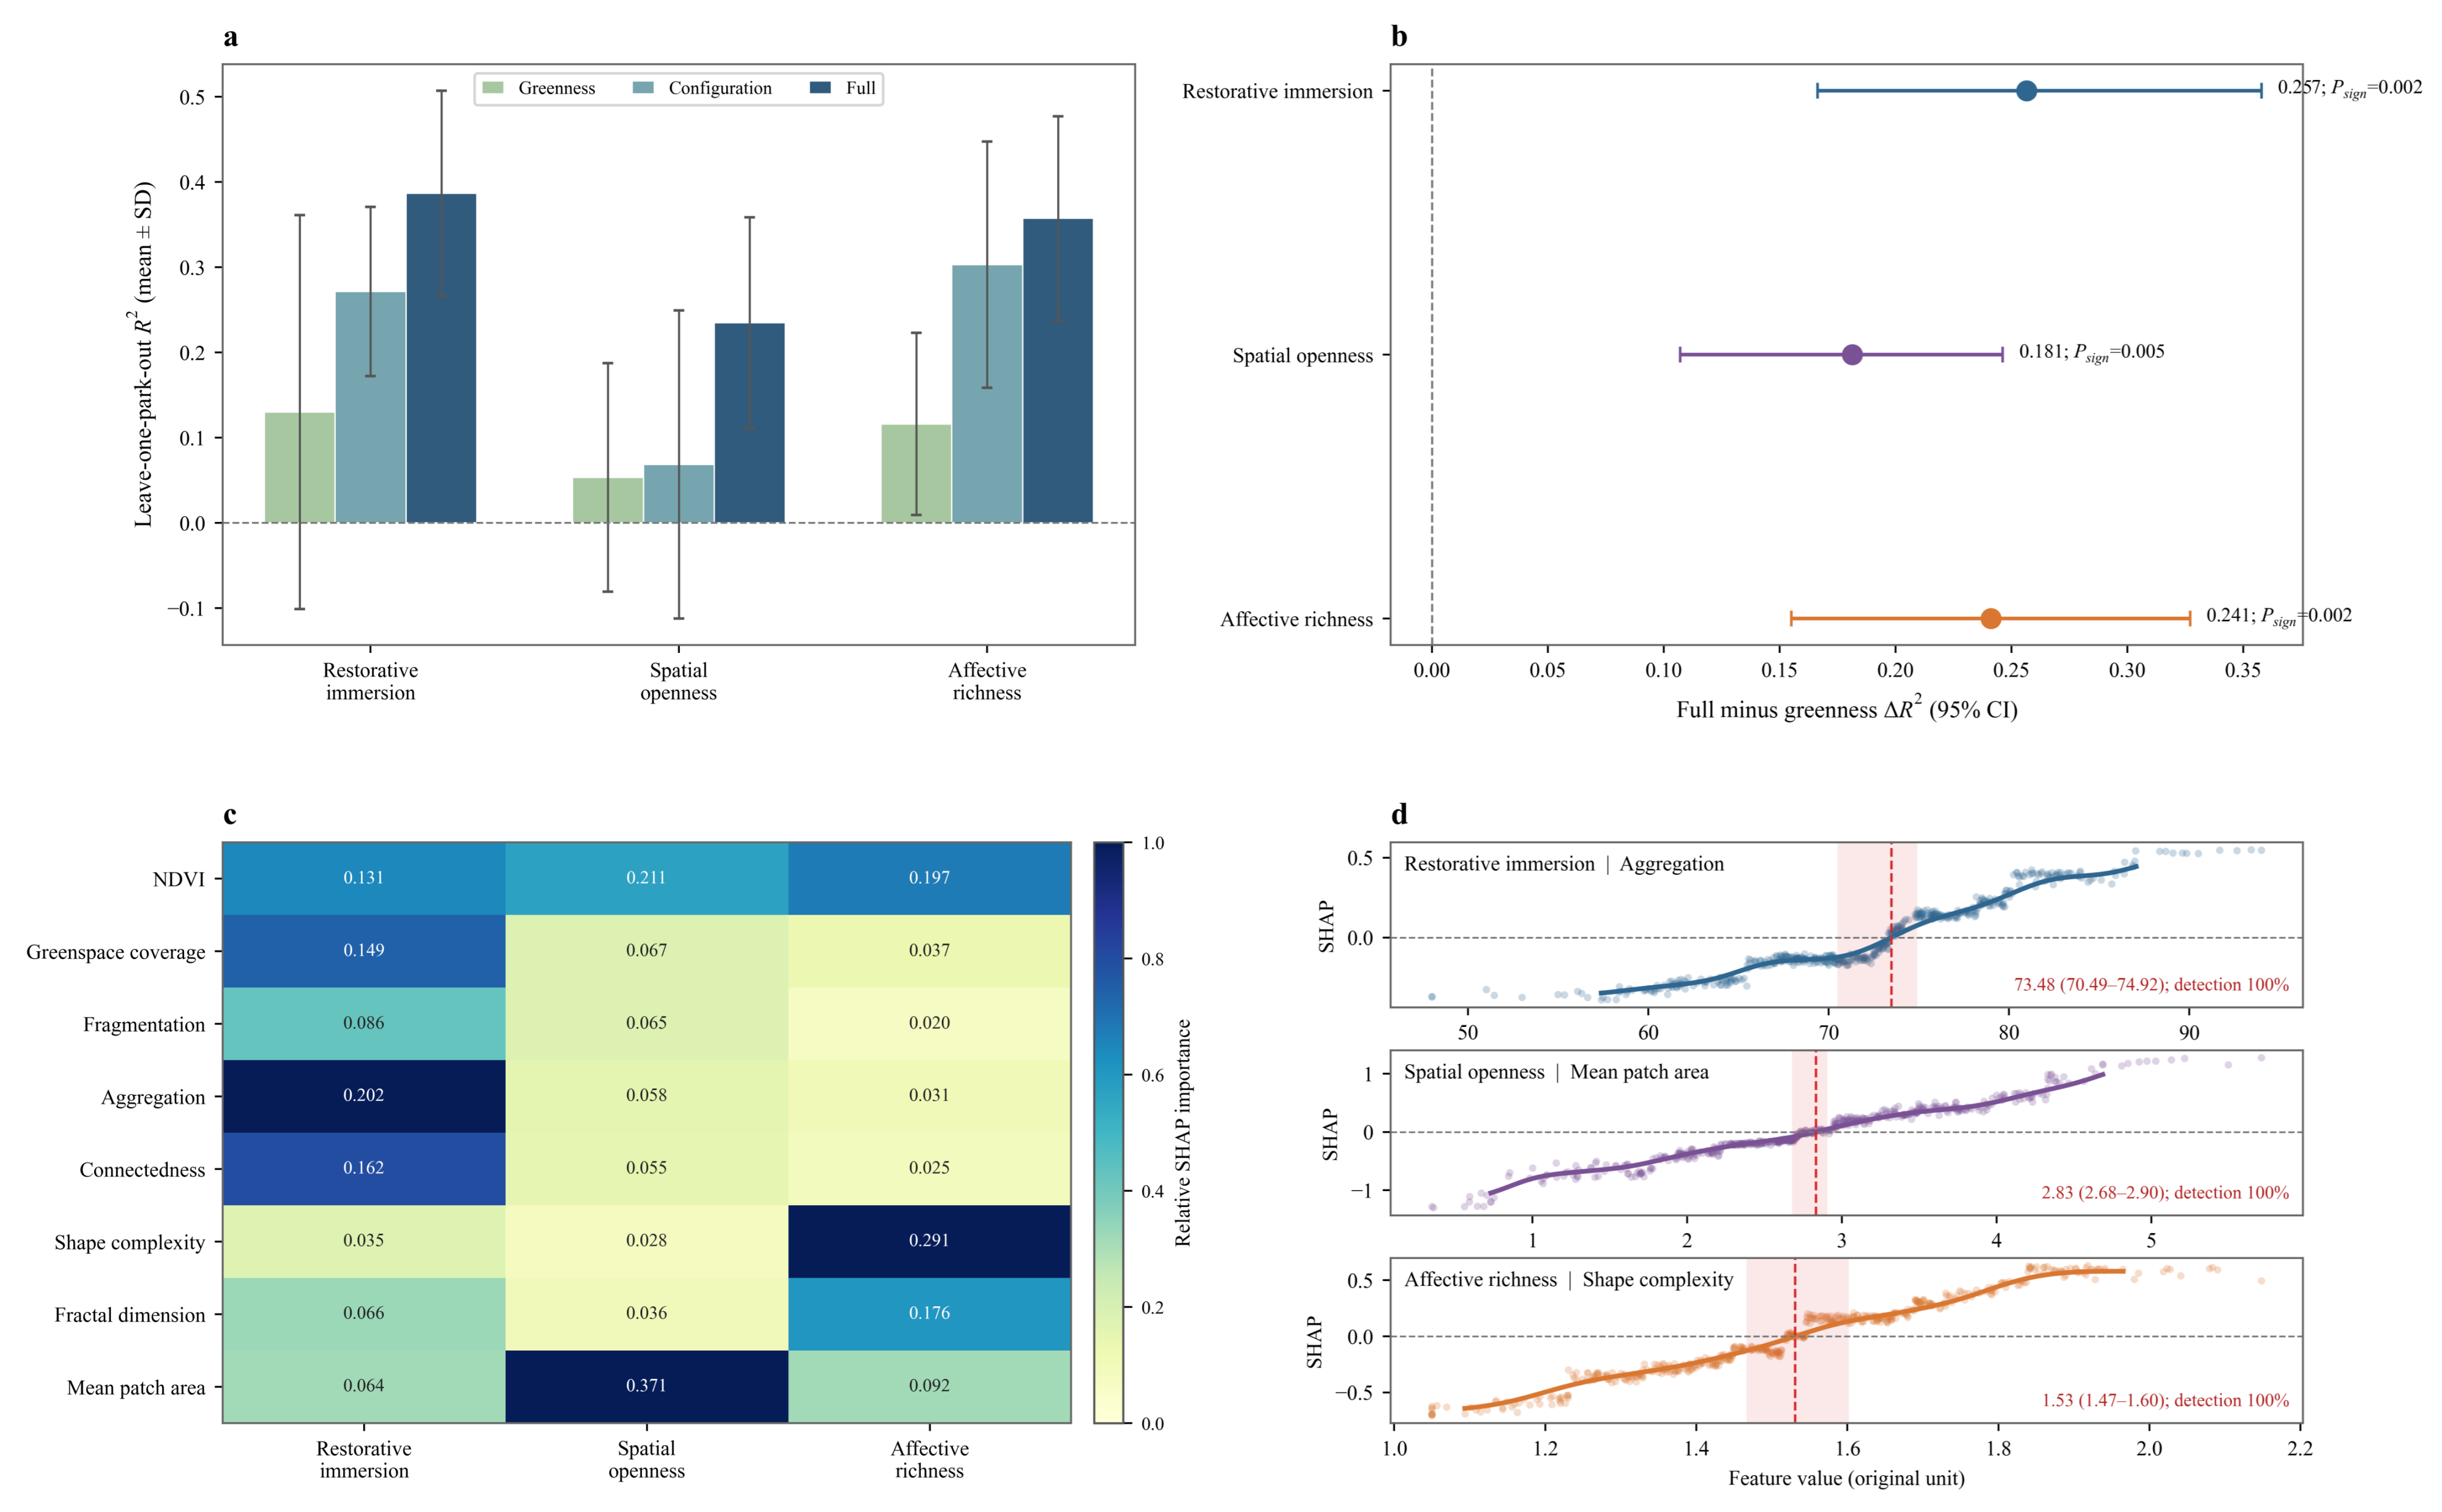
The greenness model showed limited predictive performance, with cross-validated R 2 values of 0.130, 0.053, and 0.116 for restorative immersion, spatial openness, and affective richness, respectively (Figure 9a). The configuration model achieved higher predictive performance for restorative immersion ( R 2 = 0.271 ) and affective richness ( R 2 = 0.303 ), but remained weak for spatial openness ( R 2 = 0.069 ).
The full model performed best across all three perceptual domains, with cross-validated R 2 values of 0.387, 0.235, and 0.357 (SD = 0.120, 0.124, and 0.120, respectively) (Figure 9b). Relative to the greenness model, the corresponding Δ R 2 values were 0.257, 0.181, and 0.241. None of the confidence intervals included zero, indicating robust incremental predictive contributions from horticultural configuration. Consistently, the in-sample R 2 values increased from 0.303, 0.155, and 0.193 for the greenness model to 0.659, 0.501, and 0.591 for the full model, respectively.

3.3.2. Perceptual Domain-Specific Structural Predictors

SHAP analysis identified distinct dominant predictors across the three perceptual domains (Figure 9c). Restorative immersion was primarily predicted by aggregation (mean (|SHAP| = 0.202)) and connectedness (0.162), whereas spatial openness was predominantly predicted by mean patch area (0.371). Affective richness was mainly predicted by shape complexity (0.291), NDVI (0.197), and fractal dimension (0.176). These results indicate that the three perceptual domains were primarily associated with vegetation aggregation and connectivity, patch scale, and boundary geometric complexity, respectively.

3.3.3. Stable Nonlinear Response Points

SHAP dependence analysis showed monotonic positive responses for all three dominant structural predictors (Figure 9d). The SHAP contribution of aggregation to restorative immersion shifted from negative to positive at 73.477. The corresponding zero-crossing points were 2.832 for the association between mean patch area and spatial openness, and 1.531 for the association between shape complexity and affective richness. All three response points were detected in 100% of 200 whole-park bootstrap model refits, indicating high positional stability.

4. Discussion

4.1. Horticultural Configuration Extends Visual Assessment Beyond Greenness

This study demonstrates that vegetation quantity and horticultural configuration capture different aspects of the visual environment. Conventional greenness indicators primarily describe “how much vegetation” is present, whereas fragmentation, aggregation, connectedness, patch size, and geometric complexity further reveal “how vegetation is organized.” Consequently, even when overall greenness is similar, different forms of spatial organization may produce substantially different visual environments and perceptual experiences [50,51,52].
The multidimensional structural analysis further indicates that urban parks do not follow a single “greenness–structure” gradient; instead, their spatial characteristics are jointly shaped by vegetation continuity, spatial scale, and geometric form [53]. The three representative configuration states should therefore be interpreted as typical spatial-organization prototypes rather than absolutely discrete park categories. Their value lies in translating complex continuous structures into horticultural configuration patterns that practitioners can recognize and apply.
These findings suggest that relying solely on the NDVI, vegetation coverage, or similar greenness indicators may overlook important spatial structural information. Horticultural landscape assessment should therefore extend beyond vegetation quantity to jointly consider both vegetation quantity and spatial organization, bringing visual environmental evaluation into closer alignment with actual design practice.

4.2. Representative Configuration States Correspond to Distinct Perceptual Functions

This study found that the three representative horticultural configurations exhibited distinct perceptual profiles across restorative immersion, spatial openness, and affective richness, with the strongest differentiation occurring in affective richness. This indicates that visual quality is not a single overall preference but comprises multiple relatively independent experiential dimensions. This finding is consistent with previous research recognizing the multidimensional structure of restorative, spatial, and aesthetic experiences [54,55,56,57,58,59,60,61].
The dense woody configuration was characterized by greater vegetation aggregation, connectedness, and mean patch area and received higher ratings for restorative immersion. In conjunction with previous studies [62,63,64,65,66], these findings suggest that continuous and relatively enclosed vegetation structures may support restorative experiences by strengthening perceived naturalness, tranquility, refuge, and being away. However, this configuration received lower ratings for spatial openness and affective richness than the open heterogeneous configuration. This may reflect the constraints imposed by continuous vegetation on visual extension and spatial variation [67,68,69,70,71,72].
The open heterogeneous configuration exhibited greater shape complexity and fractal dimension and received the highest ratings for spatial openness and affective richness. Consistent with previous studies [73,74,75], diverse boundary forms, spatial layering, and visual transitions may enhance perceived openness, opportunities for exploration, and landscape diversity. Notably, no significant difference in restorative immersion was found between the open heterogeneous and dense woody configurations. This empirical result indicates that similar restorative experiences may correspond to different structural conditions: the dense woody configuration primarily provides continuity, refuge, and spatial coherence, whereas the open heterogeneous configuration may support restoration through spatial variation, visual attraction, and opportunities for exploration [76,77,78].
The impervious fragmented configuration exhibited lower vegetation aggregation and connectedness and received the lowest ratings across all three perceptual domains. In light of previous research [79,80,81,82], fragmented vegetation organization and frequent spatial interruptions may weaken environmental coherence, immersion in nature, and visual richness. These findings therefore indicate that perceptual benefits depend not only on the quantity of vegetation but also on the spatial relationships among vegetation elements [83].

4.3. Configuration–Perception Relationships Are Domain-Specific and Nonlinear

Different perceptual functions depend on distinct structural cues. Restorative immersion was more closely associated with vegetation aggregation and connectedness, suggesting that a continuous and coherent vegetation background may provide an important structural basis for environmental coherence, perceived refuge, and immersion in nature [84,85,86].
Spatial openness depended more strongly on patch scale and spatial integrity. Larger continuous patches may reduce spatial subdivision and maintain a more coherent field of view. An open experience therefore does not simply require “less vegetation” but depends on whether vegetation and open spaces are organized at an appropriate scale [87,88,89,90].
Affective richness was more closely associated with boundary and geometric complexity. Moderate variation in form may increase visual information, spatial layering, and exploratory cues, thereby strengthening landscape interest and experiential richness [83,91,92,93]. Different structural attributes therefore perform distinct perceptual functions: continuity supports restoration, scale shapes openness, and complexity enhances richness [94]. Using a single greenness or structural indicator to represent overall visual quality may obscure these functional differences.
The nonlinear responses observed in the models further indicate that structural associations do not necessarily strengthen continuously as indicator values increase. However, the observed response points should be interpreted as empirical reference points under the present sample and modeling conditions, rather than as causal or universally applicable design thresholds. Their specific ranges may still be influenced by correlations among variables, landscape type, urban context, and sample coverage.

4.4. From Greenness Targets to Function-Oriented Configuration Strategies

These findings support a shift in urban park horticultural design from simple greenness targets toward function-oriented configuration. Conventional planning often uses vegetation coverage, vegetation indices, or the green view index as control targets, yet similar levels of greenness do not guarantee comparable visual experiences [95,96,97]. Design decisions should therefore address not only “how much vegetation to provide,” but also “how to organize it” and “which experiential function the organization is intended to serve”.
For restorative spaces, priority should be given to maintaining vegetation continuity and connectedness—for example, by connecting isolated patches, preserving continuous tree canopies or vegetated backgrounds, and reducing repeated fragmentation by paths and impervious boundaries [98,99,100]. The objective is not merely to increase the number of trees, but to create an integrated natural structure that can be visually perceived [101].
For spaces intended for activities, social interaction, and extended views, emphasis should be placed on the scale and integrity of open patches [102,103]. Entrances, activity lawns, and public gathering areas can enhance perceived openness by maintaining major view corridors, avoiding excessive fragmentation, and coordinating edge planting with the scale of open spaces.
For strolling and experience-oriented spaces, visual richness can be enhanced through moderate variation in planting boundaries, layered compositions, and landscape sequences [104,105,106]. However, greater complexity is not necessarily better; a balance should be maintained among heterogeneity, spatial legibility, and maintenance feasibility [107].
Accordingly, this study does not support pursuing a single “optimal configuration” that maximizes all types of experience. A more appropriate strategy is to create a sequence of complementary spaces within the same park: continuous vegetation supports restoration, coherent open patches facilitate activity and perceived openness, and organized structural heterogeneity enhances visual and affective richness [108,109,110,111,112,113]. For existing park renewal, this means first identifying specific structural deficiencies and then reconnecting vegetation, adjusting the scale of open spaces, or optimizing boundary forms, rather than automatically increasing overall greenness.

4.5. Limitations and Future Directions

This study has several limitations. First, the samples were drawn from only ten urban parks in Chengdu, with sampling units nested within parks. Leave-one-park-out cross-validation reduced within-park information leakage but could not substitute for external validation across cities. The spatial generalizability of the findings therefore remains limited.
Second, visual perception may vary with season, weather, vegetation condition, intended use, and cultural background. Future research should include multiple seasons, cities, and population groups and apply multilevel models to distinguish variation among sampling units, parks, and cities.
Third, SHAP identifies predictive associations rather than causal effects. The identified zero-crossing locations represent model-specific response points within the present sample and should not be interpreted directly as universally applicable design thresholds. Further validation using independent datasets, field experiments, or configuration-based interventions is required.
Finally, the three configurations represent characteristic states along continuous structural gradients rather than a fixed classification system. Their boundaries and structural meanings may vary across study areas, sample compositions, and indicator systems. Future studies should examine the stability and transferability of these configuration states and their perceptual functions across different urban contexts.

5. Conclusions

This study demonstrates that horticultural configuration in urban parks is not determined by a single greenness gradient but is jointly structured by relatively independent dimensions, including vegetation continuity–fragmentation, geometric complexity, and patch scale. Dense woody, open heterogeneous, and impervious fragmented configurations should be understood as representative states within a continuous structural space rather than as fixed design styles or universally applicable park types. Within their existing design language, historical context, and functional framework, different parks may generate different perceptual outcomes by adjusting these structural dimensions. This study therefore does not advocate replacing naturalistic, formal, waterfront, cultural, or other established design styles with a uniform spatial form. Instead, it provides a set of structural diagnostic dimensions that can be incorporated into different design styles.
Compared with greenspace coverage and the NDVI, which describe “how much vegetation” is present, configuration metrics further reveal “how vegetation is organized” and the perceptual significance of this organization. Vegetation aggregation and connectedness were primarily associated with restorative immersion, patch scale with spatial openness, and geometric complexity with affective richness. Thus, design style defines a park’s overall spatial language, whereas configuration metrics can further indicate whether that language effectively supports its intended use and perceptual functions. The same greenness target may therefore be achieved through different configurations, while different design styles may attain similar functional performance through structural adjustment.
For planning and professional practice, these findings provide a framework applicable across master planning, functional zoning, detailed design, and renewal assessment. At the planning stage, the dominant perceptual function of each area can first be determined according to objectives such as restoration, activity and social interaction, or recreational experience. During design development, alternative spatial schemes can then be evaluated using vegetation continuity, patch scale, and geometric complexity rather than greenness alone. For existing park renewal, specific structural deficiencies—such as fragmented vegetation, excessively subdivided open spaces, or monotonous boundary structures—can be identified to guide interventions such as reconnecting vegetation patches, adjusting open-space scale, or optimizing planting boundaries. These metrics can therefore support not only the interpretation of perceptual differences but also design comparison, design review, and renewal prioritization.
Accordingly, this study supports a shift in urban park planning from a uniform greening objective toward design-style-sensitive and function-oriented configuration. While preserving the distinctive design style and sense of place of each park, continuous woody structures can support restoration, appropriately scaled open patches can sustain openness and activity functions, and organized variation in boundaries and spatial layers can enhance experiential richness. The identified model response points may inform scheme testing and scenario comparison but should not be directly treated as universal design thresholds. Their applicability requires further validation across different design styles, urban contexts, and field-based intervention studies.

Author Contributions

Conceptualization, Y.P.; Software, Z.L.; Investigation, Z.L. and Y.L.; Resources, Y.L.; Writing—original draft, Y.P.; Writing—review & editing, Y.P.; Supervision, Q.C. and H.S.; Project administration, H.S.; Funding acquisition, Q.C. All authors have read and agreed to the published version of the manuscript.

Funding

This research was supported by the National Key R&D Program of China: Technologies for the Construction of Urban-Rural Recreational and Health-Promoting Bamboo Forests [Grant No. 2023YFD22012040102].

Data Availability Statement

The original contributions presented in this study are included in the article. Further inquiries can be directed to the corresponding authors.

Acknowledgments

We would like to express our sincere gratitude to all those who have contributed to the success of this research.

Conflicts of Interest

The authors declare no conflicts of interest.

References

  1. Gao, W.; Tang, B.M.; Liu, B. Effects of Landscape Characteristic Perception of Campus on College Students’ Mental Restoration. Behav. Sci. 2025, 15, 470. [Google Scholar] [CrossRef] [Scilit]
  2. Ghasaban, M.; Mirjalili, P.; Yeganeh, M. Integration of building envelope with open spaces and greenery to enhance thermal and visual comfort and energy efficiency in office buildings. Results Eng. 2025, 25, 103660. [Google Scholar] [CrossRef] [Scilit]
  3. Gozalo, G.R.; Morillas, J.M.B.; González, D.M. Perceptions and use of urban green spaces on the basis of size. Urban For. Urban Green. 2019, 46, 126470. [Google Scholar] [CrossRef] [Scilit]
  4. Gu, Y.; Quintana, M.; Liang, X.; Ito, K.; Yap, W.; Biljecki, F. Designing effective image-based surveys for urban visual perception. Landsc. Urban Plan. 2025, 260, 105368. [Google Scholar] [CrossRef] [Scilit]
  5. Güngör, S.G.; Polat, A.T. Relationship between visual quality and landscape characteristics in urban parks. J. Environ. Prot. Ecol. 2018, 19, 939–948. [Google Scholar]
  6. Hartig, T.; Mang, M.; Evans, G.W. Restorative Effects of Natural Environment Experiences. Environ. Behav. 1991, 23, 3–26. [Google Scholar] [CrossRef] [Scilit]
  7. Teeuwen, R.; Milias, V.; Bozzon, A.; Psyllidis, A. How well do NDVI and OpenStreetMap data capture people’s visual perceptions of urban greenspace? Landsc. Urban Plan. 2024, 245, 105009. [Google Scholar] [CrossRef] [Scilit]
  8. Martinez, A.d.l.I.; Labib, S.M. Demystifying normalized difference vegetation index (NDVI) for greenness exposure assessments and policy interventions in urban greening. Environ. Res. 2023, 220, 115155. [Google Scholar] [CrossRef] [Scilit] [PubMed]
  9. Hou, J.; Wang, Y.; Zhang, X.; Qiu, L.; Gao, T. The effect of visibility on green space recovery, perception and preference. Trees For. People 2024, 16, 100538. [Google Scholar] [CrossRef] [Scilit]
  10. Fry, G.; Tveit, M.S.; Ode, Å.; Velarde, M.D. The ecology of visual landscapes: Exploring the conceptual common ground of visual and ecological landscape indicators. Ecol. Indic. 2009, 9, 933–947. [Google Scholar] [CrossRef] [Scilit]
  11. Liu, C.; Wang, T.-Y.; Yuizono, T. Assessing the landscape visual quality of urban green spaces with multidimensional visual indicators. Urban For. Urban Green. 2025, 106, 128727. [Google Scholar] [CrossRef] [Scilit]
  12. Ta, N.; Li, H.; Zhu, Q.; Wu, J. Contributions of the quantity and quality of neighborhood green space to residential satisfaction in suburban Shanghai. Urban For. Urban Green. 2021, 64, 127293. [Google Scholar] [CrossRef] [Scilit]
  13. Li, H.; Chen, R.; Wu, J.; Ta, N. How green space quantity and quality across different geographic contexts impact mental health. Cities 2025, 168, 106439. [Google Scholar] [CrossRef] [Scilit]
  14. Cai, M.; Xiang, L.; Ng, E. How does the visual environment influence pedestrian physiological stress? Evidence from high-density cities using ambulatory technology and spatial machine learning. Sustain. Cities Soc. 2023, 96, 104695. [Google Scholar] [CrossRef] [Scilit]
  15. Zheng, L.; Kwan, M.-P.; Liu, Y. Greenspace morphology and mental well-being: A mobility-based study on urban stress and emotion. Ecol. Indic. 2025, 178, 114090. [Google Scholar] [CrossRef] [Scilit]
  16. Bi, S.; Chen, M.; Dai, F. The impact of urban green space morphology on PM2.5 pollution in Wuhan, China: A novel multiscale spatiotemporal analytical framework. Build. Environ. 2024, 221, 107479. [Google Scholar] [CrossRef] [Scilit]
  17. Wang, H.; Tassinary, L.G. Effects of greenspace morphology on mortality at the neighbourhood level: A cross-sectional ecological study. Lancet Planet. Health 2019, 3, e460–e468. [Google Scholar] [CrossRef] [Scilit] [PubMed]
  18. Pataki, D.E.; Carreiro, M.M.; Cherrier, J.; Grulke, N.E.; Jennings, V.; Pincetl, S.; Pouyat, R.V.; Whitlow, T.H.; Zipperer, W.C. Coupling biogeochemical cycles in urban environments: Ecosystem services, green solutions, and misconceptions. Front. Ecol. Environ. 2011, 9, 27–36. [Google Scholar] [CrossRef] [Scilit]
  19. Wang, H.; Gholami, S.; Xu, W.; Samavatekbatan, A.; Sleipness, O.; Tassinary, L.G. Where and how to invest in greenspace for optimal health benefits: A systematic review of greenspace morphology and human health relationships. Lancet Planet Health 2024, 8, e574–87. [Google Scholar] [CrossRef] [Scilit] [PubMed]
  20. Jackson, L.E.; Daniel, J.; McCorkle, B.; Sears, A.; Bush, K.F. Linking ecosystem services and human health: The Eco-Health Relationship Browser. Int. J. Public Health 2013, 58, 747–755. [Google Scholar] [CrossRef] [Scilit] [PubMed]
  21. Buyantuyev, A.; Wu, J. Effects of thematic resolution on landscape pattern analysis. Landsc. Ecol. 2006, 22, 7–13. [Google Scholar] [CrossRef] [Scilit]
  22. Irvine, K.N.; Fuller, R.A.; Devine-Wright, P.; Tratalos, J.; Payne, S.R.; Warren, P.H.; Lomas, K.J.; Gaston, K.J. Ecological and psychological values of urban green space. In Dimensions of the Sustainable City; Springer: Dordrecht, The Netherlands, 2009. [Google Scholar]
  23. Bratman, G.N. Nature and mental health: An ecosystem service perspective. Sci. Adv. 2019, 5, eaax0903. [Google Scholar] [CrossRef] [Scilit] [PubMed]
  24. Wan, B.; Shen, N.; Zhang, H.; Sheng, Q. Analyzing the impact of urban morphology on urban land surface temperature from the perspective of spatial configuration and explainable machine learning: A case study of seven cities. Sustain. Cities Soc. 2026, 138, 107165. [Google Scholar] [CrossRef] [Scilit]
  25. Huo, J.; Qin, H.; Hong, D.; Niu, J.; Wu, H.; Wei, X.; Han, G.; Yan, J.; Liu, Z. The physiological restorative effects in changing air temperature among various landscape composition of green spaces during summer: Empirical evidence from Chongqing, China. Ecol. Indic. 2025, 175, 113537. [Google Scholar] [CrossRef] [Scilit]
  26. Deng, L.; Li, X.; Luo, H.; Fu, E.-K.; Ma, J.; Sun, L.-X.; Huang, Z.; Cai, S.-Z.; Jia, Y. Empirical study of landscape types, landscape elements and landscape components of the urban park promoting physiological and psychological restoration. Urban For. Urban Green. 2020, 48, 126488. [Google Scholar] [CrossRef] [Scilit]
  27. Martin, C.; Czellar, S. Where do biospheric values come from? A connectedness to nature perspective. J. Environ. Psychol. 2017, 52, 56–68. [Google Scholar] [CrossRef] [Scilit]
  28. Berman, M.G.; Hout, M.C.; Kardan, O.; Hunter, M.R.; Yourganov, G.; Henderson, J.M.; Hanayik, T.; Karimi, H.; Jonides, J. The Perception of Naturalness Correlates with Low-Level Visual Features of Environmental Scenes. PLoS ONE 2014, 9, e114572. [Google Scholar] [CrossRef] [Scilit] [PubMed]
  29. Fisher, J.C.; Irvine, K.N.; Bicknell, J.E.; Hayes, W.M.; Fernandes, D.; Mistry, J.; Davies, Z.G. Perceived biodiversity, sound, naturalness and safety enhance the restorative quality and wellbeing benefits of green and blue space in a neotropical city. Sci. Total Environ. 2020, 755, 143095. [Google Scholar] [CrossRef] [Scilit] [PubMed]
  30. Fisher, B.S.; Nasar, J.L. Fear of Crime in Relation to Three Exterior Site Features: Prospect, Refuge, and Escape. Environ. Behav. 1992, 24, 35–65. [Google Scholar] [CrossRef] [Scilit]
  31. Li, K.; Zhai, Y.; Dou, L.; Liu, J. A Preliminary Exploration of Landscape Preferences Based on Naturalness and Visual Openness for College Students with Different Moods. Front. Psychol. 2021, 12, 629650. [Google Scholar] [CrossRef] [Scilit] [PubMed]
  32. Franěk, M. Landscape Preference: The Role of Attractiveness and Spatial Openness of the Environment. Behav. Sci. 2023, 13, 666. [Google Scholar] [CrossRef] [Scilit] [PubMed]
  33. Weitkamp, G.; van Lammeren, R.; Bregt, A. Validation of isovist variables as predictors of perceived landscape openness. Landsc. Urban Plan. 2014, 125, 140–145. [Google Scholar] [CrossRef] [Scilit]
  34. Zhang, G.; Yang, J.; Wu, G.; Hu, X. Exploring the interactive influence on landscape preference from multiple visual attributes: Openness, richness, order, and depth. Urban For. Urban Green. 2021, 65, 127363. [Google Scholar] [CrossRef] [Scilit]
  35. Hao, J.; Gao, T.; Qiu, L. How do species richness and colour diversity of plants affect public perception, preference and sense of restoration in urban green spaces? Urban For. Urban Green. 2024, 100, 128487. [Google Scholar] [CrossRef] [Scilit]
  36. Zhang, G.; Wu, G. Interactive influence of the perceived visual richness, greenness and scenography on landscape preference of urban woodland. J. Environ. Psychol. 2025, 103, 102586. [Google Scholar] [CrossRef] [Scilit]
  37. Chen, T.; Wang, L.; Huang, B.; Yu, J.; Wu, Y. Pursued Spatial Perception benefit considering Attractiveness and Cognitive Load: Appropriate Visual Complexity of Indoor Commercial Space. J. Build. Eng. 2024, 98, 111144. [Google Scholar] [CrossRef] [Scilit]
  38. Xing, G.; Ma, Y.; Chen, S.; Xing, Y.; Pang, Q.; Gao, L. Investigating the self-explaining performance of visual guidance facilities in extra-long spiral tunnels based on drivers’ spatial perception and visual attention distribution. Accid. Anal. Prev. 2025, 217, 108040. [Google Scholar] [CrossRef] [Scilit] [PubMed]
  39. Knez, I.; Ode Sang, Å.; Gunnarsson, B.; Hedblom, M. Wellbeing in Urban Greenery: The Role of Naturalness and Place Identity. Front. Psychol. 2018, 9, 491. [Google Scholar] [CrossRef] [Scilit] [PubMed]
  40. Li, Y.; Li, W.; Liu, Y. Remedies from nature: Exploring the moderating mechanisms of natural landscape features on emotions and perceived restoration in urban parks. Front. Psychol. 2025, 15, 1502240. [Google Scholar] [CrossRef] [Scilit] [PubMed]
  41. Bai, Z.; Zhang, S.; He, H.; Xu, M. Nature perception and positive emotions in urban forest parks enhance subjective well-being. Sci. Rep. 2025, 15, 31457. [Google Scholar] [CrossRef] [Scilit] [PubMed]
  42. Hisoriev, H.; Li, Y.; Huang, W.; Fan, L.; Okhonniyozov, M.; Ma, X. Grassland ecosystems of Tajikistan: Plant species diversity, ecological restoration, and sustainable management. Reg. Sustain. 2026, 7, 100293. [Google Scholar] [CrossRef] [Scilit]
  43. He, M.; Wang, Y.; Wang, W.J.; Xie, Z. Therapeutic plant landscape design of urban forest parks based on the Five Senses Theory: A case study of Stanley Park in Canada. Int. J. Geoherit. Parks 2022, 10, 97–112. [Google Scholar] [CrossRef] [Scilit]
  44. Zhao, Y.; Yang, D. Research Note: Revealing the triple burden of spatial health inequities in urban communities: A built environment health vulnerability (BEHV) framework analysis of resource availability, risk exposure, and structural sensitivity. Landsc. Urban Plan. 2026, 275, 105717. [Google Scholar] [CrossRef] [Scilit]
  45. Meng, D.; Zhang, J.; Wang, Y.; Yang, D. Visual exposure benefits of urban green spaces: Overlooking view yields greater attention restoration than close-up view. J. Environ. Psychol. 2026, 110, 102905. [Google Scholar] [CrossRef] [Scilit]
  46. Qi, Z.; Jin, X.; Liang, X.; Han, B.; Zhou, Y. A new framework for dynamic visual landscape quality evaluation of greenways based on perceived sensory dimensions: A case study of Chengdu urban greenway. J. Environ. Manag. 2024, 370, 122950. [Google Scholar] [CrossRef] [Scilit] [PubMed]
  47. Ito, K.; Kang, Y.; Zhang, Y.; Zhang, F.; Biljecki, F. Understanding urban perception with visual data: A systematic review. Cities 2024, 152, 105169. [Google Scholar] [CrossRef] [Scilit]
  48. Samaha, J.; Boutonnet, B.; Postle, B.R.; Lupyan, G. Effects of meaningfulness on perception: Alpha-band oscillations carry perceptual expectations and influence early visual responses. Sci. Rep. 2018, 8, 6606. [Google Scholar] [CrossRef] [Scilit] [PubMed]
  49. Peng, Y.; Jiang, C.; Du, X.; Liu, Y.; Chen, Q.; Song, H. Visual–morphological drivers of restorative perception in dog-friendly urban green spaces. Horticulturae 2026, 12, 262. [Google Scholar] [CrossRef] [Scilit]
  50. Yang, T.; Wang, J.; Xu, Z.; Gu, T.; Wang, Y.; Jin, J.; Cao, R.; Li, G.; Huang, J. Associations between greenness and blood pressure and hypertension in Chinese middle-aged and elderly population: A longitudinal study. Environ. Res. 2022, 212, 113558. [Google Scholar] [CrossRef] [Scilit] [PubMed]
  51. Joo, H.E.; Clark, J.A.G.; Kremer, P.; Aronson, M.F.J. Socio-environmental drivers of human-nature interactions in urban green spaces. Home Urban Ecosyst. 2024, 27, 2397–2413. [Google Scholar] [CrossRef] [Scilit]
  52. Jiang, B.; Li, J.; Gong, P.; Webster, C.; Schumann, G.; Liu, X.; Suppakittpaisarn, P. A generalized relationship between dose of greenness and mental health response. Nat. Cities 2025, 2, 739–748. [Google Scholar] [CrossRef] [Scilit]
  53. Kang, N.; Liu, C. Towards landscape visual quality evaluation: Methodologies, technologies, and recommendations. Ecol. Indic. 2022, 142, 109174. [Google Scholar] [CrossRef] [Scilit]
  54. Nguyen-Dinh, N.; Zhang, H. How Landscape Preferences and Emotions Shape Environmental Awareness: Perspectives from University Experiences. Sustainability 2025, 17, 3161. [Google Scholar] [CrossRef] [Scilit]
  55. Komossa, F.; Wartmann, F.M.; Kienast, F.; Verburg, P.H. Comparing outdoor recreation preferences in peri-urban landscapes using different data gathering methods. Landsc. Urban Plan. 2020, 199, 103796. [Google Scholar] [CrossRef] [Scilit]
  56. Pazhouhanfar, M.; Kamal, M. Effect of predictors of visual preference as characteristics of urban natural landscapes in increasing perceived restorative potential. Urban For. Urban Green. 2014, 13, 145–151. [Google Scholar] [CrossRef] [Scilit]
  57. Schirpke, U.; Mölk, F.; Feilhauer, E.; Tappeiner, U.; Tappeiner, G. How suitable are discrete choice experiments based on landscape indicators for estimating landscape preferences? Landsc. Urban Plan. 2023, 237, 104813. [Google Scholar] [CrossRef] [Scilit]
  58. Yang, Y.; Lu, Y.; Yang, H.; Yang, L.; Gou, Z. Impact of the Quality and Quantity of Eye-level Greenery on Park Usage. Urban For. Urban Green. 2021, 60, 127061. [Google Scholar] [CrossRef] [Scilit]
  59. Lehto, C.; Hedblom, M.; Filyushkina, A.; Ranius, T. Seeing through their eyes: Revealing recreationists’ landscape preferences through viewshed analysis and machine learning. Landsc. Urban Plan. 2024, 248, 105097. [Google Scholar] [CrossRef] [Scilit]
  60. Lo, C.-W. Effects of urban green space landscape elements on perceived sensory dimensions, landscape preference, stress restoration, and anxiety in women. Cities 2026, 170, 106595. [Google Scholar] [CrossRef] [Scilit]
  61. Walton, M.L. A Case Study Investigating the Influence of Deliberative Discussion on Environmental Preferences. Soc. Nat. Resour. 2013, 26, 303–324. [Google Scholar] [CrossRef] [Scilit]
  62. Stamps, A.E. Simulation Effects on Environmental Preference. J. Environ. Manag. 1993, 38, 115–132. [Google Scholar] [CrossRef] [Scilit]
  63. Buttazzoni, A.; Minaker, L. Exploring the relationships between specific urban design features and adolescent mental health: The case of imageability, enclosure, human scale, transparency, and complexity. Landsc. Urban Plan. 2023, 235, 104736. [Google Scholar] [CrossRef] [Scilit]
  64. Jia, X.; Xu, J.; Xu, Y.; Li, H.; Zhao, B.; Wei, W. Designing virtual environments for psychological health: Nature connectedness mediates the benefits of indoor virtual green exercise on restoration. Build. Environ. 2026, 300, 114750. [Google Scholar] [CrossRef] [Scilit]
  65. van den Berg, A.E.; Koole, S.L.; van der Wulp, N.Y. Environmental preference and restoration: (How) are they related? J. Environ. Psychol. 2003, 23, 135–146. [Google Scholar] [CrossRef] [Scilit]
  66. Belmeziti, A.; Cherqui, F.; Kaufmann, B. Improving the multi-functionality of urban green spaces: Relations between components of green spaces and urban services. Sustain. Cities Soc. 2018, 43, 1–10. [Google Scholar] [CrossRef] [Scilit]
  67. Mao, Y.; Cao, L.; Zhang, J.; Chen, D.; Ding, J.; Xia, T.; Bai, Z.; Zhang, X.; Zhang, Z. How objective natural environment, subjective nature connectedness and naturalness preference jointly shape mental health throughout China. Environ. Impact Assess. Rev. 2026, 121, 108545. [Google Scholar] [CrossRef] [Scilit]
  68. Flynn, E.; Denson, E.B.; Mueller, M.K.; Gandenberger, J.; Morris, K.N. Human-animal-environment interactions as a context for youth social-emotional health and wellbeing: Practitioners’ perspectives on processes of change, implementation, and challenges. Complement. Ther. Clin. Pract. 2020, 41, 101223. [Google Scholar] [CrossRef] [Scilit] [PubMed]
  69. Mayer, F.S.; Frantz, C.M. The connectedness to nature scale: A measure of individuals’ feeling in community with nature. J. Environ. Psychol. 2004, 24, 503–515. [Google Scholar] [CrossRef] [Scilit]
  70. Hu, T.; Wu, J. Shaping the general resilience of green infrastructure through integrating structures, functions, and connections. J. Environ. Manag. 2024, 369, 122294. [Google Scholar] [CrossRef] [Scilit] [PubMed]
  71. Gong, C.; Yang, R.; Li, S. The role of urban green space in promoting health and well-being is related to nature connectedness and biodiversity: Evidence from a two-factor mixed-design experiment. Landsc. Urban Plan. 2024, 245, 105020. [Google Scholar] [CrossRef] [Scilit]
  72. Sahraoui, Y.; De Godoy Leski, C.; Benot, M.-L.; Revers, F.; Salles, D.; van Halder, I.; Barneix, M.; Carassou, L. Integrating ecological networks modelling in a participatory approach for assessing impacts of planning scenarios on landscape connectivity. Landsc. Urban Plan. 2021, 209, 104039. [Google Scholar] [CrossRef] [Scilit]
  73. Galaktionova, A. Emotional boundaries of public involvement in city improvement. Cities 2021, 115, 103254. [Google Scholar] [CrossRef] [Scilit]
  74. Gianfredi, V.; Buffoli, M.; Rebecchi, A.; Croci, R.; Oradini-Alacreu, A.; Stirparo, G.; Marino, A.; Odone, A.; Capolongo, S.; Signorelli, C. Association between Urban Greenspace and Health: A Systematic Review of Literature. Int. J. Environ. Res. Public Health 2021, 18, 5137. [Google Scholar] [CrossRef] [Scilit] [PubMed]
  75. Rapuano, M.; Ruotolo, F.; Ruggiero, G.; Masullo, M.; Maffei, L.; Galderisi, A.; Palmieri, A.; Iachini, T. Spaces for relaxing, spaces for recharging: How parks affect people’s emotions. J. Environ. Psychol. 2022, 81, 101809. [Google Scholar] [CrossRef] [Scilit]
  76. Tan, P.Y.; Bin Ismail, M.R. Building shade affects light environment and urban greenery in high-density residential estates in Singapore Author links open overlay panel. Urban For. Urban Green. 2014, 13, 771–784. [Google Scholar] [CrossRef] [Scilit]
  77. Xu, H.; Duan, J.; Ren, M.; Zhao, G.; Liu, Z. Revealing youth-perceived cultural ecosystem services for high-density urban green space management: A deep learning spatial analysis of social media photographs from central Beijing. Landsc. Ecol. 2025, 40, 119. [Google Scholar] [CrossRef] [Scilit]
  78. Richards, D.R.; Passy, P.; Oh, R.R.Y. Research article Impacts of population density and wealth on the quantity and structure of urban green space in tropical Southeast Asia. Landsc. Urban Plan. 2017, 157, 553–560. [Google Scholar] [CrossRef] [Scilit]
  79. Gu, F.; Xu, G.; Wang, B.; Jia, L.; Xu, M. Vegetation cover change and restoration potential in the Ziwuling Forest Region, China. Ecol. Eng. 2023, 187, 106877. [Google Scholar] [CrossRef] [Scilit]
  80. Park, J.-H.; Lee, S.-H.; Kim, Y.-S.; Park, J.-W.; Lee, J.-M.; Park, Y.-B.; Kim, E.-J.; You, Y.-H. Vegetation cover is a crucial key to the success of ecological restoration in the desertified steppe of Inner Mongolia. Ecol. Indic. 2024, 165, 112241. [Google Scholar] [CrossRef] [Scilit]
  81. Negash, E.; Birhane, E.; Gebrekirstos, A.; Gebremedhin, M.A.; Annys, S.; Rannestad, M.M.; Berhe, D.H.; Sisay, A.; Alemayehu, T.; Berhane, T.; et al. Remote sensing reveals how armed conflict regressed woody vegetation cover and ecosystem restoration efforts in Tigray (Ethiopia). Sci. Remote Sens. 2023, 8, 100108. [Google Scholar] [CrossRef] [Scilit]
  82. Potgieter, L.J.; Gaertner, M.; O’Farrell, P.J.; Richardson, D.M. Does vegetation structure influence criminal activity? Insights from Cape Town, South Africa. Front. Biogeogr. 2019, 11, e42035. [Google Scholar] [CrossRef] [Scilit]
  83. Wang, R.; Zhao, J.; Meitner, M.J. Urban woodland understory characteristics in relation to aesthetic and recreational preference. Urban For. Urban Green. 2017, 24, 55–61. [Google Scholar] [CrossRef] [Scilit]
  84. García-Martín, M.; Schaupp, J.; Olafsson, A.S.; Legarth, J.V.; Beery, T.H.; Tobias, S. Perceived constraints for psychological restoration in nearby greenspaces. An exploratory and multi-dimensional approach. Urban For. Urban Green. 2025, 107, 128746. [Google Scholar] [CrossRef] [Scilit]
  85. Fleming, W.; Tenbrink, T.; Van Den Hoek, J.; Biedenweg, K. How long-term tree cover decline influences psychological restoration, place attachment, and governance perceptions. Urban For. Urban Green. 2026, 122, 129540. [Google Scholar] [CrossRef] [Scilit]
  86. Gilby, B.L.; Olds, A.D.; Sievers, M.; Vozzo, M.L.; Elliott, B.B.; Goodridge Gaines, L.A.; Mosman, J.D.; Perry, H.J.; Rummell, A.J.; Henderson, C.J. Prioritising actions over space and time in multi-habitat ecological restoration: Insights from indicator species in coastal seascapes. Landsc. Urban Plan. 2026, 271, 105624. [Google Scholar] [CrossRef] [Scilit]
  87. Grahn, P.; Stigsdotter, U.K. The relation between perceived sensory dimensions of urban green space and stress restoration. Landsc. Urban Plan. 2010, 94, 264–275. [Google Scholar] [CrossRef] [Scilit]
  88. Jeon, J.Y.; Jo, H.I.; Lee, K. Psycho-physiological restoration with audio-visual interactions through virtual reality simulations of soundscape and landscape experiences in urban, waterfront, and green environments. Sustain. Cities Soc. 2023, 99, 104929. [Google Scholar] [CrossRef] [Scilit]
  89. Edwards, A. ‘Therapeutic landscape’ experiences—Redefining their relationship with the everyday. Health Place 2022, 75, 102796. [Google Scholar] [CrossRef] [Scilit] [PubMed]
  90. Ewane, E.B.; Bajaj, S.; Velasquez-Camacho, L.; Srinivasan, S.; Maeng, J.; Singla, A.; Luber, A.; De-Miguel, S.; Richardson, G.; Broadbent, E.N.; et al. Influence of urban forests on residential property values: A systematic review of remote sensing-based studies. Heliyon 2023, 9, e20408. [Google Scholar] [CrossRef] [Scilit] [PubMed]
  91. Gesler, W.M. Healing Places; Rowman & Littlefield: Lanham, MD, USA, 2003. [Google Scholar]
  92. Kong, L.; Liu, Z.; Pan, X.; Wang, Y.; Guo, X.; Wu, J. How do different types and landscape attributes of urban parks affect visitors” positive emotions? Landsc. Urban Plan. 2022, 226, 104482. [Google Scholar] [CrossRef] [Scilit]
  93. Olszewska-Guizzo, A.; Sia, A.; Fogel, A.; Ho, R. Features of Urban Green Spaces Associated with Positive emotions, Mindfulness and Relaxation. Sci. Rep. 2022, 12, 20695. [Google Scholar] [CrossRef] [Scilit] [PubMed]
  94. Pavic, K.; Vergilino-Perez, D.; Gricourt, T.; Chaby, L. Age-related differences in subjective and physiological emotion evoked by immersion in natural and social virtual environments. Sci. Rep. 2024, 14, 15320. [Google Scholar] [CrossRef] [Scilit] [PubMed]
  95. Stock, S.; Bu, F.; Fancourt, D.; Mak, H.W. Longitudinal associations between going outdoors and mental health and wellbeing during a COVID-19 lockdown in the UK. Sci. Rep. 2022, 12, 10580. [Google Scholar] [CrossRef] [Scilit] [PubMed]
  96. Sakieh, Y.; Jaafari, S.; Ahmadi, M.; Danekar, A. Green and calm: Modeling the relationships between noise pollution propagation and spatial patterns of urban structures and green covers. Urban For. Urban Green. 2017, 24, 195–211. [Google Scholar] [CrossRef] [Scilit]
  97. Seamon, D. The phenomenological contribution to environmental psychology. J. Environ. Psychol. 1982, 2, 119–140. [Google Scholar] [CrossRef] [Scilit]
  98. Shanahan, D.F.; Bush, R.; Gaston, K.J.; Lin, B.B.; Dean, J.; Barber, E.; Fuller, R.A. Health Benefits from Nature Experiences Depend on Dose. Sci. Rep. 2016, 6, 28551. [Google Scholar] [CrossRef] [Scilit] [PubMed]
  99. Soga, M.; Evans, M.J.; Tsuchiya, K.; Fukano, Y. A room with a green view: The importance of nearby nature for mental health during the COVID-19 pandemic. Ecol. Appl. 2020, 31, e2248. [Google Scholar] [CrossRef] [Scilit] [PubMed]
  100. Tabrizian, P.; Baran, P.K.; Smith, W.R.; Meentemeyer, R.K. Exploring perceived restoration potential of urban green enclosure through immersive virtual environments. J. Environ. Psychol. 2018, 55, 99–109. [Google Scholar] [CrossRef] [Scilit]
  101. Southon, G.E.; Jorgensen, A.; Dunnett, N.; Hoyle, H.; Evans, K.L. Biodiverse perennial meadows have aesthetic value and increase residents’ perceptions of site quality in urban green-space. Landsc. Urban Plan. 2017, 158, 105–118. [Google Scholar] [CrossRef] [Scilit]
  102. Stevenson, M.P.; Schilhab, T.; Bentsen, P. Attention Restoration Theory II: A systematic review to clarify attention processes affected by exposure to natural environments. J. Toxicol. Environ. Health Part B 2018, 21, 227–268. [Google Scholar] [CrossRef] [Scilit] [PubMed]
  103. Tan, C.L.Y.; Chang, C.-C.; Nghiem, L.T.P.; Zhang, Y.; Oh, R.R.Y.; Shanahan, D.F.; Lin, B.B.; Gaston, K.J.; Fuller, R.A.; Carrasco, L.R. The right mix: Residential urban green-blue space combinations are correlated with physical exercise in a tropical city-state. Urban For. Urban Green. 2021, 57, 126947. [Google Scholar] [CrossRef] [Scilit]
  104. Tsai, W.-L.; Leung, Y.-F.; McHale, M.R.; Floyd, M.F.; Reich, B.J. Relationships between urban green land cover and human health at different spatial resolutions. Urban Ecosyst. 2018, 22, 315–324. [Google Scholar] [CrossRef] [Scilit]
  105. Tyrväinen, L.; Ojala, A.; Korpela, K.; Lanki, T.; Tsunetsugu, Y.; Kagawa, T. The influence of urban green environments on stress relief measures: A field experiment. J. Environ. Psychol. 2014, 38, 1–9. [Google Scholar] [CrossRef] [Scilit]
  106. Hao, J.; Li, Y.; Hu, T.; Ma, Y.; Wang, X.; Liu, J.; Gao, T.; Qiu, L. Vegetation diversity in structure, species or colour: Coupling effects of the different characteristics of urban green spaces on preference and perceived restoration. Ecol. Indic. 2024, 169, 112897. [Google Scholar] [CrossRef] [Scilit]
  107. Valtchanov, D.; Ellard, C.G. Cognitive and affective responses to natural scenes: Effects of low level visual properties on preference, cognitive load and eye-movements. J. Environ. Psychol. 2015, 43, 184–195. [Google Scholar] [CrossRef] [Scilit]
  108. Wan, C.; Shen, G.Q.; Choi, S. Underlying relationships between public urban green spaces and social cohesion: A systematic literature review. City Cult. Soc. 2021, 24, 100383. [Google Scholar] [CrossRef] [Scilit]
  109. Wang, M.; Yan, Y.; Li, M.; Zhou, L. Differences in Emotional Preferences toward Urban Green Spaces among Various Cultural Groups in Macau and Their Influencing Factors. Land 2024, 13, 414. [Google Scholar] [CrossRef] [Scilit]
  110. Wells, N.M.; Evans, G.W. Nearby nature: A buffer of life stress among rural children. Environ. Behav. 2003, 35, 311–330. [Google Scholar] [CrossRef] [Scilit]
  111. Wilson, B.; Neale, C.; Roe, J. Urban green space access, social cohesion, and mental health outcomes before and during COVID-19. Cities 2024, 152, 105173. [Google Scholar] [CrossRef] [Scilit]
  112. Wu, Y.; Wang, L.; Yu, J.; Chen, P.; Wang, A. Improving the Restorative Potential of Living Environments by Optimizing the Spatial Luminance Distribution. Buildings 2023, 13, 1708. [Google Scholar] [CrossRef] [Scilit]
  113. Xie, X.; Jiang, Q.; Wang, R.; Guo, Z. Correlation between Vegetation Landscape and Subjective Human Perception: A Systematic Review. Buildings 2024, 14, 1734. [Google Scholar] [CrossRef] [Scilit]
Figure 1. Describes the geographic locations and site distribution.
Horticulturae 12 01041 g001
Figure 2. Description and Calculation of Green Space Morphology a. a Some images in this table are directly adopted from a previous paper, with additional images created and provided by the authors of the current study for the purpose of enhancing the comprehensiveness of the data presentation [49].
Horticulturae 12 01041 g002
Figure 3. Pairwise relationships among horticultural structural metrics.
Horticulturae 12 01041 g003
Figure 4. Multidimensional structural gradients of horticultural configurations.
Horticulturae 12 01041 g004
Figure 5. Structural distinctiveness and stability of the three horticultural configuration states. (a) Distribution of configuration states in the first two principal-component dimensions; large points indicate cluster centroids and ellipses represent cluster dispersion. (b) Cluster-wise bootstrap Jaccard similarity across 500 resamples, with error bars indicating 95% confidence intervals; the dashed line denotes the 0.80 stability reference. (c) Distributions of within-cluster Silhouette coefficients; black points indicate cluster means and the dashed line indicates the overall mean. (d) Pairwise Euclidean distances between cluster centroids, with darker shading indicating greater structural separation. PC, principal component. The different colors in (a) represent the three horticultural configuration types: dense woody, open heterogeneous, and impervious fragmented configurations.
Horticulturae 12 01041 g005
Figure 6. Latent structure of multidimensional visual perception revealed by PCA. (a) PCA biplot showing variable loadings and perceptual domain structure. (b) Loading coefficients of perception variables across the first three principal components. (c) Standardized domain loadings with 95% confidence intervals.
Horticulturae 12 01041 g006
Figure 7. Perceptual differentiation among horticultural configuration states. Standardized scores of restorative immersion, spatial openness, and affective richness across the dense woody, open heterogeneous, and impervious fragmented configurations. Boxes indicate the interquartile range, horizontal lines indicate medians, whiskers extend to 1.5 times the interquartile range, and circles denote outliers. Overall differences were tested using Kruskal–Wallis tests, followed by Dunn’s pairwise tests with Benjamini–Hochberg FDR correction. * P F D R < 0.05 ; ** PFDR < 0.01; *** P F D R < 0.001 .
Horticulturae 12 01041 g007
Figure 8. Cross-validated predictive performance of greenness, configuration and full models across perceptual domains. (a) Model predictive performance across the three perceptual domains. (b) Incremental predictive contribution of configuration beyond greenness across the three perceptual domains.
Horticulturae 12 01041 g008
Figure 9. Incremental predictive contribution and nonlinear effects of horticultural configuration beyond greenness. (a) Cross-validated incremental (R2) of the full model relative to the greenness-only model, with model-refit bootstrap 95% confidence intervals. (b) Cross-validated (R2) of greenness-only, configuration-only and full models. (c) Mean absolute SHAP values showing domain-specific predictor importance. (d) SHAP dependence relationships for the dominant configuration predictor in each perceptual domain. Dashed lines indicate stable SHAP zero-crossings; shaded bands indicate bootstrap 95% confidence intervals.
Horticulturae 12 01041 g009
Disclaimer/Publisher’s Note: The statements, opinions and data contained in all publications are solely those of the individual author(s) and contributor(s) and not of MDPI and/or the editor(s). MDPI and/or the editor(s) disclaim responsibility for any injury to people or property resulting from any ideas, methods, instructions or products referred to in the content.