Article

Integrated GWAS Candidate Prioritization, Moso Bamboo Transcriptome Screening and Diverse Bamboo Shoot Multi-Omics Reveal a Multi-Layer Framework for Bamboo Property Formation


1
College of Forestry, Central South University of Forestry and Technology, Changsha 410004, China
2
Yuelushan Laboratory, Changsha 410128, China
3
People’s Government of Nijiangkou Town, Yiyang 413000, China
4
Hunan Zihong Ecological Technology Company Limited, Changsha 410100, China
5
College of Landscape Architecture and Architecture, Central South University of Forestry and Technology, Changsha 410004, China
*
Author to whom correspondence should be addressed.
These authors contributed equally to this work.
Horticulturae 2026, 12(8), 1030; https://doi.org/10.3390/horticulturae12081030
Submission received: 27 June 2026 / Revised: 30 July 2026 / Accepted: 6 August 2026 / Published: 18 August 2026
(This article belongs to the Section Genetics, Genomics, Breeding, and Biotechnology (G2B2))

Highlights

What are the main findings?
  • Applied a stepwise evidence-integration strategy to prioritize 99 previously reported GWAS-derived candidate genes associated with bamboo property-related traits.
  • Identified 30 expression-supported candidates and prioritized PH02Gene17228, PH02Gene00247, and PH02Gene51360 through transcriptome–metabolome association analysis and qRT-PCR assessment.
What are the implications of the main findings?
  • Generated a testable three-layer working hypothesis linking environmental/regulatory signaling, carbon allocation, and cell wall remodeling with bamboo property-related variation.
  • Provided a ranked candidate resource for subsequent functional validation and molecular breeding in bamboo.

Abstract

Bamboo shoot development influences subsequent culm architecture and material properties, but the biological relevance of GWAS-derived candidates remains unclear. A stepwise candidate-prioritization strategy integrated 99 previously reported property-associated candidates with large-scale moso bamboo transcriptome screening, multi-species bamboo shoot transcriptome–metabolome data, and qRT-PCR analysis. The candidates were classified into three functional layers: environmental adaptation/stress signaling, carbohydrate metabolism/carbon allocation, and cell wall biosynthesis/remodeling. A rule-based ranking that balanced candidate representation across the three functional categories retained 44 genes for transcriptomic evaluation, of which 30 showed strong or moderate expression support across 90 comparisons. Cell wall biosynthesis/remodeling genes exhibited the broadest transcriptional responses, whereas carbohydrate- and regulatory-related genes provided complementary metabolic and upstream evidence. Correlation analysis across 24 matched shoot variables and 5059 metabolites prioritized PH02Gene17228, PH02Gene00247, and PH02Gene51360, which were associated with amino acid/nitrogen metabolism, hormone/signaling-like metabolites, and organic acid/central carbon metabolism, respectively. qRT-PCR analysis independently supported their expression patterns in developing bamboo shoots. These results support a working model in which regulatory signaling, carbon allocation, and cell wall remodeling jointly contribute to bamboo property-related variation. The prioritized genes provide targets for functional validation and may inform future marker development and molecular breeding aimed at improving bamboo culm quality and material properties.

1. Introduction

Bamboo shoot development should not be interpreted only as the formation of an edible juvenile organ, but rather as an early developmental phase in which the architectural and material basis of the future culm is progressively established. In moso bamboo, rapid shoot elongation has been shown to occur through a highly organized developmental continuum involving cell division, cell elongation, secondary cell wall thickening, vascular differentiation, hormone gradients, and transcriptional reprogramming, with representative internodes depositing substantial amounts of lignin and cellulose during daily growth [1,2]. This view is further supported by transcriptomic and spatial/single-nucleus studies showing that bamboo shoot organogenesis is accompanied by the differentiation of intercalary meristems, procambium, vascular tissues, and tissue-specific regulatory programs, indicating that shoot-stage development already contains the cellular framework for later culm formation [3,4]. Therefore, bamboo shoots provide an early developmental window for investigating the developmental and metabolic processes associated with subsequent culm architecture, internode elongation, wall deposition, lignification, and property-related traits.
At the molecular and metabolic levels, the transition from shoot elongation to culm maturation is closely associated with carbon allocation, carbohydrate metabolism, phenylpropanoid metabolism, secondary cell wall biosynthesis, and lignin polymerization. In moso bamboo shoots, genes related to hormone signaling, sugar and starch metabolism, energy conversion, cell wall remodeling, and lignin biosynthesis have been found to be dynamically regulated during early elongation and internode differentiation, while lignification increases with shoot height and is regulated by miRNA–transcription factor–enzyme modules such as the MYB–laccase pathway [5,6]. Similar developmental logic has been observed in rice and maize internodes, where cellulose, lignin, xylan, glucuronoarabinoxylan, feruloylation, and p-coumaroylation accumulate along spatial gradients from elongating to mature zones, demonstrating that grass stem mechanical support is established through coordinated cell wall deposition and carbon-flow reallocation [7,8,9]. Comparative evidence from rice, maize, poplar, eucalyptus, and Arabidopsis further indicates that secondary-wall formation is governed by conserved but lineage-modified NAC–MYB regulatory networks, which activate cellulose, hemicellulose, and lignin biosynthetic programs and thereby potentially coordinate tissue stiffness, hydrophobicity, vascular support, wood formation, and mechanical properties [10,11,12,13]. Accordingly, integrating GWAS-derived candidate genes with bamboo shoot transcriptomic and metabolomic variation is biologically meaningful because candidate loci associated with bamboo property-related traits may act during early shoot development, when carbon allocation, lignification, and secondary cell wall deposition are already being programmed before the mature culm phenotype is fully expressed.
Genome-wide association studies have become a powerful strategy for detecting genetic loci associated with complex plant traits, because genome-wide SNP variation can be statistically linked with phenotypic variation across natural populations. In plants, this approach has been widely applied to agronomic traits, adaptive traits, metabolic composition, root architecture, wood formation, and biomass-related traits, and it has been especially useful for generating candidate loci in species where conventional genetic mapping is difficult [14,15,16]. In moso bamboo, population genomic analyses based on 427 resequenced genomes identified 5.45 million SNPs and detected candidate genes associated with nine property-related traits, many of which were annotated to cell wall biosynthesis, carbohydrate metabolism, and environmental adaptation, thereby providing an important genomic foundation for dissecting bamboo property traits [17]. Similarly, genome resequencing of moso bamboo forms and bamboo species has revealed SNPs, InDels, structural variants, and candidate genes associated with culm shape variation and mechanical traits, indicating that bamboo morpho-structural and material properties can be linked to genomic variation but are likely controlled by multiple regulatory, developmental, and metabolic layers [18,19]. Comparable evidence has also been obtained in Populus, where GWAS of wood anatomical, morphological, lignin, photosynthetic, and wood-property traits identified numerous SNPs and candidate genes, but subsequent transcriptomic, co-expression, metabolomic, epistatic, and transgenic evidence was required to clarify which candidates were more likely to participate directly in wood formation or secondary cell wall regulation [20,21,22,23]. These studies collectively indicate that GWAS is highly effective for locating association signals, but the biological meaning of each signal cannot be fully resolved from genomic proximity or functional annotation alone.
However, GWAS-derived candidate sets often include direct structural genes, metabolic enzymes, transporters, transcription factors, hormone-response genes, stress-adaptation genes, and genes located near associated SNPs because of linkage disequilibrium, making it difficult to distinguish primary functional candidates from broader association-proximal genes without additional biological evidence [14,24,25]. This limitation has been repeatedly emphasized in plant systems, where candidate gene prioritization has been improved by integrating GWAS with co-expression networks, transcriptome-wide association analysis, expression GWAS, metabolomics, WGCNA, haplotype-based fine mapping, and functional validation. In maize, co-expression networks were integrated with GWAS to prioritize candidate genes for ionomic traits, and experimentally validated candidates demonstrated that tissue-relevant expression information can substantially improve the interpretation of broad GWAS loci [26]. In rice, GWAS combined with transcriptome-wide and expression-based association analyses improved candidate resolution for root traits, while GWAS integrated with transcriptome and metabolome WGCNA identified more reliable genes for anaerobic germination by linking loci with stress-responsive metabolites and expression modules [27,28]. In canola, multi-omics integration across phenotypic QTL, expression QTL, metabolite QTL, and correlation networks was used to nominate “prime candidate genes” for metabolic and vegetative growth variation, illustrating that candidate genes become more interpretable when statistical association is connected with biological pathway evidence [24]. Therefore, in the present study, GWAS was not repeated; instead, previously reported bamboo property-associated candidates were curated, reclassified, and prioritized into biologically interpretable layers before downstream transcriptomic and metabolomic comparison [29,30]. This strategy was designed to convert a broad association-derived candidate list into a more testable functional framework, enabling candidate genes related to environmental adaptation, carbohydrate metabolism, carbon allocation, and cell wall biosynthesis/remodeling to be evaluated in relation to shoot multi-omics variation.
Bamboo property traits should therefore not be interpreted as the downstream consequence of a narrow group of structural cell wall genes alone, but as an emergent phenotype generated by coordinated wall construction, carbon allocation, and environmental–regulatory signaling. In bamboo, this interpretation is strongly supported by studies showing that rapidly elongating Phyllostachys edulis internodes contain spatially separated cell division, elongation, and secondary-wall-thickening zones, with simultaneous deposition of cellulose and lignin and regulation by gibberellin, auxin, cytokinin, ABA, mechanical pressure, and temperature-related effects [1]. Bamboo lignification studies further showed that lignin content, PAL/laccase activity, MYB–laccase modules, miRNA-mediated regulation, and secondary-wall enzyme genes are dynamically reorganized during shoot height growth [6], while PePRX2 was experimentally shown to promote lignin polymerization and drought tolerance, directly linking peroxidase-mediated wall cross-linking with stress adaptation [31]. Similar evidence was reported in GA-treated moso bamboo, where internode elongation, lignin condensation, photosynthesis repression, LAC4-related responses, and cell wall-biogenesis genes were simultaneously affected [32], and in dwarf bamboo, where shortened internodes were associated with hormone imbalance, cell wall-loosening genes, cellulose/lignin biosynthesis, and altered fiber traits [23]. These bamboo-specific findings are consistent with the broader plant cell wall literature, in which secondary-wall formation is understood as a coordinated process involving plasma-membrane cellulose synthase complexes, Golgi-derived hemicellulose/xylan biosynthesis, lignin monomer production and oxidative polymerization by laccases/peroxidases, and wall remodeling through expansins and xyloglucan endotransglucosylase/hydrolases [33,34]. Therefore, the irregular xylem (IRX)/xylan/xyloglucan endotransglucosylase/hydrolase (XTH)/cellulose synthase-like A (CSLA), cinnamoyl-CoA reductase (CCR)/laccase, cellulose synthase A (CESA)/cellulose synthase-like (CSL), pectin-related, peroxidase, and expansin candidates identified in our results should be viewed as the structural execution layer of bamboo property formation rather than as the entire causal system.
This structural layer must be supplied and constrained by carbohydrate metabolism and carbon allocation, because cellulose, hemicellulose, pectin, and lignin biosynthesis require sucrose cleavage, UDP-sugar production, starch turnover, PPP-derived reducing power, and central carbon skeletons. In sorghum and sugarcane, developmental shifts in sucrose accumulation, stem biomass partitioning, invertase/sucrose synthase expression, cellulose synthase activity, expansins, XTHs, lignin genes, and hormone-related transcripts were shown to jointly coordinate whether carbon is retained as soluble sugar or redirected into fiber/cell wall biomass [35,36]. UDP-glucose metabolism has also been proposed as a key control point for carbon flow into cellulose, hemicellulose, sucrose, and respiratory pools in sugarcane [37], and overexpression of poplar xylem sucrose synthase increased cellulose content, secondary-wall thickness, fiber length, and plant height in tobacco, demonstrating that sucrose cleavage can actively reshape wall deposition rather than merely provide background substrate [38]. At the same time, cell wall formation is continuously adjusted by environmental and regulatory signaling. Plant cell wall integrity studies have shown that receptor-like kinases, malectin-like RLKs, ROS, calcium, jasmonate, ACC/ethylene-related pathways, pectin-derived signals, immunity, and lignification form a surveillance system that links wall state with development and stress responses [39,40,41,42]. This provides a mechanistic basis for interpreting the nucleotide-binding leucine-rich repeat (NLR)/resistance (R) genes, receptor-like kinases (RLKs), GRAS/DELLA regulators, and redox-related proteins in our GWAS-derived framework as upstream modulators of growth–defense balance, hormone sensitivity, oxidative status, and wall remodeling. Accordingly, integrating transcriptomic responsiveness and metabolite-module coupling is essential because GWAS alone provides association-derived loci, whereas expression data indicate whether candidate genes are activated in relevant tissues, developmental stages, or stress/hormone contexts, and metabolomics provides readouts of carbon partitioning, wall precursors, phenylpropanoid flux, lipid/oxylipin signaling, central carbon metabolism, and redox status [43,44,45,46,47,48,49]. This logic is supported by plant multi-omics studies in Populus, canola, and rapeseed, where GWAS combined with transcriptomic, metabolomic, coexpression, or regulatory-network evidence improved the prioritization of biologically interpretable candidate genes for wood traits, nitrogen-related growth, metabolic variation, and stress-responsive phenolic pathways [21,24,50,51]. Accordingly, the present study was designed as a stepwise evidence-filtering analysis rather than a de novo multi-omics survey. Previously reported GWAS-derived candidates and large-scale moso bamboo transcriptome resources were reanalyzed for computational prioritization, whereas the multi-species bamboo shoot transcriptome–metabolome datasets and qRT-PCR measurements generated in this study provided additional expression- and association-level evidence [52,53]. The resulting candidate rankings and functional layers were intended to generate experimentally testable hypotheses rather than establish direct causal mechanisms.
In this study, a stepwise candidate gene prioritization strategy was applied to connect previously reported GWAS signals with transcriptional and metabolic variation during bamboo shoot development. A curated set of 99 candidate genes associated with nine bamboo property-related traits was standardized and organized into three functional layers: environmental adaptation/stress signaling, carbohydrate metabolism/carbon allocation, and cell wall biosynthesis/remodeling [54,55,56]. Mechanism-balanced scoring, large-scale moso bamboo transcriptome screening, multi-species bamboo shoot transcriptome–metabolome integration, and qRT-PCR analysis were subsequently used to identify candidates supported by convergent evidence. The study aimed to provide a ranked set of experimentally testable genes and to formulate a working hypothesis linking regulatory signaling, carbon allocation, and cell wall remodeling with bamboo property-related variation.

2. Materials and Methods

2.1. Curation of GWAS-Derived Candidate Genes Associated with Bamboo Property-Related Traits

A curated candidate gene table associated with bamboo property-related traits was constructed from a previously reported GWAS-derived candidate gene resource [17]. The original table contained information on genomic position, evidence type, candidate priority, gene annotation, KEGG ortholog annotation, InterPro domain annotation, GO annotation, functional classification, and trait association. The candidate information was imported into R software (version 4.2.1) as trait_genes and standardized before downstream analysis.
Candidate records were first filtered to retain effective gene records only. Non-gene entries were removed according to the Is.gene.record field after converting possible gene-record indicators, including “true”, “yes”, “gene” and “gene record”, into logical values. Chromosome labels were standardized by removing “Chr” prefixes and extra spaces. Start and end positions, interval length, evidence score, and associated trait count were converted into numeric format after removing comma separators. Gene identifiers were harmonized using both the transcript-level gene ID and the locus-level gene ID. When transcript suffixes such as “.t1” or “.t2” were not required for expression matching, gene IDs were converted to locus-level identifiers by removing the transcript suffix.
The functional reclassification was performed by the authors using an annotation-guided procedure. Information from the original functional classification, molecular-family annotation, best-hit product description, KEGG annotation, InterPro domain, and GO annotation was considered collectively to assign candidates to three broad functional layers: environmental adaptation/stress signaling, carbohydrate metabolism/carbon allocation, and cell wall biosynthesis/remodeling. The environmental adaptation/stress signaling layer included NLR/RPM1/RPP13/RGA/RPS-type resistance genes, receptor-like kinase genes, GRAS/DELLA regulators, and redox-related proteins. The carbohydrate metabolism/carbon allocation layer included sugar transporters, sucrose synthase/fructokinase genes, starch metabolism genes, pentose phosphate pathway enzymes, and UDP-sugar/galactinol-related enzymes. The cell wall biosynthesis/remodeling layer included IRX/xylan/XTH/CSLA genes, CCR/laccase lignin-related genes, CESA/CSL-like glycan synthases, pectin-related genes, class III peroxidases, and expansins. After removing non-gene records and duplicate gene IDs, 99 effective candidate gene records were retained.

2.2. Standardization of Trait Associations

Trait association information from the curated candidate table was parsed into long format using semicolons, commas, and vertical bars as separators. Trait names were standardized into nine bamboo property-related traits: clear culm height, node number, ground diameter, density, compressive strength, bending strength at 12°, elastic modulus, maximum load, and tensile modulus. When the associated trait count was missing, it was recalculated from the number of unique standardized traits linked to each gene. Genes associated with one trait were defined as single-trait candidates, whereas genes associated with two or more traits were defined as multi-trait candidates.
Trait-guided mapping was performed by linking each candidate gene to its standardized trait, functional category, and molecular family. The number of C1/C2 candidate genes associated with each trait was then summarized to evaluate whether growth-architecture traits and mechanical/material traits differed in candidate gene representation.

2.3. Integrated Candidate Scoring and Mechanism-Balanced Prioritization

To prioritize candidates for downstream expression and multi-omics analysis, an integrated candidate score was calculated for each of the 99 effective candidate genes. The score combined seven components: candidate priority, evidence strength, annotation confidence, normalized evidence score, trait recurrence, mechanistic-layer relevance, and key molecular-family relevance.
Candidate priority was scored as 4 for Tier 1, 3 for Tier 2, 2 for Tier 3, and 1 for unassigned candidates. Evidence strength was scored as 4 for high, 3.5 for moderate-high, 3 for moderate, 2 for low, and 1 for low/unclear or unassigned evidence. Annotation confidence was scored as 3 for high, 2 for moderate, 1 for low, and 0 for unassigned annotation. The original evidence score was min–max normalized to a 0–4 scale. Trait recurrence was scored as 3 for genes associated with three or more traits, 2 for genes associated with two traits, 1 for genes associated with one trait, and 0 for genes without explicit trait mapping. Genes belonging to one of the three major mechanistic layers received one additional point, and genes assigned to predefined key molecular families received one additional point. The integrated candidate score was calculated as the sum of these components. The integrated score was used as a transparent rule-based ranking tool rather than as a fitted statistical model. The ordinal scores preserved the hierarchy of the original evidence categories, whereas the continuous evidence score was min–max normalized to a comparable 0–4 range. Trait recurrence was capped at three points to limit the influence of highly recurrent traits, while mechanistic-layer and key-family membership were each assigned a one-point bonus so that these criteria functioned as supporting rather than decisive evidence. Because the numerical scales were empirically defined, the resulting scores were interpreted only as relative prioritization values and not as probabilities of causal involvement.
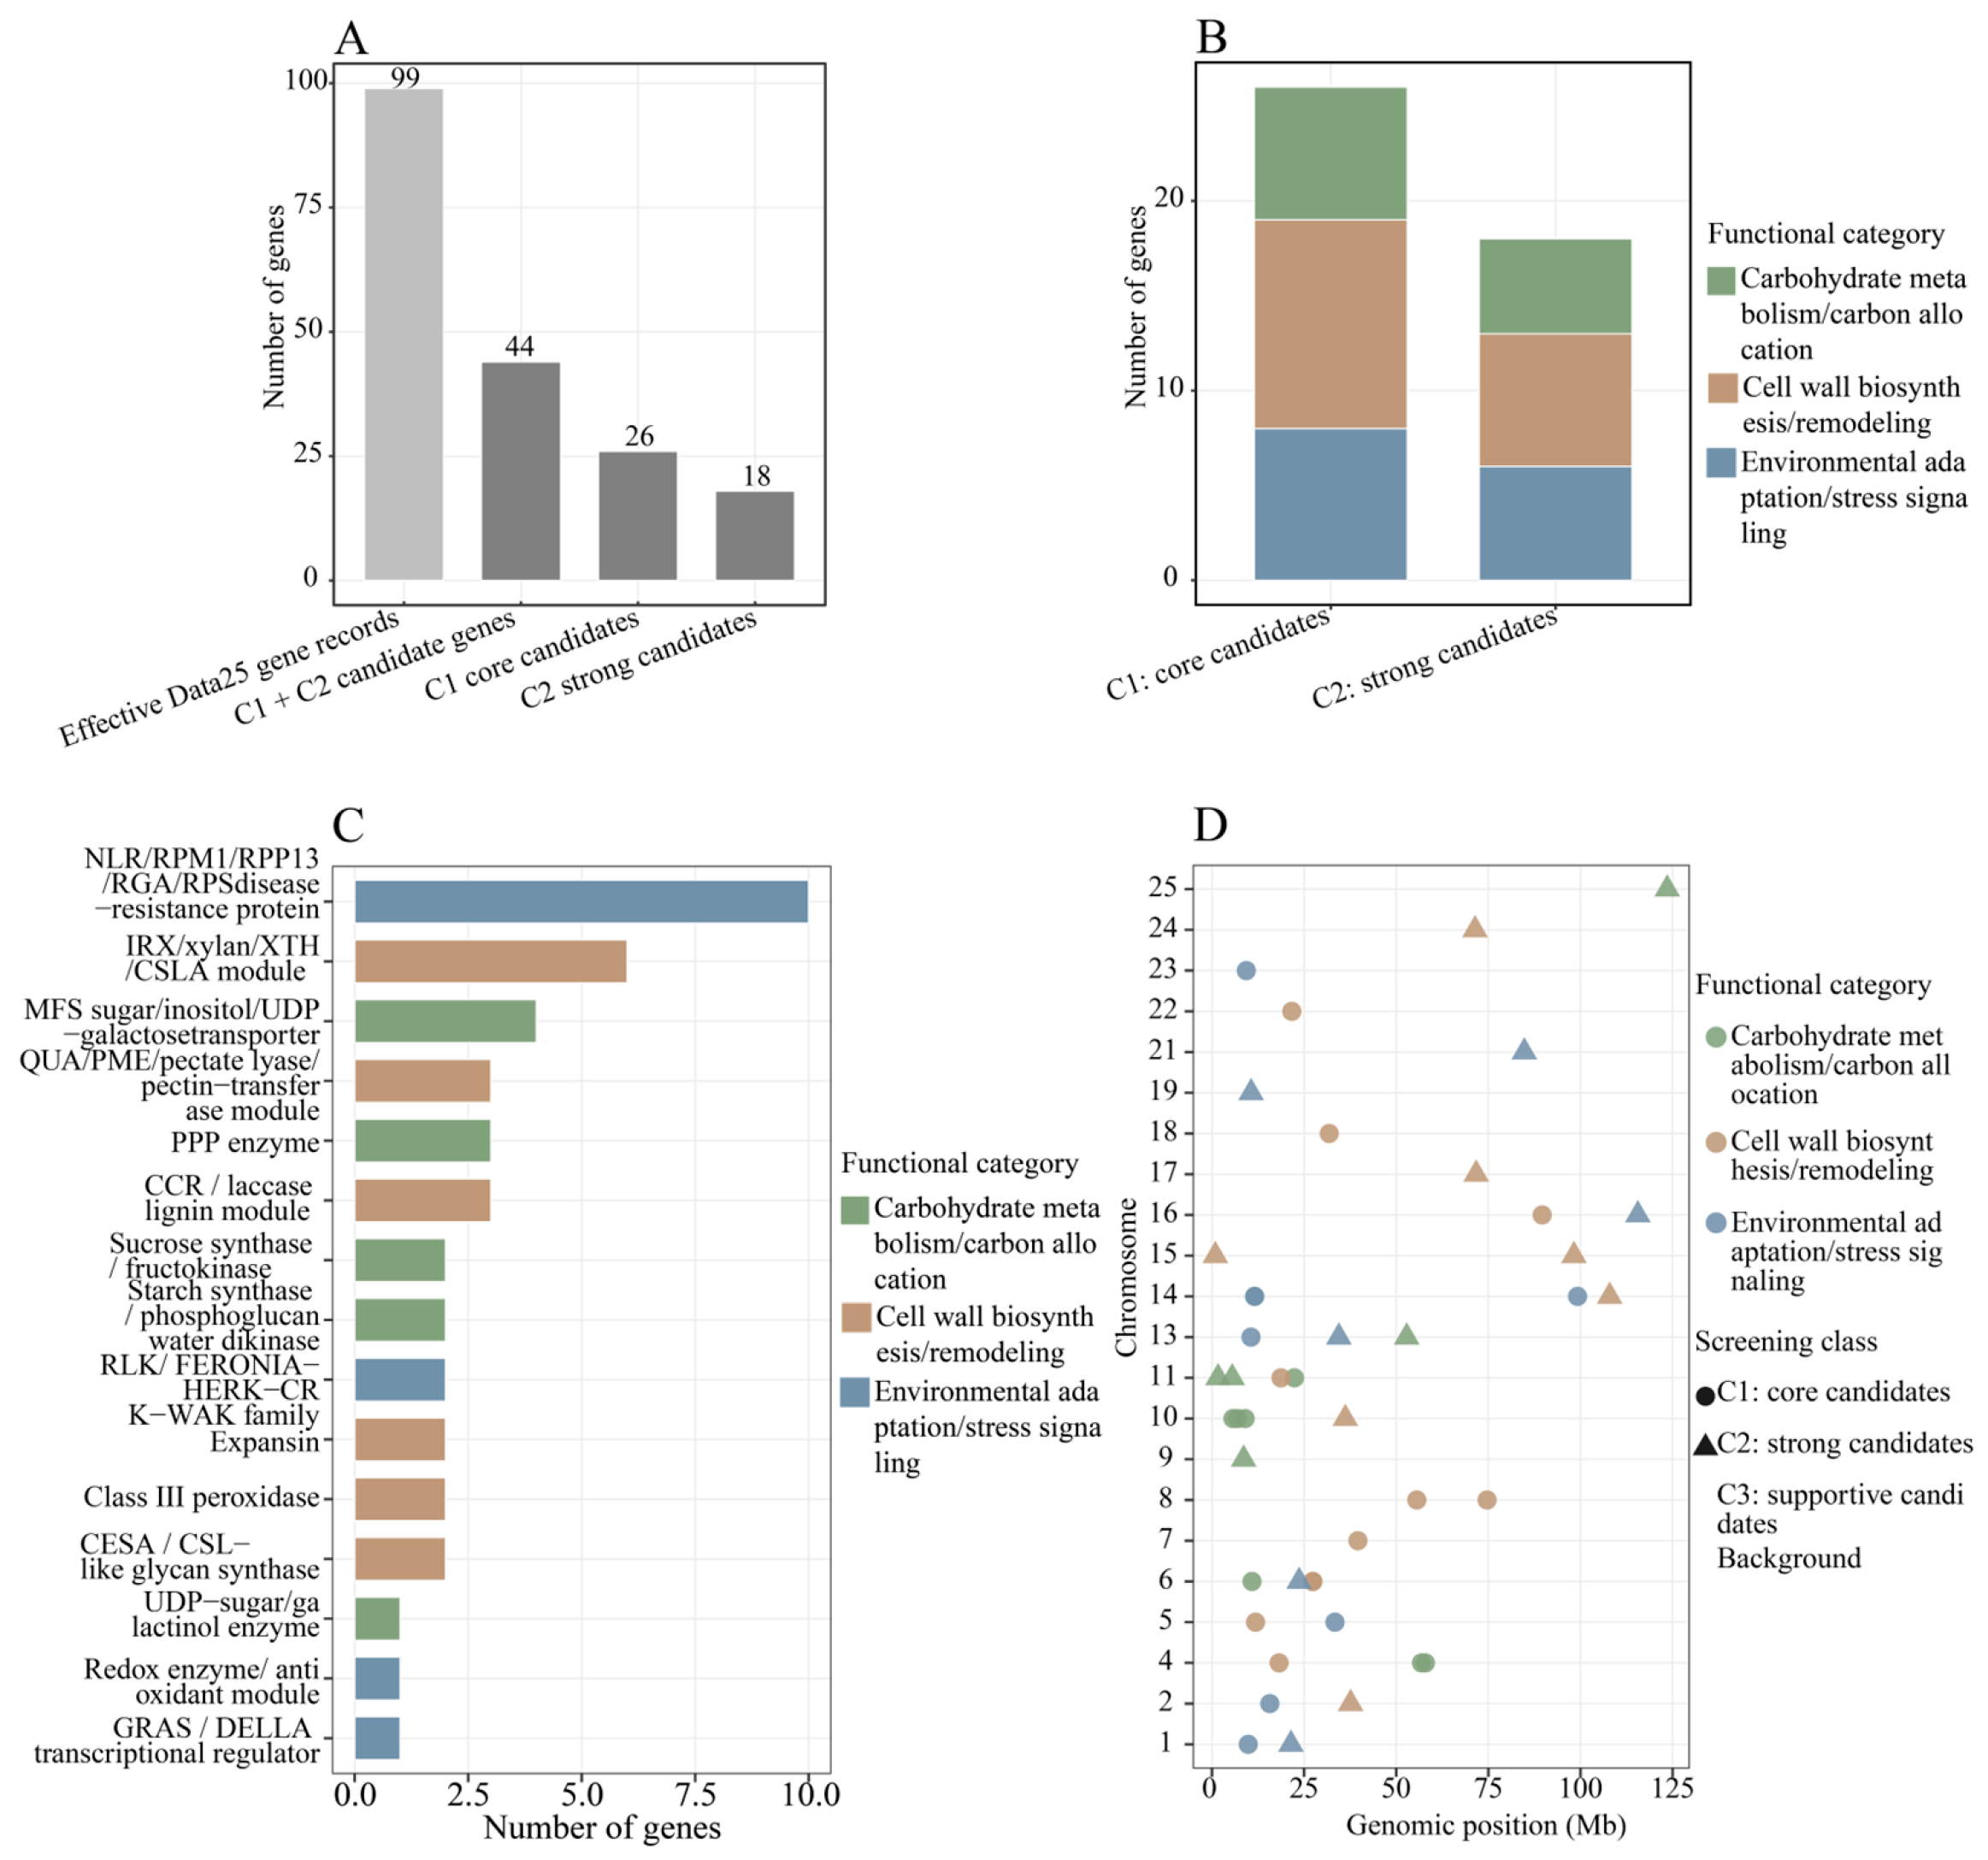
To reduce over-representation of a single functional class, candidates were ranked within each mechanistic layer rather than solely according to the global integrated score. Within each layer, candidates were ordered by integrated score, associated trait count, original evidence score, candidate priority, annotation confidence, and gene ID. Predefined layer-specific quotas were then used to retain C1 core and C2 strong candidates representing structural, metabolic, and regulatory processes. These quotas served as a mechanism-balancing rule for downstream candidate screening and were not intended to represent statistically optimized cutoffs or equivalent biological effect sizes. For the cell wall biosynthesis/remodeling layer, 11 C1 and seven C2 candidates were retained. For the carbohydrate metabolism/carbon allocation layer, seven C1 and five C2 candidates were retained. For the environmental adaptation/stress signaling layer, eight C1 and six C2 candidates were retained. This strategy produced a final transcriptome-testable panel of 44 C1/C2 candidate genes, including 26 C1 core candidates and 18 C2 strong candidates. Remaining candidates were classified as C3 supportive candidates or background genes and were retained for secondary interpretation or comparison.

2.4. Plant Materials, Bamboo Shoot Sampling and Experimental Design

Fresh bamboo shoot samples were collected from four representative bamboo species (Dendrocalamus brandisii, Phyllostachys edulis, Melocanna baccifera, and Bambusa vulgaris) at the bamboo germplasm resource nursery of Central South University of Forestry and Technology (Changsha, Hunan, China) during spring of 2023. For each bamboo type, shoots were collected at the early rapid growth stage (shoot height of approximately 20–30 cm) with three biological replicates. Because species-specific molecular staging markers were unavailable, shoot height and visible growth status were used as practical criteria to approximate a comparable early rapid-growth phase across the four bamboo species. Samples were divided for transcriptome and metabolome analyses. Tissues intended for RNA sequencing were immediately frozen in liquid nitrogen and stored at −80 °C until RNA extraction. Samples intended for metabolomic profiling were processed using freeze-dried material and stored at −80 °C before extraction. Detailed sample information, including sample code, bamboo species or accession, tissue type, developmental stage and replicate number, should be provided in Supplementary Table S1.

2.5. RNA Sequencing and Expression Matrix Generation

Total RNA was extracted from bamboo shoot samples using the FastPure Plant Total RNA Isolation Kit (Vazyme, Nanjing, China) according to the manufacturer’s instructions. RNA integrity and concentration were assessed using the Illumina NovaSeq 6000 platform (Illumina, San Diego, CA, USA) with 150 bp paired-end reads. RNA-seq libraries were constructed using the NEBNext® Ultra™ RNA Library Prep Kit for Illumina® (NEB, Ipswich, MA, USA) and sequenced on the Illumina NovaSeq 6000 platform (Illumina, San Diego, CA, USA) with paired-end 150 bp reads. Raw reads were quality-filtered using fastp (version 0.20.1), and clean reads were mapped to the moso bamboo reference genome (version 2.0) using HISAT2 (version 2.1.0). Gene expression levels were quantified as FPKM values using featureCounts (version 1.6.3). The final expression matrix was used for candidate gene expression screening and multi-species shoot transcriptome integration.
For the large-scale moso bamboo transcriptome screening, the expression matrix moso_merged_FPKM.csv and sample annotation table sample_annotation.csv were used. Candidate genes were extracted from the expression matrix according to the locus-level IDs of the 44 C1/C2 genes. Sample annotations were standardized, and a sample index was constructed by combining tissue, treatment, and treatment time information. Expression data were reshaped into long format, merged with sample annotations, and summarized by gene, category, SRA project, treatment group, and sample index. Mean FPKM values were calculated using the summarySE function from the R package Rmisc (version 1.5.1) Rmisc.
For each gene and transcriptome comparison, the corresponding control group was identified within the same gene, transcriptome category, and SRA project. Fold change was calculated as the ratio between treatment FPKM and control FPKM, and log2 fold change was calculated as log2(fold change). Non-finite log2 fold-change values were set to zero. Transcriptome comparisons were grouped into five biological categories: Development, Tissue, Environment, Hormone, and Flower.

2.6. Expression Response Definition and Expression-Support Scoring

Candidate gene expression responses were evaluated using both fold-change and expression-abundance thresholds. A gene–condition record was defined as responsive when the absolute log2 fold change was at least 1 and the maximum value between treatment FPKM and control FPKM was at least 1. This combined threshold was used to reduce false response calls caused by extremely low-abundance transcripts. These empirically established thresholds were applied to rigorously separate biologically relevant transcriptional alterations from technical sequencing background noise.
For each candidate gene, expression-support metrics were calculated across all transcriptome comparisons. These metrics included the total number of comparisons, number of expressed comparisons, number of responsive comparisons, number of up-regulated comparisons, number of down-regulated comparisons, response-category breadth, mean FPKM, maximum FPKM, mean absolute log2 fold change, median absolute log2 fold change, and maximum absolute log2 fold change. An expression-support score was calculated by combining maximum absolute log2 fold change, mean absolute log2 fold change, the logarithmically transformed number of responsive comparisons, and response-category breadth.
Candidate genes were classified into four expression-support classes. Genes with at least five responsive comparisons, response in at least two transcriptome categories, and a maximum absolute log2 fold change of at least 2 were classified as E1 strongly expression-supported candidates. Genes with at least two responsive comparisons and a maximum absolute log2 fold change of at least 1.5 were classified as E2 expression-responsive candidates. Genes with at least one responsive comparison and a maximum absolute log2 fold change of at least 1 were classified as E3 weak or condition-limited candidates. Genes not meeting these criteria were classified as E4 low or no response candidates.

2.7. Non-Targeted Metabolome Profiling and Metabolite Matrix Generation

Metabolites were extracted from bamboo shoot samples using 70% aqueous methanol extraction at 4 °C overnight. Non-targeted metabolomic profiling was performed using a UPLC-ESI-MS/MS system (UPLC, SHIMADZU Nexera X2, Shimadzu, Kyoto, Japan; MS, 4500 Q TRAP, Applied Biosystems, Foster City, CA, USA) in both positive and negative ion modes. Raw metabolomic data were processed using Analyst 1.6.3 software (AB Sciex, Framingham, MA, USA) for peak detection, alignment, normalization, and metabolite annotation. Metabolites were annotated based on the local MWDB database (Metware Biotechnology, Wuhan, China) and public databases including KEGG and HMDB. The final metabolite abundance table contained metabolite ID, metabolite name, first-level class, second-level class, sample variable, tissue, abundance value, and summary statistics. Detailed metabolomic processing parameters are provided in Supplementary Table S2.
In the present analysis, shoot and culm metabolome tables were initially imported from new_shoot_metabo.xlsx and new_bamboo_metabo.xlsx. Metabolite abundance tables were reshaped into long format, and sample replicate labels were simplified by extracting the accession or shoot-variable prefix. Only shoot metabolome records were retained for the multi-species shoot integration. Metabolite abundance values were converted to numeric values and summarized by metabolite ID, metabolite name, metabolite class, sample variable, and tissue using summarySE. The resulting shoot metabolome summary table was used as total_df_sumSE.

2.8. Multi-Species Bamboo Shoot Transcriptome–Metabolome Integration

For multi-species bamboo shoot transcriptome analysis, the expression matrix shoot_fpkm.csv was used. Sample columns originally labeled as A1–A32 with replicate suffixes were renamed according to 32 bamboo shoot variables. Candidate genes were extracted from the expression matrix using the selected omics candidate gene pool. FPKM values were converted to log2(FPKM + 1), and replicate-level expression values were averaged for each gene and shoot variable. Genes with zero expression variance across shoot variables were removed. This produced a candidate gene expression matrix for cross-sample analysis.
For metabolome integration, metabolite abundance values were log2-transformed as log2(value + 1). Metabolites were retained when they were detected in at least five shoot variables and showed non-zero abundance variation across variables. The transcriptome and metabolome matrices were then matched by common shoot variables. In the final integration, 32 shoot transcriptome variables, 41 variable candidate genes, 5059 retained metabolites, and 24 matched transcriptome–metabolome variables were used.
Principal component analysis was performed separately on the candidate gene expression matrix and the metabolite abundance matrix using the prcomp function in R with scaling enabled. The first two principal components were used to visualize transcriptional and metabolic differentiation among bamboo shoot variables.

2.9. Metabolite-Module Classification and Module-Score Calculation

To summarize metabolome variation at a broad functional level, retained metabolites were assigned to eight predefined modules using metabolite names, first-level classifications, second-level classifications, and, where available, KEGG and HMDB annotations. A predefined keyword dictionary was applied consistently across these annotation fields. This classification was intended as a broad functional grouping for downstream correlation analysis rather than as a formal pathway annotation. Metabolites containing terms related to sugar, monosaccharide, disaccharide, oligosaccharide, glycoside, galactose, glucose, fructose, sucrose, xylose, arabinose, rhamnose, galacturonic acid, or UDP were classified as sugars/wall precursors. Metabolites containing phenylpropanoid, phenolic, flavonoid, coumaric, caffeic, ferulic, sinapic, cinnamic, lignin, lignan, or anthocyanin-related terms were classified as phenylpropanoid/phenolics. Metabolites associated with lipid, fatty acid, glycerol, glycolipid, linolenic acid, linoleic acid, octadecadienoic acid, oxylipin, or jasmonate-related terms were classified as lipid/fatty acid/oxylipin. Metabolites related to amino acids, peptides, nitrogen metabolism, tryptophan, phenylalanine, tyrosine, glutamate, aspartate, valine, leucine, or isoleucine were classified as amino acid/nitrogen metabolism. Metabolites related to citrate, malate, succinate, fumarate, pyruvate, lactate, organic acid, or the TCA cycle were classified as organic acid/central carbon metabolism. Metabolites related to auxin, IAA, gibberellin, ABA, salicylic acid, jasmonic acid, cytokinin, or strigolactone were classified as hormone/signaling-like metabolites. Metabolites related to ascorbate, glutathione, tocopherol, antioxidant, quinone, redox, or thiol were classified as redox/antioxidant-like metabolites. Remaining metabolites were assigned to the other metabolites category. Metabolites with insufficient or unclear annotations were retained in the “other metabolites” category. The resulting modules were interpreted as broad functional summaries rather than definitive pathway assignments.
For each retained metabolite, abundance values were z-score transformed across matched shoot variables. For each shoot variable and metabolite module, the metabolite-module score was calculated as the mean z-score of all metabolites assigned to that module. The resulting metabolite-module score matrix was used for gene–metabolite module correlation analysis.

2.10. Gene–Metabolite Module Correlation and Multi-Omics Candidate Ranking

Spearman correlation analysis was performed between the expression level of each variable candidate gene and each metabolite-module score across the matched bamboo shoot variables. p-values were calculated using cor.test with Spearman’s method. Multiple-testing correction was performed separately within each metabolite module using the Benjamini–Hochberg method. Correlations with p < 0.05 were considered nominally significant, whereas correlations with module-wise adjusted p < 0.05 were considered FDR-supported.
For each candidate gene, a multi-omics support score was calculated using the strongest absolute gene–module correlation, mean absolute correlation across modules, number of nominally significant metabolite modules, normalized candidate integrated score, normalized expression-support score, and optional membership in predefined omics or key-validation gene sets. Candidate genes were classified into four multi-omics support classes. Genes with at least two significant metabolite-module associations and maximum absolute correlation of at least 0.65 were classified as MO1 strong multi-omics-supported candidates. Genes with at least one significant association and maximum absolute correlation of at least 0.55 were classified as MO2 moderate multi-omics-supported candidates. Genes with maximum absolute correlation of at least 0.45 were classified as MO3 weak or module-specific candidates. Remaining genes were classified as MO4 limited-support candidates.

2.11. Data Visualization and Statistical Analysis

All statistical analyses and visualizations were performed in R. Data manipulation was conducted using tidyverse, dplyr, tidyr, stringr, reshape2, data.table, and forcats. Summary statistics were calculated using Rmisc. Plots were generated using ggplot2, patchwork, ggrepel, and scales. Excel output tables were exported using writexl.
For candidate gene overview figures, stacked bar plots, boxplots, heatmaps, bubble plots, lollipop plots, and chromosomal distribution plots were used to summarize functional categories, screening classes, evidence scores, annotation confidence, trait associations, molecular families, and genomic positions. For expression-response analysis, heatmaps were generated using capped log2 fold-change values to reduce the visual influence of extreme values. For multi-species shoot omics analysis, PCA plots, expression heatmaps, metabolite-module heatmaps, gene–metabolite module correlation heatmaps, module-level bubble plots, and ranked candidate plots were generated. All figures were exported in both PDF and PNG formats, with PNG files saved at 300 dpi.
R version, package versions, and computing environment should be reported as follows: analyses were performed in R version 4.2.2 on Windows 10 operating system. Package versions are provided in Supplementary Table S3 or can be obtained using sessionInfo(). Formal statistical inference was restricted to analyses for which matched-sample or replicate-level data were available. Gene–metabolite associations were evaluated using Spearman’s rank correlation with module-wise Benjamini–Hochberg correction, as described in Section 2.10. Candidate counts, functional compositions, chromosomal distributions, PCA ordinations, and heatmap patterns were treated as descriptive summaries. These visualizations were not interpreted as evidence of statistical enrichment or significant between-group differences unless a formal statistical test was explicitly reported.

2.12. qRT-PCR Analysis in Bamboo Shoots

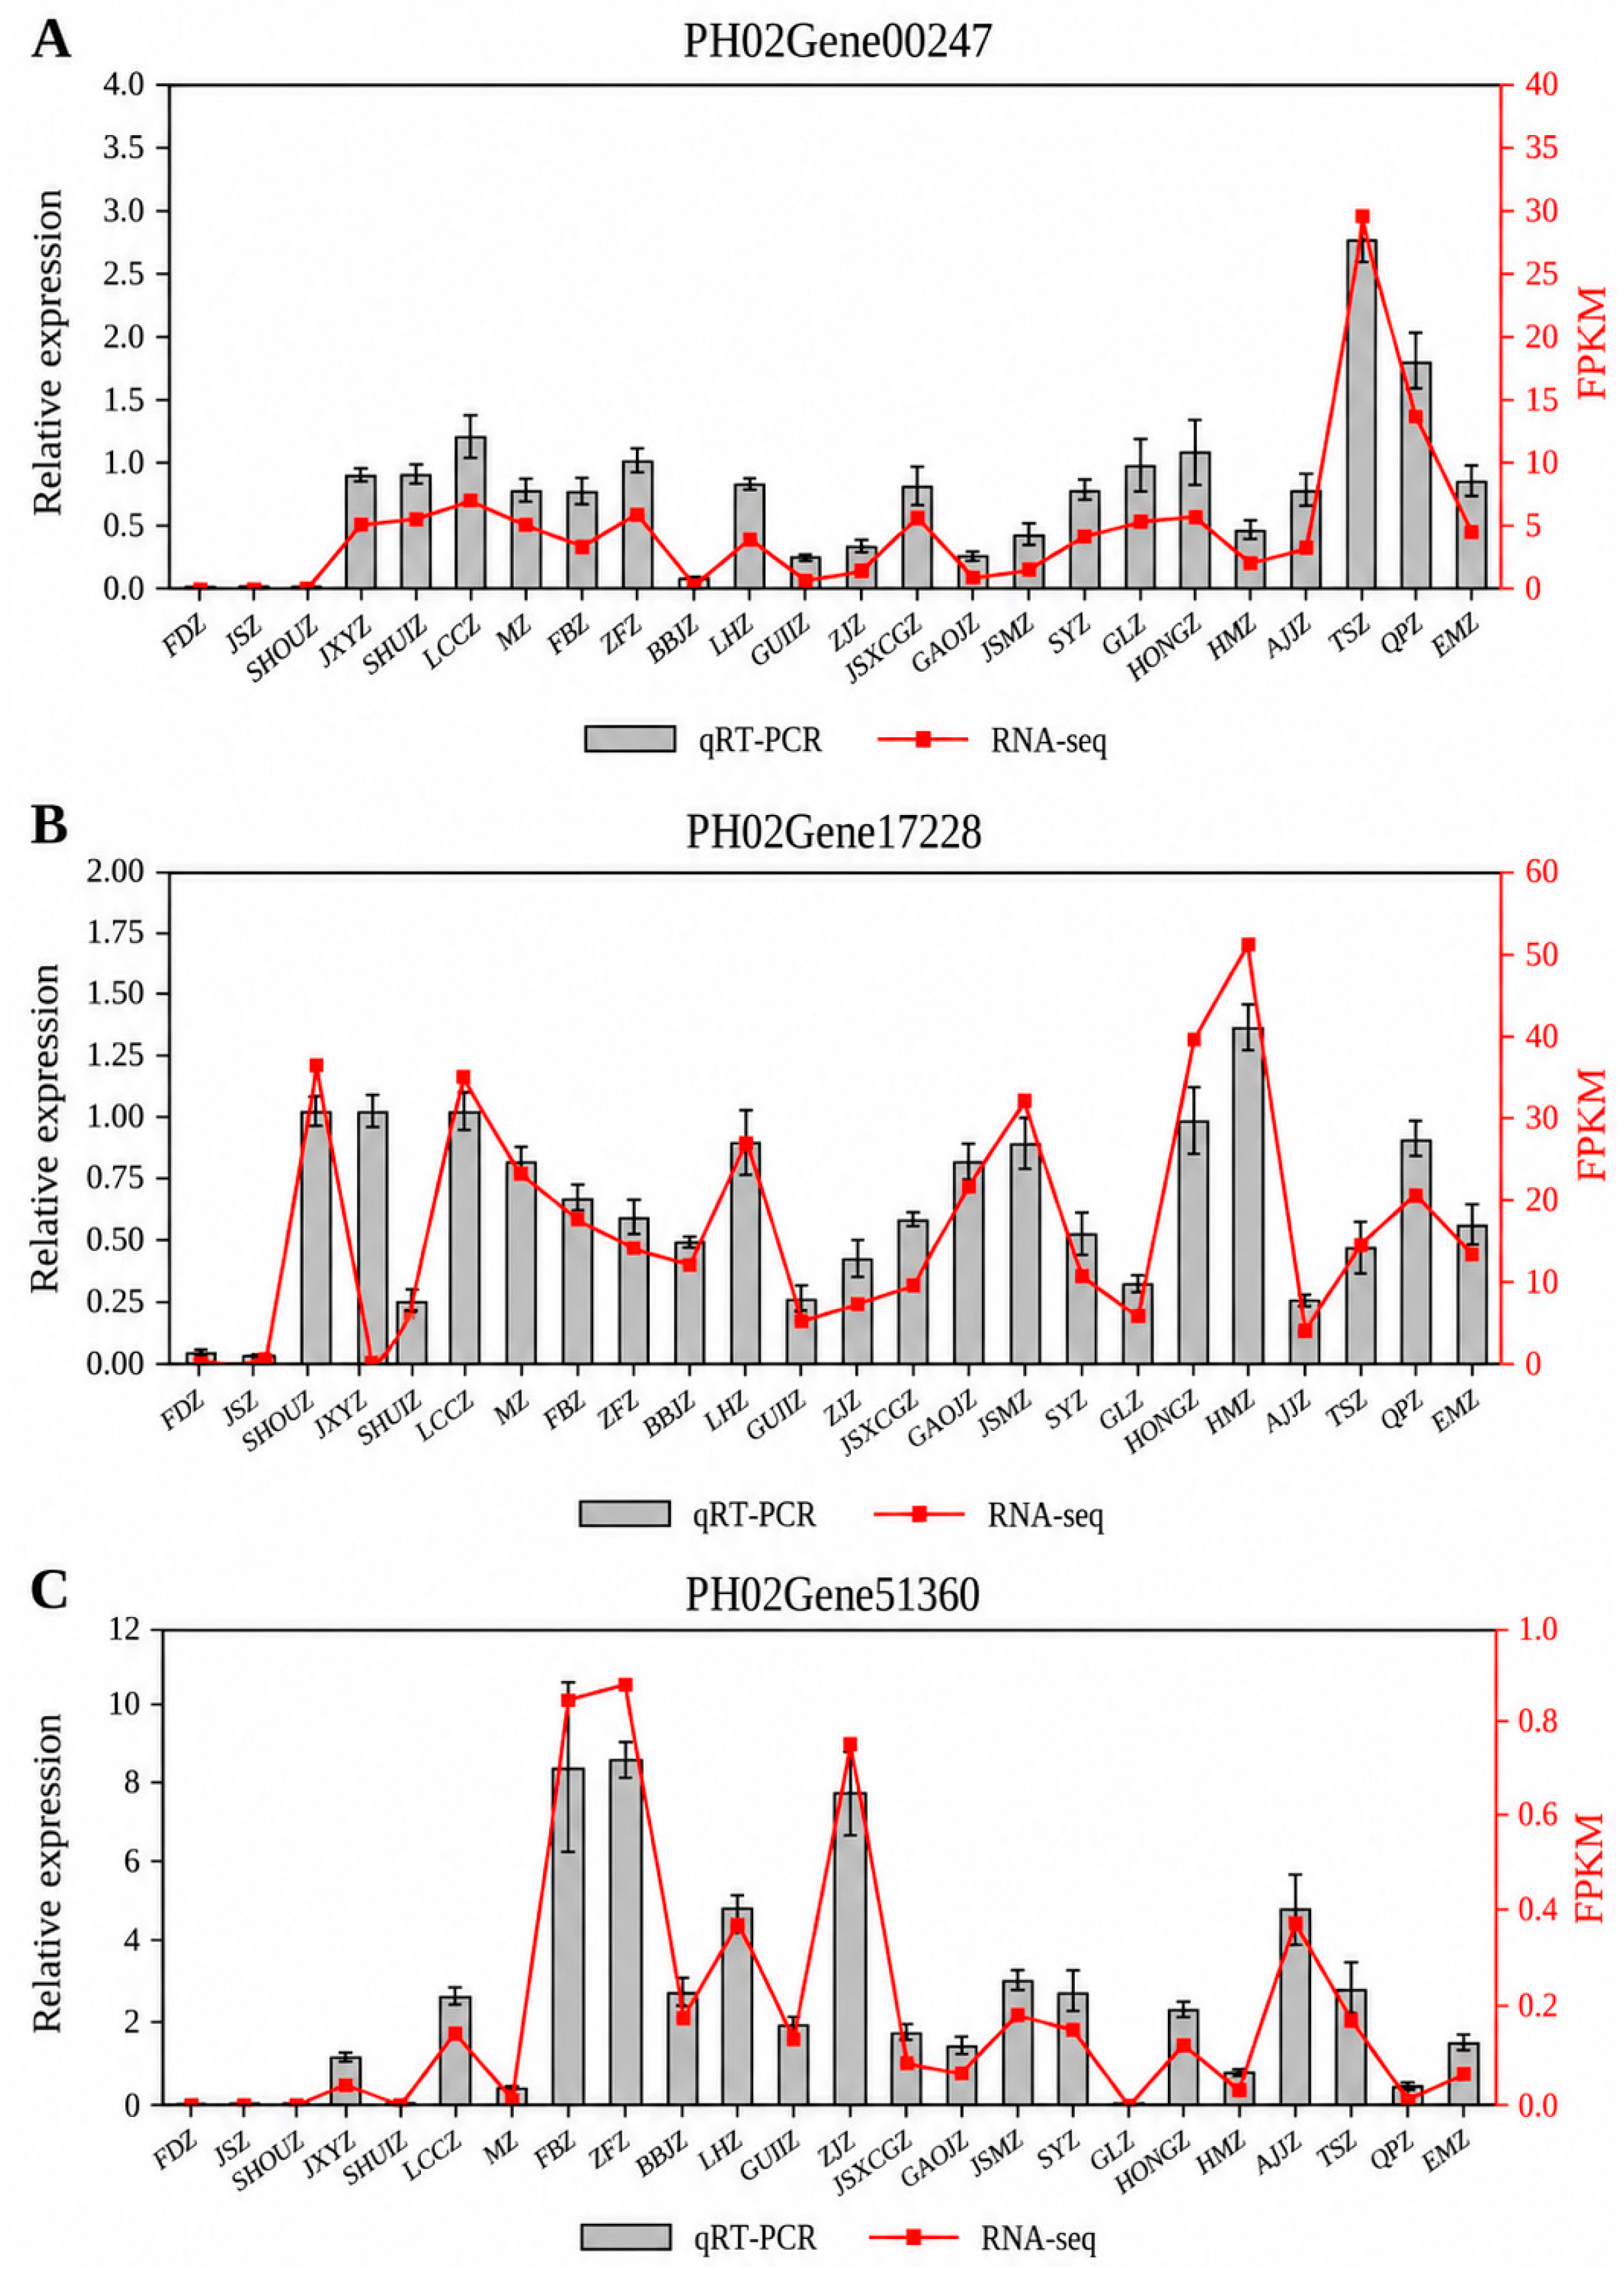
To validate the in silico predictions, total RNA was extracted from developing bamboo shoots using the RNAprep Pure Plant Plus Kit (Tiangen, Beijing, China) following the manufacturer’s instructions. First-strand cDNA was synthesized using the PrimeScript™ RT reagent Kit (TaKaRa, Dalian, China). The qRT-PCR analysis was performed on a Bio-Rad CFX96 Real-Time PCR Detection System (Bio-Rad, Hercules, CA, USA) using the ChamQ Universal SYBR qPCR Master Mix (Vazyme, Nanjing, China). The bamboo Actin gene was utilized as the internal reference control for data normalization. The relative expression levels of the top three prioritized genes (PH02Gene17228, PH02Gene00247, and PH02Gene51360) were calculated using the 2−ΔΔCt method. All reactions were conducted with three independent biological replicates. Statistical significance was determined using one-way ANOVA (p < 0.05).

3. Results

3.1. A Curated GWAS-Derived Candidate Framework Links Bamboo Property Traits with Shoot Multi-Omics Variation

To connect genetic signals associated with bamboo property-related traits to transcriptome and metabolome variation in bamboo shoots, we first constructed a curated candidate gene framework from a previously reported GWAS-derived candidate set. The original candidate information, including genomic position, evidence type, gene annotation, functional classification, and trait association, was standardized into a unified candidate table for downstream analysis (Supplementary Table S1). After removing non-gene records and harmonizing gene identifiers, 99 effective candidate gene records were retained.
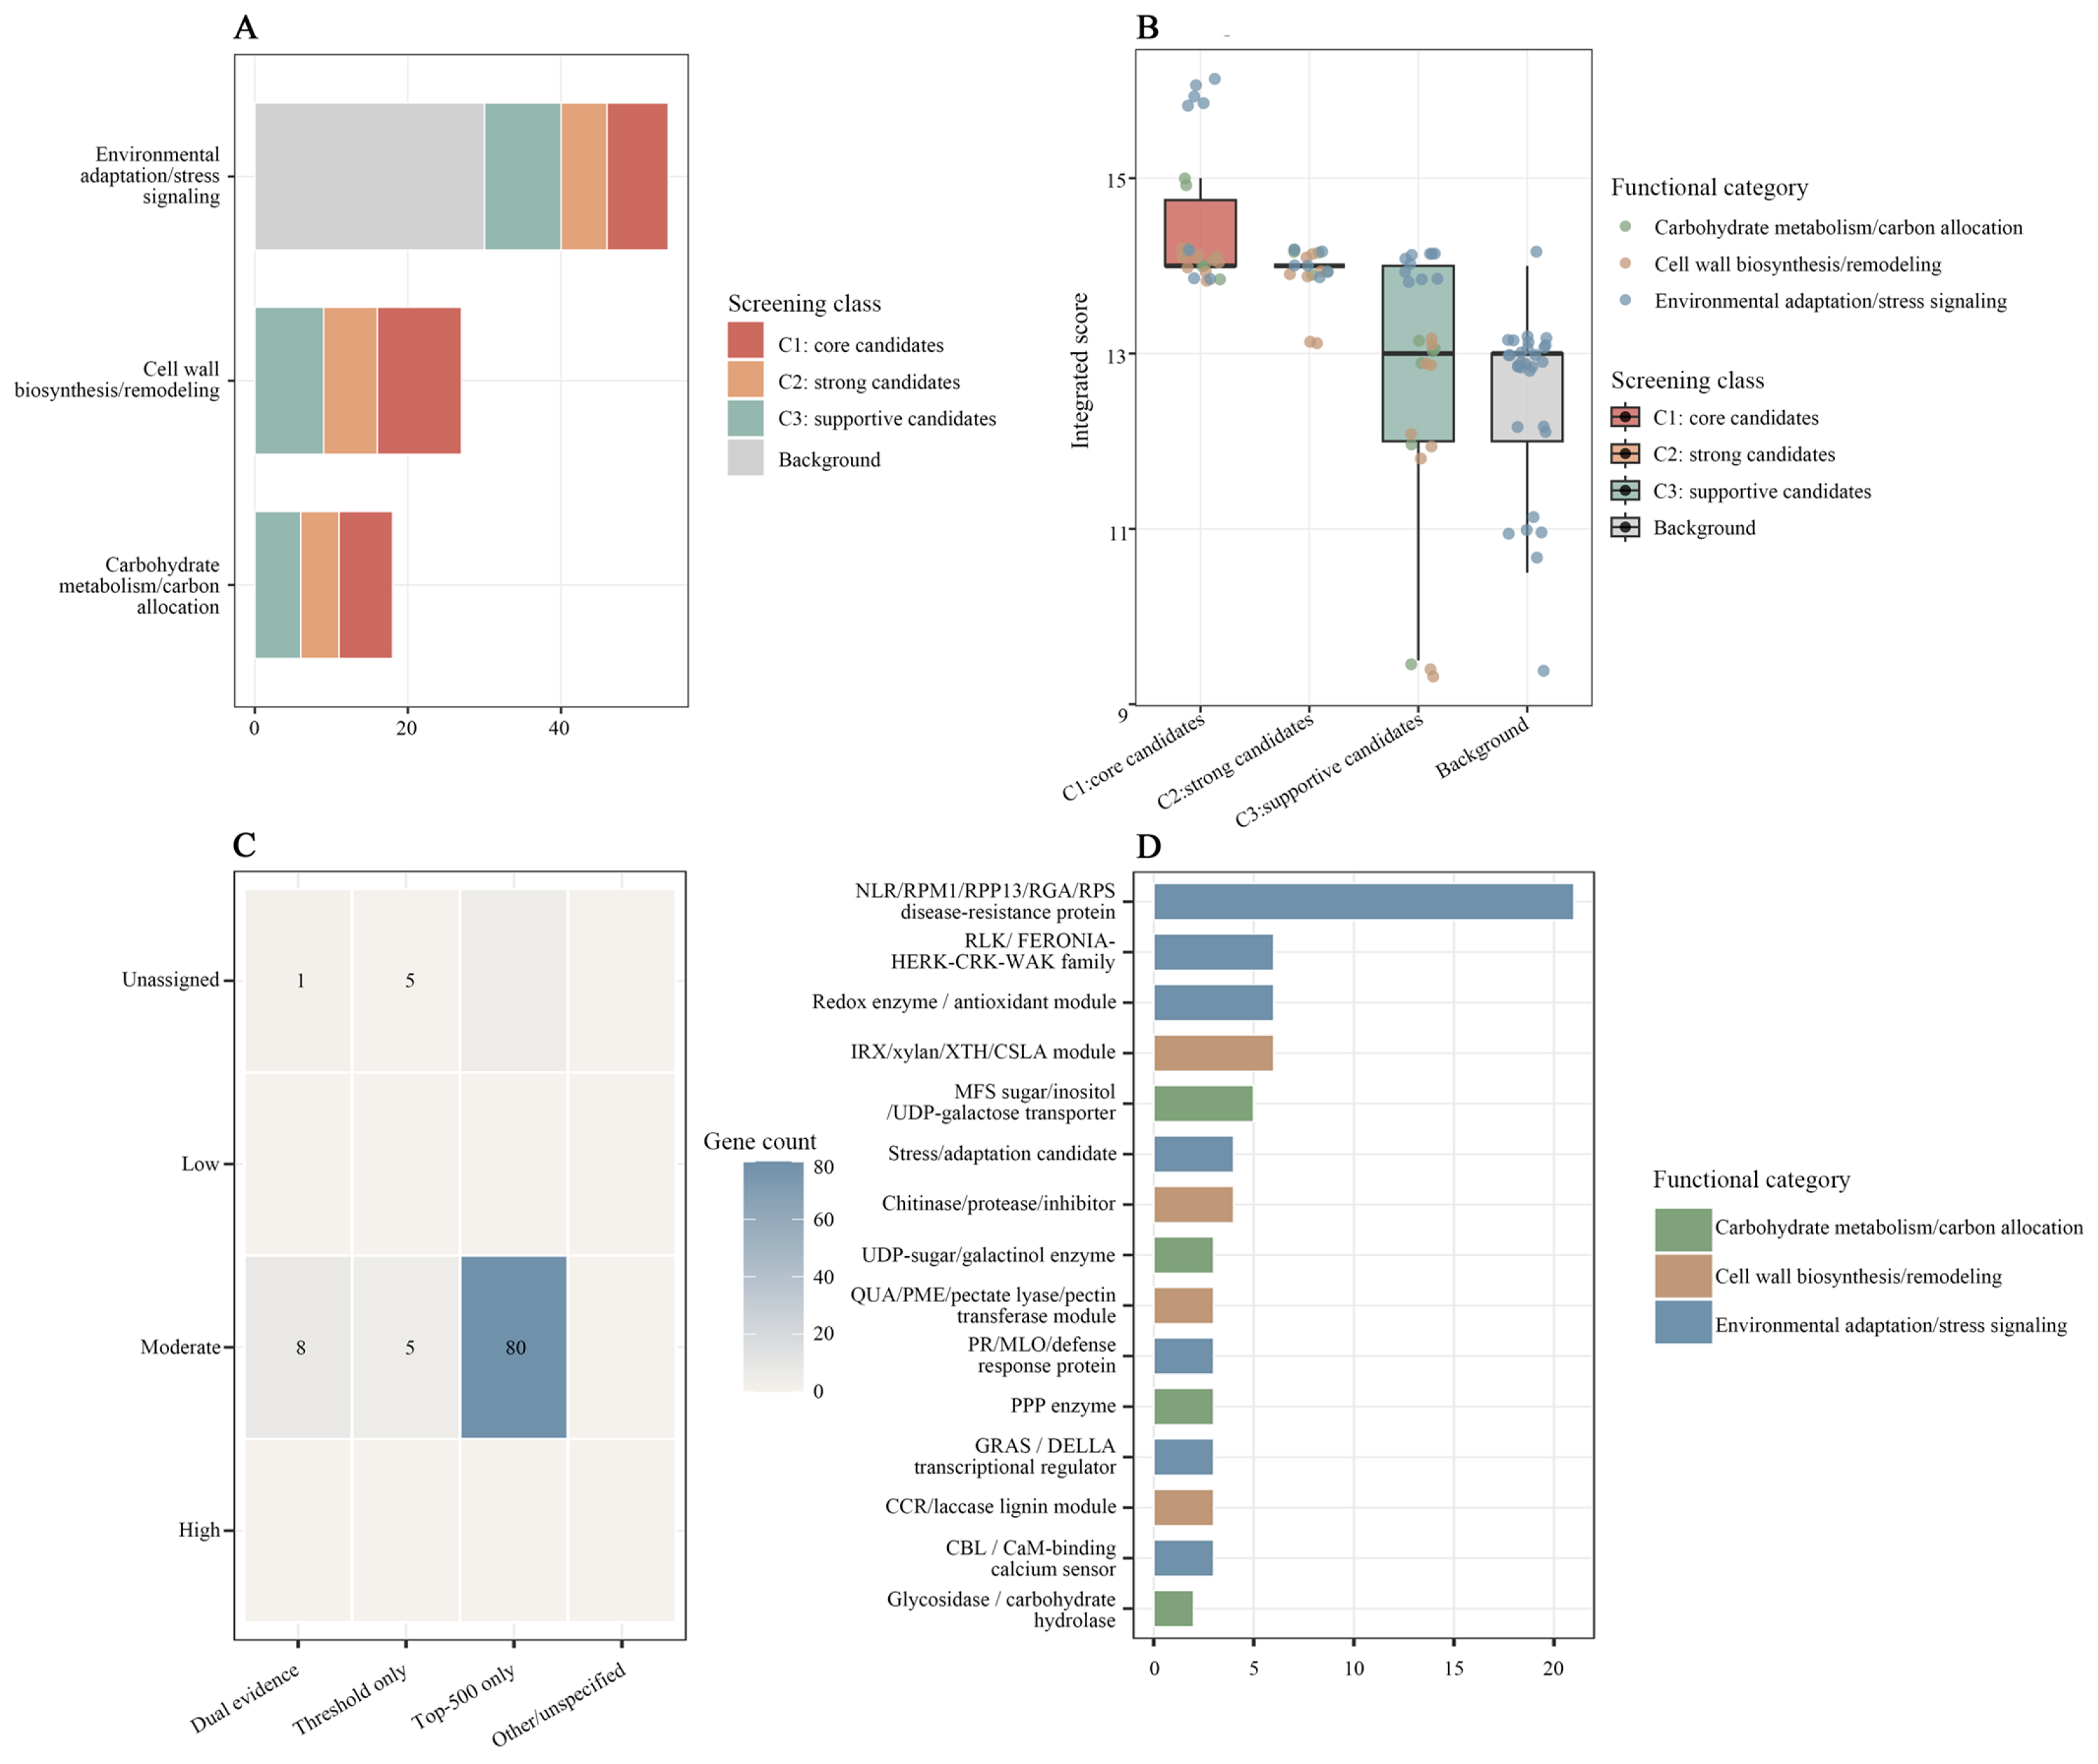
These candidates were reorganized into three biologically interpretable layers: environmental adaptation/stress signaling, carbohydrate metabolism/carbon allocation, and cell wall biosynthesis/remodeling. The environmental adaptation/stress signaling layer included NLR/RPM1/RPP13/RGA/RPS-type resistance genes, receptor-like kinases, GRAS/DELLA regulators, and redox-related proteins. The carbohydrate metabolism/carbon allocation layer included sugar transporters, sucrose synthase/fructokinase, starch metabolism genes, pentose phosphate pathway enzymes, and UDP-sugar/galactinol-related enzymes. The cell wall biosynthesis/remodeling layer included IRX/xylan/XTH/CSLA genes, CCR/laccase lignin-related genes, CESA/CSL-like glycan synthases, pectin-related genes, class III peroxidases and expansins (Figure 1A,D).

3.2. Trait-Guided Mapping Reveals a Multi-Module Basis of Bamboo Property-Related Traits

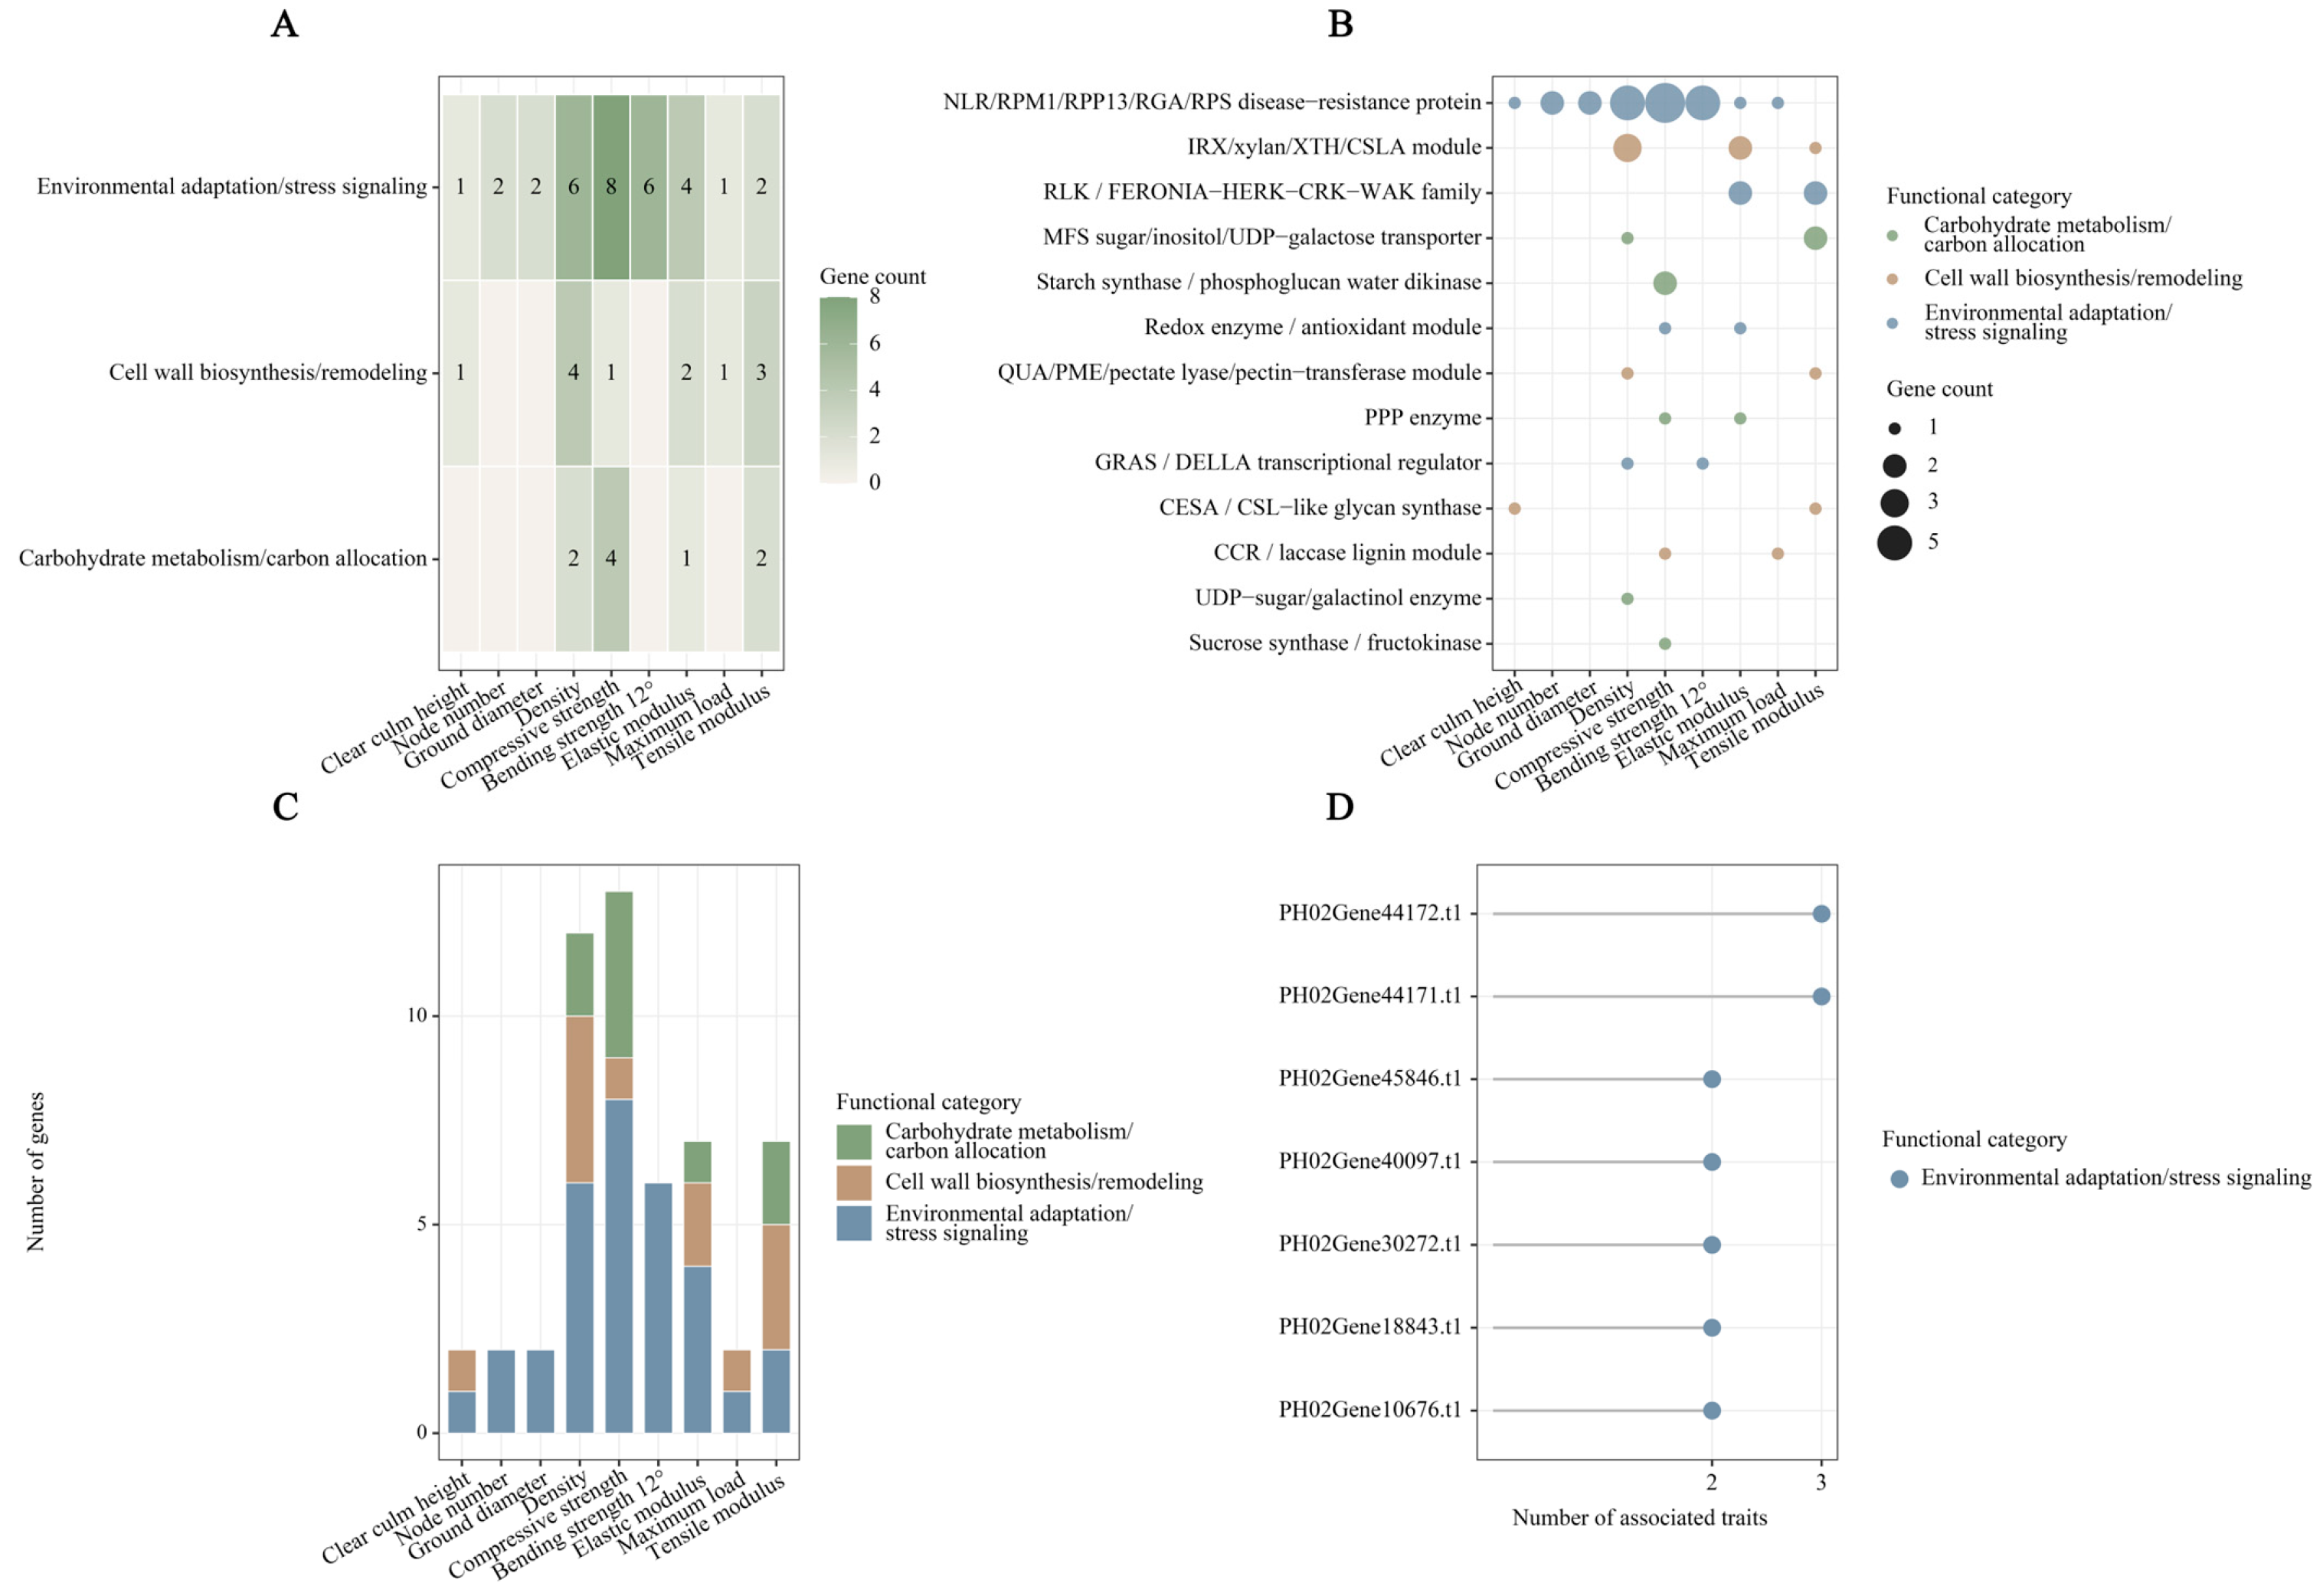
The standardized candidates were then mapped back to the nine original bamboo property-related traits, including clear culm height, node number, ground diameter, density, compressive strength, bending strength 12°, elastic modulus, maximum load, and tensile modulus. This trait-guided mapping showed that major bamboo mechanical and growth traits were associated with multiple functional layers rather than a single structural module (Figure 2A; Supplementary Table S5).
Among the 44 C1/C2 candidates, compressive strength was associated with the largest number of genes (16 genes), followed by density (11 genes), bending strength at 12°, elastic modulus and tensile modulus (six genes each), ground diameter (four genes), node number (two genes), and clear culm height and maximum load (one gene each). In the prioritized candidate set, mechanical and material traits accounted for more candidate–trait associations than growth-architecture traits. Because the nine traits were represented by unequal numbers of GWAS-derived candidate records, this pattern was treated as a descriptive summary rather than as evidence of statistical enrichment.
At the molecular-family level, the trait-associated candidate set included several gene families with established or putative relevance to bamboo property formation. IRX/xylan/XTH/CSLA genes suggested potential roles in hemicellulose biosynthesis and xyloglucan remodeling; CCR/laccase genes were linked to lignin biosynthesis and polymerization; CESA/CSL-like genes represented cellulose or cellulose-like polysaccharide formation; and class III peroxidases and expansins were associated with oxidative wall modification and wall loosening (Figure 2B). In parallel, sugar transporters, sucrose synthase/fructokinase, pentose phosphate pathway (PPP) enzymes, starch-related genes and UDP-sugar/galactinol enzymes indicated that carbon transport, metabolic remobilization and wall precursor supply are important components of bamboo property formation.
Cross-trait mapping identified seven C1/C2 candidates associated with two or more property-related traits: PH02Gene44171, PH02Gene44172, PH02Gene10676, PH02Gene18843, PH02Gene30272, PH02Gene40097, and PH02Gene45846 (Figure 2C,D). Notably, these multi-trait candidates all belonged to the environmental adaptation/stress signaling layer, including NLR/R-type genes, a redox-related gene, and a GRAS/DELLA regulator. This pattern suggests that regulatory or adaptive genes may contribute to multiple trait dimensions, potentially acting as shared upstream nodes rather than trait-specific structural genes.

3.3. Mechanism-Balanced Prioritization Defines 44 Transcriptome-Testable Candidates

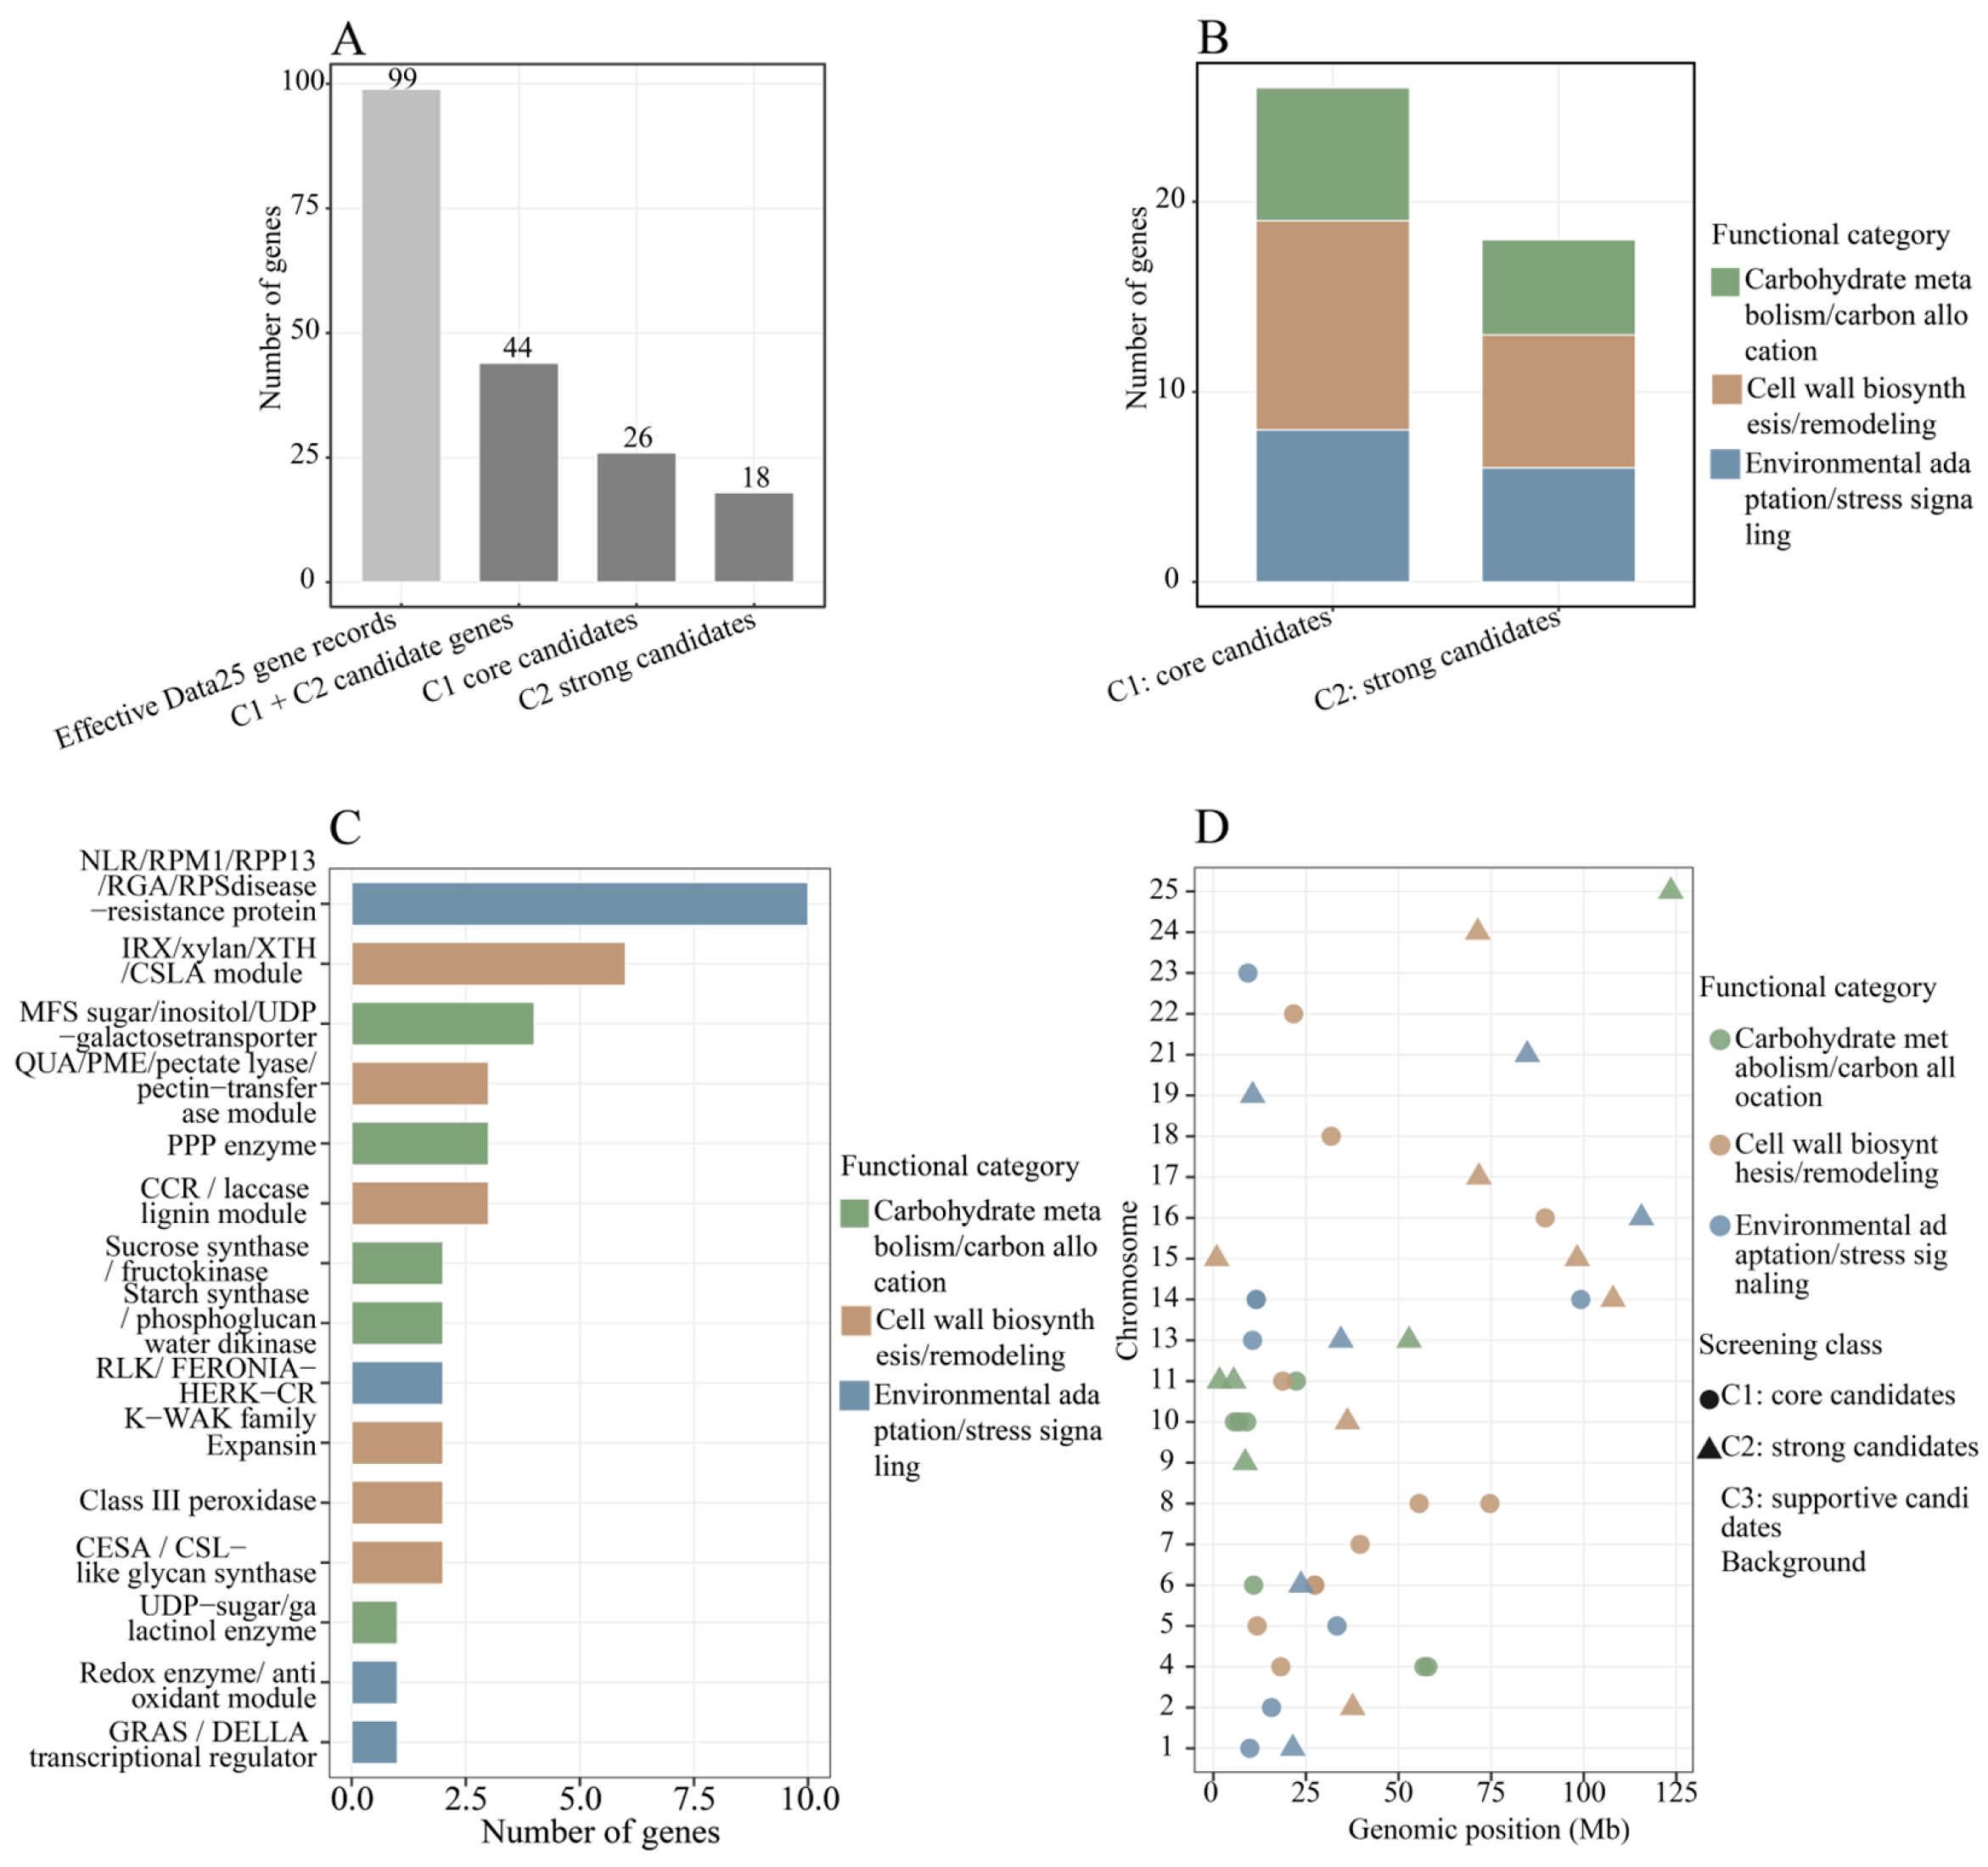
To avoid over-representation of a single gene class, a mechanism-balanced prioritization strategy was applied. Rather than selecting candidates solely by global rank, high-scoring candidates were retained from each of the three mechanistic layers. This strategy identified 44 transcriptome-testable C1/C2 candidates from the 99 effective candidate records, including 26 C1 core candidates and 18 C2 strong candidates (Figure 3A; Supplementary Table S2).
The final 44-gene panel consisted of 18 cell wall biosynthesis/remodeling genes, 12 carbohydrate metabolism/carbon allocation genes, and 14 environmental adaptation/stress signaling genes (Figure 3B). The cell wall module included six IRX/xylan/XTH/CSLA genes, three CCR/laccase lignin-related genes, three QUA/PME/pectate lyase/pectin-transferase genes, two CESA/CSL-like glycan synthase genes, two class III peroxidase genes, and two expansin genes (Figure 3C). The carbohydrate module contained four MFS sugar/inositol/UDP-galactose transporter genes, three PPP enzyme genes, two starch synthase/phosphoglucan water dikinase genes, two sucrose synthase/fructokinase genes, and one UDP-sugar/galactinol enzyme gene. The environmental/stress module contained ten NLR/RPM1/RPP13/RGA/RPS genes, two RLK/FERONIA-HERK-CRK-WAK genes, one GRAS/DELLA regulator, and one redox enzyme/antioxidant protein.
Chromosomal mapping showed that the 44 C1/C2 candidates were distributed across multiple genomic regions rather than concentrated within a single locus (Figure 3D). This pattern supports a multi-locus and multi-module genetic architecture for bamboo property-related traits. The 44-gene panel was therefore used as the main transcriptome-testable candidate set for subsequent expression and multi-omics analyses.

3.4. Expression Screening Identifies Context-Dependent Transcriptome-Supported Candidates

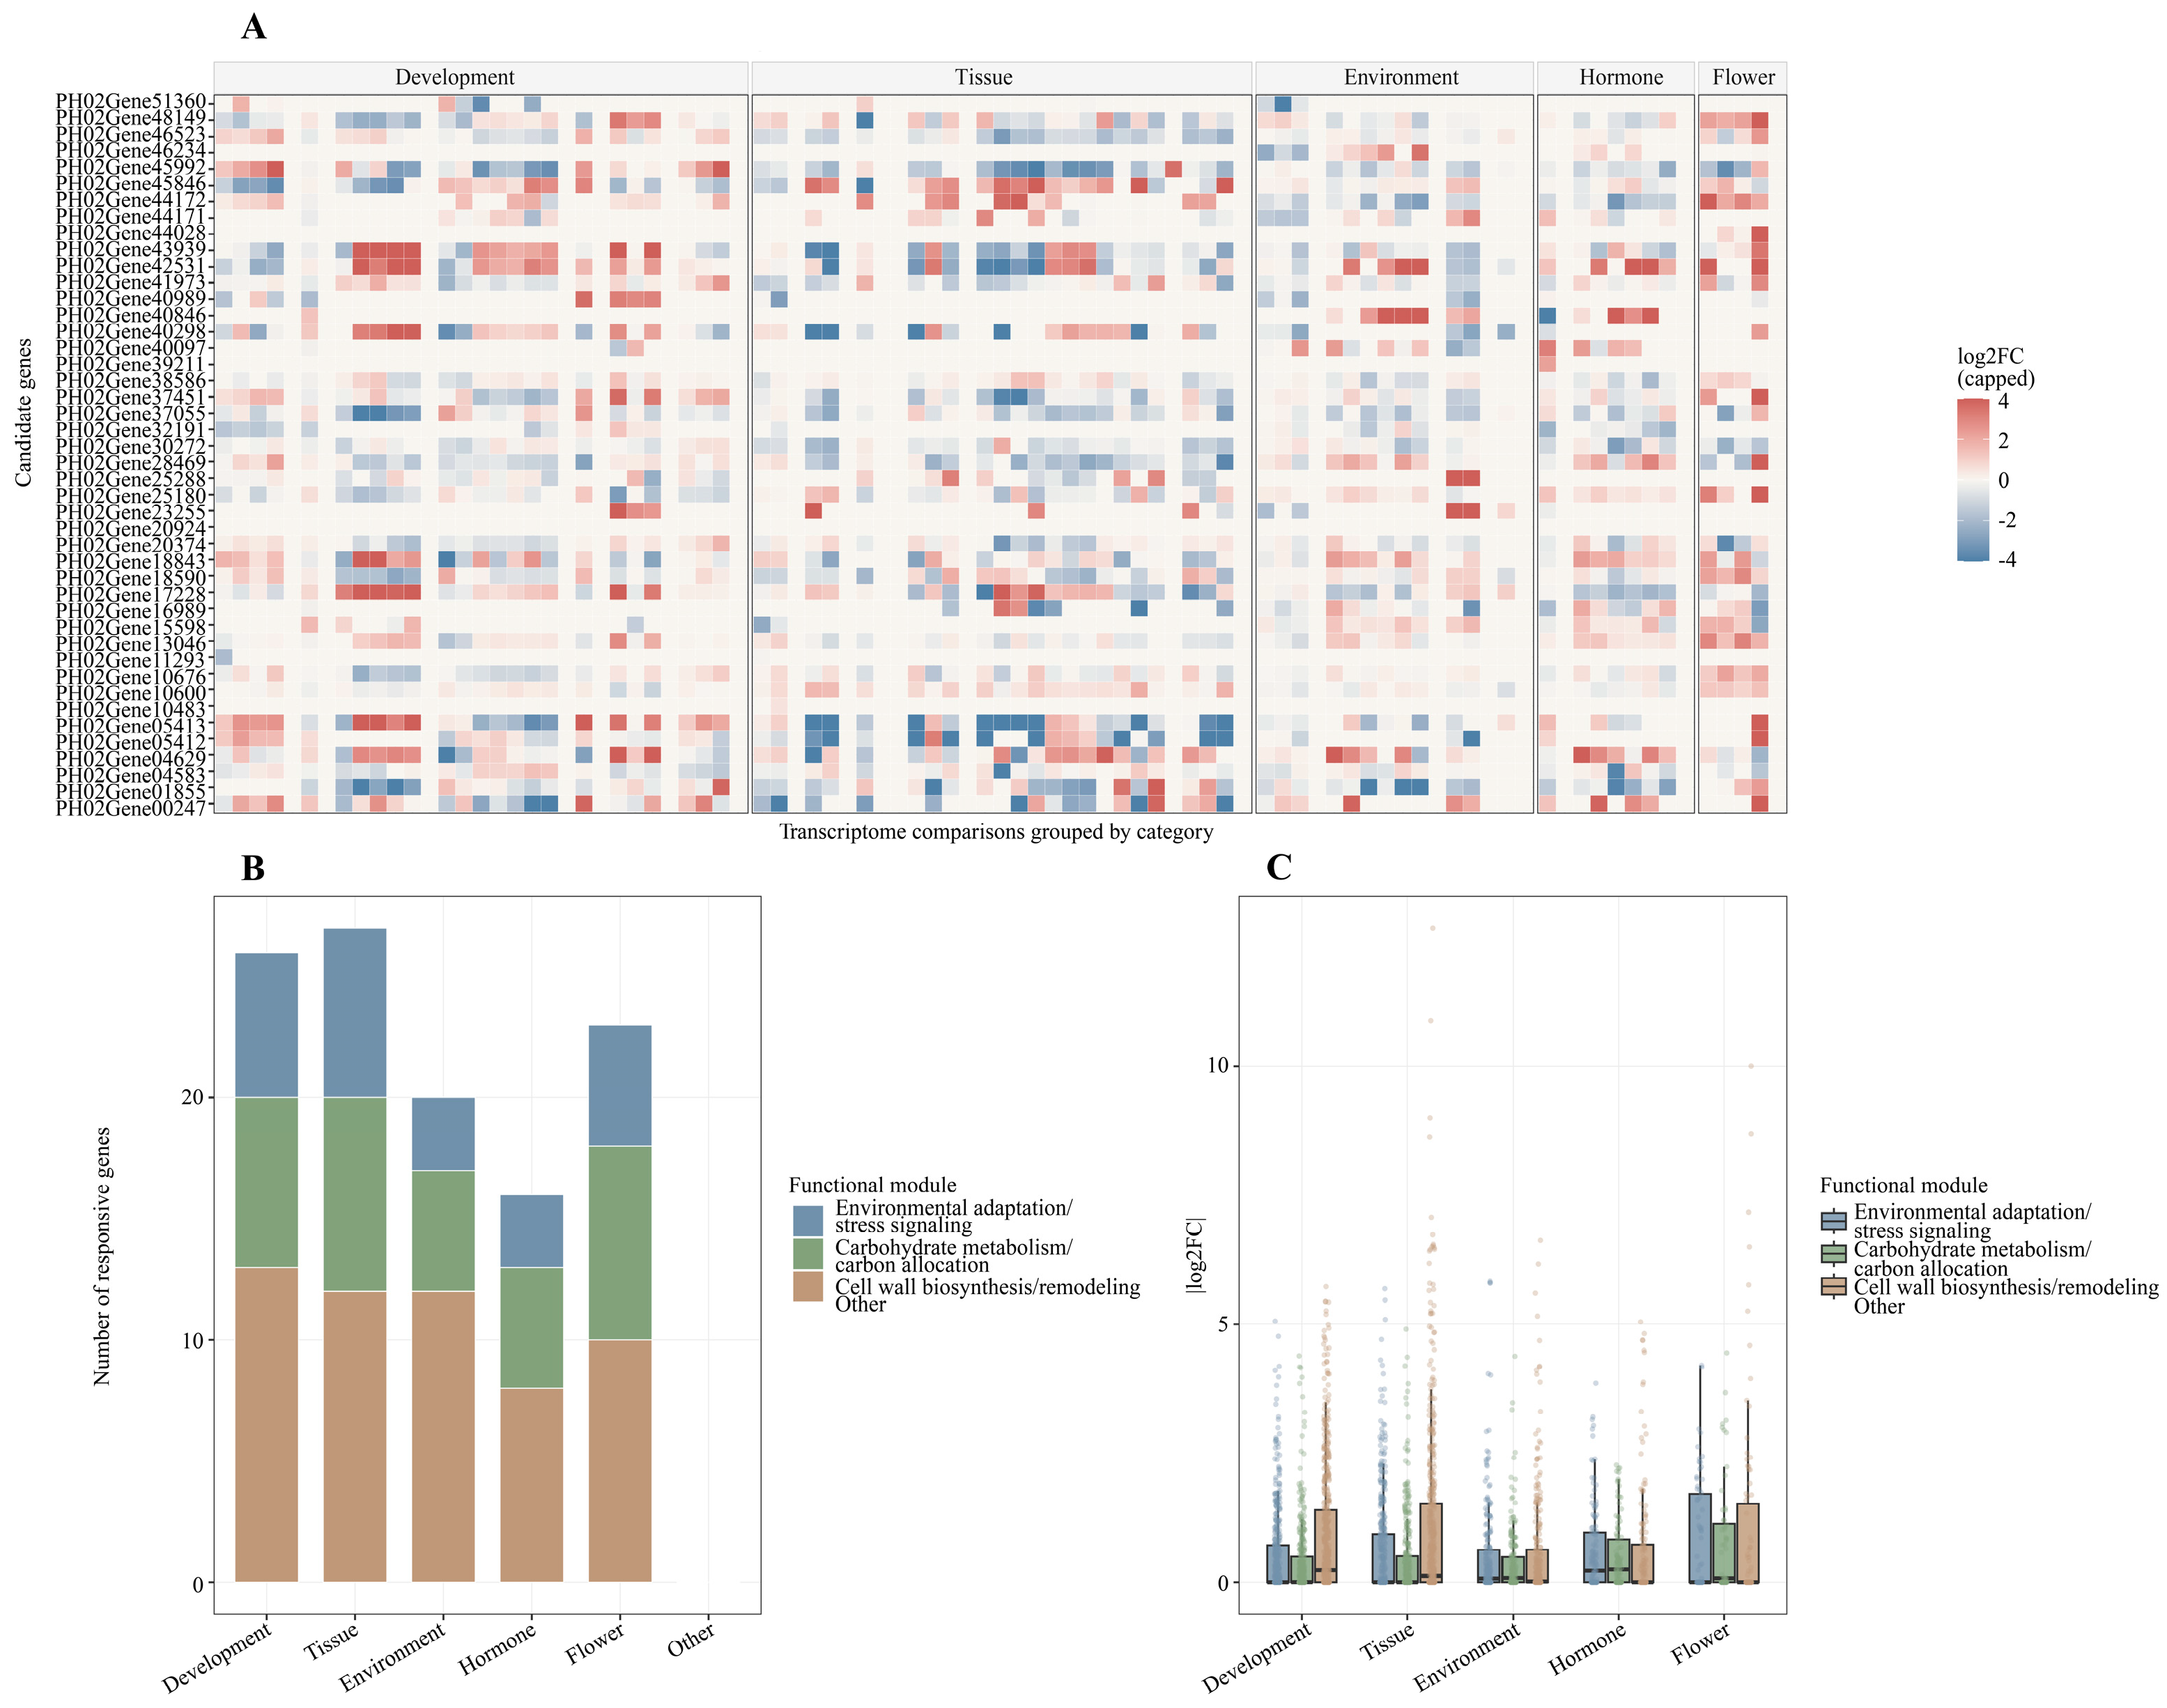
The 44 C1/C2 candidates were next evaluated across transcriptome comparisons representing Development, Tissue, Environment, Hormone and Flower-related categories. In total, 3960 gene–condition expression records from 90 transcriptome comparisons were analyzed. Candidate response was defined using both fold-change and expression-abundance thresholds: |log2fold| ≥ 1 and max(FPKM, control FPKM) ≥ 1 (Supplementary Table S3).
The global expression-response heatmap showed that the candidates exhibited heterogeneous and context-dependent transcriptional patterns across the transcriptome categories (Figure 4A). Rather than showing uniform expression changes, many genes were activated or repressed only in specific developmental stages, tissues, or treatment contexts. In the descriptive comparison across the five transcriptome categories, the cell wall biosynthesis/remodeling layer contained the largest number of responsive genes. The number of responsive cell wall genes reached 13 in Development, 12 in Tissue, 12 in Environment, 10 in Flower, and eight in Hormone comparisons. Carbohydrate metabolism/carbon allocation genes showed seven, eight, five, eight, and five responsive genes in these five categories, respectively. Environmental adaptation/stress signaling genes showed six, seven, three, five, and three responsive genes, respectively (Figure 4B; Supplementary Table S5). Because the three functional layers contained different numbers of candidates and the transcriptome comparisons were compiled from heterogeneous experimental projects, these counts were interpreted as descriptive response summaries rather than as formal evidence of significant differences among functional layers.
The distributions of absolute log2 fold changes showed descriptive variation among transcriptome categories and functional modules (Figure 4C). Developmental and tissue comparisons showed broad responses across all three modules, whereas hormone and environment comparisons retained more selective response patterns. These results indicate that the 44-gene panel contains both broadly responsive candidates and more context-restricted candidates.

3.5. Expression-Support Scoring Refines the 44-Gene Panel

To refine the 44-gene panel, an expression-support score was calculated for each candidate using response intensity, response frequency, and response breadth. Candidates were classified into four expression-support classes. Among the 44 candidates, 22 genes were classified as E1 strongly expression-supported, eight as E2 expression-responsive, four as E3 weak/condition-limited, and ten as E4 low or no response (Figure 5A,C; Supplementary Table S3). Thus, 30 genes showed strong or moderate transcriptomic support.
Expression-support classes showed different numerical distributions among the three functional modules. In the cell wall biosynthesis/remodeling module, 12 genes were classified as E1 and three as E2, indicating that 15 of 18 cell wall-related candidates showed strong or moderate expression support. In the carbohydrate metabolism/carbon allocation module, six genes were E1 and two were E2, whereas four genes were classified as E4. In the environmental adaptation/stress signaling module, four genes were E1, three were E2, two were E3, and five were E4. Descriptively, the cell wall biosynthesis/remodeling layer contained the highest proportion of candidates with strong or moderate expression support, whereas the environmental adaptation/stress signaling layer showed a more heterogeneous distribution of expression-support classes. These patterns were used for candidate prioritization and were not interpreted as statistically significant module-level differences (Figure 5C).
The highest-ranked expression-supported genes were dominated by cell wall biosynthesis/remodeling candidates. The top-ranked gene was PH02Gene05413, an IRX/xylan/XTH/CSLA candidate, which showed responses in 38 comparisons across four transcriptome categories, with a maximum absolute log2 fold change of 12.7 and the highest expression-support score (23.8). Other highly ranked cell wall genes included the expansin gene PH02Gene42531, the CCR/laccase lignin-related candidates PH02Gene04629 and PH02Gene48149, the CESA/CSL-like glycan synthase candidate PH02Gene45992, the IRX/xylan/XTH/CSLA candidates PH02Gene43939, PH02Gene37451, PH02Gene37055 and PH02Gene05412, the class III peroxidase gene PH02Gene00247, and the pectin-related candidate PH02Gene44028 (Figure 5A,D; Supplementary Table S3).
Several carbohydrate metabolism/carbon allocation genes also showed strong expression support. These included PH02Gene17228, a starch synthase/phosphoglucan water dikinase candidate, PH02Gene25180, a PPP enzyme candidate, PH02Gene13046, a UDP-sugar/galactinol enzyme candidate, and the MFS sugar/inositol/UDP-galactose transporter candidates PH02Gene16989 and PH02Gene41973. Among the environmental adaptation/stress signaling genes, PH02Gene45846, a GRAS/DELLA transcriptional regulator, was strongly expression-supported, while PH02Gene18590, an RLK/FERONIA-HERK-CRK-WAK family gene, also showed broad responsiveness. These results indicate that the expression-supported candidate set retained not only structural wall-remodeling genes, but also carbon-allocation and regulatory candidates potentially linked to bamboo shoot development and property formation.

3.6. Multi-Species Bamboo Shoot Omics Captures Transcriptional and Metabolic Differentiation

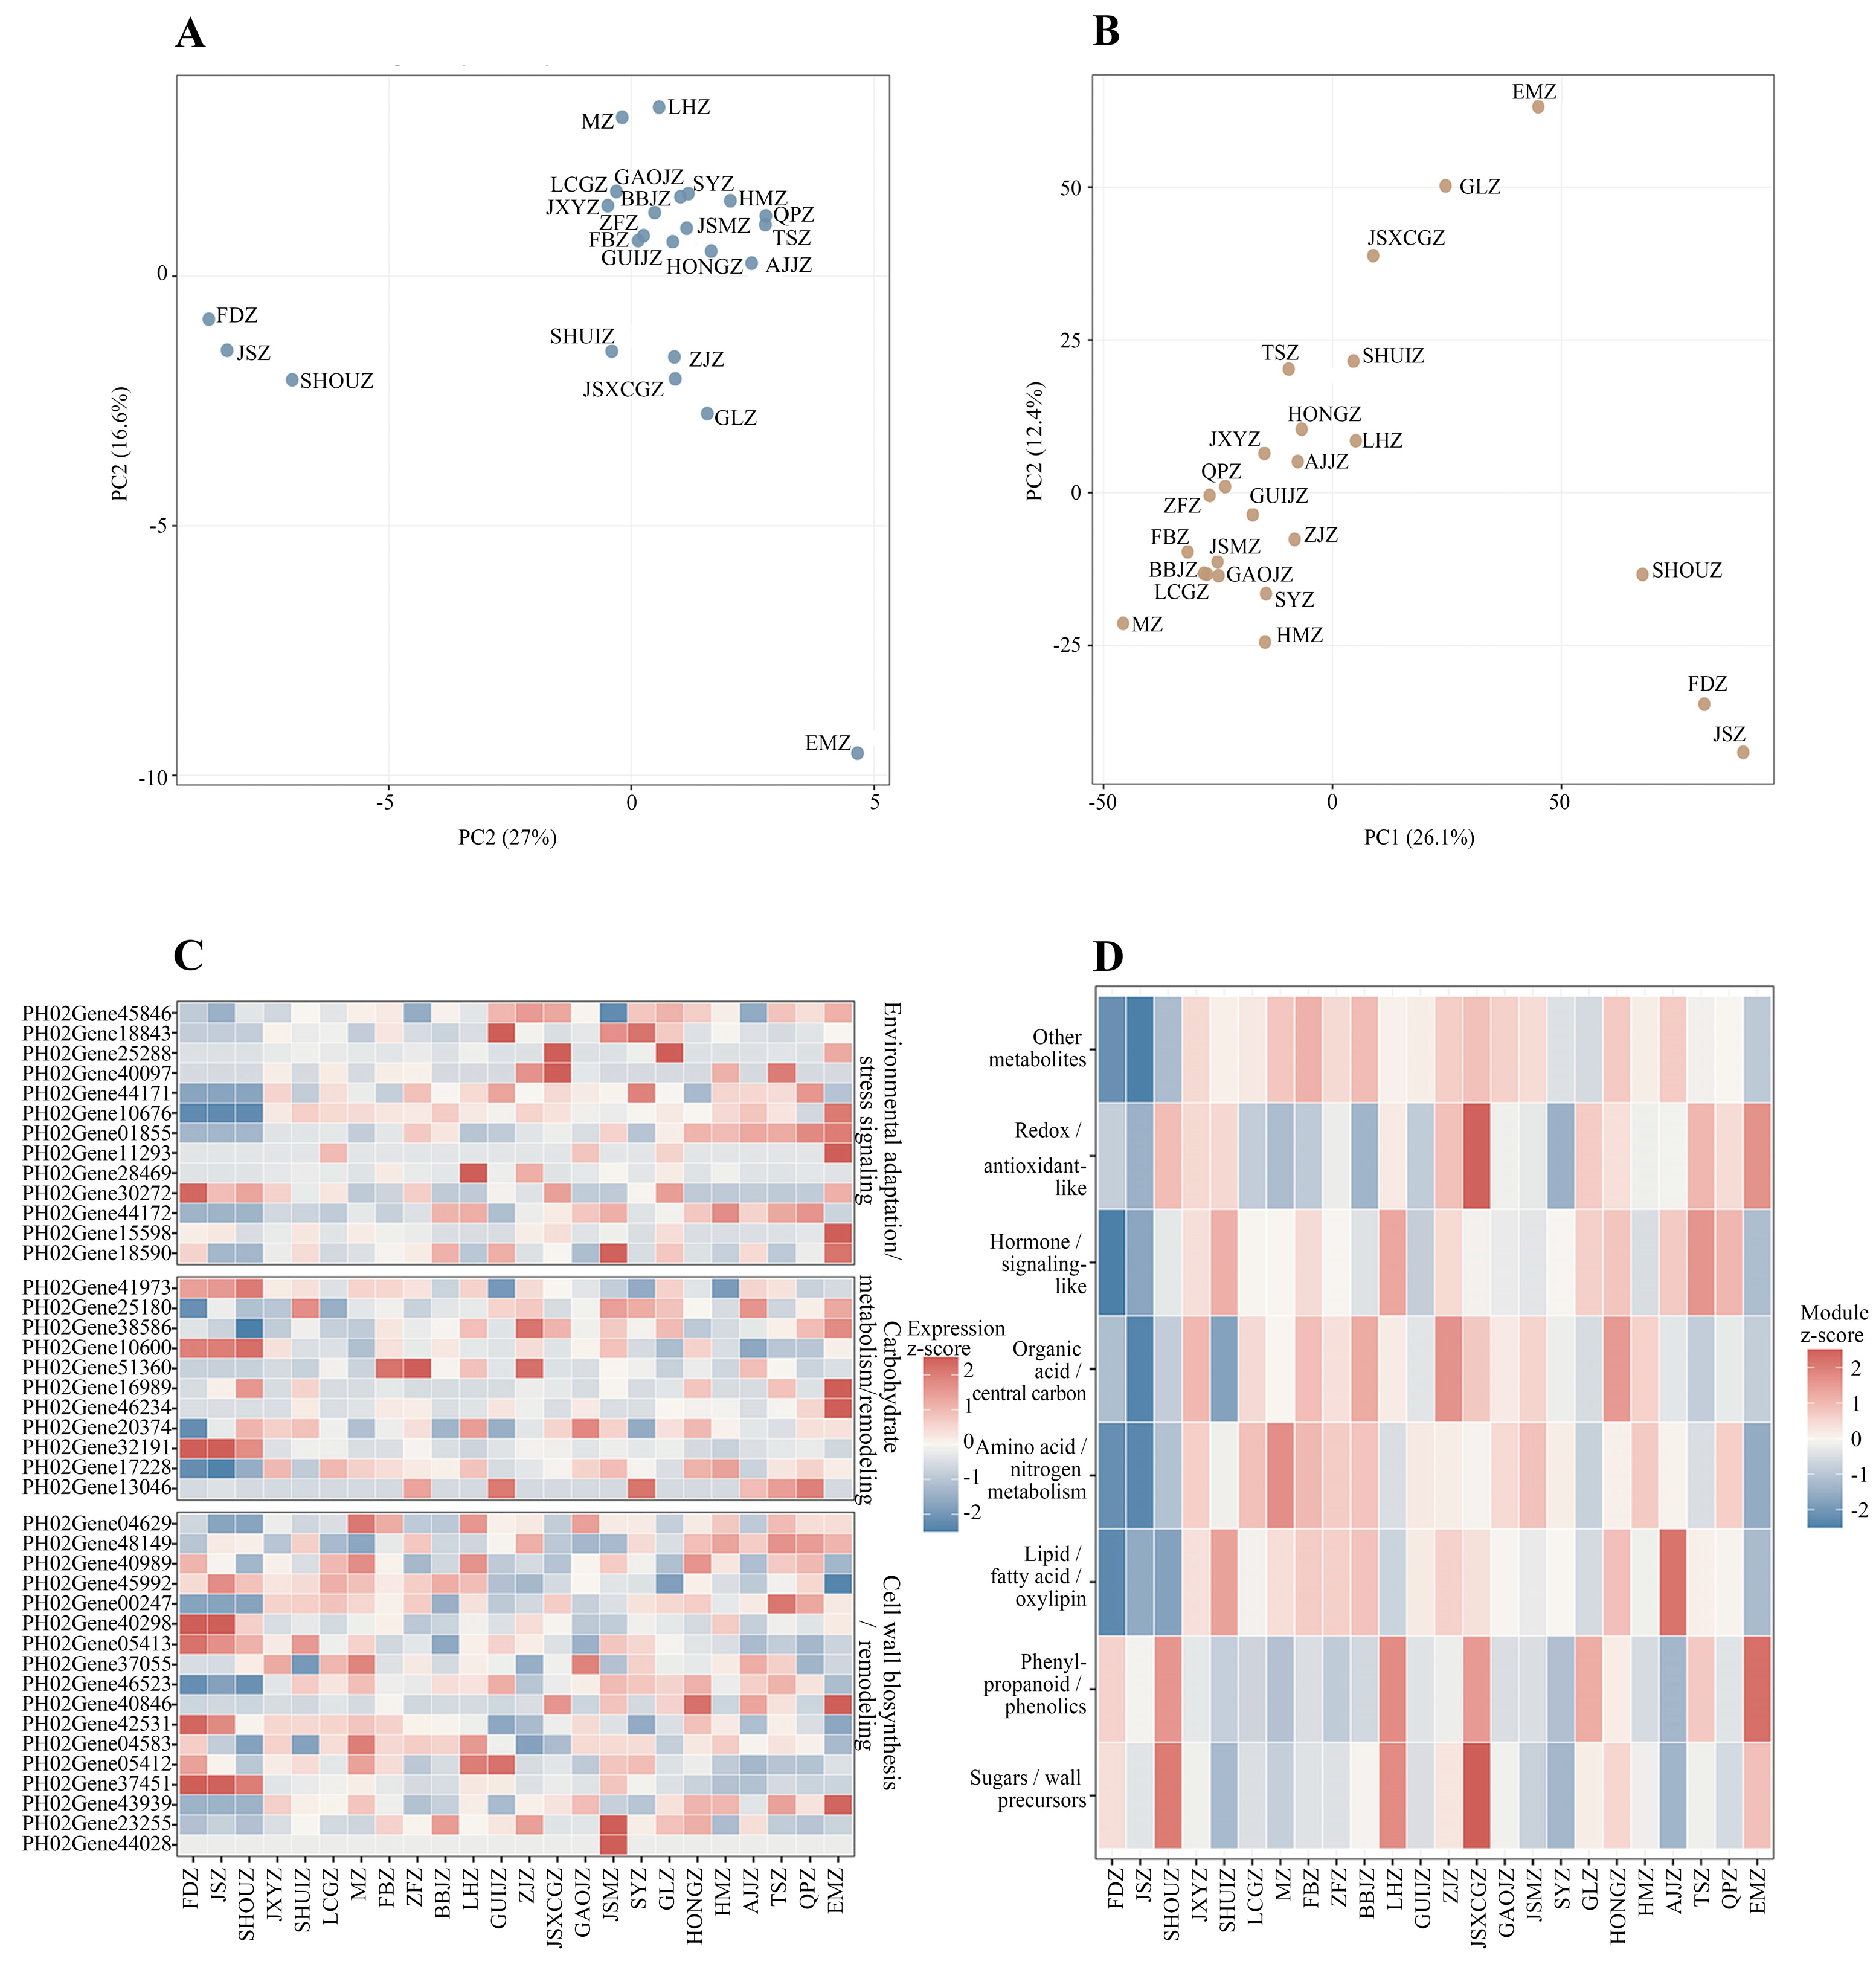
To evaluate whether the prioritized candidates were connected with bamboo shoot metabolic variation, all 44 C1/C2 candidates were retained as the background candidate pool for multi-species shoot transcriptome–metabolome integration. Candidate gene expression from multi_shoot_fpkm was summarized across 32 bamboo shoot variables, among which 41 candidate genes showed non-zero expression variance. The non-targeted metabolome contained 32 shoot variables, and 5059 metabolites were retained after filtering for cross-sample representation and abundance variation. A total of 24 matched shoot variables were shared between the transcriptome and metabolome matrices and were used for integration (Supplementary Table S4).
PCA of the candidate gene expression matrix separated bamboo shoot samples along the first two principal components, with PC1 and PC2 explaining 27.0% and 16.6% of the variance, respectively (Figure 6A). Metabolome PCA also separated samples, with PC1 and PC2 explaining 26.1% and 12.4% of the variance, respectively (Figure 6B). These results indicate that candidate gene expression and metabolite accumulation both captured inter-sample variation among bamboo shoots, although the two omics layers did not show identical separation patterns.
The expression heatmap showed that the three functional modules displayed distinct patterns across bamboo shoot samples (Figure 6C). Cell wall-related candidates showed sample-dependent variation, especially genes assigned to the IRX/xylan/XTH/CSLA, CCR/laccase, pectin-related, peroxidase and expansin families. Carbohydrate allocation genes also varied among samples, suggesting differences in sugar transport, sucrose cleavage, starch turnover, PPP activity and activated sugar precursor supply. Environmental/stress-related genes displayed additional variation, indicating potential roles in receptor-like kinase signaling, immune response, hormone-related growth regulation and redox homeostasis.
Non-targeted metabolites were grouped into broad functional modules to improve biological interpretability. Of the retained metabolites, 796 were assigned to the lipid/fatty acid/oxylipin module, 467 to sugars/wall precursors, 337 to organic acid/central carbon metabolism, 278 to amino acid/nitrogen metabolism, 171 to phenylpropanoid/phenolics, 67 to redox/antioxidant-like metabolites, and three to hormone/signaling-like metabolites, while 2940 remained in the broader “other metabolites” category (Figure 6D; Supplementary Table S5). The metabolite-module heatmap showed that bamboo shoot samples were metabolically reorganized across these modules, providing metabolite-level readouts related to carbon availability, wall precursor supply, lipid/oxylipin signaling, phenylpropanoid metabolism, and oxidative regulation.

3.7. Gene–Metabolite Coupling Identifies Multi-Omics-Supported Candidates

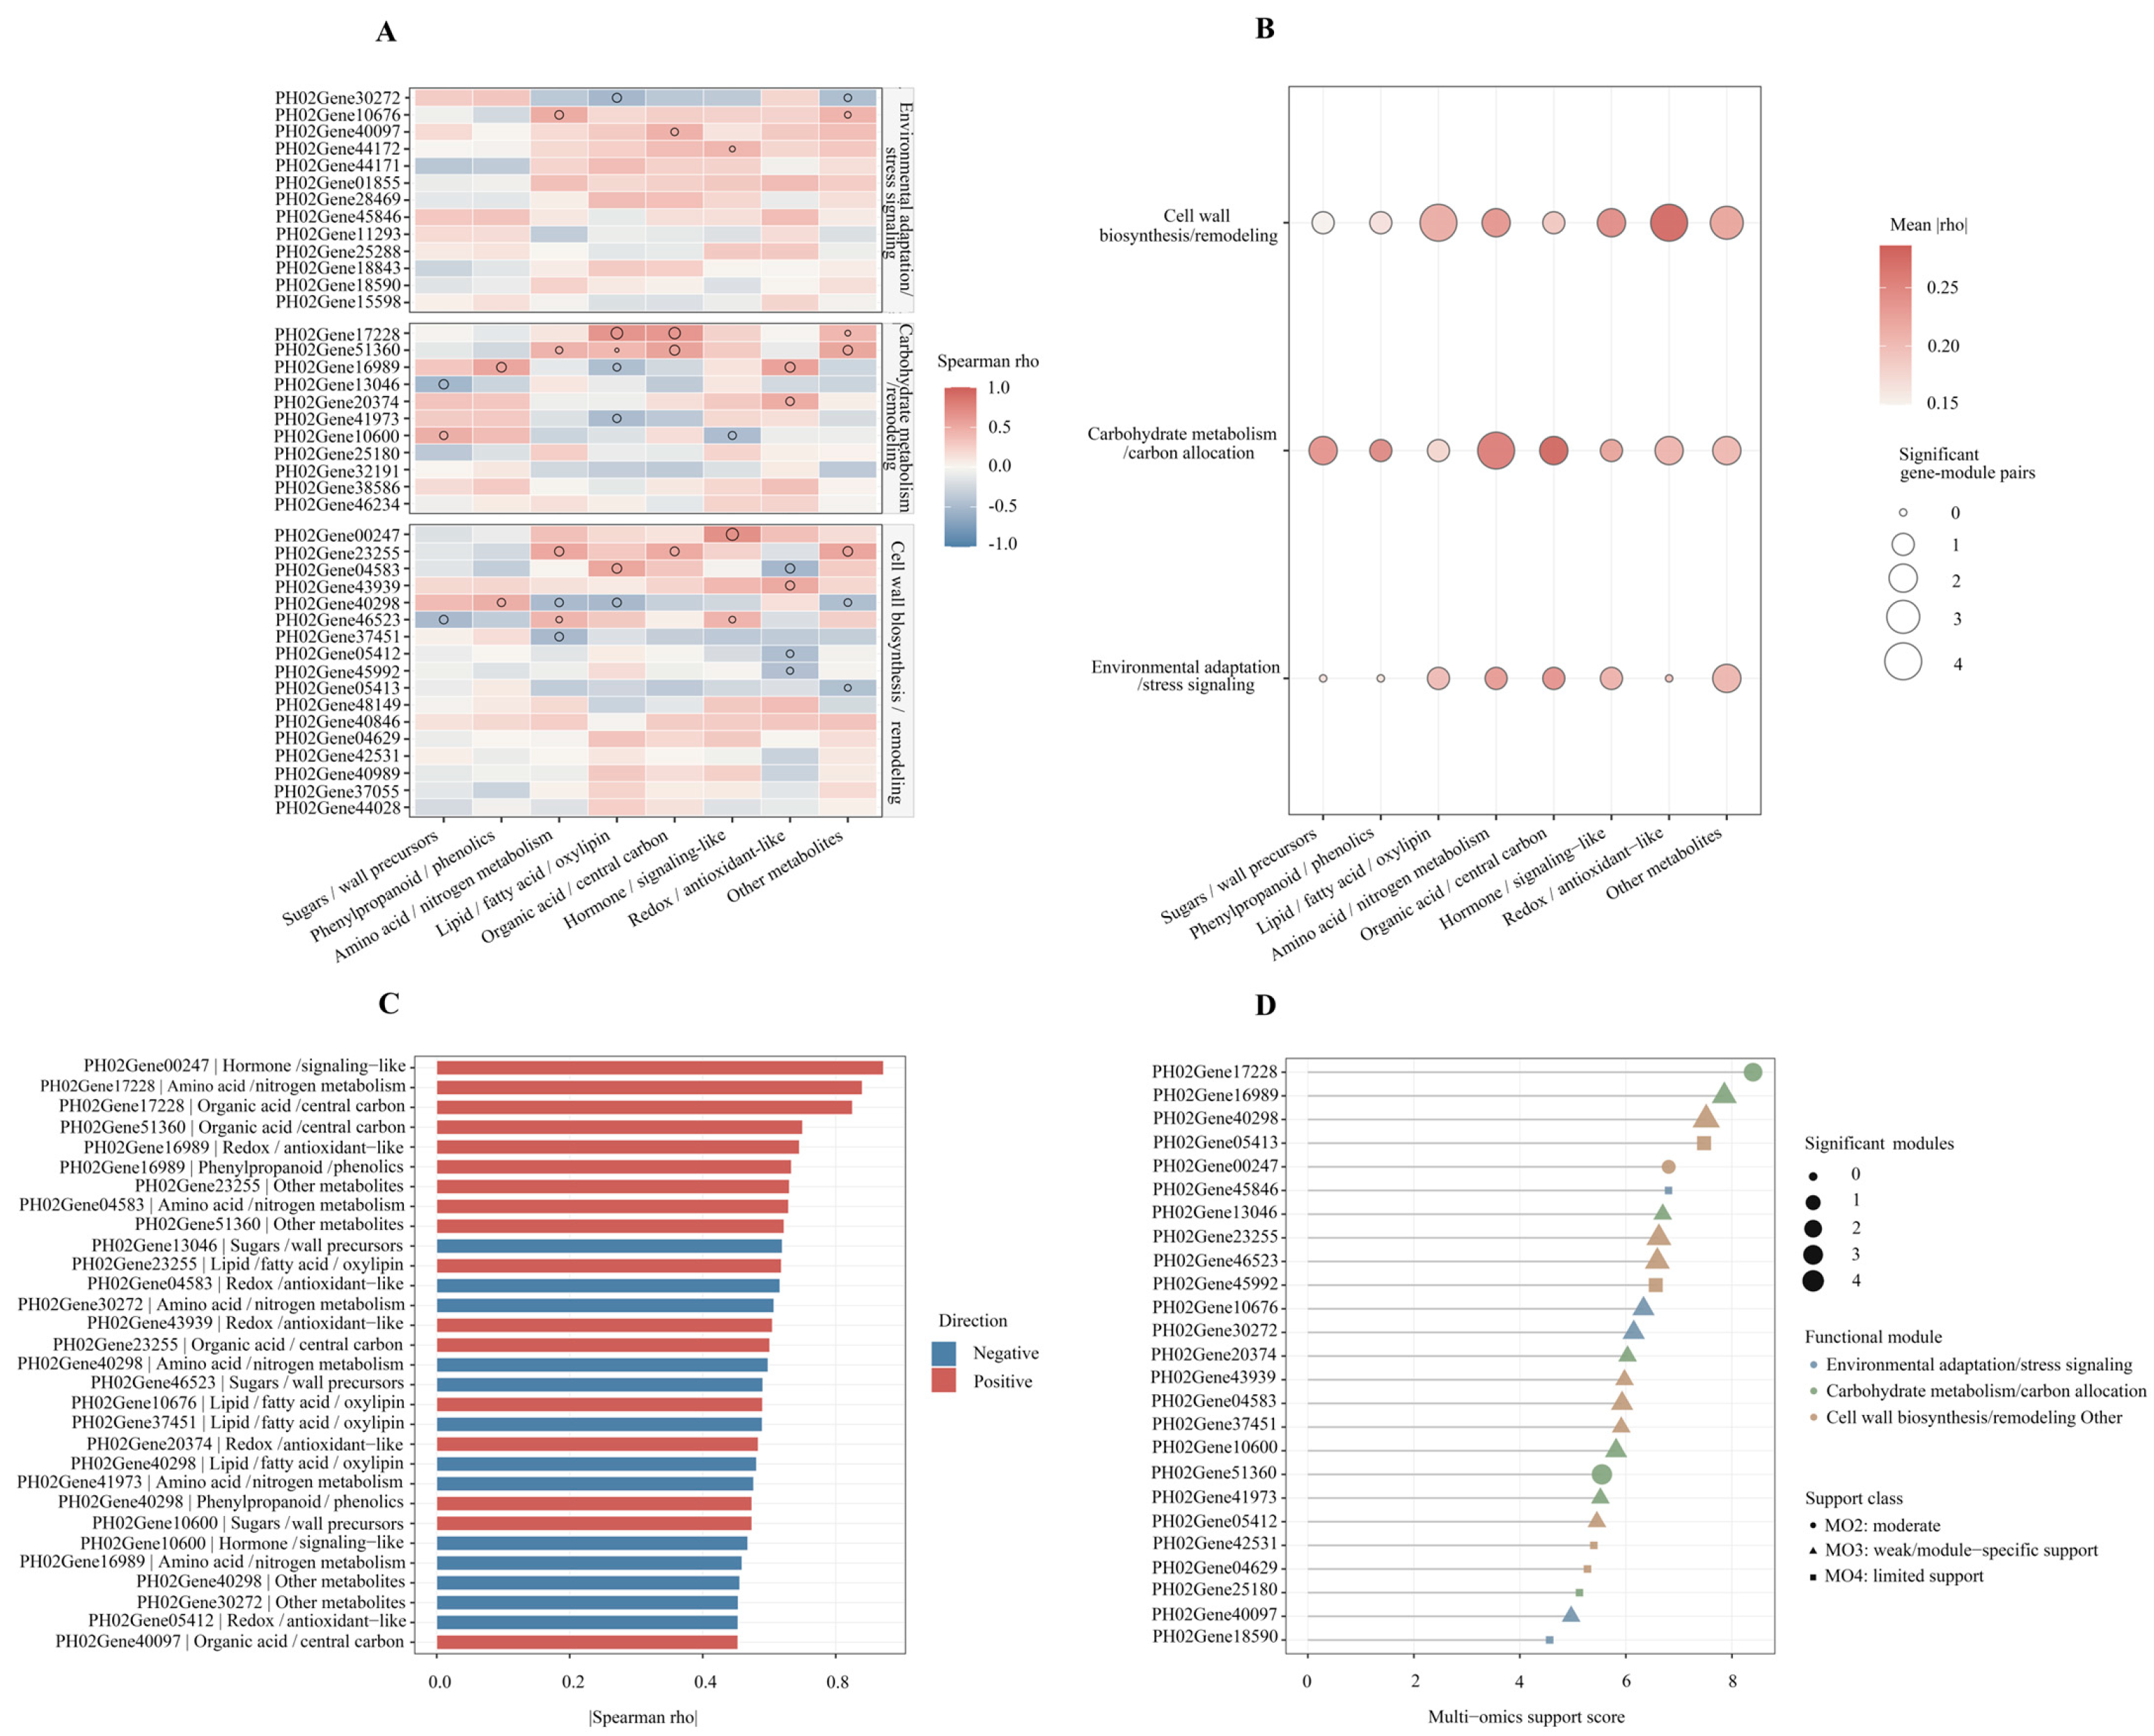
To identify candidates with multi-omics support, Spearman correlations were calculated between expression levels of the 41 variable candidate genes and eight metabolite-module scores across matched bamboo shoot samples. This produced 328 gene–metabolite module pairs. Among them, 39 pairs were significant at p < 0.05, three pairs remained significant after module-wise FDR correction, four pairs showed |rho| ≥ 0.55, and one pair showed |rho| ≥ 0.65 (Figure 7A; Supplementary Table S4). These results indicate that only a subset of the candidate genes showed strong metabolite-module coupling, supporting a conservative prioritization of multi-omics-supported candidates.
The significant correlations were distributed across all three functional layers (Figure 7B). Carbohydrate metabolism/carbon allocation genes showed multiple associations with amino acid/nitrogen metabolism, sugars/wall precursors, organic acid/central carbon, and redox/antioxidant-like modules. Cell wall biosynthesis/remodeling genes were linked with modules related to wall precursors, phenylpropanoid/phenolics, central carbon metabolism, redox regulation, and hormone/signaling-like metabolites. Environmental adaptation/stress signaling genes were associated with lipid/fatty acid/oxylipin, amino acid/nitrogen, organic acid/central carbon, and hormone/signaling-like modules. These module-level associations suggest that the candidate genes are connected with metabolic variation related to carbon allocation, wall construction, and adaptive regulation.
Multi-omics ranking classified three genes as MO2 moderate multi-omics-supported candidates, 15 genes as MO3 weak/module-specific candidates, and 23 genes as MO4 limited-support candidates; no candidate reached the most stringent MO1 threshold under the current criteria (Figure 7D). The three MO2 candidates were PH02Gene17228, PH02Gene00247, and PH02Gene51360. PH02Gene17228, a starch synthase/phosphoglucan water dikinase candidate, ranked highest overall and showed the strongest association with the amino acid/nitrogen metabolism module (rho = 0.640), with three significant metabolite-module associations, two of which remained significant after FDR correction. PH02Gene00247, a class III peroxidase candidate, showed the strongest single gene–module association, correlating with the hormone/signaling-like module (rho = 0.672) and retaining one FDR-supported association. PH02Gene51360, a sucrose synthase/fructokinase candidate, was associated with the organic acid/central carbon module (rho = 0.550) and showed four significant metabolite-module associations.
Several MO3 candidates also provided biologically meaningful links between the candidate framework and metabolite modules. The MFS sugar/inositol/UDP-galactose transporter PH02Gene16989 was associated with the redox/antioxidant-like module (rho = 0.545) and showed three significant metabolite-module associations. The expansin gene PH02Gene40298 was negatively associated with the amino acid/nitrogen metabolism module (rho = −0.498) and showed four significant associations. The IRX/xylan/XTH/CSLA candidate PH02Gene05413, which was the strongest expression-supported gene, was linked to the broader metabolite background module (rho = −0.436). The GRAS/DELLA regulator PH02Gene45846, the UDP-sugar/galactinol enzyme PH02Gene13046, the pectin-related genes PH02Gene23255 and PH02Gene46523, the CESA/CSL-like glycan synthase PH02Gene45992, the redox-related candidate PH02Gene10676, the NLR/R-type gene PH02Gene30272, and the PPP enzyme PH02Gene20374 were also among the top-ranked multi-omics candidates (Figure 7C,D; Supplementary Table S4).
Together, the transcriptome–metabolome integration refined the 44-gene panel into a smaller group of multi-omics-supported candidates. Although only three genes reached the MO2 class and no gene reached the MO1 threshold, the observed gene–metabolite module coupling provides additional evidence that selected carbohydrate allocation, cell wall remodeling and regulatory candidates are linked to shoot metabolic differentiation. These genes represent priority targets for subsequent qRT-PCR validation, tissue-specific expression analysis and functional testing.

3.8. Integrated Model of Bamboo Shoot Differentiation and Property-Related Variation

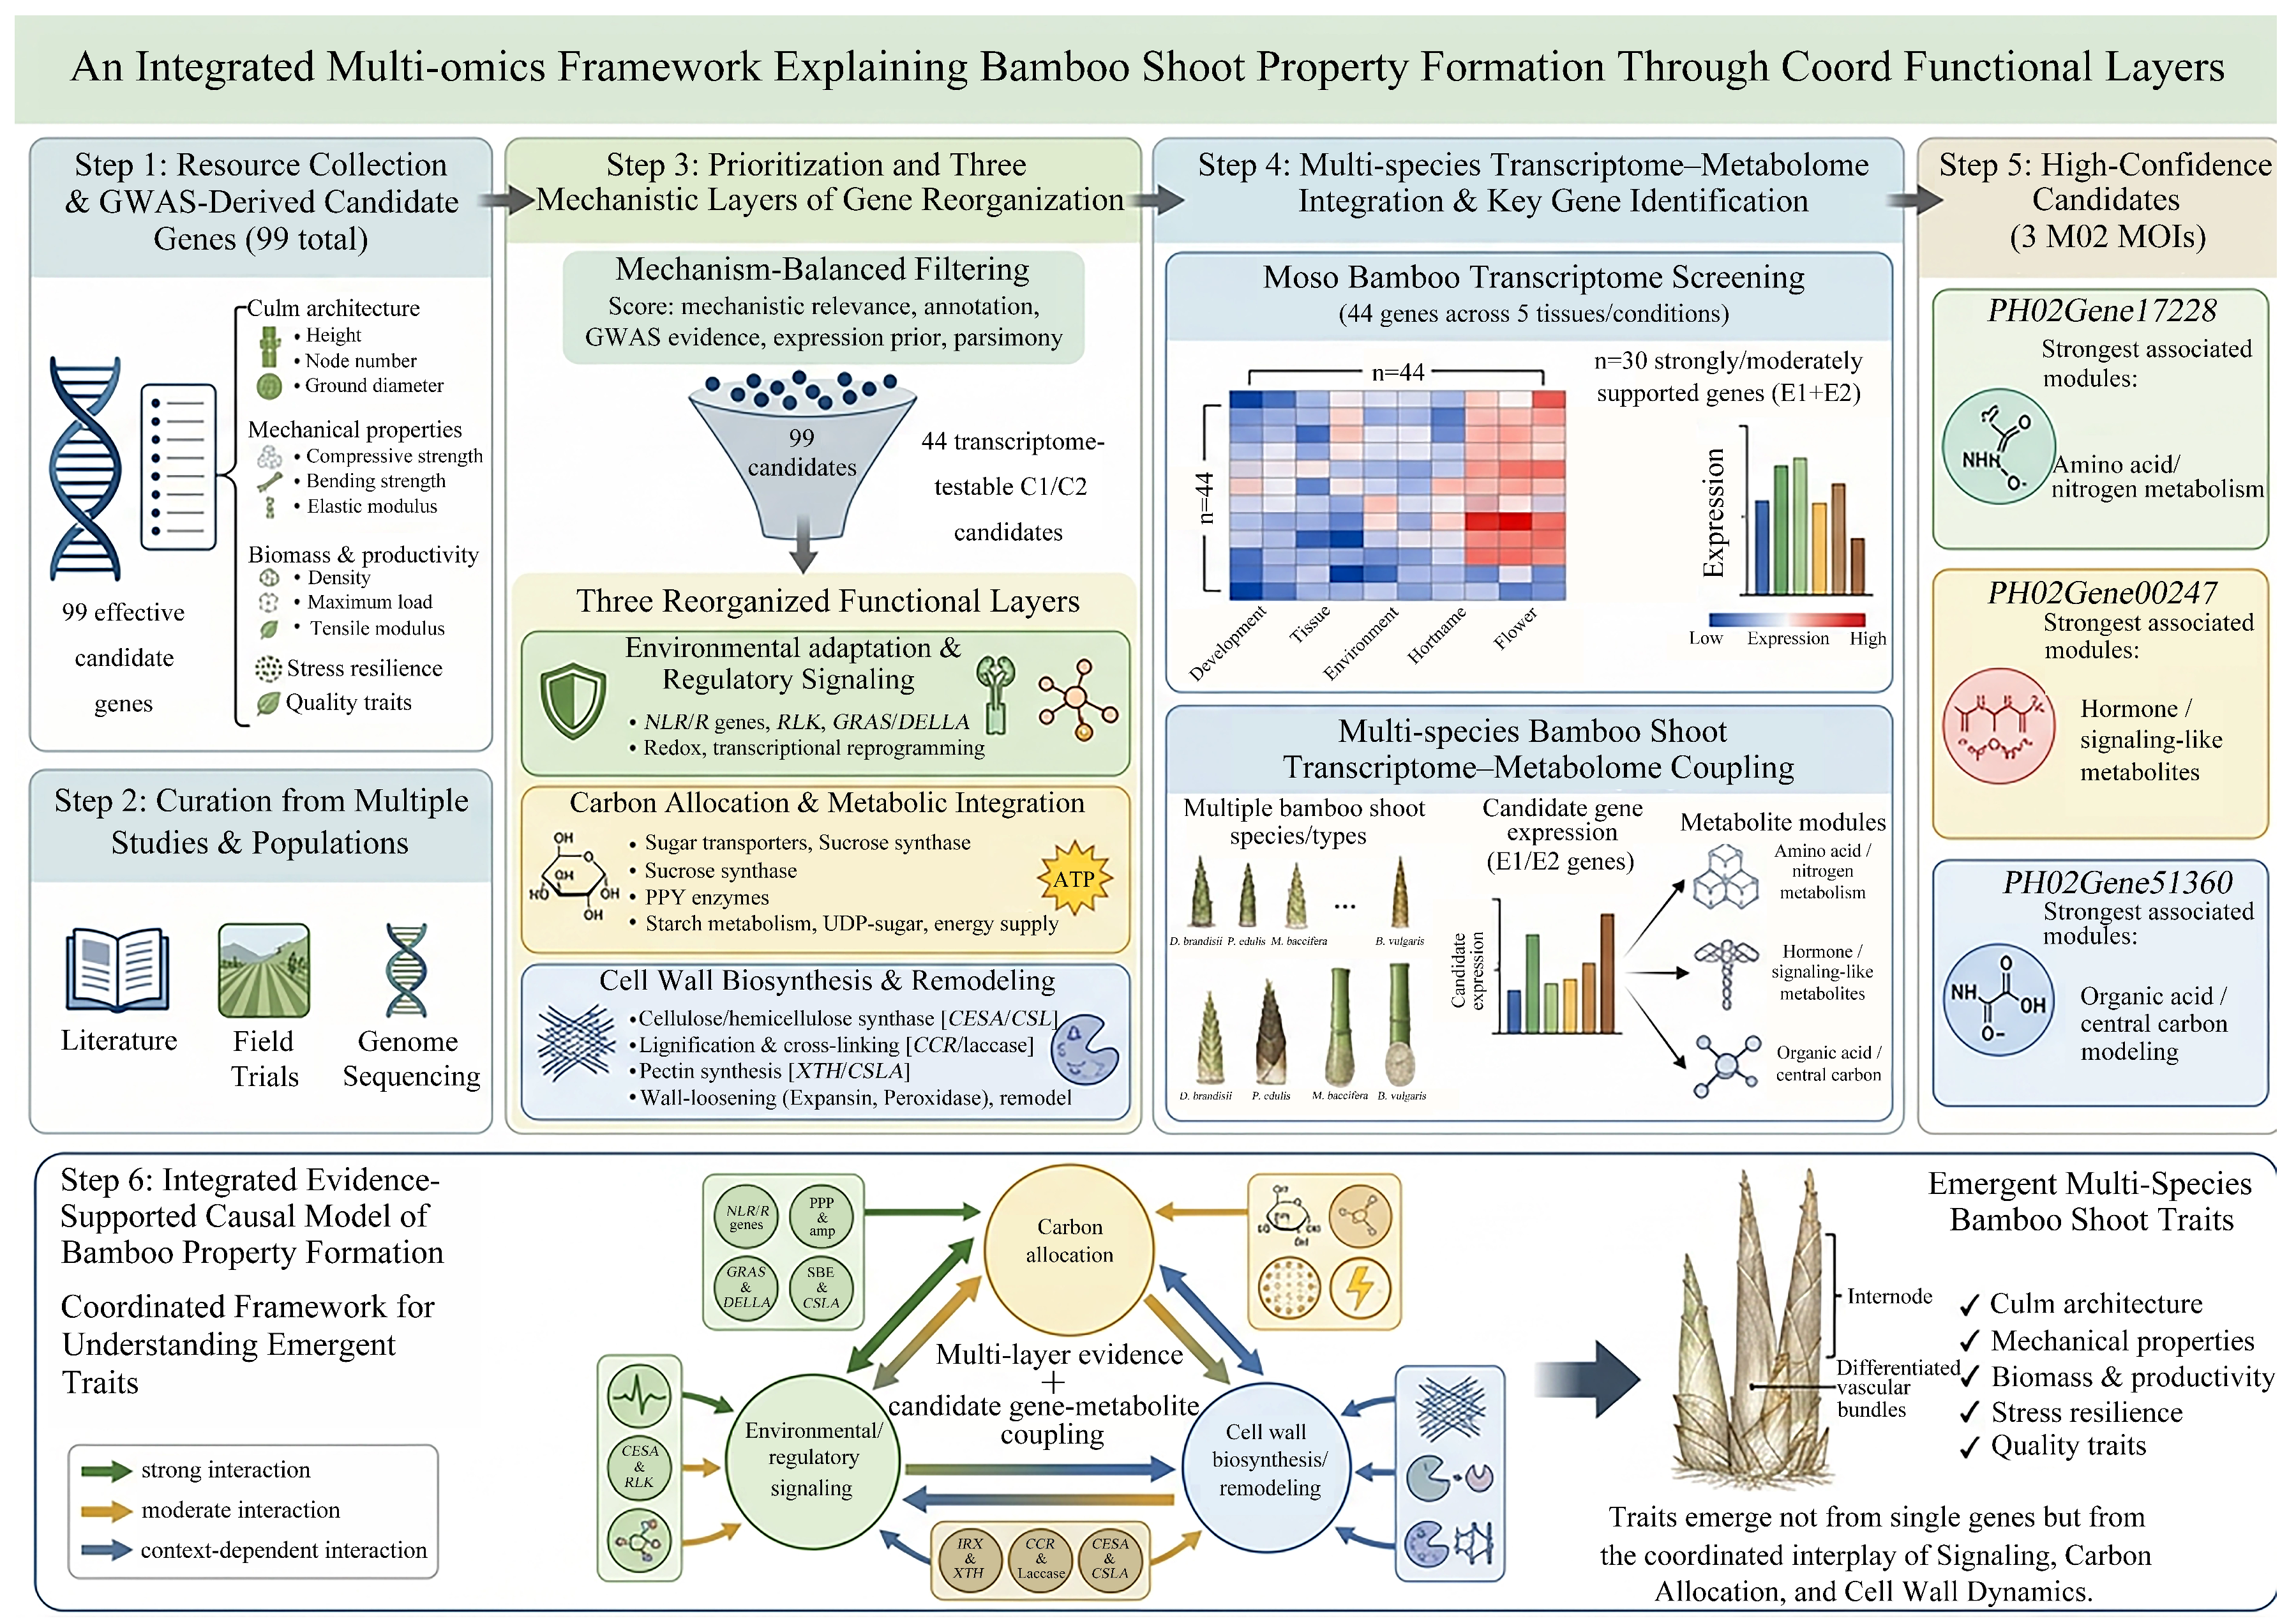
The integrated framework supports a model in which bamboo shoot differentiation and property-related variation are shaped by the coordinated activity of three biological layers (Figure 8). Environmental and regulatory genes, including NLR/R genes, RLK/FERONIA-HERK-CRK-WAK genes, GRAS/DELLA regulators and redox-related proteins, may mediate stress perception, wall-associated signaling, hormone regulation and redox balance. Carbohydrate metabolism genes, including sugar transporters, sucrose synthase/fructokinase, PPP enzymes, starch metabolism genes and UDP-sugar-related enzymes, may regulate carbon flux, energy supply, source–sink allocation and wall precursor availability. Cell wall biosynthesis/remodeling genes, including IRX/xylan/XTH/CSLA, CCR/laccase, CESA/CSL, pectin-related genes, class III peroxidases and expansins, may directly participate in cellulose, hemicellulose, pectin, and lignin formation, as well as wall loosening and oxidative cross-linking.
Thus, bamboo shoot differentiation and property-related variation are unlikely to be explained by a single structural gene class alone. Instead, the results support a coordinated model in which environmental/regulatory signaling, carbon allocation, and cell wall biosynthesis/remodeling jointly contribute to bamboo shoot growth, metabolic differentiation, and property-related trait formation.

3.9. qRT-PCR Assessment of the Top-Ranked Candidate Genes

To obtain independent expression-level support for the candidate prioritization, qRT-PCR analysis was performed for the three top-ranked genes, PH02Gene17228, PH02Gene00247, and PH02Gene51360, using developing bamboo shoot samples. Their qRT-PCR expression patterns were generally consistent with the corresponding RNA-seq profiles (Figure 9), supporting the reliability of the observed transcript-level trends.

4. Discussion

Bamboo property formation is a complex quantitative process in which genetic variation is expected to affect structural deposition, carbon allocation, and stress-responsive regulation simultaneously, rather than through a single class of cell wall genes alone. Therefore, a key challenge after identifying GWAS-derived candidates is not only to retain statistically associated genes, but also to reorganize them into a biologically interpretable framework that can guide downstream omics-based screening and functional validation.
The present candidate-prioritization framework should therefore be interpreted less as a simple reduction in candidate number and more as a stepwise conversion of a heterogeneous GWAS-derived association list into a biologically structured and experimentally testable gene panel. This is important because GWAS loci in plants often identify broad genomic regions rather than directly resolving causal genes, and post-GWAS interpretation generally requires additional biological evidence from annotation, expression, pathway context, co-expression, metabolite association, or functional validation [16,57,58]. Similar limitations have been reported in wood- and biomass-related traits, where association signals may implicate hundreds of nearby genes, but only a subset can be biologically prioritized after integration with expression, cell wall composition, metabolite, or network evidence [20,21,59]. In this study, 99 effective GWAS-derived candidate gene records were first curated from the original candidate set and then reorganized into three mechanistic layers, namely environmental adaptation/stress signaling, carbohydrate metabolism/carbon allocation, and cell wall biosynthesis/remodeling. This layered reclassification is biologically justified because bamboo shoot growth and culm property formation have repeatedly been shown to involve coordinated regulation of cell wall development, lignification, carbohydrate metabolism, hormone signaling, and stress-related regulatory pathways rather than isolated structural-gene effects alone [5,6,60,61]. For example, integrated transcriptomic and proteomic analyses of moso bamboo rapid growth identified enrichment of phytohormone signaling, carbohydrate metabolism, and cell wall development pathways, while lignification studies further showed that transcription factors, miRNAs, and enzyme genes jointly regulate lignin deposition during shoot development [6,60]. Therefore, the three-layer framework used here provides a mechanistic bridge between GWAS association signals and the biological processes most likely to determine bamboo property variation.
The mechanism-balanced procedure retained a transcriptome-testable candidate panel spanning the three functional layers, thereby avoiding exclusive selection of obvious cell wall genes and preserving structural, metabolic, and regulatory candidates for downstream evaluation. Nevertheless, the numerical score ranges and layer-specific quotas were empirically defined rather than estimated from an external training dataset or optimized using a statistical model. The resulting candidate order should therefore be interpreted as a transparent, hypothesis-oriented prioritization rather than as a definitive measure of causal probability. Alternative scoring schemes may alter the relative positions of individual candidates, although the present strategy provides a reproducible basis for organizing heterogeneous evidence and selecting candidates for subsequent experimental testing. This is a critical advantage because candidate selection based only on obvious annotation similarity would probably overemphasize cellulose, xylan, or lignin biosynthetic genes while underrepresenting upstream regulators that control carbon allocation, stress responsiveness, or developmental transitions. In bamboo, comparable evidence has been observed for NAC regulators associated with secondary cell wall biosynthesis, GT43 genes involved in xylan biosynthesis, SWEET genes involved in source–sink carbohydrate partitioning, and DREB/DIR genes linking stress signaling with growth or lignification-related processes [3,5,62,63,64]. Thus, the major contribution of the present framework is not the discovery of 99 genes per se, but the establishment of a mechanism-balanced prioritization pipeline by which a broad GWAS-derived candidate list was transformed into a tractable gene panel that can be directly tested by transcriptomic, metabolomic, and future functional-validation evidence. This framework allows bamboo property formation to be evaluated as a coordinated outcome of structural deposition, carbon allocation, and upstream environmental/stress regulation, thereby improving both the biological interpretability and experimental utility of GWAS-derived candidates.
The distribution of trait-associated candidates indicates that bamboo property traits should not be interpreted as simple outputs of a single “structural gene” class. Trait-guided mapping showed that mechanical and material traits were associated with candidates from multiple functional layers, supporting a broader architecture than a single structural-gene model. This pattern is consistent with the view that mechanical performance in lignocellulosic tissues emerges from coordinated wall composition, polymer organization, carbon allocation, and regulatory response networks rather than from cell wall biosynthetic genes alone. In bamboo and other vascular plants, cellulose microfibrils, xylan/hemicellulose, lignin, pectin, and wall-modifying proteins have been shown to jointly determine wall stiffness, extensibility, density, and load-bearing capacity; for example, bamboo culm micromechanics are strongly related to radial variation in xylan, cellulose, and lignin distribution, while lignin and xylan interactions provide a molecular basis for mechanical reinforcement [65,66,67]. Accordingly, the representation of candidates across the cell wall, carbohydrate metabolism/carbon allocation, and environmental adaptation/stress signaling layers supports a multilayer model involving both direct wall-execution genes and upstream regulatory or adaptive candidates. Notably, all seven cross-trait candidates were assigned to the environmental adaptation/stress signaling layer, suggesting that they may represent shared upstream nodes rather than trait-specific structural determinants. This interpretation is biologically plausible because plant defense and stress pathways are tightly connected with hormone signaling, redox homeostasis, lignification, and cell wall-associated immunity; NLR/R genes, redox-related proteins, GRAS/DELLA-type regulators, and hormone-responsive factors may influence wall deposition indirectly through defense–growth balance, oxidative cross-linking, and stress-induced wall remodeling [68,69,70]. In bamboo, this regulatory connection is further supported by evidence that auxin response factors can directly regulate lignin biosynthesis under mechanical bending, PeLAC10 participates in both lignification and abiotic stress response, and PePRX2 enhances lignin polymerization while improving drought tolerance [31,71,72]. Thus, Figure 2 results should be discussed as evidence for a possible regulatory contribution of adaptive/stress-related genes to multiple bamboo property dimensions, while their causal roles remain candidates for future functional validation.
By contrast, Figure 4 and Figure 5 provide the strongest expression-level support for the cell wall module as the most direct molecular execution layer of bamboo property formation. Most strongly expression-supported candidates belonged to the cell wall biosynthesis/remodeling layer. Representative genes included PH02Gene05413 and candidates related to expansin, CCR/laccase, CESA/CSL, class III peroxidase, and pectin remodeling. Their annotations collectively support coordinated roles in hemicellulose/xylan remodeling, cellulose synthesis, lignin formation, oxidative cross-linking, wall loosening, and pectin modification, consistent with established secondary-wall models [33,34,51,73,74,75,76]. Comparable bamboo studies support this interpretation: Moso bamboo shoot maturation is accompanied by increased lignin and cellulose accumulation and elevated expression of PeCESA4, PeIRX9, PeIRX10, and lignin-related genes; PeGT43 family members are associated with xylan biosynthesis during rapid growth; PePAL manipulation alters lignin content; and PeLAC10 and PePRX2 function in lignin accumulation and stress adaptation [31,32,71,77,78]. Therefore, the most conservative and mechanistically appropriate conclusion is that cell wall biosynthesis and remodeling genes constitute the most consistently expression-supported execution module for bamboo property traits, whereas environmental/stress-signaling genes may act as shared upstream regulatory candidates linking mechanical performance with adaptive and developmental regulation.
The carbohydrate metabolism/carbon allocation module should be interpreted as a metabolic bridge connecting rapid shoot growth with the carbon demand of structural wall formation. This interpretation is strongly supported by previous bamboo studies showing that rapid shoot elongation is accompanied by exceptional cell production and secondary-wall deposition; in Phyllostachys edulis, rapid growth reached 114.5 cm day−1, with approximately 28 mg g−1 DW lignin and 44 mg g−1 DW cellulose deposited daily in the representative fast-growing internode [1]. Similar physiological and omics studies have shown that non-structural carbohydrates are mobilized from mature ramets and rhizome-connected tissues to young shoots, while sugar/starch metabolism, sucrose metabolism, glycolysis, the pentose phosphate pathway, TCA cycle and oxidative phosphorylation are activated during bamboo shoot growth [5,79,80,81]. More broadly, plant cell walls are major carbon sinks, and wall polysaccharide synthesis depends on carbon supply, UDP-glucose/nucleotide sugars, sucrose cleavage, sugar transport and energy status; therefore, carbon allocation is increasingly regarded not only as a background metabolic process but also as an upstream determinant of wall synthesis and remodeling [82,83,84]. Expression-supported candidates related to sugar transport, starch turnover, the pentose phosphate pathway, sucrose metabolism, and UDP-sugar supply were consistent with the proposed metabolic-bridge function of this layer. The associations of PH02Gene17228 and PH02Gene51360 with amino acid/nitrogen and organic acid/central carbon modules, respectively, suggest coordination between carbon allocation, nitrogen-associated growth, and energy metabolism rather than direct regulatory control. These relationships support a broader metabolic interface linking central carbon metabolism with structural wall-precursor supply. Comparable transcriptome–metabolome studies in bamboo have also shown that carbohydrate metabolism is closely associated with postharvest shoot quality, xylan biosynthesis, lignification and secondary wall-related metabolic shifts, further supporting the relevance of this module to bamboo material traits [85,86,87].
In contrast, the environmental adaptation/stress signaling module should be interpreted as an upstream regulatory or adaptive layer rather than as a direct determinant of bamboo mechanical strength. The inclusion of NLR/R-type, receptor-like kinase, GRAS/DELLA, and redox-related candidates, together with the concentration of cross-trait candidates in this layer, suggests possible shared roles in stress perception, immune-growth balance, wall-integrity sensing, and developmental regulation. This interpretation is consistent with cell wall integrity theory, in which receptor-like kinases such as FERONIA, THESEUS, and WAK-related proteins are involved in sensing cell wall status, mechanical perturbation, and stress-induced wall remodeling during growth [88,89,90]. It is also consistent with the broader view that NLR proteins are primarily immune receptors and that NLR-mediated resistance can impose growth or fitness costs, implying a possible immune-growth trade-off rather than a simple direct effect on wall strength [91,92,93]. Although PH02Gene45846, PH02Gene10676, and PH02Gene30272 showed only moderate or weak multi-omics support, their annotations remain compatible with upstream roles in hormone signaling, redox regulation, and immune-growth balance. Therefore, these environmental/stress genes are better described as candidate upstream modulators whose effects on bamboo property traits may occur through immune-growth balance, hormone signaling, wall integrity sensing, ROS homeostasis, or stress-conditioned developmental regulation. This interpretation is further supported by ROS literature showing that redox signals and peroxidase-related processes can contribute to cell wall stiffening, loosening, lignification, and stress-responsive wall remodeling, but that these processes are context-dependent and require functional validation [94,95,96]. The metabolite modules further separated lipid/fatty acid/oxylipin metabolites, sugars/wall precursors, organic acid/central carbon metabolites, amino acid/nitrogen metabolism, phenylpropanoid/phenolics, redox/antioxidant-like metabolites, and hormone/signaling-like compounds. Because these modules were constructed using broad annotation-based keyword rules, they should be interpreted as functional summaries rather than definitive pathway assignments. Nevertheless, among 328 gene–module pairs, only 39 reached p < 0.05, only three were FDR-supported, four showed |rho| ≥ 0.55, one showed |rho| ≥ 0.65, and no candidate reached MO1. The three MO2 genes—PH02Gene17228, PH02Gene00247 and PH02Gene51360—should therefore be treated as conservative priority candidates rather than causal regulators. The relatively small number of FDR-supported gene–module associations indicates that the multi-omics analysis should be interpreted as a prioritization layer rather than direct evidence of causal regulation. Cross-species integration also assumes sufficient orthology and functional comparability among the four bamboo species. Because shoots of similar height may not represent identical developmental stages across species, part of the observed variation may reflect evolutionary divergence or imperfect developmental-stage matching [97,98]. The qRT-PCR results provided independent support for the transcript-level patterns of the three MO2 candidates but did not validate the inferred gene–metabolite relationships or establish their causal roles in bamboo property-related traits.
Taken together, these findings support a coordinated model in which bamboo shoot differentiation and property-related variation are associated with environmental/regulatory signaling, carbon allocation, and cell wall biosynthesis/remodeling rather than with a single structural gene class alone (Figure 8). The three-layer candidate framework and the 44 C1/C2 gene panel indicate that GWAS-derived signals associated with bamboo property traits can be organized into structural, metabolic, and regulatory components. Trait-guided mapping further showed that mechanical traits, especially compressive strength and density, were associated with multiple functional modules, suggesting a multilayer genetic basis for bamboo material formation. Expression screening provided the strongest support for cell wall biosynthesis/remodeling genes, indicating that cellulose, hemicellulose, pectin, lignin deposition, oxidative cross-linking, and wall loosening likely represent the major execution layer of property formation [81,99]. In parallel, carbohydrate metabolism/carbon allocation genes may provide sugars, energy, UDP-sugar precursors, and central carbon flux required for rapid shoot growth and structural wall construction, whereas environmental/regulatory genes may contribute upstream signals related to stress perception, hormone regulation, ROS homeostasis, and cell wall integrity sensing. The multi-species transcriptome–metabolome analysis further linked selected candidates with metabolite modules, with MO2 candidates covering carbohydrate metabolism, cell wall modification and central metabolism/signaling-related modules. Therefore, the integrated model should be viewed as an evidence-supported working hypothesis: bamboo shoot growth and property-related variation are likely shaped by the coordinated coupling of regulatory signaling, metabolic allocation and wall remodeling [100]. However, because the multi-omics associations are primarily correlative, this model identifies priority candidate nodes for future tissue-specific expression analysis, genetic transformation, and functional assays rather than providing direct causal proof.

5. Conclusions

This study established a stepwise framework for prioritizing genes associated with bamboo property-related variation by integrating previously reported GWAS-derived candidates with large-scale moso bamboo transcriptome screening, matched multi-species bamboo shoot transcriptome–metabolome data, and qRT-PCR analysis. Of the 99 curated GWAS-derived candidates, 44 were retained for transcriptomic evaluation, and 30 showed strong or moderate expression support. The results support a three-layer working model in which environmental adaptation and regulatory signaling provide upstream regulation, carbohydrate metabolism and carbon allocation supply energy and cell wall precursors, and cell wall biosynthesis and remodeling contribute directly to structural formation. Cell wall-related genes showed the broadest transcriptional responses, whereas carbohydrate- and regulatory-related candidates provided complementary metabolic and upstream evidence. Integrated gene–metabolite association analysis prioritized PH02Gene17228, PH02Gene00247, and PH02Gene51360, which were associated with amino acid/nitrogen metabolism, hormone- and signaling-related metabolites, and organic acid/central carbon metabolism, respectively. Their qRT-PCR expression patterns were generally consistent with the corresponding RNA-seq profiles, providing independent transcript-level support for their prioritization. However, because this study relies on previously reported GWAS candidates without fine mapping, cross-species data integration, and correlation-based gene–metabolite associations, the proposed framework should be interpreted as hypothesis-generating rather than as evidence of direct causality. Further genetic, biochemical, and tissue-specific analyses will be required to establish the functions of these candidates and assess their potential value for marker development and molecular improvement of bamboo culm quality and material properties.

Supplementary Materials

The following supporting information can be downloaded at: https://www.mdpi.com/article/10.3390/horticulturae12081030/s1, Table S1: Curation, annotation, and functional classification of the 99 GWAS-derived candidate genes; Table S2: Integrated multi-omics prioritization scores and module assignments for the candidate genes; Table S3: Transcriptome expression profiles and responsiveness evaluation of the candidate genes across bamboo shoot development; Table S4: Detailed multi-omics evidence and prioritization metrics for the finalized 44-gene panel; Table S5: Final validation rank scores and multi-omics priority summary of key candidate genes.

Author Contributions

S.S.: Conceptualization, Methodology, Resources, Writing—review and editing, Supervision, Project administration, Funding acquisition. C.X.: Methodology, Software, Validation, Formal analysis, Investigation, Data curation, Writing—original draft, Visualization. J.L. (Jingjing Long): Software, Validation, Formal analysis, Investigation, Writing—original draft, Visualization. T.L.: Methodology, Validation, Formal analysis, Investigation, Writing—original draft. Y.S.: Validation, Investigation. R.L.: Investigation, Data curation. Y.W.: Validation, Data curation. S.Z.: Validation, Formal analysis, Investigation, Resources. J.L. (Jiahe Li): Validation, Investigation, Data curation. W.Z.: Validation, Investigation, Data curation. J.L. (Jiayu Liu): Investigation, Data curation. W.L.: Investigation, Data curation. Z.X.: Investigation, Data curation. F.T.: Resources, Investigation (Fieldwork). H.Z.: Resources, Investigation (Fieldwork). S.C.: Writing—review and editing, Supervision. P.D.: Validation, Investigation. H.W.: Validation, Data curation. All authors have read and agreed to the published version of the manuscript.

Funding

This work was financially supported by the Seed Industry Special Project of Yuelushan Laboratory (Grant No. YLS-2025-ZY01007), the Natural Science Foundation of Hunan Province (Grant No. 2025JJ60906), and the Hunan Forestry Science and Technology Innovation Project (Grant No. XLK202455). All the funding was acquired by Song Sheng.

Data Availability Statement

The original contributions presented in this study are included in the article. Further inquiries can be directed to the corresponding author.

Acknowledgments

We would like to thank the teachers in our laboratory for providing useful discussions and technical assistance.

Conflicts of Interest

Author Hong Zeng was employed by the company Hunan Zihong Ecological Technology Company limited. The remaining authors declare that the research was conducted in the absence of any commercial or financial relationships that could be construed as a potential conflict of interest.

References

  1. Chen, M.; Guo, L.; Ramakrishnan, M.; Fei, Z.; Vinod, K.K.; Ding, Y.; Jiao, C.; Gao, Z.; Zha, R.; Wang, C.; et al. Rapid growth of Moso bamboo (Phyllostachys edulis): Cellular roadmaps, transcriptome dynamics, and environmental factors. Plant Cell 2022, 34, 3577–3610. [Google Scholar] [CrossRef] [Scilit] [PubMed]
  2. Guo, L.; Wang, C.; Chen, J.; Ju, Y.; Yu, F.; Jiao, C.; Fei, Z.; Ding, Y.; Wei, Q. Cellular differentiation, hormonal gradient, and molecular alternation between the division zone and the elongation zone of bamboo internodes. Physiol. Plant. 2022, 174, e13774. [Google Scholar] [CrossRef] [Scilit] [PubMed]
  3. Gu, X.; Peng, J.; Ou, Q.; Chen, S.; Feng, W.; Huang, Y.; Deng, B.; Cao, Y.; Hu, S. Dendrocalamus farinosus SWEET14 is involved in source–sink carbohydrate partitioning. J. Exp. Bot. 2025, 76, 2727–2742. [Google Scholar] [CrossRef] [Scilit]
  4. He, C.; Cui, K.; Zhang, J.G.; Duan, A.; Zeng, Y. Next-generation sequencing-based mRNA and microRNA expression profiling analysis revealed pathways involved in the rapid growth of developing culms in Moso bamboo. BMC Plant Biol. 2013, 13, 119. [Google Scholar] [CrossRef] [Scilit] [PubMed]
  5. Lan, Y.; Wu, L.; Wu, M.; Liu, H.; Gao, Y.; Zhang, K.; Xiang, Y. Transcriptome analysis reveals key genes regulating signaling and metabolic pathways during the growth of moso bamboo (Phyllostachys edulis) shoots. Physiol. Plant. 2021, 172, 91–105. [Google Scholar] [CrossRef] [Scilit] [PubMed]
  6. Yang, K.; Li, L.; Lou, Y.; Zhu, C.; Li, X.; Gao, Z. A regulatory network driving shoot lignification in rapidly growing bamboo. Plant Physiol. 2021, 187, 900–916. [Google Scholar] [CrossRef] [Scilit] [PubMed]
  7. Lin, F.Y.; Williams, B.; Thangella, P.A.V.; Ladak, A.; Schepmoes, A.; Olivos, H.J.; Zhao, K.; Callister, S.J.; Bartley, L. Proteomics coupled with metabolite and cell wall profiling reveal metabolic processes of a developing rice stem internode. Front. Plant Sci. 2017, 8, 1134. [Google Scholar] [CrossRef] [Scilit] [PubMed]
  8. Zhang, Q.; Cheetamun, R.; Dhugga, K.S.; Rafalski, J.A.; Tingey, S.V.; Shirley, N.J.; Taylor, J.; Hayes, K.; Beatty, M.; Bacic, A.; et al. Spatial gradients in cell wall composition and transcriptional profiles along elongating maize internodes. BMC Plant Biol. 2014, 14, 27. [Google Scholar] [CrossRef] [Scilit] [PubMed]
  9. Zhang, Y.; Legland, D.; El Hage, F.; Devaux, M.; Guillon, F.; Reymond, M.; Méchin, V. Changes in cell walls lignification, feruloylation and p-coumaroylation throughout maize internode development. PLoS ONE 2019, 14, e0219923. [Google Scholar] [CrossRef] [Scilit] [PubMed]
  10. Handakumbura, P.; Hazen, S. Transcriptional regulation of grass secondary cell wall biosynthesis: Playing catch-up with Arabidopsis thaliana. Front. Plant Sci. 2012, 3, 74. [Google Scholar] [CrossRef] [Scilit] [PubMed]
  11. Nakano, Y.; Yamaguchi, M.; Endo, H.; Rejab, N.A.; Ohtani, M. NAC-MYB-based transcriptional regulation of secondary cell wall biosynthesis in land plants. Front. Plant Sci. 2015, 6, 288. [Google Scholar] [CrossRef] [Scilit] [PubMed]
  12. Xiao, R.; Zhang, C.; Guo, X.; Li, H.; Lu, H. MYB transcription factors and its regulation in secondary cell wall formation and lignin biosynthesis during xylem development. Int. J. Mol. Sci. 2021, 22, 3560. [Google Scholar] [CrossRef] [Scilit] [PubMed]
  13. Zhong, R.; Lee, C.; McCarthy, R.L.; Reeves, C.K.; Jones, E.G.; Ye, Z.H. Transcriptional activation of secondary wall biosynthesis by rice and maize NAC and MYB transcription factors. Plant Cell Physiol. 2011, 52, 1856–1871. [Google Scholar] [CrossRef] [Scilit] [PubMed]
  14. Alseekh, S.; Kostova, D.; Bulut, M.; Fernie, A.R. Genome-wide association studies: Assessing trait characteristics in model and crop plants. Cell. Mol. Life Sci. 2021, 78, 5743–5754. [Google Scholar] [CrossRef] [Scilit] [PubMed]
  15. Nandi, S.; Varotariya, K.; Luhana, S.; Kyada, A.D.; Saha, A.; Roy, N.; Sharma, N.; Rambabu, D. GWAS for identification of genomic regions and candidate genes in vegetable crops. Funct. Integr. Genom. 2024, 24, 78. [Google Scholar] [CrossRef] [Scilit] [PubMed]
  16. Tibbs Cortes, L.; Zhang, Z.; Yu, J. Status and prospects of genome-wide association studies in plants. Plant Genome 2021, 14, 20077. [Google Scholar] [CrossRef] [Scilit] [PubMed]
  17. Zhao, H.; Sun, S.; Ding, Y.; Wang, Y.; Yue, X.; Du, X.; Wei, Q.; Fan, G.; Sun, H.; Lou, Y.; et al. Analysis of 427 genomes reveals moso bamboo population structure and genetic basis of property traits. Nat. Commun. 2021, 12, 5460. [Google Scholar] [CrossRef] [Scilit] [PubMed]
  18. Del Giudice, L.; Bazakos, C.; Vassiliou, M. Study of genetic variation and its association with tensile strength among bamboo species through whole genome resequencing. Front. Plant Sci. 2022, 13, 935751. [Google Scholar] [CrossRef] [Scilit] [PubMed]
  19. Liu, Y.; Zhu, C.; Yue, X.; Lin, Z.; Li, H.; Di, X.; Wang, J.; Gao, Z. Evolutionary relationship of moso bamboo forms and a multihormone regulatory cascade involving culm shape variation. Plant Biotechnol. J. 2024, 22, 2578–2592. [Google Scholar] [CrossRef] [Scilit] [PubMed]
  20. Bryant, N.; Zhang, J.; Feng, K.; Shu, M.; Ployet, R.; Chen, J.G.; Muchero, W.; Yoo, C.G.; Tschaplinski, T.J.; Pu, Y.; et al. Novel candidate genes for lignin structure identified through genome-wide association study of naturally varying Populus trichocarpa. Front. Plant Sci. 2023, 14, 1153113. [Google Scholar] [CrossRef] [Scilit] [PubMed]
  21. Chhetri, H.B.; Furches, A.; Macaya-Sanz, D.; Walker, A.R.; Kainer, D.; Jones, P.; Harman-Ware, A.; Tschaplinski, T.J.; Jacobson, D.A.; Tuskan, G.A.; et al. Genome-wide association study of wood anatomical and morphological traits in Populus trichocarpa. Front. Plant Sci. 2020, 11, 545748. [Google Scholar] [CrossRef] [Scilit] [PubMed]
  22. Quan, M.; Liu, X.; Du, Q.; Xiao, L.; Lu, W.; Fang, Y.; Li, P.; Li, J.; Zhang, D. Genome-wide association studies reveal the coordinated regulatory networks underlying photosynthesis and wood formation in Populus. J. Exp. Bot. 2021, 72, 2877–2892. [Google Scholar] [CrossRef] [Scilit] [PubMed]
  23. Wang, J.P.; Matthews, M.L.; Williams, C.M.; Shi, R.; Yang, C.; Tunlaya-Anukit, S.; Chen, H.C.; Li, Q.; Liu, J.; Lin, C.Y.; et al. Improving wood properties for wood utilization through multi-omics integration in lignin biosynthesis. Nat. Commun. 2018, 9, 1579. [Google Scholar] [CrossRef] [Scilit] [PubMed]
  24. Knoch, D.; Meyer, R.C.; Heuermann, M.C.; Riewe, D.; Peleke, F.F.; Szymanski, J.; Abbadi, A.; Snowdon, R.J.; Altmann, T. Integrated multi-omics analyses and genome-wide association studies reveal prime candidate genes of metabolic and vegetative growth variation in canola. Plant J. 2023, 115, 16524. [Google Scholar] [CrossRef] [Scilit] [PubMed]
  25. Schaid, D.J.; Chen, W.; Larson, N.B. From genome-wide associations to candidate causal variants by statistical fine-mapping. Nat. Rev. Genet. 2018, 19, 491–504. [Google Scholar] [CrossRef] [Scilit] [PubMed]
  26. Schaefer, R.; Michno, J.; Jeffers, J.; Hoekenga, O.; Dilkes, B.P.; Baxter, I.; Myers, C. Integrating coexpression networks with GWAS to prioritize causal genes in maize. Plant Cell 2017, 30, 2922–2942. [Google Scholar] [CrossRef] [Scilit] [PubMed]
  27. Li, D.; Liu, K.; Zhao, C.; Liang, S.; Yang, J.; Peng, Z.; Xia, A.; Yang, M.; Luo, L.; Huang, C.; et al. GWAS combined with WGCNA of transcriptome and metabolome to excavate key candidate genes for rice anaerobic germination. Rice 2023, 16, 67. [Google Scholar] [CrossRef] [Scilit] [PubMed]
  28. Wei, S.; Tanaka, R.; Kawakatsu, T.; Teramoto, S.; Tanaka, N.; Shenton, M.; Uga, Y.; Yabe, S. Genome- and transcriptome-wide association studies to discover candidate genes for diverse root phenotypes in cultivated rice. Rice 2023, 16, 72. [Google Scholar] [CrossRef] [Scilit] [PubMed]
  29. Harberd, N.P.; Belfield, E.; Yasumura, Y. The angiosperm gibberellin–GID1–DELLA growth regulatory mechanism: How an “inhibitor of an inhibitor” enables flexible response to fluctuating environments. Plant Cell 2009, 21, 1328–1339. [Google Scholar] [CrossRef] [Scilit] [PubMed]
  30. Rongpipi, S.; Ye, D.; Gomez, E.D.; Gomez, E.W. Progress and opportunities in the characterization of cellulose as an important regulator of cell wall growth and mechanics. Front. Plant Sci. 2019, 9, 1894. [Google Scholar] [CrossRef] [Scilit] [PubMed]
  31. Jia, Y.; Li, M.; Xu, J.; Chen, S.; Han, X.; Qiu, W.; Lu, Z.; Zhuo, R.; Qiao, G. Comprehensive analysis of class III peroxidase genes revealed PePRX2 enhanced lignin biosynthesis and drought tolerance in Phyllostachys edulis. Tree Physiol. 2025, 45, tpaf008. [Google Scholar] [CrossRef] [Scilit] [PubMed]
  32. Zhang, H.; Ying, Y.; Wang, J.; Zhao, X.; Zeng, W.; Beahan, C.T.; He, J.; Chen, X.; Bacic, A.; Song, L.; et al. Transcriptome analysis provides insights into xylogenesis formation in moso bamboo shoot. Sci. Rep. 2018, 8, 13963. [Google Scholar] [CrossRef] [Scilit] [PubMed]
  33. Meents, M.J.; Watanabe, Y.; Samuels, A.L. The cell biology of secondary cell wall biosynthesis. Ann. Bot. 2018, 121, 1107–1125. [Google Scholar] [CrossRef] [Scilit] [PubMed]
  34. Zhong, R.; Cui, D.; Ye, Z.H. Secondary cell wall biosynthesis. New Phytol. 2018, 221, 1703–1723. [Google Scholar] [CrossRef] [Scilit] [PubMed]
  35. Hosaka, G.K.; Correr, F.H.; Silva, C.C.; Sforça, D.; Barreto, F.; Balsalobre, T.W.A.; Pasha, A.; de Souza, A.P.; Provart, N.; Carneiro, M.S.; et al. Temporal gene expression in apical culms shows early changes in cell wall biosynthesis genes in sugarcane. Front. Plant Sci. 2021, 12, 736797. [Google Scholar] [CrossRef] [Scilit] [PubMed]
  36. McKinley, B.A.; Rooney, W.; Wilkerson, C.; Mullet, J. Dynamics of biomass partitioning, stem gene expression, cell wall biosynthesis, and sucrose accumulation during development of Sorghum bicolor. Plant J. 2016, 88, 662–680. [Google Scholar] [CrossRef] [Scilit] [PubMed]
  37. Mason, P.; Hoang, N.V.; Botha, F.; Furtado, A.; Marquardt, A.; Henry, R. Organ-specific expression of genes associated with the UDP-glucose metabolism in sugarcane (Saccharum spp. hybrids). BMC Genom. 2023, 24, 352. [Google Scholar] [CrossRef] [Scilit] [PubMed]
  38. Wei, Z.; Qu, Z.; Zhang, L.; Zhao, S.; Bi, Z.; Ji, X.; Wang, X.; Wei, H. Overexpression of poplar xylem sucrose synthase in tobacco leads to a thickened cell wall and increased height. PLoS ONE 2015, 10, e0120669. [Google Scholar] [CrossRef] [Scilit] [PubMed]
  39. Baez, L.A.; Tichá, T.; Hamann, T. Cell wall integrity regulation across plant species. Plant Mol. Biol. 2022, 109, 483–504. [Google Scholar] [CrossRef] [Scilit] [PubMed]
  40. Engelsdorf, T.; Hamann, T. An update on receptor-like kinase involvement in the maintenance of plant cell wall integrity. Ann. Bot. 2014, 114, 1339–1347. [Google Scholar] [CrossRef] [Scilit] [PubMed]
  41. Franck, C.M.; Westermann, J.; Boisson-Dernier, A. Plant malectin-like receptor kinases: From cell wall integrity to immunity and beyond. Annu. Rev. Plant Biol. 2018, 69, 301–328. [Google Scholar] [CrossRef] [Scilit] [PubMed]
  42. Wolf, S. Plant cell wall signalling and receptor-like kinases. Biochem. J. 2017, 474, 471–492. [Google Scholar] [CrossRef] [Scilit] [PubMed]
  43. Botha, F.C.; Marquardt, A. Metabolic control of sugarcane internode elongation and sucrose accumulation. Agronomy 2024, 14, 1487. [Google Scholar] [CrossRef] [Scilit]
  44. Euring, D.; Bai, H.; Janz, D.; Polle, A. Nitrogen-driven stem elongation in poplar is linked with wood modification and gene clusters for stress, photosynthesis and cell wall formation. BMC Plant Biol. 2014, 14, 391. [Google Scholar] [CrossRef] [Scilit] [PubMed]
  45. Guo, L.; Chen, T.; Chu, X.; Sun, K.; Yu, F.; Que, F.; Ahmad, Z.; Wei, Q.; Ramakrishnan, M. Anatomical and transcriptome analyses of moso bamboo culm neck growth: Unveiling key insights. Plants 2023, 12, 3478. [Google Scholar] [CrossRef] [Scilit]
  46. Wang, T.; Liu, L.; Wang, X.; Liang, L.X.; Yue, J.J.; Li, L. Comparative analyses of anatomical structure, phytohormone levels, and gene expression profiles reveal potential dwarfing mechanisms in Shengyin bamboo (Phyllostachys edulis f. tubaeformis). Int. J. Mol. Sci. 2018, 19, 1697. [Google Scholar] [CrossRef] [Scilit] [PubMed]
  47. Wolf, S. Cell wall signaling in plant development and defense. Annu. Rev. Plant Biol. 2022, 73, 323–353. [Google Scholar] [CrossRef] [Scilit] [PubMed]
  48. Xia, J.; Zhao, Y.; Burks, P.S.; Pauly, M.; Brown, P.J. A sorghum NAC gene is associated with variation in biomass properties and yield potential. Plant Direct 2018, 2, e70. [Google Scholar] [CrossRef] [Scilit] [PubMed]
  49. Zhang, B.; Gao, Y.; Zhang, L.; Zhou, Y. The plant cell wall: Biosynthesis, construction, and functions. J. Integr. Plant Biol. 2021, 63, 251–272. [Google Scholar] [CrossRef] [Scilit] [PubMed]
  50. Salami, M.; Heidari, B.; Batley, J.; Wang, J.; Tan, X.L.; Richards, C.; Tan, H. Integration of genome-wide association studies, metabolomics, and transcriptomics reveals phenolic acid- and flavonoid-associated genes and their regulatory elements under drought stress in rapeseed flowers. Front. Plant Sci. 2024, 14, 1249142. [Google Scholar] [CrossRef] [Scilit] [PubMed]
  51. Zhong, R.; Ye, Z.H. Secondary cell walls: Biosynthesis, patterned deposition and transcriptional regulation. Plant Cell Physiol. 2015, 56, 195–214. [Google Scholar] [CrossRef] [Scilit] [PubMed]
  52. Peaucelle, A.; Braybrook, S.A.; Höfte, H. Cell wall mechanics and growth control in plants: The role of pectins revisited. Front. Plant Sci. 2012, 3, 121. [Google Scholar] [CrossRef] [Scilit] [PubMed]
  53. Unda, F.; Kim, H.; Hefer, C.; Ralph, J.; Mansfield, S. Altering carbon allocation in hybrid poplar (Populus alba × grandidentata) impacts cell wall growth and development. Plant Biotechnol. J. 2017, 15, 865–878. [Google Scholar] [CrossRef] [Scilit] [PubMed]
  54. Rodriguez-Zaccaro, F.D.; Lieberman, M.; Groover, A.; Tuominen, H.; Chai, G.; Chhetri, H.B. A systems genetic analysis identifies putative mechanisms and candidate genes regulating vessel traits in poplar wood. Front. Plant Sci. 2024, 15, 1375506. [Google Scholar] [CrossRef] [Scilit] [PubMed]
  55. Sato-Izawa, K.; Nakamura, S.; Matsumoto, T. Mutation of rice bc1 gene affects internode elongation and induces delayed cell wall deposition in developing internodes. Plant Signal. Behav. 2020, 15, 1749786. [Google Scholar] [CrossRef] [Scilit] [PubMed]
  56. Wang, L.; Lu, W.; Ran, L.; Dou, L.; Yao, S.; Hu, J.; Fan, D.; Li, C.; Luo, K. R2R3-MYB transcription factor MYB6 promotes anthocyanin and proanthocyanidin biosynthesis but inhibits secondary cell wall formation in Populus tomentosa. Plant J. 2019, 99, 733–751. [Google Scholar] [CrossRef] [Scilit] [PubMed]
  57. Alqudah, A.M.; Sallam, A.; Baenziger, P.S.; Börner, A. GWAS: Fast-forwarding gene identification and characterization in temperate cereals: Lessons from barley. J. Adv. Res. 2019, 22, 119–135. [Google Scholar] [CrossRef] [Scilit]
  58. Clauw, P.; Ellis, T.J.; Liu, H.J.; Sasaki, E. Beyond the standard GWAS—A guide for plant biologists. Plant Cell Physiol. 2024, 66, 431–443. [Google Scholar] [CrossRef] [Scilit] [PubMed]
  59. Wang, W.; Li, Y.; Cai, C.; Zhu, Q. Auxin response factors fine-tune lignin biosynthesis in response to mechanical bending in bamboo. New Phytol. 2023, 241, 19398. [Google Scholar] [CrossRef] [Scilit] [PubMed]
  60. Tao, G.; Ramakrishnan, M.; Vinod, K.K.; Yrjälä, K.; Satheesh, V.; Cho, J.; Fu, Y.; Zhou, M. Multi-omics analysis of cellular pathways involved in different rapid growth stages of moso bamboo. Tree Physiol. 2020, 40, 1487–1508. [Google Scholar] [CrossRef] [Scilit] [PubMed]
  61. Wang, W.; Wu, Q.; Wang, N.; Ye, S.; Zhang, J.; Lin, C.; Zhu, Q. Advances in bamboo genomics: Growth and development, stress tolerance, and genetic engineering. J. Integr. Plant Biol. 2025, 67, 1725–1755. [Google Scholar] [CrossRef] [Scilit] [PubMed]
  62. Hu, X.; Liang, J.; Wang, W.; Cai, C.; Ye, S.; Wang, N.; Han, F.; Wu, Y.; Zhu, Q. Comprehensive genome-wide analysis of the DREB gene family in moso bamboo (Phyllostachys edulis): Evidence for the role of PeDREB28 in plant abiotic stress response. Plant J. 2023, 116, 15420. [Google Scholar] [CrossRef] [Scilit] [PubMed]
  63. Shan, X.; Yang, K.; Xu, X.; Zhu, C.; Gao, Z. Genome-wide investigation of the NAC gene family and its potential association with the secondary cell wall in moso bamboo. Biomolecules 2019, 9, 609. [Google Scholar] [CrossRef] [Scilit] [PubMed]
  64. Xuan, X.; Su, S.; Chen, J.; Tan, J.; Yu, Z.; Jiao, Y.; Cai, S.; Zhang, Z.; Ramakrishnan, M. Evolutionary and functional analysis of the DIR gene family in moso bamboo: Insights into rapid shoot growth and stress responses. Front. Plant Sci. 2025, 16, 1535733. [Google Scholar] [CrossRef] [Scilit] [PubMed]
  65. Jin, K.; Ling, Z.; Jin, Z.; Ma, J.; Yang, S.; Liu, X.; Jiang, Z. Local variations in carbohydrates and matrix lignin in mechanically graded bamboo culms. Polymers 2021, 14, 143. [Google Scholar] [CrossRef] [Scilit] [PubMed]
  66. Kang, X.; Kirui, A.; Widanage, M.C.D.; Mentink-Vigier, F.; Cosgrove, D.J.; Wang, T. Lignin-polysaccharide interactions in plant secondary cell walls revealed by solid-state NMR. Nat. Commun. 2019, 10, 5075. [Google Scholar] [CrossRef] [Scilit] [PubMed]
  67. Terrett, O.M.; Dupree, P. Covalent interactions between lignin and hemicelluloses in plant secondary cell walls. Curr. Opin. Biotechnol. 2019, 56, 97–104. [Google Scholar] [CrossRef] [Scilit] [PubMed]
  68. Berens, M.L.; Berry, H.M.; Mine, A.; Argueso, C.T.; Tsuda, K. Evolution of hormone signaling networks in plant defense. Annu. Rev. Phytopathol. 2017, 55, 401–425. [Google Scholar] [CrossRef] [Scilit] [PubMed]
  69. Ding, L.; Li, Y.T.; Wu, Y.; Li, T.; Geng, R.; Cao, J.; Zhang, W.; Tan, X. Plant disease resistance-related signaling pathways: Recent progress and future prospects. Int. J. Mol. Sci. 2022, 23, 16200. [Google Scholar] [CrossRef] [Scilit] [PubMed]
  70. Wan, J.; He, M.; Hou, Q.; Zou, L.; Yang, Y.; Wei, Y.; Chen, X. Cell wall associated immunity in plants. Stress Biol. 2021, 1, 4. [Google Scholar] [CrossRef] [Scilit] [PubMed]
  71. Li, L.; Yang, K.; Wang, S.; Lou, Y.; Zhu, C.; Gao, Z. Genome-wide analysis of laccase genes in moso bamboo highlights PeLAC10 involved in lignin biosynthesis and in response to abiotic stresses. Plant Cell Rep. 2020, 39, 751–763. [Google Scholar] [CrossRef] [Scilit] [PubMed]
  72. Wang, Y.; Zhang, H.; Zhu, S.; Shen, T.; Pan, H.; Xu, M. Association mapping and expression analysis of the genes involved in the wood formation of poplar. Int. J. Mol. Sci. 2023, 24, 12662. [Google Scholar] [CrossRef] [Scilit] [PubMed]
  73. Busse-Wicher, M.; Gomes, T.C.F.; Tryfona, T.; Nikolovski, N.; Stott, K.; Grantham, N.J.; Bolam, D.N.; Skaf, M.S.; Dupree, P. The pattern of xylan acetylation suggests xylan may interact with cellulose microfibrils as a twofold helical screw in the secondary plant cell wall of Arabidopsis thaliana. Plant J. 2014, 79, 492–506. [Google Scholar] [CrossRef] [Scilit] [PubMed]
  74. Cosgrove, D.J. Catalysts of plant cell wall loosening. F1000Research 2016, 5, 7180. [Google Scholar] [CrossRef] [Scilit] [PubMed]
  75. Cosgrove, D.J. Plant cell wall loosening by expansins. Annu. Rev. Cell Dev. Biol. 2024, 40, 329–352. [Google Scholar] [CrossRef] [Scilit] [PubMed]
  76. Watanabe, Y.; Meents, M.J.; McDonnell, L.M.; Barkwill, S.; Sampathkumar, A.; Cartwright, H.N.; Demura, T.; Ehrhardt, D.W.; Samuels, A.L.; Mansfield, S.D. Visualization of cellulose synthases in Arabidopsis secondary cell walls. Science 2015, 350, 198–203. [Google Scholar] [CrossRef] [Scilit] [PubMed]
  77. Li, Z.; Wang, X.; Yang, K.; Zhu, C.; Yuan, T.; Wang, J.; Li, Y.; Gao, Z. Identification and expression analysis of the glycosyltransferase GT43 family members in bamboo reveal their potential function in xylan biosynthesis during rapid growth. BMC Genom. 2021, 22, 541. [Google Scholar] [CrossRef] [Scilit] [PubMed]
  78. Sun, H.; Li, H.; Huang, M.; Gao, Z. Expression and function analysis of phenylalanine ammonia-lyase genes involved in bamboo lignin biosynthesis. Physiol. Plant. 2024, 176, e14444. [Google Scholar] [CrossRef] [Scilit] [PubMed]
  79. Song, X.; Peng, C.; Zhou, G.; Gu, H.; Li, Q.; Zhang, C. Dynamic allocation and transfer of non-structural carbohydrates, a possible mechanism for the explosive growth of moso bamboo (Phyllostachys heterocycla). Sci. Rep. 2016, 6, 25908. [Google Scholar] [CrossRef] [Scilit] [PubMed]
  80. Wang, X.J.; Geng, X.; Yang, L.; Chen, Y.; Zhao, Z.; Shi, W.; Kang, L.; Wu, R.; Lu, C.; Gao, J. Total and mitochondrial transcriptomic and proteomic insights into regulation of bioenergetic processes for shoot fast-growth initiation in moso bamboo. Cells 2022, 11, 1240. [Google Scholar] [CrossRef] [Scilit] [PubMed]
  81. Zhang, J.; Ma, R.; Ding, X.; Huang, M.; Shen, K.; Zhao, S.; Xiao, Z.; Xiu, C. Association among starch storage, metabolism, related genes and growth of moso bamboo (Phyllostachys heterocycla) shoots. BMC Plant Biol. 2021, 21, 477. [Google Scholar] [CrossRef] [Scilit] [PubMed]
  82. Pottier, D.; Roitsch, T.; Persson, S. Cell wall regulation by carbon allocation and sugar signaling. Cell Surf. 2023, 9, 100096. [Google Scholar] [CrossRef] [Scilit]
  83. Stein, O.; Granot, D. An overview of sucrose synthases in plants. Front. Plant Sci. 2019, 10, 95. [Google Scholar] [CrossRef] [Scilit] [PubMed]
  84. Verbančič, J.; Lunn, J.E.; Stitt, M.; Persson, S. Carbon supply and the regulation of cell wall synthesis. Mol. Plant 2018, 11, 75–94. [Google Scholar] [CrossRef] [Scilit] [PubMed]
  85. Jiang, J.; Zhang, Z.; Bai, Y.; Wang, X.; Dou, Y.; Geng, R.; Wu, C.; Zhang, H.; Lu, C.; Gu, L.; et al. Chromosomal-level genome and metabolome analyses of highly heterozygous allohexaploid Dendrocalamus brandisii elucidate shoot quality and developmental characteristics. J. Integr. Plant Biol. 2024, 66, 1087–1105. [Google Scholar] [CrossRef] [Scilit] [PubMed]
  86. Li, S.; Cao, Y.; Wang, B.; Fan, W.; Hu, S. Bio-organic fertilizer affects secondary cell wall biosynthesis of Dendrocalamus farinosus by inhibiting the phenylpropanoid metabolic pathway. BMC Plant Biol. 2024, 24, 1112. [Google Scholar] [CrossRef] [Scilit] [PubMed]
  87. Li, Z.; Xu, X.; Yang, K.; Zhu, C.; Liu, Y.; Gao, Z. Multifaceted analyses reveal carbohydrate metabolism mainly affecting the quality of postharvest bamboo shoots. Front. Plant Sci. 2022, 13, 1021161. [Google Scholar] [CrossRef] [Scilit] [PubMed]
  88. Feng, W.; Kita, D.; Peaucelle, A.; Cartwright, H.N.; Doan, V.; Duan, Q.; Liu, M.C.; Maman, J.; Steinhorst, L.; Schmitz-Thom, I.; et al. The FERONIA receptor kinase maintains cell-wall integrity during salt stress through Ca2+ signaling. Curr. Biol. 2018, 28, 666–675. [Google Scholar] [CrossRef] [Scilit] [PubMed]
  89. Novaković, L.; Guo, T.; Bacic, A.; Sampathkumar, A.; Johnson, K.L. Hitting the wall: Sensing and signaling pathways involved in plant cell wall remodeling in response to abiotic stress. Plants 2018, 7, 89. [Google Scholar] [CrossRef] [Scilit] [PubMed]
  90. Vaahtera, L.; Schulz, J.; Hamann, T. Cell wall integrity maintenance during plant development and interaction with the environment. Nat. Plants 2019, 5, 924–932. [Google Scholar] [CrossRef] [Scilit] [PubMed]
  91. Contreras, M.P.; Lüdke, D.; Pai, H.; Toghani, A.; Kamoun, S. NLR receptors in plant immunity: Making sense of the alphabet soup. EMBO Rep. 2023, 24, e57495. [Google Scholar] [CrossRef] [Scilit] [PubMed]
  92. Giolai, M.; Laine, A.L. A trade-off between investment in molecular defense repertoires and growth in plants. Science 2024, 386, 677–680. [Google Scholar] [CrossRef] [Scilit] [PubMed]
  93. Richard, M.M.S.; Gratias, A.; Meyers, B.C.; Geffroy, V. Molecular mechanisms that limit the costs of NLR-mediated resistance in plants. Mol. Plant Pathol. 2018, 19, 2516–2523. [Google Scholar] [CrossRef] [Scilit] [PubMed]
  94. Cosgrove, D.J. Structure and growth of plant cell walls. Nat. Rev. Mol. Cell Biol. 2024, 25, 340–358. [Google Scholar] [CrossRef] [Scilit] [PubMed]
  95. Mittler, R.; Zandalinas, S.I.; Fichman, Y.; Van Breusegem, F. Reactive oxygen species signalling in plant stress responses. Nat. Rev. Mol. Cell Biol. 2022, 23, 663–679. [Google Scholar] [CrossRef] [Scilit] [PubMed]
  96. Tenhaken, R. Cell wall remodeling under abiotic stress. Front. Plant Sci. 2015, 5, 771. [Google Scholar] [CrossRef] [Scilit] [PubMed]
  97. Huang, L.C.; Lai, J.X.; Tian, X.; Li, Y.Y.; Chen, Y.H.; An, Y.; Jiang, C.; Chen, N.; Lu, M.; Zhang, J. PagKNAT5a promotes plant growth by enhancing xylem cell elongation and secondary wall formation in poplar. Hortic. Res. 2025, 12, uhaf125. [Google Scholar] [CrossRef] [Scilit] [PubMed]
  98. Zhang, H.; Wang, H.; Zhu, Q.; Gao, Y.; Wang, H.; Zhao, L.; Wang, Y.; Xi, F.; Wang, W.; Yang, Y.; et al. Transcriptome characterization of moso bamboo (Phyllostachys edulis) seedlings in response to exogenous gibberellin applications. BMC Plant Biol. 2018, 18, 1336. [Google Scholar] [CrossRef] [Scilit] [PubMed]
  99. Zhao, X.; Niu, Y.; Bai, X.; Mao, T. Transcriptomic and metabolic profiling reveals a lignin metabolism network involved in mesocotyl elongation during maize seed germination. Plants 2022, 11, 1034. [Google Scholar] [CrossRef] [Scilit] [PubMed]
  100. Guo, J.; Luo, D.; Chen, Y.; Li, F.; Gong, J.; Yu, F.; Zhang, W.; Qi, J.; Guo, C. Spatiotemporal transcriptome atlas reveals gene regulatory patterns during the organogenesis of the rapid growing bamboo shoots. New Phytol. 2024, 244, 102059. [Google Scholar] [CrossRef] [Scilit] [PubMed]
Figure 1. Overall architecture and integrated ranking of the curated GWAS-derived candidate genes. (A) Functional category composition and screening-class distribution of effective candidate genes. (B) Integrated candidate score distribution across C1 core candidates, C2 strong candidates, C3 supportive candidates, and background genes. (C) Relationship between evidence source and annotation confidence. (D) Dominant molecular families in the curated candidate pool.
Horticulturae 12 01030 g001
Figure 2. Trait-guided prioritization of C1/C2 candidate genes. (A) Heatmap showing associations between nine bamboo property-related traits and functional categories. (B) Bubble plot showing trait-associated molecular families. (C) Trait coverage of the C1/C2 transcriptome-testable gene set. (D) Cross-trait candidate genes associated with multiple property-related traits.
Horticulturae 12 01030 g002
Figure 3. Final transcriptome-testable C1/C2 candidate gene set. (A) Screening summary from 99 effective candidate gene records to 44 C1/C2 candidates. (B) Functional composition of the final C1/C2 set. (C) Dominant molecular families retained for transcriptome screening. (D) Chromosomal distribution of the final 44 C1/C2 candidate genes.
Horticulturae 12 01030 g003
Figure 4. Global expression-response landscape of C1/C2 candidates. (A) Heatmap of log2 fold-change values across transcriptome comparisons. (B) Number of responsive candidate genes across transcriptome categories and functional modules. (C) Distribution of absolute log2 fold-change values among functional modules and transcriptome categories. Responsive genes were defined using both fold-change and expression-abundance thresholds: |log2fold| ≥ 1 and max(FPKM, control FPKM) ≥ 1.
Horticulturae 12 01030 g004
Figure 5. Expression-supported prioritization of C1/C2 candidate genes. (A) Ranked expression-supported candidate genes based on expression-support score. (B) Functional-module response across transcriptome categories. (C) Composition of expression-support classes by functional module. (D) Category-averaged expression-response heatmap of top-ranked candidates.
Horticulturae 12 01030 g005
Figure 6. Multi-species bamboo shoot transcriptome–metabolome landscape. (A) PCA of candidate gene expression profiles across bamboo shoot samples. (B) PCA of non-targeted metabolome profiles. (C) Expression heatmap of C1/C2 candidate genes across bamboo shoots. (D) Heatmap of metabolite-module abundance across bamboo shoots.
Horticulturae 12 01030 g006
Figure 7. Gene–metabolite module coupling identifies multi-omics-supported shoot candidates. (A) Spearman correlation heatmap between candidate gene expression and metabolite-module scores. The black circles within the cells indicate significant correlations. (B) Functional module–metabolite module association summary. (C) Top gene–metabolite module associations. (D) Ranked multi-omics-supported candidate genes integrating candidate ranking, expression support, and metabolite-module coupling.
Horticulturae 12 01030 g007
Figure 8. Integrated framework linking curated GWAS-derived candidates, expression support, and shoot multi-omics evidence to bamboo property-related variation.
Horticulturae 12 01030 g008
Figure 9. qRT-PCR verification of RNA transcription sequencing results. (A) Expression analysis of PH02Gene00247. (B) Expression analysis of PH02Gene17228. (C) Expression analysis of PH02Gene51360. The gray bars represent relative expression levels from qRT-PCR (left y-axis), and the red lines represent FPKM values from RNA-seq (right y-axis).
Horticulturae 12 01030 g009
Disclaimer/Publisher’s Note: The statements, opinions and data contained in all publications are solely those of the individual author(s) and contributor(s) and not of MDPI and/or the editor(s). MDPI and/or the editor(s) disclaim responsibility for any injury to people or property resulting from any ideas, methods, instructions or products referred to in the content.