1. Introduction
Tomato (
Solanum lycopersicum L.) is one of the most important vegetable crops worldwide and is widely cultivated in both protected and open-field production systems [
1,
2]. In recent years, tomato disease identification and intelligent monitoring have also become a major focus in agricultural vision research. Tomato leaf diseases occur frequently and spread rapidly throughout the growth cycle. If not identified and managed in a timely manner, they often lead to reductions in both yield and quality, highlighting the importance of early and accurate diagnosis [
3,
4]. Under natural field conditions, the manifestation of leaf diseases is highly variable: lesion morphology changes with disease progression, and early symptoms are typically characterized by small scale, weak texture, and indistinct boundaries. In addition, overlapping leaves, illumination variation, shadows, and interference from weed backgrounds further increase the difficulty of disease recognition. Traditional manual inspection relies heavily on human experience and suffers from low efficiency, strong subjectivity, and limited scalability and standardization [
5]. Therefore, developing an automatic tomato leaf disease detection method that can operate robustly in natural environments is of great significance for early disease warning, precision pesticide application, and visual perception in intelligent agricultural equipment [
6].
Traditional leaf disease recognition methods have largely relied on strategies such as threshold segmentation [
7], edge detection, morphological filtering, and handcrafted feature engineering [
8,
9]. Although these methods can achieve acceptable performance under controlled conditions, they often exhibit limited robustness in natural scenarios characterized by unstable illumination, complex backgrounds, and varying leaf poses, and they are inadequate for capturing the fine-grained differences among multiple disease symptoms [
9,
10]. With the development of deep learning, convolutional neural networks have become capable of automatically learning discriminative features from data, significantly improving recognition and detection performance in agricultural vision tasks [
11,
12]. Compared with image-level classification, object detection can simultaneously provide both disease categories and spatial locations, making it more suitable for applications such as field inspection, lesion localization, disease severity assessment, and decision support. As a result, it has attracted increasing attention in agricultural disease recognition research [
13,
14].
Among the numerous object detection frameworks, the YOLO series has been widely adopted in agricultural disease detection because of its end-to-end architecture and high inference efficiency. Numerous studies have focused on improving detection accuracy for agricultural diseases through architectural optimization. For instance, Qi et al. [
15] incorporated a visual attention mechanism into YOLOv5 for tomato virus disease detection, achieving an mAP@0.5 of 94.10%, which was 1.23%, 16.77%, and 1.78% higher than those of Faster R-CNN, SSD, and the original YOLOv5, respectively. To address challenges such as illumination variation, leaf occlusion, and small lesions in natural environments, Wang et al. [
16] combined an attention mechanism with multi-scale feature fusion to enhance lesion feature representation under complex conditions. Likewise, Liu et al. [
17] introduced MobileNetV3, CBAM, CycleGAN-based data augmentation, and an adaptive confidence loss into YOLOX, improving detection accuracy by 1.46% and detection speed by 50.20%, while reducing memory usage by 35.34%; the model further achieved 11.1 FPS on Jetson Nano. Jing et al. [
18] improved YOLOv5 by integrating an automatic annotation algorithm, a weighted bidirectional feature pyramid network, and CBAM, and developed the BC-YOLOv5 model, whose automatic annotation pass rate for tomato leaf images exceeded 95%. Cardellicchio et al. [
19] improved YOLOv11-based tomato phenotyping through incremental learning and domain adaptation, enhancing both detection stability and efficiency. Additionally, Huang et al. [
20] further improved vegetable disease detection performance by enhancing YOLOv8, indicating that strengthening feature extraction and feature fusion remains an important direction for improving the accuracy of agricultural disease detection. Although these studies have demonstrated the effectiveness of attention mechanisms, feature enhancement, and multi-scale fusion strategies, they often rely on more complex structural designs, which may introduce additional parameters and computational overhead.
To reduce the parameter count and computational complexity of YOLO-based models and improve their deployability on resource-constrained devices, some studies have focused on lightweight model design. For instance, Su et al. [
21] introduced MobileNetV1 into YOLOv3 and developed SE-YOLOv3-MobileNetV1 for tomato maturity recognition in natural greenhouse environments. Similarly, Zeng et al. [
22] proposed a lightweight tomato detection algorithm based on YOLOv5 and deployed the quantized model on a smartphone, enabling on-device mobile detection. In a tomato harvesting robot scenario, Wang et al. [
23] developed SM-YOLOv5 by adopting a lightweight backbone network to improve model applicability. Wu et al. [
24] further proposed MTS-YOLO for tomato cluster maturity recognition and picking-point detection, demonstrating the potential of lightweight models in multi-task agricultural applications. More recently, Liu et al. [
25] presented Faster-YOLO-AP, which reduced the number of parameters and FLOPs to 0.66 M and 2.29 G, respectively, while achieving an mAP@0.50 of 84.12%. Although these methods significantly reduce model complexity, they are often accompanied by some loss of accuracy in complex agricultural scenarios, particularly under conditions involving small targets, occluded objects, and cluttered backgrounds, where missed detections and false detections are more likely to occur [
26].
Although existing studies have made encouraging progress in improving detection accuracy and lightweight model design, several limitations remain. On the one hand, high-accuracy methods usually rely on more complex feature enhancement modules or network architectures, which tend to introduce additional parameters and computational overhead, thereby limiting their deployment on resource-constrained devices. On the other hand, although lightweight approaches effectively reduce model complexity, they are often accompanied by a certain degree of performance compromise in complex agricultural scenarios, particularly under conditions involving small targets, occlusion, and cluttered backgrounds, where missed detections and false detections become more likely. Rana et al. [
27] further showed that the field reliability of agricultural detectors depends not only on mAP but also on robustness to occlusion, illumination variation, and false detections. This contradiction is even more pronounced in tomato leaf disease detection under natural environments. Early-stage disease symptoms can be subtle, weak in texture, and spatially localized within leaves, making relevant visual cues prone to attenuation during repeated downsampling. Meanwhile, overlapping leaves, cluttered backgrounds, and symptom similarity among different diseases further increase the difficulty of feature representation and category discrimination. In addition, complex backgrounds, leaf occlusion, and ambiguous leaf-background separation can adversely affect bounding-box regression quality and reduce localization stability [
28]. Therefore, how to simultaneously maintain fine-grained details, strengthen multi-scale feature fusion, and improve localization quality within a lightweight framework remains an urgent challenge in tomato leaf disease detection under natural conditions.
To address the above issues, this study takes YOLOv12n as the baseline and proposes a lightweight model, DFR-YOLOv12n, for tomato leaf disease detection in natural environments, with coordinated improvements from three aspects: detail-preserving downsampling, feature enhancement, and bounding box regression optimization. Specifically, a detail-preserving strategy was introduced at key downsampling stages to alleviate the attenuation of fine-grained disease-related visual cues during feature compression. An efficient feature enhancement mechanism was incorporated into the high-level feature extraction and fusion stages to improve the representation of leaf texture and disease-related appearance information under complex background interference. Meanwhile, an optimized regression strategy was adopted during bounding box regression to enhance the localization stability and regression quality of whole-leaf targets under occlusion and background interference. Through systematic comparison and ablation experiments on insertion positions, module combinations, and regression strategies, the effectiveness of each improved component was verified, and the optimal configuration balancing detection accuracy and computational efficiency was identified.
The main contributions of this study are summarized as follows:
A multi-source tomato leaf disease detection dataset in natural environments was constructed and curated, containing seven diseased leaf categories and one healthy leaf category, with a total of 12,755 images. Unified data partitioning and evaluation settings were also provided, offering a data foundation for disease detection research under complex scenarios.
A lightweight tomato leaf disease detection model, DFR-YOLOv12n, was proposed. The model introduces coordinated improvements in three key aspects, namely detail preservation, feature enhancement, and localization optimization, thereby improving detection performance for small lesions and complex-background scenarios in natural environments while maintaining relatively low computational cost.
Through insertion-position experiments, comparative experiments on different enhancement modules, and ablation experiments on regression strategies, the effects of each component on model performance were systematically analyzed, and the optimal model configuration balancing accuracy, complexity, and deployment requirements was determined.
The proposed model was deployed and validated on the Jetson Nano B01 development board, supporting image, video, and camera-based detection, which demonstrates its potential for edge applications.
2. Materials and Methods
2.1. Dataset Construction
2.1.1. Dataset Acquisition
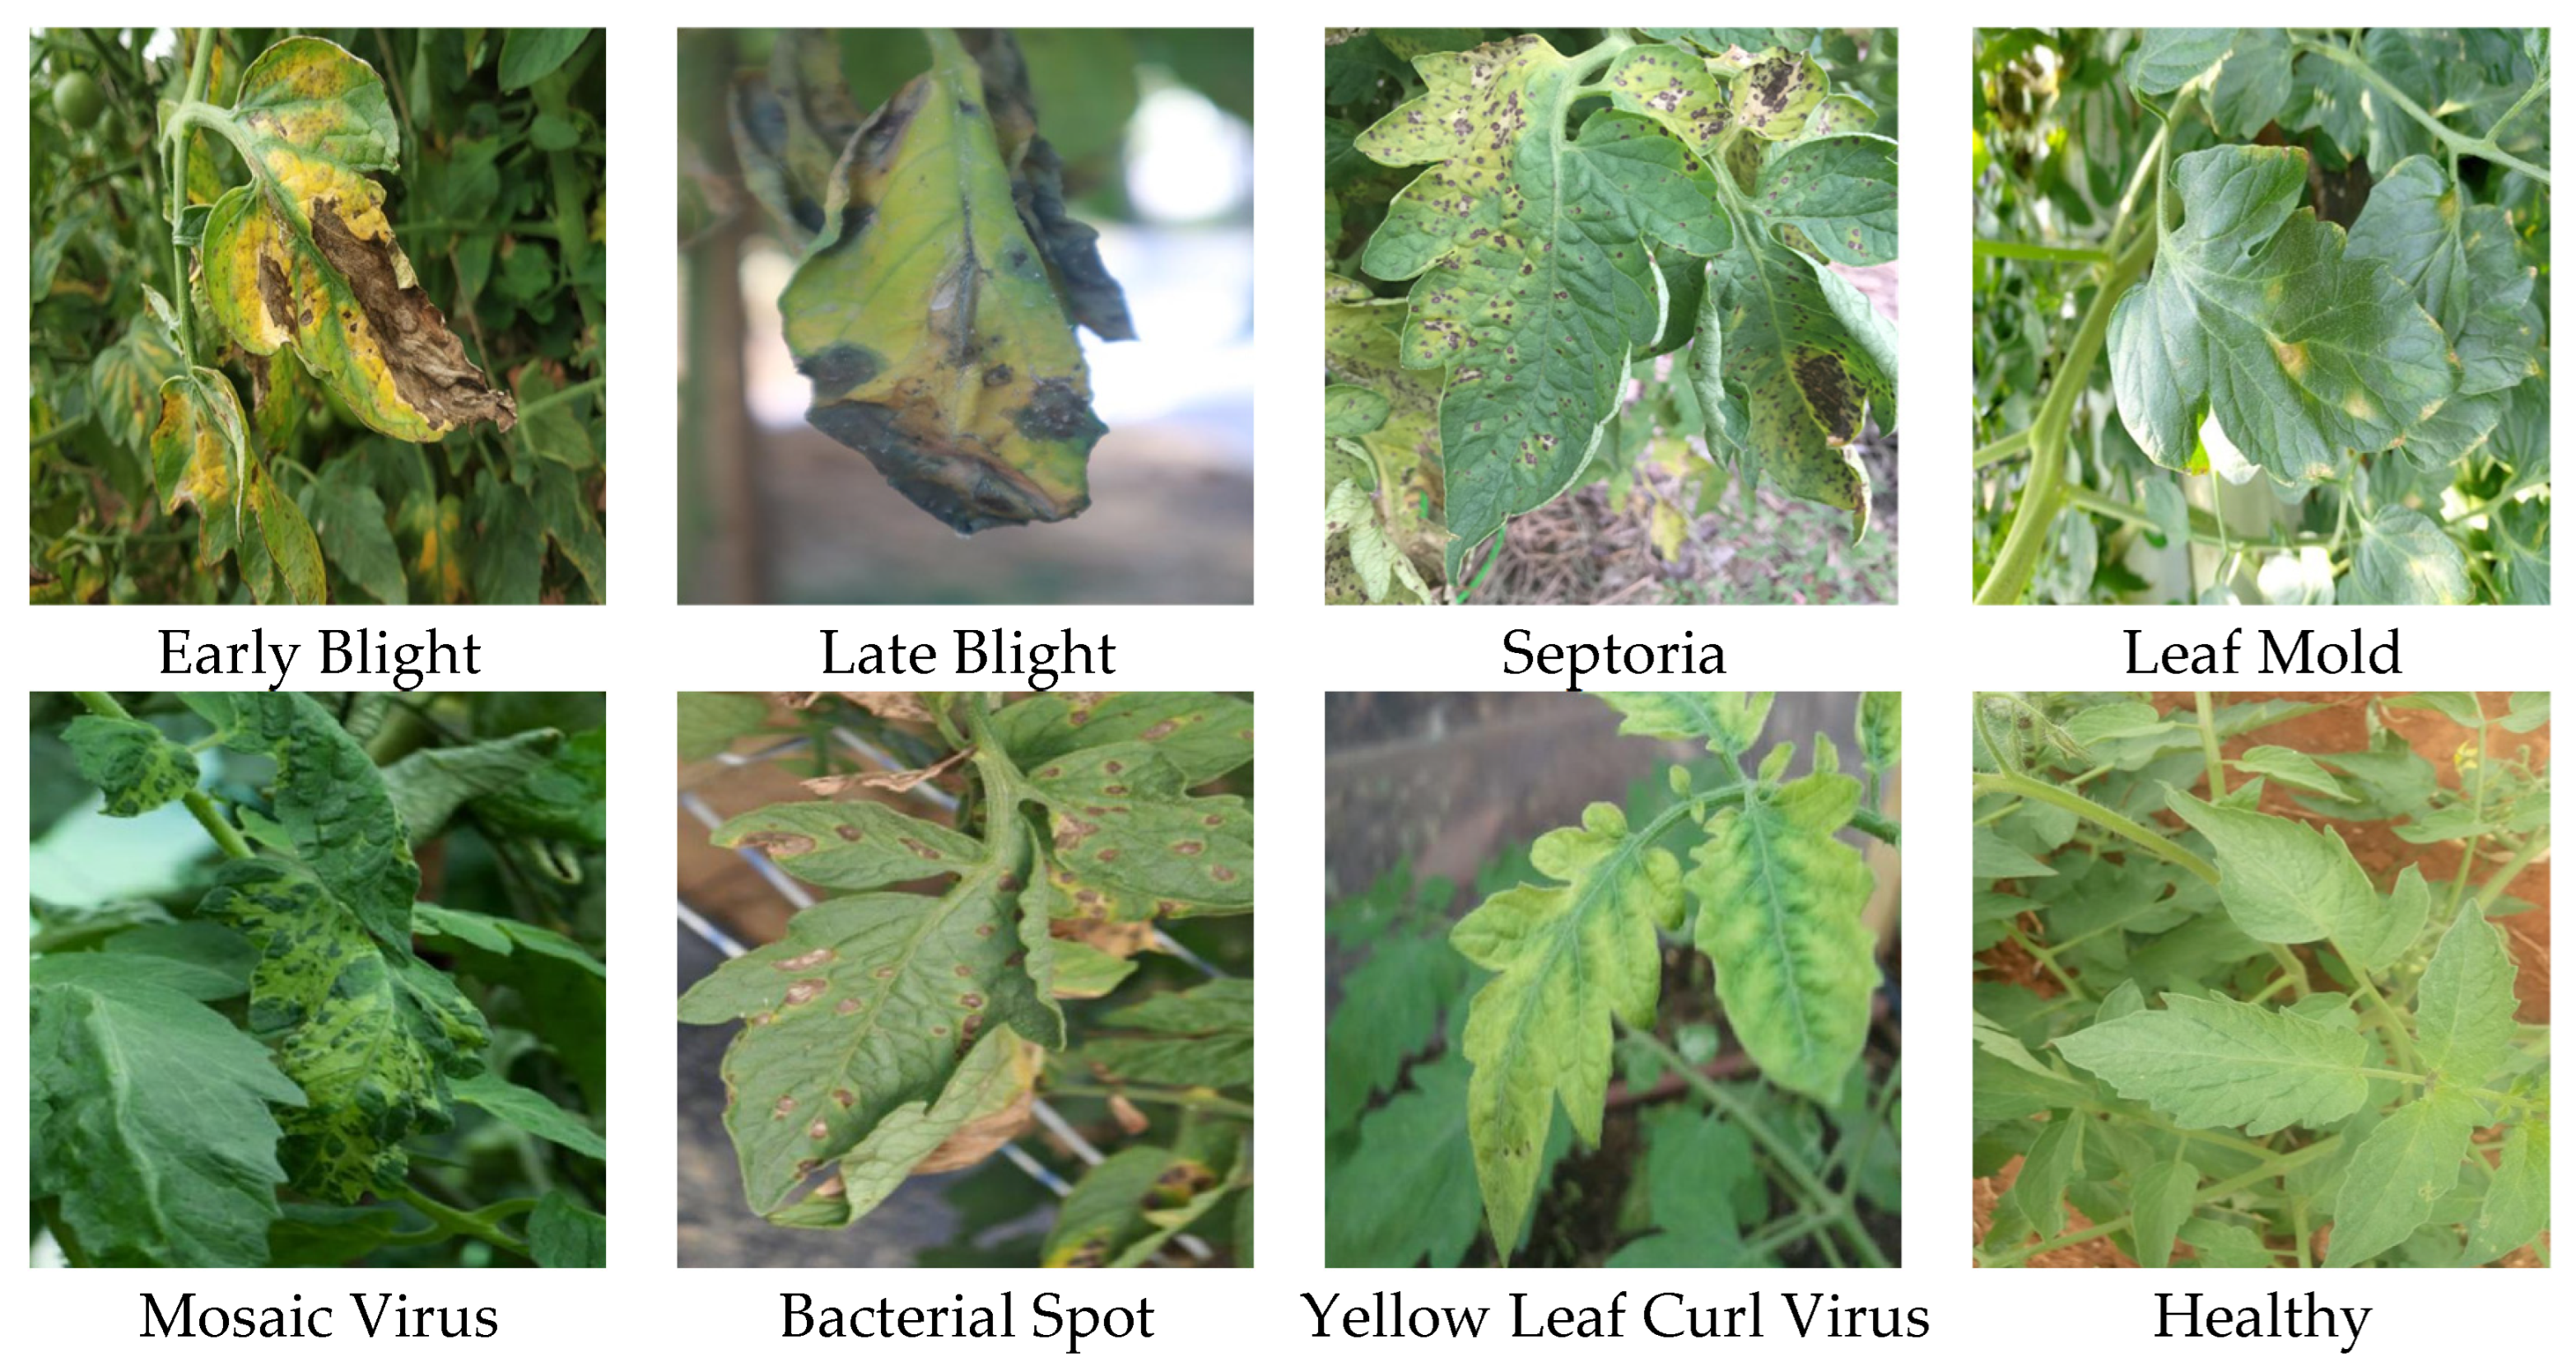
The tomato leaf images used in this study were compiled from four publicly accessible sources: PlantVillage, PlantDoc, tomato disease datasets hosted on Roboflow, and the Dataset of Tomato Leaves. These sources encompassed images acquired against controlled backgrounds, under laboratory conditions, and in natural or otherwise complex scenes. To better reflect real-world disease-detection scenarios, priority was given to images with natural or complex backgrounds. Images exhibiting severe blurring, low resolution, extensive occlusion, ambiguous disease symptoms, or inconsistent class labels were manually excluded. Duplicate and near-duplicate samples were also removed. After harmonizing the class nomenclature across sources, 12,755 images were retained and assigned to eight categories: bacterial spot, early blight, healthy leaf, late blight, leaf mold, mosaic virus, Septoria leaf spot, and yellow leaf curl virus. Representative images of each category are shown in
Figure 1.
2.1.2. Data Preprocessing
All images were manually annotated using LabelImg, with the annotations stored in YOLO format. The complete visible leaf was defined as the detection target; accordingly, each bounding box delineated the entire leaf and was assigned the corresponding class label. The completed annotations were subsequently checked for missing or incorrect labels and bounding boxes extending beyond the image boundaries.
The detection task was formulated at the leaf level. Each visible leaf was assigned one bounding box and classified as either healthy or one of seven disease categories. Lesion regions were not separately annotated or evaluated.
The dataset was partitioned into training, validation, and test sets at a ratio of 8:1:1 using stratified random sampling, yielding 10,204, 1276, and 1275 images, respectively. To improve model robustness, mitigate overfitting, and reproduce the variability encountered in natural environments, online data augmentation was applied exclusively to the training set. The transformations included random horizontal and vertical flipping, scaling, translation, affine transformation, noise injection, image blurring, and illumination adjustment, thereby simulating variations in leaf orientation, target scale, viewing angle, lighting conditions, and image quality. The validation and test sets were not augmented and were used to evaluate model performance on the original images.
2.2. Overall Architecture of DFR-YOLOv12n
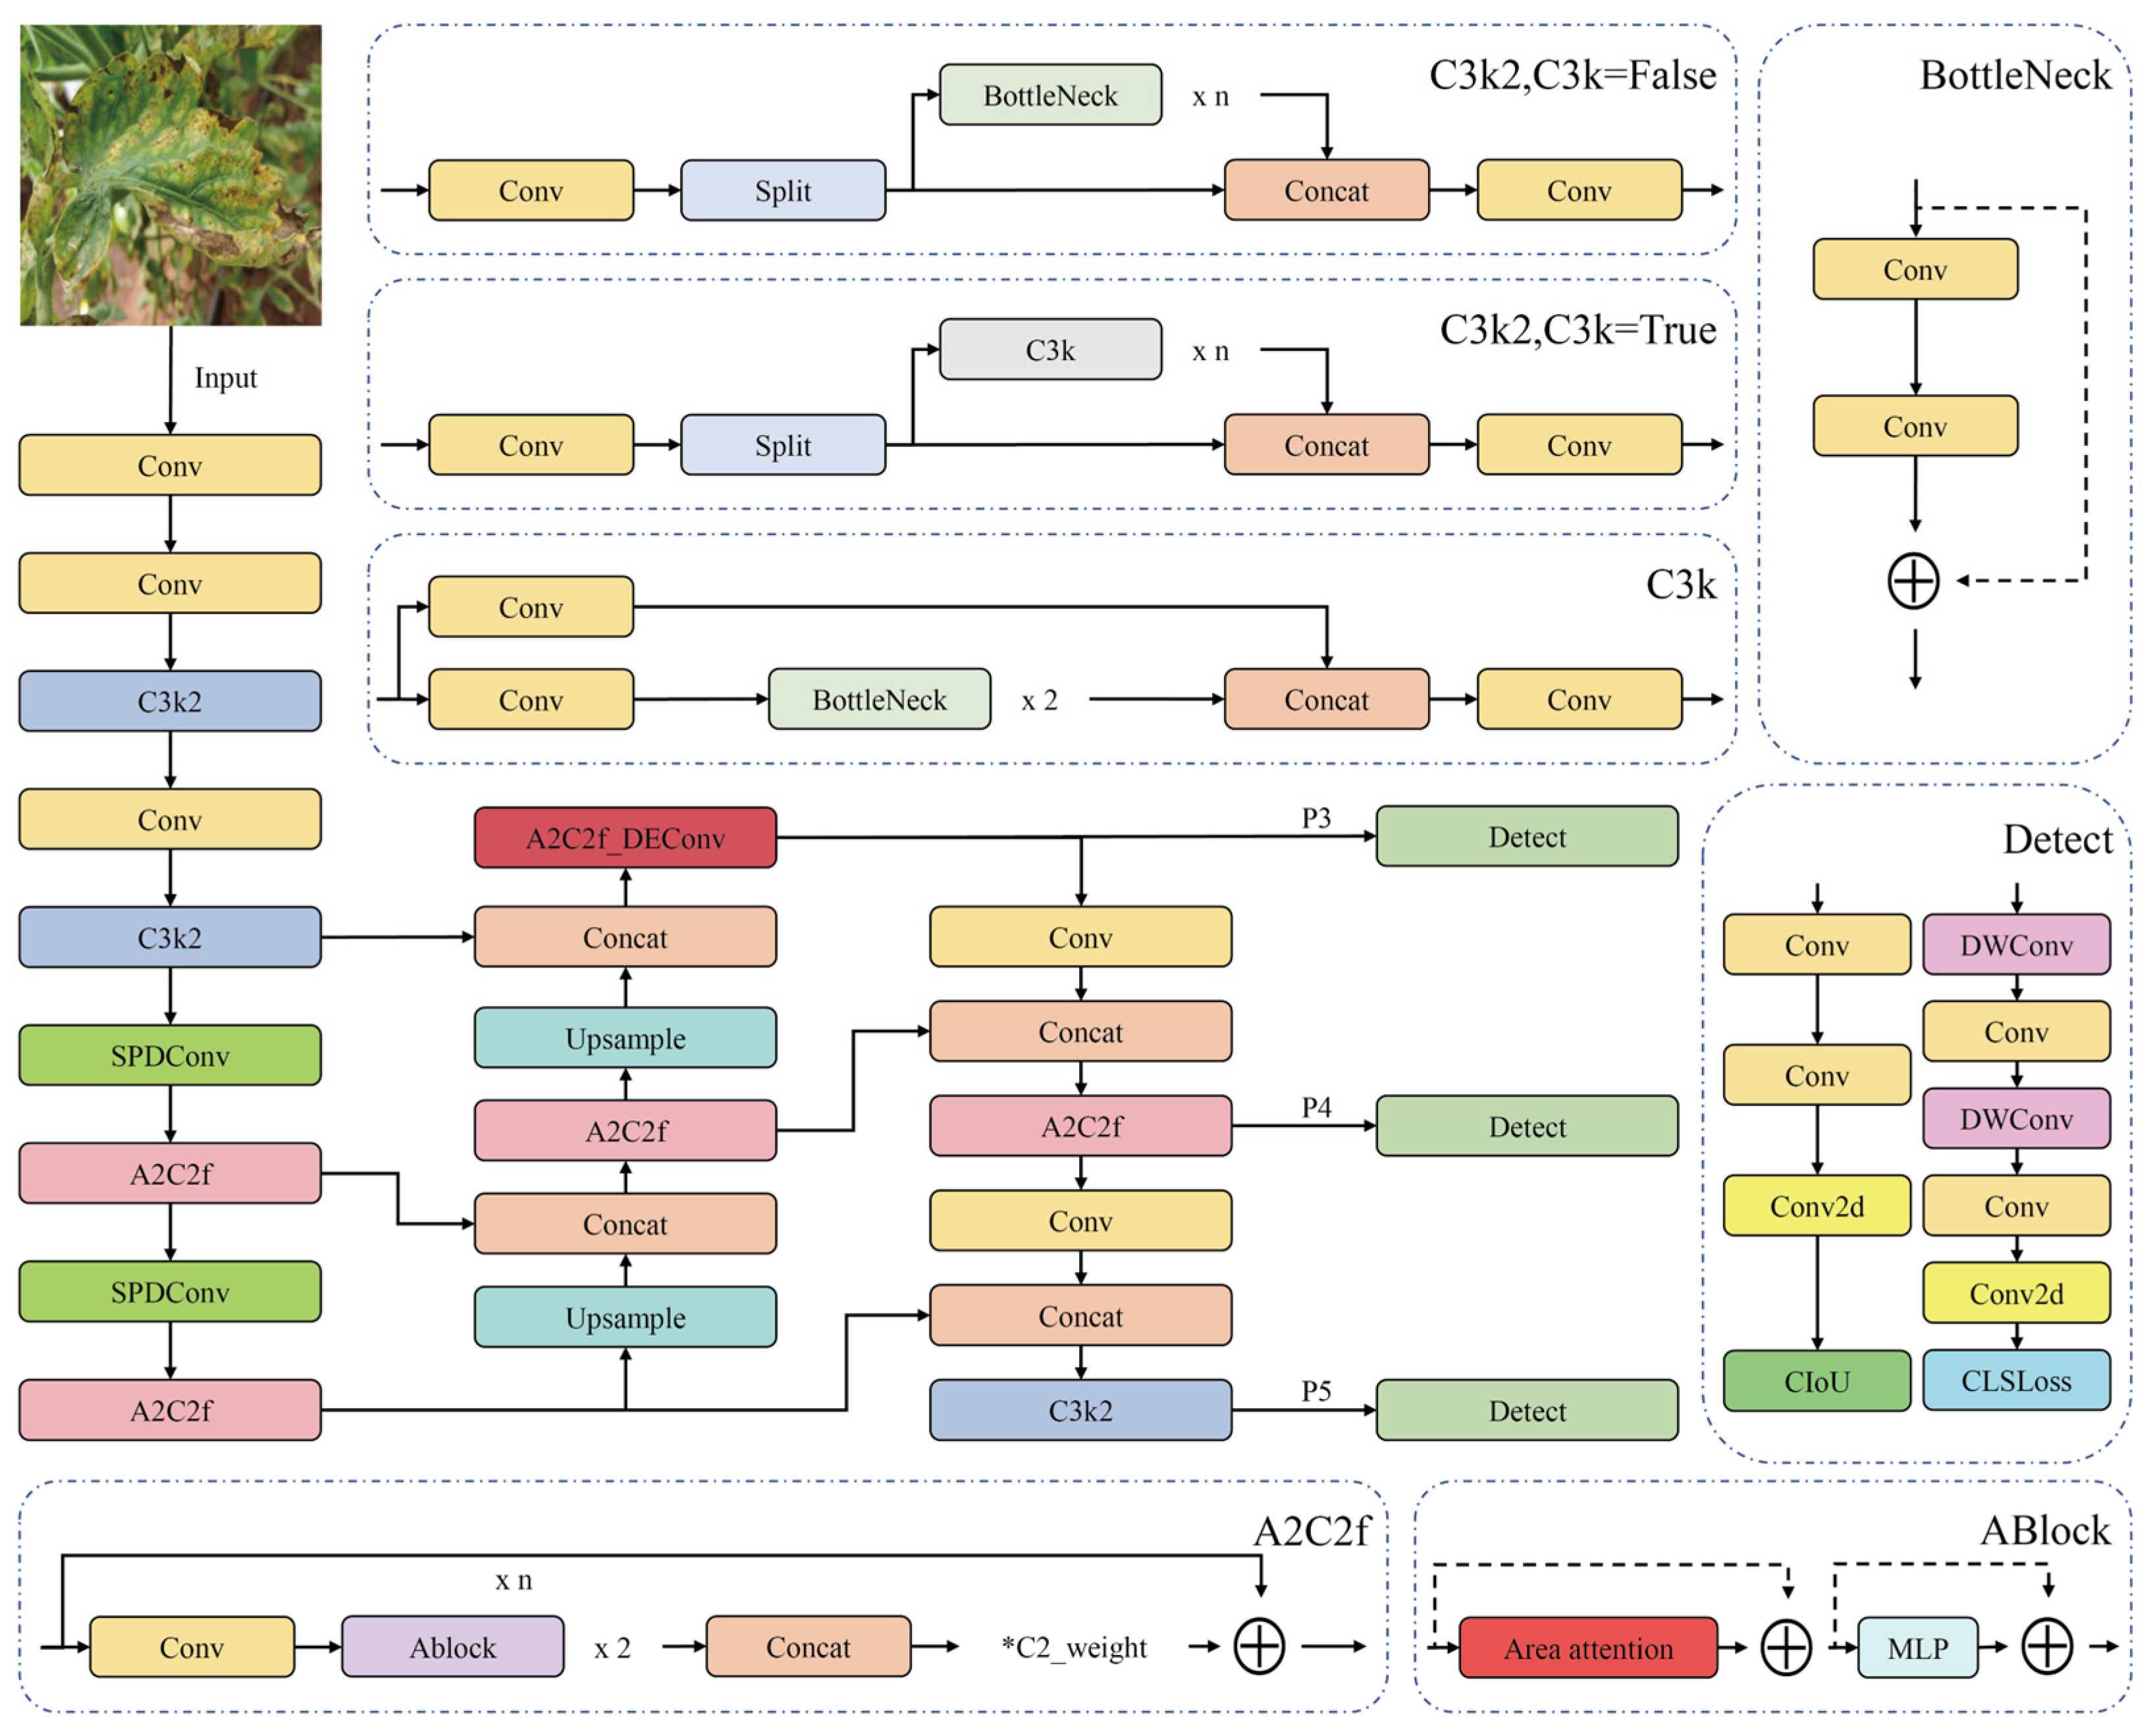
DFR-YOLOv12n was developed from YOLOv12n through three targeted modifications. First, the existing SPDConv module was inserted at key downsampling stages to preserve fine-grained disease-related visual cues during feature compression. Second, A2C2f_DEConv was introduced into the P3 feature-fusion branch to strengthen the representation of leaf texture and disease-related appearance features. Third, the existing MPDIoU loss was adopted for bounding-box regression. These modifications respectively target detail preservation, feature enhancement, and regression optimization while maintaining a lightweight architecture. The overall network structure is shown in
Figure 2.
2.3. Detail-Preserving Downsampling with SPDConv
In tomato leaf disease detection under natural field conditions, early symptoms may be subtle, weak in texture, and characterized by slight local color variations within the affected leaf. Although conventional stride-2 convolution can effectively reduce the spatial resolution of feature maps, it may also attenuate fine-grained disease-related cues during downsampling, thereby affecting leaf-level disease classification and localization. To address this issue, the existing SPDConv module was introduced to optimize the critical downsampling stages of the network.
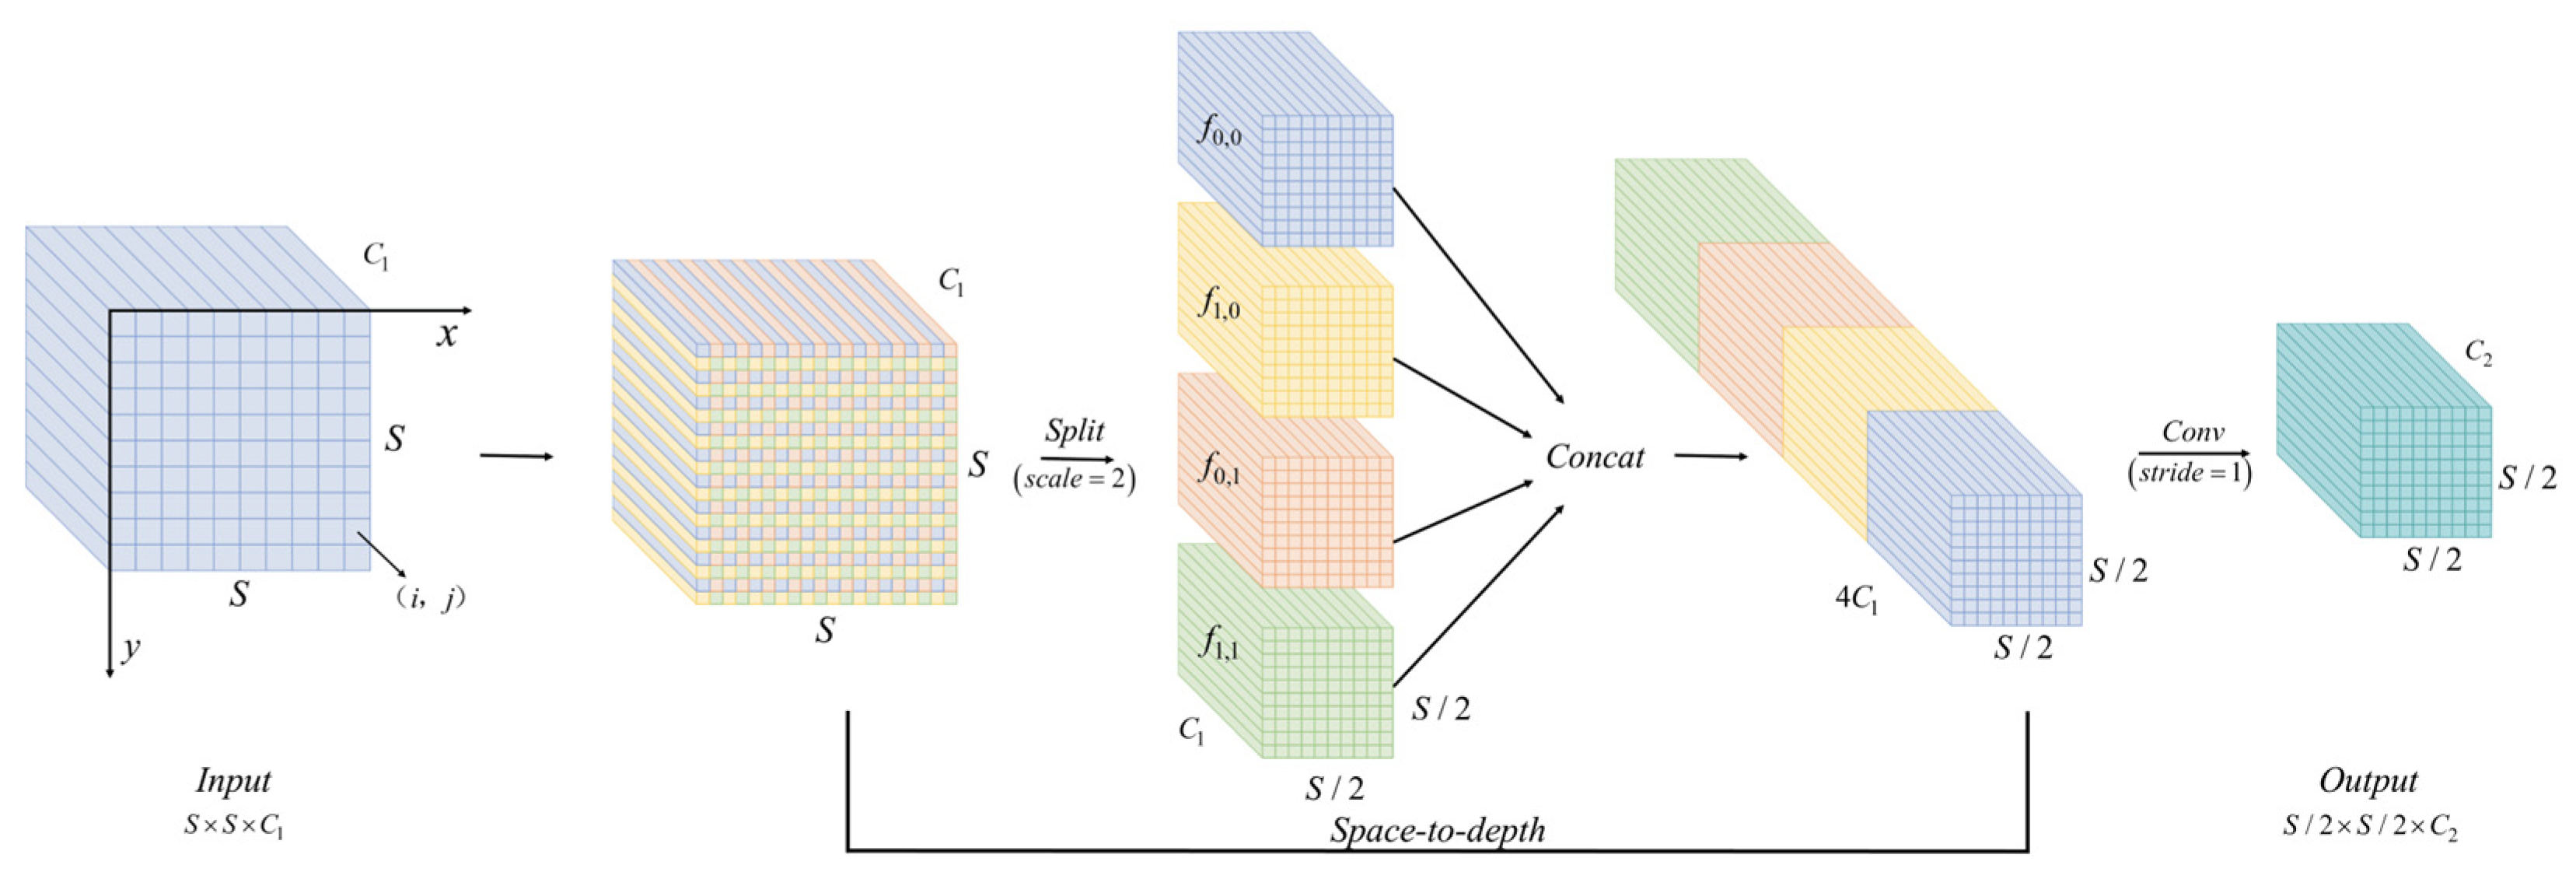
SPDConv is an existing CNN building block designed to replace the strided convolution and pooling operations commonly used in conventional CNN architectures. It consists of a Space-to-Depth layer followed by a non-strided convolution layer, and its overall workflow is illustrated in
Figure 3.
Specifically, let the input feature map be denoted as
, Taking the scale factor of 2 as an example, the SPD layer first performs regular interleaved sampling along the spatial coordinates to decompose the input into four sub-feature maps:
Each sub-feature map has a spatial size of
. These four sub-feature maps are then concatenated along the channel dimension to form a new intermediate feature representation:
Through this operation, the spatial resolution is reduced by half, while the pixel information is losslessly transferred to the channel dimension, thereby preserving more fine-grained feature information during downsampling.
After the SPD operation, a non-strided convolution layer is introduced to further fuse the rearranged features. Let the number of convolution kernels be
; the intermediate feature map can then be transformed into:
Without further reducing the spatial resolution, this non-strided convolution performs feature fusion and channel compression on the rearranged feature map, thereby completing the feature extraction process while retaining fine-grained information.
In conjunction with the baseline network architecture, the proposed method does not replace all downsampling layers globally. Instead, SPDConv is introduced only at two key downsampling positions in the deeper backbone stages, corresponding to the generation of the P4 and P5 feature layers. This design enhances the representation of fine-grained disease-related cues in deep feature maps while keeping the increase in model complexity acceptable, thus providing richer detail information for subsequent multi-scale feature fusion and detection.
2.4. High-Resolution Feature Enhancement with A2C2f_DEConv
Due to the characteristics of tomato leaf diseases in natural scenes, which may manifest as subtle symptom patterns and local texture differences within leaves, a high-resolution detection branch is particularly important for recognizing disease-related visual cues at the leaf level. In the detection head of YOLOv12n, the P3 branch retains a relatively high spatial resolution and is therefore important for preserving fine-grained visual cues that distinguish disease classes and for localizing leaves affected by occlusion, scale variation, or background interference. However, the baseline network still shows limited capability in local texture modeling within this branch, which may result in insufficient responses to subtle disease-related visual cues.
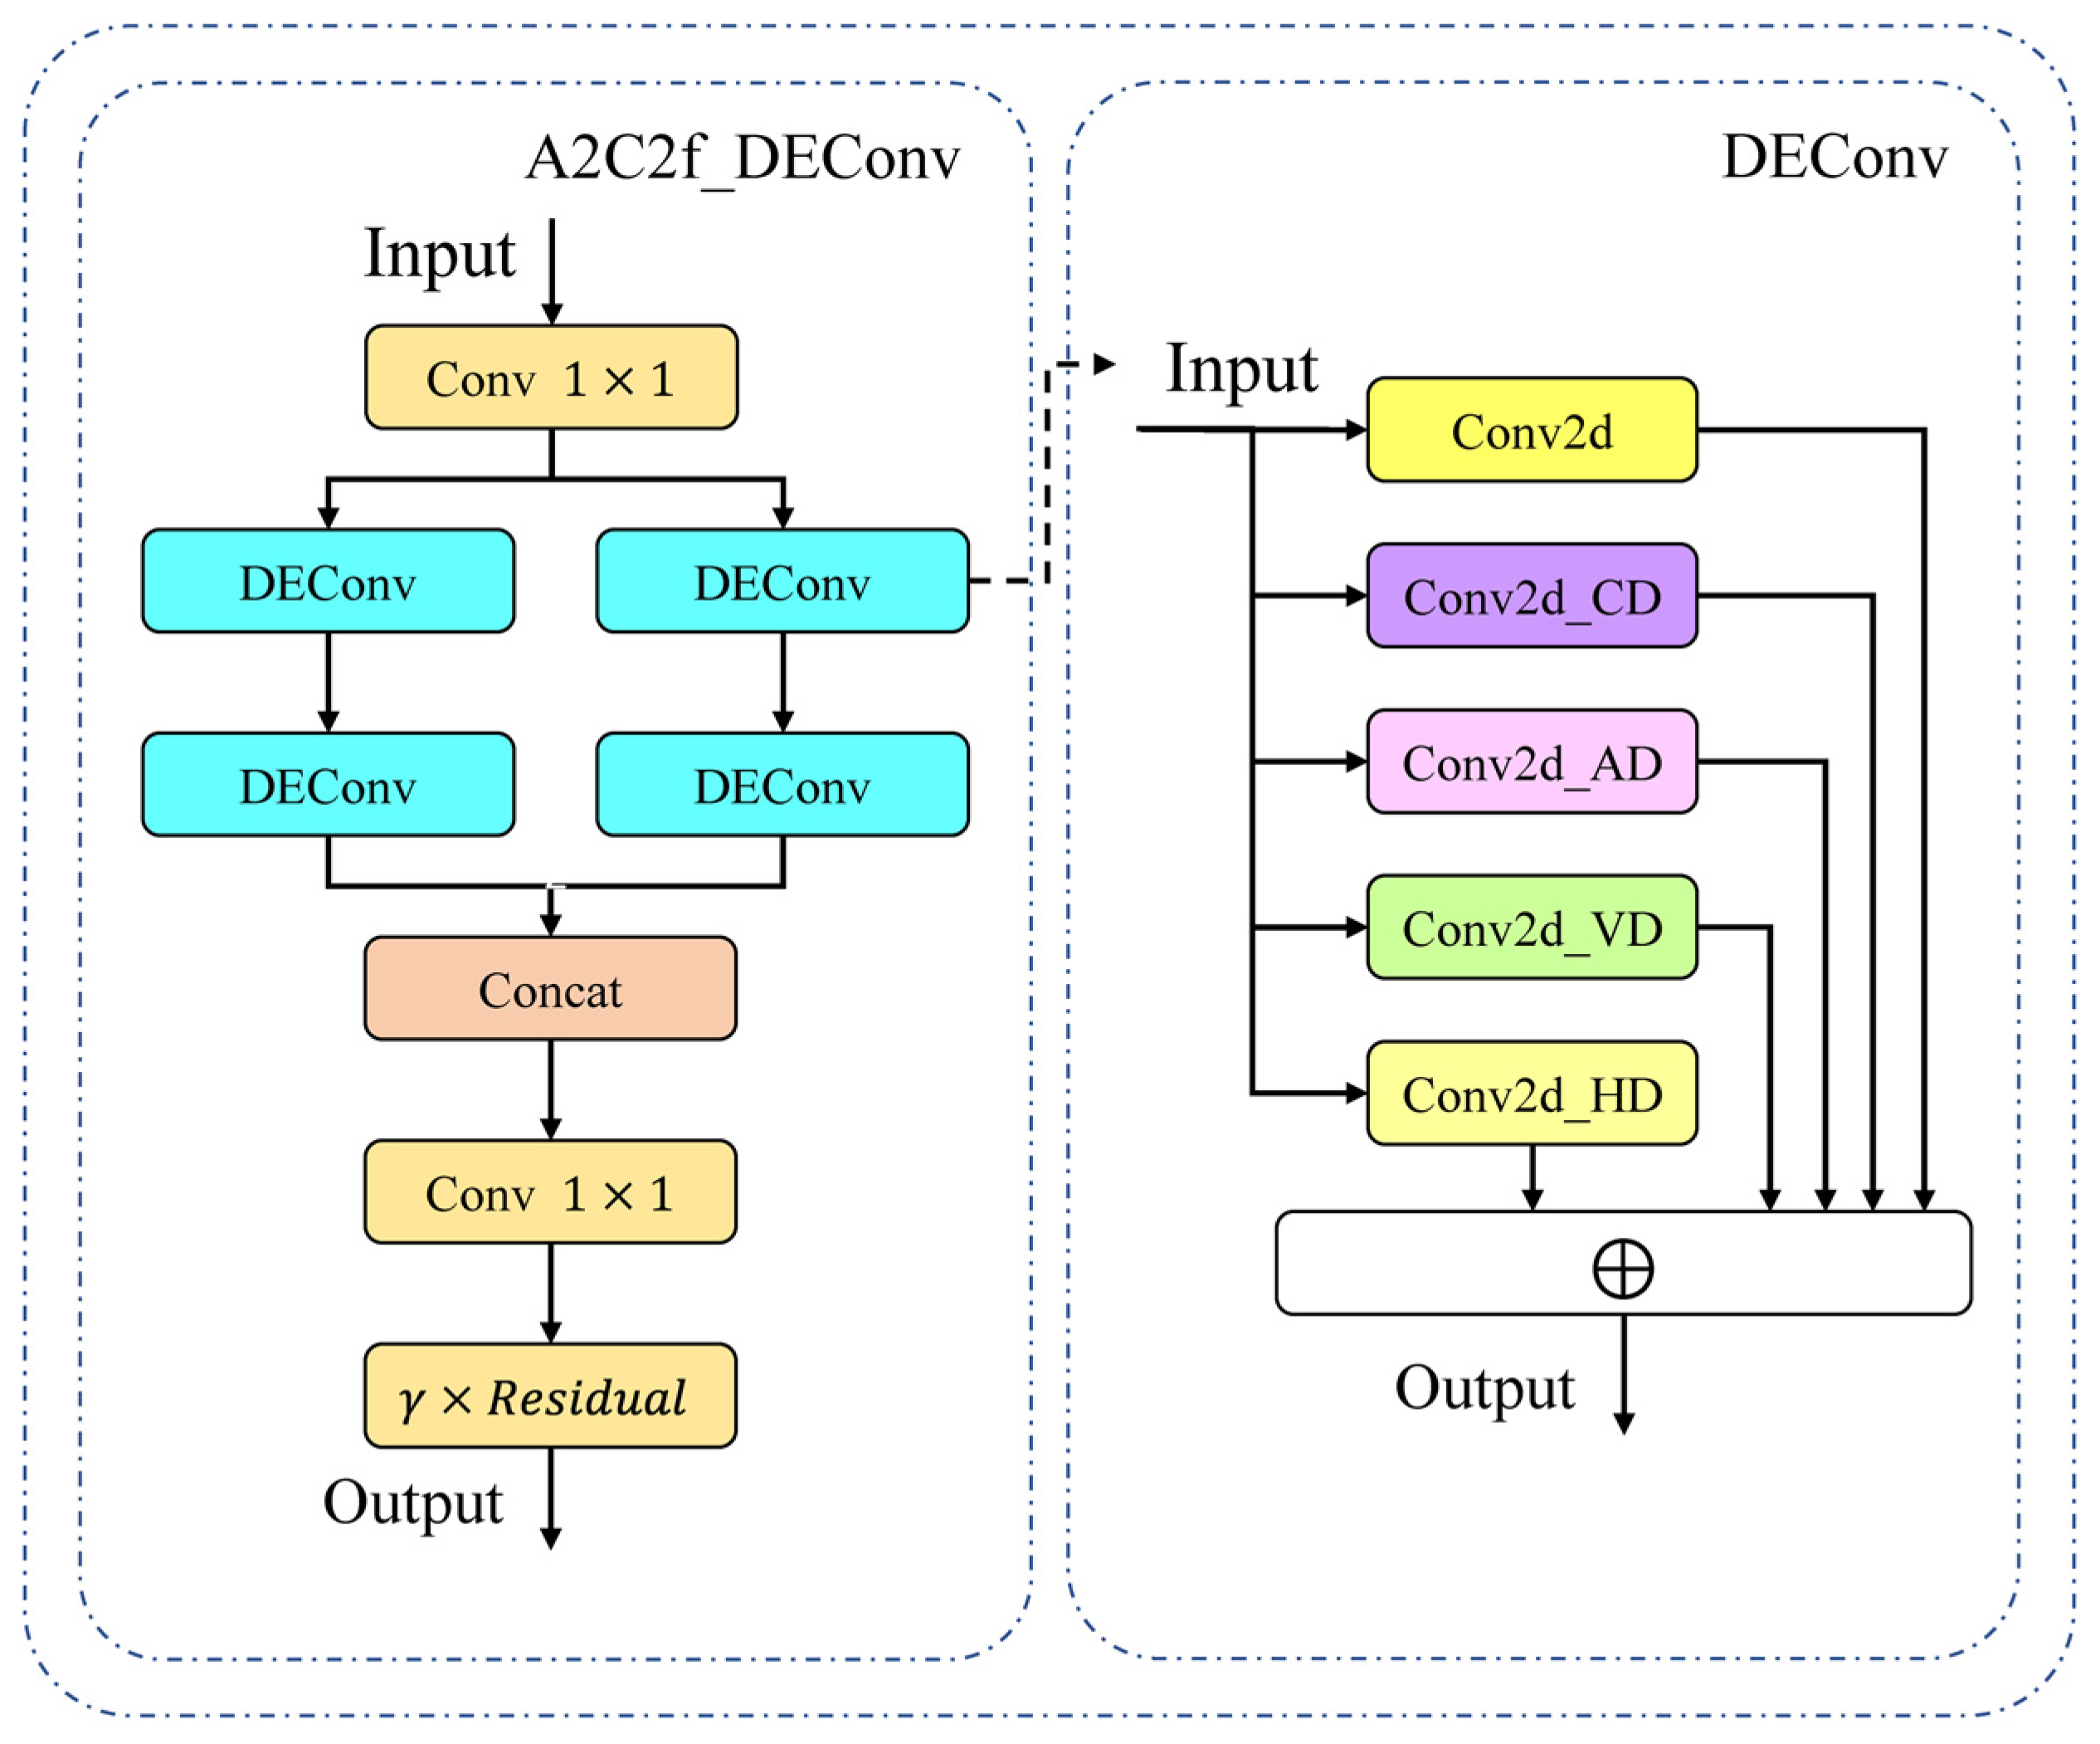
To address this issue, A2C2f_DEConv was introduced into the feature fusion module of the P3 branch to enhance the representation ability of shallow high-resolution features for leaf texture, disease-related appearance variations, and local structural patterns. DEConv is designed to enhance sensitivity to local structural changes and is therefore suitable for representing disease-related visual patterns under leaf-scale variation, partial occlusion, and complex backgrounds. Its structure is illustrated in
Figure 4.
To further enhance the representation capability of high-resolution features for fine-grained disease-related cues, the A2C2f_DEConv structure was introduced into the feature fusion module of the P3 branch. Built upon the original A2C2f architecture, this module replaces the conventional convolution units with DEConv, thereby introducing convolution operations that are more sensitive to fine-grained details while preserving the efficient feature aggregation capability of the ELAN-style structure. Specifically, A2C2f_DEConv first performs channel adjustment on the input features through a convolution, after which the features are split into multiple DEConv branches for progressive feature extraction. The multi-branch features are then fused through a Concat operation, followed by a convolution layer for feature integration. Furthermore, by introducing a residual connection with a learnable scaling factor , the module not only effectively alleviates the gradient vanishing problem during deep feature extraction, but also adaptively recalibrates high-frequency detail features, thereby enabling more stable feature propagation.
The DEConv module enhances fine-detail representation by integrating multiple differential convolution operators with standard convolution, thereby capturing image variations from different directions and scales. Specifically, Central Difference Convolution (CDC) is used to enhance local texture gradient information; Horizontal Difference Convolution (HDC) and Vertical Difference Convolution (VDC) strengthen edge responses in the horizontal and vertical directions, respectively; and Angular Difference Convolution (ADC) further improves the perception of diagonal structural features. Through the joint modeling of features with these multi-branch convolution operations, the network becomes more sensitive to disease-related appearance patterns and local texture variations, thereby improving leaf-level disease detection under natural and complex background conditions.
It is worth noting that DEConv adopts a multi-branch differential convolution structure during training to enhance feature representation. During inference, however, the weights of these branches can be equivalently fused into a standard convolution kernel through re-parameterization, thereby preserving the detail-enhancement capability without introducing additional computational overhead. In this way, a favorable balance between performance and efficiency can be achieved.
Different from strategies that introduce complex feature enhancement modules across multiple scale branches, the proposed method applies this improvement only to the high-resolution P3 branch, so as to balance the detection of leaves with subtle disease symptoms with the requirement for lightweight deployment. Without significantly increasing model complexity, this design was intended to enhance the representation of fine-grained disease-related cues while limiting additional model complexity.
2.5. Bounding Box Regression Optimization with MPDIoU
In natural field environments, partial occlusion, leaf overlap, complex background textures, and diverse leaf orientations can increase the difficulty of whole-leaf localization. These factors can further degrade bounding-box regression accuracy. Although the baseline model can detect diseased leaves, the conventional bounding box regression loss adopted in the baseline still provides insufficient geometric constraints when localizing leaves that are partially occluded, scale-variable, or difficult to separate from the background. To improve the localization quality of diseased-leaf targets, the original bounding box regression loss in the baseline model was replaced with the existing MPDIoU loss.
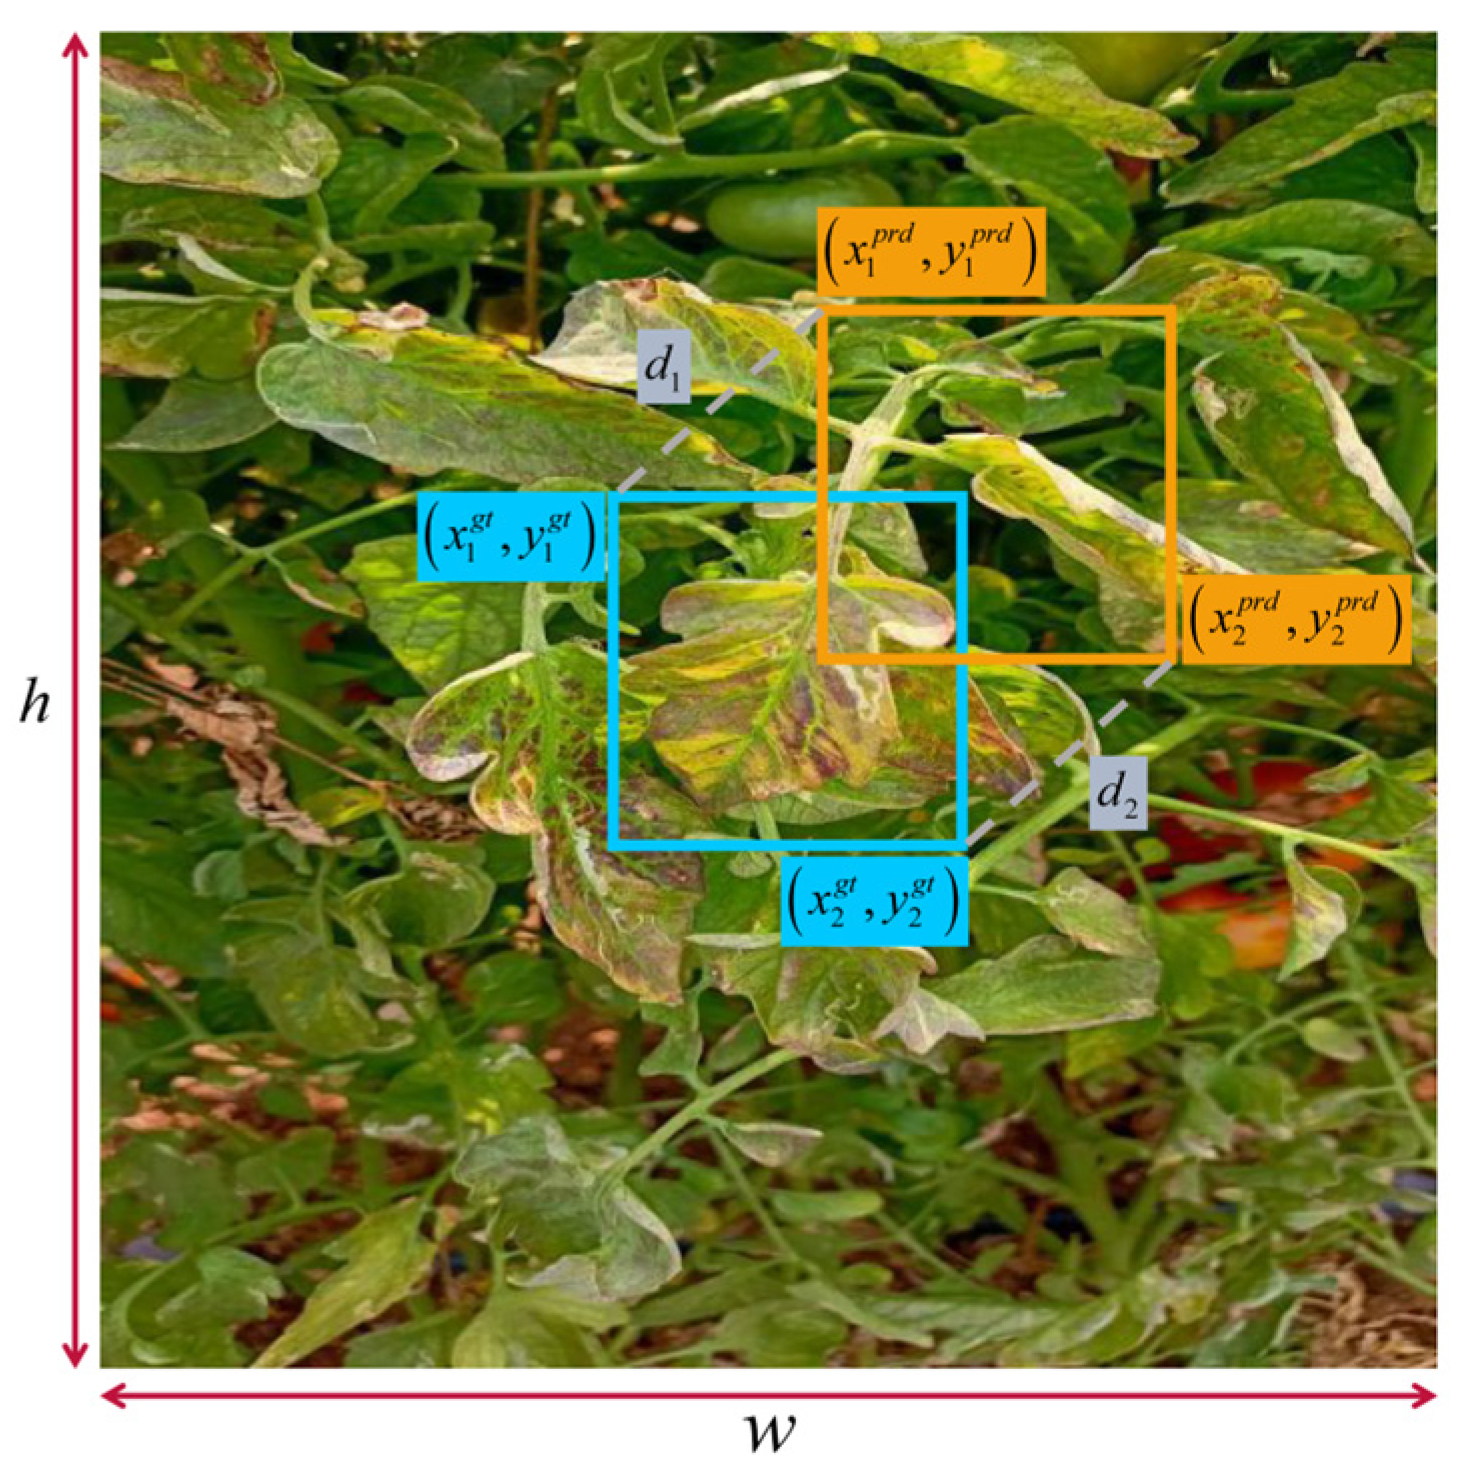
Built upon the traditional IoU metric, MPDIoU introduces distance constraints between the corresponding corner points of the predicted box and the ground-truth box. It not only considers the overlap between the two boxes, but also further characterizes their spatial displacement relationship, as illustrated in
Figure 5. Specifically, let the ground-truth box and the predicted box be denoted as and, heir top-left and bottom-right coordinates are given by, respectively. Here, d1 and d2 denote the Euclidean distances between the top-left corners and the bottom-right corners of the predicted box and the ground-truth box, respectively, while w and h represent the width and height of the minimum enclosing rectangle covering both boxes. By jointly considering overlap information and corner-point distance information, MPDIoU provides more effective geometric constraints for bounding box regression. The formulation is given as follows:
Accordingly, the bounding box regression loss based on MPDIoU is defined as:
Compared with overlap-only IoU losses, MPDIoU additionally considers the distances between corresponding corner points of the predicted and ground-truth boxes. This property may provide complementary geometric constraints during regression, particularly for targets with irregular shapes or ambiguous boundaries.
In summary, SPDConv, A2C2f_DEConv, and MPDIoU were complement one another from the perspectives of detail preservation, feature enhancement, and localization optimization, jointly improving the detection performance of the model in complex natural scenes.
4. Experimental Results and Analysis
4.1. Ablation Experiments
To systematically evaluate the influence of each proposed improvement on model performance, ablation experiments were conducted using YOLOv12n as the baseline model. Three main improvements were introduced in this study, namely SPDConv, A2C2f_DEConv, and the MPDIoU loss function. Based on the baseline model, a series of intermediate models were progressively constructed to analyze the effects of individual and combined modules on detection performance and model complexity. Specifically, Model 1 incorporates SPDConv into the baseline model, Model 2 introduces A2C2f_DEConv, Model 3 replaces the original bounding box regression loss with MPDIoU, and Model 4 combines both SPDConv and A2C2f_DEConv. The final model, DFR-YOLOv12n, integrates all three improvements. The experimental results are presented in
Table 1.
As shown in
Table 1, the individual modifications and their combinations produced different effects on detection accuracy and model complexity. Compared with the baseline YOLOv12n, Model 1 increased Precision and Recall from 86.8% and 76.9% to 87.0% and 77.5%, respectively. The mAP@0.5 and mAP@0.5:0.95 increased from 86.5% and 70.5% to 86.9% and 71.0%, respectively, while reducing FLOPs, parameters, and model size from 5.83 G, 2.51 M, and 5.22 MB to 5.44 G, 2.26 M, and 4.76 MB. These results indicate that SPDConv improves detection accuracy while effectively reducing computational and storage costs. Model 2 with A2C2f_DEConv increased Precision, Recall, mAP@0.5, and mAP@0.5:0.95 to 87.2%, 78.2%, 87.0%, and 70.8%, respectively. Meanwhile, FLOPs decrease to 5.66 G and FPS increases to 638.45, indicating that the accuracy gains were obtained without increasing the computational cost. For Model 3, replacing the original regression loss with MPDIoU raises Precision, Recall, mAP50, and mAP@0.5:0.95 to 87.3%, 78.8%, 87.3%, and 70.8%, respectively, without changing FLOPs, parameters, or model size, because only the loss function was replaced in this variant, these improvements were obtained without introducing additional structural complexity. Among the three single-module variants, Model 3 achieved the largest mAP@0.5 gain of 0.8 percentage points, whereas Model 1 achieved the highest mAP@0.5:0.95 of 71.0%. When SPDConv and A2C2f_DEConv are jointly introduced, Model 4 achieves 87.7% Precision, 79.1% Recall, and 87.0% mAP50, while FLOPs, parameters, and model size are reduced to 5.27 G, 2.25 M, and 4.71 MB, respectively, and FPS increases to 647.21. However, its mAP@0.5:0.95 was 70.4%, which was 0.1 percentage points lower than that of the baseline. Therefore, Model 4 primarily improved recall and inference efficiency, but did not improve performance under the stricter averaged IoU criterion.
After integrating all three improvements, DFR-YOLOv12n achieved the highest Precision, Recall, mAP@0.5, and FPS, reaching 88.1%, 81.7%, 88.6%, and 648.16, respectively. Its mAP@0.5:0.95 reached 70.7%, which was 0.2 percentage points higher than that of the baseline but 0.3 percentage points lower than that of Model 1. Compared with the baseline, Precision, Recall, mAP@0.5, and mAP@0.5:0.95 increased by 1.3, 4.8, 2.1, and 0.2 percentage points, respectively. Overall, the combined configuration simultaneously improved mAP@0.5 and recall while reducing model complexity and increasing inference speed, although it did not achieve the highest mAP@0.5:0.95.
4.2. Comparison Experiments of SPDConv Located at Different Positions
To further investigate the effect of SPDConv at different network positions and determine its optimal insertion strategy, a series of comparative experiments were conducted based on the YOLOv12n baseline model. Considering that the core mechanism of SPDConv is to preserve complete channel information during downsampling so as to reduce the loss of fine-grained features, placing it at different network depths or structures may lead to substantially different effects on feature extraction efficiency and computational cost. Therefore, SPDConv was separately introduced into the entire network, all downsampling stages of the backbone, the neck, and the combined rear backbone and neck positions, and the results were compared with those of the final insertion strategy adopted in this study. The experimental results are presented in
Table 2.
As shown in
Table 2, the placement of SPDConv affected both detection accuracy and model complexity. When SPDConv is introduced throughout the entire network, the FLOPs decrease from 5.83 G to 5.39 G and the model size is reduced from 5.22 MB to 4.57 MB, indicating a clear lightweighting effect. However, the mAP50 drops to 85.2%, which is 1.3 percentage points lower than that of the baseline model. The mAP@0.5:0.95 also decreased from 70.5% to 69.8%, corresponding to a reduction of 0.7 percentage points. Thus, global placement reduced model complexity but decreased detection performance under both evaluation criteria. When SPDConv was applied at all backbone positions, mAP@0.5 and mAP@0.5:0.95 decreased to 84.5% and 69.7%, respectively. Although the model size decreased to 4.77 MB, the FLOPs increased to 8.00 G This configuration therefore did not provide a favorable trade-off between detection accuracy and computational complexity. In contrast, applying SPDConv only to the neck increased mAP@0.5 and mAP@0.5:0.95 to 87.2% and 70.9%, respectively. These values were 0.7 and 0.4 percentage points higher than those of the baseline. Meanwhile, the FLOPs decrease to 5.70 G and the model size is reduced to 5.03 MB. Among the tested placements, the neck-only configuration achieved the highest mAP@0.5 and improved both accuracy metrics while reducing FLOPs and model size. Furthermore, when SPDConv was introduced into the P4 and P5 backbone stages and the neck, mAP@0.5 reached 86.6%, representing an increase of only 0.1 percentage points. Its mAP@0.5:0.95 remained at 70.5%, the same as that of the baseline. Although FLOPs and model size decreased to 5.31 G and 4.56 MB, respectively, this configuration provided little improvement in detection accuracy. This suggests that although this strategy performs well in terms of lightweight design, its gain in detection accuracy is not sufficiently prominent.
Overall, the final placement adopted in this study achieved an mAP@0.5 of 86.9% and the highest mAP@0.5:0.95 of 71.0%. Compared with the baseline, these metrics increased by 0.4 and 0.5 percentage points, respectively. Meanwhile, FLOPs decreased from 5.83 G to 5.44 G, and model size decreased from 5.22 MB to 4.76 MB. Although the neck-only configuration achieved a 0.3-percentage-point higher mAP@0.5, the selected scheme produced a 0.1-percentage-point higher mAP@0.5:0.95. It also reduced FLOPs by 0.26 G and model size by 0.27 MB relative to the neck-only configuration. Therefore, this placement was selected to balance detection accuracy under different IoU criteria, computational complexity, and storage requirements.
4.3. Comparison Experiments of Different Feature Extraction Modules
To further verify the effectiveness of the introduced A2C2f_DEConv module and evaluate the influence of different feature extraction modules on model performance, comparative experiments were conducted under the same experimental conditions using Model 1 as the baseline. Specifically, HWD [
29], SCConv [
30], C3RFEM [
31], and A2C2f_DEConv were separately introduced for comparison. The experimental results are presented in
Table 3.
As shown in
Table 3, different feature extraction modules lead to clear differences in detection accuracy, model complexity, and inference speed. HWD increased Recall and mAP@0.5 to 78.3% and 87.0%, respectively, while reducing FLOPs and model size to 5.31 G and 4.56 MB. However, its mAP@0.5:0.95 decreased to 70.7%, and its FPS decreased to 440.48. SCConv reduced FLOPs and model size to 5.27 G and 4.71 MB, respectively, but its Precision, Recall, mAP@0.5, and mAP@0.5:0.95 were lower than those of Model 1. In contrast, C3RFEM increased FLOPs and model size to 5.48 G and 4.77 MB, respectively. Although it achieved the highest Precision of 89.1%, its Recall, mAP@0.5, mAP@0.5:0.95, and FPS were lower than those of Model 1.
In contrast, A2C2f_DEConv achieves the most balanced results. After introducing A2C2f_DEConv, the model attains 87.7% Precision, 79.1% Recall, 87.0% mAP@0.5, and 70.4% mAP@0.5:0.95, while reducing FLOPs to 5.27 G and model size to 4.71 MB. Meanwhile, FPS reaches 647.21, the highest among all compared methods. These results demonstrate that A2C2f_DEConv can effectively enhance feature extraction while maintaining low model complexity and high inference efficiency.
Overall, although each module exhibits advantages in specific metrics, A2C2f_DEConv provides the best trade-off between detection accuracy, lightweight design, and real-time performance. Therefore, it was selected as the feature extraction module in DFR-YOLOv12n.
4.4. Comparison Experiments of Different IoU Loss
To analyze the influence of different IoU loss functions on model performance, comparative experiments were conducted using Model 4 with the default CIoU as the baseline. Specifically, EIoU [
32], SIoU [
33], DIoU [
34], GIoU [
35], ShapeIoU [
36], Inner-CIoU [
37], and Focaler-CIoU [
38] were selected for comparison. The results are presented in
Table 4.
As shown in
Table 4, the evaluated IoU losses exhibited a metric-dependent trade-off. DIoU achieved the highest mAP@0.5:0.95 of 71.2%, which was 0.5 percentage points higher than that of MPDIoU, indicating better performance under stricter IoU thresholds. In contrast, MPDIoU achieved the highest mAP@0.5 of 88.6%, exceeding DIoU by 0.6 percentage points. Because this study focuses on the detection and classification of complete disease-affected leaves rather than precise lesion-boundary delineation, mAP@0.5 was used as the primary criterion for selecting the regression loss. MPDIoU was therefore retained in the final model.
4.5. Comparison Experiments of Various Object Detection Models
Based on the ablation experiments and the verified effectiveness of each proposed improvement, further comparative experiments were conducted to comprehensively evaluate the performance of the proposed model in tomato leaf disease detection. A series of mainstream object detection models, including YOLOv5n [
39], YOLOv7-tiny [
40], YOLOv8n [
41], YOLOv9-tiny [
42], YOLOv10n [
43], YOLOv11n [
44], YOLOv12s, YOLOv12m, and YOLOv26n, were selected for comparison. All models were trained and tested under the same dataset and training conditions, and their performance was comprehensively analyzed from the perspectives of detection accuracy and model complexity. The results are presented in
Table 5.
As shown in
Table 5, the compared models exhibited different trade-offs between detection accuracy and model complexity. The YOLOv5n–YOLOv11n baselines achieved mAP@0.5 values ranging from 85.1% to 87.2% and mAP@0.5:0.95 values ranging from 67.5% to 70.0%. Among these models, YOLOv10n achieved the highest values for both metrics, but required 8.24 G FLOPs. YOLO26n reduced the computational cost to 5.40 G FLOPs, while achieving an mAP@0.5 of 86.4% and an mAP@0.5:0.95 of 69.9%. The larger YOLOv12s and YOLOv12m models increased mAP@0.5:0.95 to 71.7% and 72.4%, respectively. However, their parameter counts increased to 9.28 M and 20.20 M, while their FLOPs reached 21.70 G and 68.10 G.
DFR-YOLOv12n achieved the highest mAP@0.5 of 88.6%, together with an mAP@0.5:0.95 of 70.7%. It required 2.25 M parameters, 5.27 G FLOPs, and 4.71 MB of model storage. Compared with YOLO26n, DFR-YOLOv12n improved mAP@0.5 and mAP@0.5:0.95 by 2.2 and 0.8 percentage points, respectively. It also reduced the parameter count, FLOPs, and model size by 0.15 M, 0.13 G, and 0.34 MB, respectively. Although YOLOv12s and YOLOv12m achieved higher mAP@0.5:0.95 values, both required substantially greater computational and storage resources. Therefore, DFR-YOLOv12n combined the highest mAP@0.5 with nano-scale model complexity, providing a favorable balance between detection accuracy and computational cost.
4.6. Visualization of Detection Results
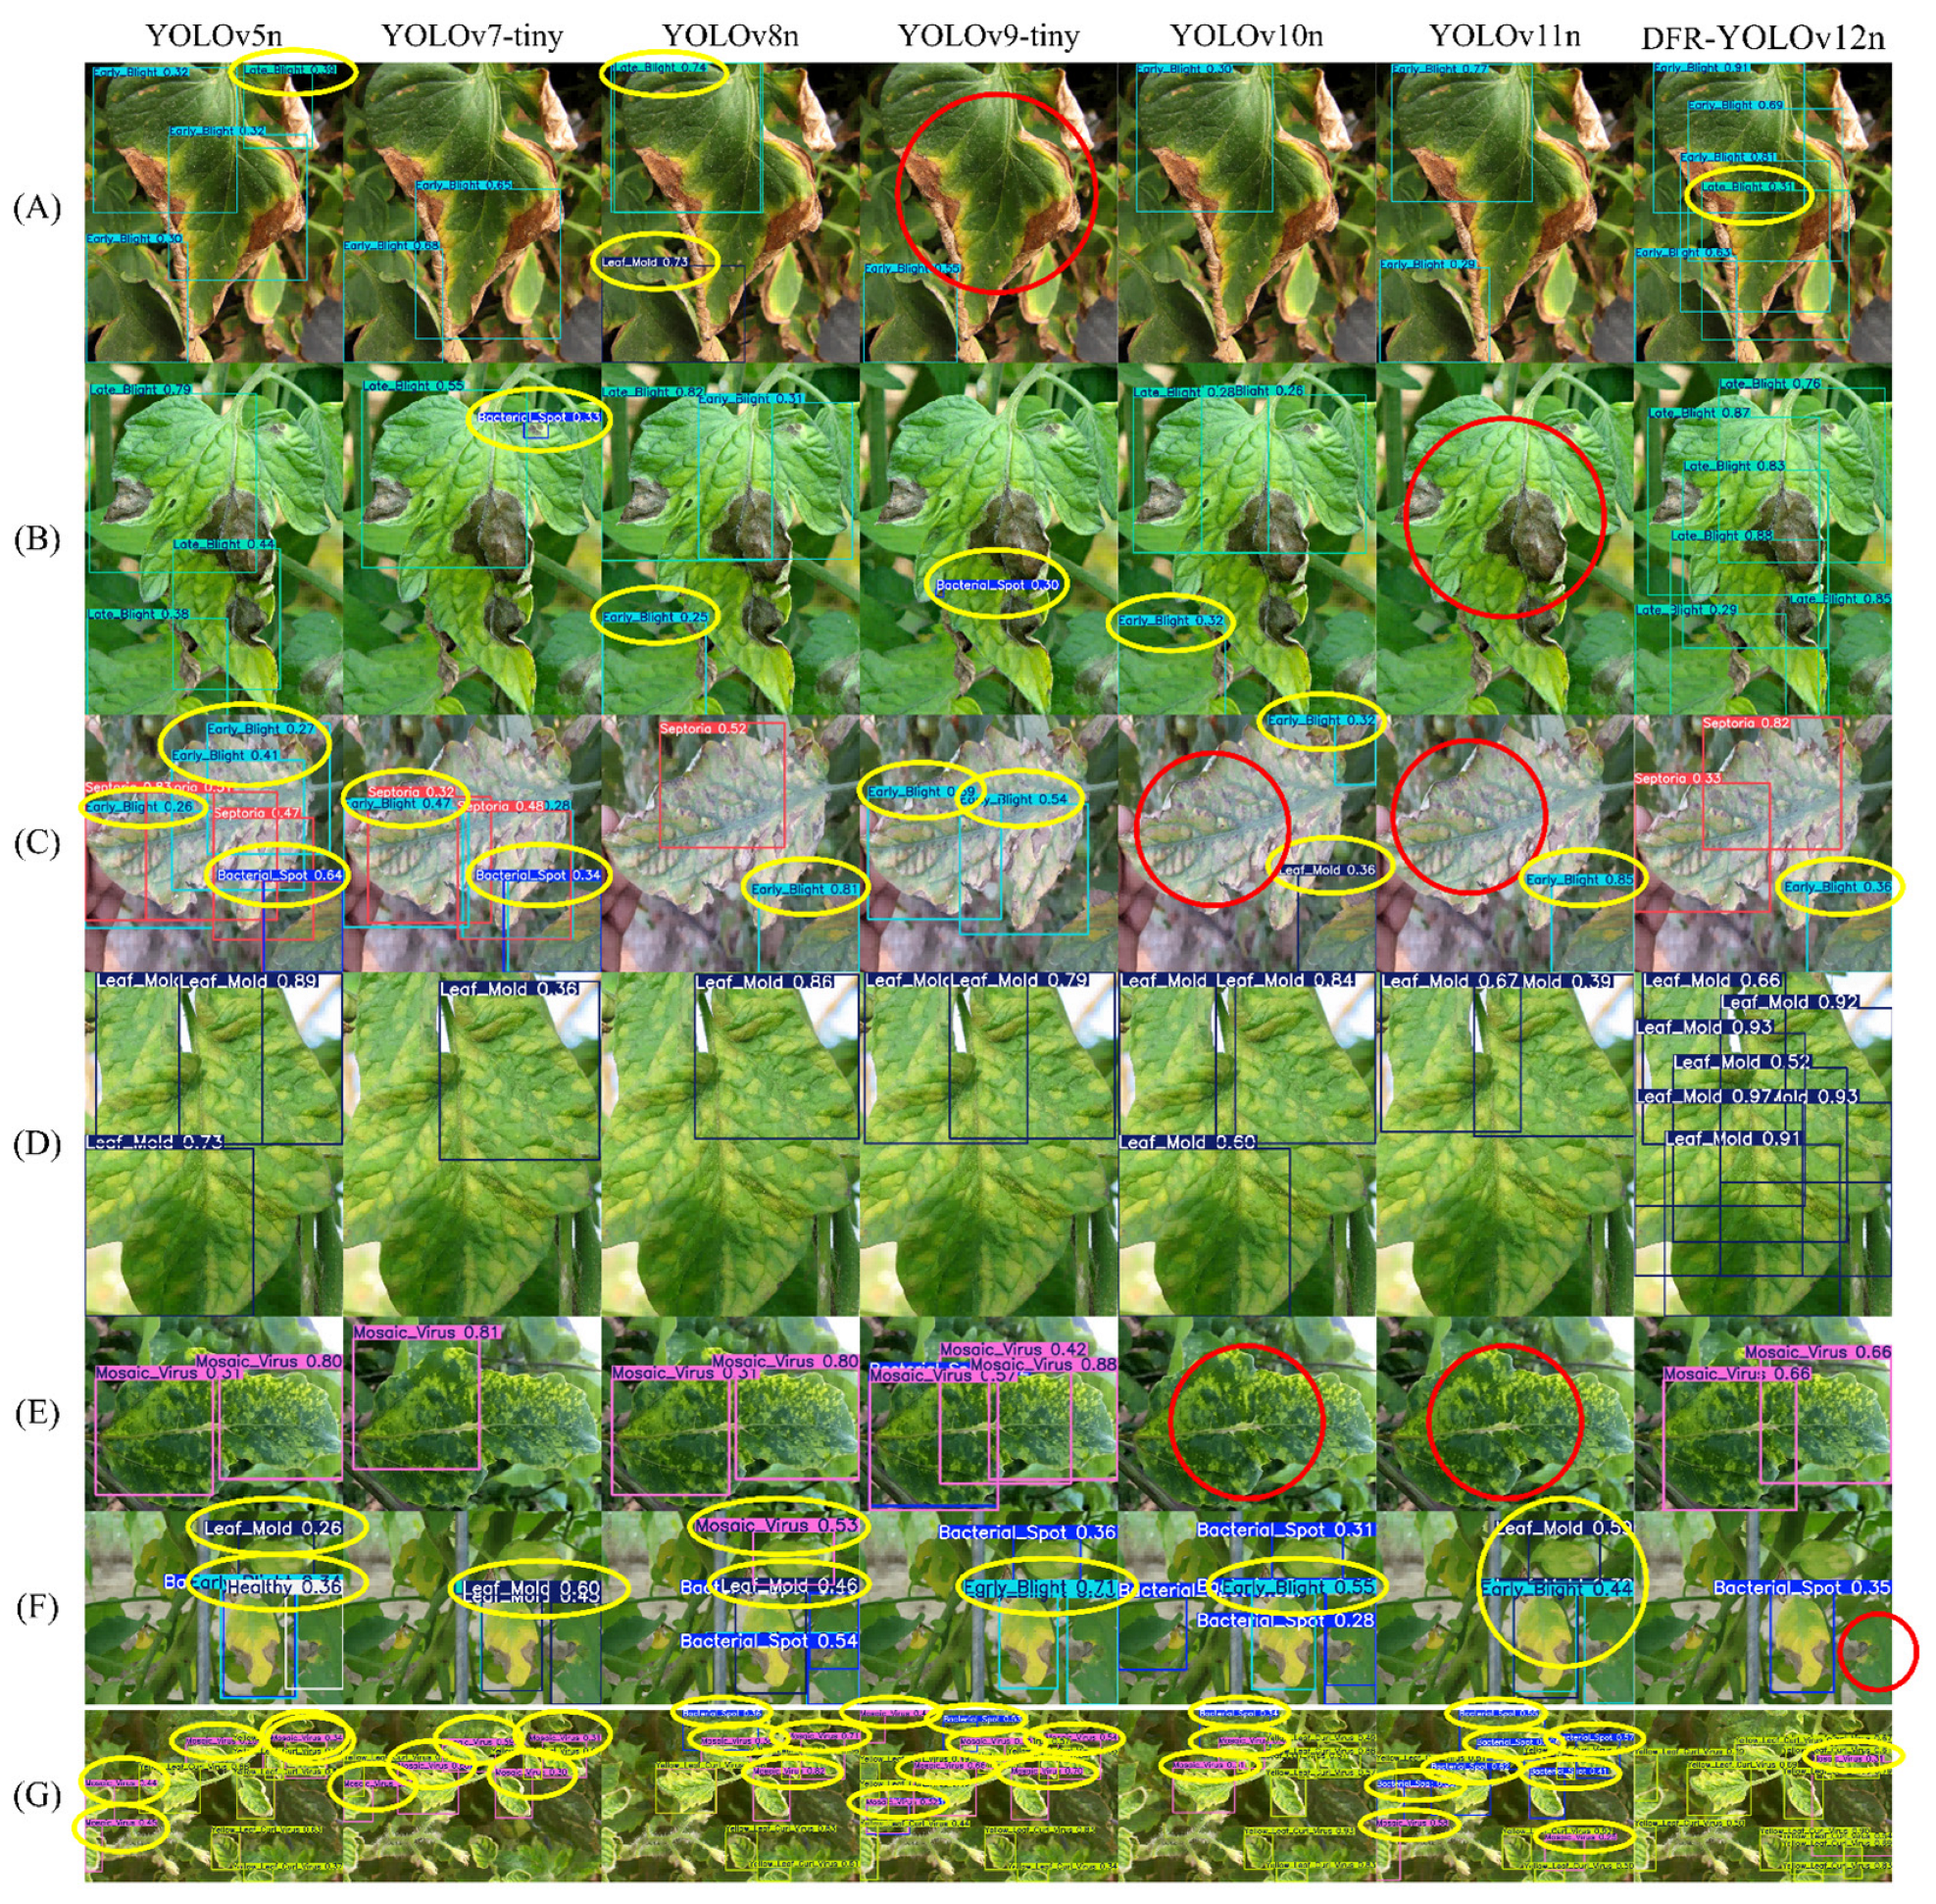
To provide a more intuitive evaluation of the disease detection performance of the proposed DFR-YOLOv12n model under real natural conditions, several representative tomato leaf images containing multi-scale lesions, complex background interference, and densely distributed targets were selected for visual comparison with current mainstream YOLO-series models. The detection results are shown in
Figure 6.
As shown in
Figure 6, clear differences can be observed among the compared models in complex natural scenes. In samples (A) and (B), some competing models fail to completely identify diseased leaves, resulting in missed detections or incorrect category predictions, whereas DFR-YOLOv12n localizes diseased leaves more accurately with more complete bounding-box coverage. In samples (C) and (G), where leaves are densely distributed, partially occluded, and subject to strong background interference, the other YOLO-series models exhibit varying degrees of false detections and missed detections. In contrast, DFR-YOLOv12n detects more valid leaf targets while effectively suppressing redundant bounding boxes, demonstrating stronger fine-grained disease-cue representation and better resistance to background interference. In samples (D) and (E), where disease-related visual patterns are weak and affected leaves are difficult to distinguish from the background, some compared models tend to misclassify background textures as diseased leaves or fail to fully localize the affected leaf, whereas DFR-YOLOv12n still maintains relatively accurate detection, indicating stronger fine-grained feature representation capability. In sample (F), DFR-YOLOv12n also produces more stable detection results for small or sparsely distributed diseased leaves.
Overall, DFR-YOLOv12n demonstrates superior detection performance across different types of tomato leaf disease samples. In particular, it effectively reduces false detections and missed detections under scenarios involving complex backgrounds, subtle disease symptoms, leaf overlap, and scale variation. These results further confirm the robustness and practical applicability of the proposed model in real-world tomato leaf disease detection tasks.
4.7. Edge Device Deployment Experiment
To further evaluate the deployment feasibility of DFR-YOLOv12n on a resource-constrained platform, a quantitative edge-deployment benchmark was conducted on the Jetson Nano B01 platform under the unified configuration described. Both YOLOv12n and DFR-YOLOv12n were exported to ONNX format and converted into FP16 TensorRT engines on the same Jetson Nano device. The two models were evaluated using identical preprocessing, post-processing, input resolution, batch size, and benchmark procedures to ensure a fair comparison.
As shown in
Table 6, DFR-YOLOv12n reduced the FLOPs, parameter count, and model size by 9.6%, 10.4%, and 9.8%, respectively, compared with YOLOv12n. Under the same edge-deployment configuration, DFR-YOLOv12n achieved a mean end-to-end latency of 124.599 ms, which was 10.4% lower than that of YOLOv12n (139.061 ms). Its P95 end-to-end latency was reduced from 152.849 ms to 130.132 ms, corresponding to a reduction of 14.9%. In addition, DFR-YOLOv12n increased the end-to-end throughput from 7.191 FPS to 8.054 FPS, representing an improvement of 12.0%, while reducing peak shared memory usage from 3165 MB to 3122 MB. These results indicate that the proposed model improves detection performance while reducing model complexity and providing lower latency and higher throughput on the tested edge device. Therefore, DFR-YOLOv12n demonstrates improved deployment efficiency relative to the YOLOv12n baseline under the evaluated configuration.
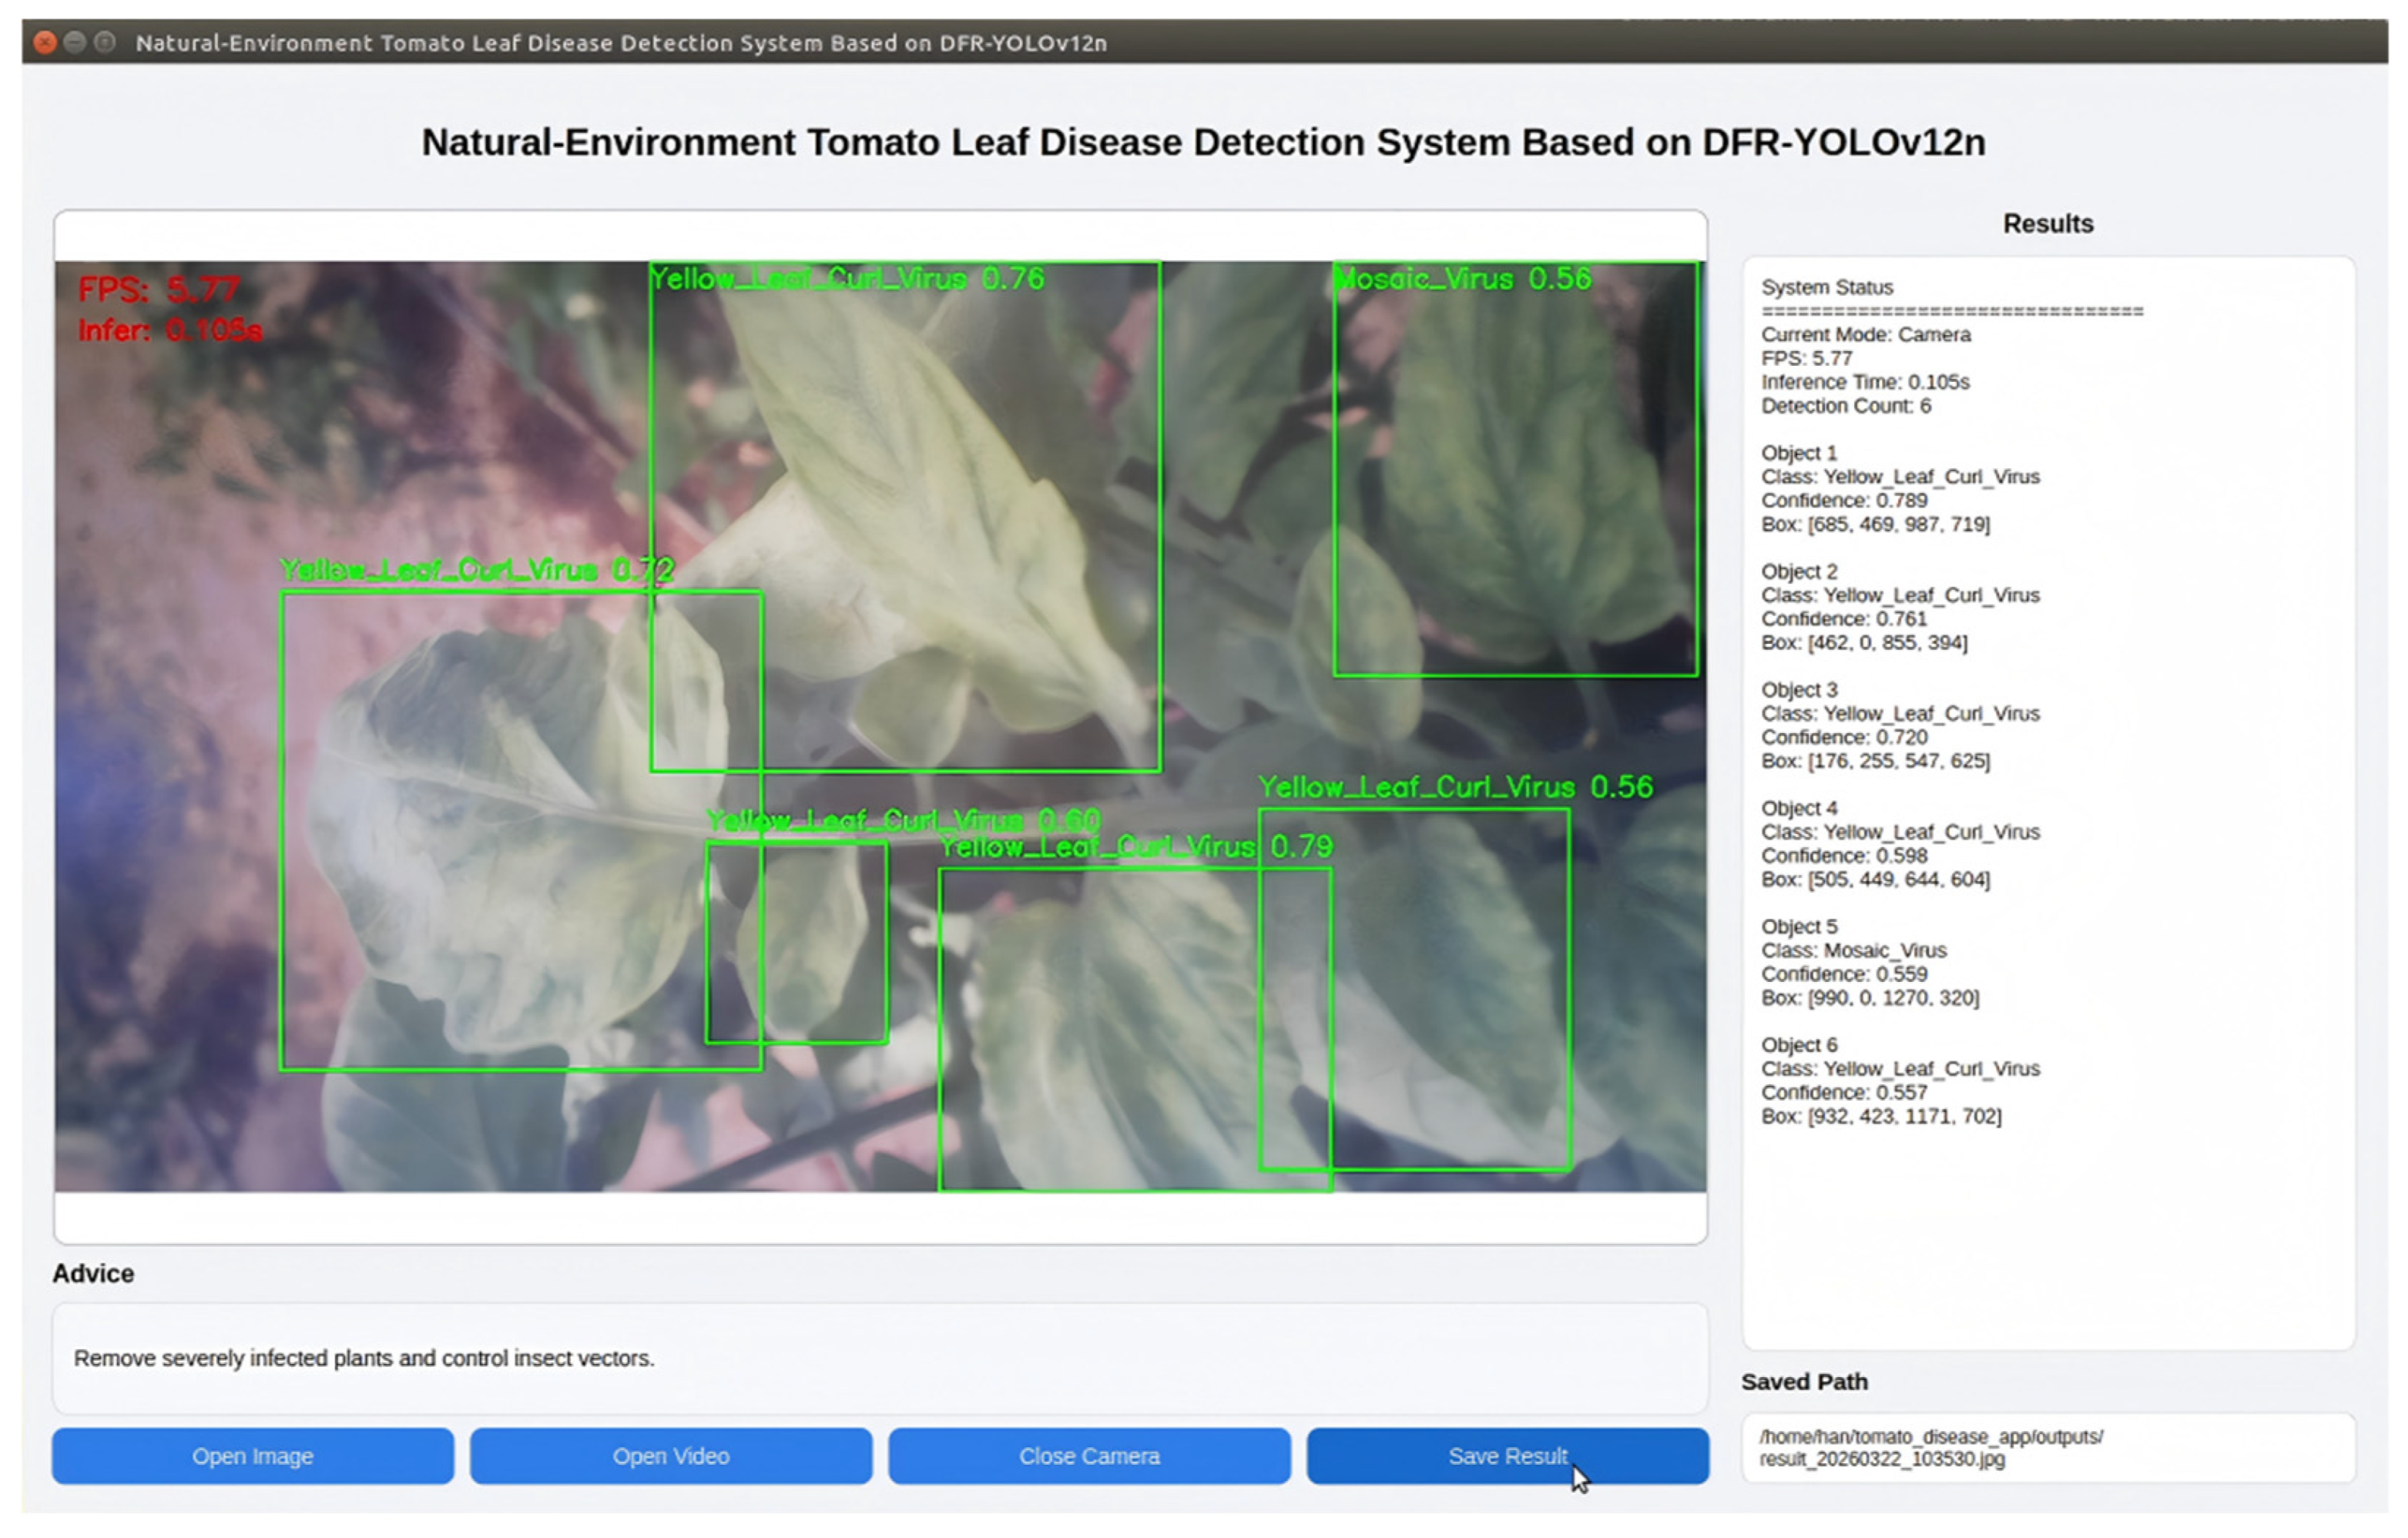
At the system implementation level, a graphical user interface for practical tomato leaf disease detection was further developed. The system supports three input modes, including static image import, video import, and real-time acquisition via a USB camera. During detection, it can simultaneously display disease category, bounding box, confidence score, inference time, and frame rate, and can automatically output corresponding disease control recommendations according to the recognition results. In addition, the system provides a result-saving function for subsequent record keeping and application demonstration.
Figure 7 shows the interface of the proposed edge-side tomato leaf disease detection system. As can be seen, the system already possesses relatively complete human-computer interaction functions and visual result presentation capability.
Overall, the deployment results verify that DFR-YOLOv12n can be executed on the Jetson Nano platform and supports image-, video-, and camera-based disease detection. The observed reductions in model complexity, end-to-end latency, and shared memory usage, together with the increase in throughput, demonstrate the deployment feasibility of the proposed model for resource-constrained agricultural applications.
6. Conclusions
This study proposes DFR-YOLOv12n to improve tomato leaf disease detection under natural conditions while retaining a lightweight architecture. By integrating SPDConv at key downsampling stages, A2C2f_DEConv in the P3 branch, and MPDIoU for bounding-box regression, the model strengthens detail preservation, feature representation, and localization. Compared with baseline YOLOv12n, DFR-YOLOv12n increased precision, recall, and mAP@0.5 from 86.8%, 76.9%, and 86.5% to 88.1%, 81.7%, and 88.6%, respectively. It also reduced FLOPs, parameter count, and model size from 5.83 G, 2.51 M, and 5.22 MB to 5.27 G, 2.25 M, and 4.71 MB. Deployment on the Jetson Nano supported image, video, and real-time camera inputs, reduced mean latency by 10.4%, and increased throughput by 12.0%. These findings indicate that DFR-YOLOv12n balances detection accuracy, computational cost, and edge-deployment feasibility under the evaluated dataset and device conditions. Future work will examine cross-dataset generalization, model compression, and integration with practical agricultural monitoring systems.