1. Introduction
Pears (
Pyrus spp.), which belong to the genus Pyrus within the Rosaceae family, are perennial woody plants whose cultivation can be traced back more than three millennia [
1]. Although China ranks third in pear acreage among fruit crops (after apple and citrus), it leads globally in both production area and total yield [
2]. The ‘Cangxi Pear’ is a nationally recognized Geographical Indication product widely grown in Sichuan and other regions, while its hybrid offspring ‘Cangxi 6-2’ is also commercially cultivated. However, physiological disorders such as cork spot frequently affect pear quality and cause substantial economic losses. The incidence of cork spot can reach up to 80% in poorly managed orchards, yet its underlying mechanisms remain incompletely understood. Emerging evidence suggests that imbalances in Ca and B homeostasis, as well as excessive lignification, may contribute to the development of this disorder. Despite these observations, the interactions among mineral nutrition, vascular structure, and cell wall metabolism in cork spot pathogenesis have not been systematically examined.
Pear cork spot disorder is a physiological disease causing brown spots under the skin, leading to reduced market value. The causes are complex and unclear.
Zhang et al. [
3] pointed out that Ca and B may be connected with pear cork disorder, and this is now widely recognized as one of the main factors causing cork spot disorder on pear fruit skin. Ca and B have similar physiological functions in plants, and interactions between them have been observed [
4]; this view is widely accepted in the field of plant biology. However, the conclusion that Ca and B deficiencies lead to the occurrence of pear cork disorder still requires further study. Moreover, Tamura et al. [
5] noted that the factors that lead to cork formation involve not only mineral nutrition but also climatic conditions during the growing season, soil properties, tree age, pruning and fertilization practices, as well as water allocation between fruits and leaves. In addition, the molecular mechanisms underlying pear cork spot disorder are gradually being elucidated. Xu et al. [
6] identified the CSE gene family (PbCSE) in pear and demonstrated that PbCSE1 is involved in lignin deposition and the biosynthesis of the hard core; overexpression of PbCSE1 increased lignin accumulation in pear fruit. Zhang et al. [
7] elucidated an ABA-signaling-mediated mechanism in which the PbrMYB8-PbrMYB169 regulatory module promotes lignin biosynthesis during the development of cork spot disorder in pear fruit.
Plants respond to abiotic stresses (e.g., drought, salinity, heat, nutrient deficiency, toxicity) with physiological adjustments [
8,
9]; for instance, salt stress affects photosynthesis [
10]. Fruit trees are particularly susceptible to such stresses during the reproductive phase, and mineral nutrient imbalances often manifest as physiological disorders in developing fruits. Key nutrients like potassium (K), magnesium (Mg), and calcium (Ca) are critical; their deficiency causes recognizable syndromes [
11]. Among these, Ca plays a particularly prominent role in maintaining fruit quality, as its deficiency has been linked to various fleshy fruit disorders, including cork spot, bitter pit, and blossom-end rot.
B is a micronutrient essential for plant development and growth [
12]; it plays a crucial role in influencing the development of reproductive organs, regulating lignin, and maintaining the structural framework of cell walls and the integrity of cell membranes, and it has been shown to participate in these processes [
13]. B participates in the construction of the cell wall by forming B-ester bonds with the pectin polysaccharide rhamnogalacturonan II (RG-II), which is essential for the formation of the primary cell wall and the growth of higher plants [
14,
15]. Research by Lu et al. revealed that exogenous B alleviates salt stress in cotton by maintaining cell wall structure and ion homeostasis [
16]. Although the effects of B on plants are evident, among all essential plant nutrients, the range between B deficiency and the toxicity threshold is the narrowest. In addition, different plants have different B requirements to support optimal development [
17]. Studies have shown that B plays a crucial role in protecting the plasma membrane from oxidative damage caused by reactive oxygen species [
18]. More importantly, the relationship between B and plant lignification cannot be overlooked. A study by Yan et al. on B-mediated lignin metabolism alleviating aluminum toxicity in citrus roots showed that B treatment affects the levels and pathways of root metabolites under aluminum toxicity, reduces the accumulation of lignin in root cell walls, and, by decreasing the activity of metabolites and key enzymes (4CL and CAD) associated with the lignin biosynthesis pathway under aluminum toxicity, reduces cell wall lignification and thickness, thereby increasing cell wall extensibility and elasticity [
19]. This evidence suggests that there may be some connection between B and pear cork disease.
Ca is an essential nutrient for plants and plays a vital role in their growth and development. Ca is crucial for the stability of plant membranes and is also an important component of cell wall structure, as Ca galacturonates are required in the middle lamella for cell stability [
20,
21,
22]. At the same time, Ca serves as a cytoplasmic signaling messenger at the submicromolar level. In plants, Ca is primarily stored in the middle lamella of cell walls, vacuoles, and other regions. When Ca binds to pectin in the cell wall, it significantly enhances cell toughness; when it binds to the phospholipid heads of cell membranes, it helps improve cell membrane stability [
23]. At the structural level, Ca is essential for maintaining cell wall integrity through the cross-linking of pectin molecules, and it also contributes to membrane stability by interacting with phospholipid heads at the membrane surface. When Ca availability is insufficient, the cross-linking network that holds pectin chains together is weakened, and membrane stability is compromised. These disruptions are sufficient to induce a series of physiological responses that may contribute to tissue dysfunction. Beyond its structural roles, Ca also functions as a key signaling molecule. Notably, Ca acts as a negative regulator of lignification under normal conditions, suppressing the expression of genes encoding enzymes in the lignin biosynthesis pathway. This regulatory role has been linked to a signaling cascade involving CML38/WRKY46–NAC187–CCR [
24].
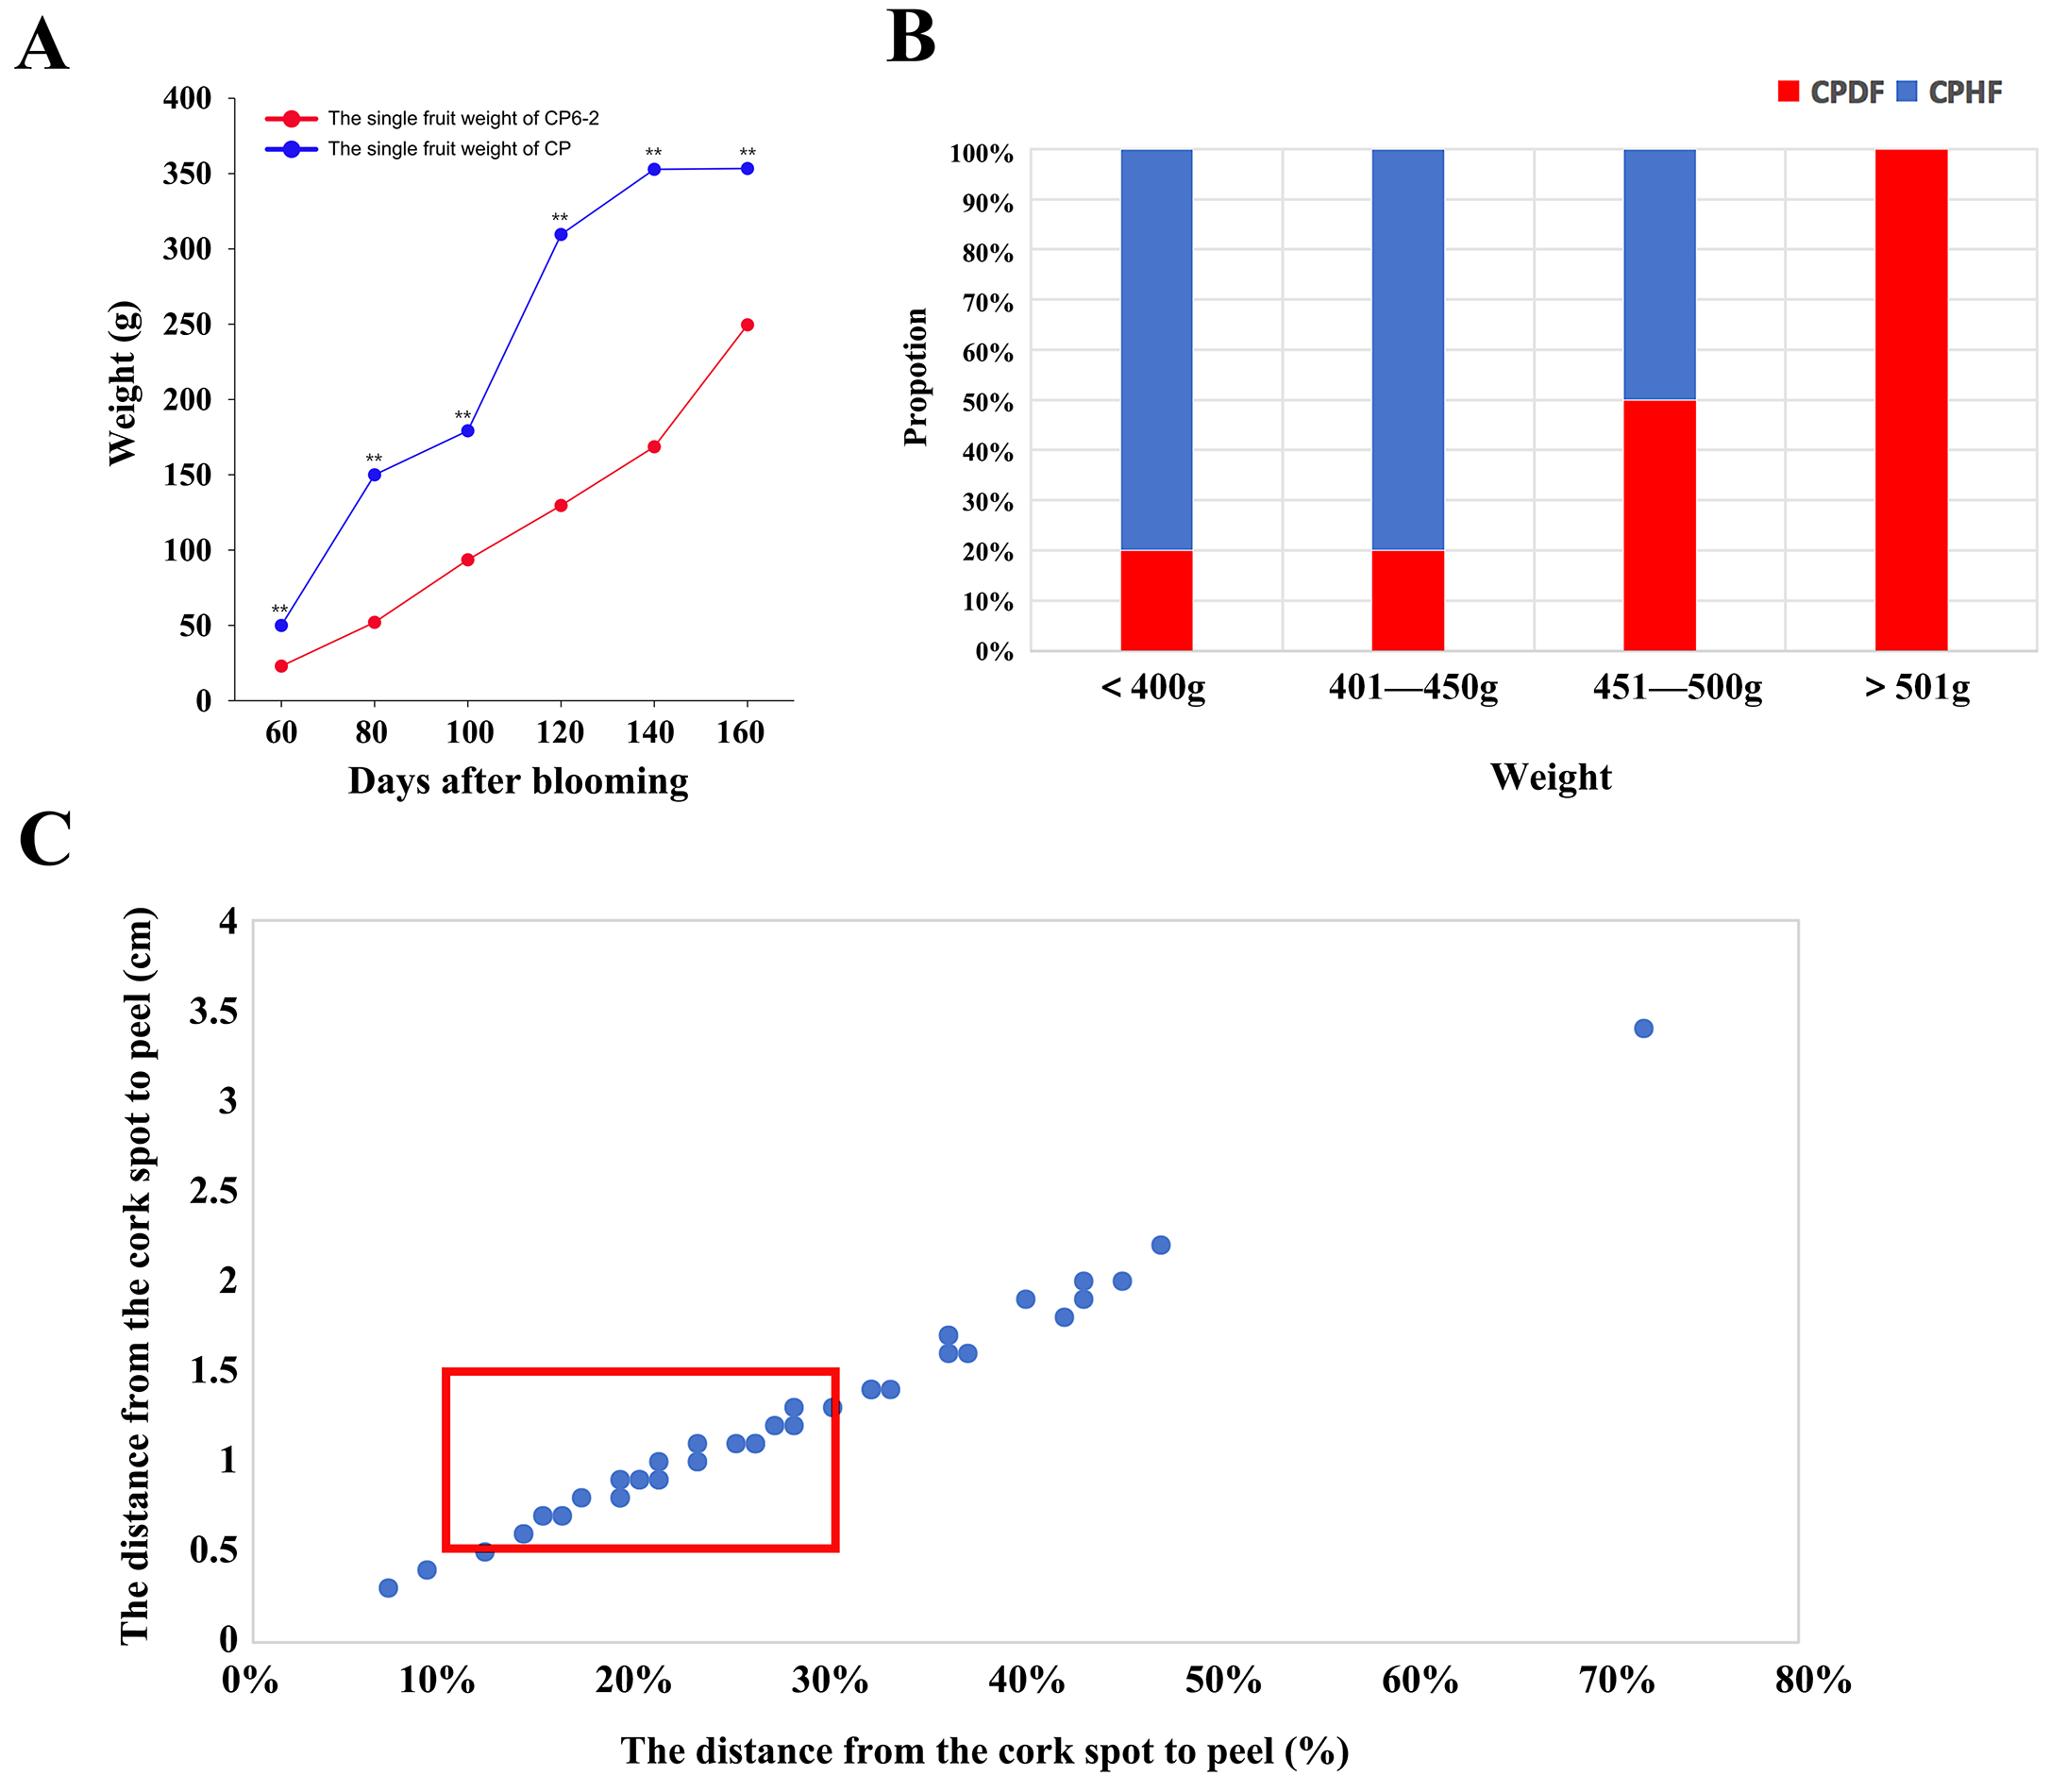
Earlier work showed large-fruited ‘Qiuyue’ pears have higher cork spot rates [
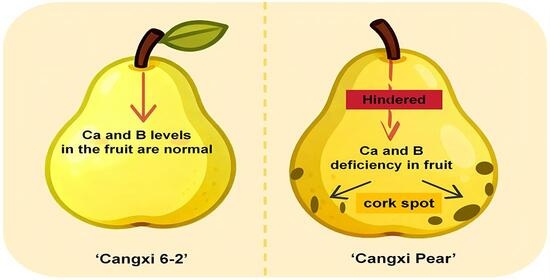
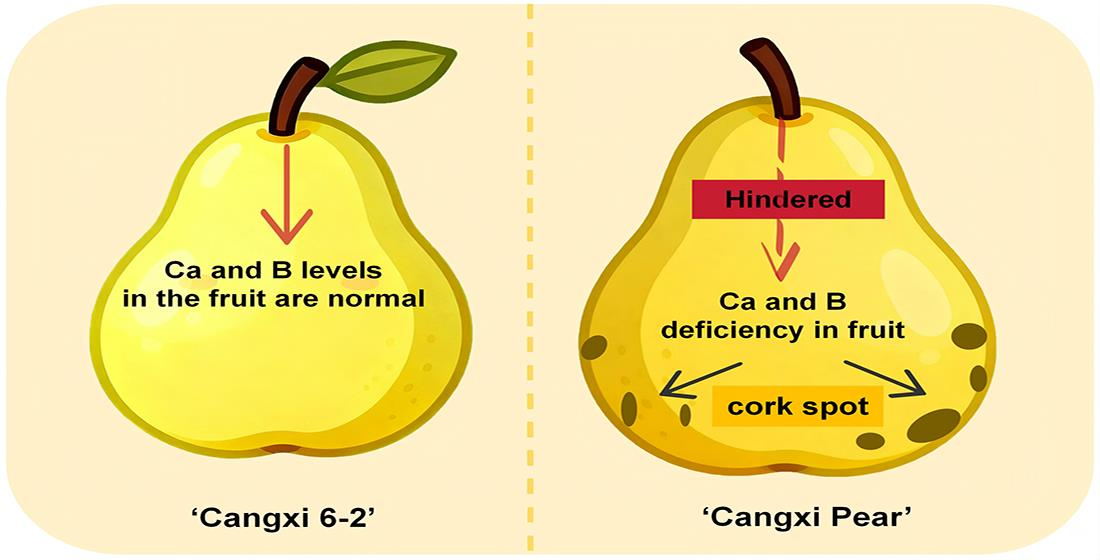
3]. Our observations found that ‘Cangxi 6-2’ shows few symptoms compared to its parent, but the reasons are unclear. The roles of Ca, B, lignin, and cellulose require systematic analysis. Therefore, we used ‘Cangxi Pear’ as the experimental group and ‘Cangxi 6-2’ as the control, monitoring fruit growth and comparing element, lignin, and cellulose contents. Based on the literature and our preliminary observations, we hypothesized that abnormal accumulation of lignin and cellulose impairs vascular bundle transport, leading to localized Ca and B deficiencies in terminal fruit tissues, which in turn disrupt cell wall structure and membrane stability, ultimately contributing to cork spot development. The present study was designed to test this hypothesis and to elucidate the etiology of cork spot disorder, providing a theoretical basis for its prevention and for the pear industry.
2. Materials and Methods
2.1. Plant Materials
This study compared two pear groups: ‘Cangxi Pear’ (CP), which produces both healthy and disordered fruits, and CP6-2, a breeding line derived from CP that remains entirely asymptomatic throughout the growing season. Both cultivars were cultivated in Qingyan Village, Yunfeng Town, Cangxi County, within the same orchard plot to minimize microenvironmental heterogeneity. The trees were 45 years old, grafted on Chuanmali (Pyrus sp.) rootstock, and managed under standard commercial practices, including uniform irrigation, fertilization, and pest control, with a spacing of 3 m × 4 m. All selected trees were free from pests and other diseases, with cork spot disorder being the only observed condition affecting CP fruits; CP6-2 trees exhibited no symptoms throughout the study period. For each cultivar, nine trees of similar age, vigor, and canopy structure were selected, with each tree serving as an experimental unit. The nine trees were randomly divided into three groups of three trees each, with each group constituting one biological replicate (n = 3 per cultivar per time point). At six time points after full bloom (60, 80, 100, 120, 140, and 160 days), three ripe fruits were collected from each of the four canopy directions from each tree within a group, along with 10 functional leaves from the middle of shoots. Fruits from the three trees in the same group were pooled (36 fruits per pooled sample).
Upon arrival at the laboratory, each fruit was weighed and measured for longitudinal and transverse diameters. The fruits were then peeled, cut into small pieces, and carefully examined for cork spot lesions. Based on this examination, CP fruits were classified as healthy (CPHF) or diseased (CPDF). To minimize confounding, healthy and diseased fruits were collected from the same trees whenever possible and matched by canopy position and fruit weight. After classification, tissues from the same category within each group were pooled separately. These samples were either ground in liquid nitrogen for biochemical assays or immersed in fixative for structural observations and stored at −80 °C until further analysis.
2.2. Measurement of Individual Fruit Weight and Fruit Shape Index
For each of the three groups, CPHF, CPDF, and CP6-2 were picked and then weighed and measured individually. Fresh weight was taken with an electronic balance and recorded in grams, while length and width dimensions were obtained using a digital Vernier caliper and expressed in centimeters. The average value for each parameter was then determined from the readings.
When it came to preparing material for biochemical work, leaf and fruit samples were ground under liquid nitrogen to a fine, even powder using a mortar and pestle that had been chilled beforehand. The powdered tissue was moved into 50 mL centrifuge tubes and kept at −80 °C until the time came for analysis. A portion of the fruit material was handled a bit differently, depending on what the subsequent assays required. Some fruits were simply cut into sections with the peel left on, while others had their peel, stem, and core removed before they were ground. The mesocarp powder obtained in this way was likewise divided into 50 mL tubes and stored at −80 °C.
2.3. Staining of Fruit Vascular Bundles
To evaluate xylem functionality in pear fruits, a dye-tracing assay was performed following the protocol of Song et al. [
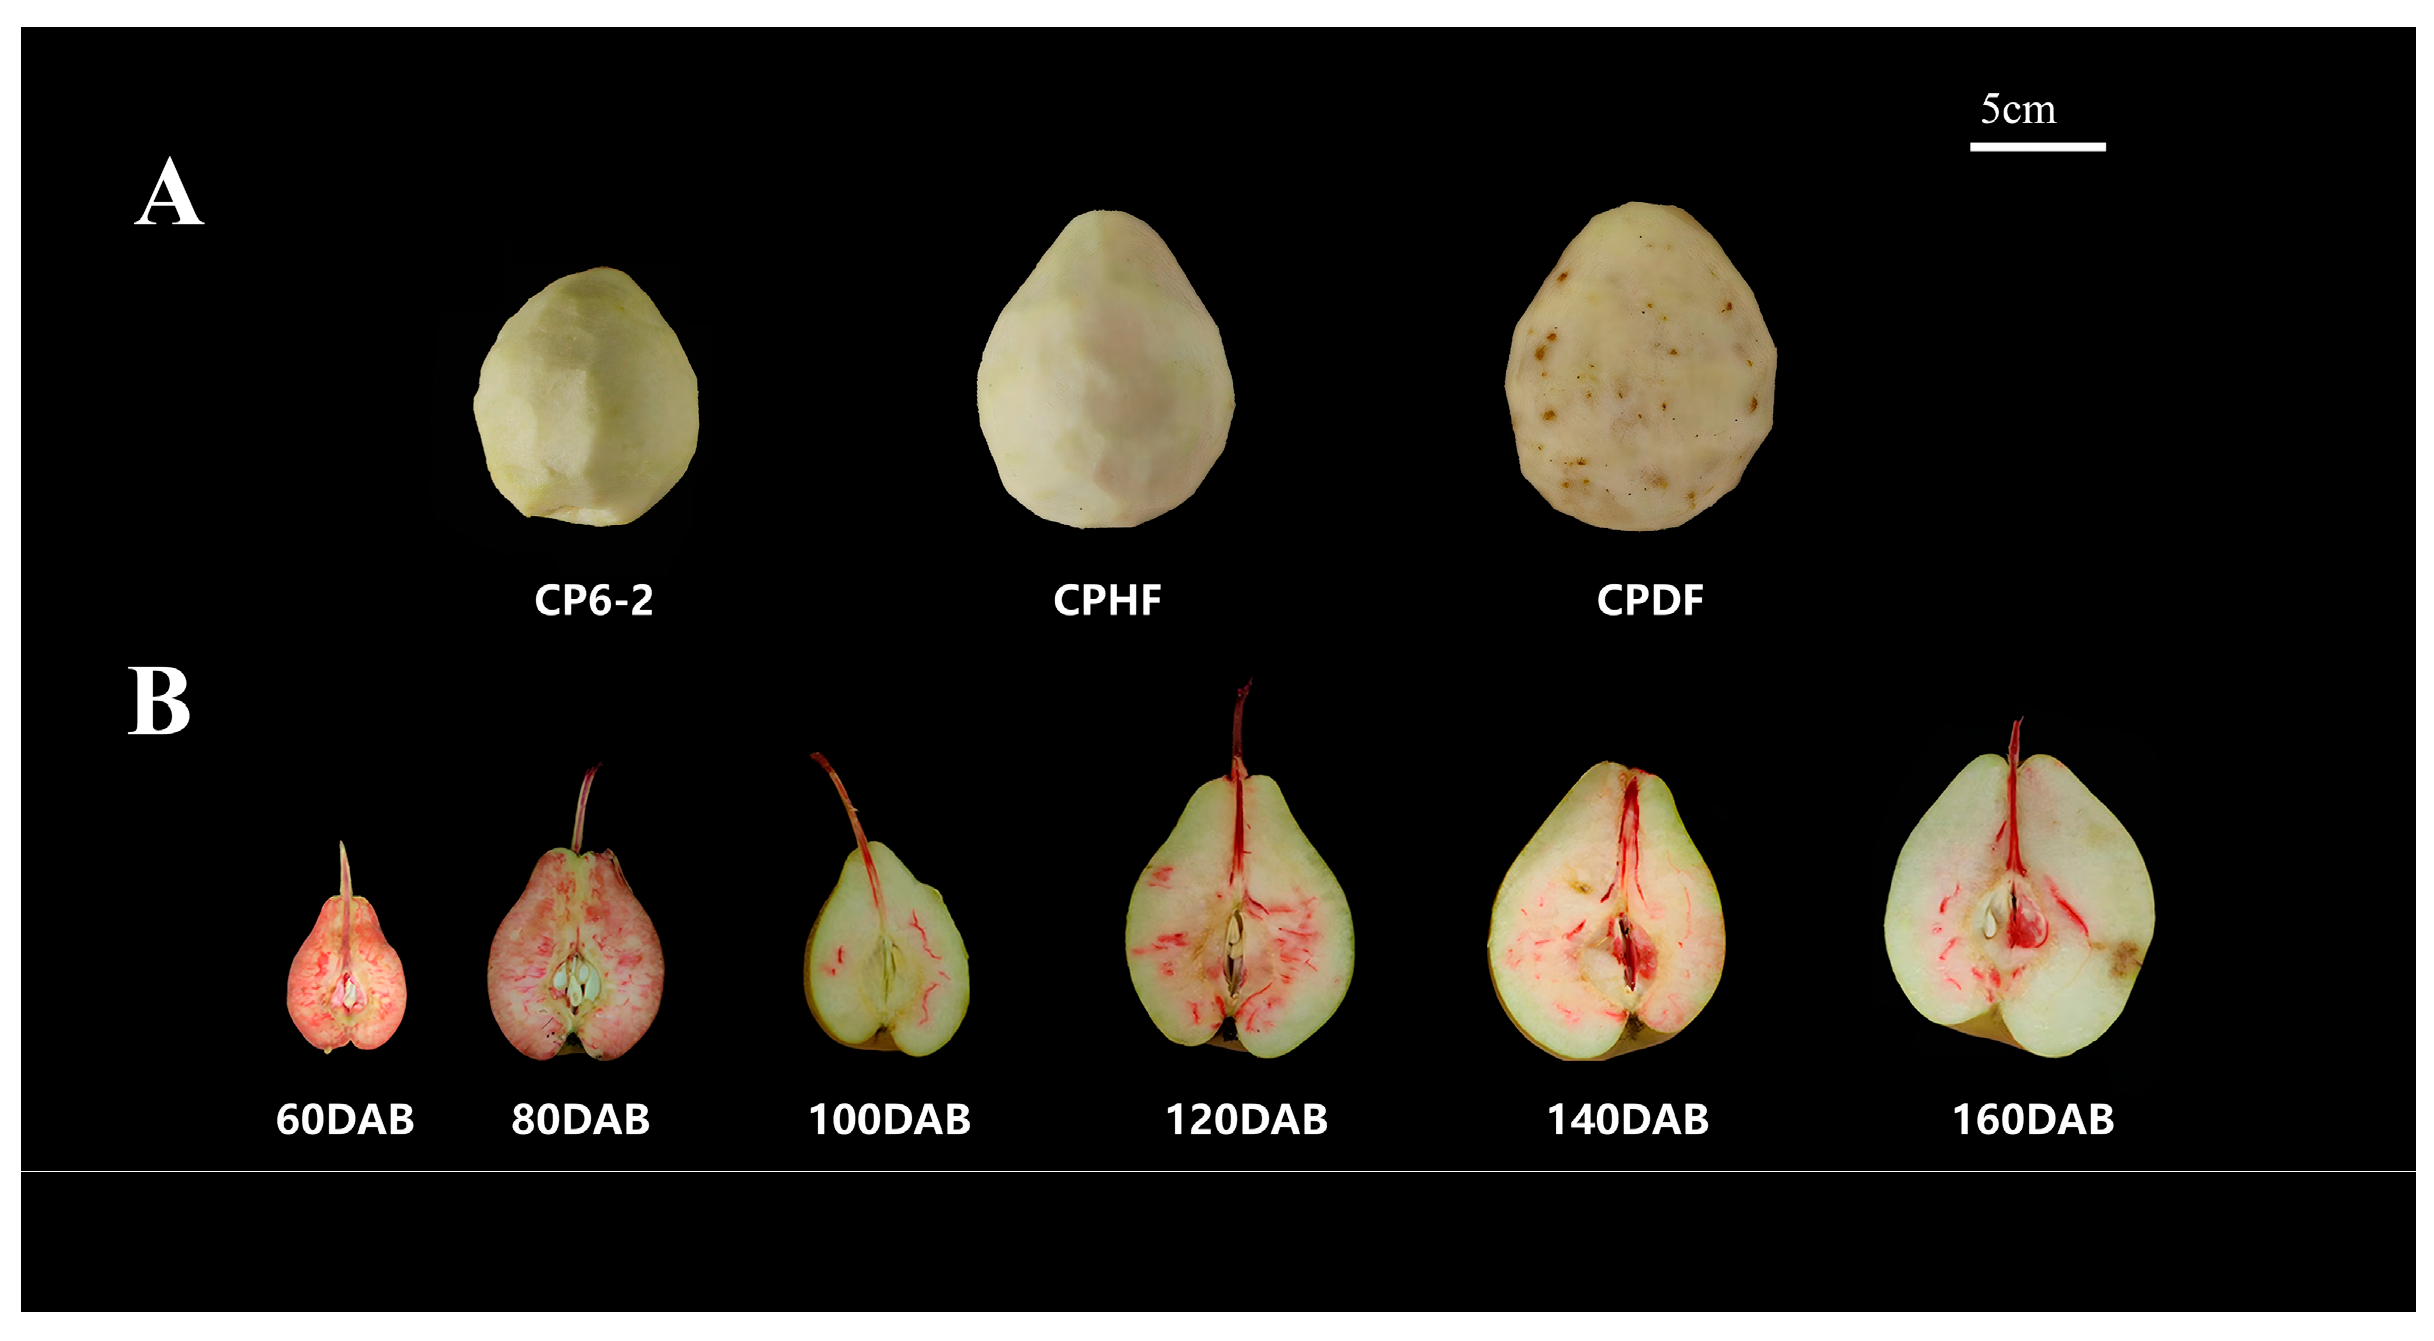
25], with minor modifications. Freshly harvested fruits at each of the six developmental stages (60, 80, 100, 120, 140, and 160 days after full bloom) were used, with two fruits per stage per biological replicate. The pedicels of each fruit were cut under water to avoid air embolism and immediately immersed in red ink. The ink is a weakly alkaline aqueous solution, primarily composed of acidic dyes such as eosin (also known as ink red A), with glycerol as a wetting agent, ethanol as a co-solvent, and gum and antioxidants as stabilizers. Dye uptake was allowed to proceed at room temperature (approximately 25 °C) under ambient light for 24 h. After incubation, each fruit was longitudinally bisected from the pedicel end to the calyx end using a sharp blade. The distribution of red coloration within the vascular bundle network was examined visually and photographed.
2.4. Determination of Plant Elements
Freeze-dried fruit and leaf samples (0.2 g) were digested in polytetrafluoroethylene vessels with 5 mL of concentrated HNO3 overnight, followed by heating in an oven at 80 °C for 2 h, 120 °C for 2 h, and 160 °C for 4 h. After cooling, the digests were heated to near dryness and made up to 25 mL with 1% (v/v) HNO3. The concentrations of calcium, Mg, iron (Fe), manganese (Mn), zinc (Zn), and boron were determined using inductively coupled plasma mass spectrometry (ICP-MS, PerkinElmer NexION® 1000, Waltham, MA, USA) with an internal standard method. Multi-element standard solutions were used for calibration, and reagent blanks served as controls.
For nitrogen (N), phosphorus (P), and K determination, dried samples were digested with H2SO4 and H2O2. N was quantified by Kjeldahl distillation, P by vanadium–molybdenum yellow colorimetry, and K by flame photometry. All measurements were performed in triplicate, and method detection limits were established following routine laboratory protocols.
2.5. Determination of Fruit Cellulose and Lignin Content
The cellulose content in fruit samples was quantified using a microplate-based colorimetric assay kit (Cellulose Content Assay Kit, Jiangsu AidiSheng Biotechnology Co., Ltd., Yancheng, Jiangsu, China) employing the sulfuric acid–anthrone method. Dried sample powder (0.02 g) was extracted and hydrolyzed according to the manufacturer’s protocol. The absorbance was measured at 620 nm, and the cellulose content was calculated using a standard curve (y = 9.9647x + 0.0033, where y is ΔA, and x is the glucose concentration in mg/mL), with results expressed as mg/g dry weight. Reagent blanks served as controls.
Likewise, lignin content was determined with the corresponding Lignin Content Assay Kit from the same supplier, based on the acetyl bromide procedure. Dried sample powder (2 mg) was processed following the kit instructions. The absorbance was read at 280 nm, and the lignin content was calculated using the standard curve (y = 10.615x − 0.003, where y is ΔA, and x is the lignin concentration in mg/mL), with results expressed as mg/g dry weight. Reagent blanks were included as controls.
All measurements were performed on three independent biological replicates (n = 3), with each pooled sample measured in triplicate.
2.6. Scanning Electron Microscopy (SEM)
Pear fruit flesh samples were cut into small pieces (approximately 3 × 3 × 5 mm) from the equatorial region, with care taken to minimize mechanical damage. The specimens were immediately immersed in a fixative solution (Servicebio, G1102) at room temperature for 2 h and then transferred to 4 °C for storage. After primary fixation, samples were washed three times (15 min each) with 0.1 M phosphate buffer (PB, pH 7.4), followed by post-fixation in 1% (w/v) osmium tetroxide (Ted Pella, Inc., Redding, CA, USA) in 0.1 M PB at room temperature in the dark for 1–2 h. The samples were then rinsed three times with 0.1 M PB (15 min each). Dehydration was carried out through a graded ethanol series (30%, 50%, 70%, 80%, 90%, 95%, 100%, and 100%, 15 min per step), followed by incubation in isoamyl acetate for 15 min. The specimens were subsequently dried using a critical point dryer (Quorum Technologies, East Sussex, UK, K850) with liquid carbon dioxide. Dried samples were mounted on conductive carbon double-sided tape on aluminum stubs and sputter-coated with gold for approximately 30 s using an ion sputter coater (Hitachi, Ltd., Tokyo, Japan, MC1000). Observations and image capture were performed using a scanning electron microscope (Hitachi, SU8100). All sample preparation and imaging procedures were carried out at Servicebio Technology Co., Ltd. (Wuhan, China).
2.7. Statistical Analysis
Statistical analysis was performed using IBM SPSS Statistics (version 26.0). Normality and homogeneity of variance were tested using the Shapiro–Wilk and Levene’s tests, respectively. A two-way analysis of variance (ANOVA) was applied with cultivar and developmental stage as fixed factors, followed by Tukey’s honestly significant difference (HSD) post hoc test for multiple comparisons, with the false discovery rate (FDR) correction applied when necessary. The significance level was set at * (
p < 0.05). All data are presented as mean ± standard deviation (SD) based on three independent biological replicates (
n = 3). In the figures, error bars represent the standard error of the mean (SE) to better visualize the precision of the mean estimates. Figures were plotted using Origin 2022 (OriginLab Corporation, Northampton, MA, USA) and Chiplot (
https://www.chiplot.online, accessed on 13 July 2025), with final adjustments made in Adobe Photoshop 2023.
4. Discussion
4.1. Pear Cork Spot Disorder Begins to Appear During the Late Stages of Fruit Development, and the Lesions Are Primarily Located near the Fruit Peel
Pear cork spot disorder does not appear from the very beginning but develops as the fruit matures. Our study found that cork spots were primarily concentrated in areas close to the fruit peel, and this is consistent with the results of previous studies [
26,
27]. However, most previous studies focused solely on the final manifestations of cork spot disorder; in contrast, our research not only documented the final symptoms but also examined the temporal dynamics of symptom onset during fruit development. In ‘Cangxi Pear’, cork spot disorder first appeared between 100 and 120 DAB, with lesions concentrated near the fruit peel—a location consistent with the ends of the vascular bundles. The spatial and temporal association between lesion location, rapid fruit expansion, and vascular bundle termini raises the possibility that physical stress from rapid fruit expansion during later developmental stages may preferentially damage the terminal ends of vascular bundles, potentially initiating cork formation. As the fruit develops, the vascular bundles also change, indicating that cork formation may be connected with some abnormality at the ends of the vascular bundles. Based on the positive correlation between individual fruit weight and disease incidence, as well as electron microscopic observations of the vascular bundles, we tentatively hypothesize that abnormalities in the structure and function of the vascular bundles during the later stages of fruit development lead to impaired substance transport. However, this hypothesis regarding damage to vascular terminals remains inferential at this stage and should be tested by direct flow measurements and quantitative anatomical analyses in future studies. Our findings extend previous work by linking the final symptom of cork spot to a specific developmental stage and a vulnerable anatomical site, thereby providing a mechanistic basis for future studies.
4.2. Lignin and Cellulose Accumulate in Infected Fruits, Leading to Abnormalities in the Vascular Bundle Structure
The vascular bundles of plants, composed of xylem and phloem, act as the main transport pathways within fruits and play a very important role in fruit growth, development, and quality formation. Studies in kiwifruit, apple, and grape have shown that the xylem also undergoes changes during fruit development [
28,
29,
30]. As the fruit expands, the process of cell enlargement exerts pressure on the neighboring cells, affecting their normal growth [
31]. The vascular bundles undergo stretching and tearing during this process and form injuries that are subsequently repaired; therefore, xylem flux decreases during the later stages of fruit development. Research by Song et al. has demonstrated that this xylem dysfunction is a common phenomenon during fruit ripening [
25].
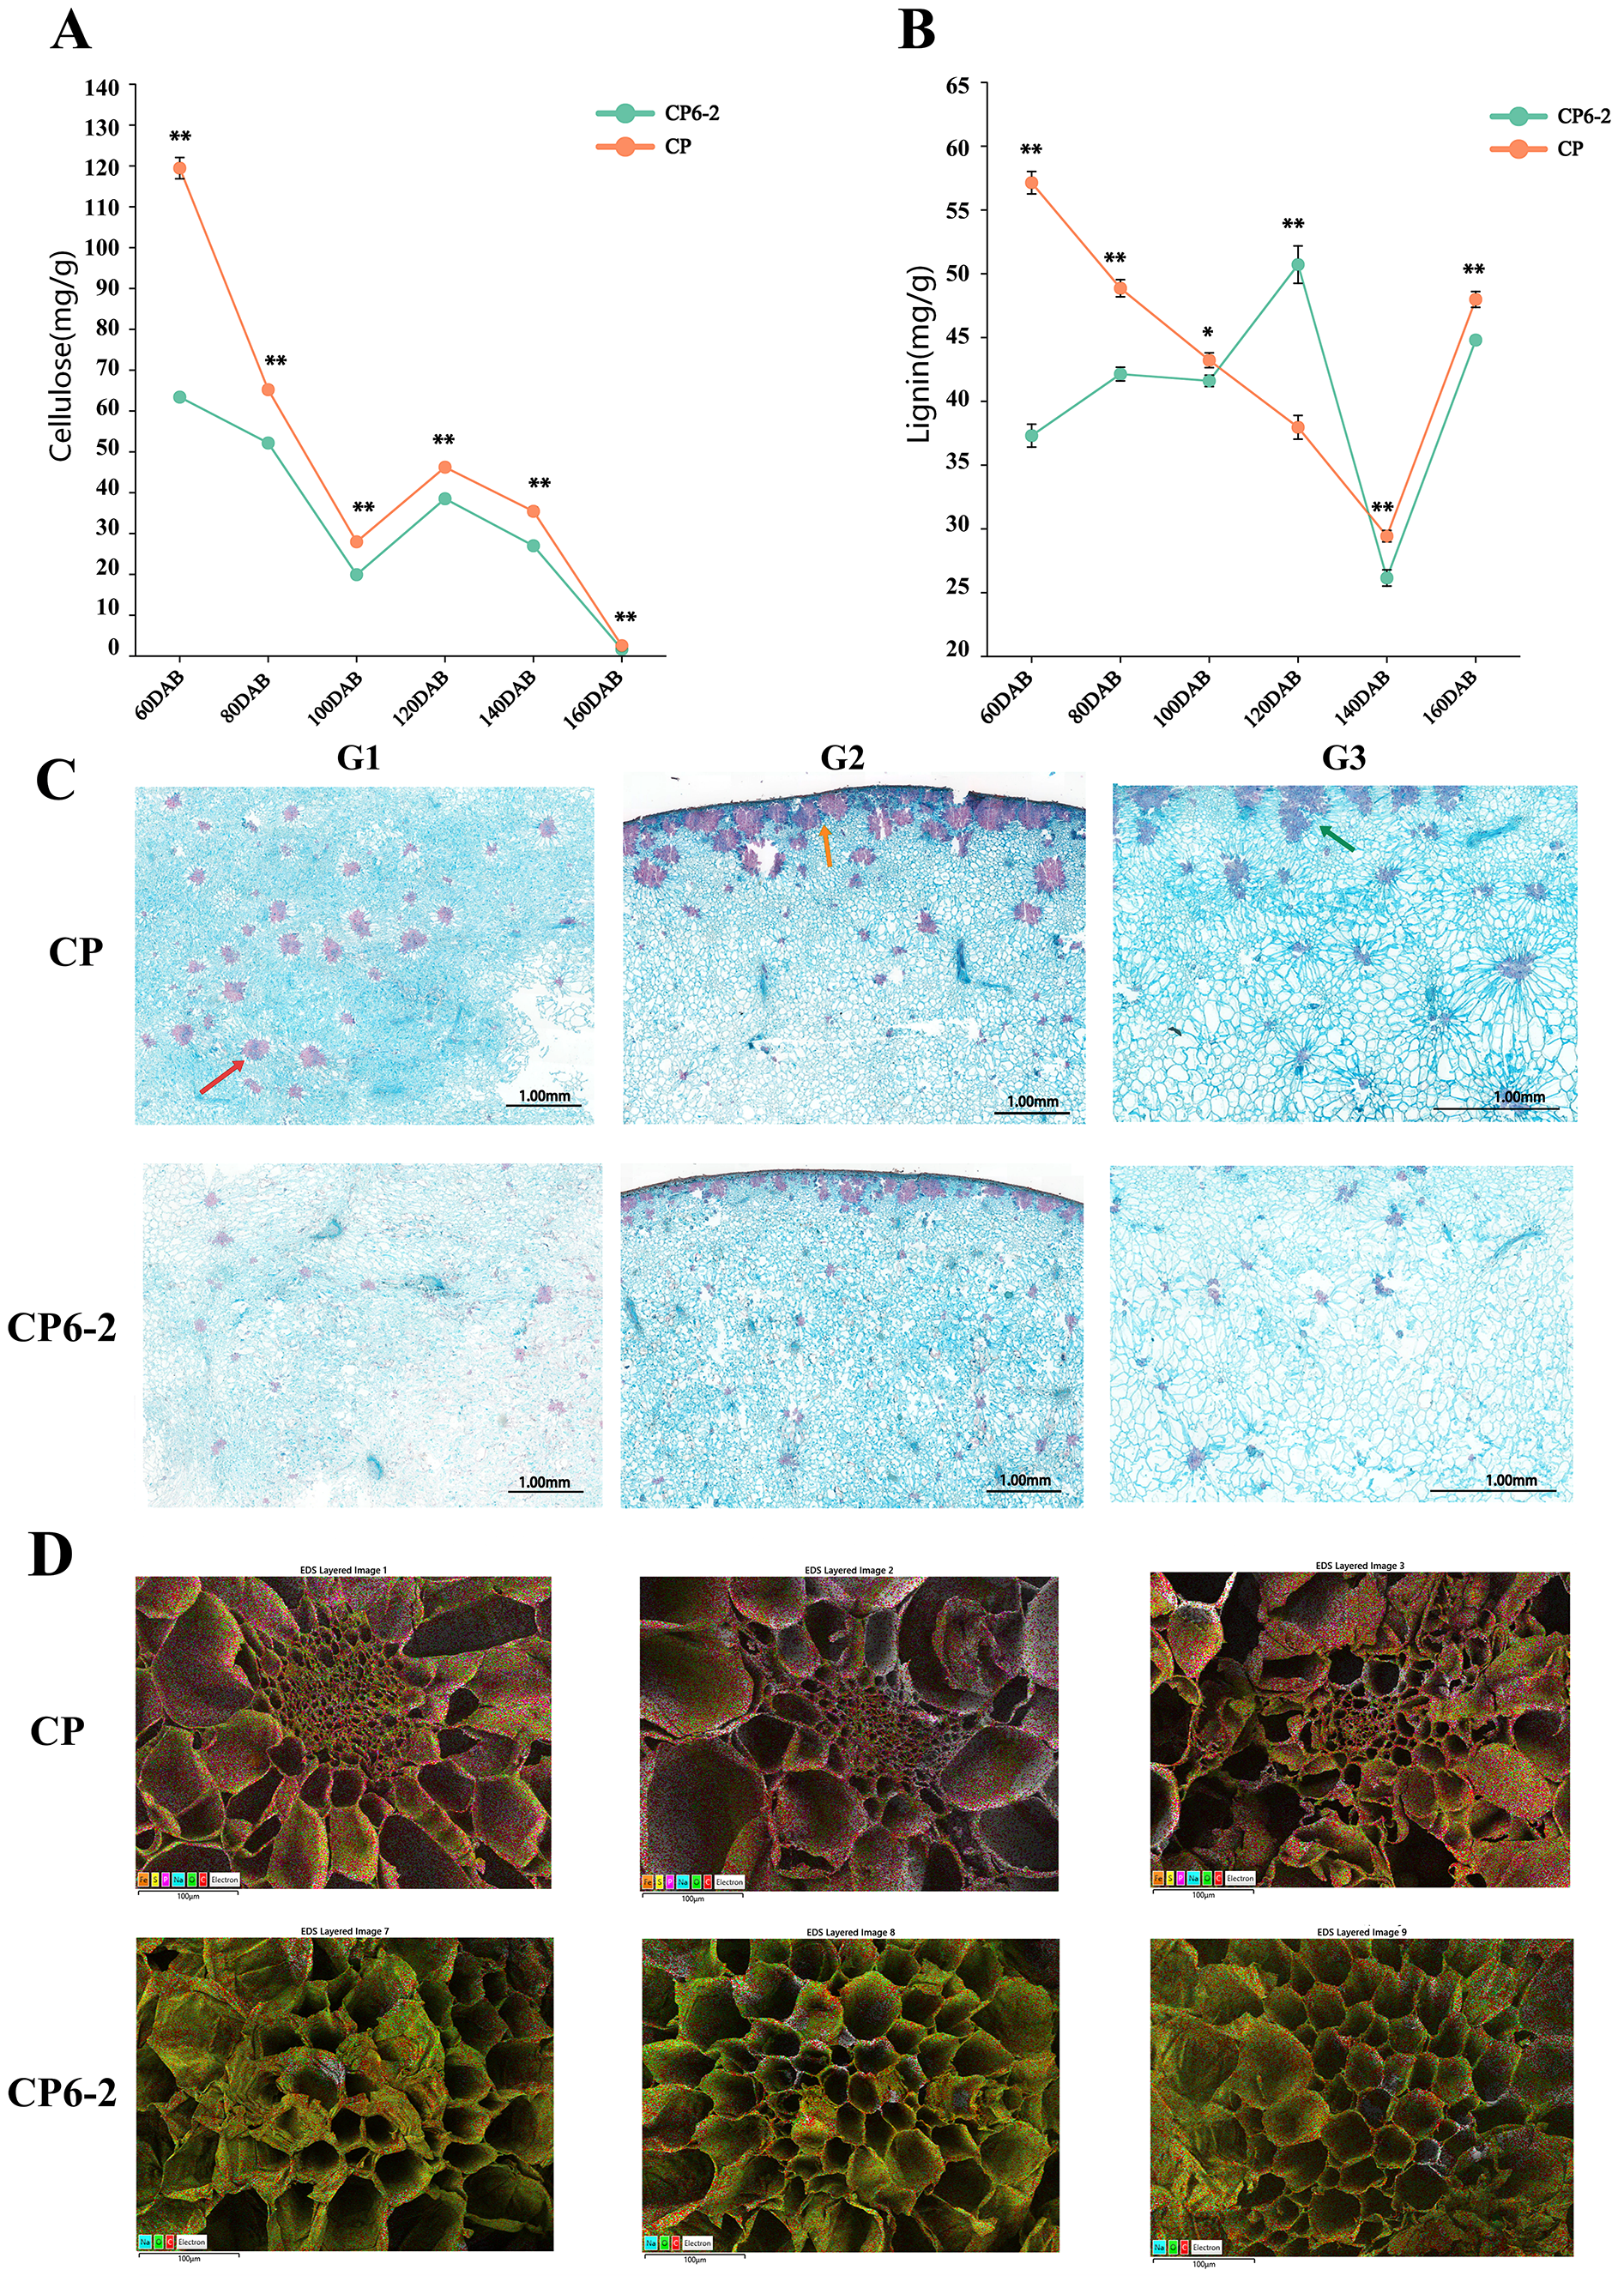
Our results are consistent with this concept: we observed that vascular bundle structure in CP was normal during early development but became abnormal in the later stage, coinciding temporally with the appearance of cork spots. This temporal coincidence suggests that the previously reported xylem dysfunction can, in this context, contribute to structural collapse rather than merely reduced flux. Through electron microscopic observations, we found that cells in the affected tissues were compressed, deformed, and indented; they had thickened cell walls and narrowed conduits. Lignin and cellulose content measurements, as well as safranin-fast green staining, show that throughout the full fruit development period, the cellulose content in CP was significantly higher than that in CP6-2. Between 120 DAB and 140 DAB, the lignin content in CP started to be significantly higher than that in CP6-2. Cellulose and lignin are both important components of plant cell walls. Based on these findings, it is plausible that an increase in their concentration would affect the structure of the cell walls, potentially compromising the integrity of the vascular bundles. However, as quantitative structural analyses were not performed, this interpretation remains inferential and would benefit from further validation through detailed anatomical measurements.
4.3. Abnormal Vascular Bundle Structure Impedes the Transport of Ca and B from the Leaves to the Fruit
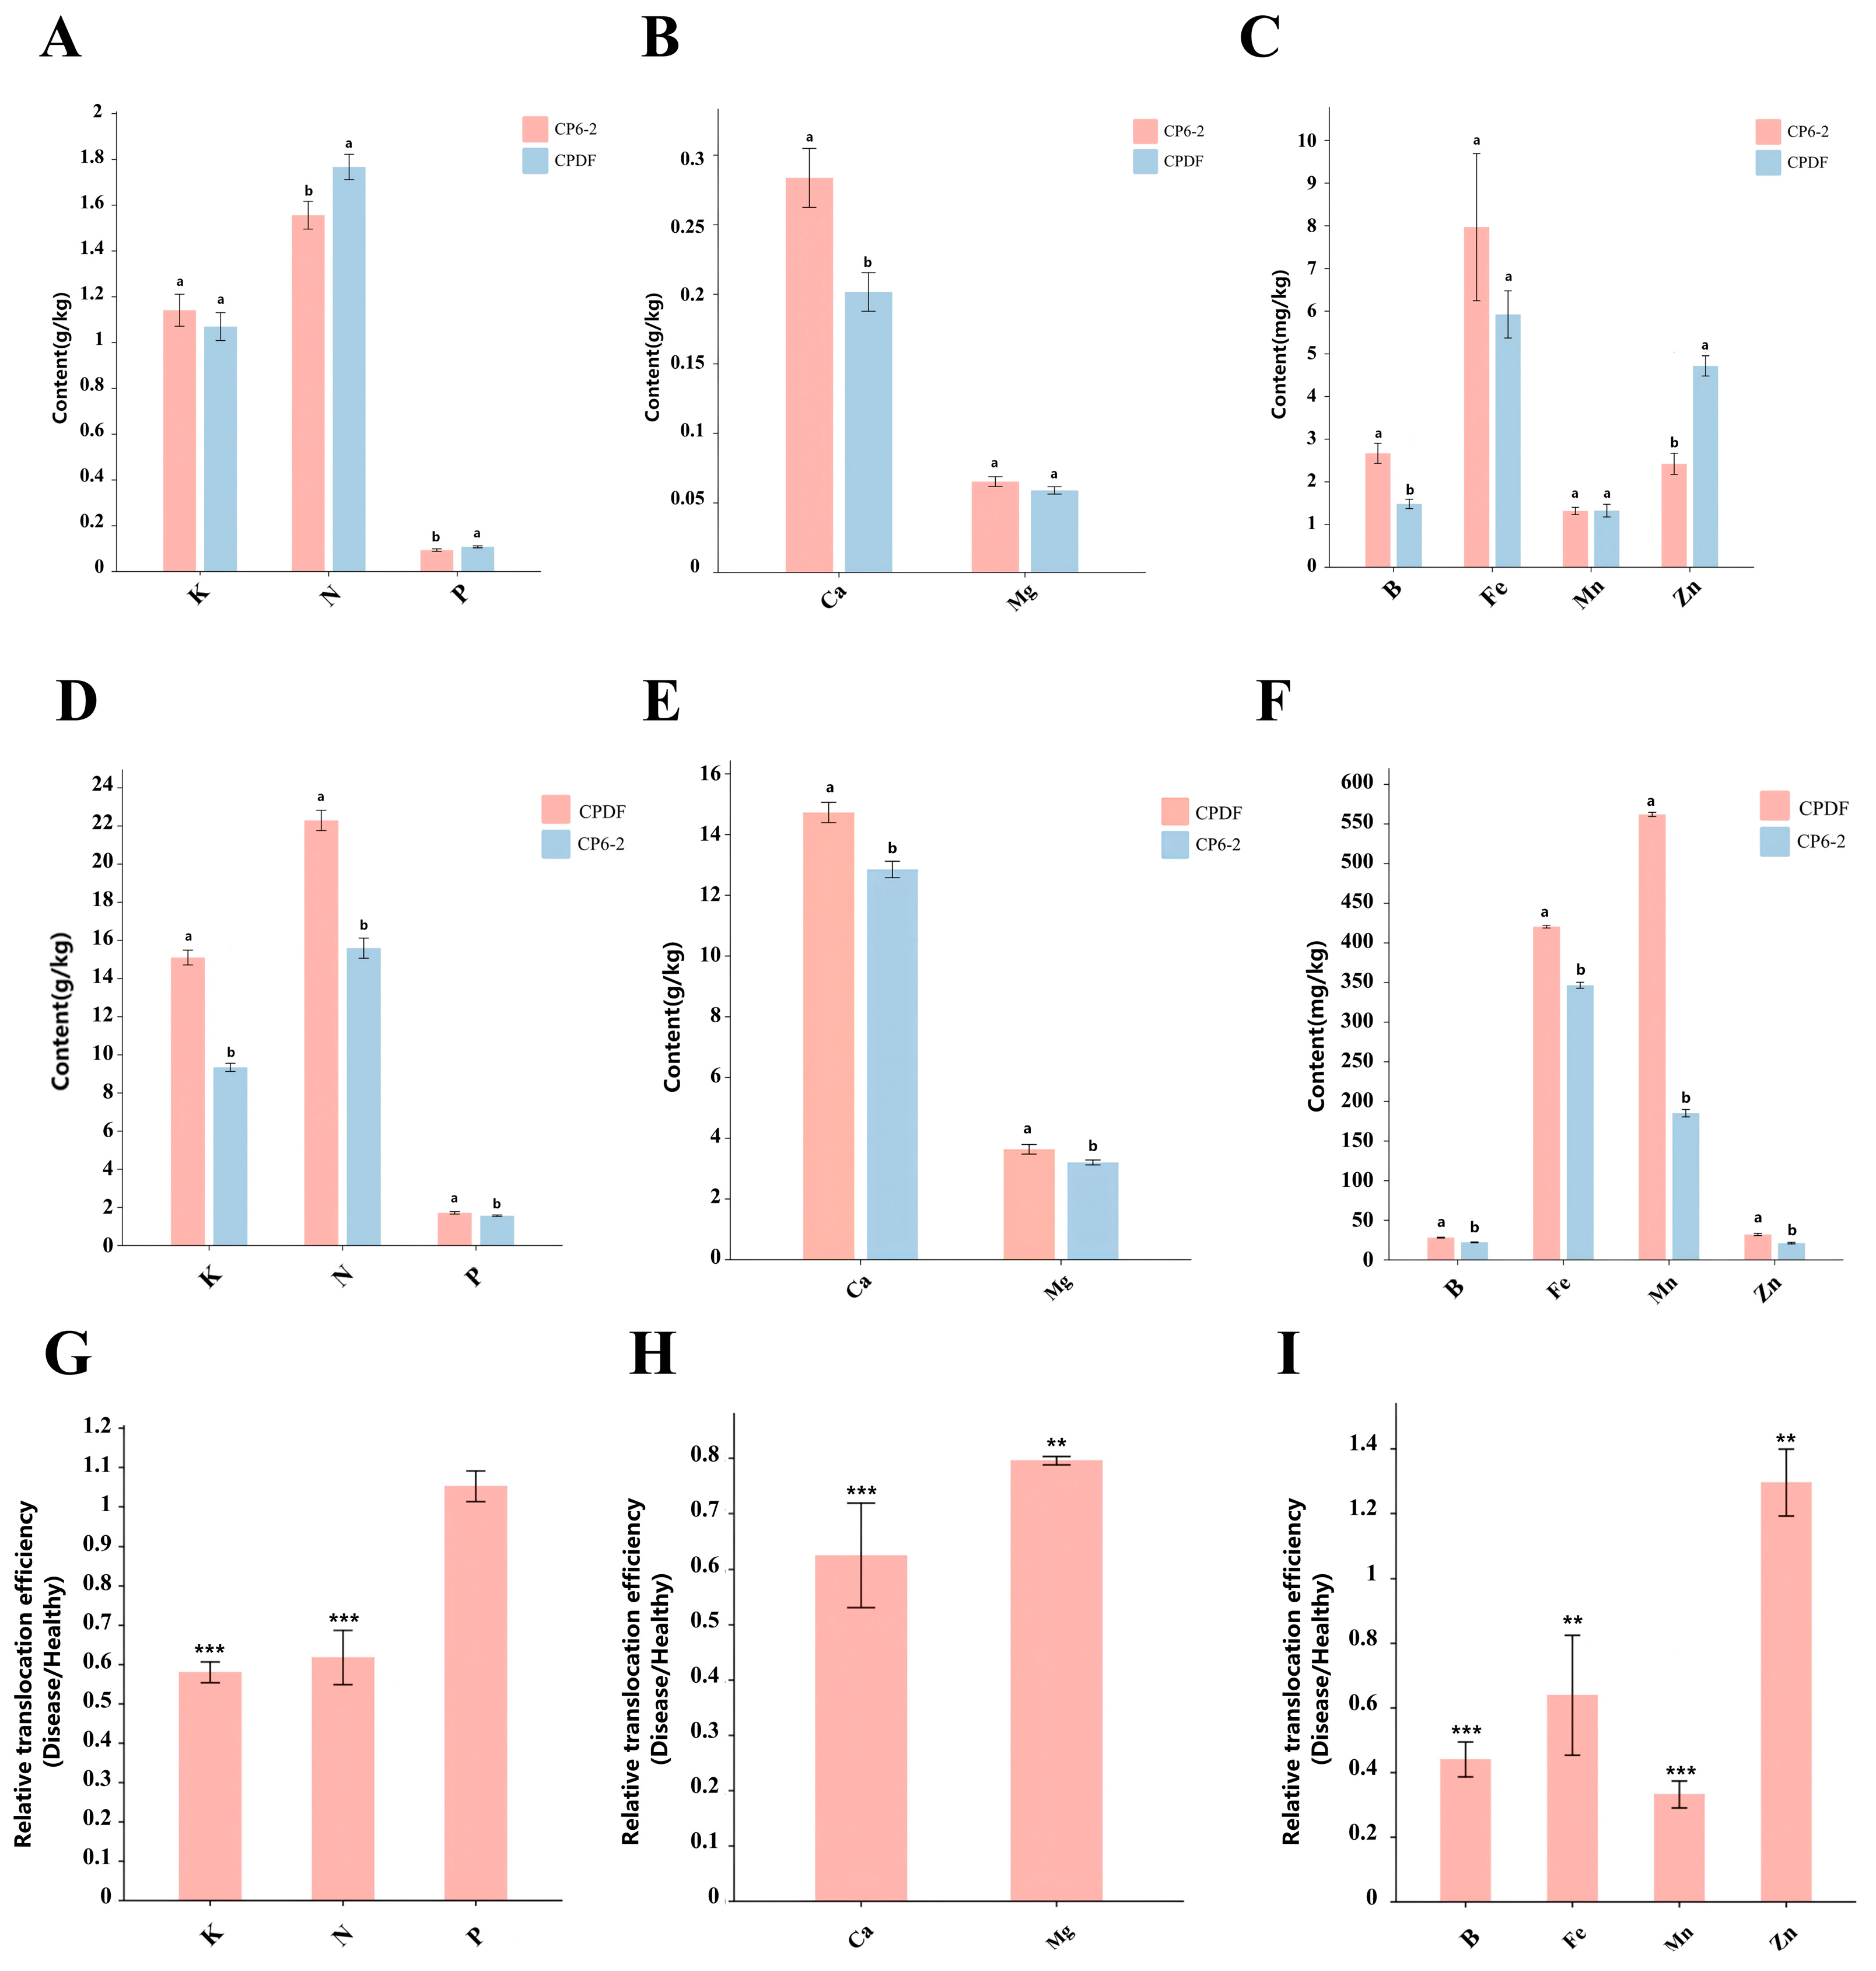
Although we observed Ca and B deficiencies in the diseased fruits, the elemental analysis of leaves showed that the Ca and B contents in CP leaves were not low; rather, they were higher than those in CP6-2. These results suggest that the observed Ca and B deficiencies in the fruits are unlikely to be primarily attributable to insufficient nutrient supply from the leaves. Instead, they may result from impaired transport of nutrients from the leaves to the fruits. It should be noted, however, that Ca is transported predominantly via the xylem and has low phloem mobility, whereas B is phloem-mobile to varying degrees depending on species. Therefore, the transport pathways and underlying mechanisms for these two elements may differ. Combined with the vascular bundle structure observations, we tentatively infer that these elemental deficiencies are associated with abnormalities in vascular bundle structure and function, which may impact nutrient translocation. Based on the results of scanning electron microscopy observations, it is possible that the altered vascular bundle structure contributes to reduced transport of Ca and B from the primary vascular bundles to the secondary vascular bundles. However, this inference is based on correlative evidence and would require direct transport measurements to be confirmed.
4.4. The Absence of Ca and B at the Tips of the Fruit’s Vascular Bundles Ultimately Led to the Onset of Cork Spot Disorder
Both Ca and B are involved in maintaining the structural homeostasis of plant cells, and abnormalities in either of these elements may affect cell structure in a tissue- and stage-dependent manner. Mineral elements not only constitute plant tissues but also play an important role in regulating plant metabolism, making them important for plant physiological activities. As Jeevanraj et al. point out, macronutrients and micronutrients primarily help plants resist external stresses by strengthening physical connections and coordinating biochemical activities [
32]. Pear cork spot disorder is widely recognized as being connected with Ca deficiency. Ca
2+ can form a pectin–calcium gel, which cross-links the non-esterified galacturonic acid residues in pectin chains [
33]. Boron, on the other hand, is essential for the cross-linking of rhamnogalacturonan-II (RG-II) in the cell wall, and its deficiency compromises wall integrity. Furthermore, Ca influences protein synthesis and the transportation of carbohydrates. Ca also helps maintain the integrity of biological membranes, enhancing the selective uptake of certain ions. The symptoms exhibited by tissues affected by cork spot disorder closely resemble those of Ca deficiency from this point of view.
When Ca and B cannot be transported normally to the vascular bundle terminals, the structure formed by cross-linked pectin molecules may break down, cell membrane stability could be compromised, and cell structure may not be adequately maintained. This cascade of events may eventually lead to tissue collapse, which contributes to the development of cork spot disorder.