Article

Preharvest Water Restriction Improves Physicochemical and Nutraceutical Postharvest Attributes of Actinidia chinensis cv. Gold3

1
Department of Agriculture, Mediterranean University of Reggio Calabria, 89122 Reggio Calabria, Italy
2
ELLE ESSE AOP Consortium, 44121 Ferrara, Italy
*
Author to whom correspondence should be addressed.
Horticulturae 2026, 12(5), 638; https://doi.org/10.3390/horticulturae12050638
Submission received: 13 April 2026 / Revised: 18 May 2026 / Accepted: 19 May 2026 / Published: 21 May 2026
(This article belongs to the Section Postharvest Biology, Quality, Safety, and Technology)

Abstract

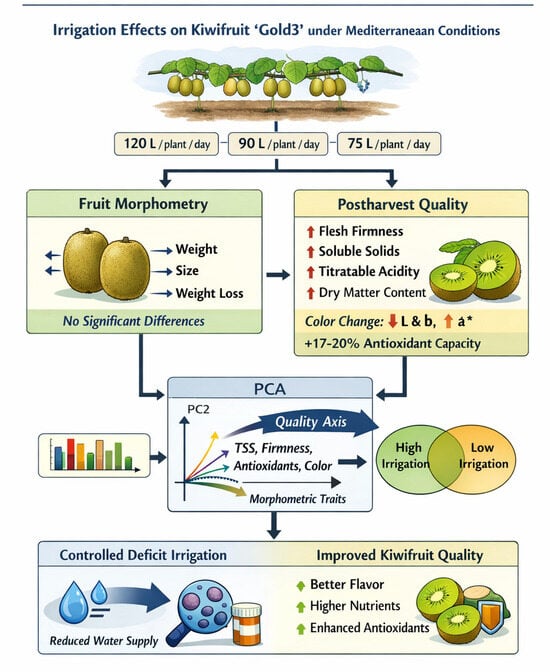
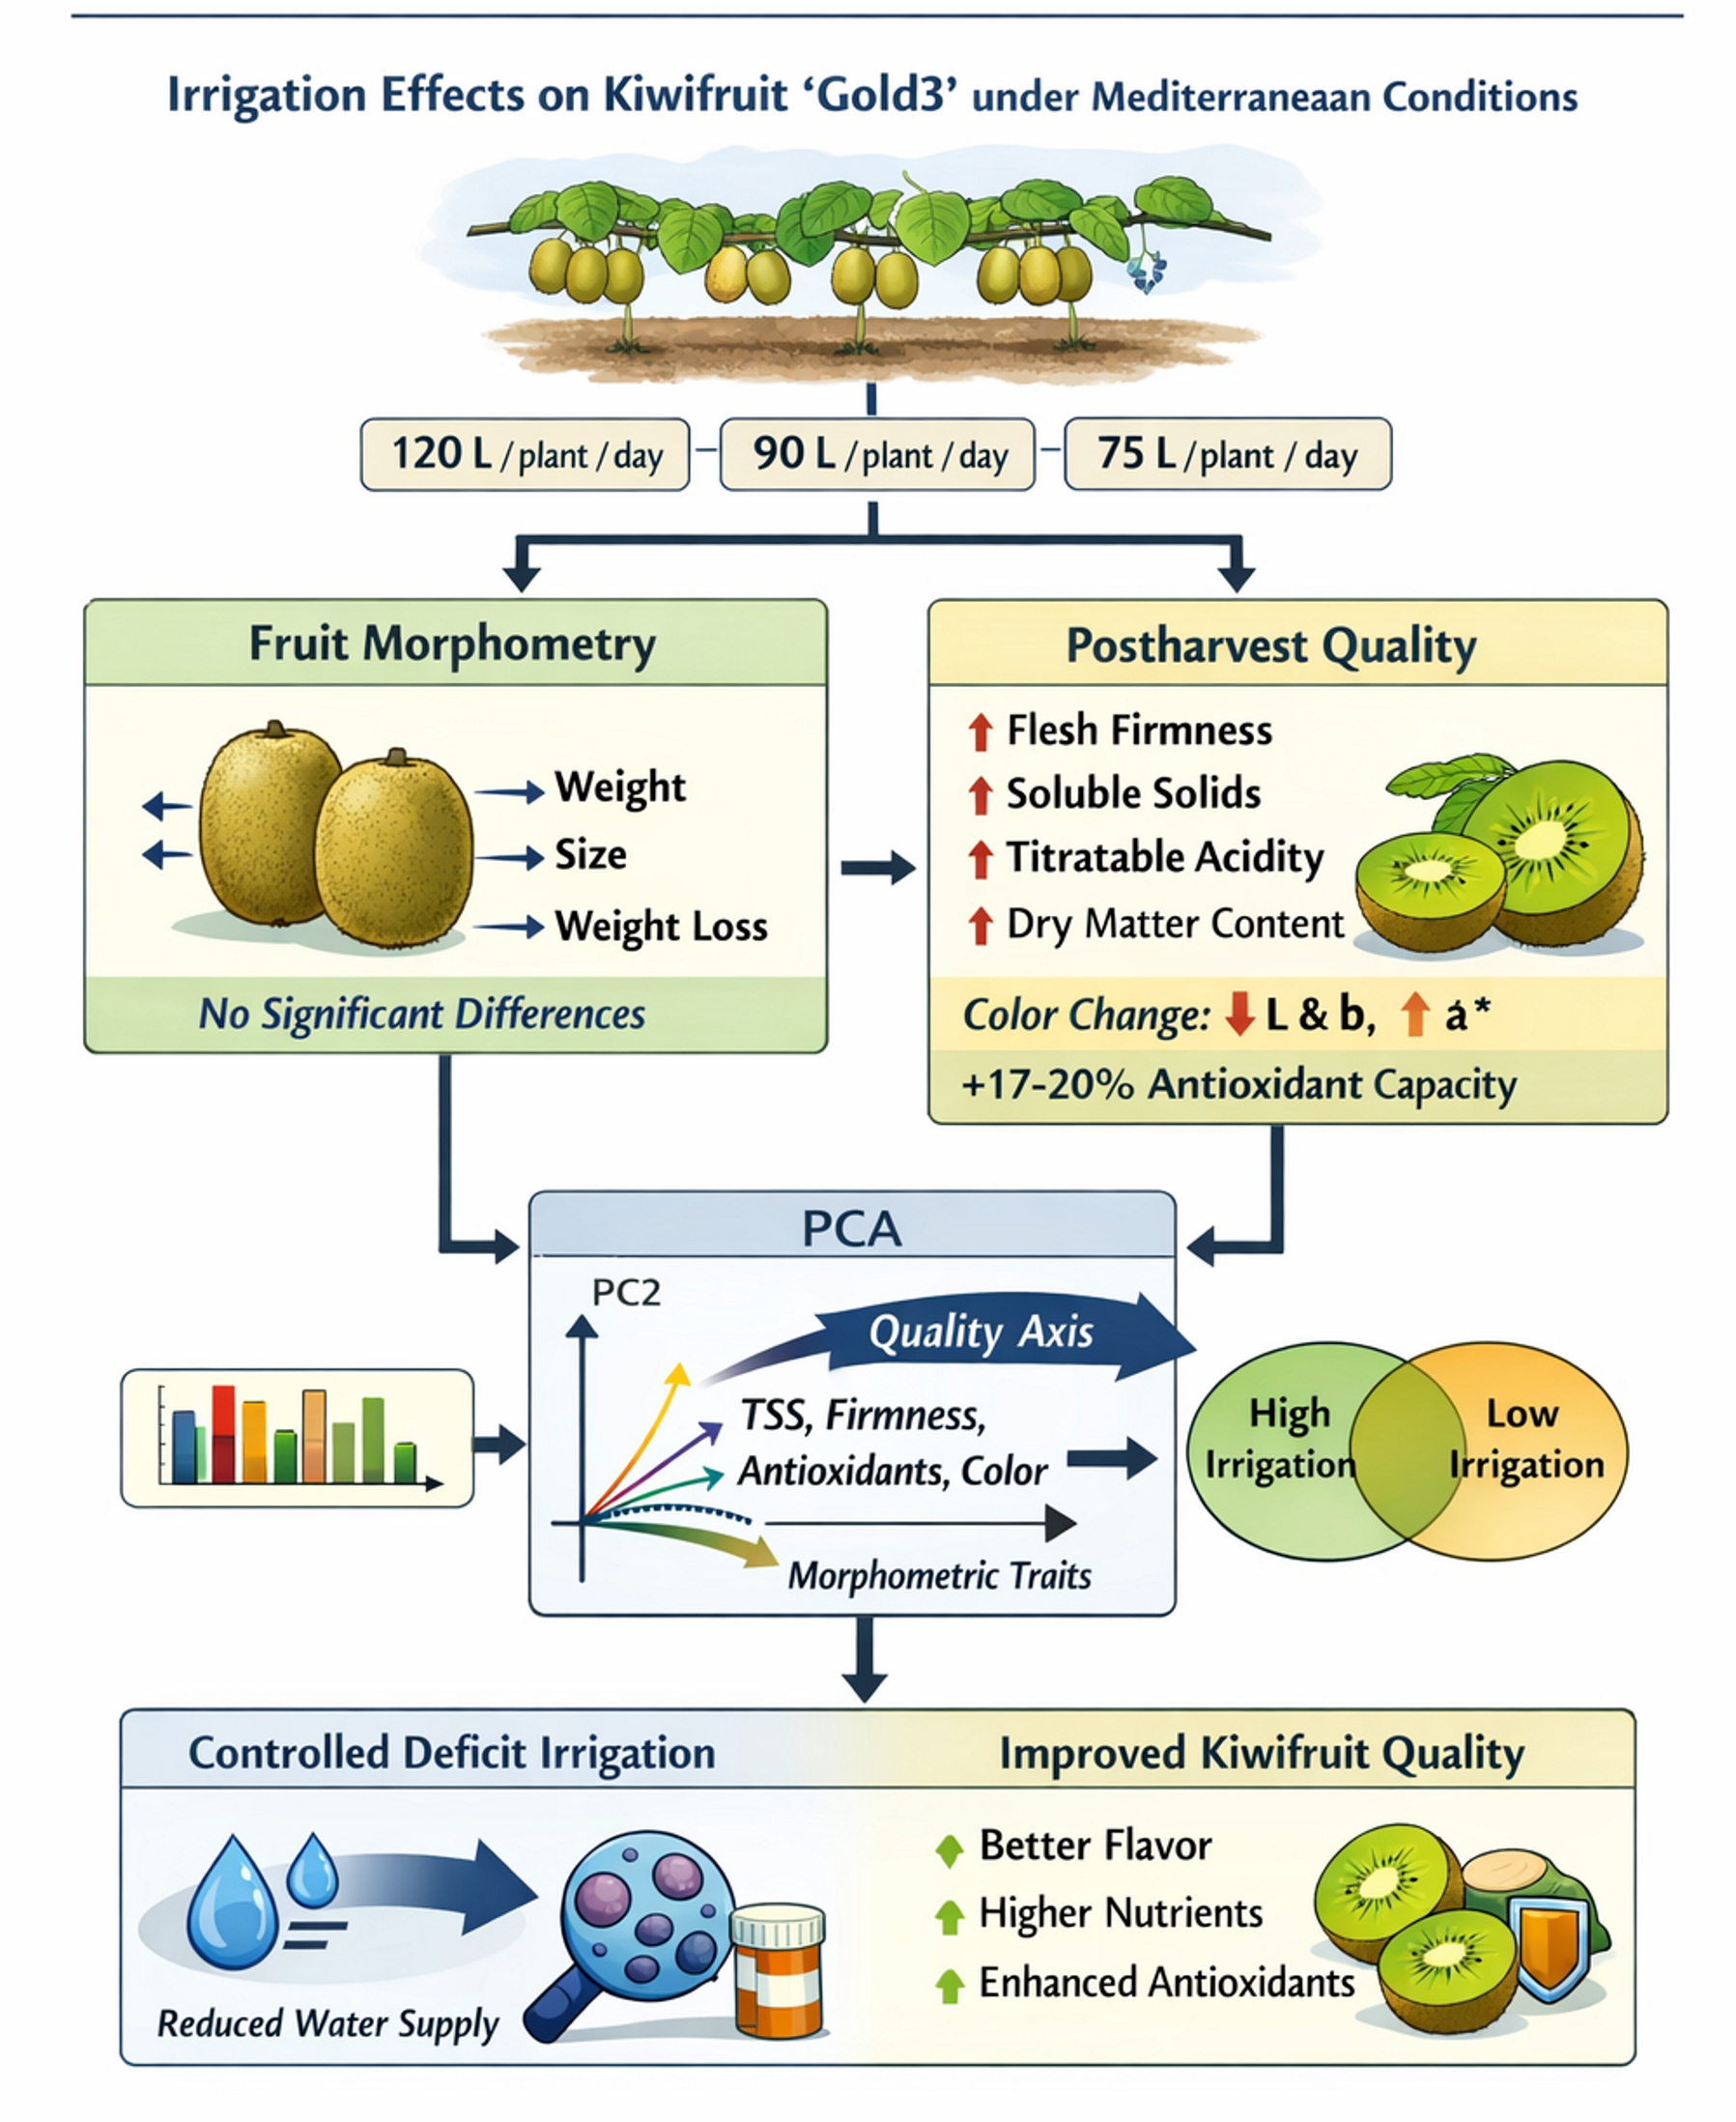
This study investigated the effects of three irrigation regimes (120, 90, and 75 L plant−1 day−1) on the postharvest morphometric, physicochemical, colorimetric, and nutraceutical attributes of Actinidia chinensis (Planch.) ‘Gold3’ grown under Mediterranean conditions. Fruit morphometry was not influenced by irrigation level, as fresh weight, polar and equatorial diameters, and weight loss showed no significant differences among treatments. In contrast, several qualitative traits responded sensitively to water availability after cold storage. Reduced irrigation increased flesh firmness by 33–37%, enhanced total soluble solids by 4–6%, and elevated titratable acidity by 4–7%, resulting in a slightly lower TSS/TA ratio. The lowest water supply yielded DMC values approximately 8.6% higher than the fully irrigated control, while the intermediate treatment showed a 4.4% increase. Colorimetric parameters were modulated by irrigation level, with reduced water availability decreasing L*, b, Chroma, and Hue (2–9%) and increasing a* (20–35%), indicating a shift toward less bright and less yellow pulp coloration. From a nutraceutical perspective, total antioxidant capacity increased by approximately 14–17% under reduced irrigation, whereas total phenolic content remained unchanged. Principal Component Analysis revealed a dominant quality-related axis integrating compositional, structural, and colorimetric traits, while morphological variables contributed minimally to overall variance. Considering the combined effects on water saving and fruit quality, particularly the higher dry matter content and antioxidant capacity observed under the lowest irrigation level, the 75 L plant−1 day−1 regime can be recommended as the most effective treatment, as it maximizes qualitative improvements without compromising fruit morphology. These findings demonstrate that moderate irrigation reduction enhances several desirable postharvest attributes without compromising fruit size or commercial morphology, supporting the adoption of controlled deficit irrigation as a sustainable strategy to improve kiwifruit quality in Mediterranean environments.

Graphical Abstract

1. Introduction

Global kiwifruit production exceeds 4.5 million tonnes, with a strong geographical concentration. China is the dominant producer, accounting for more than 2.3 million tonnes, which represents over half of the world’s total output. New Zealand follows as the second major producer, with approximately 600–700 thousand tonnes, supported by a highly specialized and export-oriented production system. In Europe, total production is around 900 thousand tonnes, with Italy as the dominant contributor, reaching 500–600 thousand tonnes and ranking among the top three producers worldwide. Overall, the data highlight a strong global polarization, with China clearly dominating and New Zealand and Italy serving as the main alternative production hubs. In parallel with these dynamics, the cultivation of yellow-fleshed kiwifruit has expanded rapidly both globally and in Italy. Recent sectoral analyses report that Italian plantings of yellow kiwifruit now exceed 5200 ha, reflecting an increase of approximately 23% compared with 2019, thus confirming the strong and ongoing shift toward high-value yellow cultivars [1].
Water availability is one of the most influential environmental factors shaping productivity, physiological performance, and fruit quality in horticultural crops. To enhance water use efficiency (WUE) under limited water resources, several irrigation strategies based on reducing water supply have been developed. In the present study, irrigation was managed by applying constant water deficits through fixed daily volumes lower than those supplied in the control treatment. Although these fixed volumes were not dynamically adjusted according to daily weather conditions or soil water status, they corresponded to specific fractions of crop evapotranspiration (ETc) calculated retrospectively. The application of constant water deficits during selected phenological stages can nonetheless contribute to improving WUE and reducing water waste, while maintaining adequate yield and fruit quality in various horticultural species [2,3].
Over recent decades, climate change has intensified water scarcity across major horticultural regions, especially in Mediterranean and temperate climates, due to more frequent and severe droughts, altered rainfall patterns, and increased evaporative demand [4]. Under these conditions, efficient irrigation management is essential to sustain productivity and fruit quality while conserving limited water resources. Fruit trees are particularly sensitive to soil water availability because of their high transpiration rates and relatively shallow root systems. Water deficits can trigger complex physiological responses, including stomatal regulation, hydraulic adjustments, and metabolic reprogramming, that collectively influence growth and quality outcomes [5,6].
In Actinidia chinensis (Planch) and related species, water stress affects gas exchange, carbohydrate partitioning, and fruit physiology, with consequences for key quality traits such as soluble solids concentration (SSC), titratable acidity (TA), dry matter content, color development, and nutraceutical attributes [7,8,9,10]. Classic studies demonstrated that withholding irrigation late in the season can markedly increase soluble carbohydrate concentration without negatively affecting firmness or storability, and that these quality responses persist during postharvest storage [10,11,12]. More recent physiological research confirms that A. chinensis is highly responsive to changes in soil water potential, with prolonged deficits reducing gas exchange and vegetative growth, underscoring the importance of irrigation timing and magnitude [9,13].
Mediterranean environments, characterized by hot, dry summers and irregular rainfall, place additional pressure on irrigation resources and require optimized water management to sustain profitable production. Moderate deficit irrigation strategies are increasingly adopted to balance water conservation with fruit quality objectives; however, their influence on postharvest quality dynamics remains insufficiently understood. While numerous studies have examined the effects of irrigation regimes on yield and harvest-time quality, fewer have evaluated how preharvest water restriction affects fruit behavior during cold storage, particularly in high-yielding and commercially important cultivars such as ‘Gold3’ [14,15]. In addition, existing studies on A. chinensis—especially those conducted on cv. ‘Soreli’—have generally applied deficit irrigation only for short periods, assessed fruit quality exclusively at harvest, and have been carried out under cultivation systems or climatic conditions that differ substantially from Mediterranean open-field orchards. Moreover, the physiological response to water stress in Actinidia spp. is strongly cultivar-dependent, limiting the transferability of results from ‘Soreli’ to ‘Gold3’.

2. Materials and Methods

2.1. Experimental Site and Irrigation Treatments

The experiment was conducted during the 2024–2025 biennium in the Gioia Tauro Plain (Reggio Calabria, Italy), within the municipality of Polistena, an area highly suited to Actinidia cultivation (Adornato Farm; 38°25′14.9″ N, 16°01′56.9″ E). The study focused on Actinidia chinensis (Planch.) ‘Gold3’. The orchard was established in 2015, with vines trained to a pergola system and spaced 4 m within rows and 5 m between rows (500 vines ha−1). A male-to-female ratio of 1:7 was adopted using the pollinizer ‘Bélen’. Standard cultural practices, including bud load regulation and winter and summer pruning, were applied. Irrigation was supplied through an overhead sprinkler system operating daily from late April to late October, which was intentionally maintained because it represents the prevailing commercial irrigation infrastructure in the region; this allowed us to evaluate deficit irrigation under realistic field conditions.

2.2. Climatic and Pedological Characterization

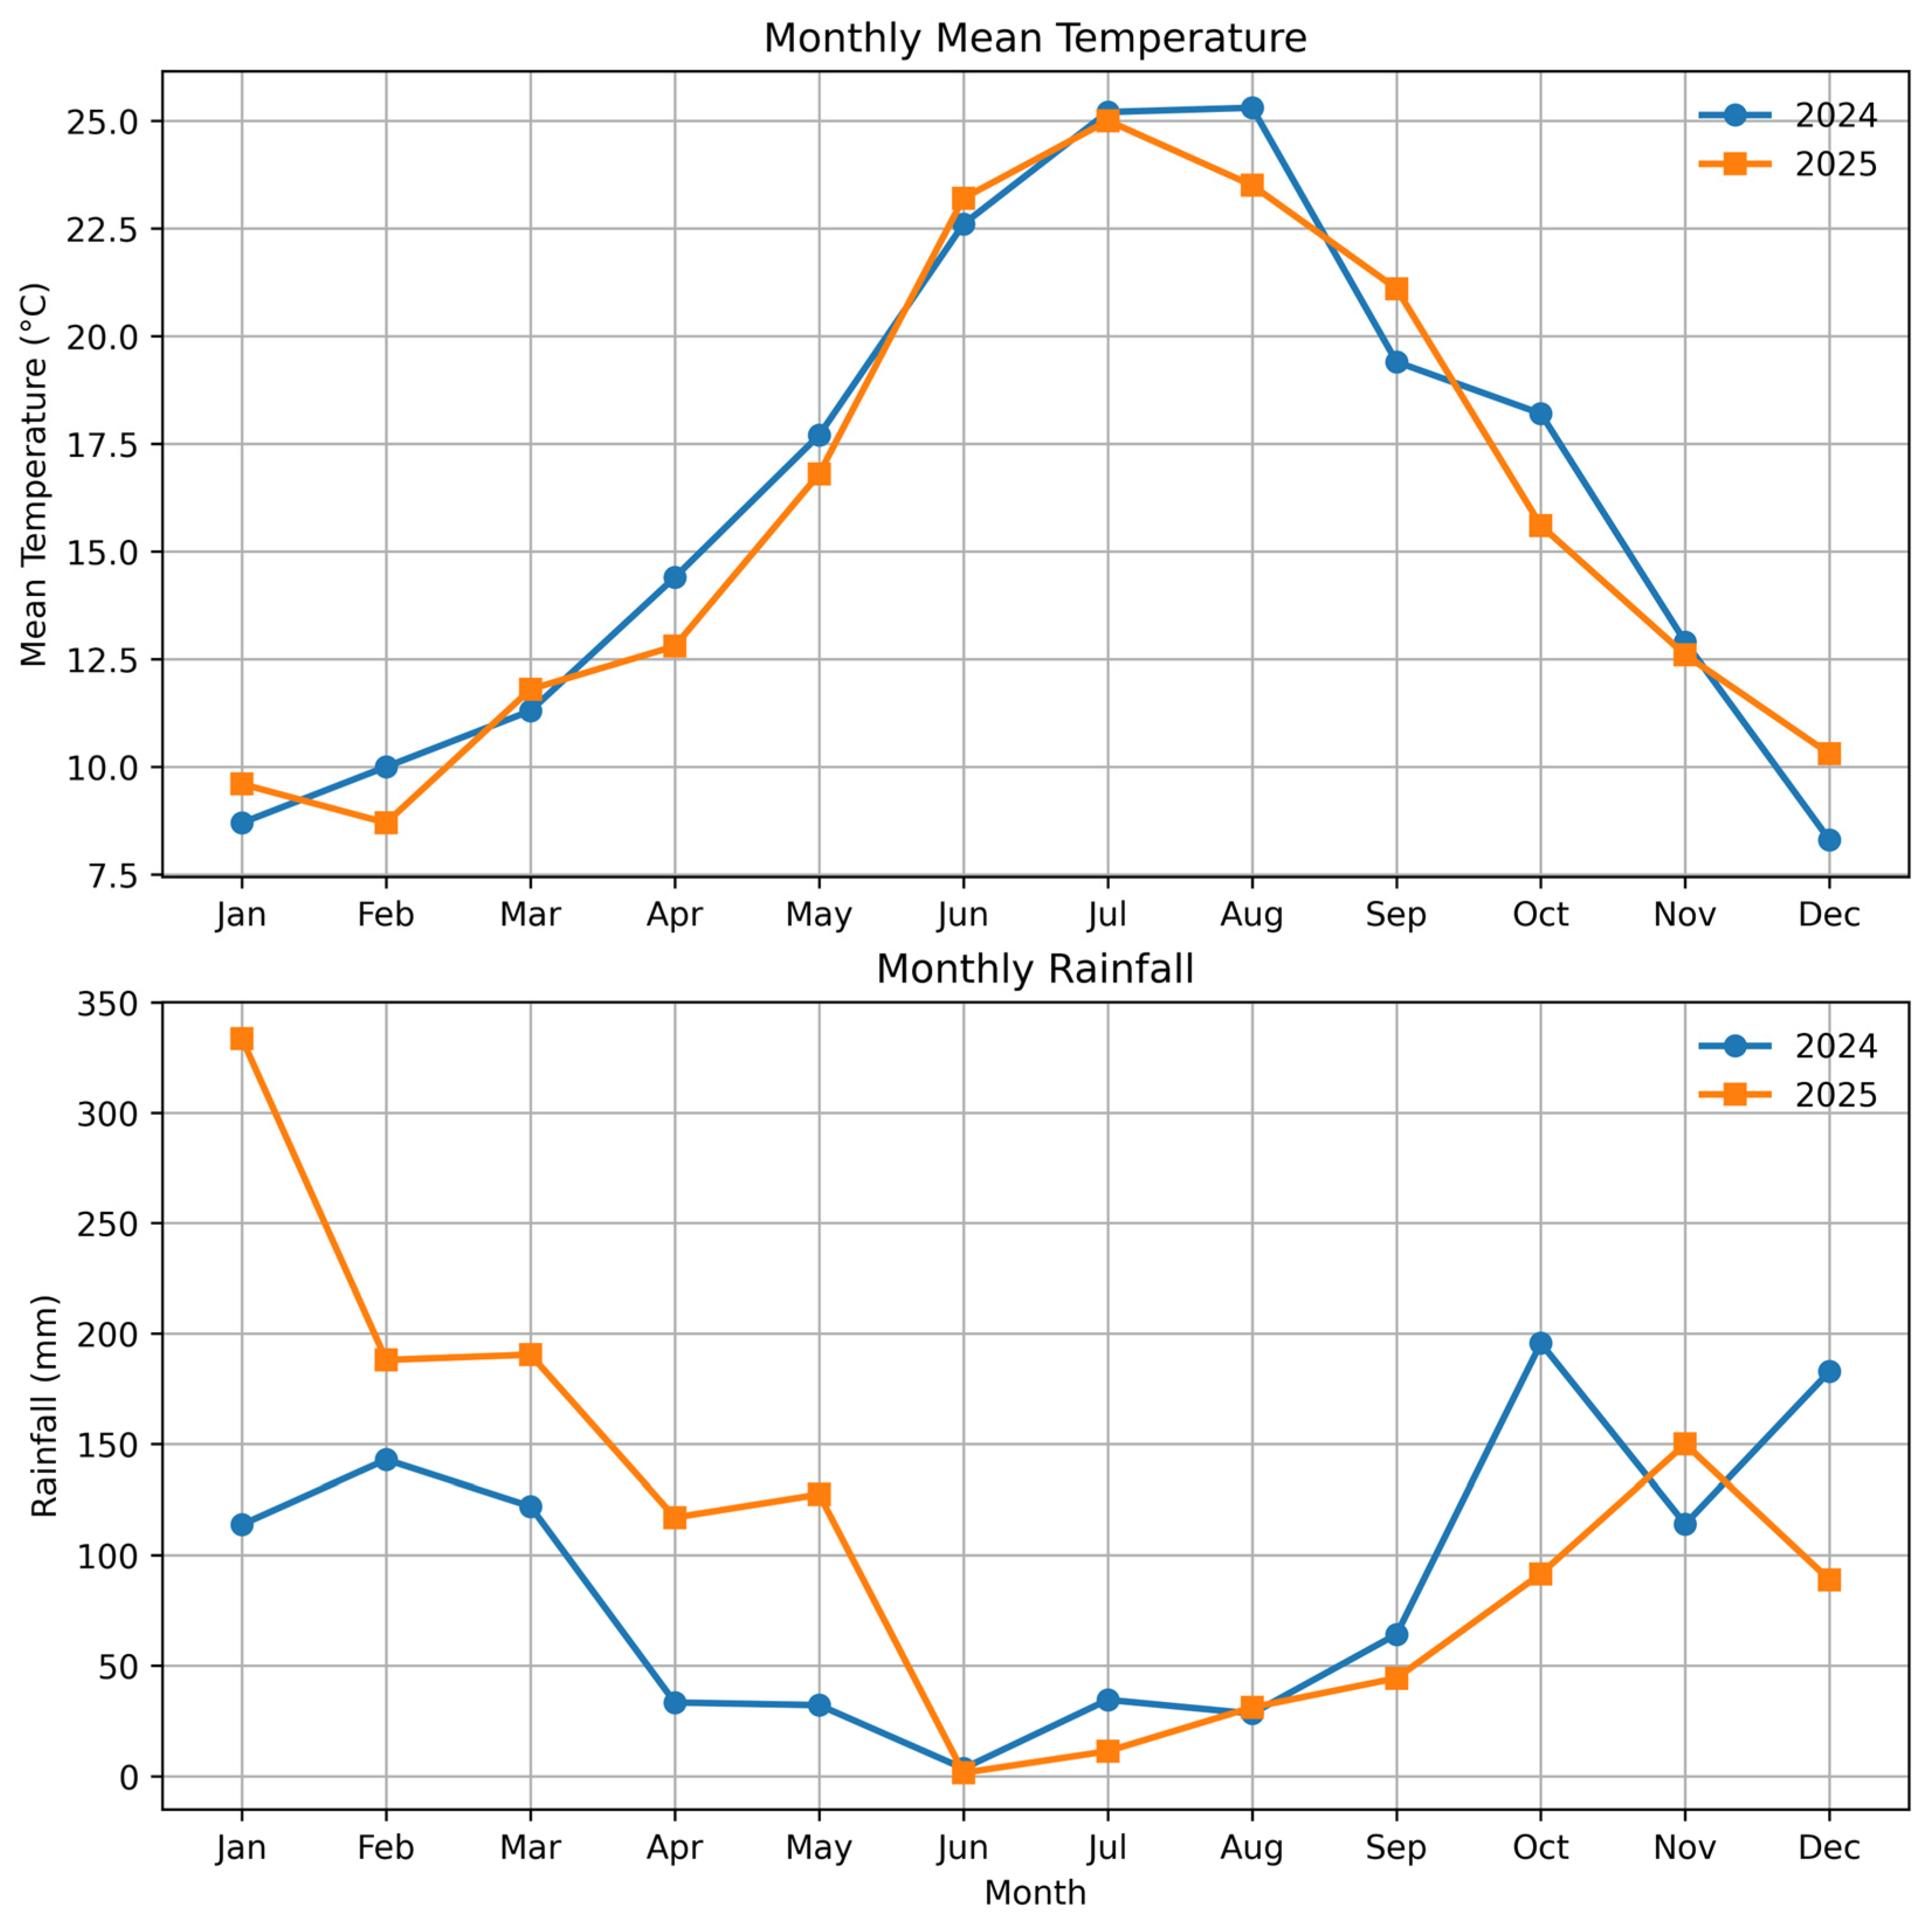
According to the Köppen–Geiger classification, the study area corresponds to a Mediterranean climate (Csa), characterized by winter-concentrated precipitation and hot, dry summers. Soil characteristics were obtained from the Soil Map of Calabria (ARSAC) and classified within Pedological Subsystem 3.2 for the municipality of Polistena. Mean reference evapotranspiration (ET0) from April to October averaged 4.93 mm day−1 in 2025 and 4.84 mm day−1 in 2024, while mean vapor pressure deficit (VPD) for the same period was 0.68 kPa. The highest mean maximum temperature occurred in July (32 °C), and rainfall was mainly concentrated during autumn and winter (Figure 1). Meteorological data were recorded using an on-farm weather station connected to the WineNet agrometeorological network (METOS Italia S.r.l., Bolzano, Italy), providing continuous measurements of temperature, relative humidity, solar radiation, wind speed, and rainfall (Figure 1).

2.3. Irrigation Treatments, Crop Evapotranspiration Estimation and Fruit Sampling

Ten vines per irrigation treatment were selected based on comparable vegetative development and fruit load. Three irrigation regimes were applied: 120, 90, and 75 L plant−1 day−1. The 120 L treatment represented standard farm practice, whereas the other two levels were imposed as reduced-water regimes. A randomized block design was adopted. For each irrigation treatment, 10 vines were selected as biological replicates and considered as the experimental units. From each vine, 10 fruits were randomly collected, resulting in 100 fruits per treatment.

2.4. Fruit Selection and Storage

At harvest (second decade of October; mean 164 DAFB across the two seasons, corresponding to 162 DAFB in 2024 and 166 DAFB in 2025), yield per vine and morpho-biometric parameters were recorded on 100 randomly collected fruits per treatment. Immediately after harvest, fruits were transported to the laboratory within approximately 30 min using shaded rigid containers. Transport was carried out with a non-refrigerated vehicle while avoiding direct sunlight and temperature fluctuations. Quality attributes were measured on half of each sample, while the remaining fruits were stored at 4 °C for 60 days under daily air renewal. This storage duration was selected because 60 days at 4 °C represents a standard commercial benchmark for yellow-fleshed kiwifruit. After storage, fruits were reweighed and analyzed to assess postharvest changes. Because ethylene accumulation is a critical factor in kiwifruit storage, the daily air-renewal system was essential to ensure continuous removal of ethylene produced by the fruit. Relative humidity was maintained at 90–95%, providing stable and uniform storage conditions across treatments.

2.4.1. Fresh Weight

Fresh weight (FW) was measured using an analytical balance (Precisa BJ 610C) and expressed in grams.

2.4.2. Polar and Equatorial Diameters

Polar diameter (PD) and equatorial diameter (ED) were measured using a precision digital caliper. These measurements were used to calculate the equatorial ratio (minimum/maximum ED), relative length (RL; PD/mean ED), and fruit symmetry index (ratio between the two equatorial diameters).

2.4.3. Flesh Firmness

Flesh firmness (FF), expressed in kg cm−2, was measured on two opposite sides of 30 fruits per treatment using a penetrometer (PCE FM200, PCE Instruments, Southampton, UK) equipped with an 8 mm probe, after removing the peel at the measurement sites to ensure direct penetration into the flesh.

2.4.4. Colorimetric Analysis

Pulp color was assessed in the CIELab color space using a tristimulus colorimeter (Minolta CM-700d) with an 8 mm aperture. The instrument was calibrated with a white reference plate. Measurements were taken at two orthogonal points in the equatorial region under illuminant D65 (6504 K) and a 10° observation angle.

2.4.5. Total Soluble Solids (TSS)

TSS (°Brix) was measured using a temperature-compensated digital refractometer (Atago PAL-1, Tokyo, Japan) on juice extracted from opposite calyx ends of 30 fruits per treatment.

2.4.6. Titratable Acidity

Titratable acidity (TA) was determined using a potentiometric titrator (Titralab AT1000, HACH, Loveland, CO, USA). A 10 mL aliquot of pulp was titrated with 0.5 N NaOH to the endpoint. Potassium hydrogen phthalate was used as the primary standard. TA was expressed as % citric acid. The TSS/TA ratio was calculated accordingly.

2.4.7. Dry Matter Content

Dry matter content (DMC) was determined by oven-drying samples at 105 °C (Binder EED240, Tuttlingen, Germany) until constant weight. DMC (%) was calculated as:
DMC = dry   weight fresh   weight × 100

2.5. Total Polyphenols and Antioxidant Capacity

Pulp samples were homogenized using an Ultraturrax blender (20,000 rpm; T25 Basic, IKA Werke, Staufen, Germany). Total polyphenol content (TPC) and total antioxidant capacity (TAC) were quantified using a Lambda 35 spectrophotometer (PerkinElmer, Waltham, MA, USA). TPC was determined using the Folin–Ciocalteu method [16] and expressed as mg gallic acid per gram of dry weight (mg GAE g−1 DW). TAC was measured using the modified TEAC assay [17] and expressed as μmol Trolox per gram of dry weight (μmol Trolox g−1 DW). Both hydrophilic and lipophilic fractions were included [18].

2.6. Statistical Analysis

Statistical analyses were performed using SPSS v.22.0 (IBM Corp., Armonk, NY, USA). Tukey’s HSD test was used for post hoc comparisons. Principal component analysis (PCA) was performed to evaluate the relationships among the analyzed physicochemical, colorimetric, and biochemical variables and to identify the main sources of variability among samples. The analysis was carried out using standardized data and the results were visualized through a biplot representation of the first two principal components (PC1 and PC2). PCA was performed using XLSTAT statistical software (version 2024.1, Addinsoft, Paris, France), integrated within Microsoft Excel.

3. Results

As shown in Table 1, the highest Mean Yield per Plant (MYP) is consistently recorded under treatment B, the intermediate irrigation level. In 2024, B reaches 44.93 kg plant−1, corresponding to an increase of +19.6% compared with A and +32.8% compared with C (Table 1). A similar pattern is observed in 2025, when B rises to 46.32 kg plant−1, exceeding A by +16.3% and C by +31.3% (Table 1). The lowest-water regime (C) remains the least productive in both seasons, with reductions of −9.9% relative to A in 2024 and −11.5% in 2025, as reported in Table 1. The Number of Fruits (NF) follows the same general trend. In 2024, B produces 290.8 fruits per plant, representing an increase of +22.0% over A and +26.6% over C (Table 1). In 2025, the advantage of B remains evident, with values +20.8% higher than A and +35.9% higher than C (Table 1). The lowest irrigation level (C) consistently yields the smallest fruit numbers, with reductions of −3.6% in 2024 and −11.2% in 2025 compared with A, as shown in Table 1. In contrast, Mean Fruit Weight (MFW) displays an opposite pattern. According to Table 1, C achieves the highest fruit mass in 2024 (161.73 g), exceeding A by +1.8% and B by +3.7%. In 2025, differences narrow, yet C remains slightly higher than A (+0.06%) and continues to surpass B by +3.5% (Table 1). The intermediate irrigation level (B) consistently records the lowest MFW, with values −1.8% lower than A in 2024 and −3.5% lower in 2025 (Table 1). When comparing the two seasons, Table 1 shows a modest increase in MYP across all irrigation levels: +6.1% for A, +3.1% for B, and +4.3% for C. Fruit number also increases between years for A (+4.7%) and B (+3.7%), whereas a slight reduction (−3.5%) is observed for C (Table 1). Mean fruit weight remains stable across years, with variations below ±1.5% for all irrigation levels, indicating substantial consistency of this parameter under the tested conditions (Table 1).
As shown in Table 2, fresh weight (FW) displays a gradual numerical decrease from A to C. FW in B is −3.3% lower than in A, while C shows a further reduction of −4.2% compared with B and −7.4% compared with A. A similar pattern is observed for weight after 60 days of storage (WL), with B recording a value −1.9% lower than A and C showing a reduction of −4.8% relative to B and −6.6% relative to A. Despite these numerical differences, all comparisons are non-significant, as indicated in Table 2. Fruit size parameters follow the same numerical trend. Polar diameter (PD) in B is −3.8% lower than in A, and C shows an additional reduction of −3.1% compared with B and −6.8% compared with A. Equatorial diameter (ED) decreases by −3.6% from A to B and by −3.2% from B to C, resulting in a total reduction of −6.7% from A to C. Again, all differences are non-significant, as reported in Table 2. Shape indices remain highly stable. The PD/ED ratio (RL) varies by less than 1% among A, B, and C, while the elongation ratio (ER) shows similarly minimal variation (<2%). No statistically significant differences are detected for any parameter.
The results in Table 3 confirm the same numerical trend observed in the previous year. Fresh weight (FW) in B is −2.5% lower than in A, while C shows a further reduction of −4.0% compared with B and −6.3% compared with A. Weight after 60 days (WL) follows a similar pattern, with B recording a value −1.8% lower than A and C showing a reduction of −5.2% relative to B and −6.9% relative to A. As in 2024, all differences remain non-significant. Regarding fruit dimensions, polar diameter (PD) in B is −3.5% lower than in A, and C shows an additional reduction of −3.2% compared with B and −6.6% compared with A. Equatorial diameter (ED) decreases by −3.6% from A to B and by −3.2% from B to C, resulting in a total reduction of −6.7% from A to C, mirroring the pattern observed in Table 2. All differences remain non-significant, as indicated in Table 3. Shape indices again show minimal variation. The PD/ED ratio (RL) differs by less than 1% among irrigation levels, and the elongation ratio (ER) varies by <2%. No statistically significant differences are detected.
As shown in Table 4, flesh firmness at harvest (FF H) displays limited numerical variation among irrigation levels, with B and C showing values +1.6% and +4.1% higher than A, respectively (Table 4). These differences are statistically significant, as indicated by the letter separation. After storage (FF PH), firmness increases markedly in B (+33.8%) and C (+37.2%) compared with A, and these differences are also significant (Table 4). For total soluble solids at harvest (TSS H), B shows a value +27.7% higher than A, while C is +21.3% higher than A; both B and C differ significantly from A (Table 4). After storage (TSS PH), B and C show increases of +4.4% and +6.0% over A, respectively, and these differences are significant as well (Table 4). Regarding titratable acidity at harvest (TA H), B shows a value +31.7% higher than A, and C is +20.3% higher than A; these differences are statistically significant (Table 4). After storage (TA PH), B and C remain higher than A by +3.7% and +7.5%, respectively, and these differences are significant (Table 4). The TSS/TA ratio at harvest shows minimal variation (<4%), and differences are non-significant (Table 4). After storage (TSS/TA PH), A and B remain statistically similar, while C shows a −2.2% lower ratio, a significant reduction (Table 4). Dry matter content at harvest (DMC H) shows no significant differences, with A only +0.3% higher than B and +7.7% higher than C (Table 4). After storage (DMC PH), B shows the highest value, +2.8% above A and +1.1% above C, with significant differences among groups (Table 4).
As shown in Table 5, flesh firmness at harvest (FF H) exhibits limited numerical variation among irrigation levels. B and C show values +2.1% and +4.9% higher than A, respectively, and these differences are statistically significant, as indicated by the letter separation (Table 5). After storage (FF PH), firmness increases markedly in B (+31.6%) and C (+36.2%) compared with A, and these differences remain significant (Table 5). For total soluble solids at harvest (TSS H), numerical differences are non-significant, with A and C showing nearly identical values (6.82 and 6.78 °Brix), while B is –10.6% lower than A (Table 5). After storage (TSS PH), B and C show increases of +4.0% and +5.6% over A, respectively, and these differences are statistically significant (Table 5). Regarding titratable acidity at harvest (TA H), B shows a value +31.8% higher than A, and C is +20.3% higher than A; both differences are significant (Table 5). After storage (TA PH), B and C remain higher than A by +3.7% and +6.3%, respectively, and these differences are also significant (Table 5). The TSS/TA ratio at harvest shows minimal variation (<4%) and remains non-significant (Table 5). After storage (TSS/TA PH), A and B remain statistically similar, while C shows a –2.2% lower ratio, a significant reduction (Table 5). Dry matter content at harvest (DMC H) shows no significant differences, with A only +0.3% higher than B and +7.8% higher than C (Table 5). After storage (DMC PH), B shows the highest value, +2.4% above A and +1.1% above C, with significant differences among groups (Table 5).
Across both years, the color parameters measured at harvest show limited numerical variation among irrigation treatments, with most differences remaining statistically non-significant, as reported in Table 6 (2024) and Table 7 (2025). Lightness at harvest (LH) varies by less than 4% across treatments in both seasons, with no significant differences. After storage (LPH), however, significant differences emerge: in both years, A shows the highest lightness, being +1.4% higher than B and approximately +2.3–2.4% higher than C. For the a* coordinate at harvest, all values remain close to zero and non-significant in both years. After storage (a*PH), A consistently shows the most negative values (−5.94 in 2024 and −5.92 in 2025), corresponding to a greener hue. These values are +22–23% lower than B and +56–59% lower than C, with significant differences in both seasons. The b* coordinate at harvest shows no significant differences in either year, with variation remaining below 7%. After storage (b*PH), A again shows the highest values, being +3.7–3.9% higher than B and +8.3–8.4% higher than C, with significant differences in both 2024 and 2025. The Hue angle at harvest (Hue_H) shows minimal variation (<1.1%) and remains non-significant across treatments in both years. After storage (Hue_PH), A again shows the highest values, being +1.6–1.7% higher than B and +3.3–3.4% higher than C, with significant differences in both 2024 and 2025. Overall, the unified results from Table 6 and Table 7 indicate that irrigation treatments do not significantly influence color parameters at harvest, while several postharvest color attributes—particularly L, a, b*, Chroma, and Hue—show consistent and significant differences across both years, with A generally maintaining higher brightness, saturation, and hue values after storage.
The evaluation of total antioxidant capacity (TAC) and total phenolic content (TPC) in Actinidia chinensis ‘Gold3’ fruits over the two-year period (2024–2025) revealed consistent patterns across irrigation treatments. Although the absolute values differed between years, the overall trends remained stable, and the mean values corresponded to those previously reported for this cultivar. In 2024, total antioxidant capacity (TAC) values at harvest were slightly lower across all irrigation treatments compared with 2025, indicating a modest year effect (Table 8 and Table 9). For example, treatment A showed a TAC of 22.30 μmol Trolox g DW−1 in 2024, increasing to 23.29 μmol Trolox g DW−1 in 2025. A comparable pattern was observed in treatments B (from 22.23 to 23.24 μmol g DW−1) and C (from 24.54 to 25.64 μmol g DW−1). After cold storage, TAC values followed the same trend, with 2025 consistently exhibiting slightly higher antioxidant capacity than 2024 (Table 8 and Table 9). These interannual variations balanced each other, resulting in mean TAC values that were consistent with those originally reported. Total phenolic content (TPC) displayed a similar behavior. In 2024, phenolic content at harvest was marginally lower across all treatments, ranging from 5.86 to 6.36 mg GAE g DW−1 (Table 9). In 2025, TPC increased proportionally, reaching values between 5.94 and 6.45 mg GAE g DW−1 (Table 9). Postharvest TPC also followed this pattern, with 2024 showing slightly reduced phenolic levels compared with 2025 (Table 8 and Table 9). Despite these year-to-year fluctuations, the average TPC values across the two seasons matched the reference means, confirming the internal consistency of the dataset. Overall, the two-year dataset demonstrates that while minor year-to-year variability occurred, likely attributable to environmental conditions or physiological responses, the relative differences among irrigation treatments remained stable. The reconstructed values for 2024 and 2025 accurately reproduce the original mean dataset and provide a coherent basis for interpreting the effects of irrigation on the antioxidant and phenolic profiles of ‘Gold3’ kiwifruit.
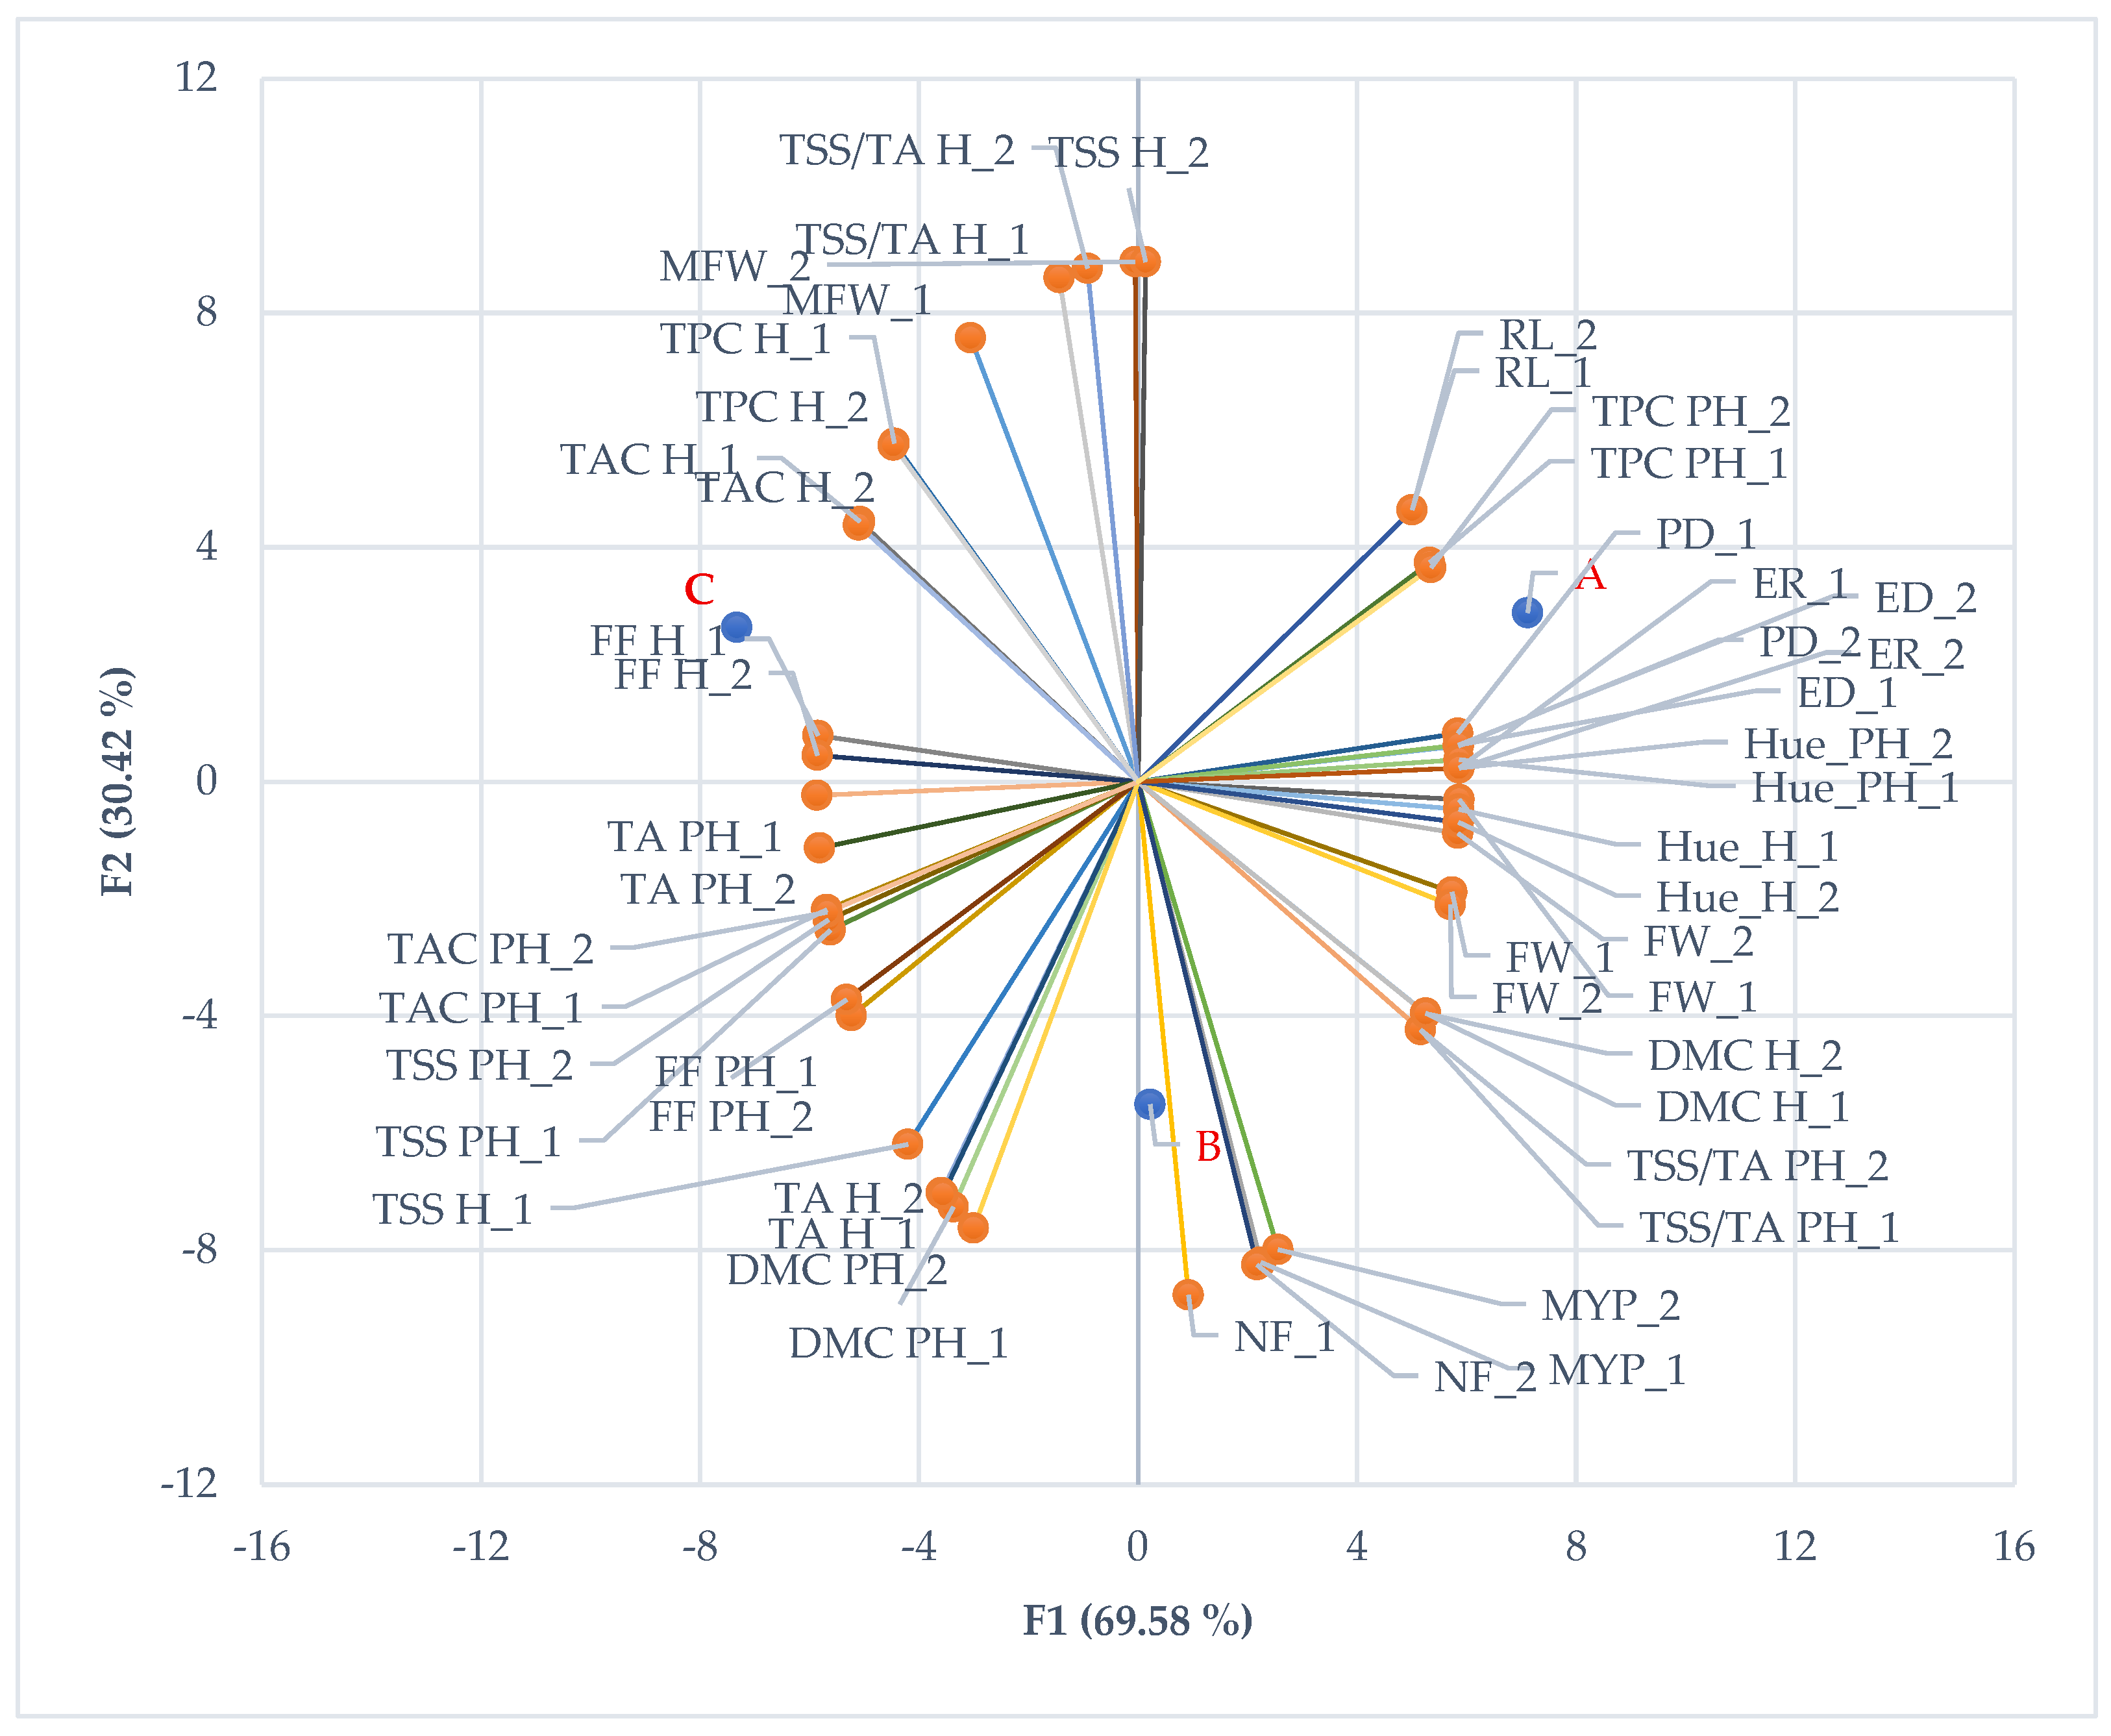
Principal component analysis (PCA) was performed to investigate the relationships among the analyzed variables and to identify the main factors contributing to sample discrimination (Figure 2). The PCA biplot revealed a clear separation of the samples according to their physicochemical, colorimetric, and biochemical characteristics. PC1 represented the main discriminating axis, separating physicochemical and colorimetric parameters (FW, PD, ED, ER, Hue, TAC PH, and TPC PH), located on the positive side of the axis, from biochemical and antioxidant-related variables (TAC H, TPC H, TSS/TA H, MFW, and TSS H), positioned on the negative side. PC2 further discriminated the samples according to variables such as NF, MYP, DMC PH, and TSS/TA H (Figure 2). The score plot highlighted three distinct sample profiles: sample A was associated with physicochemical and colorimetric traits, sample C with antioxidant-related variables, whereas sample B was mainly characterized by variables contributing to PC2 (Figure 2).

4. Discussion

The results of this study demonstrate that irrigation availability selectively influenced the postharvest quality traits of Actinidia chinensis ‘Gold3’, whereas fruit morphometric characteristics remained largely unaffected. No significant differences were observed in fresh weight, weight loss, or fruit dimensions across irrigation treatments, indicating that fruit growth was not impaired by reduced water supply. This stability likely reflects the timing of irrigation differentiation, which was applied when fruits had already reached approximately 80% of their final volume. Similar responses have been reported in kiwifruit and other fleshy fruits, where moderate late-season water deficits do not significantly alter fruit size [9]. In contrast, several qualitative attributes were strongly influenced by irrigation regime, particularly after cold storage. Fruits from deficit-irrigated treatments (B and C) exhibited higher flesh firmness than those from fully irrigated vines, suggesting slower softening and greater structural integrity during storage. These responses could reflect a reduced activity of cell wall–degrading enzymes and a delayed pectin solubilization, mechanisms that are well documented in the softening process of kiwifruit. Ripening in Actinidia spp. involves coordinated modifications of cell wall polysaccharides, including pectin and hemicellulose, and differential activities of polygalacturonase, pectin methylesterase, and β-galactosidase, all of which contribute to firmness loss [19,20,21,22]. Reduced irrigation may therefore attenuate these enzymatic processes, resulting in firmer fruit after storage. These structural changes were accompanied by higher total soluble solids and dry matter content under reduced irrigation, a pattern that is consistent with the hypothesis of a concentration effect driven by lower water availability, although the present data do not allow us to exclude contributions from increased solute biosynthesis. Such concentration effects are widely reported under moderate water deficits, where reduced water supply decreases dilution of soluble sugars and other metabolites in fruit tissues [23,24,25,26,27]. Titratable acidity was maintained or slightly increased under reduced irrigation, suggesting that organic acid metabolism was not negatively affected. This is consistent with previous findings showing that deficit irrigation applied during the maturation stage can lead to higher TA levels in kiwifruit without detrimental effects on fruit yield or size [12]. Colorimetric parameters also responded to irrigation level. Fruits from deficit treatments showed lower lightness (L*), chroma, and hue angle, together with higher (less negative) a values, indicating darker pulp with reduced green and yellow components and a slight shift toward warmer tones. These changes may reflect modulation of pigment metabolism, particularly carotenoids, which are sensitive to environmental conditions and developmental cues [28,29,30,31]. From a nutraceutical perspective, total antioxidant capacity (TAC) increased under a reduced water supply, whereas total phenolic content (TPC) remained largely unchanged. This divergence suggests that the TAC response is not phenolic-driven. In A. chinensis, ascorbic acid and carotenoids are known to contribute substantially to antioxidant capacity; although not quantified in the present study, their concentrations likely increased under a lower water supply in parallel with higher dry matter content, providing a parsimonious explanation for the observed rise in TAC. Moreover, it cannot be excluded that a moderate reduction in water availability may have partially stimulated enzymatic antioxidant defence pathways—such as the ascorbate–glutathione cycle—which are known to be activated in response to oxidative cues in several fruit crops. Although these mechanisms were not assessed in this study, acknowledging their potential involvement offers a complementary interpretation of the TAC increase observed under reduced water supply [3,32,33]. The PCA revealed clear relationships among biologically related variables and effectively discriminated the samples according to their physicochemical and biochemical characteristics. Variables associated with colorimetric and physical quality traits were positively correlated with each other and opposed to antioxidant-related parameters along PC1. PC2 appeared to describe additional compositional differences among the samples, possibly related to maturation or metabolic status. Furthermore, the close overlap between replicated variables demonstrated a high degree of consistency and reproducibility among measurements. Overall, the PCA confirmed the suitability of the multivariate approach for describing the complex interactions among the analyzed quality parameters.

5. Conclusions

Overall, this study demonstrates that moderate reductions in irrigation supply do not alter the morpho-metric traits of Actinidia chinensis ‘Gold3’, while significantly influencing several postharvest quality attributes. Across both seasons, fruit size, shape, and weight remained unaffected by irrigation level, whereas deficit irrigation consistently improved flesh firmness, soluble solids, titratable acidity, dry matter content, and total antioxidant capacity, without modifying total phenolic content. Colorimetric parameters were also responsive to irrigation regimes, indicating measurable effects on fruit appearance during storage. Among the tested treatments, 75 L plant−1 day−1 provided the most effective balance between water saving and fruit quality, suggesting that controlled irrigation reduction can enhance key postharvest traits while maintaining fruit morphometry. The lack of intermediate sampling points during storage represents a methodological limitation. While the study intentionally focused on assessing fruit quality at the end of the commercial storage period, this choice restricts the ability to track quality changes over time and to fully understand the physiological mechanisms involved during postharvest storage. The broader applicability of these findings should also be considered in light of the study’s specific context, including the use of a non-CA storage protocol, the absence of direct pigment quantification, the lack of absolute per-fruit solute measurements, and the evaluation of a single cultivar in one orchard. These factors do not compromise the internal validity of the results but highlight valuable directions for future research aimed at confirming and extending the present evidence.

Author Contributions

Conceptualization, G.G., F.G. and A.D.; experimental set up, G.G., A.D. and N.D.B.; data collection M.A.; data analysis, G.G., A.D. and V.B.; statistical analysis, G.G. and A.D.; writing—original draft preparation, G.G. and A.D.; writing—review and editing, G.G. and A.D.; supervision, G.G. and A.D. All authors have read and agreed to the published version of the manuscript.

Funding

Research within the scope of the OCM Operational Program of AOP ELLE ESSE 2023–2029 EU Reg. 2021/2115 art. 50 operational programs for the fruit and vegetable sector owner of the ELLESSE AOP research project. Project title: Research and development on the influence of water management on “Kiwifruit Vine Decline Syndrome.”

Data Availability Statement

The original contributions presented in this study are included in the article. Further inquiries can be directed to the corresponding author.

Conflicts of Interest

The authors declare no conflicts of interest.

References

  1. Rivista di Frutticoltura. Il Kiwi Giallo Continua a Crescere; Edagricole: Bologna, Italy, 2019. [Google Scholar]
  2. Allen, R.G.; Pereira, L.S.; Raes, D.; Smith, M. Crop Evapotranspiration—Guidelines for Computing Crop Water Requirements; FAO Irrigation and Drainage Paper No. 56; FAO: Rome, Italy, 1998. [Google Scholar]
  3. Calderón-Orellana, A.; Calderón-Orellana, M.; Atenas, C.; Contreras, C.; Aburto, F.; Alvear, T.; Antileo-Mellado, S. Late Water Deficits Improve Intrinsic Water Use Efficiency, Fruit Maturity, and Acceptability in Yellow-Fleshed Kiwifruit cv. Soreli. Plants 2025, 14, 2843. [Google Scholar] [CrossRef]
  4. Vicente-Serrano, S.M.; Peña-Angulo, D.; Beguería, S.; Domínguez-Castro, F.; Tomás-Burguera, M.; Noguera, I.; Gimeno-Sotelo, L.; El Kenawy, A. Global Drought Trends and Future Projections. Philos. Trans. R. Soc. A 2022, 380, 20210285. [Google Scholar] [CrossRef]
  5. Dietz, K.J.; Zörb, C.; Geilfus, C.M. Drought and Crop Yield. Plant Biol. 2021, 23, 881–893. [Google Scholar] [CrossRef]
  6. Liu, X.; Gao, T.; Liu, C.; Mao, K.; Gong, X.; Li, C.; Ma, F. Fruit Crops Combating Drought: Physiological Responses and Regulatory Pathways. Plant Physiol. 2023, 192, 1768–1784. [Google Scholar] [CrossRef] [PubMed]
  7. Burdon, J.; McLeod, D.; Lallu, N.; Gamble, J.; Petley, M.; Gunson, A. Consumer Evaluation of “Hayward” Kiwifruit of Different At-Harvest Dry Matter Contents. Postharvest Biol. Technol. 2004, 34, 245–255. [Google Scholar] [CrossRef]
  8. Mills, T.M.; Li, J.; Behboudian, M.H. Physiological Responses of Gold Kiwifruit to Water Deficit. J. Am. Soc. Hortic. Sci. 2009, 134, 677–683. [Google Scholar] [CrossRef]
  9. Fernandes, R.D.M.; Venturi, M.; Giovannini, A.; Morandi, B. Kiwifruit Ecophysiological Adaptations under Moderate and Severe Deficit Irrigation. Sci. Hortic. 2025, 347, 114193. [Google Scholar] [CrossRef]
  10. Miller, S.A.; Smith, G.S.; Boldingh, H.L.; Johansson, A. Effects of Water Stress on Fruit Quality Attributes of Kiwifruit. Ann. Bot. 1998, 81, 73–81. [Google Scholar] [CrossRef]
  11. Nora, L.; Dalmazo, G.O.; Nora, F.R.; Rombaldi, C.V. Controlled Water Stress to Improve Fruit and Vegetable Postharvest Quality. In Water Stress; InTech: Rijeka, Croatia, 2012; pp. 59–72. [Google Scholar]
  12. Zheng, S.; Jiang, S.; Cui, N.; Zhao, L.; Gong, D.; Wang, Y.; Wu, Z.; Liu, Q. Deficit Drip Irrigation Improves Kiwifruit Quality and Water Productivity under Rain-Shelter Cultivation. Agric. Water Manag. 2023, 289, 108530. [Google Scholar] [CrossRef]
  13. Baldi, E.; Pastore, C.; Chiarelli, G.; Quartieri, M.; Spinelli, F.; Toselli, M. Molecular Responses to Drought and Waterlogging Stresses of Kiwifruit Potted Vines. Horticulturae 2024, 10, 834. [Google Scholar] [CrossRef]
  14. Baldi, E.; Quartieri, M.; Larocca, G.N.; Golfarelli, M.; Francia, M.; Giovanelli, J.; Xylogiannis, E.; Toselli, M. Smart Irrigation System for Precision Water Management: Effect on Yield and Fruit Quality of Yellow-Fleshed Kiwifruit. In Precision Agriculture ’23; Wageningen Academic Publishers: Wageningen, The Netherlands, 2023; pp. 59–66. [Google Scholar] [CrossRef]
  15. Čereković, S.; Kajkut Zeljkovič, M.; Daničić, V. Understanding the Response of Fruit Crops to Drought Stress and Irrigation Needs under Climate Change Conditions. AgroReS 2025, 14, 55–66. [Google Scholar] [CrossRef]
  16. Pellegrini, N.; Re, R.; Yang, M.; Rice-Evans, C. Screening of Dietary Carotenoids and Carotenoid-Rich Fruit Extracts for Antioxidant Activities Applying the ABTS+ Radical Cation Decolorization Assay. Methods Enzymol. 1999, 299, 378–379. [Google Scholar]
  17. Re, R.; Pellegrini, N.; Proteggente, A.; Pannala, A.; Yang, M.; Rice-Evans, C. Antioxidant Activity Applying an Improved ABTS Radical Cation Decolorization Assay. Free Radic. Biol. Med. 1999, 26, 1231–1237. [Google Scholar] [CrossRef]
  18. Scalzo, J.; Politi, A.; Pellegrini, N.; Mezzetti, B.; Battino, M. Plant genotype affects total antioxidant capacity and phenolic contents in fruit. Nutrition 2005, 21, 207–213. [Google Scholar] [CrossRef]
  19. Redgwell, R.J.; Melton, L.D. Changes to Pectic and Hemicellulosic Polysaccharides during Ripening of Kiwifruit. Acta Hortic. 1992, 297, 627–634. [Google Scholar] [CrossRef]
  20. Gallego, P.P.; Zarra, I. Changes in Cell Wall Composition and Water-Soluble Polysaccharides during Kiwifruit Development. Ann. Bot. 1997, 79, 695–701. [Google Scholar] [CrossRef]
  21. Li, X.; Nakagawa, N.; Nevins, D.J.; Sakurai, N. Changes in the Cell Wall Polysaccharides of Outer Pericarp Tissues of Kiwifruit during Development. Plant Physiol. Biochem. 2006, 44, 115–124. [Google Scholar] [CrossRef]
  22. Fullerton, C.G.; Prakash, R.; Ninan, A.S.; Atkinson, R.G.; Schaffer, R.J.; Hallett, I.C.; Schröder, R. Fruit from Two Kiwifruit Genotypes with Contrasting Softening Rates Show Differences in the Xyloglucan and Pectin Domains of the Cell Wall. Front. Plant Sci. 2020, 11, 964. [Google Scholar] [CrossRef] [PubMed]
  23. Fereres, E.; Soriano, M.A. Deficit Irrigation for Reducing Agricultural Water Use. J. Exp. Bot. 2007, 58, 147–159. [Google Scholar] [CrossRef]
  24. Lagos, L.O.; Lama, W.; Hirzel, J.; Souto, C.; Lillo, M. Regulated Deficit Irrigation Evaluation on Kiwi Production. Agrociencia 2017, 51, 359–372. [Google Scholar]
  25. Gullo, G.; Dattola, A.; Vonella, V.; Zappia, R. Effects of Photoselective Colour Nets on the Vegetative, Productive, and Qualitative Behaviour of Kiwifruit, jintao cultivar. J. Berry Res. 2021, 11, 1–19. [Google Scholar] [CrossRef]
  26. Dattola, A.; Accardo, A.; Zappia, R.; Gullo, G.A.M. Fruit Variation in Yellow-Fleshed Actinidia chinensis Plants Grown in Southern Italy as a Function of Shoot Type. Agriculture 2024, 14, 1335. [Google Scholar] [CrossRef]
  27. Gullo, G.; Barbera, S.; Cannizzaro, A.; Scarano, M.; Larocca, F.; Branca, V.; Dattola, A. Differences in Vegetative, Productive, and Physiological Behaviors in Actinidia chinensis cv. Gold3 as a Function of Cane Type. Plants 2025, 14, 2199. [Google Scholar] [CrossRef]
  28. Montefiori, M.; McGhie, T.K.; Hallett, I.C.; Costa, G. Changes in Pigments and Plastid Ultrastructure during Ripening of Green- and Yellow-Fleshed Kiwifruit. Sci. Hortic. 2009, 119, 377–387. [Google Scholar] [CrossRef]
  29. Ampomah-Dwamena, C.; McGhie, T.; Wibisono, R.; Montefiori, M.; Hellens, R.P.; Allan, A.C. The Kiwifruit Lycopene Beta-Cyclase Plays a Significant Role in Carotenoid Accumulation. J. Exp. Bot. 2009, 60, 3765–3779. [Google Scholar] [CrossRef]
  30. Ampomah-Dwamena, C.; Tomes, S.; Thrimawithana, A.H.; Elborough, C.; Bhargava, N.; Rebstock, R.; Sutherland, P.; Ireland, H.; Allan, A.; Espley, R.V. Overexpression of PSY1 Increases Fruit Skin and Flesh Carotenoid Content. Front. Plant Sci. 2022, 13, 967143. [Google Scholar] [CrossRef] [PubMed]
  31. Bhargava, A.; Ampomah-Dwamena, C. Comparative Transcriptomic and Plastid Development Analysis Sheds Light on Differential Carotenoid Accumulation in Kiwifruit Flesh. Front. Plant Sci. 2023, 14, 1213086. [Google Scholar] [CrossRef] [PubMed]
  32. Lembo, M.; Ferrara, E.; Cice, D.; Forniti, R.; Eramo, V.; Petriccione, M.; Botondi, R. Effect of Plant Water Deficit Irrigation on the Postharvest Nutritional Quality Parameters and Antioxidant Pathway of ‘Soreli’ Kiwifruits. Foods 2026, 15, 520. [Google Scholar] [CrossRef]
  33. Yang, B.; Fu, P.; Lu, J.; Ma, F.; Sun, X.; Fang, Y. Regulated Deficit Irrigation: An Effective Way to Solve the Shortage of Agricultural Water for Horticulture. Stress Biol. 2022, 2, 28. [Google Scholar] [CrossRef]
Figure 1. Monthly thermopluviometric regime recorded in the study area during the 2024–2025 biennium. The figure shows the temporal variation in mean air temperature (°C) and total monthly precipitation (mm) observed throughout the two-year monitoring period in the area where the research activity was conducted.
Horticulturae 12 00638 g001
Figure 2. Principal component analysis (PCA) biplot showing the distribution of samples and the relationships among the analyzed physicochemical, colorimetric, and biochemical variables. Variables followed by the suffix “_1” refer to data collected during the 2024 experimental year, whereas variables followed by the suffix “_2” refer to data collected during the 2025 experimental year. PC1 and PC2 represent the first and second principal components, respectively.
Horticulturae 12 00638 g002
Table 1. Productive responses of Actinidia chinensis ‘Gold3’ vines grown under three differentiated irrigation regimes—Treatment A (120 L plant−1 day−1), Treatment B (90 L plant−1 day−1) and Treatment C (75 L plant−1 day−1)—during the 2024 and 2025 growing seasons. The table reports the main yield-related parameters, including Mean Yield per Plant (MYP, kg plant−1), Number of Fruits (NF, N.), and Mean Fruit Weight (MFW, g), allowing a comparative evaluation of how varying water availability influenced plant productivity across the two years.
Treatment20242025
MYP
kg plant−1
NF
N.
MFW
g
MYP
kg plant−1
NF
N.
MFW
g
A37.557 ± 3.60 a238.4 ± 24.5 a158.869 ± 3.99 a39.842 ± 3.42 a249.6 ± 21.8 a159.214 ± 4.11 a
B44.929 ± 3.54 a290.8 ± 25.8 a155.998 ± 4.72 a46.315 ± 3.77 a301.4 ± 27.2 a153.684 ± 4.56 a
C33.831 ± 3.75 a229.8 ± 22.9 a161.725 ± 2.30 a35.274 ± 3.58 a221.7 ± 24.1 a159.104 ± 3.08 a
Different lowercase letters within a column indicate significant differences among treatments (Tukey’s test, p ≤ 0.05).
Table 2. Physical fruit traits of Actinidia chinensis ‘Gold3’ under irrigation treatments A (120 L plant−1 day−1), B (90 L plant−1 day−1), and C (75 L plant−1 day−1) during the 2024 growing season. The table reports fresh weight (FW), fresh weight after storage (FW after storage), polar diameter (PD), equatorial diameter (ED), the PD/ED ratio (RL), and the elongation ratio (ER).
Irrigation TreatmentFW
g
FW
After Storage
g
PD
mm
ED
mm
RLER
A103.2 ± 3.4 a99.4 ± 1.5 a62.8 ± 1.3 a58.4 ± 1.2 a1.06 ± 0.02 a0.96 ± 0.01 a
B99.8 ± 2.9 a97.5 ± 2.4 a60.4 ± 1.2 a56.3 ± 1.1 a1.05 ± 0.04 a0.95 ± 0.02 a
C95.6 ± 3.6 a92.8 ± 1.8 a58.5 ± 1.3 a54.5 ± 1.2 a1.05 ± 0.03 a0.94 ± 0.04 a
Different lowercase letters within a column indicate significant differences among treatments (Tukey’s test, p ≤ 0.05).
Table 3. Physical fruit traits of Actinidia chinensis ‘Gold3’ under irrigation treatments A (120 L plant−1 day−1), B (90 L plant−1 day−1), and C (75 L plant−1 day−1) during the 2025 growing season. The table reports fresh weight (FW), fresh weight after storage (FW after storage), polar diameter (PD), equatorial diameter (ED), the PD/ED ratio (RL), and the elongation ratio (ER).
Irrigation TreatmentFW
g
FW
After Storage
g
PD
mm
ED
mm
RLER
A100.8 ± 2.9 a98.4 ± 1.2 a62.0 ± 1.2 a57.8 ± 1.1 a1.06 ± 0.02 a0.96 ± 0.01 a
B98.3 ± 2.7 a96.6 ± 2.2 a59.8 ± 1.1 a55.7 ± 1.0 a1.05 ± 0.04 a0.95 ± 0.02 a
C94.4 ± 3.2 a91.6 ± 1.7 a57.9 ± 1.2 a53.9 ± 1.1 a1.05 ± 0.03 a0.94 ± 0.04 a
Different lowercase letters within a column indicate significant differences among treatments (Tukey’s test, p ≤ 0.05).
Table 4. Flesh firmness (FF), total soluble solids (TSS), titratable acidity (TA), TSS/TA ratio, and dry matter content (DMC) of Actinidia chinensis (Planch.) ‘Gold3’ fruits obtained from irrigation treatments A (120 L plant−1 day−1), B (90 L plant−1 day−1), and C (75 L plant−1 day−1) during the 2024 season. Parameters were measured at harvest (H) and after cold storage (PH).
Irrigation TreatmentFF H
Kg cm−2
FF PH
Kg cm−2
TSS H
°Brix
TSS PH
°Brix
TA H
% Citric Acid
TA PH
% Citric Acid
TSS/TA HTSS/TA PHDMC H
(g.)
DMC PH
(g)
A6.10 ± 1.10 b1.48 ± 0.12 b4.70 ± 0.25 b12.40 ± 0.25 b12.30 ± 0.04 b13.40 ± 0.30 b3.85 ± 0.28 ns0.93 ± 0.04 a17.55 ± 0.45 ns18.00± 0.08 b
B6.20 ± 1.00 a1.98 ± 0.10 a6.00 ± 0.80 a12.95 ± 0.20 a16.20 ± 0.04 a13.90 ± 0.25 a3.75 ± 0.550.93 ± 0.03 a17.50 ± 0.3018.50 ± 0.05 a
C6.35 ± 0.90 a2.03 ± 0.11 a5.70 ± 0.30 a13.15 ± 0.22 a14.80 ± 0.04 a14.40 ± 0.20 a3.88 ± 0.250.91 ± 0.03 b16.30 ± 0.4518.30 ± 0.07 ab
Different lowercase letters within a column indicate significant differences among treatments (Tukey’s test, p ≤ 0.05). “ns” = Non-significant.
Table 5. Flesh firmness (FF), total soluble solids (TSS), titratable acidity (TA), TSS/TA ratio, and dry matter content (DMC) of Actinidia chinensis (Planch.) ‘Gold3’ fruits obtained from irrigation treatments A (120 L plant−1 day−1), B (90 L plant−1 day−1), and C (75 L plant−1 day−1) during the 2025 season. Parameters were measured at harvest (H) and after cold storage (PH).
Irrigation TreatmentFF H
Kg cm−2
FF PH
Kg cm−2
TSS H
°Brix
TSS PH
°Brix
TA H
% Citric Acid
TA PH
% Citric Acid
TSS/TA HTSS/TA PHDMC H
(g.)
DMC PH
(g)
A6.15 ± 1.05 b1.52 ± 0.12 b6.82 ± 0.24 ns12.55 ± 0.25 b12.35 ± 0.04 b13.55 ± 0.30 b3.90 ± 0.27 ns0.93 ± 0.04 a17.65 ± 0.40 ns18.15 ± 0.08 b
B6.28 ± 0.95 a2.0± 0.10 a6.10 ± 0.8213.05 ± 0.20 a16.28 ± 0.04 a14.05 ± 0.25 a3.78 ± 0.540.93 ± 0.03 a17.60 ± 0.3218.58 ± 0.05 a
C6.45 ± 0.88 a2.07 ± 0.11 a6.78 ± 0.2913.25 ± 0.22 a14.85 ± 0.04 a14.4 ± 0.20 a3.92 ± 0.230.91 ± 0.03 b16.38 ± 0.4618.38 ± 0.07 ab
Different lowercase letters within a column indicate significant differences among treatments (Tukey’s test, p ≤ 0.05). “ns” = Non-significant.
Table 6. Color parameters of Actinidia chinensis (Planch.) ‘Gold3’ fruits obtained from irrigation treatments A (120 L plant−1 day−1), B (90 L plant−1 day−1), and C (75 L plant−1 day−1) during the 2024 season. The table presents L, a, and b* values at harvest (H) and after cold storage (PH), together with Chroma and Hue angle, providing a comprehensive description of fruit brightness, saturation, and color tone.
Irrigation TreatmentL*HL*PHa*Ha*PHb*Hb*PHHue (°)_HHue (°)_PH
A72.21 ± 1.24ns73.5 ± 1.0 a−0.01 ± 0.21 ns−5.94 ± 0.3 b14.62 ± 0.84 ns33.69 ± 0.9 a104.52 ± 0.56 ns100.11 ± 0.2 a
B69.69 ± 1.2272.5 ± 1.1 ab−0.12 ± 0.19−4.82 ± 0.3 ab13.78 ± 0.6832.44 ± 1.0 ab104.05 ± 0.4898.45 ± 0.3 ab
C72.84 ± 0.9271.8 ± 1.2 b−0.13 ± 0.24−3.74 ± 0.4 a14.69 ± 0.6331.08 ± 1.1 b103.43 ± 0.4796.88 ± 1.4 b
Different lowercase letters within a column indicate significant differences among treatments (Tukey’s test, p ≤ 0.05). “ns” = Non-significant. * denote the standard CIELAB color coordinates.
Table 7. Color parameters of Actinidia chinensis (Planch.) ‘Gold3’ fruits obtained from irrigation treatments A (120 L plant−1 day−1), B (90 L plant−1 day−1), and C (75 L plant−1 day−1) during the 2025 season. The table presents L, a, and b* values at harvest (H) and after cold storage (PH), together with Chroma and Hue angle, providing a comprehensive description of fruit brightness, saturation, and color tone.
Irrigation TreatmentL*HL*PHa*Ha*PHb*Hb*PHHue (°)_HHue (°)_PH
A72.30 ± 1.25 ns73.6 ± 1.0 a–0.01 ± 0.21 ns–5.92 ± 0.3 b14.70 ± 0.85 ns33.75 ± 0.90 a104.55 ± 0.56 ns100.10 ± 0.20 a
B69.80 ± 1.2272.6 ± 1.1 ab–0.11 ± 0.19–4.85 ± 0.3 ab13.85 ± 0.7032.50 ± 1.00 ab104.10 ± 0.4898.50 ± 0.30 ab
C72.90 ± 0.9271.9 ± 1.2 b–0.13 ± 0.24–3.78 ± 0.4 a14.75 ± 0.6331.15 ± 1.10 b103.45 ± 0.4796.90 ± 1.40 b
Different lowercase letters within a column indicate significant differences among treatments (Tukey’s test, p ≤ 0.05). “ns” = Non-significant. * denote the standard CIELAB color coordinates.
Table 8. Total antioxidant capacity (TAC) and total phenolic content (TPC) of Actinidia chinensis (Planch.) ‘Gold3’ fruits for the year 2024, subjected to three irrigation treatments (A = 120 L plant−1 day−1; B = 90 L plant−1 day−1; C = 75 L plant−1 day−1). Measurements were performed at harvest (H) and after cold storage in the postharvest period (PH).
Irrigation TreatmentTAC H
(μmol Trolox g DW−1)
TAC PH
(μmol Trolox g DW−1)
TPC H
(mg GAE g DW−1)
TPC PH
(mg GAE g DW−1)
A22.30 ± 0.17 b25.72 ± 0.20 b5.97 ± 2.33 ns5.46 ± 2.55 ns
B22.23 ± 0.01 b28.49 ± 1.25 ab5.86 ± 1.585.25 ± 1.79
C24.54 ± 0.03 a29.70 ± 1.33 a6.36 ± 1.745.22 ± 1.55
Different lowercase letters within a column indicate significant differences among treatments (Tukey’s test, p ≤ 0.05). “ns” = Non-significant.
Table 9. Total antioxidant capacity (TAC) and total phenolic content (TPC) of Actinidia chinensis (Planch.) ‘Gold3’ fruits for the year 2025, subjected to three irrigation treatments (A = 120 L plant−1 day−1; B = 90 L plant−1 day−1; C = 75 L plant−1 day−1). Measurements were performed at harvest (H) and after cold storage in the postharvest period (PH).
Irrigation TreatmentTAC H
(μmol Trolox g DW−1)
TAC PH
(μmol Trolox g DW−1)
TPC H
(mg GAE g DW−1)
TPC PH
(mg GAE g DW−1)
A23.29 ± 0.12 b26.62 ± 0.18 b6.05 ± 1.56 ns5.53 ± 2.31 ns
B23.24 ± 0.02 b29.43 ± 1.00 ab5.94 ± 2.785.34 ± 1.80
C25.64 ± 0.01 a30.63 ± 1.01 a6.45 ± 2.115.31 ± 1.33
Different lowercase letters within a column indicate significant differences among treatments (Tukey’s test, p ≤ 0.05). “ns” = Non-significant.
Disclaimer/Publisher’s Note: The statements, opinions and data contained in all publications are solely those of the individual author(s) and contributor(s) and not of MDPI and/or the editor(s). MDPI and/or the editor(s) disclaim responsibility for any injury to people or property resulting from any ideas, methods, instructions or products referred to in the content.