Article

Synergistic and Antagonistic Effects of Combined Dietary Iron and Potassium on Lettuce Growth Quality and Fish Physiological Responses in Aquaponics

1
School of Enology and Horticulture, Ningxia University, Yinchuan 750021, China
2
Jiangsu Academy of Agricultural Sciences, Nanjing 210000, China
*
Author to whom correspondence should be addressed.
Horticulturae 2026, 12(5), 574; https://doi.org/10.3390/horticulturae12050574
Submission received: 8 April 2026 / Revised: 3 May 2026 / Accepted: 7 May 2026 / Published: 8 May 2026
(This article belongs to the Section Vegetable Production Systems)

Abstract

Aquaponics is a resource-efficient agricultural system, yet its overall productivity is frequently constrained by micro- and macronutrient deficiencies, particularly iron (Fe) and potassium (K). Currently, the efficacy of combined dietary Fe and K supplementation in optimizing nutrient management in these systems remains unclear. Therefore, a 60-day feeding trial was conducted to evaluate the effects of four dietary Fe and K levels—CK (basal diet without added Fe or K), T1 (Fe 0.1 g/kg + K 2.5 g/kg), T2 (Fe 0.2 g/kg + K 5.0 g/kg), and T3 (Fe 0.3 g/kg + K 7.5 g/kg)—on the growth and quality of lettuce (Lactuca sativa) and the physiological responses of crucian carp (Carassius auratus). The results demonstrated that the T2 treatment was suitable for enhancing system productivity. Compared with the CK group, the lettuce plant height, biomass, and net photosynthetic rate in the T2 group exhibited marked increases of 25.3%, 16.0%, and 26.4%, respectively. Furthermore, the vitamin C content increased by 52.2%, while the nitrate content notably declined by 32.2%. Plant nutrient analysis revealed that the combined Fe and K supplementation markedly promoted the foliar uptake of P, Mn, and Zn (peaking in the T2 group), whereas Cu and S contents increased linearly with the supplementation dose, reaching its maximum in the T3 group. Regarding fish health, the weight gain rate (WGR) of crucian carp in the T2 group peaked at 41.0%, and the feed conversion ratio (FCR) improved to 1.76. Additionally, the dietary supplementation maintained the stability of water quality parameters of the recirculating system. These findings indicate that a combined dietary inclusion of 0.2 g/kg Fe and 5.0 g/kg K can simultaneously enhance the yield and quality of both plants and fish. This approach provides a novel optimization strategy for mitigating acute water quality shocks, while also highlighting the inherent boundaries of competitive ion antagonism in aquaponic nutrient management.

1. Introduction

The continuous growth of the global population and the intensification of climate change have exacerbated challenges related to food security and water scarcity. By 2050, the global population is projected to exceed 9 billion, driving a 70% increase in food demand, particularly in regions with limited freshwater resources [1]. The high water consumption and intensive fertilizer input associated with traditional agricultural systems often lead to environmental pollution, and their application in arid and semi-arid regions is severely restricted. Consequently, the development of sustainable agricultural paradigms has become an urgent necessity [2]. Aquaponics, a closed-loop system integrating aquaculture and hydroponics, achieves the ecological goal of zero-water-exchange aquaculture combined with fertilizer-free vegetable production. Through microbe-mediated nutrient cycling, it significantly reduces water consumption and waste discharge [3,4]. This highly resource-efficient system not only improves nutrient utilization but also provides self-sufficient agricultural products in arid and semi-arid regions, enhancing agricultural resilience to natural disasters [5].
Despite these significant advantages, the practical promotion of aquaponics still faces severe challenges regarding internal nutrient balance. Specifically, the insufficient supply of various essential macro- and micronutrients has emerged as a critical bottleneck restricting overall system productivity [6,7]. In aquaponic systems, plant nutrients are almost entirely derived from the mineralization of fish excreta and uneaten feed. However, commercial fish feeds are formulated primarily to meet the nutritional requirements of fish rather than plants. This discrepancy results in a relative abundance of macronutrients like nitrogen and phosphorus in the water, but typically leads to severe deficiencies in several essential elements, most notably potassium (K), calcium (Ca), magnesium (Mg), iron (Fe), and manganese (Mn) [8,9]. Among these, Fe and K are particularly critical yet often severely deficient. Fe is an essential element for chlorophyll synthesis, photosynthetic electron transport, and enzymatic reactions in plants; its deficiency leads to leaf chlorosis and drastically reduces photosynthetic efficiency. K, the most abundant cation in plants, plays an irreplaceable role in regulating stomatal movement, maintaining cell turgor, and promoting carbohydrate metabolism, all of which are crucial for the final yield and nutritional quality of crops [10,11]. In the closed-loop aquaponic system, the natural scarcity of these key mineral nutrients not only limits plant growth but can also trigger water quality fluctuations, indirectly exerting negative impacts on fish health and stress resistance [12].
Currently, mitigation strategies for nutrient deficiencies in aquaponic systems predominantly focus on the direct addition of single elements into the water. For instance, previous studies have demonstrated that directly adding potassium sulfate to the water (maintaining K concentrations at 50–100 mg/L) significantly improves nutrient utilization efficiency and promotes fish growth [13]. However, traditional methods such as direct water supplementation or foliar spraying present distinct limitations [14,15,16,17]. First, adding large doses of inorganic salts directly into the water can trigger drastic local water quality fluctuations (e.g., electrical conductivity [EC] and osmotic pressure), which may not only induce acute stress in fish but also easily provoke ion antagonism (e.g., high K levels inhibiting calcium and magnesium uptake) [18,19]. Second, multiple nutrient elements are often simultaneously deficient in practical production, making fragmented, single-element management inadequate for system optimization [20]. In contrast, dietary supplementation demonstrates immense potential. Studies by Luo et al. [21] and Liu et al. [22] have indicated that dietary Fe supplementation is a safe and effective approach, provided the dosage is strictly controlled (e.g., an ideal range of 118–120 mg/kg); excessive supplementation (e.g., up to 800 mg/kg) can trigger Fenton reactions in the fish liver, leading to severe oxidative damage [23]. Intriguingly, fish have extremely low physiological requirements for K, and the excess ingested K ions are continuously released into the water via the gills and excretory system [24]. Therefore, premixing Fe and K into fish feed in specific proportions essentially utilizes the fish as a natural “biological slow-release reactor”. This not only avoids the water quality shock associated with direct salt addition but also greatly simplifies system operation, achieving the nutrient management goal of a dual-benefit single-input strategy. Nevertheless, high-dose mineral supplementation may induce competitive ion antagonism (e.g., high K inhibiting Ca and Mg uptake) [25], thereby disrupting system nutrient balance. The safety thresholds and regulatory mechanisms of this approach require further exploration. To date, systematic studies investigating the dose–response relationship, the physiological synergistic and antagonistic mechanisms between plants and fish, and the safety thresholds of combined dietary Fe and K supplementation in aquaponic systems are still lacking.
To address these research gaps, this study investigated the intervention effects of combined dietary Fe and K supplementation at various proportions in a recirculating aquaponic system using lettuce (Lactuca sativa) and crucian carp (Carassius auratus) as model organisms. By establishing a dose–response model, the effects of dietary Fe and K levels on the growth phenotypes, photosynthetic characteristics, and nutritional quality of lettuce, as well as the growth performance, antioxidant status, and physiological stress of crucian carp, were systematically analyzed. This study aimed to screen for the ideal dietary Fe and K ratio capable of balancing high crop productivity with fish health and welfare. Furthermore, we sought to reveal the internal physiological regulatory mechanisms governing these effects, thereby providing a scientific basis and novel strategies for precise mineral nutrient management and productivity enhancement in aquaponic systems.

2. Materials and Methods

2.1. Experimental Materials and Site

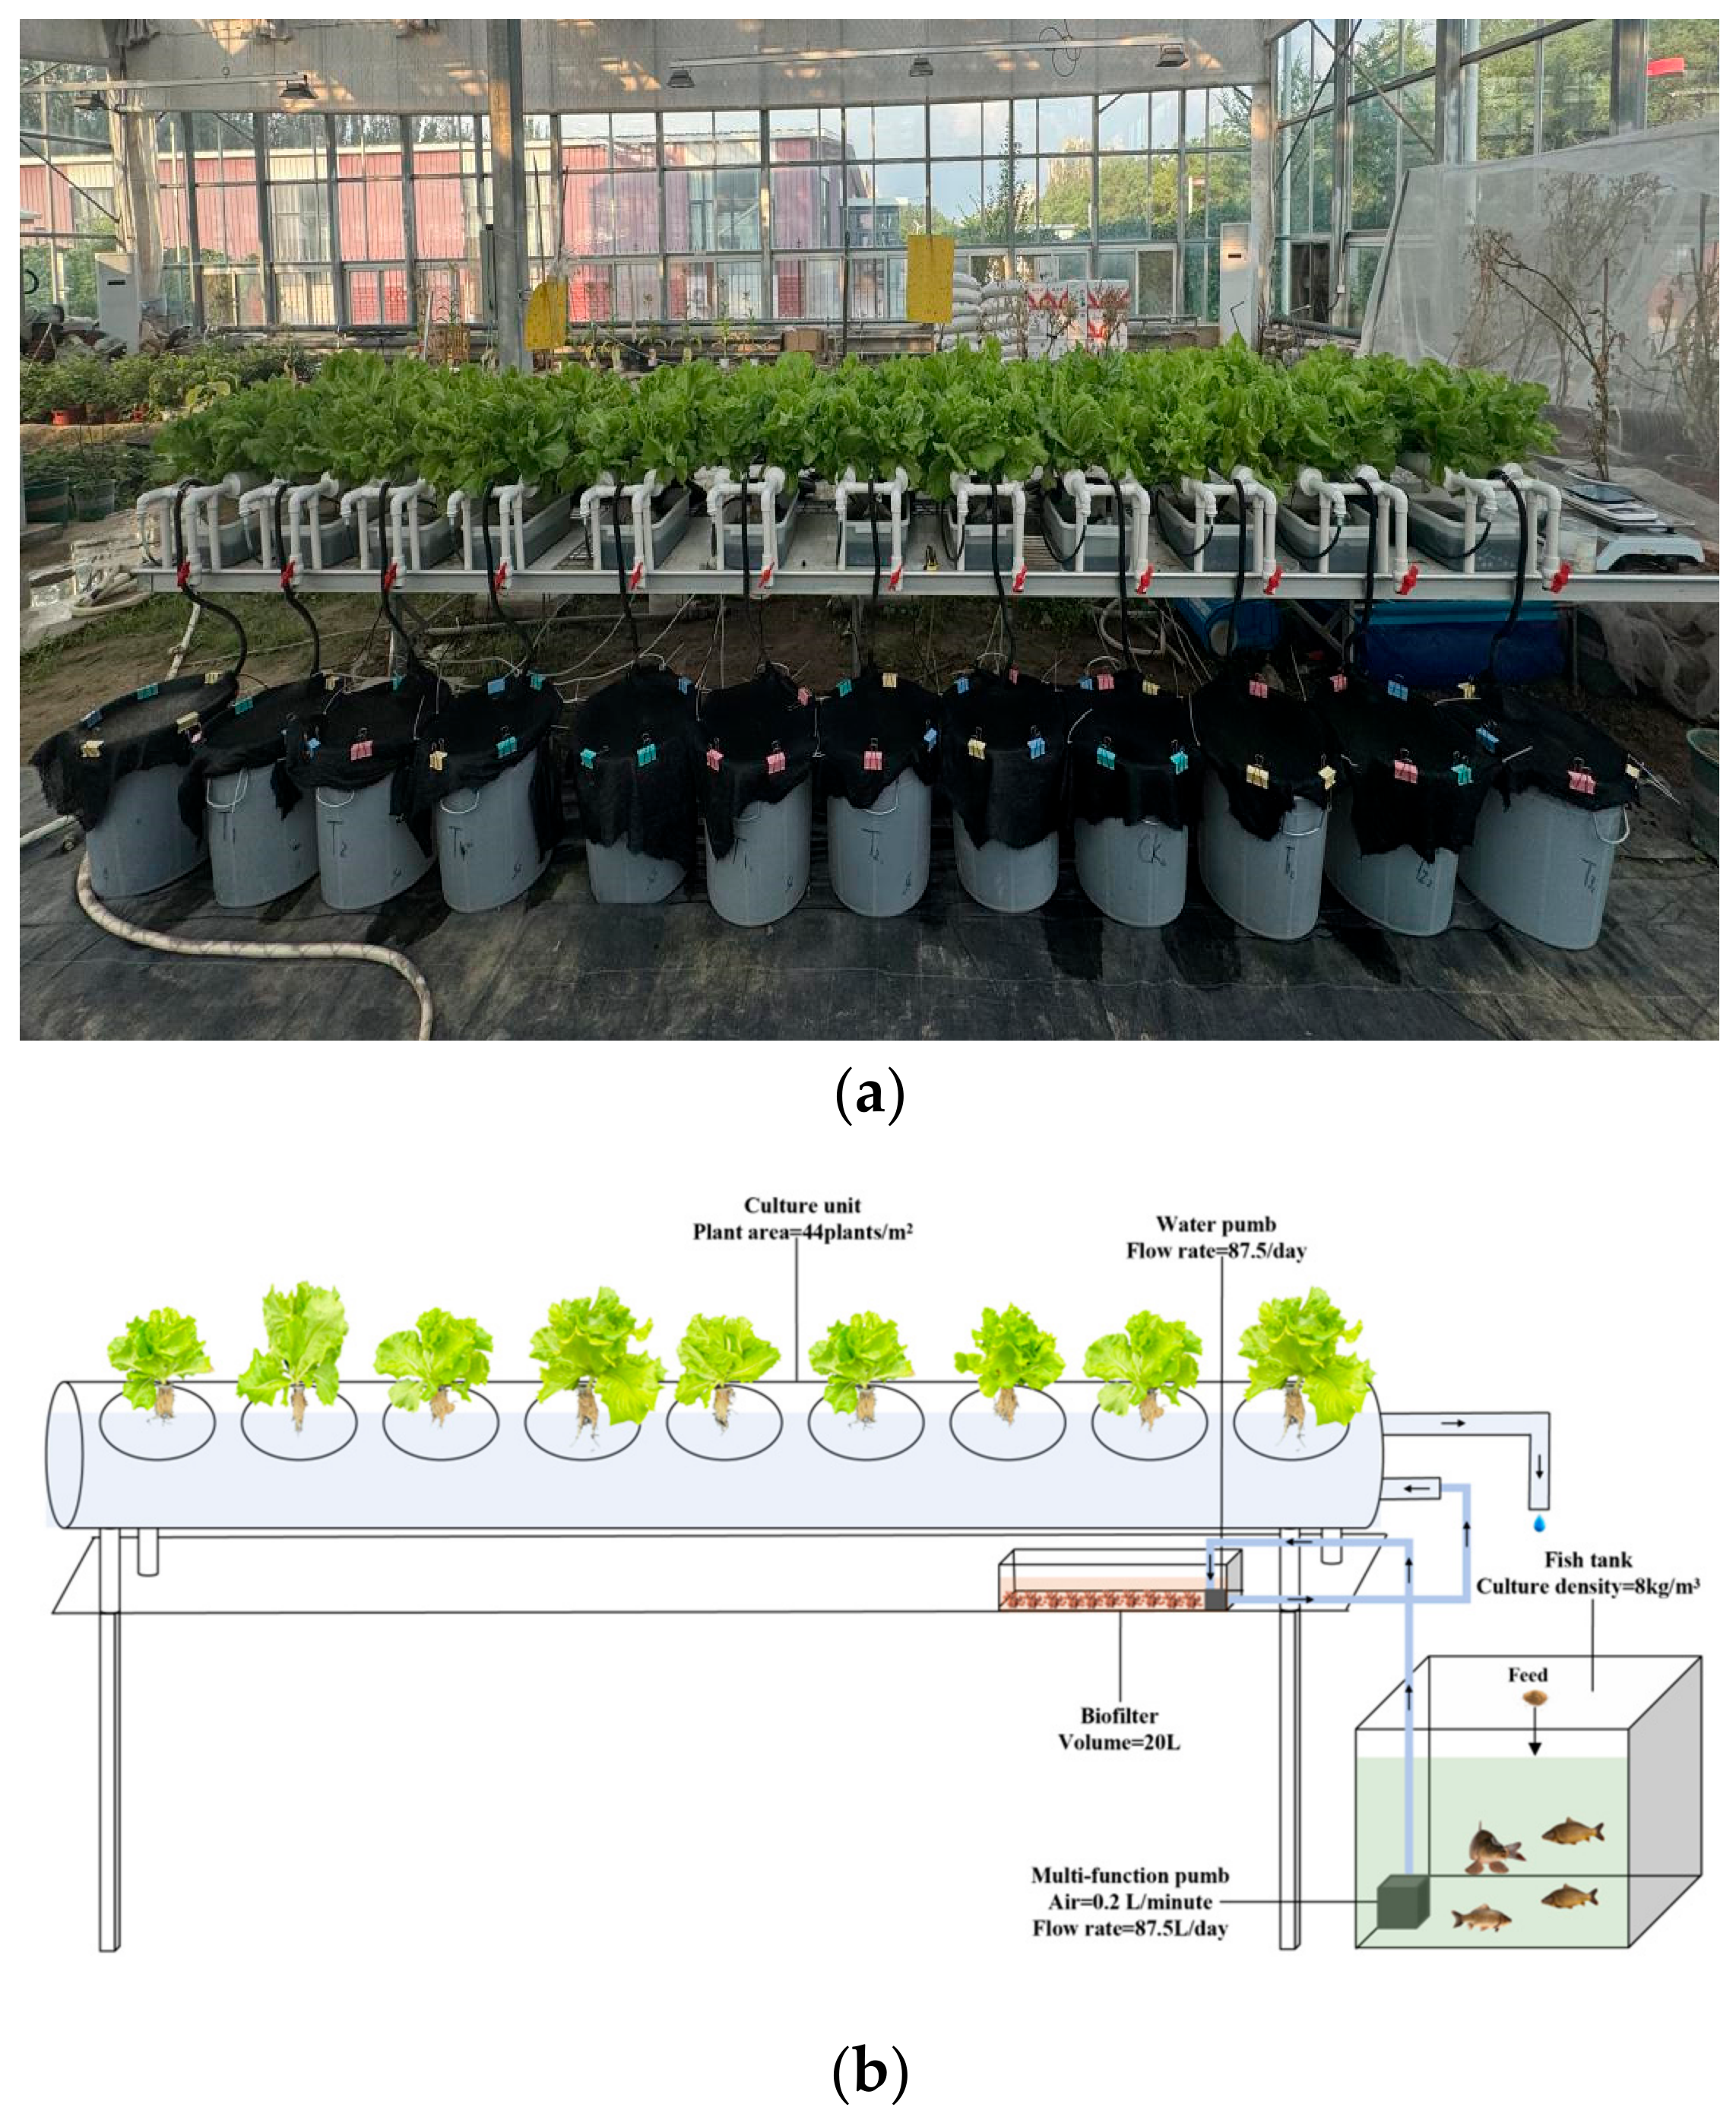
The experiment was conducted in a modern glass greenhouse at the National University Science Park of Ningxia University (Yinchuan, China). A completely randomized design (CRD) was employed to construct 12 independent and structurally identical recirculating aquaponic system units, comprising one control group and three treatment groups, with three replicates per group (Figure 1). The core components of each independent unit included: a fish rearing tank (60 L circular PE tank, 0.40 m × 0.33 m × 0.44 m), a biological filter unit (12.3 L rectangular turnover box filled with 0.5–1.0 cm volcanic rocks as biological media), and a nutrient film technique (NFT) hydroponic pipe system (0.06 m × 1.05 m × 0.25 m).
The water circulation was configured as follows: a 15 W submersible pump (model JP-700GS; Sensen, Shanghai, China. maximum head of 1.2 m, equipped with a jet device for continuous aeration) pumped the aquaculture water from the fish tank into the biological filter. After processing by nitrifying bacteria, the water was delivered to the NFT pipes by a 3 W miniature submersible pump (model JP-140GS; Sensen, Shanghai, China. maximum head of 0.7 m). The nutrient solution flowed through the plant root systems and returned to the fish tank via gravity, completing the closed-loop circulation. The system pumps were controlled by an automatic timer (model OMRON H3CR; Omron, Shanghai, China) set to an intermittent circulation mode of “10 min on, 20 min off”. The total water flow rate of the system was maintained at 87.5 L·h−1 to ensure sufficient dissolved oxygen (DO) and a highly effective hydraulic retention time (HRT). During the trial, equal volumes of aerated tap water were manually replenished daily to compensate for water losses. No chemical buffers (such as acids or bases) were added to artificially adjust the pH; instead, the pH was allowed to fluctuate naturally within the buffering capacity of the system’s nitrogen cycle.

2.2. Experimental Design

The 60-day feeding trial was conducted from 10 June to 10 August 2025. Four dietary treatments were established with varying levels of combined iron (Fe) and potassium (K) supplementation. Isonitrogenous (crude protein ~300 g/kg) and iso-lipidic (crude lipid ~50 g/kg) semi-purified experimental diets were formulated using sodium iron edetate (EDTA-Fe) and potassium sulfate (K2SO4) as the effective supplement sources. The four groups were as follows: the control group (CK, basal diet), the T1 group (Fe 0.1 g/kg + K 2.5 g/kg), the T2 group (Fe 0.2 g/kg + K 5.0 g/kg), and the T3 group (Fe 0.3 g/kg + K 7.5 g/kg). The experiment utilized a commercial extruded feed (manufactured by Huai’an Tong Wei Feed Co., Ltd., Nanjing, China, and purchased from a local supplier in Yinchuan) as the basal raw material. The primary ingredients of this commercial diet included fish meal, soybean meal, rapeseed meal, and wheat. This feed was pulverized and reformulated to serve as the practical basal diet. Because the basal ingredients naturally contained a certain amount of micro- and macronutrients, the CK group received no additional artificial Fe or K, serving as the baseline for endogenous content. The T1–T3 groups received a gradient of additional Fe and K based on this baseline. The specific supplemental doses were determined based on previous studies [26,27].
The diet preparation process was as follows: the basal diet ingredients were crushed and sieved. According to the formulation (Table 1), ingredients were progressively mixed following the principle of micro-to-macro quantities. An appropriate amount of purified water was added to knead the mixture into a dough. Sinking pellets with a diameter of 2.0 mm were then produced using a twin-screw extruder. Extruded diets possess high water stability, minimizing the direct leaching of soluble nutrients into the water before ingestion. The pellets were dried in a forced-air thermostatic oven at 60 °C for 24 h. This specific temperature and duration were selected to ensure adequate moisture removal for long-term storage stability, while avoiding higher temperatures that could cause thermal degradation of heat-sensitive nutrients (e.g., vitamins and proteins) and compromise pellet integrity. After drying, the pellets were cooled, sealed, and stored in a −20 °C refrigerator until use.
Prior to the formal experiment, all recirculating systems underwent a nitrifying bacteria cultivation phase to ensure the full establishment of the nitrogen cycle. The test plant, Romaine lettuce (Lactuca sativa L., var. longifolia), was germinated in sponge blocks and grown for 15 days until the 3–4 true-leaf stage before being transplanted into the NFT hydroponic pipes. The planting density was 44 plants/m2. Healthy juvenile crucian carp (Carassius auratus) were obtained from a local commercial aquatic market (Yinchuan, China). Prior to the formal 60-day feeding trial, all fish were acclimated in the aquaponic system for 14 days and fed the basal diet to adapt to the experimental conditions. After the acclimation period, fish of similar sizes (initial body weight: 124.5 ± 2.0 g) were randomly distributed into the 12 tanks at a stocking density of 8 kg/m3. For the first 15 days, the fish were fed to apparent satiation twice daily (at 10:00 and 18:00) at a feeding rate of 2% of their total body weight. After 15 days, the feeding rate was adjusted to 1% based on the fish’s feed intake and growth conditions, continuing until the end of the trial. This strict feeding regime ensured that almost all feed pellets were consumed by the fish within minutes, thereby confirming that the primary route of Fe and K entry into the water was via fish excretion rather than feed leaching. During the trial, water temperature and pH were naturally buffered by the ambient greenhouse conditions and the system’s internal nutrient cycling, without the use of active heating/cooling devices or chemical pH adjusters. Dissolved oxygen (DO) was adequately supplied via the jet device on the submersible pump.

2.3. Water Quality Parameters

During the trial, water temperature (T), pH, DO, electrical conductivity (EC), and total dissolved solids (TDS) were recorded daily using a mercury thermometer, a portable pH meter (model DLX-PH-05-2; Dexlxi, Wenzhou, China), a portable DO meter (model AE8403; Azovtes, Guangzhou, China), and a water quality monitoring pen (model COM-300; Hm Digital, Guangzhou, China), respectively. Water samples were collected bi-weekly to determine the concentrations of nitrate nitrogen (NO3-N), nitrite nitrogen (NO2-N), total nitrogen (TN), total phosphorus (TP), chemical oxygen demand (COD), and ammonia nitrogen (NH4+-N). These measurements were conducted using a multi-parameter portable water quality analyzer (model TPSZ-20D; Top Cloud-agriculture, Hangzhou, China) coupled with specific reagents, according to standard methods [28].

2.4. Plant Growth and Quality Analysis

Destructive sampling of lettuce was conducted twice: on day 30 (mid-term) and day 60 (end-term) post-transplantation. Plant height and stem diameter were measured using a digital vernier caliper. The fresh weights of the above-ground and below-ground parts were weighed separately using a precision electronic balance (accuracy of 0.01 g). The total leaf area of the fresh above-ground leaves was determined using a portable living leaf area meter (model YMJ-B; Top Cloud-agriculture, Hangzhou, China).
Total nitrogen content was determined by the Kjeldahl method; soluble protein content was measured using the Coomassie brilliant blue G-250 staining method; soluble sugar content was determined by the anthrone colorimetric method; Vitamin C content was determined using the molybdenum blue colorimetric method; and nitrate content was quantified using the salicylic acid colorimetric method.

2.5. Determination of Leaf Mineral Content

After collecting, drying, and grinding the lettuce leaf samples, a microwave digestion pretreatment was performed according to the methods described by Hao et al. [29]. The contents of macro- and micronutrients, including P, S, K, Ca, Mg, Fe, Mn, Zn, Cu, B, and Mo, were accurately quantified using an Inductively Coupled Plasma Optical Emission Spectrometer (model EXPEC 6000; Hangzhou, China).

2.6. Photosynthetic Pigments and Parameters

During the vigorous growth stage of the lettuce (40 days post-transplantation), photosynthetic parameters were measured on clear, sunny mornings between 9:00 and 11:00. The net photosynthetic rate (Pn), transpiration rate (Tr), stomatal conductance (Gs), and intercellular CO2 concentration (Ci) of the third fully expanded true leaf from the top were measured using an LI-6400XT portable photosynthesis system (LI-COR, Lincoln, NE, USA). The light intensity was set to 800 μmol·m−2·s−1, the CO2 concentration was stably controlled at 550 μmol·mol−1 using a micro-cylinder system, and the relative humidity was set at 75–80% [30]. Simultaneously, the content of photosynthetic pigments (chlorophyll a, chlorophyll b, and carotenoids) was determined via the 95% ethanol extraction method. Briefly, 0.2 g of freshly chopped leaves (with the midrib removed) was weighed, and quartz sand, calcium carbonate powder, and 2 mL of 95% ethanol were added to grind the mixture into a homogenate. After making up to an appropriate volume, the mixture was left in the dark for extraction. Following centrifugation, the absorbance of the supernatant was measured using a spectrophotometer, and the pigment contents were calculated.

2.7. Fish Growth

All crucian carp in each system were measured comprehensively every 15 days. Fish were lightly anesthetized using an appropriate concentration of eugenol solution prior to measurement. Survival percentage, body length, and body weight were recorded. At the end of the 60-day feeding trial, growth parameters including weight gain rate (WGR), specific growth rate (SGR), feed conversion ratio (FCR), and protein efficiency ratio (PER) were calculated according to [31,32], using the following equations:
W G R ( % ) = 100 × [ f i n a l   t o t a l   w e i g h t   ( g ) i n i t i a l   t o t a l   w e i g h t ( g ) ] / i n i t i a l   t o t a l   w e i g h t   ( g )
F C R = t o t a l   f e e d   s u p p l i e d   p e r   t a n k ( g ) / [ f i n a l   t a n k   b i o m a s s ( g ) i n i t i a l   t a n k   b i o m a s s   ( g ) ]
S G R ( % / d ) = 100 × [ l n   ( f i n a l   a v e r a g e   w e i g h t ) l n   ( i n i t i a l   a v e r a g e   w e i g h t ) ] / t r i a l   d u r a t i o n ( d a y s )
P E R = [ f i n a l   t o t a l   w e i g h t ( g ) i n i t i a l   t o t a l   w e i g h t ( g ) ] / [ t o t a l   f e e d   i n t a k e   ( g ) × d i e t a r y   c r u d e   p r o t e i n   c o n t e n t ( % ) ]

2.8. Fish Stress

At the end of the 60-day trial, all fish were fasted for 24 h. Three fish were randomly sampled from each replicate unit (a total of 9 fish per treatment group). Fish were deeply anesthetized using a eugenol solution (40 mg/L) and immediately dissected on ice. The liver tissues were rapidly excised, flash-frozen in liquid nitrogen, and subsequently transferred to a −80 °C freezer for subsequent analysis. The activities of superoxide dismutase (SOD), catalase (CAT), and glutathione peroxidase (GSH-PX), as well as the contents of malondialdehyde (MDA) and cortisol in the liver, were measured using enzyme-linked immunosorbent assay (ELISA) kits in accordance with the manufacturer’s instructions [33].

2.9. Ethical Statement and Statistical Analysis

In this study, the experimental unit was defined as an independent recirculating aquaponic system unit. All statistical analyses were conducted with n = 3, representing the three independent replicate systems per treatment. For plant phenotypic and quality parameters, the value for each replicate system was calculated as the mean of 3 plants randomly sampled from that specific tank to minimize intra-unit variation while maintaining statistical independence.
All animal experimental protocols and sampling procedures strictly complied with the guidelines of the Animal Welfare and Ethics Committee of Ningxia University.
Data were statistically analyzed using IBM SPSS Statistics 22.0 software. All data were first evaluated using the Shapiro–Wilk test for normality and Levene’s test for homogeneity of variance, followed by a One-way Analysis of Variance (ANOVA). When significant differences were detected among treatments, Duncan’s multiple range test was employed for post hoc comparisons, as this method provides high sensitivity for detecting subtle but meaningful differences among multiple group means in agricultural and biological experiments. Throughout the results section, the statistical significance identified by ANOVA is visually represented in the tables and figures using different lowercase letters, where sharing no common letters indicates a significant difference. The overall significance level was set at p < 0.05. Experimental results are expressed as “Mean ± Standard Error (SE)”. To systematically evaluate the synergistic effects of dietary Fe and K on lettuce, a Principal Component Analysis (PCA) was conducted to calculate the Growth Comprehensive Index and Quality Comprehensive Index. The raw physiological and biochemical data were standardized, and the comprehensive scores for each treatment were extracted based on the variance contribution rates of the principal components. Subsequently, to visualize the dose–response relationship, 3D response surface models were constructed using the XYZ Gridding interpolation method in Origin 2025b with dietary Fe and K levels as the independent variables. These models were specifically employed to qualitatively illustrate the interactive trends and potential synergistic/antagonistic effects between the two nutrients across the experimental range, rather than to establish deterministic kinetic or mechanistic equations.

3. Results

3.1. Basic Water Quality of the Aquaponic System

Throughout the experimental period, the basic water quality parameters in all treatment groups remained within the suitable ranges for the operation of aquaponic systems (Table 2). Water temperature was maintained between 24.33 and 24.53 °C, dissolved oxygen (DO) ranged from 6.08 to 6.18 mg/L, pH values were between 7.62 and 7.77, and electrical conductivity (EC) ranged from 583 to 616 μS·cm−1. There were no significant differences in these basic parameters among the treatment groups (p > 0.05). Similarly, the concentrations of nitrate nitrogen, nitrite nitrogen, and ammonia nitrogen showed no significant differences among the groups. Notably, the chemical oxygen demand (COD) exhibited a significant treatment effect (One-way ANOVA, F = 528.76, p < 0.001). The T2 group had the lowest COD value (20.5 ± 0.65 mg/L), which was significantly lower than that of the CK group (31.6 ± 0.79 mg/L). Conversely, the high-dose T3 group saw a significant increase in COD, reaching 54.9 ± 1.06 mg/L.

3.2. Lettuce Growth Analysis

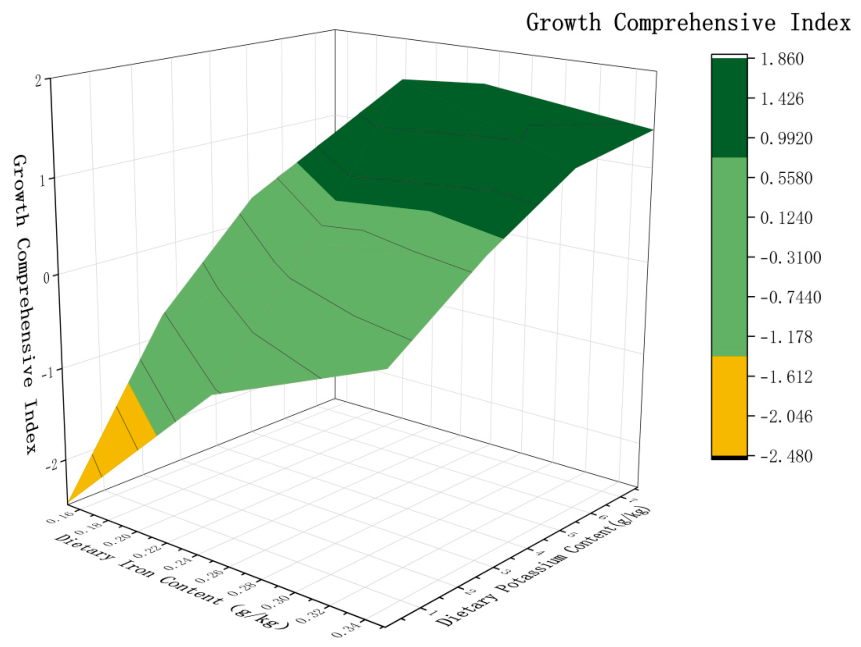
Throughout the trial, visual observation indicated that lettuce in the control group (CK) exhibited mild symptoms of nutrient deficiency, characterized by slightly pale green leaves (indicative of incipient chlorosis due to insufficient Fe) and marginally slower growth rates compared to the supplemented groups. The growth parameters of lettuce were significantly affected by the dietary Fe and K supplementation levels (One-way ANOVA: plant height F = 128.45, p < 0.001; stem diameter F = 45.72, p < 0.001; shoot fresh weight F = 18.63, p < 0.001; root fresh weight F = 76.39, p < 0.001; leaf area F = 92.17, p < 0.001; Table 3). Compared with the control group (CK), the T2 treatment group reached the maximum values in plant height (22.43 ± 0.16 cm), stem diameter (13.7 ± 0.15 mm), shoot fresh weight (113.29 ± 2.91 g), and leaf area (5562.83 ± 159.42 cm2), representing significant increases of 25.3%, 26.0%, 16.0%, and 37.8%, respectively (p < 0.05). Although the T3 group showed no significant differences from the T2 group in plant height and leaf area, its root fresh weight dropped to 7.27 ± 0.17 g, which was significantly lower than that of the T2 group (9.67 ± 0.11 g) (p < 0.05). The response surface analysis of the comprehensive growth index (Figure 2) visually demonstrated that the index peaked within the supplementation ranges of 0.15–0.25 g/kg for Fe and 4.0–6.0 g/kg for K; beyond these ranges, the promotive effect diminished.

3.3. Lettuce Quality Analysis

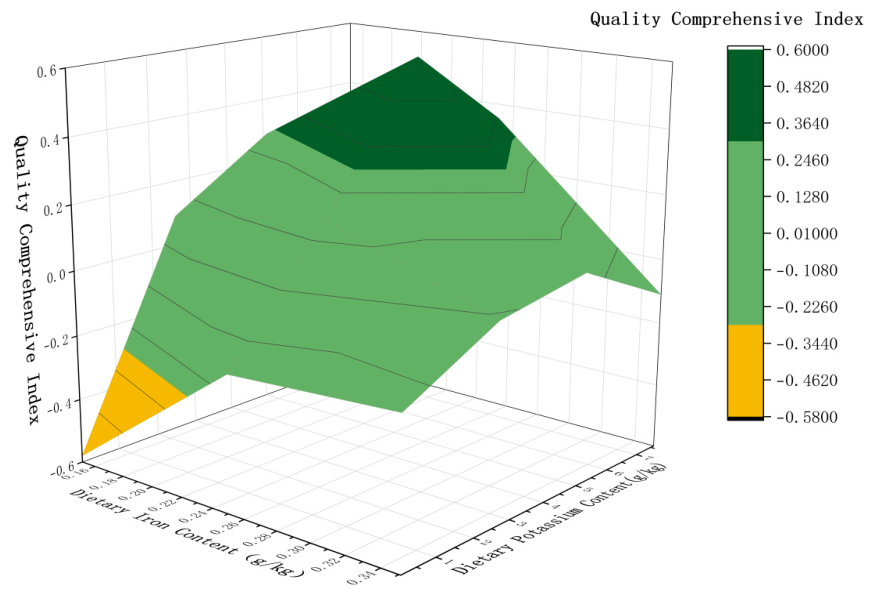
Dietary Fe and K supplementation markedly impacted the nutritional quality of lettuce leaves (One-way ANOVA: p < 0.001 for all indices; soluble sugar F = 126.942, soluble protein F = 1142.630, vitamin C F = 3110.063, nitrate F = 155.87; Table 4). The T2 group performed most favorably across several key quality indicators. Its vitamin C content reached 3153.15 ± 19.32 mg/kg DW, which was 52.2% higher than that of the CK group. The soluble sugar (9.80 ± 0.38 mg/g FW) and soluble protein (5.09 ± 0.08 mg/g FW) contents also peaked in the T2 group. Concurrently, the nitrate content in the T2 group significantly decreased to 1299.81 ± 30.21 mg/kg FW, a reduction of 32.2%. When the supplementation level further increased to the T3 level, the soluble protein (4.86 ± 0.05 g/kg FW) and total nitrogen (15.90 ± 0.34 g/kg DW) contents showed a significant downward trend. The response surface of the comprehensive quality index (Figure 3) exhibited a clear dose-dependent characteristic, reaching its peak within the addition ranges of 0.15–0.25 g/kg for Fe and 4.0–6.0 g/kg for K. Although the T3 group exhibited the highest absolute vitamin C content, the PCA-based quality comprehensive index peaked at the T2 level. This indicates that the concurrent significant declines in soluble sugar, soluble protein, and total nitrogen in the T3 group outweighed the isolated benefit of increased vitamin C, demonstrating that the T2 treatment provides the most balanced overall nutritional profile.

3.4. Leaf Tissue Mineral Content Analysis

The mineral content analysis revealed significant differences in elemental accumulation in lettuce leaves under different dietary Fe and K treatments (One-way ANOVA: p < 0.001 for all indices; phosphorus F = 86.096, sulfur F = 192.190, potassium F = 32,085.652, calcium F = 69.096, magnesium F = 40.684, iron F = 42.264, manganese F = 163.130, zinc F = 51.038, copper F = 60.317, boron F = 98.230, molybdenum F = 106.000; Table 5). Regarding macronutrients, the T2 group had the highest phosphorus (P) content (147.12 ± 1.42 mg/100 g), which was 18.0% higher than the CK group. The potassium (K) content exhibited a dose-dependent increase, peaking in the T3 group (3728.90 ± 6.89 mg/100 g). As for secondary macronutrients, calcium (Ca) and magnesium (Mg) contents showed a significant downward trend with increasing Fe and K addition; in the T3 group, Ca and Mg dropped to 398.72 mg/100 g and 265.96 mg/100 g, respectively, significantly lower than those in the CK group (p < 0.05). Regarding micronutrients, the iron (Fe) content in the T2 group (37.29 ± 0.40 mg/100 g) was 70.0% higher than in the CK group. Furthermore, the contents of zinc (Zn) (1.44 ± 0.01 mg/100 g, a 38.5% increase), sulfur (S), manganese (Mn), and copper (Cu) also reached their highest levels in the T2 group. Meanwhile, the molybdenum (Mo) content increased progressively with higher supplementation doses, reaching its maximum (0.0567 ± 0.0003 mg/100 g) in the T3 group (p < 0.05).

3.5. Analysis of Photosynthetic Pigments

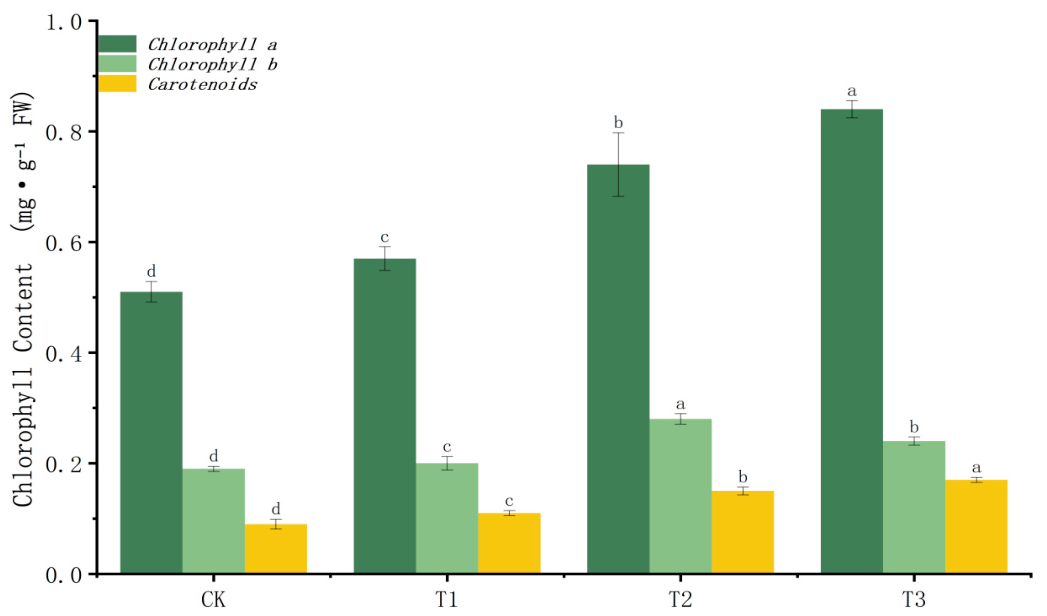
The contents of photosynthetic pigments in lettuce leaves exhibited a significant dose–response effect to dietary Fe and K supplementation (One-way ANOVA: all p < 0.001; chlorophyll a F = 126.627, chlorophyll b F = 130.950, carotenoids F = 183.232; Figure 4). The chlorophyll a content in the T3 group reached a peak of 0.84 ± 0.02 mg/g FW, which was 45.1% higher than that of the CK group (0.58 ± 0.01 mg/g FW). Meanwhile, the chlorophyll b content peaked in the T2 group at 0.28 ± 0.01 mg/g FW (a 39.3% increase), and the carotenoid content peaked in the T3 group at 0.18 ± 0.01 mg/g FW (a 38.5% increase). Notably, while the chlorophyll a and carotenoid contents in the T2 group were slightly lower than those in the T3 group, its chlorophyll a, chlorophyll b, and carotenoid contents were still significantly higher than those of the CK group by 27.6%, 39.3%, and 25.0%, respectively (p < 0.05).

3.6. Lettuce Photosynthetic Parameters

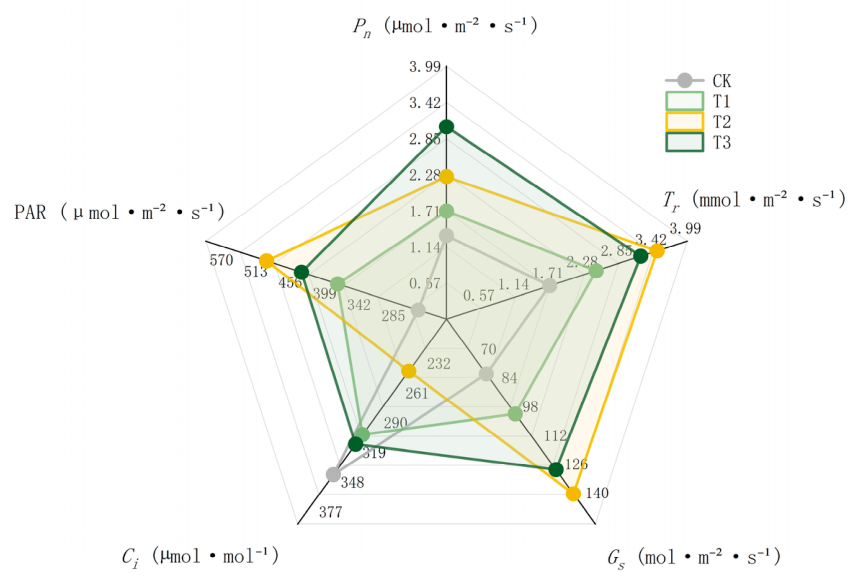
Measurements of photosynthetic parameters indicated that dietary Fe and K supplementation significantly promoted the photosynthetic efficiency of lettuce leaves (One-way ANOVA: photosynthetically active radiation F = 179.730, p < 0.001; transpiration rate F = 161.837, p < 0.001; stomatal conductance F = 825.461, p < 0.001; net photosynthetic rate F = 313.828, p < 0.001; Figure 5). The net photosynthetic rate (Pn) reached a peak of 3.04 ± 0.06 μmol·m−2·s−1 in the T3 group, a significant 70.8% increase compared to the CK group, while the T2 group (2.25 ± 0.05 μmol·m−2·s−1) showed a 26.4% increase over CK. The transpiration rate (Tr) exhibited a similar upward trend, with the T2 and T3 groups being 31.7% and 46.0% higher than CK, respectively. Stomatal conductance (Gs) in the T2 and T3 groups reached 135.11 ± 3.02 and 142.36 ± 3.18 mol·m−2·s−1, respectively, which were significantly higher than that of the CK group. Notably, there was no significant difference in the intercellular CO2 concentration (Ci) among the treatment groups (p > 0.05).

3.7. Growth Performance of Crucian Carp

Dietary Fe and K supplementation had a significant dose effect on the growth performance of crucian carp (One-way ANOVA: final body weight F = 38.958, p < 0.001; final body length F = 133.430, p < 0.001; WGR F = 162.043, p < 0.001; SGR F = 156.649, p < 0.001; FCR F = 71.410, p < 0.001; PER F = 55.920, p < 0.001; CF F = 9.013, p = 0.006; Table 6). The T2 group displayed superior growth performance: its weight gain rate (WGR) peaked at 41.0%, significantly higher than the CK group (36.08%) and the T3 group (36.70%); the specific growth rate (SGR) was 0.49%/d, significantly higher than CK. Regarding feed utilization efficiency, the feed conversion ratio (FCR) of the T2 group dropped to its lowest (1.76), significantly outperforming the CK (1.98) and T3 (1.95) groups. The protein efficiency ratio (PER) reached its maximum value of 2.29 in the T2 group. The body length indicator also reached its maximum (25.18 cm) in the T2 group. Throughout the experimental period, the survival percentage (SR) of crucian carp was maintained at 100% across all treatment groups.

3.8. Fish Stress Indicators

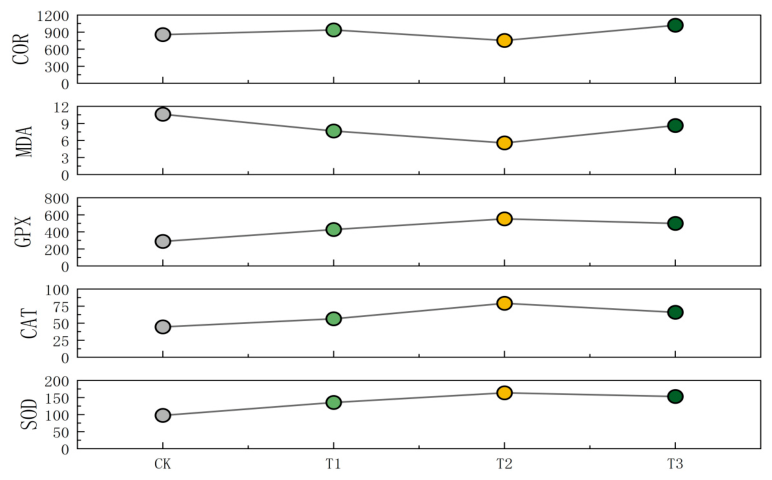
Determinations of hepatic stress and antioxidant indicators revealed that dietary Fe and K supplementation significantly affected the physiological status of the fish (One-way ANOVA: SOD F = 28.412, p < 0.001; CAT F = 23.774, p < 0.001; GPX F = 16.927, p = 0.001; MDA F = 41.286, p < 0.001; Cortisol F = 35.693, p < 0.001; Figure 6). The T2 group exhibited the ideal antioxidant defense status: the activities of superoxide dismutase (SOD), catalase (CAT), and glutathione peroxidase (GPX) reached 163.8 ± 3.5 U·mL−1, 79.19 ± 1.6 U·mL−1, and 553.1 ± 11.2 U·mL−1, respectively, representing significant increases of 18.5%, 22.3%, and 15.8% compared to the CK group. Concurrently, the content of malondialdehyde (MDA), an oxidative damage marker, dropped to its lowest in the T2 group (5.58 ± 0.12 nmol·mL−1, a 33.7% reduction vs. CK), and the level of the core stress hormone, cortisol, also reached its lowest level (285.4 ± 6.2 pg·mL−1, a 32.3% reduction vs. CK). When the supplementation dose reached the T3 level, although SOD and CAT activities remained high, the MDA content (6.87 ± 0.14 nmol·mL−1) and cortisol level (382.5 ± 8.3 pg·mL−1) were significantly higher than those in the T2 group.

4. Discussion

4.1. Stability and Dynamics of Basic Water Quality

Water quality stability is the cornerstone for evaluating the healthy operation of aquaponic systems [34]. In this study, despite the introduction of different gradients of Fe and K through the diet, basic parameters such as water temperature, dissolved oxygen (DO), pH, and electrical conductivity (EC) were all successfully maintained within the established favorable physiological ranges for lettuce, nitrifying bacteria, and crucian carp, as defined by previous literature [35]. Crucially, the concentrations of nitrate, nitrite, and ammonia nitrogen did not exhibit drastic fluctuations, confirming the robust environmental buffering capacity and homeostasis maintained by microbe-mediated nitrogen cycling in the aquaponic system [36,37]. Notably, the chemical oxygen demand (COD) of the water exhibited a highly sensitive dose-dependent response. Compared to traditional methods of directly adding inorganic salts to the water—which often cause severe fluctuations in electrical conductivity—this study effectively used a biological slow-release reactor. The specific combined Fe and K supplementation in the T2 group not only improved the feed utilization of the fish but also likely facilitated a steady, slow release of unassimilated micronutrients via feces. This steady release optimized the nutrient structure of the system, likely activating the metabolic activity of heterotrophic bacterial communities [38,39], accelerating the degradation of organic matter, and ultimately dropping the COD to its lowest level [40]. Fe serves as an essential cofactor for extracellular enzymes involved in the hydrolysis of recalcitrant organic matter, thereby facilitating the complete decomposition of carbon sources by the biofilter microbial community and resulting in a cleaner water environment. Conversely, when the supplementation dose reached the excessive T3 level, the COD drastically rebounded. This suggests that the gut absorption capacity of the crucian carp was saturated, leading to a massive discharge of unabsorbed Fe and K ions into the water. Furthermore, the drastic rebound of COD in the T3 group strongly implies an ecological tipping point. High concentrations of free heavy metal ions (Fe) and excessive osmotic pressure from K+ can exert direct cytotoxic effects on the biofilter microbiome. This dual ionic stress likely inhibited the metabolic activity of heterotrophic and nitrifying bacteria, stalling the mineralization process and leading to organic matter accumulation. Additionally, the elevated COD in the T3 group may not exclusively originate from unabsorbed fish feed; it could also be attributed to increased root exudates (such as soluble organic compounds) released by the stressed lettuce plants attempting to cope with the hyperosmotic micro-environment. This highlights that micro- and macronutrient management via dietary pathways must strictly adhere to the ecological carrying capacity of the system’s microbiome [41].

4.2. Synergistic and Antagonistic Effects of Combined Fe and K on Plant Nutrition

This study demonstrated that an appropriate combined dietary supplementation of Fe and K (T2 group) substantially promoted biomass accumulation and morphological development in lettuce. Fe, as a core component of cytochromes and ferredoxin, directly participates in photosynthetic electron transport [42]; meanwhile, K plays a dominant role in regulating stomatal movement and maintaining cell turgor pressure. The combined supplementation in T2 not only significantly increased chlorophyll content but also substantially enhanced the net photosynthetic rate (Pn) by optimizing the dual pathways of the “pigment base” and “photosynthetic efficiency”. This significant photosynthetic advantage likely stems from the highly efficient coupling of Fe and K in energy metabolism and water regulation. From a bioenergetics perspective, Fe ensures the continuous supply of ATP and NADPH by regulating the efficiency of electron transport [43]; concurrently, K ions drive the H+-ATPase on the plasma membrane of guard cells to generate a proton gradient, utilizing the “energy thrust” provided by Fe to achieve rapid stomatal regulation. The physiological coupling of this “energy supply” and “stomatal driving force” is proposed as the key mechanism allowing the T2 group to achieve peak photosynthetic performance even in the complex nutritional environment of the aquaponic system [44,45,46].
Interestingly, the intercellular CO2 concentration (Ci) did not change significantly among the treatments. This indicates that the substantial increase in photosynthetic rate was primarily driven by a substantial enhancement in the photosynthetic carbon assimilation activity of mesophyll cells under an adequate Fe/K supply, rather than merely by stomatal factors. However, the significant decline in root fresh weight in the T3 group, despite high photosynthetic rates, indicates a strategic shift in carbon allocation. Under excessive ionic stress, the plants likely prioritize the synthesis of osmolytes (such as soluble sugars) to maintain cellular turgor rather than allocating fixed carbon to structural biomass accumulation, a trade-off that ultimately limits root development. Interestingly, although the T3 group exhibited the highest net photosynthetic rate (Figure 5), this did not translate into maximum biomass. This suggests that the excess energetic resources in the T3 group were likely partitioned toward metabolic detoxification and the synthesis of stress-related secondary metabolites rather than structural growth, a phenomenon often observed under mineral toxicity. Furthermore, excessive nutrient supply in the T3 group led to significant negative interference in plant nutrient uptake. Mineral element analysis showed a sharp decline in calcium (Ca) content in the leaves of the T3 group. Interestingly, while magnesium (Mg) content was lowest in the T2 group, it slightly rebounded in the T3 group. This complex fluctuation of divalent cations highlights the inherent challenge of balancing macronutrients in closed aquaponic systems. The sharp decline in Ca content (and the overall suppression of Mg relative to the control) under high K supplementation (T3) strongly points to classical ion antagonism. However, it is crucial to clarify that although the overall suppression of Mg was observed, the absolute Mg content in the T3 group (265.96 mg/100 g) remained within the adequate physiological range for normal lettuce growth (typically 200–400 mg/100 g DW). This explains why severe chlorosis or classical mineral toxicity symptoms were not observed, and chlorophyll contents (especially chlorophyll b) remained relatively stable. Therefore, the significant decrease in structural biomass in the T3 group was not primarily driven by Mg starvation, but rather by the aforementioned high osmotic stress exerted by excessive K. Reference [47] observed a similar phenomenon when directly adding potassium sulfate to aquaponic water, where a high-K environment severely restricted the uptake of divalent cations. Our findings demonstrate that delivering K via fish dietary intervention, while effective in buffering acute water quality shocks, cannot bypass this fundamental physiological antagonism once K accumulation in the system exceeds a certain threshold. The significant reduction in Ca in T3 leaves (Table 5) is highly consistent with the well-documented competitive inhibition between monovalent (K+) and divalent (Ca2+, Mg2+) cations at root uptake sites. While we hypothesize that this may involve the occupation of non-selective cation channels (NSCCs) by excess K+, the precise molecular transport mechanisms in this aquaponic context require future targeted electrophysiological or gene expression studies for confirmation. Concurrently, excessive free Fe in the rhizosphere could potentially trigger Fenton-like reactions, which are known to generate reactive oxygen species (ROS) and induce lipid peroxidation in root cell membranes. This dual stress of ‘ion competition’ and ‘potential oxidative damage’ likely compromises membrane integrity and impairs overall nutrient uptake efficiency [48], physiologically explaining the significant decrease in biomass in the T3 group.
Additionally, while the vitamin C content continued to rise in the T3 group, the soluble sugar content slightly declined from its peak in the T2 group, and soluble protein and total nitrogen contents decreased significantly. This suggests that excessive Fe and K created a “hyperosmotic ion” micro-stress environment in the plant rhizosphere. To cope with this osmotic stress, the plants were forced to activate osmotic adjustment mechanisms, converting more carbon sources into osmolytes such as soluble sugars [49], which consequently led to an imbalance in energy allocation (e.g., the significant decline in root biomass in the T3 group). Concurrently, the ion imbalance triggered by excessive K inhibited nitrate reduction and amino acid synthesis, ultimately leading to a decline in overall nitrogen metabolism. Furthermore, the significant decrease in nitrate content observed in the T2 group corroborates the promotive role of K+ on nitrate reductase (NR) activity. As a cofactor of NR, K accelerates the assimilation of nitrate into proteins. This not only alleviates nitrogen accumulation stress within the plant but also substantially improves the food safety of lettuce as a horticultural product. Unlike previous studies that reported severe Ca and Mg deficiencies caused by competitive inhibition when potassium sulfate was directly added to aquaponic water, our dietary intervention strategy (particularly the T2 treatment) successfully circumvented acute ion antagonism. This finding emphasizes that precisely regulating the Fe/K ratio through dietary pathways—utilizing slow ecological release—is a far more stable and effective means of balancing crop yield, nutritional quality, and food safety in aquaponic systems. However, this single-input dietary strategy has inherent limitations. Despite the overall superior performance of the T2 group, its foliar accumulation of Ca and Mg remained significantly lower than the control (Table 5). This persistent decline indicates that while dietary Fe/K optimization buffers water quality shocks, it cannot entirely eliminate competitive ion antagonism in the rhizosphere, suggesting that future aquaponic management may require supplementary targeted applications (e.g., foliar sprays) to fully resolve localized divalent cation deficiencies.

4.3. Fish Growth and Health

In this study, the growth performance and physiological stress status of crucian carp exhibited a highly sensitive dose–response to dietary Fe and K supplementation. The T2 group (Fe 0.2 g/kg + K 5.0 g/kg) achieved highly favorable results in weight gain rate, specific growth rate, and protein efficiency ratio. Although specific hematological and electrophysiological parameters were not measured in this study, it is widely documented that highly effective Fe levels are essential for erythropoiesis and hemoglobin synthesis in cyprinids, which sustains the higher metabolic oxygen demands during the vigorous growth phase. Concurrently, adequate dietary K is known to support cellular osmoregulation and digestive enzyme secretion. The significant improvement in the feed conversion ratio (FCR dropping to 1.76) in the T2 group suggests that this specific Fe/K combination effectively supported these baseline metabolic functions without inducing osmotic stress. This excellent physiological metabolic state complements the lower water COD load in the T2 group, jointly providing the ideal environment for directing energy toward fish growth.
Regarding antioxidant defense, the matrix of antioxidant enzymes (SOD, CAT, and GPX) was synergistically elevated in the T2 group, while the MDA content (a marker of oxidative damage) and cortisol level (a primary stress biomarker) dropped to their lowest. However, when the dose increased to the T3 level, fish growth performance declined, and MDA and cortisol levels significantly rebounded, indicating that excessive mineral intake had induced oxidative stress. Specifically, the significant surge in hepatic MDA levels despite sustained high antioxidant enzyme activities (SOD, CAT) in the T3 group (Figure 6) serves as a clear biochemical footprint of an overwhelmed oxidative defense system. This strongly supports the occurrence of iron-catalyzed Fenton reactions, where excessive free Fe catalyzes the production of highly toxic hydroxyl radicals, while extreme excessive K intake overloads the excretory capacity of the gills and kidneys, disrupting cellular ion homeostasis. Although fish possess efficient mechanisms to excrete moderate amounts of excess K (as noted in the introduction), the extreme dietary load in the T3 group likely overwhelmed these osmoregulatory pathways, thereby exacerbating physiological stress and lipid peroxidation of the cell membrane. This mechanism strongly aligns with core findings in recent aquatic animal nutrition research: Luo et al. [21] pointed out that the highly effective Fe content in cyprinid diets should be controlled within 118–120 mg/kg, and excessive supplementation leads to significantly elevated hepatic MDA; Liu et al. [22] further confirmed that an Fe supplementation dose as high as 800 mg/kg causes severe pathological damage such as hepatocyte degeneration in common carp. In our study, the T2 group (200 mg/kg Fe) achieved most favorable antioxidant and haemato-immunological status, whereas the T3 group (300 mg/kg Fe) exhibited growth inhibition and oxidative damage. These results are not only highly consistent with previous conclusions regarding “iron overload inducing oxidative damage” but also precisely define the safe tolerance threshold of critical micronutrients for cyprinids within the complex “combined Fe-K” aquaponic system. Furthermore, the significantly elevated cortisol level in the T3 group reflects that the fish, in response to chronic nutritional and oxidative stress, were forced to consume additional energy by promoting gluconeogenesis and protein catabolism. This energetic trade-off provides a fundamental endocrine perspective for the growth suppression observed in the high-dose group.

5. Conclusions

This study demonstrates that the combined dietary supplementation of iron (Fe) and potassium (K) is a highly effective ecological strategy for overcoming mineral nutrient bottlenecks in recirculating aquaponic systems. Based on Principal Component Analysis and response surface modeling, the suitable dietary supplementation was identified as 0.2 g/kg Fe combined with 5.0 g/kg K (the T2 treatment). At this dosage, the system achieved synergistic improvements in both plant and fish productivity. This synergistic effect not only promoted lettuce biomass accumulation, photosynthetic efficiency, and nutritional quality (e.g., elevated vitamin C and markedly reduced nitrate) but also substantially improved the growth performance and feed utilization of crucian carp while alleviating hepatic oxidative stress. Furthermore, this dietary approach maintained better water quality stability than direct supplementation. Despite these distinct advantages, this strategy presents specific limitations: the persistent decline in foliar Ca and Mg in the T2 group indicates that dietary Fe/K optimization cannot fully circumvent competitive ion antagonism. Additionally, excessive combined supplementation (the T3 treatment, Fe 0.3 g/kg + K 7.5 g/kg) exceeded the system’s carrying capacity, triggering severe growth suppression, potential microbial metabolic stress in the biofilter, and oxidative damage in the fish liver. These findings provide a critical theoretical rationale for optimizing precise mineral nutrient management in modern aquaponics, while cautioning that supplemental strategies must be carefully calibrated to avoid tipping the delicate ecological balance. To address the persistent limitation of competitive ion antagonism, future studies should explore integrating this dietary approach with targeted foliar sprays to fully resolve localized Ca and Mg deficiencies.

Author Contributions

H.X. designed and implemented the experiments and wrote the manuscript. J.L., X.Z., Z.L., K.C. and H.X. collected the data. H.X., J.L., X.Z., Z.L. and S.G. analyzed and interpreted the data. L.Y. contributed to the conception, design, implementation, and funding acquisition. All authors have read and agreed to the published version of the manuscript.

Funding

We gratefully acknowledge the following agencies for funding this research article: (1) the Ningxia Hui Autonomous Region Key R&D Program Project (2023BCF01022). (2) the Postgraduate Innovation Project of Ningxia University (CXXM2025-032).

Data Availability Statement

All of the data are represented in the form of tables and figures. Raw data can be provided on request.

Conflicts of Interest

The authors declare no conflicts of interest.

References

  1. Greenfeld, A.; Becker, N.; Bornman, J.F.; Spatari, S.; Angel, D.L. Is aquaponics good for the environment?—Evaluation of environmental impact through life cycle assessment studies on aquaponics systems. Aquac. Int. 2022, 30, 305–322. [Google Scholar] [CrossRef]
  2. Zhu, Z.; Yogev, U.; Keesman, K.J.; Rachmilevitch, S.; Gross, A. Integrated hydroponics systems with anaerobic supernatant and aquaculture effluent in desert regions: Nutrient recovery and benefit analysis. Sci. Total Environ. 2023, 904, 166867. [Google Scholar] [CrossRef]
  3. Effendi, H.; Wahyuningsih, S.; Wardiatno, Y. The use of nile tilapia (Oreochromis niloticus) cultivation wastewater for the production of romaine lettuce (Lactuca sativa L. var. longifolia) in water recirculation system. Appl. Water Sci. 2017, 7, 3055–3063. [Google Scholar] [CrossRef]
  4. Aslanidou, M.; Elvanidi, A.; Mourantian, A.; Levizou, E.; Mente, E.; Katsoulas, N. Evaluation of productivity and efficiency of a large-scale coupled or decoupled aquaponic system. Sci. Hortic. 2024, 337, 113552. [Google Scholar] [CrossRef]
  5. Bordignon, F.; Birolo, M.; Fanizza, C.; Trocino, A.; Zardinoni, G.; Stevanato, P.; Nicoletto, C.; Xiccato, G. Effects of water salinity in an aquaponic system with rainbow trout (Oncorhynchus mykiss), black bullhead catfish (Ameiurus melas), Swiss chard (Beta vulgaris), and cherry tomato (Solanum lycopersicum). Aquaculture 2024, 584, 740634. [Google Scholar] [CrossRef]
  6. Puccinelli, M.; Galati, D.; Carmassi, G.; Rossi, L.; Pardossi, A.; Incrocci, L. Leaf production and quality of sea beet (Beta vulgaris subsp. maritima) grown with saline drainage water from recirculating hydroponic or aquaculture systems. Sci. Hortic. 2023, 322, 112416. [Google Scholar] [CrossRef]
  7. Delaide, B.; Teerlinck, S.; Decombel, A.; Bleyaert, P. Effect of wastewater from a pikeperch (Sander lucioperca L.) recirculated aquaculture system on hydroponic tomato production and quality. Agric. Water Manag. 2019, 226, 105814. [Google Scholar] [CrossRef]
  8. Kasozi, N.; Tandlich, R.; Fick, M.; Kaiser, H.; Wilhelmi, B. Iron supplementation and management in aquaponic systems: A review. Aquac. Rep. 2019, 15, 100221. [Google Scholar] [CrossRef]
  9. Zhang, X.; Zhang, D.; Sun, W.; Wang, T. The adaptive mechanism of plants to iron deficiency via iron uptake, transport, and homeostasis. Int. J. Mol. Sci. 2019, 20, 2424. [Google Scholar] [CrossRef]
  10. Li, K.L.; Tang, R.J.; Wang, C.; Luan, S. Potassium nutrient status drives posttranslational regulation of a low-K response network in Arabidopsis. Nat. Commun. 2023, 14, 360. [Google Scholar] [CrossRef]
  11. Shah, I.H.; Jinhui, W.; Li, X.; Hameed, M.K.; Manzoor, M.A.; Li, P.; Zhang, Y.; Niu, Q.; Chang, L.J.S.H. Exploring the role of nitrogen and potassium in photosynthesis implications for sugar: Accumulation and translocation in horticultural crops. Sci. Hortic. 2024, 327, 112832. [Google Scholar] [CrossRef]
  12. Barreto, M.O.; Rey Planellas, S.; Yang, Y.; Phillips, C.; Descovich, K. Emerging indicators of fish welfare in aquaculture. Rev. Aquac. 2022, 14, 343–361. [Google Scholar] [CrossRef]
  13. Harika, N.; Verma, A.K.; Krishnani, K.K.; Hittinahalli, C.M.; Reddy, R.; Pai, M. Supplementation of potassium in aquaculture wastewater and its effect on growth performance of basil (Ocimum basilicum L) and pangasius (Pangasianodon hypophthalmus) in NFT-based aquaponics. Sci. Hortic. 2024, 323, 112521. [Google Scholar] [CrossRef]
  14. Roosta, H.R.; Mohsenian, Y. Effects of foliar spray of different Fe sources on pepper (Capsicum annum L.) plants in aquaponic system. Sci. Hortic. 2012, 146, 182–191. [Google Scholar] [CrossRef]
  15. Meena, L.L.; Verma, A.K.; Bharti, V.S.; Nayak, S.K.; Chandrakant, M.; Haridas, H.; Reang, D.; Javed, H.; John, V.C. Effect of foliar application of potassium with aquaculture wastewater on the growth of okra (Abelmoschus esculentus) and Pangasianodon hypophthalmus in recirculating aquaponic system. Sci. Hortic. 2022, 302, 111161. [Google Scholar] [CrossRef]
  16. Meena, L.L.; Verma, A.K.; Krishnani, K.K.; Hittinahalli, C.M.; Haridas, H.; John, V.C. Combined foliar application effect of iron and potassium on growth of okra and striped catfish using media bed based aquaponics. Aquaculture 2023, 569, 739398. [Google Scholar] [CrossRef]
  17. Frassine, D.; Braglia, R.; Scuderi, F.; Redi, E.L.; Valentini, F.; Relucenti, M.; Colasanti, I.A.; Macchia, A.; Allegrini, I.; Gismondi, A.; et al. Enhancing lettuce (Lactuca sativa) productivity: Foliar sprayed Fe-Alg-CaCO3 MPs as fertilizers for aquaponics cultivation. Plants 2024, 13, 3416. [Google Scholar] [CrossRef]
  18. Corrado, G.; De Micco, V.; Lucini, L.; Miras-Moreno, B.; Senizza, B.; Zengin, G.; El-Nakhel, C.; De Pascale, S.; Rouphael, Y. Isosmotic macrocation variation modulates mineral efficiency, morpho-physiological traits, and functional properties in hydroponically grown lettuce varieties (Lactuca sativa L.). Front. Plant Sci. 2021, 12, 678799. [Google Scholar] [CrossRef]
  19. Musielińska, R.; Kowol, J.; Kwapuliński, J.; Rochel, R. Antagonism between lead and zinc ions in plants. Arch. Environ. Prot. 2016, 42, 78–91. [Google Scholar] [CrossRef]
  20. Farooq, A.; Verma, A.K.; Hittinahalli, C.M.; Harika, N.; Pai, M. Iron supplementation in aquaculture wastewater and its effect on the growth of spinach and pangasius in nutrient film technique based aquaponics. Agric. Water Manag. 2023, 277, 108126. [Google Scholar] [CrossRef]
  21. Luo, X.-L.; Abdessan, R.; Yan, J.-J.; Ji, H. Evaluation of dietary Fe on juvenile mirror carp (Cyprinus carpio var. specularis) and lettuce (Lactuca sativa var. ramosa Hort) in recirculating aquaponic system. Aquaculture 2024, 591, 741107. [Google Scholar] [CrossRef]
  22. Liu, Y.; Dou, Z.; Ji, C.; Zhou, Q.; Zhao, J.; Wang, K.; Chen, C.; Liu, Q. Effects of Dietary Ferric EDTA Levels on Vegetables and Mirror Carp (Cyprinus carpio var. specularis) in Aquaponics System. Animals 2025, 15, 792. [Google Scholar] [CrossRef] [PubMed]
  23. Musharraf, M.; Khan, M.A. Requirement of fingerling Indian major carp, Labeo rohita (Hamilton) for dietary iron based on growth, whole body composition, haematological parameters, tissue iron concentration and serum antioxidant status. Aquaculture 2019, 504, 148–157. [Google Scholar] [CrossRef]
  24. Siqwepu, O.; Salie, K.; Goosen, N. Evaluation of potassium diformate and potassium chloride in the diet of the African catfish, Clarias gariepinus in a recirculating aquaculture system. Aquaculture 2020, 526, 735414. [Google Scholar] [CrossRef]
  25. He, J.; Rossner, N.; Hoang, M.T.T.; Alejandro, S.; Peiter, E. Transport, functions, and interaction of calcium and manganese in plant organellar compartments. Plant Physiol. 2021, 187, 1940–1972. [Google Scholar] [CrossRef]
  26. Roy, K.; Bernas, J.; Gebauer, R.; Tellbuscher, A.A.; Nikl, O.; Shaw, C.; Folorunso, E.A.; Kloas, W.; Aubin, J.; Mraz, J. Environmental impact assessment of fish feed for aquaponic systems to introduce higher phosphorus and potassium in value-added fish sludge. Aquaculture 2025, 599, 742142. [Google Scholar] [CrossRef]
  27. Tellbüscher, A.A.; Gebauer, R.; Šeda, M.; Goldhammer, T.; Nikl, O.; Roy, K.; Kloas, W.; Mráz, J. Fish manure as a potential feedstock for organic hydroponic nutrient solutions: The effect of fish feed composition and fertilizer amendment on the growth performance of lettuce. Sci. Hortic. 2025, 350, 114309. [Google Scholar] [CrossRef]
  28. Clesceri, L.S. Standard Methods for Examination of Water and Wastewater; American Public Health Association: Washington, DC, USA, 1998; Available online: https://www.standardmethods.org/ (accessed on 6 September 2025).
  29. Hao, L.; Han, Y.; Zhang, S.; Luo, Y.; Luo, K. Bioavailability of selenium and the influence of trace elements in crops grown in selenium-rich areas. Food Chem. 2025, 476, 143463. [Google Scholar] [CrossRef] [PubMed]
  30. Li, L.; Tong, Y.-x.; Lu, J.-l.; Li, Y.-m.; Liu, X.; Cheng, R.-f. Morphology, photosynthetic traits, and nutritional quality of lettuce plants as affected by green light substituting proportion of blue and red light. Front. Plant Sci. 2021, 12, 627311. [Google Scholar] [CrossRef] [PubMed]
  31. Bernardino, R.; Vieira, J.; Vaz, D.C.; Santos, O.D.; Ribeiro, V.S.; Pires, C.L.; Cotrim, L.; Bernardino, S.; Sebastião, F. Production of parsley and pennyroyal with an African catfish-based aquaponics partially fed with yellow mealworms-Tenebrio molitor. Sci. Hortic. 2025, 353, 114487. [Google Scholar] [CrossRef]
  32. Waadt, R.; Seller, C.A.; Hsu, P.-K.; Takahashi, Y.; Munemasa, S.; Schroeder, J.I. Plant hormone regulation of abiotic stress responses. Nat. Rev. Mol. Cell Biol. 2022, 23, 680–694. [Google Scholar] [CrossRef]
  33. Li, S. Novel insight into functions of ascorbate peroxidase in higher plants: More than a simple antioxidant enzyme. Redox Biol. 2023, 64, 102789. [Google Scholar] [CrossRef]
  34. Wortman, S.E. Crop physiological response to nutrient solution electrical conductivity and pH in an ebb-and-flow hydroponic system. Sci. Hortic. 2015, 194, 34–42. [Google Scholar] [CrossRef]
  35. Duan, S.; Zhang, Y.; Zheng, S. Heterotrophic nitrifying bacteria in wastewater biological nitrogen removal systems: A review. Crit. Rev. Environ. Sci. Technol. 2022, 52, 2302–2338. [Google Scholar] [CrossRef]
  36. Tanveer, M.; Wang, S.; Ma, X.; Yu, P.; Xu, P.; Zhuang, L.; Hu, Z. Enhancement of nitrogen transformation in media-based aquaponics systems using biochar and zerovalent iron. Bioresour. Technol. 2025, 418, 131933. [Google Scholar] [CrossRef]
  37. Li, H.; Miller, T.; Lu, J.; Goel, R. Nitrogen fixation contribution to nitrogen cycling during cyanobacterial blooms in Utah Lake. Chemosphere 2022, 302, 134784. [Google Scholar] [CrossRef]
  38. Thakur, K.; Kuthiala, T.; Singh, G.; Arya, S.K.; Iwai, C.B.; Ravindran, B.; Khoo, K.S.; Chang, S.W.; Awasthi, M.K. An alternative approach towards nitrification and bioremediation of wastewater from aquaponics using biofilm-based bioreactors: A review. Chemosphere 2023, 316, 137849. [Google Scholar] [CrossRef]
  39. Chen, Y.-Z.; Zhang, L.-J.; Ding, L.-Y.; Zhang, Y.-Y.; Wang, X.-S.; Qiao, X.-J.; Pan, B.-Z.; Wang, Z.-W.; Xu, N.; Tao, H.-C. Sustainable treatment of nitrate-containing wastewater by an autotrophic hydrogen-oxidizing bacterium. Environ. Sci. Ecotechnol. 2022, 9, 100146. [Google Scholar] [CrossRef]
  40. Liu, Q.; Hou, J.; Wu, J.; Miao, L.; You, G.; Ao, Y. Intimately coupled photocatalysis and biodegradation for effective simultaneous removal of sulfamethoxazole and COD from synthetic domestic wastewater. J. Hazard. Mater. 2022, 423, 127063. [Google Scholar] [CrossRef] [PubMed]
  41. Hu, Z.; Lee, J.W.; Chandran, K.; Kim, S.; Khanal, S.K. Nitrous oxide (N2O) emission from aquaculture: A review. Environ. Sci. Technol. 2012, 46, 6470–6480. [Google Scholar] [CrossRef]
  42. Emrich-Mills, T.Z.; Proctor, M.S.; Degen, G.E.; Jackson, P.J.; Richardson, K.H.; Hawkings, F.R.; Buchert, F.; Hitchcock, A.; Hunter, C.N.; Mackinder, L.C.M.; et al. Tethering ferredoxin-NADP+ reductase to photosystem I promotes photosynthetic cyclic electron transfer. Plant Cell 2025, 37, koaf042. [Google Scholar] [CrossRef]
  43. Rahman, A.; Harker, T.; Lewis, W.; Islam, K.R. Nano and chelated iron fertilization influences marketable yield, phytochemical properties, and antioxidant capacity of tomatoes. PLoS ONE 2023, 18, e0294033. [Google Scholar] [CrossRef] [PubMed]
  44. Semahegn, Z. Effects of Increased Temperature on Photosynthesis of C3 and C4 Plants. J. Nat. Sci. Res. 2022, 13, 19–25. [Google Scholar] [CrossRef]
  45. Li, S.-l.; Tan, T.-t.; Fan, Y.-f.; Raza, M.A.; Wang, Z.-l.; Wang, B.-b.; Zhang, J.-w.; Tan, X.-m.; Chen, P.; Shafiq, I.; et al. Responses of leaf stomatal and mesophyll conductance to abiotic stress factors. J. Integr. Agric. 2022, 21, 2787–2804. [Google Scholar] [CrossRef]
  46. Ding, H.; Wang, Z.; Zhang, Y.; Li, J.; Jia, L.; Chen, Q.; Ding, Y.; Wang, S. A mechanistic model for estimating rice photosynthetic capacity and stomatal conductance from sun-induced chlorophyll fluorescence. Plant Phenomics 2023, 5, 0047. [Google Scholar] [CrossRef] [PubMed]
  47. John, V.C.; Verma, A.K.; Krishnani, K.K.; Chandrakant, M.; Bharti, V.S.; Varghese, T. Optimization of potassium (K+) supplementation for growth enhancement of Spinacia oleracea L. and Pangasianodon hypophthalmus (Sauvage, 1878) in an aquaponic system. Agric. Water Manag. 2022, 261, 107339. [Google Scholar] [CrossRef]
  48. Tyerman, S.D.; McGaughey, S.A.; Qiu, J.; Yool, A.J.; Byrt, C.S. Adaptable and Multifunctional Ion-Conducting Aquaporins. Annu. Rev. Plant Biol. 2021, 72, 703–736. [Google Scholar] [CrossRef] [PubMed]
  49. Lin, X.Y.; Ye, Y.Q.; Fan, S.K.; Jin, C.W.; Zheng, S.J. Increased sucrose accumulation regulates iron-deficiency responses by promoting auxin signaling in Arabidopsis plants. Plant Physiol. 2016, 170, 907–920. [Google Scholar] [CrossRef]
Figure 1. Layout of the recirculating aquaponic system used in the experiment. (a) Photograph of the actual physical setup in the greenhouse. (b) Schematic diagram illustrating the water flow circulation among the fish rearing tank, biological filter, and NFT hydroponic unit.
Horticulturae 12 00574 g001
Figure 2. Effect of Iron and Potassium Addition on Growth Comprehensive Index.
Horticulturae 12 00574 g002
Figure 3. Effect of Iron and Potassium Addition on Quality Comprehensive Index.
Horticulturae 12 00574 g003
Figure 4. Chlorophyll contents (chlorophyll a, chlorophyll b, and carotenoids) of lettuce leaves in each treatment group. Different lowercase letters above the bars indicate significant differences among treatments based on Duncan’s multiple range test (p < 0.05). Data are presented as means ± SE (n = 3).
Horticulturae 12 00574 g004
Figure 5. Photosynthetic characteristics (net photosynthetic rate [Pn], transpiration rate [Tr], stomatal conductance [Gs], and intercellular CO2 concentration [Ci]) of lettuce leaves in each treatment group. Data are presented as means ± SE (n = 3).
Horticulturae 12 00574 g005
Figure 6. Hepatic antioxidant and stress parameters of crucian carp in each treatment group. Abbreviations: COR, Cortisol; MDA, Malondialdehyde; GPX, Glutathione peroxidase; CAT, Catalase; SOD, Superoxide dismutase. Data are presented as means ± SE (n = 3).
Horticulturae 12 00574 g006
Table 1. Approximate Composition of the experimental diets (g/kg dry matter).
Approximate IngredientsCKT1T2T3
Crude protein (g/kg)300300300300
Crude lipid (g/kg)50505050
Ash (g/kg)150150150150
Moisture (g/kg)125125125125
Calcium (g/kg)6666
Total Phosphorus (g/kg)14141414
Lysine (g/kg)14141414
Crude Fiber (g/kg)120120120120
Iron (g/kg)0.0510.1510.2510.351
Potassium (g/kg)0.10372.60375.10377.6037
Table 2. Basic water quality.
ParameterCKT1T2T3
Temperature (°C)24.33 ± 0.0224.41 ± 0.0324.53 ± 0.1224.42 ± 0.09
DO (mg·L−1)6.08 ± 0.016.11 ± 0.026.18 ± 0.056.13 ± 0.01
pH7.62 ± 0.167.67 ± 0.127.77 ± 0.137.73 ± 0.15
EC (μS·cm−1)583 ± 15.54616 ± 18.67588 ± 17.25597 ± 14.80
TDS (mg·L−1)397 ± 3.21413 ± 4.32394 ± 4.65398 ± 2.63
NO3-N (mg·L−1)7.57 ± 0.408.99 ± 0.519.11 ± 0.468.61 ± 0.76
NO2-N (mg·L−1)0.08 ± 0.010.08 ± 0.010.07 ± 0.010.08 ± 0.01
NH4+-N (mg·L−1)0.11 ± 0.010.10 ± 0.020.11 ± 0.010.10 ± 0.01
COD (mg·L−1)31.6 ± 0.79 b28.5 ± 0.25 c20.5 ± 0.65 d54.9 ± 1.06 a
Note: Data are presented as means ± SE. Water temperature, DO, pH, EC, and TDS were recorded daily, while nitrogen and phosphorus parameters were measured bi-weekly over the 60-day trial. Different lowercase letters in the same row indicate significant differences among treatments (p < 0.05).
Table 3. Biomass of vegetables in each treatment group.
TreatmentPlant Height (cm)Stem Diameter (mm)Shoot Fresh Weight (g)Root Fresh Weight (g)Leaf Area (cm2)
CK17.9 ± 0.18 c10.87 ± 0.34 c97.61 ± 5.13 b6.83 ± 0.19 c4038.7 ± 143.81 c
T119.8 ± 0.24 b12.27 ± 0.71 b101.75 ± 2.88 ab7.82 ± 0.02 b4793.16 ± 109.78 b
T222.43 ± 0.16 a13.7 ± 0.15 a113.29 ± 2.91 a9.67 ± 0.11 a5562.83 ± 159.42 a
T322.8 ± 0.22 a14.77 ± 0.05 a113.27 ± 1.63 a7.27 ± 0.17 c5687.6 ± 102.91 a
Note: Data are presented as means ± SE (n = 3). Here, n = 3 represents the three independent replicate aquaponic systems per treatment. For plant growth and quality parameters, each replicate value is derived from the mean of 3 randomly selected plants per system. Different lowercase letters within the same column indicate significant differences among treatments based on Duncan’s multiple range test (p < 0.05).
Table 4. Quality of vegetables in each treatment group.
TreatmentSoluble Sugar
(mg/g FW)
Soluble Protein
(mg/g FW)
Vitamin C
(mg/kg DW)
Nitrate
(mg/kg FW)
Total Nitrogen
(g/kg DW)
CK7.47 ± 0.27 c4.46 ± 0.16 d2070.76 ± 20.58 d1917.14 ± 20.33 a14.11 ± 0.26 d
T18.97 ± 0.20 b4.72 ± 0.13 c2805.41 ± 9.37 c1524.47 ± 36.16 b17.73 ± 0.13 b
T29.80 ± 0.38 a5.09 ± 0.08 a3153.15 ± 19.32 b1299.81 ± 30.21 c18.74 ± 0.20 a
T39.23 ± 0.29 b4.86 ± 0.05 b3490.08 ± 8.04 a1284.43 ± 18.71 c15.9 ± 0.34 c
Note: Data are presented as means ± SE (n = 3). Here, n = 3 represents the three independent replicate aquaponic systems per treatment. For plant growth and quality parameters, each replicate value is derived from the mean of 3 randomly selected plants per system. Different lowercase letters within the same column indicate significant differences among treatments based on Duncan’s multiple range test (p < 0.05).
Table 5. Leaf tissue mineral content in each treatment group (dry weight basis).
TreatmentCKT1T2T3
P (mg/100 g)124.64 ± 0.92 c134.58 ± 0.76 b147.12 ± 1.42 a138.20 ± 0.76 b
S (mg/100 g)113.34 ± 2.00 d134.86 ± 2.07 c147.75 ± 0.17 b165.72 ± 1.33 a
K (mg/100 g)1957.12 ± 6.65 d2008.77 ± 9.92 c2437.69 ± 14.74 b3728.90 ± 6.89 a
Ca (mg/100 g)640.51 ± 19.56 a527.05 ± 8.62 b449.81 ± 11.41 c398.72 ± 7.06 d
Mg (mg/100 g)300.55 ± 6.28 a277.89 ± 1.36 b250.77 ± 1.39 c265.96 ± 0.39 b
Fe (mg/100 g)21.93 ± 3.31 c22.09 ± 0.68 c37.29 ± 0.40 b47.75 ± 1.85 a
Mn (mg/100 g)4.12 ± 0.04 c4.71 ± 0.05 b5.49 ± 0.05 a4.80 ± 0.01 b
Zn (mg/100 g)1.04 ± 0.02 b1.14 ± 0.01 b1.44 ± 0.01 a1.39 ± 0.05 a
Cu (mg/100 g)0.1457 ± 0.0012 c0.172 ± 0.0006 b0.214 ± 0.0080 a0.2253 ± 0.0050 a
B (mg/100 g)2.89 ± 0.03 a2.67 ± 0.03 b2.47 ± 0.03 c2.19 ± 0.03 d
Mo (mg/100 g)0.044 ± 0.0006 d0.048 ± 0.0006 c0.052 ± 0.0006 b0.0567 ± 0.0003 a
Note: Data are presented as means ± SE (n = 3). Here, n = 3 represents the three independent replicate aquaponic systems per treatment. For plant growth and quality parameters, each replicate value is derived from the mean of 3 randomly selected plants per system. Different lowercase letters within the same column indicate significant differences among treatments based on Duncan’s multiple range test (p < 0.05).
Table 6. Growth performance of fish in each treatment group.
ParameterCKT1T2T3
IW (g)123.6 ± 0.75 a125.65 ± 0.79 a125.25 ± 0.31 a125.33 ± 0.28 a
FW (g)168.2 ± 0.75 d174.05 ± 0.79 b176.65 ± 0.31 a171.33 ± 0.28 c
IBL (cm)18.67 ± 0.04 a18.64 ± 0.10 a18.59 ± 0.05 a18.69 ± 0.08 a
FBL (cm)22.59 ± 0.15 c23.33 ± 0.07 b25.18 ± 0.07 a23.47 ± 0.05 b
WGR (%)36.08 ± 0.21 c38.51 ± 0.24 b41.04 ± 0.10 a36.70 ± 0.08 c
SGR (%)0.44 ± 0.0020 c0.46 ± 0.0022 b0.49 ± 0.0009 a0.45 ± 0.0008 c
FCR1.98 ± 0.0146 a1.85 ± 0.0146 b1.76 ± 0.0089 c1.95 ± 0.0087 a
PER1.98 ± 0.0208 c2.15 ± 0.0115 b2.29 ± 0.0117 a2.04 ± 0.0203 c
SR (%)100%100%100%100%
Note: Data are presented as means ± SE (n = 3). Here, n = 3 represents the three independent replicate tanks per treatment. Growth performance indices (WGR, SGR, FCR, and PER) were calculated on a per-tank basis to ensure statistical independence. Different lowercase letters within the same column indicate significant differences among treatments based on Duncan’s multiple range test (p < 0.05).
Disclaimer/Publisher’s Note: The statements, opinions and data contained in all publications are solely those of the individual author(s) and contributor(s) and not of MDPI and/or the editor(s). MDPI and/or the editor(s) disclaim responsibility for any injury to people or property resulting from any ideas, methods, instructions or products referred to in the content.