Article

Optimizing Nitrogen, Phosphorus, and Potassium Use Efficiency in Temperate Vegetable Production in Latvia’s Agroecological Conditions

Institute of Horticulture, Graudu Iela 1, Ceriņi, Krimūnu Pagasts, LV-3701 Dobele, Latvia
*
Author to whom correspondence should be addressed.
Horticulturae 2026, 12(5), 567; https://doi.org/10.3390/horticulturae12050567
Submission received: 17 March 2026 / Revised: 23 April 2026 / Accepted: 28 April 2026 / Published: 6 May 2026
(This article belongs to the Special Issue Nutrient Uptake and Efficiency of Horticultural Crops)

Abstract

Optimizing nutrient uptake efficiency (NUE) through an understanding of system-level dynamics and crop-specific physiological thresholds is essential for the resilience of North European vegetable production under shifting climatic conditions. This study evaluated the uptake and efficiency of macro- and secondary nutrients (N, P, K, Ca, Mg) in cabbage, carrot, red beet, and onion over a five-year period (2021–2025) in Latvia, comparing organic and integrated management systems. It was hypothesized that NUE on commercial farms is currently suboptimal due to standardized bulk applications and that systems integrating sustainable practices would demonstrate higher nutrient uptake efficiency than those relying exclusively on mineral fertilization. The results revealed a notable yield–input divergence, where increased fertilization rates failed to provide proportional yield gains, as evidenced by the lack of a strong linear relationship (R2 < 0.07) and variable correlation coefficients (e.g., r = 0.52 for N in cabbage and r = −0.47 for Ca in carrot). These findings suggest that abiotic stressors and technical constraints may outweigh the influence of nutrient volume alone. This divergence was less pronounced in organic farming systems compared to integrated ones and varied notably by crop. Such species-specific responses indicate a complex role for mineral nutrition in root crops that requires further physiological investigation. No consistent differences in nutrient concentrations were observed between farming systems, indicating that inter-annual climatic variability is the dominant driver of nutrient dynamics. Furthermore, the integration of green manures and supplemental irrigation triggered extreme apparent system-level N-NUE values (exceeding 500% in some cases), reflecting the successful mineralization of legacy nitrogen and enhanced mass flow to the root zone. The study concludes that current fertilization methodologies in the Baltic region may lead to over-application. To ensure climate-resilient horticulture, management strategies must transition toward balancing ionic ratios (Ca:K) and synchronizing inputs with specific crop removal rates, rather than relying on standardized bulk applications.

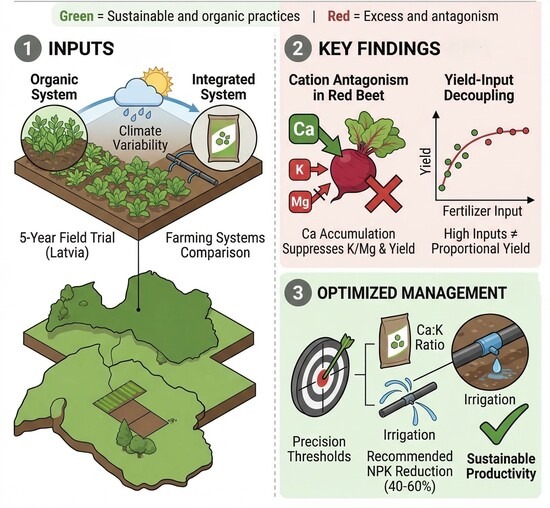
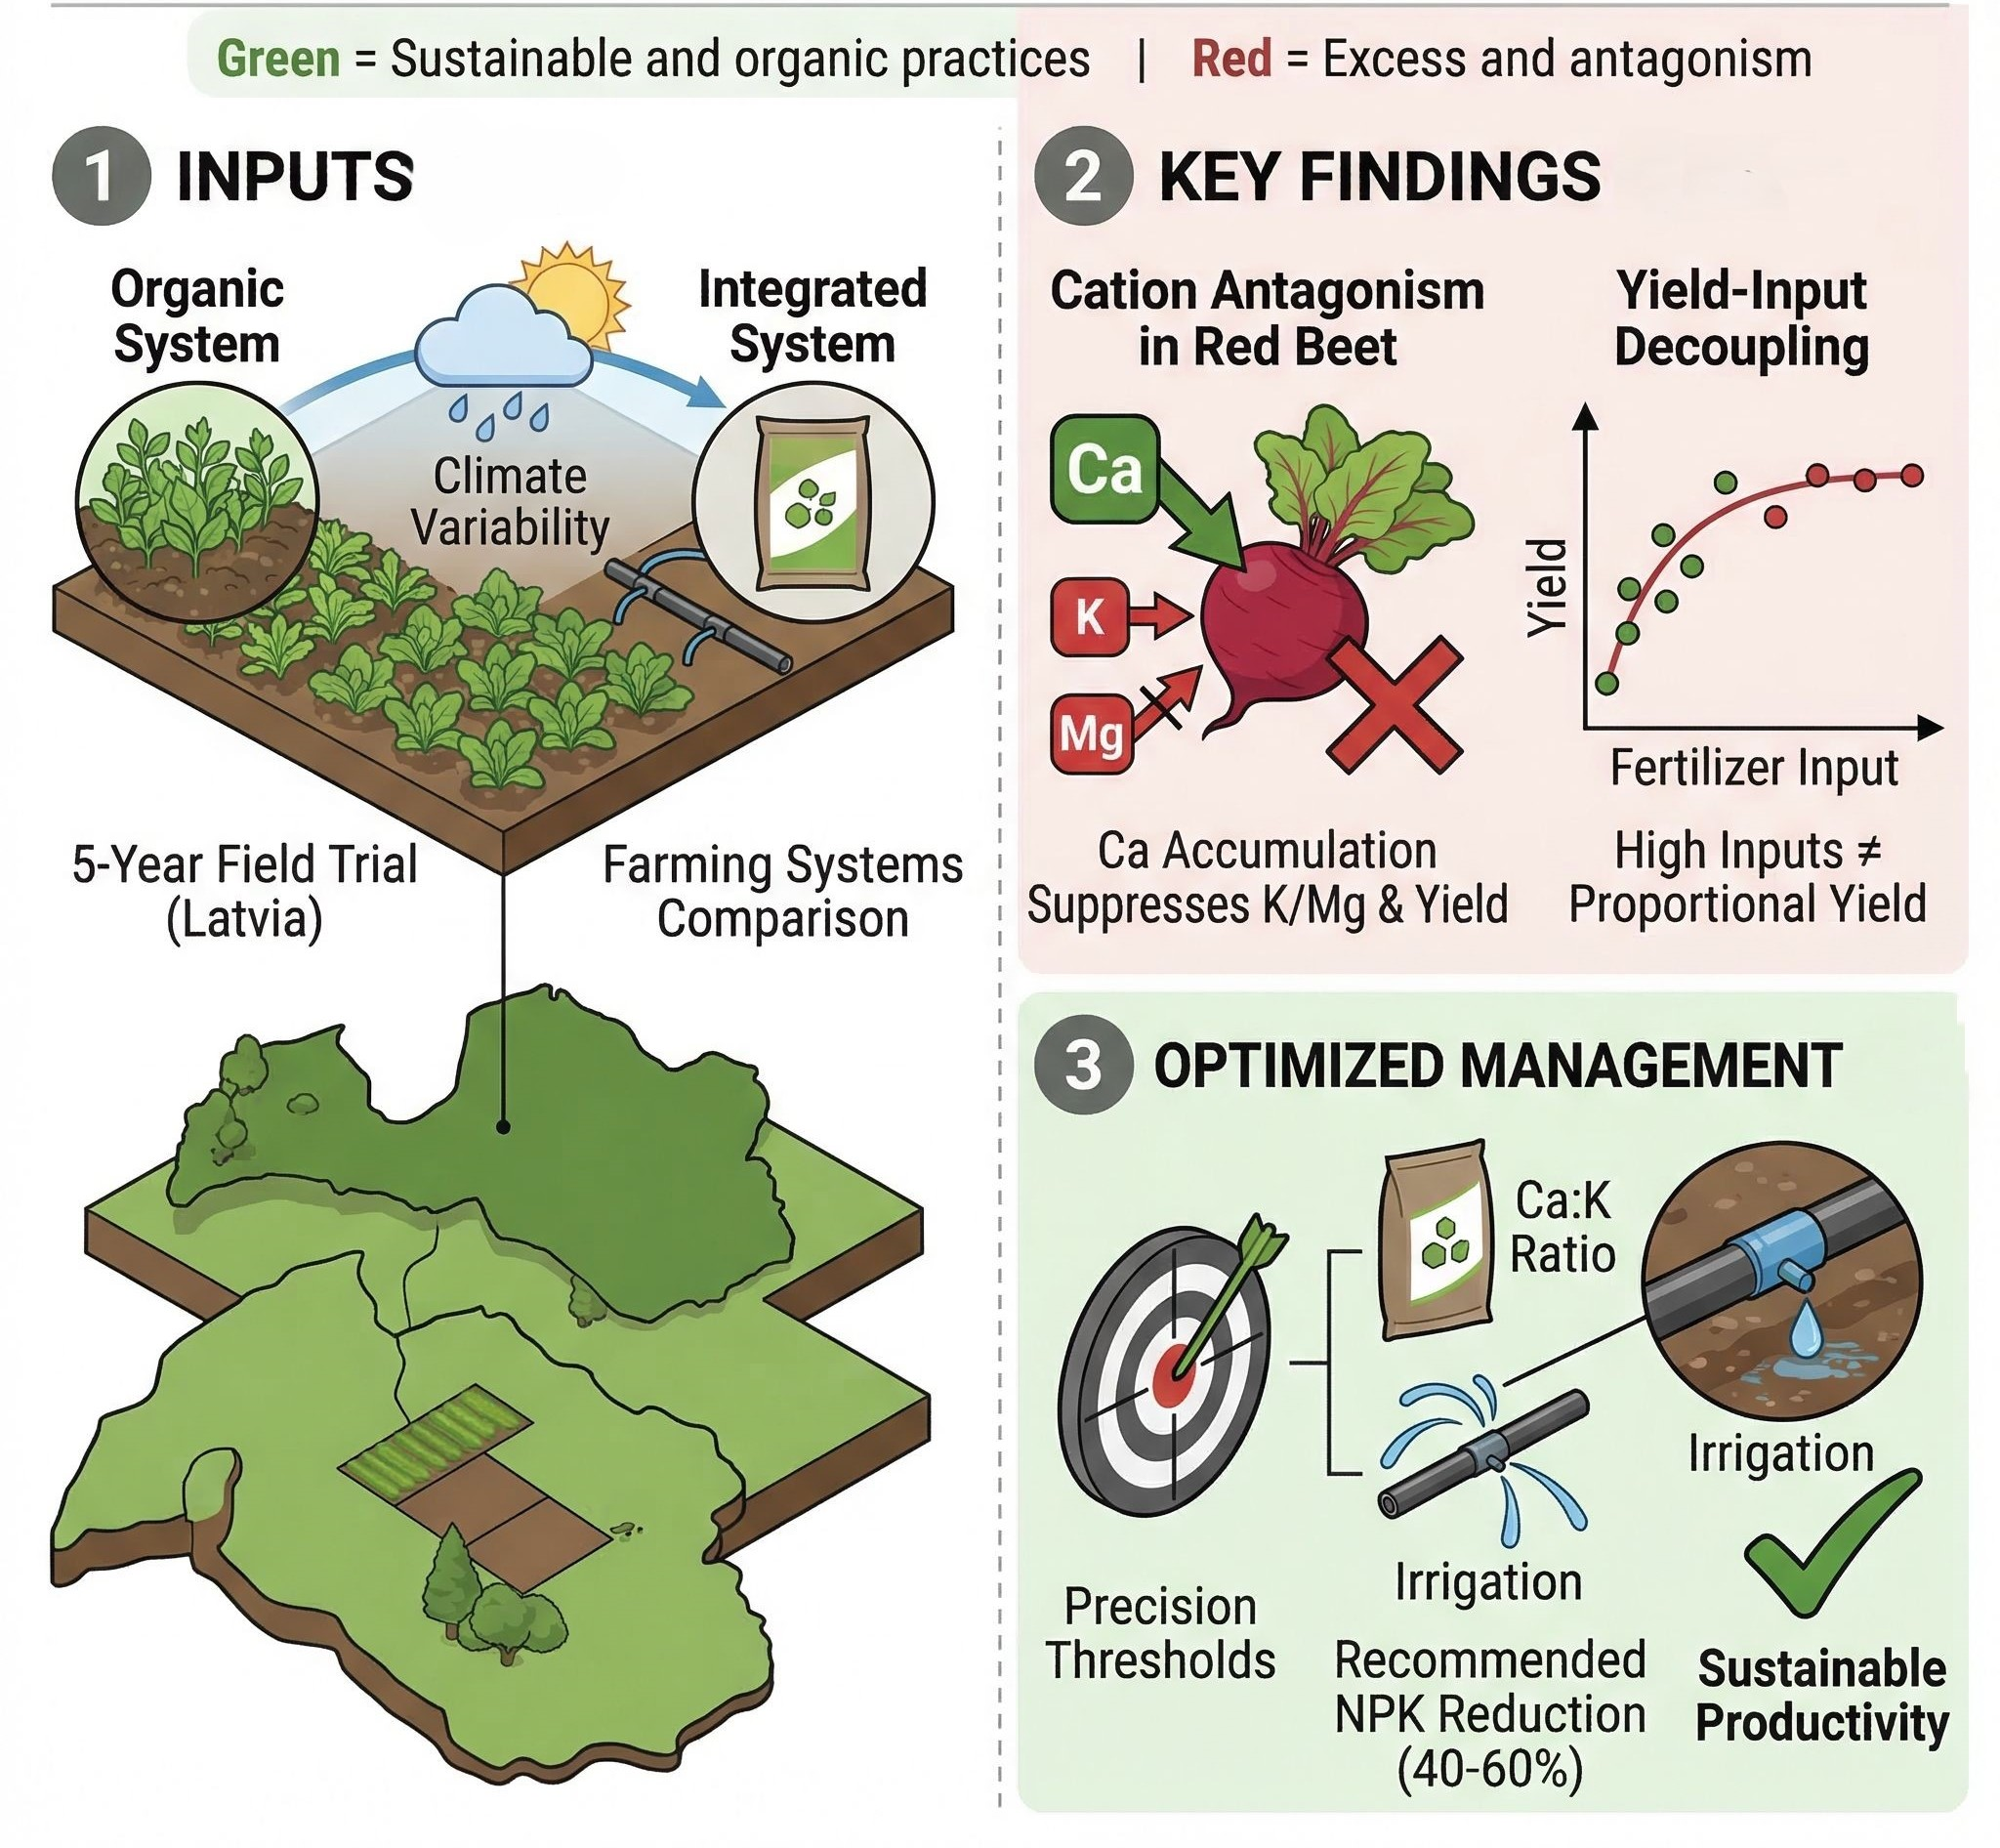
Graphical Abstract

1. Introduction

Agriculture is estimated to contribute 70–90% of nitrogen and 60–80% of phosphorus inputs to the Baltic Sea, thereby driving widespread eutrophication [1]. The situation is further exacerbated by intensive agricultural practices across the region. As a result, the overuse of fertilizers not only reduces nutrient use efficiency in agricultural systems but also contributes to soil degradation and environmental problems such as algal blooms, oxygen depletion, and deterioration of water quality. Therefore, balanced fertilization and improved nutrient management practices are essential to minimize nutrient losses and maintain both agricultural productivity and environmental sustainability [2].
Despite regional initiatives and policy frameworks, diffuse agricultural pollution remains difficult to manage due to its dispersed sources and the significant lag time between nutrient application and observable environmental effects [3]. Consequently, improving the nutrient uptake efficiency (NUE), particularly of nitrogen (N), phosphorus (P), and potassium (K), has become a critical objective in sustainable farming practice. Enhancing NUE not only supports higher crop productivity and profitability but also reduces nutrient runoff, thereby safeguarding ecosystems, and may confer societal benefits through reduced greenhouse gas emissions, thus mitigating climate change [4]. Developing sustainable fertilization strategies that optimize nutrient uptake while minimizing environmental losses is essential to balancing agricultural production with ecological preservation in the sensitive region of the Baltic Sea.
Cabbage (cultivated on 600 ha), carrot (450 ha), onion (450 ha), and red beet (240 ha) represent the most widely cultivated vegetable crops in Latvia. Due to their extensive acreage and intensive nutrient requirements, these crops are the primary drivers of agricultural nutrient consumption, meaningly influencing the regional ecological and environmental footprint. The efficiency of mineral nutrient (NPK) use in these vegetable crops has been insufficiently studied under temperate-climate conditions, despite its relevance to yield and quality optimization. Previous studies have shown that N, P, and K fertilization significantly affects morphological and physiological parameters, with balanced nutrient application enhancing plant biomass and yield [5,6]. However, the predominant focus in the scientific literature has been on increasing crop yields through higher fertilizer application rates, although some studies report that vegetable yields can be maintained even with reduced fertilizer inputs [7,8,9]. Importantly, not all applied nutrients are absorbed by crops [4]; over-application remains a common practice among vegetable growers, partly to ensure yield stability. Valenzuela (2024) emphasizes that the relatively high fertilizer application rates in vegetable production may explain the globally low nutrient use efficiency observed for these crops compared to cereals and other lower-value crops [9]. Low nutrient use efficiency in vegetables is mainly caused by their shallow root systems and relatively short vegetation period, and unfavorable growing conditions during the season, such as dry weather and limited precipitation extremes [10]. The efficiency of nutrient uptake in vegetable crops is also governed by the interplay between soil nutrient mobility and species-specific physiological traits. Differences in root architecture—ranging from the deep, nutrient-mining taproots of carrots to the high-density lateral systems of brassicas and shallow onion roots—determine the volume of soil explored and the plant’s capacity to intercept mobile ions like NO3 via mass flow [11,12]. Furthermore, crop productivity is dictated by sink–source dynamics, where the internal translocation of carbohydrates to harvestable organs depends on maintaining a precise ionic balance. Disruptions in this balance, often caused by cation competition or climatic interference with transpiration, can restrict nutrient flux regardless of soil fertility levels [13]. Understanding these mechanistic constraints is essential for interpreting the divergence between nutrient application and actual yield outcomes in high-latitude agroecosystems.
Globally, considerable quantities of mineral fertilizers are applied annually in crop production [9,14]. In European vegetable production systems, fertilizer inputs typically range between 100 and 300 kg ha−1, with Latvia applying approximately 111 kg ha−1 [7]. Despite having a relatively low fertilizer application rate compared with other European countries, recent research by Müller-Karulis et al. (2024) [15] highlights notable legacy N and P pools in agricultural lands across the Baltic Sea region. This indicates substantial potential for biologically and economically viable reductions in fertilizer use, if strategies to increase fertilizer efficiency are identified and implemented.
Evidence also suggests that integrated fertilization practices—combining mineral (N, P, K) and organic amendments—can improve nutrient uptake efficiency [16,17]. The integration of green manures into vegetable rotations serves as a critical driver of nutrient availability, often providing between 100 and 200 kg N ha−1 through the mineralization of biomass. Comparative studies indicate that while mineral fertilizers offer immediate nutrient availability, green manures exhibit a superior long-term nitrogen recovery efficiency due to the synchronized release of nutrients with crop demand and the enhancement of soil microbial activity. In Northern European climates, the mineralization of leguminous green manure can meet up to 40–60% of the nitrogen requirements for high-demand crops like cabbage, significantly reducing the reliance on synthetic inputs. Consequently, the exclusion of these organic N fluxes from traditional efficiency calculations often results in ‘apparent’ NUE values that exceed theoretical limits, reflecting the mobilization of legacy nitrogen rather than the inefficiency of the system [18,19,20,21]. In addition to full-season green manure, shoulder-season cover crops are grown during periods when the soil would otherwise be fallow, typically after the main crop is harvested in late summer/early fall and before planting of the next crop in early spring. They are not grown for commercial purposes but to act as ground cover and green manure [4]. To further enhance sustainability, organic production systems serve as a framework for a systemic approach to nutrient management. This strategy integrates diverse elements, including green manure, intercropping, proper crop rotation, biological diversity, and organic fertilizers [22]. Organic systems can achieve comparable or higher system-level NUE through reduced losses, though crop-specific yields and metrics notably vary compared with conventional/integrated systems [23].
From 2021 to 2025, the Institute of Horticulture (LatHort) conducted a research project titled “Optimization of fertilizer application for widely cultivated field vegetables in Latvia to ensure sustainable technologies,” supported by the Ministry of Agriculture of the Republic of Latvia. The study aimed to monitor and evaluate existing nutrient management practices in both integrated and organic Latvian vegetable farms. While NUE has been studied extensively on a global scale, its dynamics at the system level and within the specific context of North European agroecosystems—characterized by short growing seasons, high inter-annual climatic variability, and substantial legacy soil nutrient reserves—remain insufficiently documented. In Latvia, empirical data regarding the long-term interaction between organic amendments and mineral fertilization in commercial vegetable production are particularly scarce. This study addresses this regional gap by evaluating nutrient uptake across diverse management systems over a continuous five-year period (2021–2025). It was hypothesized that NUE on commercial farms in Latvia conditions is currently suboptimal due to standardized bulk applications and that systems integrating sustainable practices—such as green manure, organic fertilizers, and controlled irrigation—would demonstrate prominently higher nutrient uptake efficiency than those relying exclusively on mineral fertilization. This article presents the findings of that research.

2. Materials and Methods

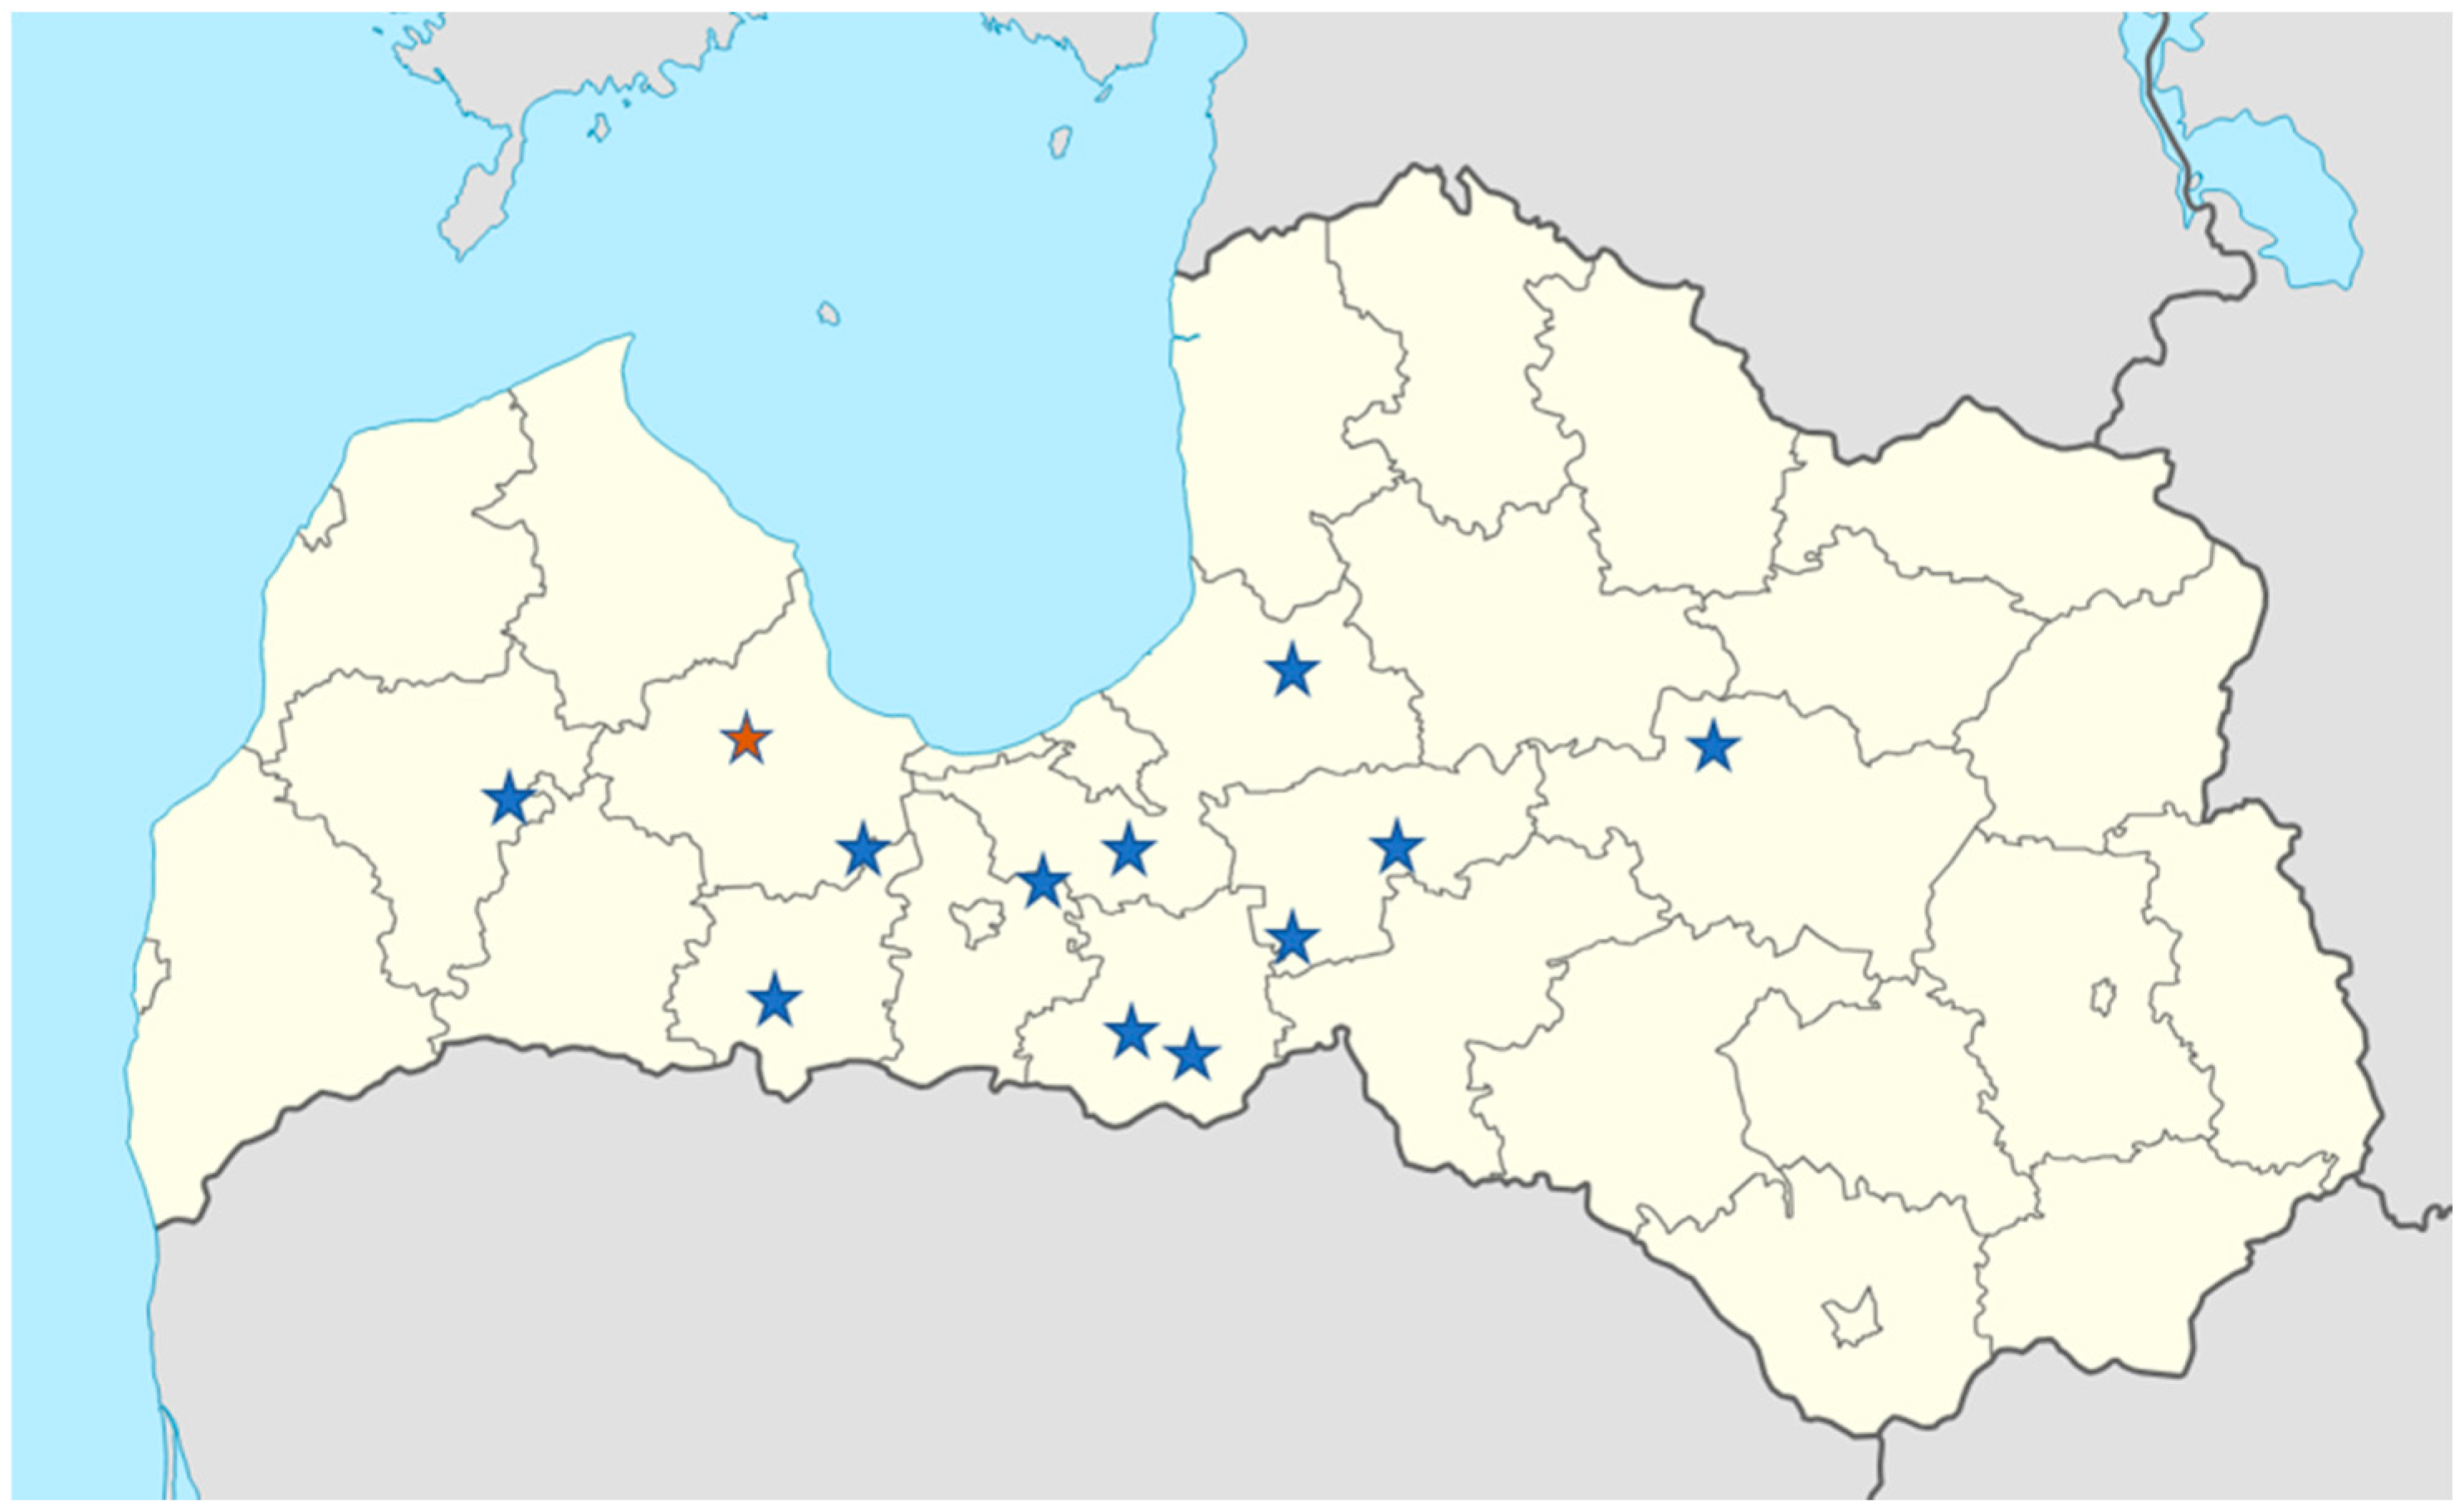
Three organic and eight integrated farms across Latvia were selected for monitoring, representing the regions of vegetable growing in the country (Figure 1), to assess fertilizer rates, soil agrochemical composition, nutrient content in the plants, and vegetable yield (productive parts and residues as well). Similar parameters are also detected in the trials located in LatHort in the Tukums region (57°03′45.9″ N 22°55′08.1″ E). The presented data were collected over five successive growing seasons from 2021 to 2025.
The farming systems evaluated in this study are categorized into two distinct management regimes: organic and integrated. The ‘integrated’ category comprises commercial farms officially registered under the Latvian National Integrated Fruit and Vegetable Production scheme (Cabinet Regulation No. 1056). While these systems strictly adhere to mandatory Integrated Pest Management protocols, their nutrient management strategies are functionally equivalent to conventional mineral fertilization practices. Consequently, the integrated group serves as the regional benchmark for high-input, technology-driven production, contrasting with the organic systems, which rely primarily on biological nitrogen fixation and organic amendments. Regarding irrigation, it should be noted that limited irrigation infrastructure is characteristic of vegetable production in Latvia, where only a small number of farms have irrigation systems. Among the monitored farms, only one (No. 4) and the LatHort trial applied irrigation, meaning that weather conditions—particularly precipitation—had a notable influence on nutrient uptake in most farms, thereby affecting the data used for calculations. Therefore, precipitation patterns are particularly important when analyzing meteorological conditions. Furthermore, it is important to distinguish the LatHort experimental trials in which proper crop rotation was maintained. This included two years of incorporated green manure and the consistent use of winter catch crops (rye) across all plots—practices that were not uniformly applied across the monitored commercial farms. Plants were sown or planted according to the common practice in commercial growing. Cabbage in Latvia is usually planted at the end of April/beginning of May. Plantlets are mostly grown on-farm. The varieties observed in the trials were late-maturing, mostly harvested in October. The varieties in the trial differed between the farms; for example, cabbages included ‘Zenon’, ‘Storidor’, ‘Professor’, and ‘Holsteiner Platter’. This genotype diversity should be considered when analyzing the data for all monitored crops.
Carrots were sown in the period of April–May depending on the region and farm, mostly for a late harvest in October. Carrots were grown on beds in three to five rows depending on the farm. Different varieties were grown in farms: ‘Narbonne’, ‘Nazareth’, ‘Rodelica’, and ‘Cadace’.
Onions in the majority of commercial plantations in Latvia are planted in sets at the beginning of May and harvested in August, depending on the variety and meteorological conditions. Different varieties were grown in the monitored farms—‘Contado’, ‘Sturon’, ‘Centurion’, and ‘Stuttgarten Riesen’.
Red beet in Latvia is usually sown in May, when the temperature becomes stable and does not drop below 0 °C, and harvested in September. The varieties grown in farms were ‘Subeto’, ‘Pablo’, ‘Bresko’ and ‘Jannis’.
Soil agrochemical analyses for all farms were performed three times per vegetation period:
-
Basic analysis, detecting soil pH, OM, P, K, Ca, Mg, S, B, was performed twice per season—in spring (before vegetation period—in April) and in autumn (at the harvest time or shortly after it in September–October);
-
Mineral nitrogen content (in the form of N-NH4 and N-NO3) was detected three times per season—simultaneously with basic analyses and one additional time in July (in the period of the intensive vegetative growth).
Soil sampling was standardized at a depth of 0–25 cm, representing the full depth of the primary tillage layer (Ap horizon). This depth was selected as it encompasses the zone where mineral fertilizers, green manures, and organic amendments are homogenized through cultivation. While root architecture varies by species, the 0–25 cm layer is the most biologically active zone for nutrient mineralization and the primary reservoir for plant-available P, K, and secondary macronutrients.
Agrochemical analyses were performed in a certified laboratory of the State Plant Protection Service according to accredited testing methods (available at: https://www.vaad.gov.lv/en/services/agronomic-analysis-soil-laboratory, accessed on 5 April 2026) in accordance with ISO/IEC 17025 [24]: soil acidity (pH KCl) was determined potentiometrically in a 1:5 (v/v) suspension of soil in 1 M KCl according to LVS EN 15933:2012 [25]; organic matter (OM) was determined according to LVS EN 13039 [26]; mineral nitrogen (N-NH4, N-NO3) was determined in a 1 M KCl extract following ISO 14256-2 [27]; for P2O5, K2O, Ca and Mg, we used the Egner–Riehm protocol with 0.02 M calcium lactate (LVS 010:2010) [28]; S was measured as water-soluble or exchangeable sulfates (S-SO42−) extracted in deionized water or a 0.01 M CaCl2 solution (1:5 ratio), according to ICP-OES [29] (ISO 11048) [30]; B was determined using Hot Water Extraction—the soil was boiled in a dilute CaCl2 solution according to ICP-OES [31].
To detect the element uptake, the total plant biomass was divided into harvested fresh vegetable crop and residues (leaves, roots and stalks), and weighed on the harvest day. The concentrations of main nutrients (N, P, K, Ca, Mg) in plants were detected at the Institute of Biology of Latvia University. To determine macro- and micronutrient levels, the plant material was oven-dried at 60 °C, ground using a laboratory mill, dry-ashed in concentrated HNO3 vapors, and the ash was dissolved in a 3% HCl solution. Wet digestion in H2SO4 and HNO3 was used for N and Sulfur (S) detection, respectively. Levels of K, Ca and Mg were analyzed by a microwave plasma atomic emission spectrometer (MP-AES, Agilent 4200; Agilent Technologies; Agilent 4200 MP-AES. Santa Clara, USA, 2014). The concentrations of N, P and Boron (B) were measured by colorimetry—N by a modified Kjeldal method using Nessler’s reagent in an alkaline medium, P by ammonium molybdate in an acid-reduced medium, and B by hinalizarine in a sulphuric acid medium—whereas S was determined by turbidimetry after adding BaCl2, using a JENWAY 6300 spectrophotometer (Jenway (Cole-Parmer); Stone, United Kingdom, 2011), as described previously [32,33].
Detailed records of fertilizer quantities and formulations were provided by participating farmers for each crop and growing season. While management practices varied across sites, a common strategy involved a basal application prior to crop establishment, followed by side-dressing focusing on N, S, and micronutrients. Total application rates for each macro- and micronutrient were calculated based on the elemental composition of the fertilizers used and expressed as kilograms of pure element per hectare. Due to the extensive volume of these data, they are not presented in full within this manuscript but are available in the Supplementary Materials.
The total yield from each field was provided by farmers and expressed in tons per hectare (t ha−1). This value was used to estimate nutrient output and NUE, as well as to analyze the correlation between yield and fertilizer doses applied for each crop, farm, and year.
Nutrient uptake was calculated for each element within different biomass components—harvested crops and residues—and expressed as kilograms of element per ton of crop and as kilograms of element per hectare. Total nutrient uptake per whole plant was used to calculate NUE and to calculate the suggested fertilization rates.
Nutrient uptake efficiency (NUE): Conventional agronomic indices typically evaluate the immediate efficiency of applied fertilizers. These include Partial Factor Productivity (PFP = Yield/Applied Fertilizer) and recovery efficiency (RE = (Uptake − Uptake (control))/Applied Fertilizer). These metrics are designed for controlled trials where a zero-fertilizer control plot is present. In contrast, in our study, system-level NUE is calculated. It was calculated using a modified version of the Partial Nutrient Balance (PNB) formula as described by Fixen et al. [34] and nutrient uptake/recovery efficiency [35]. According to Fixen and colleagues, PNB is expressed as the ratio of nutrient uptake to nutrient input, indicating the amount of nutrients removed from the system relative to the amount applied. Weih and colleagues referred to NUE as the relation between aboveground plant nutrient amount and available nutrients in the soil, plus the amount given by fertilizers. In our calculation, NUE accounted for all plant parts, including non-productive parts/residues/roots, while nutrient input comprised the amount of each nutrient applied via fertilizers plus the nutrients available in the soil in 1 ha at a depth of 0.25 m (kg ha−1) according to the soil analyses at the start of the growing season. Therefore, the NUE values reported herein represent a Total System Available Nutrient Efficiency approach. Consequently, NUE values in our research are interpreted as the net mining of soil legacy reserves and the mineralization of organic amendments. This approach provides a more holistic view of nutrient cycling in Latvian commercial vegetable production than traditional fertilizer-centric indices. Thus, the formula used to calculate the system-level NUE in this study was developed accordingly:
Element   uptake   by   crop   yield   and   nonproductive   parts Available   amount   of   element   ( fertilizer + detected   in   the   soil ) = NUE
Study limitations and trial layout: This research was conducted using a multisite observational monitoring approach and is classified as an exploratory study. Unlike controlled experimental trials, this framework did not utilize randomization or replication within single sites, leading to inherent risks of pseudo-replication. Confounding variables—including genotype variability (cultivar differences), management heterogeneity (farm-specific practices), and environmental gradients—were not statistically controlled. However, this approach was selected to maximize ecological validity, providing a realistic assessment of nutrient dynamics and crop performance under actual commercial production conditions in the boreal climate of Latvia.
The variability of meteorological parameters, yield, and nutrient uptake across regions (spatial) and the five-year study period (temporal) was quantitatively described using the Coefficient of Variation (CV%)—calculated as the ratio of the standard deviation to the mean—and standard deviation (SD). Confidence intervals (CIs) at the 95% level were calculated across all monitored sites and years for each farming system to indicate the range of uncertainty for the estimated means. These metrics were used to evaluate the stability and spread of crop performance under real-world production conditions.
To detect biological trends, Pearson correlation analyses were used to assess relationships among nutrient application, crop uptake, and yield. Furthermore, linear regression modeling was employed to determine the strength of the relationship between nutrient inputs and crop productivity. This descriptive–comparative framework acknowledges inherent confounding factors, such as genotype variability and management heterogeneity, while prioritizing high ecological validity to capture the actual nutrient dynamics of the Latvian vegetable production sector.

3. Results

Meteorological conditions:
Notably, considerable variability in weather was observed both between regions and across growing seasons, and the results of this study therefore reflect the influence of agroecological conditions on plant nutrient uptake. To illustrate the differences between locations regarding the meteorological conditions across years, a sum of precipitation during the vegetation period, average, minimum, and maximum temperatures per regions, per year are summarized in Table 1, Table 2, Table 3 and Table 4.
Across the 2021–2025 observation period, precipitation and temperature patterns showed considerable inter-annual variability across the Latvian regions represented by monitored farms. (In Table 5, the corresponding nearest locations where meteorological data were collected are given.) Precipitation varied widely, with the driest year being 2023 (average 324 mm) with relatively low spatial variability (CV = 14.2%) and the wettest year being 2025 (average 466 mm), also showing low spatial variability (CV = 19.7%). Most regions experienced similar trends: higher rainfall in 2021 and 2025, and markedly lower amounts in 2022 and especially 2023. The wettest locations overall were Skrīveri and Madona—both exceeding 550 mm in their wettest years—while Dobele, Pūre, and Jelgava tended to be among the driest sites, particularly during 2021–2023. The year 2024 was the most uniform across regions regarding precipitation (CV = 4.8%).
Average temperatures showed a general warming trend through 2024, followed by a slight cooling in 2025, and no sharp differences between locations and years (CV does not exceed 6.6.%). The warmest year was 2024, with an average of 15.3 °C across regions. Temperatures peaked in Bauska, Jelgava, and Dobele, which consistently recorded the highest averages, while Madona and Saldus remained slightly cooler. In contrast, 2022 and 2025 were the coolest years, with average temperatures around 13.3–13.5 °C.
Maximum temperatures followed a similar trend, reaching their highest values in 2024. Regional peaks were not sharp (the highest CV = 2.1% in 2025), and ranged from 25.5 to 26.7 °C, with Bauska, Jelgava, and Dobele showing the highest extremes. The lowest maximum temperatures occurred in 2022, when values generally stayed below 23.5 °C. Minimum temperatures also rose gradually toward 2024, the year with the highest average minimum (5.7 °C), before decreasing again in 2025. The coldest minima appeared in 2022, especially in Madona and Pūre, where values fell to around 2.5–2.8 °C. Minimum temperatures showed high spatial variability (CV reaching 21.1% in 2022), suggesting that frost risks and nighttime recovery periods varied drastically between sites, potentially influencing the metabolic efficiency of nutrient uptake.
The observed climatic fluctuations, particularly the moisture deficits in 2022 and 2023 followed by the warmer, wetter conditions in 2024 and 2025, provided a diverse environmental background for assessing crop nutrient response. This variability is statistically reflected in the low coefficients of determination (R2) found between nutrient application rates and yields. In years of precipitation extremes, the influence of mass flow and transpiration-driven nutrient transport likely superseded the influence of total soil nutrient concentration, creating a non-linear crop response to fertilization across the monitored integrated and organic systems.
Yield and its response to nutrient application:
In line with the exploratory nature of this monitoring, the yield data (Table 5) demonstrated high inter-farm and inter-annual variability. The extreme diversity in yields is quantified by high Coefficients of Variation (CVs) across all crops. This heterogeneity is determined by the diverse environmental conditions characteristic of commercial vegetable production in Latvia, including abiotic stressors such as prolonged drought periods, low spring temperatures, and extreme precipitation/drought events. Furthermore, the broad spectrum of cultivars utilized and the limited availability of irrigation systems notably influenced both yield outcome and crop quality.
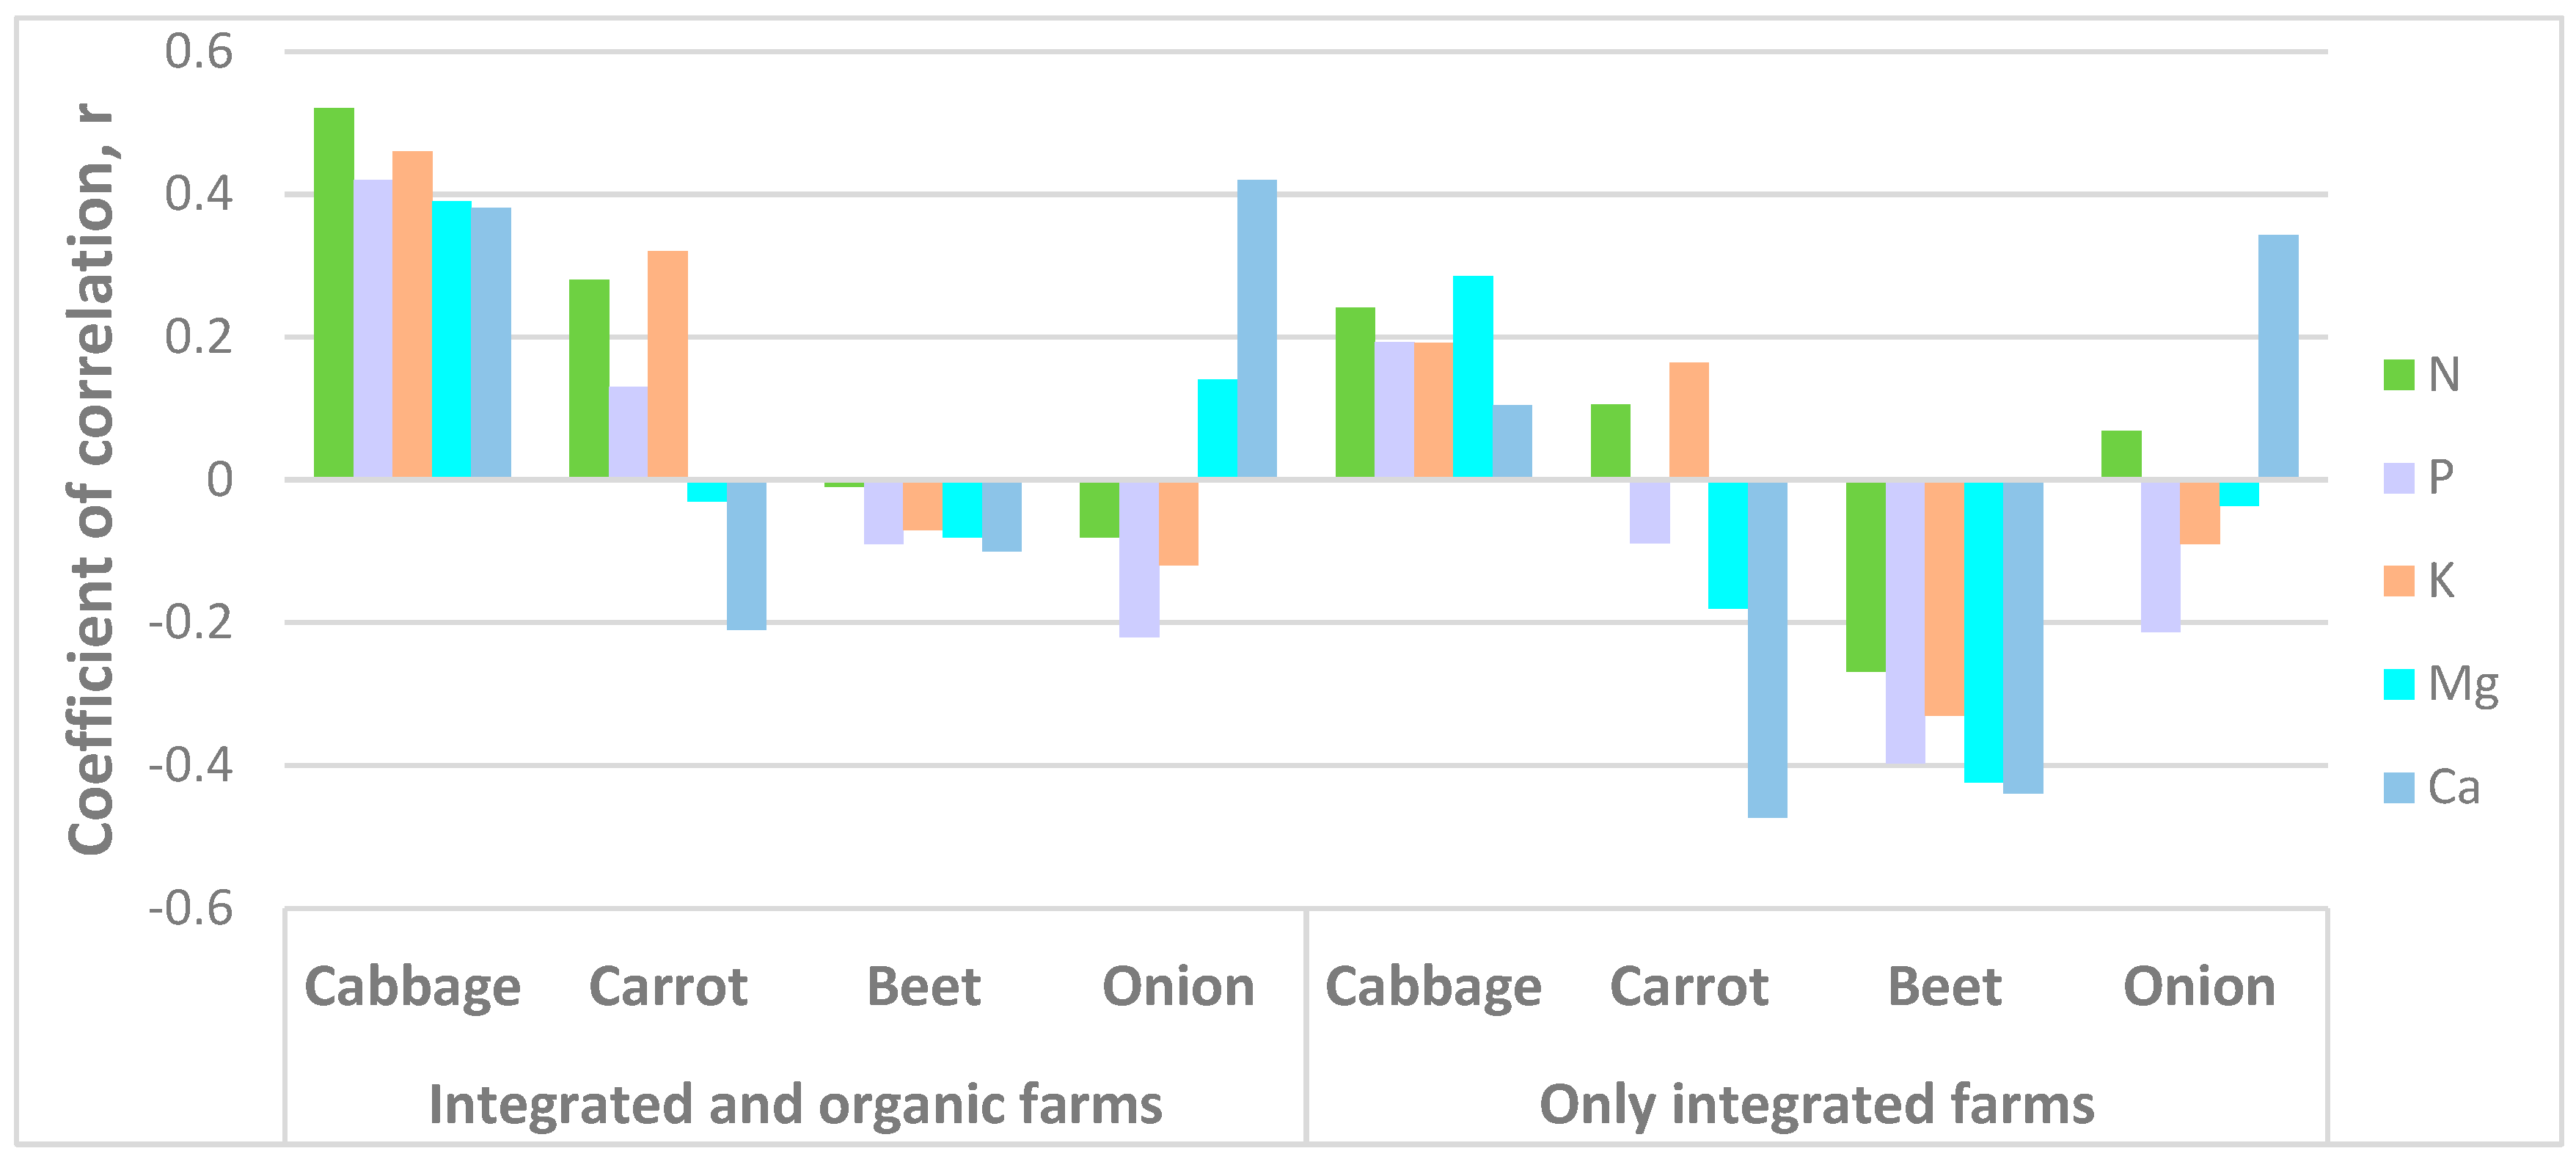
Preliminary observations indicated a non-linear relationship between nutrient inputs and productivity; specifically, increased fertilization rates did not consistently ensure higher crop outputs. To elucidate this lack of correspondence, Pearson correlation analyses were performed to quantify the relationship between nutrient application and yield. The data presented in Figure 2 indicate a divergence of fertilizer application rates and yields for all nutrients in red beet, as well as for N, P, and K in onion, when aggregating integrated and organic systems. When the analysis was restricted to only integrated farms, the positive correlations weakened notably; furthermore, several nutrients exhibited a shift toward substantial negative correlations.
The coefficients of determination (R2) derived from the linear regression analysis (p < 0.05) indicate that fertilizer application rates had a negligible influence on total crop yields across the combined dataset for 2021–2025 (Table 6).
Regression analysis confirmed a weak linear relationship (with R2 values predominantly below 0.10), suggesting that while a slight correlation exists, the majority of the variance in yield was driven by factors other than nutrient input. An exception was observed for Ca fertilization in carrot, which exhibited the only moderate relationship (R2 = 0.53) in an otherwise weakly correlated dataset.
Nutrient concentration and uptake in vegetable crops:
The main nutrient concentrations (N, P, K, Ca, Mg, S, B) in plants reported in the research show slight fluctuations across years, farms, and cultivars (Table 7). These parameters are strongly influenced by weather conditions, with drought periods alternating with severe precipitation periods. The year 2022 was the coolest, with relatively low precipitation, resulting in the lowest concentration of most elements in plants due to reduced uptake, especially of mobile nutrients (N, K). It should be noted that the highest N concentration across all crops was observed in 2021, when precipitation and temperature were moderate, thereby promoting mineral uptake. P content was the highest in 2025, while other elements fluctuated between crops and years.
No consistent trends favored higher nutrient concentrations in either organic or integrated systems. However, organic cropping systems showed greater variability in nutrient content across sites and years, as evidenced by wider ranges in those datasets. Cabbage consistently had the highest average N concentrations across both systems, with integrated cabbage averaging 4.56% and organic cabbage 4.69%. Both systems showed moderate instability in N levels (CV: 13.2% and 12.5%, respectively). Red beet showed the highest overall variability in several macronutrients, especially under organic management; notably, N (CV: 65.5%; CI: = 3.39; average: 3.26), Ca (CV: 61.6%; CI: 1.83; average: 1.87), and Mg (CV: 63.5%; CI: 1.26; average: 1.25) exhibited substantial fluctuations, suggesting that nutrient uptake in organic beets was highly sensitive to the environmental “noise” of specific growing seasons. K levels varied greatly across all crops, particularly in carrots, where the organic system recorded an extreme CV of 87.4% (CI: 4.0; average: 2.88) compared to 51.7% (CI: 2.95; average: 4.58) in the integrated system. P concentrations showed a general upward trend toward 2025 in integrated onions and carrots, though the high variability (CV up to 50% in the integrated system) indicates that localized soil moisture and legacy P availability likely outweighed the effects of applied fertilization rates. Micronutrient levels, such as those of B, remained relatively stable in integrated systems (CV: 7.1–18.5%), whereas organic systems exhibited more pronounced fluctuations, particularly in cabbage (CV: 30.8%) and red beet (CV: 37.1%).
Nutrient uptake calculations are based on nutrient concentrations in plants. The unit nutrient uptake (expressed in kg per ton of the crop) is calculated for the whole plant, separately for productive and non-productive parts (roots, stalks, leaves) (Table 8). The value of nutrient uptake by ton of crop is important for calculating fertilization rates and is a key factor influencing fertilization application rates. Therefore, it was compared to values used in fertilization calculations in Latvia according to “The Methodology for fertilization plan calculations” [36].
The unit nutrient uptakes (kg t−1) for cabbage, beet, carrot, and onion (Table 8) exhibit pronounced inter-annual variability, often deviating substantially from the standardized benchmarks provided by the “Methodology for fertilization plan calculations.” Across all monitored crops, N and K uptake tended to be notably higher than the methodological recommendations. For example, while the methodology suggests an N uptake of 3.00 kg t−1 for cabbage, actual values in integrated systems averaged 8.19 kg t−1, with a high temporal instability (CV: 38.9%). Organic systems followed a similar trend, though they showed a tendency toward lower N uptake in years of moisture deficit, such as 2022 and 2023. The data reveal that red beet exhibited the highest overall instability in nutrient accumulation under organic management, with N (CV: 75.1%; CI; 6.17; average: 5.17), Ca (CV: 60.9%; CI: 2.7; average: 2.79), and Mg (CV: 62.2%; CI: 1.88; average: 1.9) showing extreme fluctuations. Such high CV and CI values indicate that unit uptake in organic systems is highly susceptible to stochastic environmental factors and soil legacy effects. In contrast, K uptake in integrated carrots varied greatly (CV: 49.7%), peaking in 2023 (12.96 kg t−1), which further suggests a physiological response to osmotic stress during drought periods. P uptake remained relatively consistent with methodological values across most crops. These results indicate that current fertilization methodologies may not fully account for the wide range of actual nutrient removal occurring under modern commercial conditions in Latvia, supporting the observed decoupling between theoretical inputs and actual crop requirements. A comparative analysis between the experimental data and the ‘standard’ removal rates defined in “The Methodology…” revealed distinct patterns of nutrient sequestration. While P uptake values showed only minor deviations from the standard, the measured uptake of N and K was nearly two-fold higher than the coefficients traditionally used in fertilization calculations (except for K in onion). This discrepancy explains the notably high average system-level Nitrogen Nutrient Use Efficiency (N-NUE) values observed for cabbage, red beet, and carrot (Table 9). Similarly, the K-NUE values indicate high uptake efficiency for these three crops, suggesting that the plants capture a notably larger portion of available soil N and close to what is anticipated for K in current fertilization models.
It should be noted that the N-NUE values exhibited pronounced variability across crops, years, and management systems, with differences of nearly 50-fold across observations. This substantial range led to very large standard deviations and confidence intervals. Average N-NUE was notably high, frequently exceeding 100%, particularly in organic cabbage (146.6%), integrated beet (260.0%), and carrot (231.3%). These extreme values, peaking at 593.9% in integrated carrot (2025), indicate very high variability between locations and years, especially pronounced for beet and carrot in both systems and for onion in the organic system. P-NUE was relatively stable across locations and years, and remained the lowest among the primary macronutrients, with averages ranging from 3.5% in integrated onion to 11.9% in organic cabbage, reflecting the inherent restricted mobility and possible use of legacy P or high soil fixation of phosphorus. Conversely, K-NUE showed moderate efficiency, averaging between 10.3% and 44.0%, with integrated systems generally demonstrating more consistent potassium utilization in the root crops. K-NUE variability between locations and years was also moderately stable, with the exception of organic cabbage (CV: 43.5; CI: 54.77; average: 41.42) and integrated beet (CV: 40.3; CI: 32.46; average: 43.84). Secondary macronutrients Mg-NUE and Ca-NUE remained low across all treatments, with Ca-NUE rarely exceeding 1%, underscoring the limited recovery of these divalent cations relative to the total soil reservoir and applied amendments. For cabbage in both cropping systems and for organic beet, Mg-NUE values were highly variable across locations and years.
Nutrient concentrations and uptake exhibited significant spatiotemporal instability driven primarily by climatic stochasticity (e.g., drought-induced declines in 2022) rather than management systems. While no consistent “system effect” favored organic or integrated production, organic systems showed markedly greater variability in nutrient content and uptake, particularly for red beet and carrot. A critical finding is the quantitative decoupling between actual nutrient removal and the standardized Latvian fertilization benchmarks; specifically, N and K uptake were nearly two-fold higher than theoretical models. This discrepancy led to extreme system-level N-NUE values (frequently > 100%) on certain farms, indicating that vegetable yields there rely heavily on the mobilization of indigenous soil reserves and legacy nutrients rather than on mineral inputs alone.
Correlation analysis of nutrient uptake, NUE and crop productivity:
An analysis of inter-elemental correlations—identifying synchronized nutrient accumulation within plant biomass—revealed several distinct synergistic patterns (Table 10). Strong positive correlations were observed between Ca and Mg concentrations in carrot, onion, and red beet, while this relationship was present but less pronounced in cabbage. Additionally, K and Mg concentrations exhibited a positive correlation in both red beet and onion. Furthermore, a consistent positive correlation between P and K was observed across most of the analyzed species, indicating a coordinated uptake mechanism for these macronutrients.
Excessive Ca content reduces beet yield, which can be explained by cation competition for uptake into plant cells, thereby inhibiting the absorption of K and Mg. Contrary to this, the carrot yield increased with increased Ca uptake. Increased K uptake affects the yield formation of onion and beet.
To further confirm the importance of nutrient impact on yield formation, the correlation between the obtained yield and system-level NUE was calculated (Table 11).
When examining how closely NUE correlates with yield, as well as the inter-element correlations, it becomes clear that for beets, the supply of all nutrients is particularly important; likewise, in carrots, the contribution of all elements is important for yield formation. For cabbage, the correlation coefficient between N-NUE and yield was comparatively low, although cabbage exhibited a relatively high N-NUE (Table 10). This may be attributed to the wide variation in cabbage yields across farms and years. Nevertheless, the NUE values indicate that N is an important element for cabbage yield formation.
Ca and Mg utilization is tightly linked across all vegetable crops, as confirmed by the correlation coefficients in Table 12. The Ca:Mg ratio in plant tissues was closely related to soil Ca:Mg ratios, crop type, and soil management practices such as liming and pH adjustment [37,38]. In the present study, Ca and Mg utilization showed a strong and consistent relationship across all crops. The average Ca:Mg ratio across years, farms, and fields predominantly ranged from 6 to 8, supporting previous recommendations that an optimal soil Ca:Mg ratio lies between 6:1 and 8:1.
When analyzing the effect of the total amount of nutrients available to plants (soil-available nutrients plus those supplied with fertilization) on yield, the correlation between these variables was calculated (Table 12).
The results confirm the earlier assumption that in many cases fertilizers are applied inefficiently and, at times, unnecessarily. According to this correlation, excessively high N availability has a clearly negative effect on beet and onion yield. For carrots, the N availability does not correlate with yield. For onion and beet, K availability was close to optimal, indicating a positive influence on yield. For cabbage, the correlation between yield and the availability of all nutrients was positive but nonsignificant.
The correlation between NUE and plant availability for each element in soil was calculated across years and farms for each crop (Table 13).
The relationship between total nutrient availability (soil reservoir plus applied fertilizers) and NUE showed strong negative correlations across all studied crops (Table 13). The most pronounced inverse relationships were observed for N in onion (r = −0.78) and red beet (r = −0.73), and for K in onion (r = −0.74). These results provide statistical confirmation that as the total pool of available elements increases, the plant’s relative uptake efficiency decreases.
In summary, while some crops, such as red beet, showed higher nominal average concentrations in the integrated system, these differences were not statistically significant due to the high variance and overlapping 95% CIs. This indicates that management system effects were frequently masked by high spatiotemporal heterogeneity, particularly within the organic sector. However, organic systems exhibited higher spatiotemporal heterogeneity (CV > 25%) compared to integrated systems (CV < 18%). The consistently low R2 values across all crops suggest that mineral nutrient inputs were not the primary limiting factor for yield in the monitored vegetable farms, pointing instead to the dominance of environmental and site-specific drivers.

4. Discussion

As reported in the results, the lack of significant divergence between systems and the high spatiotemporal variability suggest that, given the exploratory nature of this monitoring, farm-level observations were used to identify broad regional trends rather than to draw definitive causal links between specific treatments. The findings indicate that increasing nutrient inputs does not elicit a proportional yield response, particularly within integrated farming systems. The observed divergence in yield with nutrient application (Figure 2) is consistent with the impact of intensified abiotic stressors, which potentially limit the efficacy of nutrient inputs. While the exploratory nature of this dataset and the high inter-annual variability preclude definitive causal inferences, the constantly low coefficients of determination support suggestive evidence of a yield–input divergence, indicating that under the monitored commercial conditions, fertilization rates were a secondary driver of productivity compared to stochastic environmental factors. Notably, the divergence was less pronounced in organic farming systems than in integrated ones and varied markedly by crop. Regression analysis confirmed a weak linear relationship in our system-level observation (R2 mostly below 0.1), indicating that although a slight correlation exists, most of the variance in yield is driven by other environmental and biological factors—such as precipitation, temperature, and soil microbiological activity—that have a primary influence on productivity, as reported in the literature [39,40]. Excessive nutrient concentrations in the soil solution can induce osmotic stress, impairing the plant’s ability to regulate water uptake and effectively utilize available minerals [41]. Consequently, under the fluctuating climatic conditions characteristic of the study period, higher fertilization rates likely intensified physiological stress rather than promoting yield formation.
Despite the distinct management philosophies for organic and integrated production, the elemental concentrations in the analyzed crops did not differ substantially between the two farming systems. This apparent lack of a ‘system effect’ on plant nutrient status is consistent with the findings of Murmu et al. (2013), who observed that conventional and organic nutrient management often yield comparable results in crop composition and soil fertility in the medium term [42]. Common trends linked with precipitation indicate that P concentrations peaked during the high-precipitation growing seasons of 2021 and 2025. This trend suggests that enhanced soil moisture levels facilitated greater P diffusion into the root zone, effectively overcoming the inherent immobility of phosphorus in the soil matrix. In contrast, K concentrations remained relatively stable over the five-year period, except during the drought-stressed 2022 season. The decline in K uptake during this dry period underscores its critical role as an osmoticum; limited water availability likely reduced K mass flow, thereby affecting the plant’s ability to maintain physiological homeostasis. N concentrations exhibited a marked response to rainfall distribution. In years characterized by warm, moist springs (e.g., 2021), higher N levels were observed across all crops, likely due to mineralization of the soil organic matter and green manure residues, which was further facilitated by optimal transpiration rates. Summarizing the climate influence on nutrient concentration, it can be assumed that climatic factors—specifically precipitation-induced nutrient mobility—exerted a primary governing influence. The synchronization of peak nutrient uptake with high-rainfall years provides empirical support for the dominance of environmental stochasticity over management philosophy in boreal vegetable production.
Nutrient uptake and removal by crops are key parameters for evaluating nutrient interactions within plants, uptake efficiency, and the overall nutritional requirements for crop development. When comparing the nutrient uptake of the monitored vegetable crops with values reported in the literature, our results were in many cases slightly higher than the reference values (e.g., those reported by the New England Vegetable Management Guide) [43]. This discrepancy may reflect differences in crop varieties, soil fertility, fertilization intensity, climatic conditions, and crop management practices across studies.
During the high-precipitation growing seasons of 2021 and 2025, a notable trend in increased P uptake was observed across the studied crops (Table 8). Enhanced soil moisture likely facilitated P diffusion to the root surface, supporting its fundamental role in cellular energy transfer (ATP) and metabolic phosphorylation. While K concentrations in plant tissues typically range between 2% and 6% [44], its consistent influence on yield—particularly in onion and red beet—highlights its indispensable role in physiological homeostasis. K serves as the primary osmoticum for stomatal regulation and a requisite cofactor for the activation of over 60 cytosolic enzymes involved in respiration and photosynthesis [13]. Furthermore, synergistic interactions between N and P were statistically evident (Table 10), corroborating established models of N–P stoichiometry. Adequate N availability enhances P uptake by stimulating root proliferation and the exudation of organic acids, while P deficiency conversely impairs N assimilation and protein synthesis [45]. Beyond its structural role, N acts as a systemic signaling molecule that modulates phosphate starvation responses to maintain a homeostatic N:P balance. Consequently, the synchronized availability of N, P, and K is essential to sustain the biochemical pathways required for successful reproductive development under fluctuating climatic conditions. Notably, excessive soil K levels can inhibit the uptake of other cations, emphasizing the importance of balanced fertilization. Specifically, elevated Ca concentrations (Table 7) may inhibit the absorption of K and Mg, thereby limiting physiological development [46]. Species-specific sensitivity to cation balance, particularly regarding Ca accumulation, was observed. In carrots, high leaf Ca concentrations (in some samples exceeding 5.6% in 2023 and 6.6% in 2025) did not suppress other essential cations; rather, K and Mg levels remained relatively stable. This suggests that carrot possesses a high physiological capacity for Ca accumulation, likely facilitated by the high adsorption capacity of its pectin-rich cell walls, which sequester Ca without disrupting intracellular ionic homeostasis [47]. This prevents ‘cavity spots’ and root splitting. Therefore, optimal Ca often leads to healthier, heavier roots rather than causing deficiencies in other elements [48]. In contrast, the associative trends in red beet were consistent with cation antagonism. As leaf Ca concentrations reached peak levels (e.g., for some samples 7.04% in 2022 and 6.65% in 2025), a relative suppression of Mg and K uptake was observed. Unlike the ‘calciotrophic’ behavior of carrot, the excessive accumulation of Ca2+ in red beet appears to competitively inhibit the uptake of Mg2+ and K+, a phenomenon frequently observed in the Chenopodiaceae family where skewed cation ratios can lead to metabolic imbalances and subsequent yield suppression [49,50]. This empirical divergence suggests that the yield–input relationship is governed more by species-specific nutrient stoichiometry than by the absolute volume of fertilizer applied. The high Coefficients of Variation across the dataset also confirm that plant nutrient status was governed by a complex interaction of systemic management and stochastic climatic factors rather than a linear response to fertilization. This strong co-dependency of Ca and Mg uptake implies that environmental factors or management practices that promote the uptake of one element, such as enhanced transpiration or soil liming, simultaneously facilitate the uptake of the other. These species-specific responses indicate a complex role for Ca in root crop nutrition that requires further physiological investigation. The absence of a linear relationship between fertilizer inputs and tissue concentration and outputs across the study period suggests that climatic factors—specifically precipitation-induced nutrient mobility—exerted a primary governing influence. The synchronization of peak nutrient uptake with high-rainfall years provides empirical support for the dominance of environmental stochasticity over management philosophy.
NUE is a critically important concept in the evaluation of crop production systems, as it integrates crop performance with environmental sustainability. The primary objective of nutrient management is to optimize crop nutrition to achieve economically viable yields while minimizing nutrient losses from the field [18]. System-level NUE is therefore closely linked to agro-climatic and agrotechnological conditions, including precipitation, temperature, soil fertility status, timing and rate of fertilizer application, and nutrient balance in soil and fertilizers [51,52,53]. Our system-level NUE values exceeding 100% (and up to 510% for carrot) reflect the associative trend of high nutrient demand met by indigenous soil capital and clearly demonstrates the complex interactions between agroecological conditions and fertilization strategies. In our study, NUE values exceeding 100% represent a system-level nutrient removal ratio rather than the recovery efficiency of applied mineral fertilizer. They reflect the mobilization of nutrients from long-term soil reserves (legacy N) and green manure mineralization, which cannot be captured in the “input” term of standard formulas. This distinction helps to explain why yields did not correlate with mineral fertilizer applications in our study.
The system-level N uptake efficiency (N-NUE) was generally high and, in several cases, exceeded 100%. This phenomenon can be attributed to soil microbial activity, particularly the mineralization of soil organic matter (legacy N), which supplies additional nitrogen to plants during the growing season [54]. Especially high N-NUE values were observed in cabbage, likely due to its longer vegetation period, which extends into late summer and early autumn, allowing efficient uptake of newly mineralized nitrogen. In contrast, onion exhibited the lowest N-NUE among the studied crops, which can be explained by its relatively short growing period and shallow root system [12]. Nevertheless, the observed N-NUE values for onion remain within ranges considered sufficient for crop production [26]. The results further demonstrate that the integration of organic and inorganic fertilizers produces a synergistic effect on nutrient availability and utilization. Farm-level analysis of NUE revealed that at the LatHort trial site, where two-year green manure fields were included in crop rotation, N-NUE exceeded 100% for all crops and apparently reached 510% for carrot and beet, reflecting a heavy reliance on indigenous soil N and the mineralization of organic residues rather than external mineral supplementation. Notably, Farm No. 4 consistently exhibited the second-highest NUE values across most parameters, a trend likely attributable to the implementation of supplemental irrigation in these fields. These findings align with earlier studies demonstrating the positive effects of irrigation [33] and green manure on subsequent crops [55], soil nutrient availability [56], and soil microbial activity, leading to a ‘priming effect’ where the addition of even small amounts of mineral N accelerates the mineralization of the organic N pool [57] and thus potentially reduces fertilizer application rates by up to 12% without yield loss [58]. This combined approach improves nutrient cycling by balancing immediate nutrient supply with long-term soil fertility enhancement. It also supports microbial processes such as nitrification and denitrification, thereby improving soil health and potentially reducing environmental risks, including nitrate leaching and greenhouse gas emissions [16].
Among the three macronutrients (NPK), phosphorus exhibited the lowest system-level NUE across all four crops, with values ranging from 0.12 for cabbage to 0.03 for onion. These extremely low efficiencies indicate substantial over-fertilization with phosphorus on the investigated farms, increasing the risk of P leaching and eutrophication of surface waters, including the Baltic Sea.
Potassium uptake efficiency (K-NUE) values were notably low across all studied crops, remaining below 0.5. This indicates a high risk of potassium accumulation in the soil and potential environmental losses. Onion exhibited particularly low K-NUE, which can be partly explained by its substantially lower K uptake (on average 3.3 kg t−1) compared with cabbage (9.01 kg t−1)—approximately half the uptake of beet and carrot (7.6 and 7.9 kg t−1, respectively).
These differences highlight species-specific nutrient uptake strategies and metabolic requirements. Cabbage exhibited the highest Mg-NUE among the studied crops (average 26.8), and Mg-NUE showed a positive correlation with K-NUE (Table 11). Previous studies indicate that high soil availability of Ca and K may reduce Mg uptake by displacing exchangeable Mg and increasing leaching losses [22,26]. Although Mg is primarily concentrated in leaves due to its role in photosynthesis, the studied vegetables contained Mg concentrations ranging from 0.4 to 1.5%, with the highest values observed in beet (average 1.93% in 2022).
Overall, the objective of nutrient management is to enhance cropping system performance by providing economically optimal nutrition while minimizing nutrient losses [26]. Our results align with the observation that rational NPK fertilization rates, combined with green manure incorporation (LatHort case) and irrigation (Farm No. 4 case), can improve nutrient use efficiency in vegetable production systems [59]. However, given that environmental stochasticity exerted a primary influence on management philosophy in this study, fertilization dose calculation methodologies should be critically reconsidered to account for the high variability in nutrient mobility and soil legacy contributions. Balancing crop nutrient uptake with fertilizer inputs remains a primary strategy to reduce environmental risks associated with excessive application, particularly in the context of observed P over-fertilization.

5. Conclusions

The findings of this five-year study on Latvian vegetable production provide critical insights into the optimization of nutrient management under shifting boreal climatic conditions. While the exploratory nature of this observational study precludes definitive causal inferences due to the lack of experimental randomization, the findings quantitatively highlight a significant divergence between theoretical fertilization models and real-world nutrient uptake.
Quantitative Yield–Input Decoupling: A marked divergence between nutrient application and yield was observed, with regression analyses consistently showing weak linear relationships (R2 < 0.10). This suggests that current fertilization methodologies, which often exceed observed uptake by 20–40% for phosphorus and potassium, lead to systemic over-application. To mitigate this, our findings suggest that fertilization rates in high-fertility soils could be adjusted downward by 20–40%—effectively targeting ranges of 40–100 kg ha−1 for P and 80–120 kg ha−1 for K—in high-fertility soils unless supplemental irrigation is used to bridge the moisture-driven “yield gap”. This reduction is particularly critical during forecasted dry periods to prevent salt accumulation and osmotic stress. However, these reduced application thresholds should be further validated through targeted multi-year field trials.
Cation Antagonism and Species-Specific Benchmarking: Nutrient uptake is governed by species-specific ionic competitions. In red beet, peak leaf Ca concentrations (6.5%) were linked to a suppression of Mg and K, identifying a clear physiological threshold for cation antagonism. Conversely, carrot demonstrated a “calciotrophic” advantage, where high Ca uptake supported root integrity. These results imply that fertilization guidelines must maintain a strict Ca:K and Ca:Mg balance.
NUE and Soil Legacy Mining: The identification of extreme NUE values (>100% and up to 510% in green manure systems) quantitatively proves that in particular farms yields heavily rely on legacy soil nitrogen and mineralization. This confirms that the “input” side of current fertilization plans is overestimated. Practical recommendations include a mandatory credit for green manure biomass (estimated at 30–50 kg N ha−1) in the following year’s fertilization plan to prevent environmental leaching.
Management Resilience vs. Climatic Dominance: No consistent “system effect” was found between organic and integrated management regarding tissue nutrient concentration. Instead, inter-annual climatic variability—specifically precipitation—was the primary driver of nutrient diffusion. Policy implications suggest that “Static Fertilization Calendars” should be replaced by Climate-Adaptive Management, where P and K applications are reduced during forecasted drought periods to avoid osmotic stress and salinity-induced yield loss.
Policy and Environmental Implications: To align Latvian horticulture with Baltic Sea environmental goals, nutrient management must transition from removal-rate models toward legacy-aware accounting. By optimizing specific removal rates and acknowledging soil nutrient pools, farmers can reduce mineral NPK inputs by an average of 15–20% without compromising yield, thereby reducing the risk of phosphorus eutrophication and nitrate leaching.

Supplementary Materials

The following supporting information can be downloaded at: https://www.mdpi.com/article/10.3390/horticulturae12050567/s1.

Author Contributions

Conceptualization, L.L. and S.Z.; methodology, L.L. and S.Z.; software, S.Z.; validation, L.L. and M.G.; formal analysis, L.L.; investigation, S.Z.; resources, L.L.; data curation, S.Z.; writing—original draft preparation, L.L.; writing—review and editing, S.Z.; visualization, S.Z.; supervision, L.L.; project administration, L.L.; funding acquisition, L.L. All authors have read and agreed to the published version of the manuscript.

Funding

This research was funded by the Ministry of Agriculture of the Republic of Latvia, grant number 25-00-S0INZ03-000021, in the project “Optimization of fertilizer application for widely cultivated field vegetables in Latvia to ensure sustainable technologies”.

Data Availability Statement

The raw data supporting the conclusions of this article will be made available by the authors on request.

Acknowledgments

This research was funded by the Ministry of Agriculture of the Republic of Latvia, grant number 25-00-S0INZ03-000021, in the project “Optimization of fertilizer application for widely cultivated field vegetables in Latvia to ensure sustainable technologies”. The authors used ChatGPT4, Gemini 3 Flashand Grammarly Pro (OpenAI) to improve the clarity and grammar of the manuscript. The graphical abstract was generated by DeeVid AI 1.22.1. The authors take full responsibility for the content of the paper.

Conflicts of Interest

The authors declare no conflicts of interest.

References

  1. Agriculture. Available online: https://helcom.fi/action-areas/agriculture/ (accessed on 1 December 2025).
  2. Tilman, D.; Cassman, K.; Matson, P.; Naylor, R.; Polasky, S. Agricultural sustainability and intensive production practices. Nature 2022, 418, 671–677. [Google Scholar] [CrossRef] [PubMed]
  3. Dzierzbicka-Głowacka, L.; Janecki, M.; Dybowski, D.; Szymczycha, B.; Obarska-Pempkowiak, H.; Wojciechowska, E.; Puszkarczuk, T. A new approach for investigating the impact of pesticides and nutrient flux from agricultural holdings and land-use structures on Baltic Sea coastal waters. Pol. J. Environ. Stud. 2019, 28, 2531–2539. [Google Scholar] [CrossRef]
  4. Farzadfar, S.J.; Knight, D.; Congreves, K.A. Rye cover crop improves vegetable crop nitrogen use efficiency and yield in a short season growing region. Can. J. Plant Sci. 2021, 101, 1014–1028. [Google Scholar] [CrossRef]
  5. Sai, R.; Paswan, S. Influence of higher levels of NPK fertilizers on growth, yield, and profitability of three potato varieties in Surma, Bajhang, Nepal. Heliyon 2024, 10, e34601. [Google Scholar] [CrossRef]
  6. Mohammed, N.T.; Halshoy, H.S.; Saed, N.F.; Rashid Ali, H.W.; Mohammed, N.I.; Mohammed Ali, S. Impact of inorganic fertilizer doses on growth, yield, physical and chemical components of broccoli plants. J. Kerbala Agric. Sci. 2024, 11, 57–72. [Google Scholar] [CrossRef]
  7. Ritchie, H. Can We Reduce Fertilizer Use Without Sacrificing Food Production? 2021. Available online: https://ourworldindata.org/reducing-fertilizer-use (accessed on 17 November 2025).
  8. Zhou, N.; Chen, Y.; Wang, J.; Yang, W.; Wang, Y. Reducing chemical fertilizer application in greenhouse vegetable cultivation under different residual levels of nutrient. Agriculture 2023, 13, 1174. [Google Scholar] [CrossRef]
  9. Valenzuela, H. Optimizing the nitrogen use efficiency in vegetable crops. Nitrogen 2024, 5, 106–143. [Google Scholar] [CrossRef]
  10. Thorup-Kristensen, K. Nitrogen use efficiency in organic and conventional vegetable rotations-measured and model simulated results. Acta Hortic. 2010, 852, 171–176. [Google Scholar] [CrossRef]
  11. Hodge, A. The plastic plant: Root responses to heterogeneous supplies of nutrients. New Phytol. 2004, 162, 9–24. [Google Scholar] [CrossRef]
  12. Thorup-Kristensen, K. Root growth and soil nitrogen depletion by onion, lettuce, early cabbage and carrot. Acta Hortic. 2021, 563, 201–206. [Google Scholar] [CrossRef]
  13. Marschner, H. Marschner’s Mineral Nutrition of Higher Plants, 3rd ed.; Marschner, P., Ed.; Academic Press: Cambridge, MA, USA, 2012. [Google Scholar]
  14. Ludemann, C.I.; Gruyere, A.; Heffer, P.; Doberman, A. Global data on fertilizer use by crop and by country. Sci. Data 2022, 9, 501. [Google Scholar] [CrossRef] [PubMed]
  15. Müller-Karulis, B.; McCrackin, M.L.; Dessirier, B.; Gustafsson, B.G.; Humborg, C. Legacy nutrients in the Baltic Sea drainage basin: How past practices affect eutrophication management. J. Environ. Manag. 2024, 370, 122478. [Google Scholar] [CrossRef]
  16. Ahmad, A.; Khan, A.; Ullah, F.; Hassan, M.A.; Iqbal, J.; Jun, W.; He, S.; Zhaorong, D. Integration of organic–inorganic nitrogen fertilization on nitrogen conversion in soil. Front. Plant Sci. 2025, 16, 1688878. [Google Scholar] [CrossRef]
  17. Ray, R.L.; Kularathna, K.M.; Griffin, R.W.; Abeysingha, N.; Woldesenbet, S.; Elhassan, A.; Awal, R.; Fares, A. Enhancing plant and soil health through organic amendments in a humid environment. Rhizosphere 2025, 35, 101126. [Google Scholar] [CrossRef]
  18. Nygaard Sorensen, J.; Thorup-Kristensen, K. Plant-based fertilizers for organic vegetable production. J. Plant Nutr. Soil Sci. 2011, 174, 321–332. [Google Scholar] [CrossRef]
  19. Mahey, H.K.; Sharma, K.; Singh, A.; Rampal, V.K.; Kaushik, P. Green manuring crop plants: Harnessing natural processes to enhance soil health and promote sustainable agricultural practices. Preprints 2024, 2024060340. [Google Scholar] [CrossRef]
  20. Popluga, D.; Kreišmane, D. Climate-Friendly Agricultural Practice in Latvia: Inclusion of Leguminous Plants in Crop Rotation for Nitrogen Fixation. 2020. Available online: https://www.lbtu.lv/sites/default/files/files/lapas/10-Taurinziezu-ieklausana-ENG.pdf#:~:text=The%20cultivation%20of%20galega%20and%20legu%2D%20mes,of%20chemically%20synthesised%20nitrogen%20and%20N2O%20emissions (accessed on 10 April 2026).
  21. Stein, S.; Hartung, J.; Perkons, U.; Moller, K.; Zikeli, S. Plant and soil N of different winter cover crops as green manure for subsequent organic white cabbage. Nutr. Cycl. Agroecosyst. 2023, 127, 285–298. [Google Scholar] [CrossRef]
  22. Chmelíková, L.; Schmid, H.; Anke, S.; Kurt-Jürgen, H. Energy-use efficiency of organic and conventional plant production systems in Germany. Sci. Rep. 2024, 14, 1806. [Google Scholar] [CrossRef] [PubMed]
  23. Lin, H.C.; Huber, J.A.; Gerl, G.; Kurt-Jürgen, H. Nitrogen balances and nitrogen-use efficiency of different organic and conventional farming systems. Nutr. Cycl. Agroecosyst. 2016, 105, 1–23. [Google Scholar] [CrossRef]
  24. ISO/IEC 17025:2017; General Requirements for the Competence of Testing and Calibration Laboratories. International Organization for Standardization: Geneva, Switzerland, 2017.
  25. LVS EN 15933:2012; Sludge, Treated Biowaste and Soil—Determination of pH. Latvian Standard (LVS): Riga, Latvia, 2012.
  26. LVS EN 13039:2012; Soil Improvers and Growing Media—Determination of Organic Matter Content and Ash. Latvian Standard (LVS): Riga, Latvia, 2012.
  27. ISO 14256-2:2005; Soil Quality—Determination of Nitrate, Nitrite and Ammonium in Field-Moist Soils by Extraction with Potassium Chloride Solution—Part 2: Automated Method with Segmented Flow Analysis. International Organization for Standardization: Geneva, Switzerland, 2005.
  28. LVS 010:2010; Augsne. Paraugu Ņemšana (Soil. Sampling). Latvian Standard (LVS): Riga, Latvia, 2010.
  29. ISO 22036: 2024; Soil Quality—Determination of Elements in Extracts of Soil by Inductively Coupled Plasma Optical Emission Spectrometry (ICP-OES). International Organization for Standardization: Geneva, Switzerland, 2024.
  30. ISO 11048:1995; Soil Quality—Determination of Water-Soluble and Acid-Soluble Sulfate. International Organization for Standardization: Geneva, Switzerland, 1995.
  31. FAO CD0604EN; Standard Operating Procedure for Boron Determination in Soil: Hot Water Extraction. Food and Agriculture Organization of the United Nations (FAO): Rome, Italy, 2024.
  32. Cekstere, G.; Osvalde, A.; Elferts, D.; Rose, C.; Lucas, F.; Vollenweider, P. Salt accumulation and effects within foliage of Tilia x vulgaris trees from the street greenery of Riga, Latvia. Sci. Total Environ. 2020, 747, 140921. [Google Scholar] [CrossRef]
  33. Karlsons, A.; Osvalde, A.; Cekstere, G.; Āboliņa, L. Effects of Ca sprays on fruit Ca content and yield of tomato variety susceptible to blossom-end rot. Plants 2023, 12, 1640. [Google Scholar] [CrossRef]
  34. Fixen, P.; Brentrup, F.; Bruulsema, T.; Garcia, F.; Norton, R.; Zingore, S. Nutrient/fertilizer use efficiency: Measurement, current situation and trends. In Managing Water and Fertilizer for Sustainable Agricultural Intensification Chapter; Drechsel, P., Heffer, P., Magen, H., Mikkelsen, R., Wichelns, D., Eds.; Chapter 2; International Fertilizer Industry Association (IFA): Paris, France; International Water Management Institute (IWMI): Colombo, Sri Lanka; International Plant Nutrition Institute (IPNI): Peachtree Corners, GA, USA; International Potash Institute (IPI): Zug, Switzerland, 2015. [Google Scholar]
  35. Weih, M.; Hamnér, K.; Pourazari, F. Analyzing plant nutrient uptake and utilization efficiencies: Comparison between crops and approaches. Plant Soil. 2018, 430, 7–21. [Google Scholar] [CrossRef]
  36. Kārkliņš, A. Kultūraugu Mēslošanas Plāna Izstrādes Metodika; Latvijas Lauku Konsultāciju Centrs: Ozolnieki, Latvia, 2008; 40p. (In Latvian) [Google Scholar]
  37. Interpreting a Soil Test Report. Available online: https://wonder-corporation.com/en/fertilizer-application-rates-and-doses/ (accessed on 5 December 2025).
  38. Rosanoff, A.; Capron, E.; Barak, P.; Mathews, B.; Nielsen, F. Edible plant tissue and soil calcium: Magnesium ratios: Data too sparse to assess implications for human health. Crop Pasture Sci. 2015, 66, 1265–1277. [Google Scholar] [CrossRef]
  39. Waraich, E.A.; Ahmad, R.; Saifullah, M.Y.A.; Ahmad, M. Improving agricultural water use efficiency by nutrient management in crop plants. Acta Agric. Scand. Sect. B-Soil Plant Sci. 2011, 61, 291–304. [Google Scholar] [CrossRef]
  40. Hatfield, J.L.; Prueger, J.H. Temperature extremes: Effect on plant growth and development. Weather Clim. Extrem. 2015, 10, 4–10. [Google Scholar] [CrossRef]
  41. Machado, R.M.; Serralheiro, R.P. Soil salinity: Effect on vegetable crop growth. Management practices to prevent and mitigate soil salinization. Horticulturae 2017, 3, 30. [Google Scholar] [CrossRef]
  42. Murmu, K.; Kumar Swain, D.; Chandra Ghosh, B. Comparative assessment of conventional and organic nutrient management on crop growth and yield and soil fertility. Aust. J. Crop Sci. 2013, 7, 1617–1626. [Google Scholar]
  43. Removal of Nutrients From the Soil. Available online: https://nevegetable.org/cultural-practices/removal-nutrients-soil (accessed on 10 December 2025).
  44. Tůma, J.; Skalický, M.; Tůmová, L.; Bláhová, P.; Rosůlková, M. Potassium, magnesium and calcium content in individual parts of Phaseolus vulgaris L. plant as related to potassium and magnesium nutrition. Plant Soil Environ. 2004, 50, 18–26. [Google Scholar] [CrossRef]
  45. Kumar, D.; Singh, M.; Kushwaha, M.; Makarana, G.; Yadav, M.R. Integrated use of organic and inorganic nutrient sources influences the nutrient content, uptake and nutrient use efficiencies of fodder oats (Avena sativa). Indian J. Agron. 2021, 66, 466–473. [Google Scholar] [CrossRef]
  46. Gerendás, J.; Führs, H. The significance of magnesium for crop quality. Plant Soil. 2013, 368, 101–128. [Google Scholar] [CrossRef]
  47. White, P.J.; Broadley, M.R. Calcium in plants. Ann. Bot. 2003, 92, 487–511. [Google Scholar] [CrossRef]
  48. Aparna, B.; Chitdeshwari, T.; Suganya, S.; Kavitha, C.; Geetha, P. Calcium nutrition for improving the growth and yield of carrot in acid soils. Int. J. Plant Soil Sci. 2023, 35, 1174–1183. [Google Scholar] [CrossRef]
  49. Hauer-Jákli, M.; Tränkner, M. Critical leaf magnesium thresholds and the impact of magnesium on plant growth and photo-oxidative defense: A systematic review and meta-analysis from 70 years of research. Front. Plant Sci. 2019, 10, 766. [Google Scholar] [CrossRef]
  50. Gransee, A.; Führs, H. Magnesium mobility in soils as a challenge for soil and plant analysis, magnesium fertilization and root uptake under adverse environmental conditions. Plant Soil. 2013, 368, 5–21. [Google Scholar] [CrossRef]
  51. Pietola, L.; Salo, T. Response of P, K, Mg and NO3-N contents of carrots to irrigation, soil compaction, and nitrogen fertilization. Agric. Food Sci. 2000, 9, 319–331. [Google Scholar] [CrossRef]
  52. Moore, A.D.; Spring, J.F.; Jeliazkova, E.A.; Wilson, T.L. Seasonal nutrient partitioning and uptake in hybrid carrot seed production. Agron. J. 2021, 113, 1934–1944. [Google Scholar] [CrossRef]
  53. Brito, L.M.; Amaro, A.L.; Mourão, I.; Moura, L. Yield and nitrogen uptake of white cabbage (Brassica oleracea var. capitata) with organic and inorganic fertilisers. Acta Hortic. 2012, 933, 107–113. [Google Scholar] [CrossRef]
  54. Bell, C.W.; Asao, S.; Calderon, F.; Wolk, B.; Wallenstein, M.D. Plant nitrogen uptake drives rhizosphere bacterial community assembly during plant growth. Soil Biol. Biochem. 2015, 85, 170–182. [Google Scholar] [CrossRef]
  55. Talgre, L.; Lauringson, E.; Roostalu, H.; Astover, A.; Makke, A. Green manure as a nutrient source for succeeding crops. Plant Soil Environ. 2012, 58, 275–281. [Google Scholar] [CrossRef]
  56. Wang, Y.; Yu, A.; Shang, Y.; Wang, P.; Wang, F.; Yin, B.; Liu, Y.; Zhang, D.; Chai, Q. Research progress on the improvement of farmland soil quality by green manure. Agriculture 2025, 15, 768. [Google Scholar] [CrossRef]
  57. Jenkinson, D.S.; Fox, R.H.; Rayner, J.H. Interactions between fertilizer nitrogen and soil nitrogen—the so-called ‘priming’ effect. J. Soil Sci. 1985, 36, 425–444. [Google Scholar] [CrossRef]
  58. Zhang, J.; He, W.; Wei, Z.; Chen, Y.; Gao, W. Integrating green manure and fertilizer reduction strategies to enhance soil carbon sequestration and crop yield: Evidence from a two-season pot experiment. Front. Sustain. Food Syst. 2025, 8, 1514409. [Google Scholar] [CrossRef]
  59. Olaniyi, J.O.; Ojetayo, A.E. Effect of fertilizer types on the growth and yield of two cabbage varieties. J. Anim. Plant Sci. 2011, 12, 1573–1582. [Google Scholar]
Figure 1. Location of LatHort (red star) and eleven monitored farms (blue stars).
Horticulturae 12 00567 g001
Figure 2. Pearson correlation coefficients (r) between fertilizer application rates and total yields for the period 2021–2025. Data are presented for the combined dataset (integrated and organic systems) and specifically for the subset of integrated farming systems.
Horticulturae 12 00567 g002
Table 1. Precipitation per vegetation period (April–September) and meteorological data collection place during the trial period, years 2021–2025, mm.
YearMadonaSaldusPriekuļiBauskaSkrīveriDobelePūreJelgavaAverageCV, %
202150940940939955231231332740422.1
202246528939037345733430638737517.2
202335132236928538932324730932414.2
20244063724063813623673834063854.8
202561543651138856941544234946619.7
CV, %21.516.613.1612.620.111.922.411.421.5
Table 2. Average temperature per vegetation period (April–September) and meteorological data collection place during the trial period, years 2021–2025, °C.
YearMadonaSaldusPriekuļiBauskaSkrīveriDobelePūreJelgavaAverageCV, %
202113.513.613.814.214.014.313.814.313.92.1
202212.713.013.213.613.413.513.113.713.32.4
202314.114.214.715.014.714.714.114.814.52.5
202414.815.115.415.715.715.614.815.715.32.6
202513.213.213.413.813.713.913.314.013.52.4
CV, %5.96.06.66.06.65.54.95.514.1
Table 3. Maximum temperature per vegetation period (April–September) and meteorological data collection place during the trial period, years 2021–2025, °C.
YearMadonaSaldusPriekuļiBauskaSkrīveriDobelePūreJelgavaAverageCV, %
202123.923.623.324.123.924.523.924.424.01.6
202222.722.722.423.522.823.422.923.423.01.8
202325.324.824.825.825.325.625.125.625.31.5
202426.325.725.526.726.326.525.726.526.11.6
202524.223.723.724.924.624.924.224.824.42.1
CV, %5.64.95.15.25.34.64.54.724.5
Table 4. Minimum temperature per vegetation period (April–September) and meteorological data collection place during the trial period, years 2021–2025, °C.
YearMadonaSaldusPriekuļiBauskaSkrīveriDobelePūreJelgavaAverageCV, %
20213.54.95.65.14.95.94.24.44.815.6
20222.53.84.44.44.04.82.83.83.821.1
20232.85.25.74.84.65.33.54.64.621.0
20244.25.96.85.75.96.35.05.65.714.4
20253.64.85.44.84.85.54.14.74.713.4
CV, %20.115.215.310.014.510.221.014.220.1
Table 5. Vegetable yield harvested in all monitored farms, 2021–2025, t ha−1.
Farm NoFarming System, Location of Nearest Meteorological StationYearCrop
OnionCarrotBeetCabbage
1.Organic,
Dobele
202181618x
202282015x
20238x12x
202413xxx
2025xxxx
2.Integrated,
Saldus
2021xx4080
2022x404350
2023x222070
2024xx4070
2025xxx80
3.Integrated,
Dobele
2021x3545x
2022xx45x
2023xx50x
2024xx60x
2025xxxx
4.Integrated,
Priekuļi
2021x40x43
2022x75x60
2023x44x78
2024x51x76
2025xxxx
5.Integrated,
Madona
2021x262036
202212271542
202318252522
20241419x35
2025xxx25
6.Integrated,
Bauska
2021xxx72
2022xxx34
2023xxx84
2024xxx96
2025xxxx
7.Integrated,
Bauska
202112xxx
202222xxx
202321xxx
202415xxx
202517xxx
8.Integrated,
Bauska
2021xx40x
2022xx60x
2023xx22x
2024xx58x
2025xxxx
9.Organic,
Bauska
2021724x31
20228142424
202314162318
20241618x10
2025xxxx
10.Organic,
Skrīveri
20211121x28
202212222418
202314xx25
20242222x18
2025xxxx
11.Integrated,
Skrīveri
20212069xx
2022247339x
20232461xx
2024217644x
2025222875x
12. Integrated,
Pūre
2021x2568x
202217645636
2023317679120
202446286850
202528427545
Average17.437.742.049.7
SD8.320.820.427.6
CV, %48.055.248.755.5
CI3.27.87.810.3
x—the particular crop was not grown in the corresponding farm in particular year.
Table 6. The coefficients of determination (R2) between fertilizer application rates and total yields for the period 2021–2025 for the combined dataset (integrated and organic systems).
CropNPKMgCa
Cabbage0.010.020.010.040.00
Carrot0.060.010.000.010.53
Red beet0.030.110.090.010.02
Onion0.130.250.120.050.02
Table 7. Mean nutrient concentrations of primary macronutrients in cabbage, carrot, red beet, and onion under integrated and organic farming systems (2021–2025).
PlantYearN, %P, %K, %Ca, %Mg, %S, %B, mg/kg
Organic
Cabbage20215.53 ± 0.810.64 ± 0.226.07 ± 2.225.75 ± 2.690.42 ± 0.011.77 ± 0.0365.00 ± 8.49
20224.36 *0.45 *3.78 *4.10 *0.69 *1.45 *90.00 *
20234.63 ± 1.080.94 ± 0.225.36 ± 0.894.04 ± 0.460.61 ± 0.090.74 ± 0.2253.67 ± 7.57
20244.23 ± 1.341.05 ± 0.106.29 ± 0.814.89 ± 1.201.01 ± 0.080.91 ± 0.1645.00 ± 1.41
2025N/A N/A N/A N/A N/A N/A N/A
Average4.690.775.374.700.681.2263.42
CI0.930.441.801.280.390.7631.04
CV, %12.535.721.117.136.239.130.8
Integrated
Cabbage20215.51 ± 1.040.82 ± 0.144.94 ± 0.844.71 ± 2.630.41 ± 0.062.21 ± 0.8862.2 ± 12.56
20223.95 ± 0.390.48 ± 0.094.71 ± 0.072.71 ± 0.670.53 ± 0.121.01 ± 0.2457.00 ± 14.00
20234.37 ± 0.540.77 ± 0.225.71 ± 0.893.53 ± 1.460.51 ± 0.131.07 ± 0.3657.33 ± 9.35
20244.24 ± 0.700.79 ± 0.096.94 ± 1.594.02 ± 0.570.61 ± 0.091.48 ± 0.3762.00 ± 6.54
20254.75 ± 0.661.15 ± 0.105.20 ± 0.393.83 ± 0.800.55 ± 0.101.20 ± 0.3967.67 ± 7.58
Average4.560.805.503.760.521.3961.24
CI0.750.301.100.910.0090.615.42
CV, %13.229.716.119.414.035.37.1
Organic
Beet20216.07 *0.34 *2.80 *2.00 *1.37 *0.45 *30.00 *
20223.06 ± 0.860.24 ± 0.114.24 ± 0.122.81 ± 0.442.20 ± 0.660.60 ± 0.0134.00 ± 1.41
20233.01 ± 0.000.32 ± 0.073.69 ± 0.252.44 ± 0.771.15 ± 0.160.42 ± 0.0829.50 ± 3.54
20240.88 *0.23 *1.94 *0.21 *0.27 *0.14 *12.00 *
2025N/A N/A N/A N/A N/A N/A N/A
Average3.260.283.171.871.250.4026.38
CI3.390.091.611.831.260.3115.57
CV, %65.520.531.961.663.548.037.1
Integrated
Beet20216.21 ± 0.550.65 ± 0.214.14 ± 0.541.29 ± 0.441.02 ± 0.150.57 ± 0.1251.57 ± 9.85
20223.58 ± 0.220.40 ± 0.156.22 ± 3.142.55 ± 0.201.66 ± 0.510.64 ± 0.0554.5 ± 6.36
20234.23 ± 0.760.46 ± 0.036.51 ± 0.952.23 ± 0.721.39 ± 0.320.47 ± 0.0640.25 ± 3.5
20244.67 ± 1.200.50 ± 0.057.25 ± 1.222.43 ± 0.521.68 ± 0.520.59 ± 0.0544.5 ± 16.2
20254.21 *0.56 *8.42 *1.17 *1.55 *0.58 *49.00 *
Average4.580.516.511.931.460.5747.96
CI1.230.121.960.810.340.087.04
CV, %21.618.524.233.918.610.911.8
Organic
Carrot20214.24 ± 0.740.38 ± 0.091.86 ± 0.480.83 ± 0.350.25 ± 0.160.45 ± 0.0849 ± 14.93
20221.49 *0.34 *1.03 *1.66 *0.36 *0.36 *55 *
20232.42 *0.22 *6.6 *3.28 *0.38 *0.65 *44 *
20242.73 ± 0.270.42 ± 0.122.05 ± 0.322.79 ± 0.350.67 ± 0.060.53 ± 0.0453 ± 2.83
2025N/A N/A N/A N/A N/A N/A N/A
Average2.720.342.882.140.420.5050.25
CI1.820.144.001.760.290.207.72
CV, %42.025.487.451.742.724.69.7
Integrated
Carrot20213.49 ± 0.400.54 ± 0.102.93 ± 0.410.61 ± 0.250.19 ± 0.050.52 ± 0.1559.2 ± 13.33
20222.36 ± 0.320.28 ± 0.041.65 ± 0.512.40 ± 0.420.43 ± 0.020.53 ± 0.1057.25 ± 7.37
20232.69 ± 0.400.35 ± 0.087.76 ± 1.492.44 ± 0.730.49 ± 0.100.33 ± 0.0648.33 ± 4.03
20242.93 ± 0.430.47 ± 0.075.44 ± 1.392.21 ± 0.810.55 ± 0.260.44 ± 0.1148.00 ± 2.65
20252.37 ± 0.350.66 ± 0.095.12 ± 1.681.47 ± 0.160.41 ± 0.040.54 ± 0.0647.4 ± 2.19
Average2.770.464.581.830.410.4752.04
CI0.580.192.950.970.170.117.09
CV, %16.932.851.742.833.318.911.0
Organic
Onion20214.24 ± 0.570.36 ± 0.061.78 ± 0.421.24 ± 0.490.33 ± 0.020.52 ± 0.1738 ± 5.29
20221.98 ± 0.720.16 ± 0.071.81 ± 1.172.71 ± 3.240.45 ± 0.540.32 ± 0.0121 ± 12.73
20233.27 ± 0.380.35 ± 0.042.72 ± 0.822.84 ± 1.030.56 ± 0.100.39 ± 0.1030 ± 2.65
20243.72 ± 0.570.48 ± 0.072.95 ± 0.173.00 ± 1.210.64 ± 0.160.55 ± 0.0925 ± 2.08
2025N/A N/A N/A N/A N/A N/A N/A
Average3.300.342.312.450.500.4428.42
CI1.540.210.971.290.220.1711.65
CV, %29.338.926.333.227.424.725.8
Integrated
Onion20213.78 ± 1.030.43 ± 0.031.42 ± 0.551.07 ± 0.310.27 ± 0.040.61 ± 0.4133 ± 13.53
20222.68 ± 1.400.27 ± 0.163.04 ± 1.752.29 ± 1.350.50 ± 0.330.35 ± 0.1440.00 ± 25.00
20232.54 ± 1.400.31 ± 0.162.99 ± 1.752.81 ± 1.350.45 ± 0.330.31 ± 0.1428.75 ± 25.00
20243.38 ± 1.010.38 ± 0.103.38 ± 2.612.44 ± 2.010.51 ± 0.240.43 ± 0.0845.50 ± 11.21
20252.96 ± 0.480.82 ± 0.434.05 ± 1.062.22 ± 0.430.48 ± 0.080.68 ± 0.1943.33 ± 4.04
Average3.070.442.972.170.440.4738.12
CI0.640.271.200.810.120.208.77
CV, %16.750.032.630.122.534.518.5
Values are presented as mean ± standard deviation (SD). Values marked with an asterisk (*) represent data obtained from a single location for that specific crop–year combination, where calculation of SD was not possible. N/A indicates years where a crop was not included in the farms’ commercial rotation.
Table 8. Unit nutrient uptake (kg t−1) for cabbage, carrot, red beet, and onion in integrated and organic farming systems (2021–2025).
PlantYearNPKCaMg
Organic
Cabbage20218.67 ± 1.871.05 ± 0.399.66 ± 3.059.30 ± 4.640.69 ± 0.04
2022 **6.50.775.556.71.19
20235.99 ± 1.511.25 ± 0.078.12 ± 0.225.22 ± 0.140.92 ± 0.1
20246.13 ± 1.111.66 ± 0.029.85 ± 0.177.64 ± 0.741.61 ± 0.15
2025N/A N/A N/A N/A N/A
Average6.821.188.307.221.10
CI1.990.603.162.720.63
CV, %18.331.723.923.735.9
Integrated
Cabbage202113.85 ± 2.212.28 ± 0.4312.05 ± 2.976.32 ± 4.090.89 ± 0.09
20227.26 ± 1.590.97 ± 0.328.59 ± 0.965.39 ± 1.441.1 ± 0.38
20236.43 ± 0.831.22 ± 0.518.99 ± 15.62 ± 20.84 ± 0.19
20246.34 ± 0.751.23 ± 0.1110.61 ± 1.666.31 ± 1.70.98 ± 0.25
20257.08 ± 0.81.81 ± 0.397.78 ± 1.175.05 ± 1.230.9 ± 0.27
Average8.191.509.605.740.94
CI3.960.662.130.700.12
CV, %38.935.517.99.810.6
Methodology *3.001.324.32--
Organic
Beet2021 **10.630.564.563.792.55
20224.62 ± 1.130.38 ± 0.156.41 ± 0.323.96 ± 0.673.13 ± 0.97
20233.95 ± 0.000.43 ± 0.1004.82 ± 0.353.07 ± 0.801.47 ± 0.26
2024 **1.480.393.270.300.46
2025N/A N/A N/A N/A N/A
Average5.170.444.772.791.90
CI6.170.132.052.701.88
CV, %75.118.827.060.962.2
Integrated
Beet20219.55 ± 1.301.03 ± 0.476.04 ± 0.922.14 ± 0.961.61 ± 0.42
20225.39 ± 0.140.61 ± 0.289.22 ± 4.973.62 ± 0.222.39 ± 0.79
20234.91 ± 0.910.53 ± 0.087.64 ± 1.552.17 ± 0.521.53 ± 0.5
20246.89 ± 1.540.75 ± 0.1410.76 ± 1.203.60 ± 0.702.5 ± 0.71
2025 **4.620.698.61.131.52
Average6.270.728.452.531.91
CI2.520.242.191.330.61
CV, %37.329.419.440.724.7
Methodology *3.000.883.32--
Organic
Carrot20217.98 ± 2.060.62 ± 0.0502.84 ± 0.401.70 ± 0.890.45 ± 0.30
2022 **2.930.621.963.650.76
2023 **3.260.298.874.490.52
20245.56 ± 0.930.80 ± 0.253.77 ± 0.686.19 ± 1.581.43 ± 0.26
2025N/A N/A N/A N/A N/A
Average4.930.584.364.010.79
CI3.730.344.922.970.71
CV, %47.636.771.046.556.6
Integrated
Carrot20215.83 ± 1.180.84 ± 0.204.72 ± 0.891.00 ± 0.540.30 ± 0.09
20224.76 ± 1.500.52 ± 0.153.28 ± 1.225.29 ± 1.050.90 ± 0.17
20234.52 ± 0.440.54 ± 0.0912.96 ± 3.514.68 ± 1.980.86 ± 0.21
20245.49 ± 1.210.81 ± 0.089.55 ± 1.424.63 ± 2.571.09 ± 0.71
20254.16 ± 1.471.10 ± 0.348.47 ± 3.432.72 ± 1.070.72 ± 0.22
Average4.950.767.803.660.77
CI0.860.304.822.210.37
CV, %14.031.649.748.538.5
Methodology *2.500.883.32--
Organic
Onion20215.27 ± 1.270.50 ± 0.122.38 ± 0.671.46 ± 0.440.39 ± 0.07
20222.73 ± 0.940.24 ± 0.122.32 ± 1.343.00 ± 3.410.50 ± 0.56
20233.97 ± 0.570.45 ± 0.063.29 ± 1.083.34 ± 1.080.66 ± 0.12
20244.41 ± 0.730.58 ± 0.093.47 ± 0.023.37 ± 1.150.73 ± 0.16
2025N/A N/A N/A N/A N/A
Average4.100.442.872.790.57
CI1.680.240.951.440.24
CV, %25.833.720.932.427.0
Integrated
Onion20214.48 ± 1.190.55 ± 0.061.83 ± 0.731.26 ± 0.270.31 ± 0.03
20223.44 ± 1.250.36 ± 0.153.90 ± 1.742.83 ± 1.300.60 ± 0.33
20232.99 ± 0.710.38 ± 0.053.21 ± 2.332.99 ± 1.960.48 ± 0.22
20244.12 ± 0.440.50 ± 0.014.11 ± 1.292.82 ± 0.740.58 ± 0.10
20253.06 ± 0.940.82 ± 0.344.15 ± 0.932.23 ± 0.830.48 ± 0.12
Average3.620.523.442.430.49
CI0.820.231.210.890.14
CV, %18.235.528.429.423.4
Methodology *1.501.193.57--
Values are presented as mean ± SD; values of the years marked with a double asterisk (**) represent data obtained from a single location for that specific crop in that year and management system, precluding the calculation of standard deviation. N/A indicates that a crop was not included in the farms’ commercial rotation for that specific monitoring year. * indicates values given in “The Methodology for fertilization plan calculations”, currently used for calculations of fertilization rates.
Table 9. Nutrient uptake efficiency (NUE) in cabbage, carrot, beet, and onion, in %, 2022–2025.
PlantYearN-NUEP-NUEK-NUEMg-NUECa-NUE
Organic
Cabbage2022 *144.4716.6264.7411.320.19
2023165.51 ± 17.119.15 ± 2.6338.64 ± 22.665.40 ± 3.330.25 ± 0.02
2024129.84 ± 81.1110.03 ± 6.4020.88 ± 9.906.46 ± 4.280.29 ± 0.19
2025N/A N/A N/A N/A N/A
Average146.6111.9341.427.730.24
CI44.5110.1454.777.840.12
CV, %10.027.943.533.317.1
Integrated
Cabbage202299.64 ± 33.2613.47 ± 0.7668.43 ± 8.1460.60 ± 29.471.00 ± 0.21
2023152.66 ± 160.7212.34 ± 5.8943.84 ± 32.0120.89 ± 16.770.56 ± 0.37
202489.86 ± 68.439.50 ± 1.2940.44 ± 6.6723.07 ± 10.920.57 ± 0.20
202581.58 ± 105.611.69 ± 6.6823.23 ± 6.2623.89 ± 8.810.46 ± 0.24
Average105.9411.7543.9932.110.65
CI50.902.6629.6230.260.38
CV, %26.212.336.751.332.0
Organic
Beet202257.70 ± 47.486.08 ± 1.7127.65 ± 19.561.70 ± 1.730.44 ± 0.33
202381.61 ± 64.965.95 ± 3.2525.37 ± 9.272.40 ± 2.040.17 ± 0.1
2024N/A N/A N/A N/A N/A
2025N/A N/A N/A N/A N/A
Average69.666.0226.512.050.31
CI151.950.8314.494.451.72
CV, %17.21.14.317.143.6
Integrated
Beet202260.45 ± 51.318.53 ± 4.0048.25 ± 16.8913.81 ± 4.561.12 ± 0.04
2023158.92 ± 215.186.14 ± 5.6917.22 ± 11.196.57 ± 5.310.99 ± 1.15
2024232.03 ± 179.3415.04 ± 10.1566.68 ± 31.449.26 ± 2.661.58 ± 0.34
2025 *588.7517.3243.26.881.97
Average260.0411.7643.849.131.42
CI365.938.4032.465.320.71
CV, %76.638.940.331.727.3
Organic
Carrot2022123.585.177.838.300.21
202319.357.0766.831.180.17
202485.16 ± 70.3911.74 ± 6.9523.97 ± 5.761.27 ± 0.420.07 ± 0.06
2025N/A N/A N/A N/A N/A
Average76.037.9932.883.580.15
CI130.868.3975.7010.140.18
CV, %56.634.575.793.239.3
Integrated
Carrot202267.24 ± 51.556.27 ± 4.1111.49 ± 2.1621.41 ± 14.030.59 ± 0.23
2023142.77 ± 197.756.03 ± 3.2855.75 ± 41.654.47 ± 4.870.28 ± 0.24
2024121.03 ± 103.649.79 ± 8.9944.16 ± 31.8412.36 ± 7.90.63 ± 0.55
2025 *593.9813.3657.5812.710.73
Average231.268.8642.2512.740.56
CI387.795.4933.9411.000.31
CV, %91.333.843.847.030.0
Organic
Onion202213.902.003.804.100.10
2023101.3 ± 100.244.43 ± 4.0423.87 ± 29.133.93 ± 2.750.13 ± 0.12
202496.19 ± 22.435.16 ± 0.6910.82 ± 1.482.58 ± 0.710.15 ± 0.02
2025N/A N/A N/A N/A N/A
Average70.463.8612.833.540.13
CI121.784.1125.282.070.06
CV, %56.835.064.819.215.9
Integrated
Onion202268.15 ± 10.822.6 ± 0.2810.25 ± 8.705.65 ± 3.890.20 ± 0.14
2023109.93 ± 78.394.00 ± 1.6610.60 ± 3.472.00 ± 1.950.10 ± 0.10
202438.81 ± 26.011.96 ± 0.168.26 ± 2.886.28 ± 1.920.22 ± 0.06
202591.8 ± 48.335.59 ± 0.5712.14 ± 6.084.27 ± 2.360.21 ± 0.08
Average77.173.5410.314.550.18
CI48.922.562.543.010.09
CV, %34.539.413.436.126.8
Values are presented as mean ± SD; values of the years marked with an asterisk (*) represent data obtained from a single location for that specific crop in that year and management system, precluding the calculation of standard deviation. The symbol N/A indicates that a crop was not included in the farms’ commercial rotation for that specific monitoring year.
Table 10. Correlation coefficients between yield and the uptake of N, P, K, Ca, and Mg for all monitored vegetable crops.
YieldNPKCaMg
Cabbage
N0.061.00
P−0.080.661.00
K 0.030.470.581.00
Ca−0.120.07−0.020.201.00
Mg−0.26−0.140.080.050.191.00
Carrot
N−0.101.00
P−0.260.221.00
K −0.09−0.060.241.00
Ca0.320.25−0.19−0.011.00
Mg0.240.410.100.000.901.00
Onion
N−0.261.00
P−0.010.131.00
K 0.390.030.271.00
Ca−0.01−0.07−0.200.271.00
Mg0.000.17−0.060.440.841.00
Beet
N0.091.00
P0.280.571.00
K0.41−0.140.181.00
Ca−0.42−0.06−0.130.091.00
Mg−0.190.06−0.160.410.651.00
Table 11. Correlation coefficients between yield and N, P, K, Ca, and Mg NUE for all monitored vegetable crops.
NutrientYieldNPKMgCa
Cabbage
N0.191.00
P0.430.361.00
K 0.170.080.541.00
Mg0.500.200.370.381.00
Ca0.650.420.290.230.751.00
Carrot
N0.341.00
P0.580.611.00
K 0.330.470.591.00
Mg0.660.060.34−0.131.00
Ca0.780.480.830.250.731.00
Onion
N0.091.00
P0.060.791.00
K −0.110.670.721.00
Mg0.41−0.020.080.181.00
Ca0.500.130.250.100.871.00
Beet
N0.771.00
P0.720.501.00
K0.530.200.881.00
Mg0.550.090.330.461.00
Ca0.900.700.710.590.601.00
Table 12. Correlation between yield and the nutrients available to plants (available in soil plus fertilizers) for NPK in integrated farms.
Nutrient, kg ha−1Yield, t ha−1NP2O5
Cabbage
N0.311.00
P2O50.290.211.00
K2O0.220.410.5
Carrot
N0.061.00
P2O5−0.240.411.00
K2O−0.100.120.31
Beet
N−0.101.00
P2O50.010.561.00
K2O0.47−0.240.27
Onion
N−0.251.00
P2O5−0.030.401.00
K2O0.36−0.11−0.08
Table 13. Coefficient of correlation between NUE and the element plant availability (soil reservoir plus applied fertilizers) for NPK in integrated farms.
CropNPK
cabbage−0.58−0.37−0.53
carrot−0.62−0.57−0.44
beet−0.73−0.71−0.33
onion−0.78−0.41−0.74
Disclaimer/Publisher’s Note: The statements, opinions and data contained in all publications are solely those of the individual author(s) and contributor(s) and not of MDPI and/or the editor(s). MDPI and/or the editor(s) disclaim responsibility for any injury to people or property resulting from any ideas, methods, instructions or products referred to in the content.