Article

Influence of Various Biochars on the Rhizosphere Microenvironment and Allelopathic Effects of Polygonatum cyrtonema Hua: Microbial Community Modulation and Enhancement of Plant Quality

1
Institute of Crop Sciences, Fujian Academy of Agricultural Sciences (Fujian Germplasm Resources Center), Fuzhou 350011, China
2
College of Horticulture, Fujian Agriculture & Forestry University, Fuzhou 350002, China
3
Institute of Environmental Microbiology, College of Resources and Environment, Fujian Agriculture & Forestry University, Fuzhou 350002, China
4
Zhangzhou Seed Station, Zhangzhou 363000, China
*
Authors to whom correspondence should be addressed.
Horticulturae 2026, 12(3), 370; https://doi.org/10.3390/horticulturae12030370
Submission received: 11 February 2026 / Revised: 27 February 2026 / Accepted: 3 March 2026 / Published: 18 March 2026
(This article belongs to the Section Medicinals, Herbs, and Specialty Crops)

Abstract

Polygonatum cyrtonema Hua (PCH) is traditionally recognized as both an edible and medicinal food source. Its rhizomes contain numerous bioactive compounds, notably polysaccharides and flavonoids, which serve as key constituents in functional food development. However, the cultivation of PCH is often hindered by allelopathic effects, which diminish its quality and restrict its industrial application. To mitigate these allelopathic influences, three types of biochars derived from maize straw (MB), rice husk (RB), and tea stem (TB) were applied at concentrations of 0%, 2%, and 4%. Initially, the physicochemical properties of these biochars were characterized, followed by an evaluation of their impact on (1) the synthesis of quality-related components, secondary metabolites, and allelochemicals within PCH rhizomes and (2) the fundamental physicochemical properties and bacterial community structure of the PCH rhizosphere soil. The findings indicated that the application of 4% RB significantly enhanced the content of total polysaccharides by 48.5%, total flavonoids by 30.2%, total saponins by 28.6%, and total polyphenols by 18.3%, while concurrently reducing protein (PRO) and free amino acid (FAA) concentrations in the rhizomes. Non-targeted metabolomic analyses revealed that biochar amendments (1) upregulated metabolites involved in the citrate cycle and galactose metabolism pathways, thereby facilitating energy supply and precursors for polysaccharide biosynthesis; (2) downregulated metabolites involved in the arginine biosynthesis pathway, which is unfavorable for protein and amino acid synthesis; (3) decreased the abundance of six identified allelochemicals, including 5-hydroxy-L-tryptophan and andrographolide, with the most pronounced effect observed in the 4% TB treatment (T2); (4) improved soil physicochemical parameters such as pH, soil organic matter (SOM), total nitrogen (TN), and available potassium (AK); and (5) altered the rhizosphere bacterial community by enriching beneficial phyla, notably Myxococcota and Gemmatimonadota. These modifications in soil properties and bacterial community composition were closely associated with enhanced rhizome quality and a reduction in allelochemical accumulation. Collectively, the results of this study elucidate the potential mechanisms linking biochar application to allelopathy mitigation, optimization of soil microbial communities, and improvement of PCH rhizome quality. This research provides a theoretical basis for the production of high-quality PCH while concurrently minimizing allelochemical accumulation in its rhizomes.

1. Introduction

Polygonatum cyrtonema Hua (PCH) represents a significant source of traditional Chinese medicinal materials [1]. This medicinal and edible species is rich in bioactive constituents, including polysaccharides and flavonoids, which exhibit immunomodulatory and antioxidant properties [2]. The increasing market demand for health products and functional foods derived from Polygonatum has necessitated the expansion of its cultivation, primarily due to the limited availability of wild germplasm resources. Nevertheless, continuous monoculture practices may detrimentally affect the quality of PCH rhizomes, a phenomenon largely attributed to allelopathic effects arising from the accumulation and subsequent release of metabolites, such as phenolic acids [3], carboxylic acids, saponins, and flavonoids, into the surrounding environment [4,5]. These compounds can exert allelopathic influences on both conspecific and heterospecific organisms [6]. Despite this, investigations into the specific allelochemicals present in PCH rhizomes remain scarce.
Allelochemicals released into the rhizosphere soil can adversely impact soil physicochemical characteristics and modify the composition of soil microbial communities. For example, certain carboxylic acids, including coumaric acid, have been reported to acidify soil, diminish soil organic matter (SOM) content, disrupt soil aggregate stability, and reduce soil aeration [7]. Additionally, these compounds may facilitate nutrient leaching, affecting essential elements such as nitrogen (N), phosphorus (P), and potassium (K) [8]. Polyphenolic compounds detected in the rhizosphere soils of tea plants have been shown to inhibit beneficial plant growth, promoting bacteria, including members of the genera Bacillus and Sphingomonas [9]. In the rhizosphere of Panax notoginseng, saponins have been implicated in promoting the proliferation of pathogenic microorganisms (such as Fusarium) while suppressing beneficial taxa (such as Saitozyma and Streptomyces), thereby increasing vulnerability to root rot disease [10]. Furthermore, flavonoids like quercetin dihydrate, quercitrin, and rutin have been found to enhance the growth of pathogenic fungi in the rhizosphere soil of the potato plant, including Alternaria solani, Botrytis cinerea, Fusarium solani, and Verticillium dahliae [11]. Collectively, these alterations in the physicochemical and biological properties of rhizosphere soil exert feedback effects that ultimately influence plant quality [12].
Biochars, produced through the pyrolysis of organic substrates such as wood, straw, and rice husk under high temperature and oxygen-limited conditions [13], have demonstrated multiple beneficial effects. These include (1) mitigation of allelopathic effects in various medicinal plants, such as Panax ginseng [14], Panax quinquefolius [15], Panax notoginseng [16], and Chrysanthemum [17]; (2) enhancement of soil nutrient status, optimization of soil structure, and modulation of soil pH [12]; (3) promotion of growth in medicinal plants like Sophora tonkinensis Gagnep [18] and Panax ginseng [14]; and (4) augmentation of the maximum sorption capacity of plant roots by increasing the number of functional groups on root cell walls, thereby altering root metabolite profiles [19]. However, biochars derived from different feedstocks often exhibit distinct physicochemical properties. For instance, biochars produced from rice straw, tea waste, and other agricultural residues vary in parameters such as pH, ash content, and nutrient composition [20]. Consequently, the application of different biochars may differentially influence the quality of PCH rhizomes and modulate allelopathic effects. Nonetheless, empirical evidence supporting this hypothesis remains limited.
To address these gaps, the present study employed a pot experiment utilizing the PCH cultivar Minchangjing 1 and three biochars derived from maize straw (MB), rice husk (RB), and tea stems (TB). The investigation focused on assessing (1) the concentrations of key compounds in the PCH rhizomes, including total polysaccharides (TPS), total flavonoids (TF), total saponins (TS), total polyphenols (TPP), total proteins (PRO), and free amino acids (FAAs); (2) the abundance of significant metabolites, encompassing allelochemicals, in PCH rhizomes (including allelochemicals) through non-targeted metabolomic analysis; and (3) the physicochemical properties and bacterial community composition of PCH rhizosphere soil. The overarching objective was to evaluate the potential of different biochars to enhance PCH rhizome quality while concurrently mitigating allelopathic effects, thereby promoting the sustainable cultivation of PCH.

2. Materials and Methods

2.1. Experimental Design

This study utilized the PCH cultivar Minchangjing 1, officially registered in 2024 by our research team. Sandy loam soil (depth < 20 cm) was collected from a cultivation site in Guangze County, Fujian Province, China (117.53° E, 27.18° N) [21]. Three commercial biochars (designated MB, RB, and TB) were purchased from Henan Lize Environmental Protection Technology Co., Ltd. (Zhengzhou, Henan Province, China). These biochars were produced via pyrolysis at temperatures ranging from 500 to 550 °C under oxygen-limited conditions.
The soil, biochars, and chicken manure were air-dried and sieved through a 2 mm mesh. Subsequently, the soil was thoroughly homogenized with basal fertilizers, biochars, and chicken manure according to the following specifications: (1) chicken manure was applied at 2% (w/w) per pot; (2) basal fertilizers were supplied at rates of 350 mg kg−1 N [(NH4)2SO4], 320 mg kg−1 P2O5 [Ca(H2PO4)2·CaSO4], and 100 mg kg−1 K2O (KH2PO4); and (3) biochars were incorporated at concentrations of 0% (control, CK), 2% MB (M1 or MB1), 2% TB (T1 or TB1), 2% RB (R1 or RB1), 4% MB (M2 or MB2), 4% TB (T2 or TB2), and 4% RB (R2 or RB2). This resulted in seven treatment groups, each with three biological replicates (one replicate per pot), and six plants per pot. Statistical analyses were performed at the pot level. Plant-level measurements were averaged per pot prior to statistical analysis. The prepared mixtures (2 kg per pot) were placed into plastic pots (14 cm length × 10 cm height) and allowed to stabilize at ambient temperature for three weeks.

2.2. Determination of Basic Physicochemical Properties of Biochars

The physicochemical characteristics of the biochars were assessed following the protocols described by Ma et al. [22]. The pH and electrical conductivity (EC) of biochar suspensions (solid-to-liquid ratio of 1:20) were measured using a pH meter (PHSJ-3F, Leici Technology Co., Ltd., Shanghai, China) and an EC meter (DDSJ-307F, Leici Technology Co., Ltd., Shanghai, China), respectively. Ash content was quantified via high-temperature ashing. Cation exchange capacity (CEC) was determined using the barium chloride–sulfuric acid method. Total N, P, and K contents were measured after digestion with H2SO4-H2O2, employing the Kjeldahl method for N, the molybdenum–antimony anti-ascorbic acid colorimetric method for P, and flame spectrophotometry for K, respectively. Detailed methodologies are provided in Supplementary Materials File S2. The results for pH, EC, ash content, CEC, total N (TN), total P (TP), and total K (TK) are presented in Table S1.

2.3. Structural Characterization of Biochars

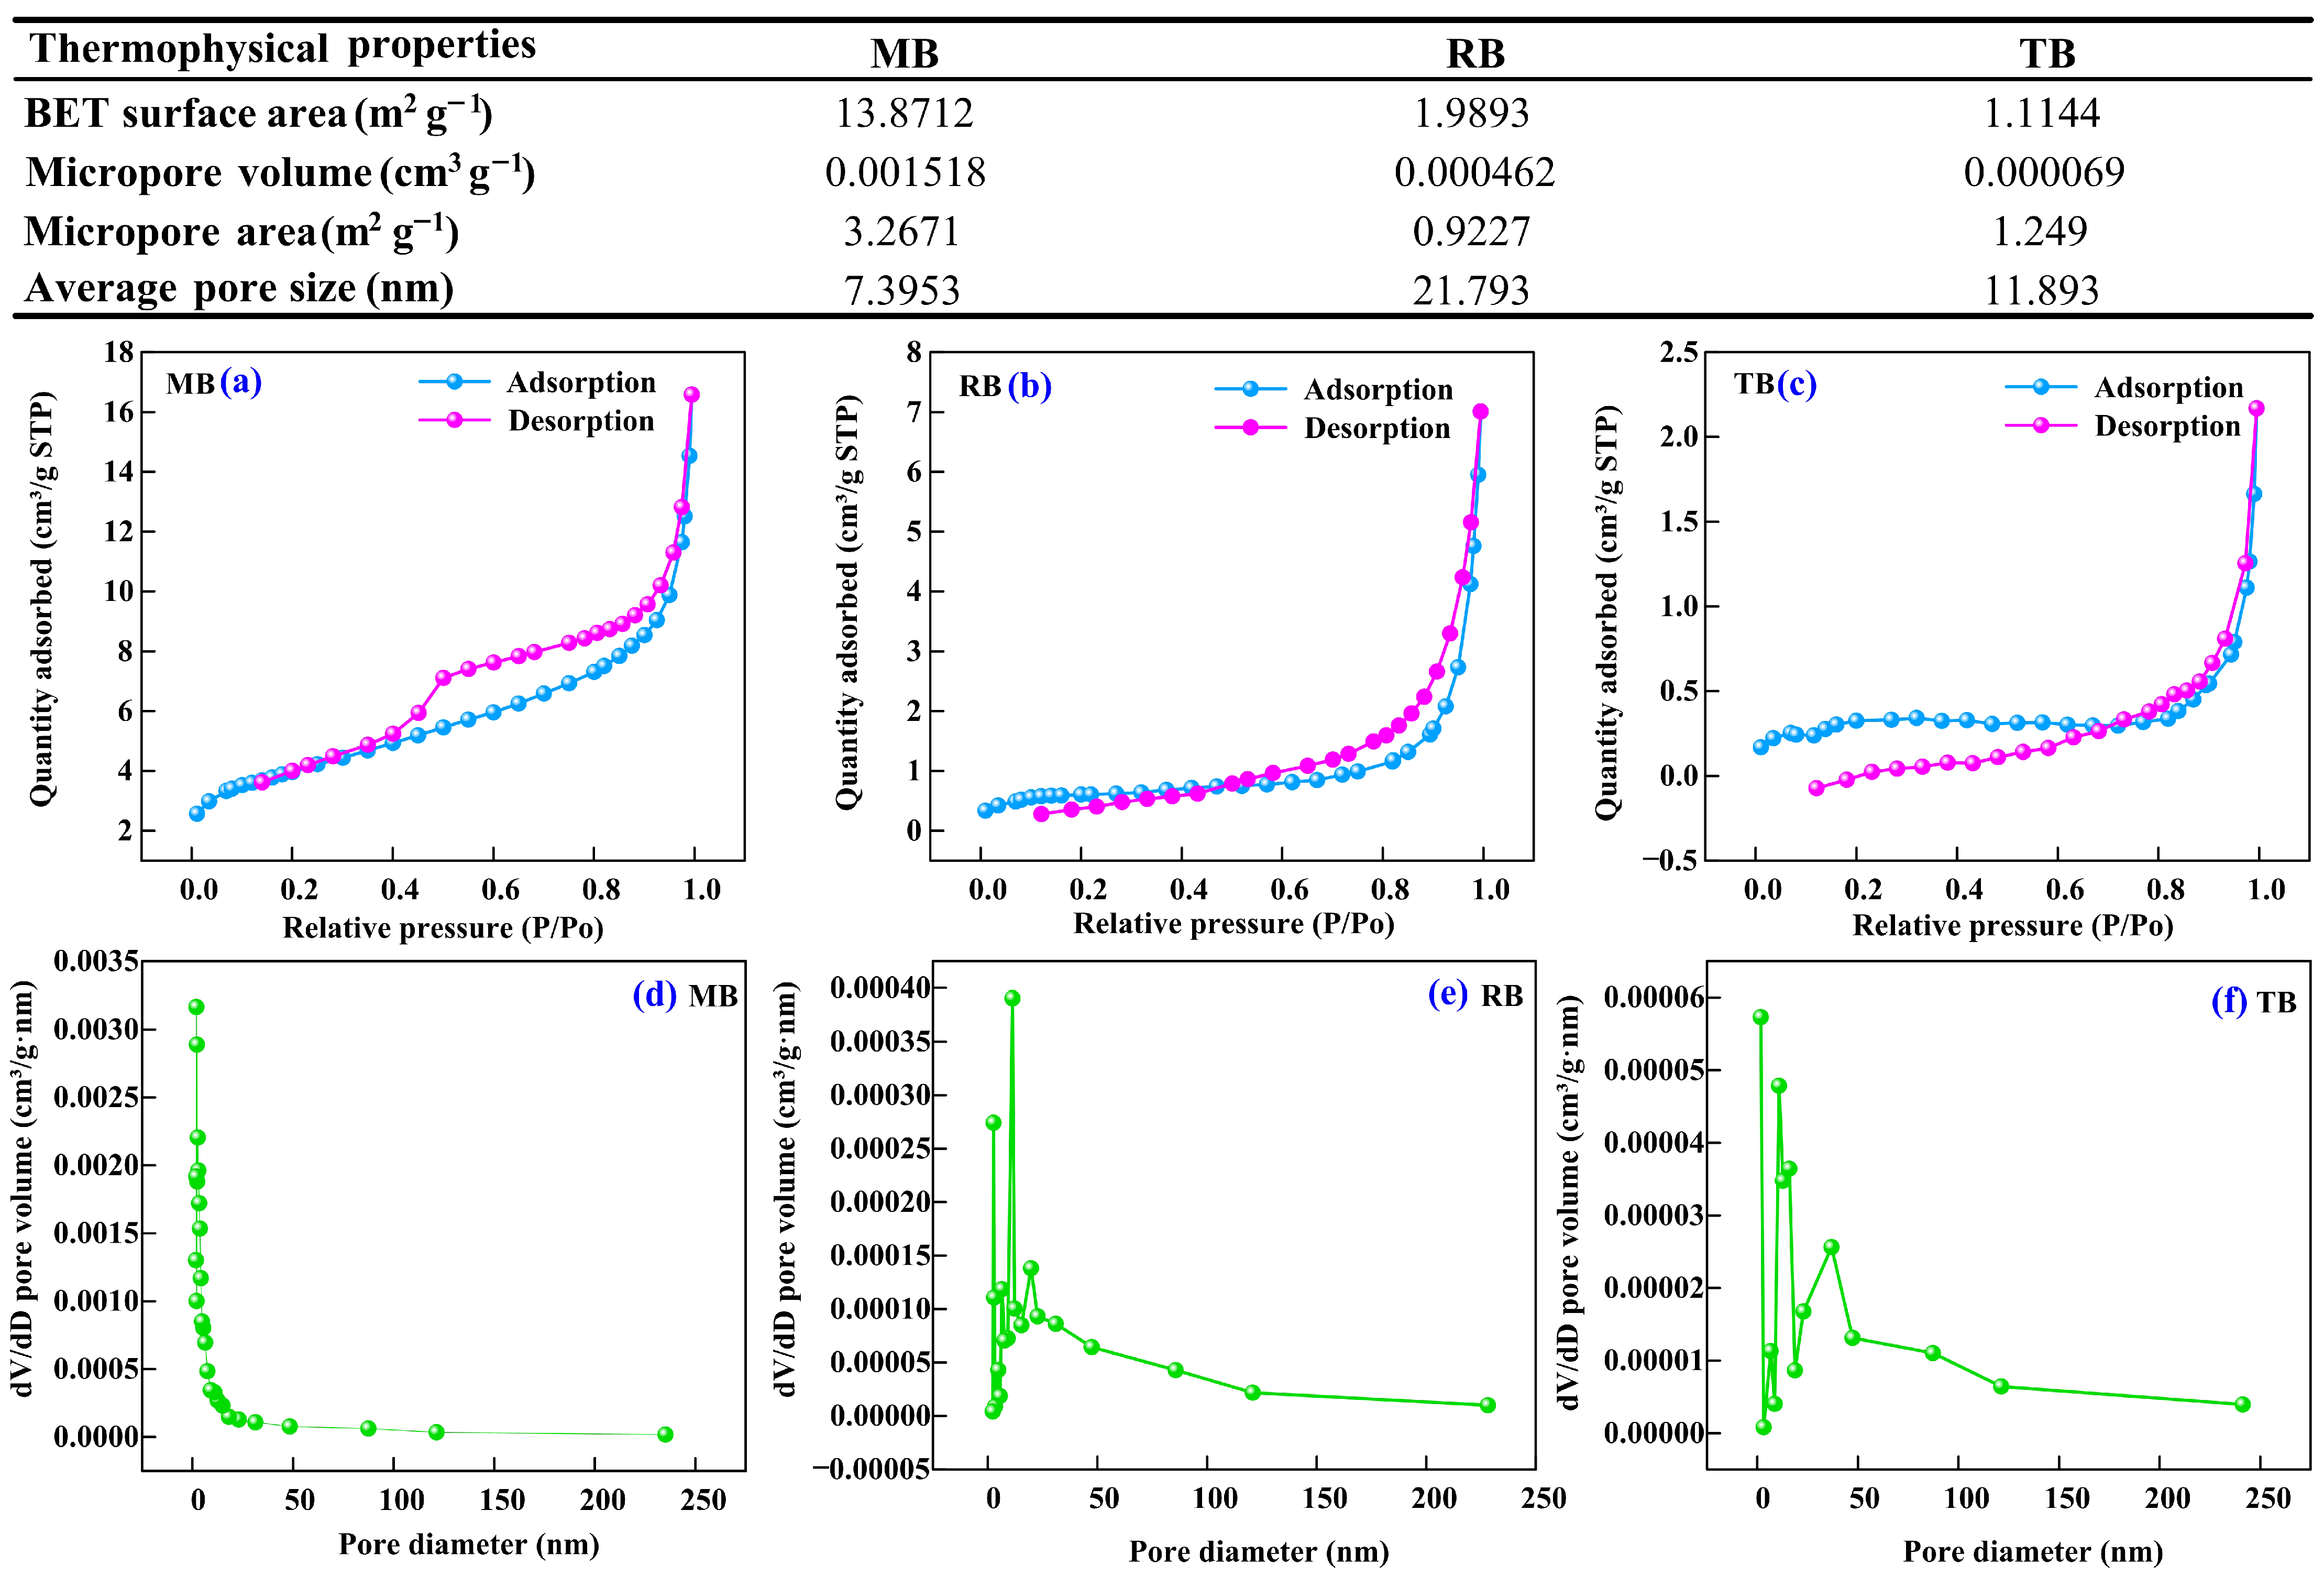
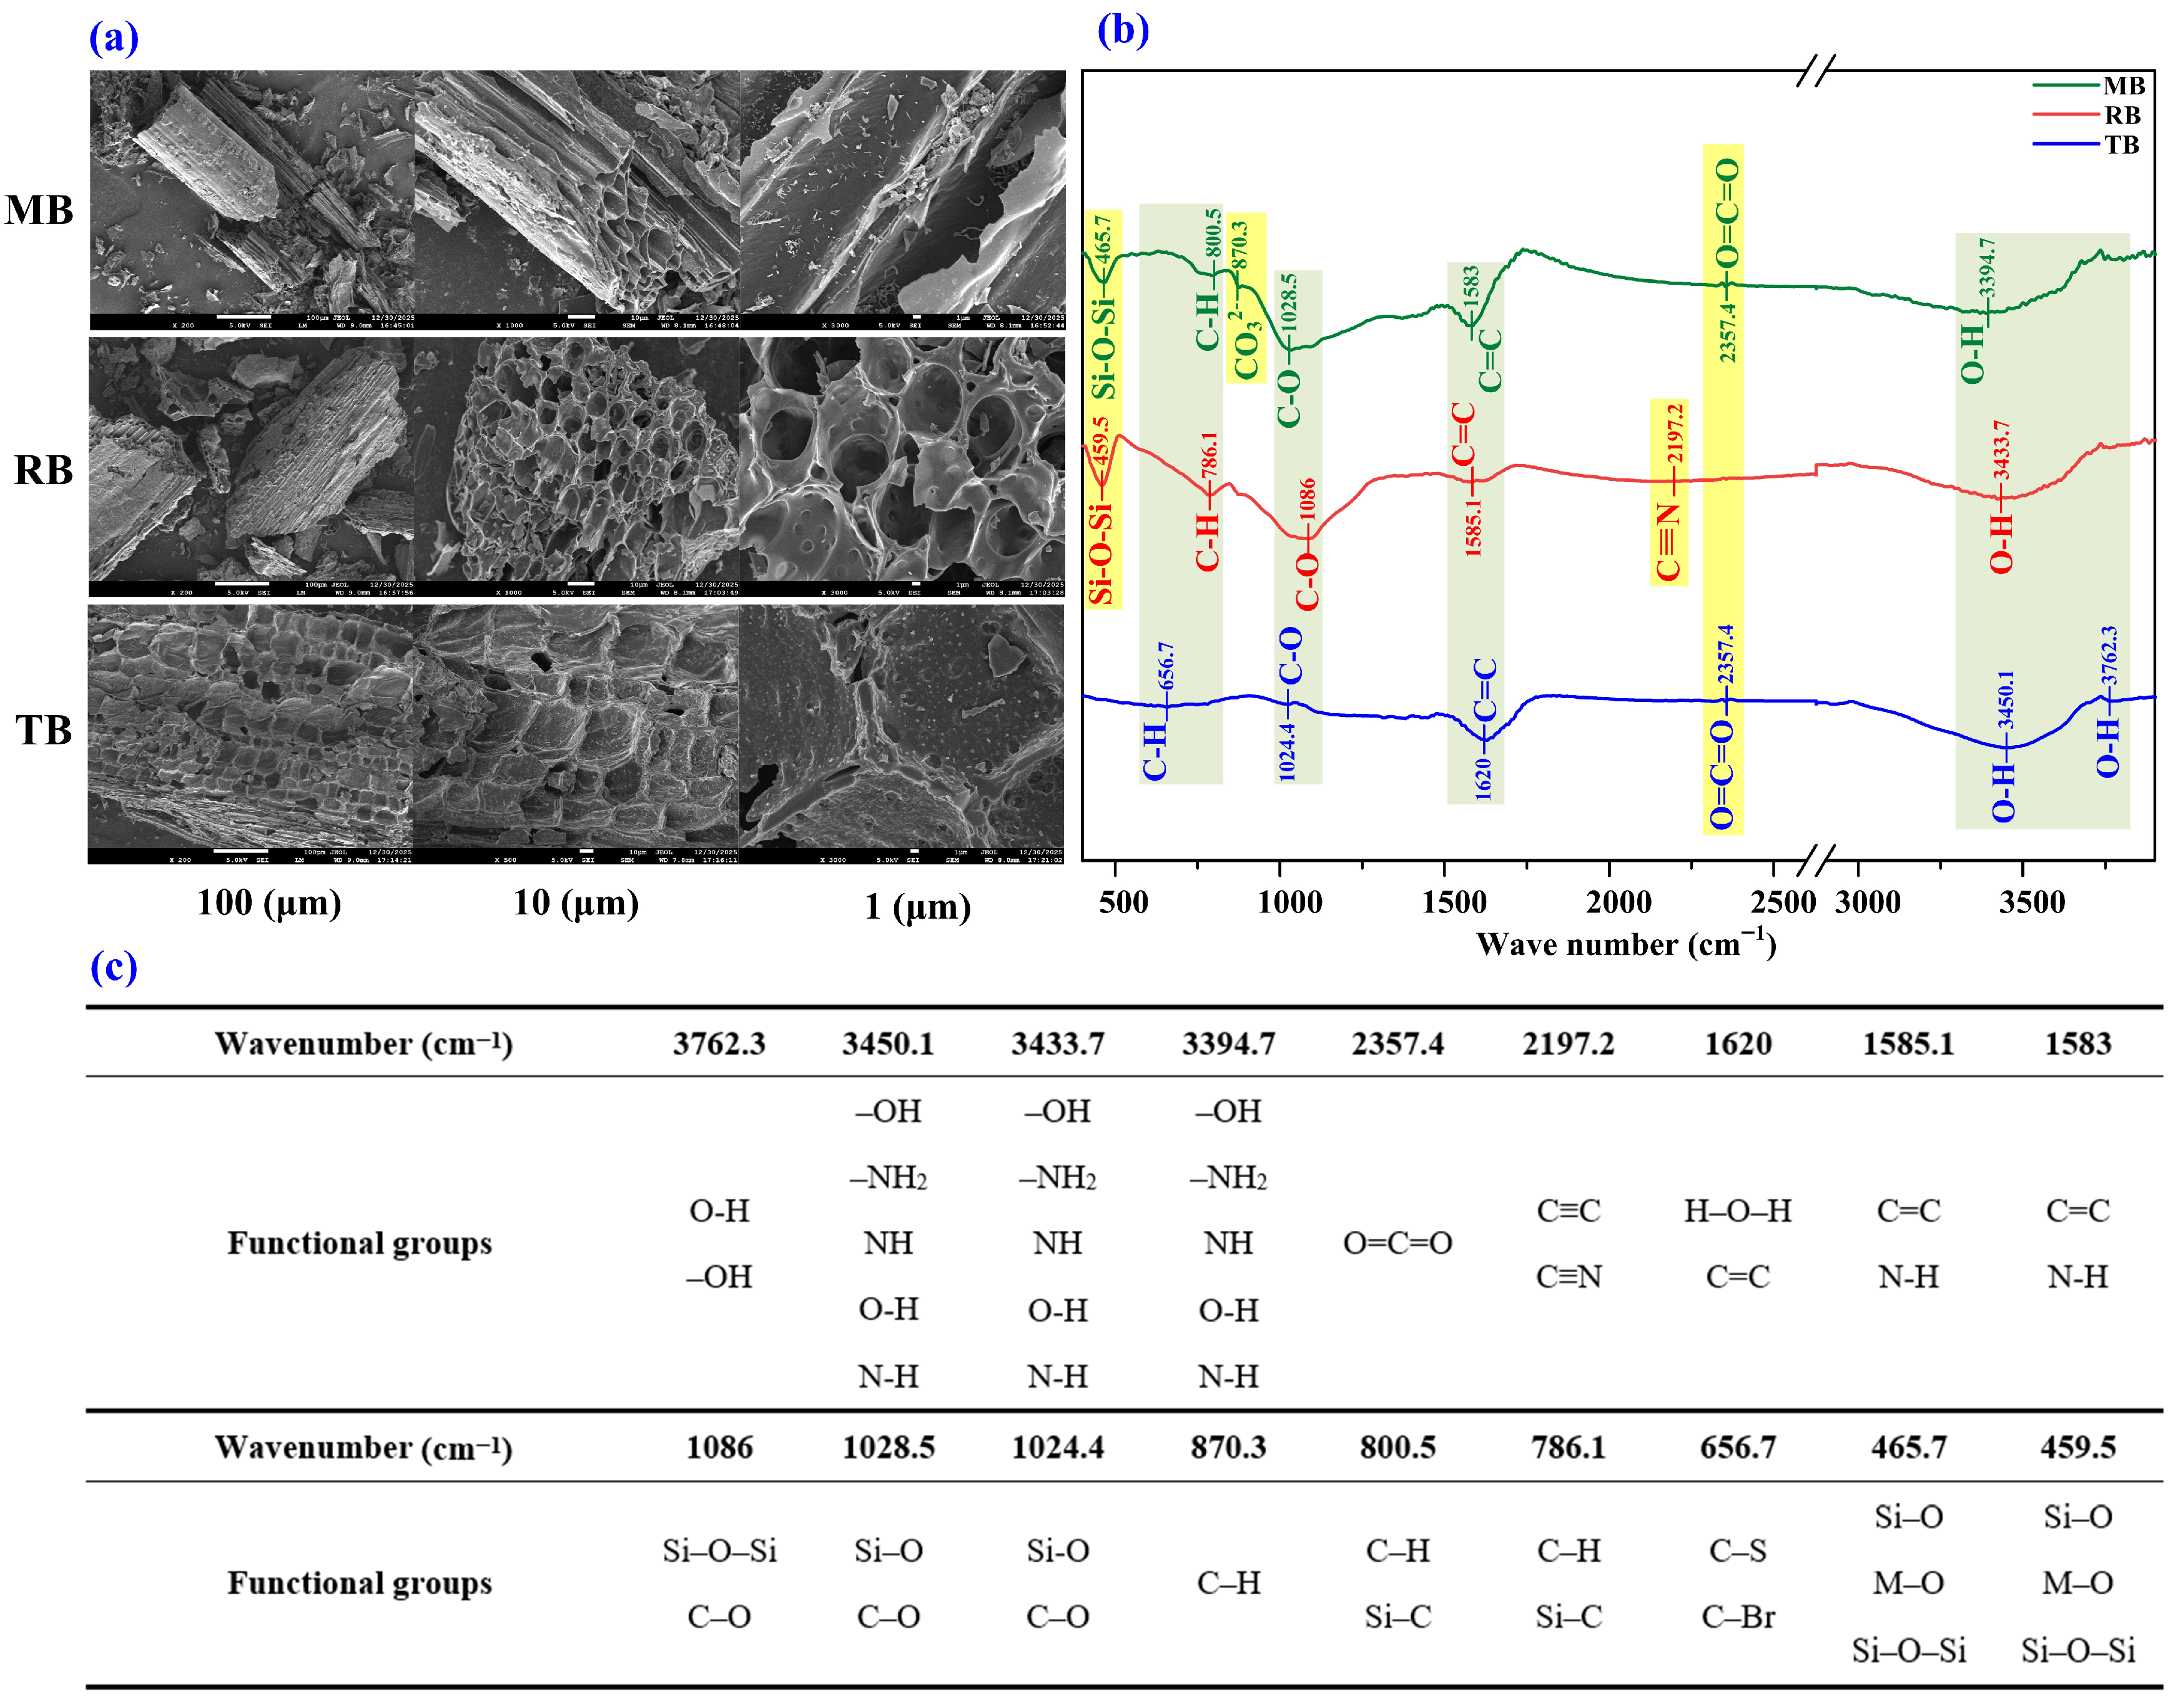
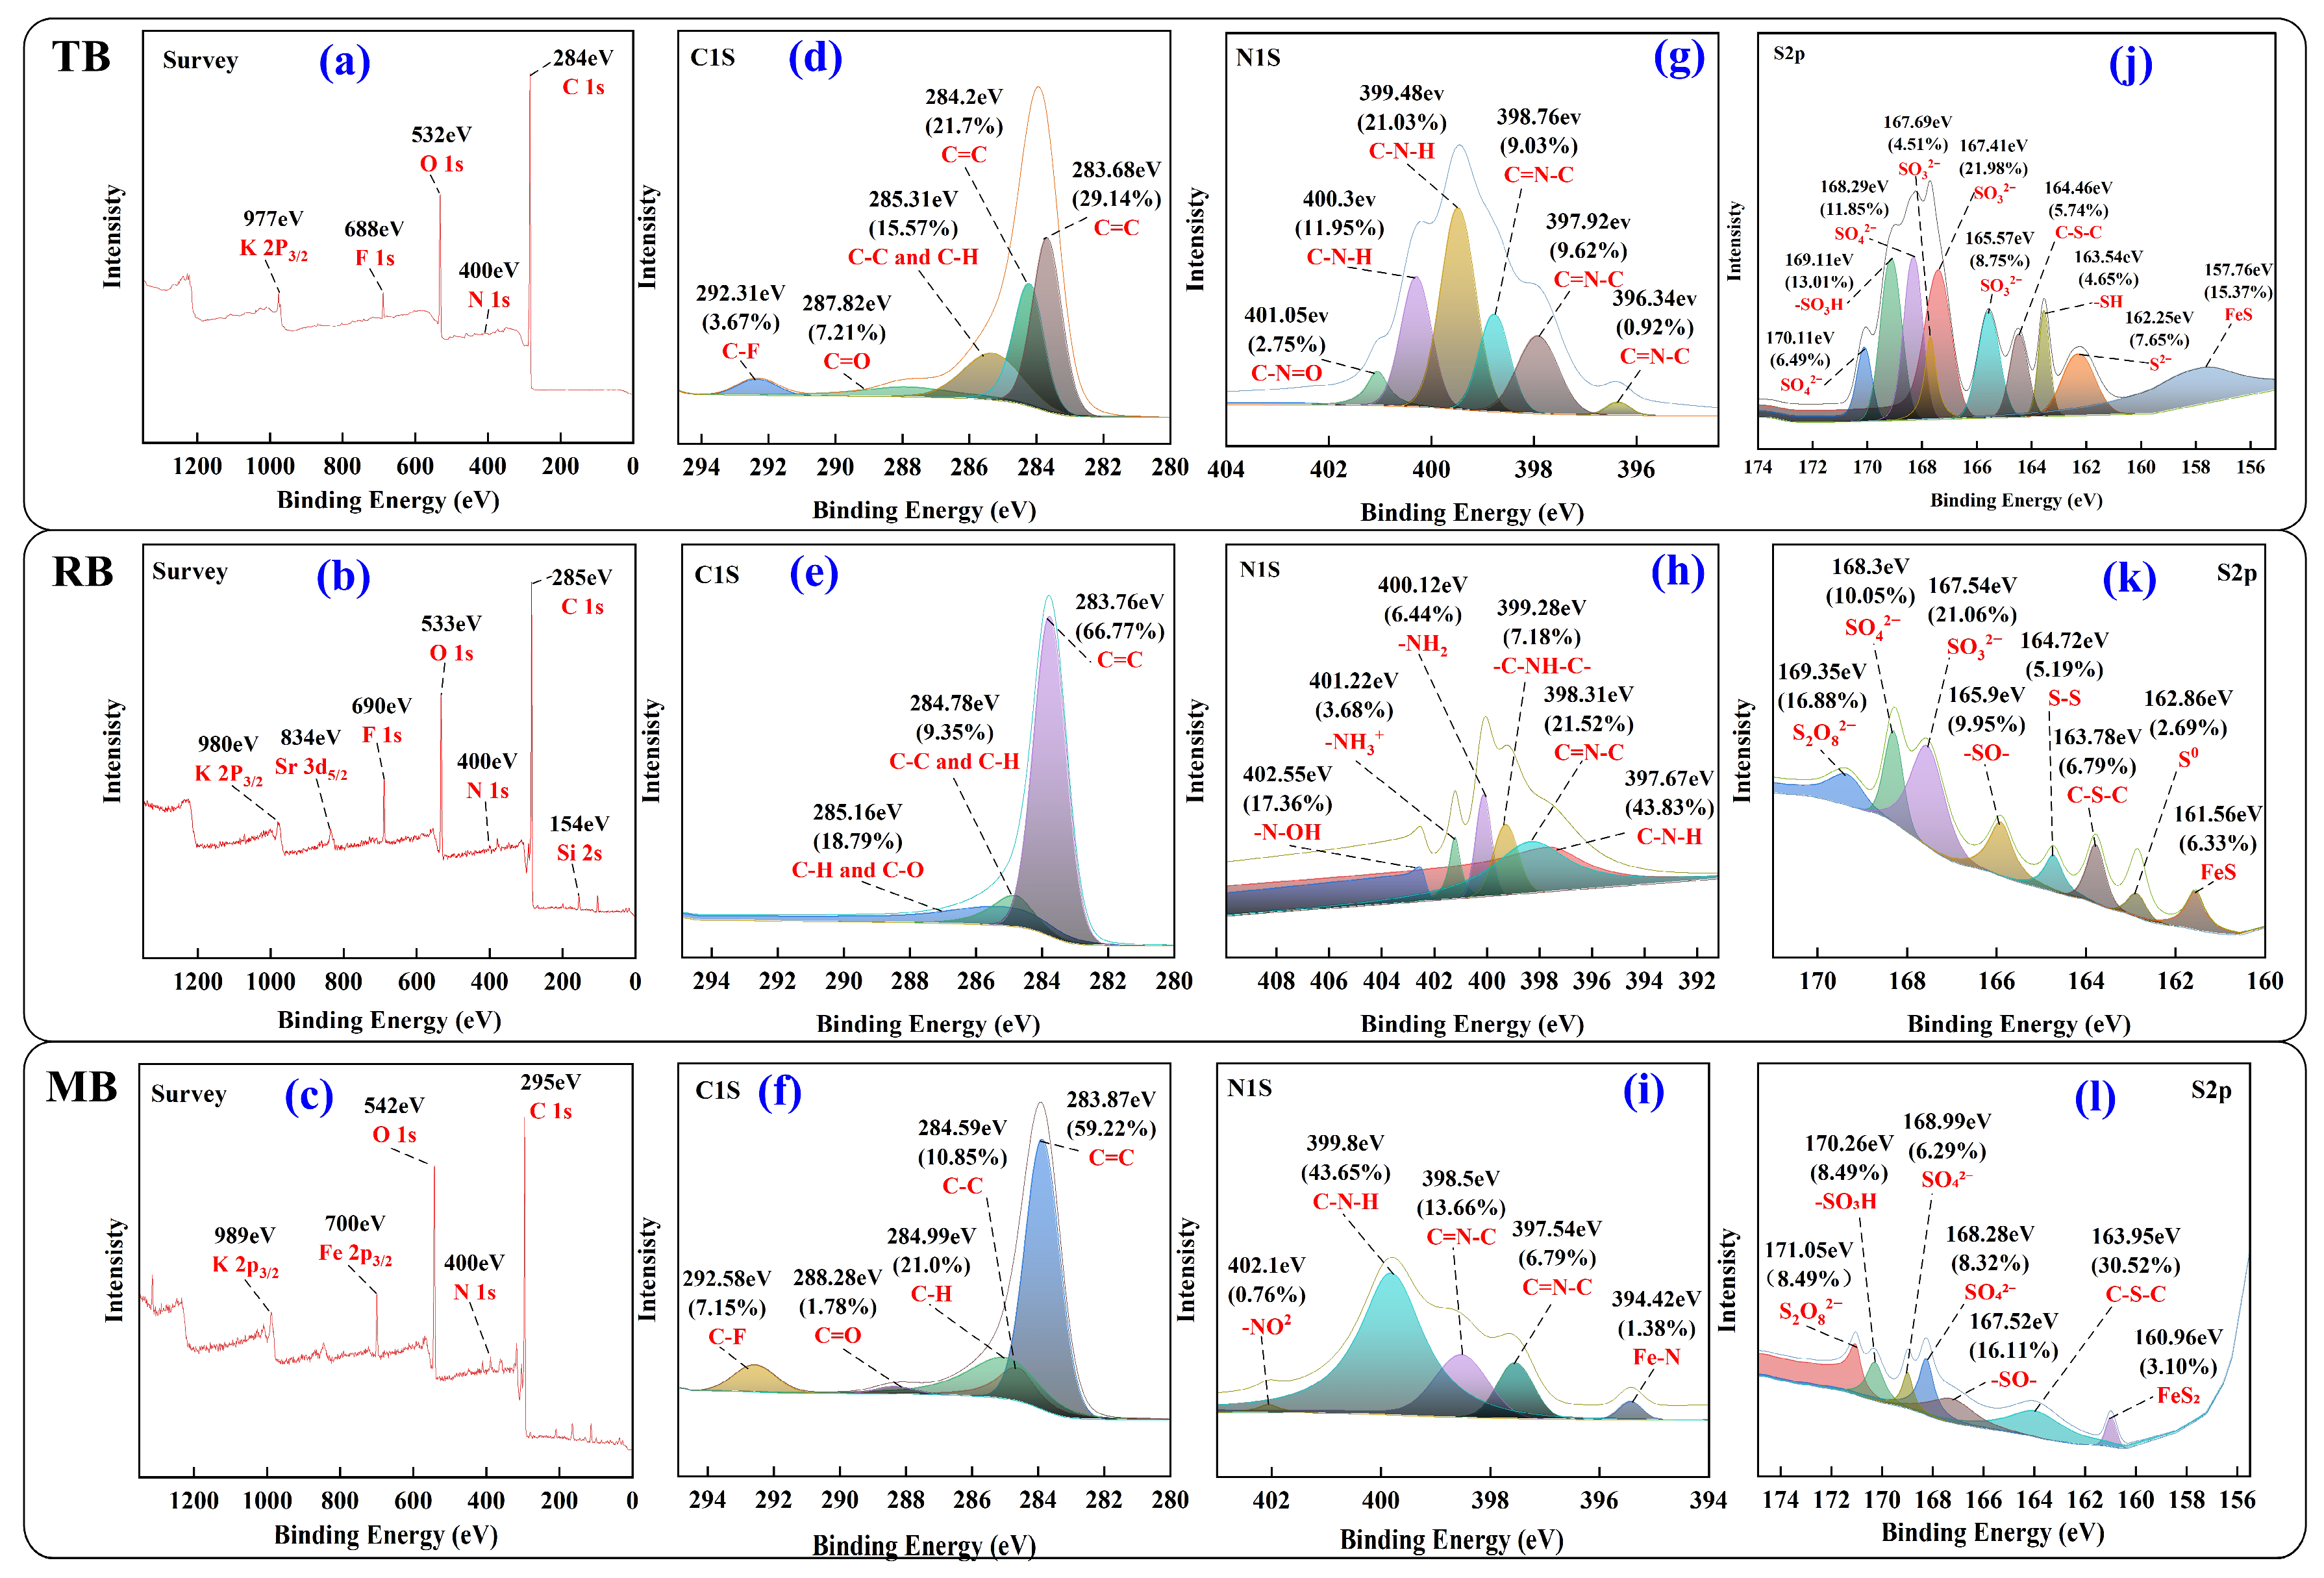
The biochars were further characterized for several physicochemical parameters, including Brunauer–Emmett–Teller (BET) surface area, micropore volume and area, average pore size, and N2 adsorption–desorption isotherms (Figure 1). Surface morphology was examined via scanning electron microscopy (SEM, JSM-7610F Plus, JEOL Ltd., Kyoto, Japan) (Figure 2a), surface elemental composition was analyzed using energy-dispersive X-ray spectroscopy (EDS, X-MaxN 80T, Oxford Instruments plc, Oxford, UK) (Figure S1), and surface functional groups were identified through Fourier transform infrared spectroscopy (FTIR, Nicolet iS 50 + Continuum, Thermo Fisher Scientific Inc., Waltham, MA, USA) (Figure 2b,c) and X-ray photoelectron spectroscopy (XPS, Kratos Axis Supra+ X, Shimadzu Corporation, Kyoto, Japan) (Figure 3). The specific analytical procedures are detailed in Supplementary Materials File S2.

2.4. Cultivation and Maintenance of PCH

Uniform and healthy PCH rhizomes of three-year-old PCH plants were collected and surface-sterilized through immersion in 0.1% potassium permanganate solution for 10 min, followed by thorough rinsing with deionized water. Six rhizomes were transplanted into each plastic pot, with a total of 21 pots arranged randomly within a greenhouse. Plants were cultivated under a red-to-blue LED light ratio of 3:1, with a photosynthetic photon flux density of 170 μmol m−2 s−1 and a photoperiod of 16 h light/8 h dark. Temperature was controlled at 26 ± 1 °C during the day and 18 ± 1 °C at night, with relative humidity maintained between 60% and 70% via an automated humidification/dehumidification system. Soil moisture was maintained at 70% of field capacity using the gravimetric method.

2.5. Collection and Analysis of PCH Rhizosphere Soil

2.5.1. Rhizosphere Soil Sampling and Physicochemical Property Analysis

After six months of biochar treatment, PCH rhizomes were harvested. Soil particles adhering to the rhizomes were gently brushed off and collected and sieved to remove large debris, defined as the rhizosphere soil. A total of 21 soil samples were collected (7 treatments × 3 replicates), with soil from six rhizomes per pot combined into a single sample. Portions of these samples were air-dried for physicochemical analyses conducted according to Lu [23]. Soil pH and EC were measured at a soil-to-water ratio of 1:2.5 using a digital pH meter (PHS-25, Leici Technology Co., Ltd., Shanghai, China) and a portable conductivity meter (DDSJ-308F, Leici Technology Co., Ltd., Shanghai, China), respectively. CEC was determined by means of ammonium acetate extraction followed by inductively coupled plasma optical emission spectrometry (Thermo iCAP 7000, Thermo Fisher Scientific, Waltham, MA, USA). Soil organic matter (SOM) content was quantified via oxidation with potassium dichromate in concentrated sulfuric acid, followed by titration to determine the oxidant consumption. Total N (TN) was measured after digestion with concentrated sulfuric acid and subsequently using an automatic Kjeldahl nitrogen analyzer (K1100, Hanon Future Technology Group Co., Ltd., Jinan, China). Available N (AN) was determined by means of sodium hydroxide hydrolysis and boric acid absorption. Total P (TP) was quantified following digestion with perchloric acid–sulfuric acid, and available P (AP) was extracted using 0.03 mol/L ammonium fluoride solution (pH 8.5), with both analyzed spectrophotometrically via the molybdenum–antimony anti-ascorbic acid colorimetric method (UV-1601, Beijing Beifen-Ruili Analytical Instrument (Group) Co., Ltd., Beijing, China). Total K (TK) was determined by means of high-temperature fusion with sodium hydroxide and available K (AK) was extracted using ammonium acetate solution (pH 7.0), with concentrations measured by means of flame photometry (AA-3800, Metash Instruments Co., Ltd., Shanghai, China).

2.5.2. Microbial Community Analysis of Rhizosphere Soil

A subset of rhizosphere soil samples was immediately frozen in liquid nitrogen for DNA extraction and subsequent bacterial community profiling at Majorbio Bio-Pharm Technology Co., Ltd. (Shanghai, China). Genomic DNA was extracted from 0.5 g of frozen soil samples using the E.Z.N.A.® Soil DNA Kit (Omega Bio-tek, Norcross, GA, USA). The V3–V4 hypervariable regions of the 16S rRNA gene were amplified via polymerase chain reaction (PCR) using primers 338F (5′-ACTCCTACGGGAGGCAGCAG-3′) and 806R (5′-GGACTACHVGGGTWTCTAAT-3′) [21]. PCR products were purified, quantified, and used to construct sequencing libraries with the NEXTFLEX Rapid DNA-Seq Kit (Revvity, Inc., Waltham, MA, USA), involving adapter ligation, magnetic bead-based removal of adapter dimers, PCR enrichment, and final purification. Paired-end sequencing was performed on an Illumina NextSeq2000 platform (Illumina, San Diego, CA, USA). Raw sequencing data were deposited in the NCBI Sequence Read Archive (SRA) under accession number PRJNA1394316. Bioinformatic processing included quality filtering, amplicon sequence variant (ASV) inference via DADA2 (v. 1.28.0) denoising, taxonomic annotation against the Silva 16S rRNA database (v. 138), and analyses of microbial alpha and beta diversity.

2.6. Collection and Analysis of Pch Rhizomes: Biomass, Metabolomics, and Key Compounds

2.6.1. Collection of PCH Rhizomes and Biomass Determination

All six rhizomes per pot were washed with tap water to remove soil and debris; fibrous roots were excised, followed by rinsing with deionized water and blotting dry. Three rhizomes were randomly selected per pot and pooled as one experimental replicate. Fresh weight was measured using an electronic analytical balance (ME204E, Mettler Toledo, Greifensee, Switzerland). Samples were then deactivated at 105 °C for 30 min and oven-dried at 60 °C to constant weight, after which dry weight was recorded (n = 3 biological replicates). The remaining three rhizomes per pot were pooled, sectioned, rapidly frozen in liquid nitrogen, and stored at −80 °C for metabolomic analysis.

2.6.2. Metabolomic Profiling of PCH Rhizomes

Metabolomic analyses were conducted at Majorbio Bio-Pharm Technology Co., Ltd., following the protocol of Zhu et al. [24]. Approximately 100 mg of frozen rhizome tissue was extracted with 800 μL of methanol–water solution (4:1, v/v) using low-temperature ultrasonic treatment. Chromatographic separation was performed on a ACQUITY UPLC system (Waters Corporation, Milford, MA, USA) equipped with a BEH C18 column (100 mm × 2.1 mm, 1.7 μm particle size). Mobile phases consisted of 0.1% formic acid in water (phase A) and acetonitrile with 0.1% formic acid (phase B). Further methodological details are provided in Supplementary Materials File S2.

2.6.3. Quantification of Key Compounds in PCH Rhizomes

Remaining rhizome samples were oven-dried at 60 °C, ground into powder, and sieved through a 50-mesh screen for the determination of quality indices including TPS, TF, TS, TPP, PRO, FAA, water-soluble extracts (WSEs), and dry matter content (DMC). TPS content was measured according to the Chinese Pharmacopoeia [1]. TF concentrations were quantified using a rutin standard curve [25]. TS content was determined following the method of Peng et al. [26]. TPP concentration was assessed using a gallic acid standard curve [27]. PRO and FAA contents were determined in accordance with the National Food Safety Standard [28] via the Kjeldahl method. WSE content was determined as per the Chinese Pharmacopoeia [1]. Fresh rhizomes were sliced thinly, oven-dried at 60 °C to constant weight, and DMC was calculated as the percentage of dry weight relative to initial fresh weight. Detailed protocols are available in Supplementary Materials File S2.

2.7. Data Analysis

Physicochemical properties of soil and biochar, as well as key compound contents, were expressed as means ± standard error (SE, n = 3). Statistical analyses were performed using SPSS version 22.0. One-way analysis of variance (ANOVA) followed by Tukey’s multiple comparison test was employed to assess significant differences among treatments (p ≤ 0.05). Graphical representations were generated using Origin 2021 and Microsoft Office Visio 2016.
Microbial community and metabolomic data (n = 3) were analyzed and visualized using the cloud platform of Majorbio Bio-Pharm Technology Co., Ltd. The associated raw data were present in https://www.majorbio.com/. Differentially accumulated metabolites (DAMs) were identified based on three integrated criteria: (1) variable importance in projection (VIP) score > 1.0 from orthogonal partial least squares-discriminant analysis (OPLS-DA, SIMCA-P v14.1), validated though seven-fold cross-validation and permutation testing (R2Y = 0.996, Q2 = 0.986); (2) statistical significance with a false discovery rate (FDR) < 0.05, where FDR was adjusted from the original p-values of Student’s t-test using the Benjamini–Hochberg method; and (3) an absolute log2 fold change (|log2FC|) ≥ 1.0. Additional details on microbiome data processing and metabolomic analyses are provided in Supplementary Materials File S2.

3. Results

3.1. Isothermal Adsorption–Desorption Curve Analysis and Specific Surface Area Analysis

Maize straw biochar (MB) exhibited the highest BET specific surface area of 13.87 m2 g−1, along with a micropore volume of 0.0015 cm3 g−1, and a micropore surface area of 3.27 m2 g−1 (Table in Figure 1). These characteristics indicate a well-developed porous structure with abundant active sites. In contrast, rice husk biochar (RB) and tea stem biochar (TB) demonstrated comparatively lower micropore volumes and surface areas. RB had the largest average pore diameter of 21.79 nm, suggesting a more open pore architecture that facilitates material transport. TB and MB had average pore sizes of 11.89 nm and 7.40 nm, respectively.
Increased relative pressure (P/P0) enhanced the nitrogen (N2) adsorption capacity on the pore surfaces of the three biochars (Figure 1a–c). At lower pressures, N2 adsorption capacity increased gradually, corresponding to monolayer formation (Figure 1a–c). When the pressure exceeded 0.9 P/P0, a rapid increase in N2 adsorption capacity was observed, indicating multilayer adsorption and subsequent N2 condensation within the pores (Figure 1a–c). Notably, the adsorption and desorption curves for all three biochars exhibited poor overlap, resulting in a hysteresis loop (Figure 1a–c). This phenomenon suggests the presence of mesoporous structures with capillary condensation effects.
Among the biochars, MB demonstrated the highest N2 adsorption capacity, while TB exhibited the lowest (Figure 1a–c). At P/P0 values nearing 1.0, MB’s adsorption capacity reached approximately 16 cm3 g−1 (STP) (Figure 1a), compared to 7 cm3 g−1 for RB (Figure 1b) and 2 cm3 g−1 for TB (Figure 1c). The pronounced hysteresis loop observed in MB (Figure 1a) indicates the presence of mesopores (2–50 nm) and a complex pore architecture. In contrast, RB and TB displayed less distinct hysteresis loops (Figure 1b,c), suggesting a lower abundance of mesopores and less structural complexity, particularly in TB. The gradual increase in adsorption capacity at low P/P0 for MB implies a microporous structure with abundant adsorption sites for N2. Conversely, the lower adsorption capacities and slower rates of increase for RB and TB suggest smaller specific surface areas and fewer adsorption sites.
Pore volume distribution analysis revealed that MB exhibited a rapid decrease in pore volume (dV/dD) within the small pore size range (<50 nm) (Figure 1d). This observation indicates a predominance of small pores such as micropores or small mesopores, with the presence of minimal large pores (>50 nm). In contrast, RB and TB displayed irregular pore volumes for pores smaller than 50 nm and a decrease in pore volume for pores larger than 50 nm (Figure 1e,f). These findings suggest that RB and TB possess a more heterogeneous pore size distribution and a higher proportion of large pores compared to MB.

3.2. X-Ray Photoelectron Spectroscopy (XPS) Analysis

Full-spectrum XPS analysis (Figure 3) revealed distinct elemental compositions among the biochars: TB contained carbon (C), oxygen (O), nitrogen (N), fluorine (F), and potassium (K); RB comprised C, O, N, sulfur (S), and silicon (Si); and MB included C, O, N, S, and iron (Fe) (Figure 3a–c).
High-resolution C 1s XPS spectra revealed that TB contained the following chemical bonds: C=C (284.2 eV, 21.7%), C=C (283.68 eV, 29.14%), C–C/C–H (285.31 eV, 15.57%), C–F (292.31 eV, 3.67%), and C=O (287.82 eV, 7.21%) (Figure 3d). In contrast, RB was characterized predominantly by C=C (283.76 eV, 66.77%), C–C/C–H (284.78 eV, 9.35%), and C–H/C–O (285.16 eV, 18.79%) bonds (Figure 3e). MB exhibited C=C (283.87 eV, 59.22%), C–C (284.59 eV, 10.85%), C–H (284.99 eV, 21.00%), C=O (288.28 eV, 1.78%), and C–F (292.58 eV, 7.15%) bonds (Figure 3f).
Analysis of the high-resolution N 1s spectra revealed that TB contained multiple nitrogen-containing bonds. These included C–N–H (399.48 eV, 21.03%), C–N–H (400.3 eV, 11.95%), C–N=O (401.05 eV, 2.75%), and various C=N–C configurations (398.76 eV, 9.03%; 397.92 eV, 9.62%; 396.34 eV, 0.92%) (Figure 3g). In contrast, RB exhibited bonds such as –C–NH–C– (399.28 eV, 7.18%), C–N–H (397.67 eV, 43.83%), C=N–C (398.31 eV, 21.52%), –NH2 (400.12 eV, 6.44%), –NH3+ (401.22 eV, 3.68%), and –N–OH (402.55 eV, 17.36%) (Figure 3h). MB presented bonds including –NO2 (402.1 eV, 0.76%), C–N–H (399.8 eV, 43.65%), C=N–C (398.5 eV, 13.66%), C=N–C (397.54 eV, 6.79%), and Fe–N (394.42 eV, 1.38%) (Figure 3i).
The high-resolution S 2p spectra revealed that TB exhibited bonds corresponding to FeS (157.76 eV, 15.37%), S2− (162.25 eV, 7.65%), –SH (163.54 eV, 4.65%), C–S–C (164.46 eV, 5.74%), SO32− (165.57 eV, 8.75%; 167.41 eV, 21.98%; 167.69 eV, 4.51%), SO42− (168.29 eV, 11.85%; 170.11 eV, 6.49%), and –SO3H (169.11 eV, 13.01%) (Figure 3j). In contrast, RB contained FeS (161.56 eV, 6.33%), S0 (162.86 eV, 2.69%), C–S–C (163.78 eV, 6.79%), S–S (164.72 eV, 5.19%), –SO– (165.9 eV, 9.95%), SO32− (167.54 eV, 21.06%), SO42− (168.3 eV, 10.05%), and S2O82− (169.35 eV, 16.88%) bonds (Figure 3k). Additionally, MB displayed FeS2 (160.96 eV, 3.10%), C–S–C (163.95 eV, 30.52%), –SO– (167.52 eV, 16.11%), SO42− (168.28 eV, 8.32%; 168.99 eV, 6.29%), –SO3H (170.26 eV, 8.49%), and S2O82− (171.05 eV, 8.49%) bonds (Figure 3l).

3.3. Scanning Electron Microscopy (SEM) and Fourier Transform Infrared (FTIR) Analysis

At a magnification of 100 μm (Figure 2a), MB exhibited a loose and aggregated structure characterized by numerous strips and debris. RB displayed blocky and strip-shaped aggregates, whereas TB demonstrated a continuous layered or honeycomb-like dense structure. At 10 μm magnification (Figure 2a), MB revealed irregular pores and an overall loose architecture; RB showed a uniform honeycomb-like porous structure with well-connected pores; and TB exhibited a uniform and compact pore arrangement. At the highest magnification of 1 μm (Figure 2a), MB presented rough, fragmented fibers and flaky features; RB had smooth pore walls with a regular pore structure; and TB showed a higher density with relatively fine texture.
FTIR analysis (Figure 2b) indicated that all three biochars contained C–O bonds (associated with alcohols and ethers), C=C bonds (aromatic ring structures), and O–H bonds (hydroxyl groups), confirming the presence of oxygen-containing functional groups and/or aromatic rings. Specifically, MB exhibited Si–O–Si bonds (465/800 cm−1), CO32− functional groups (870 cm−1), and O=C=O bonds (2357 cm−1) (Figure 2b). RB showed Si–O–Si bonds (460 cm−1), C–H bonds (786 cm−1), and C≡N bonds (2197 cm−1). TB lacked Si–O–Si bonds but contained C–H bonds (656 cm−1), O=C=O bonds (2357 cm−1), and hydroxyl groups (3450 and 3762 cm−1), which were absent in MB and RB. These variations in functional groups likely influence the surface chemical properties of the biochars and, consequently, their adsorption capacities.

3.4. Quality Assessment of PCH Rhizomes

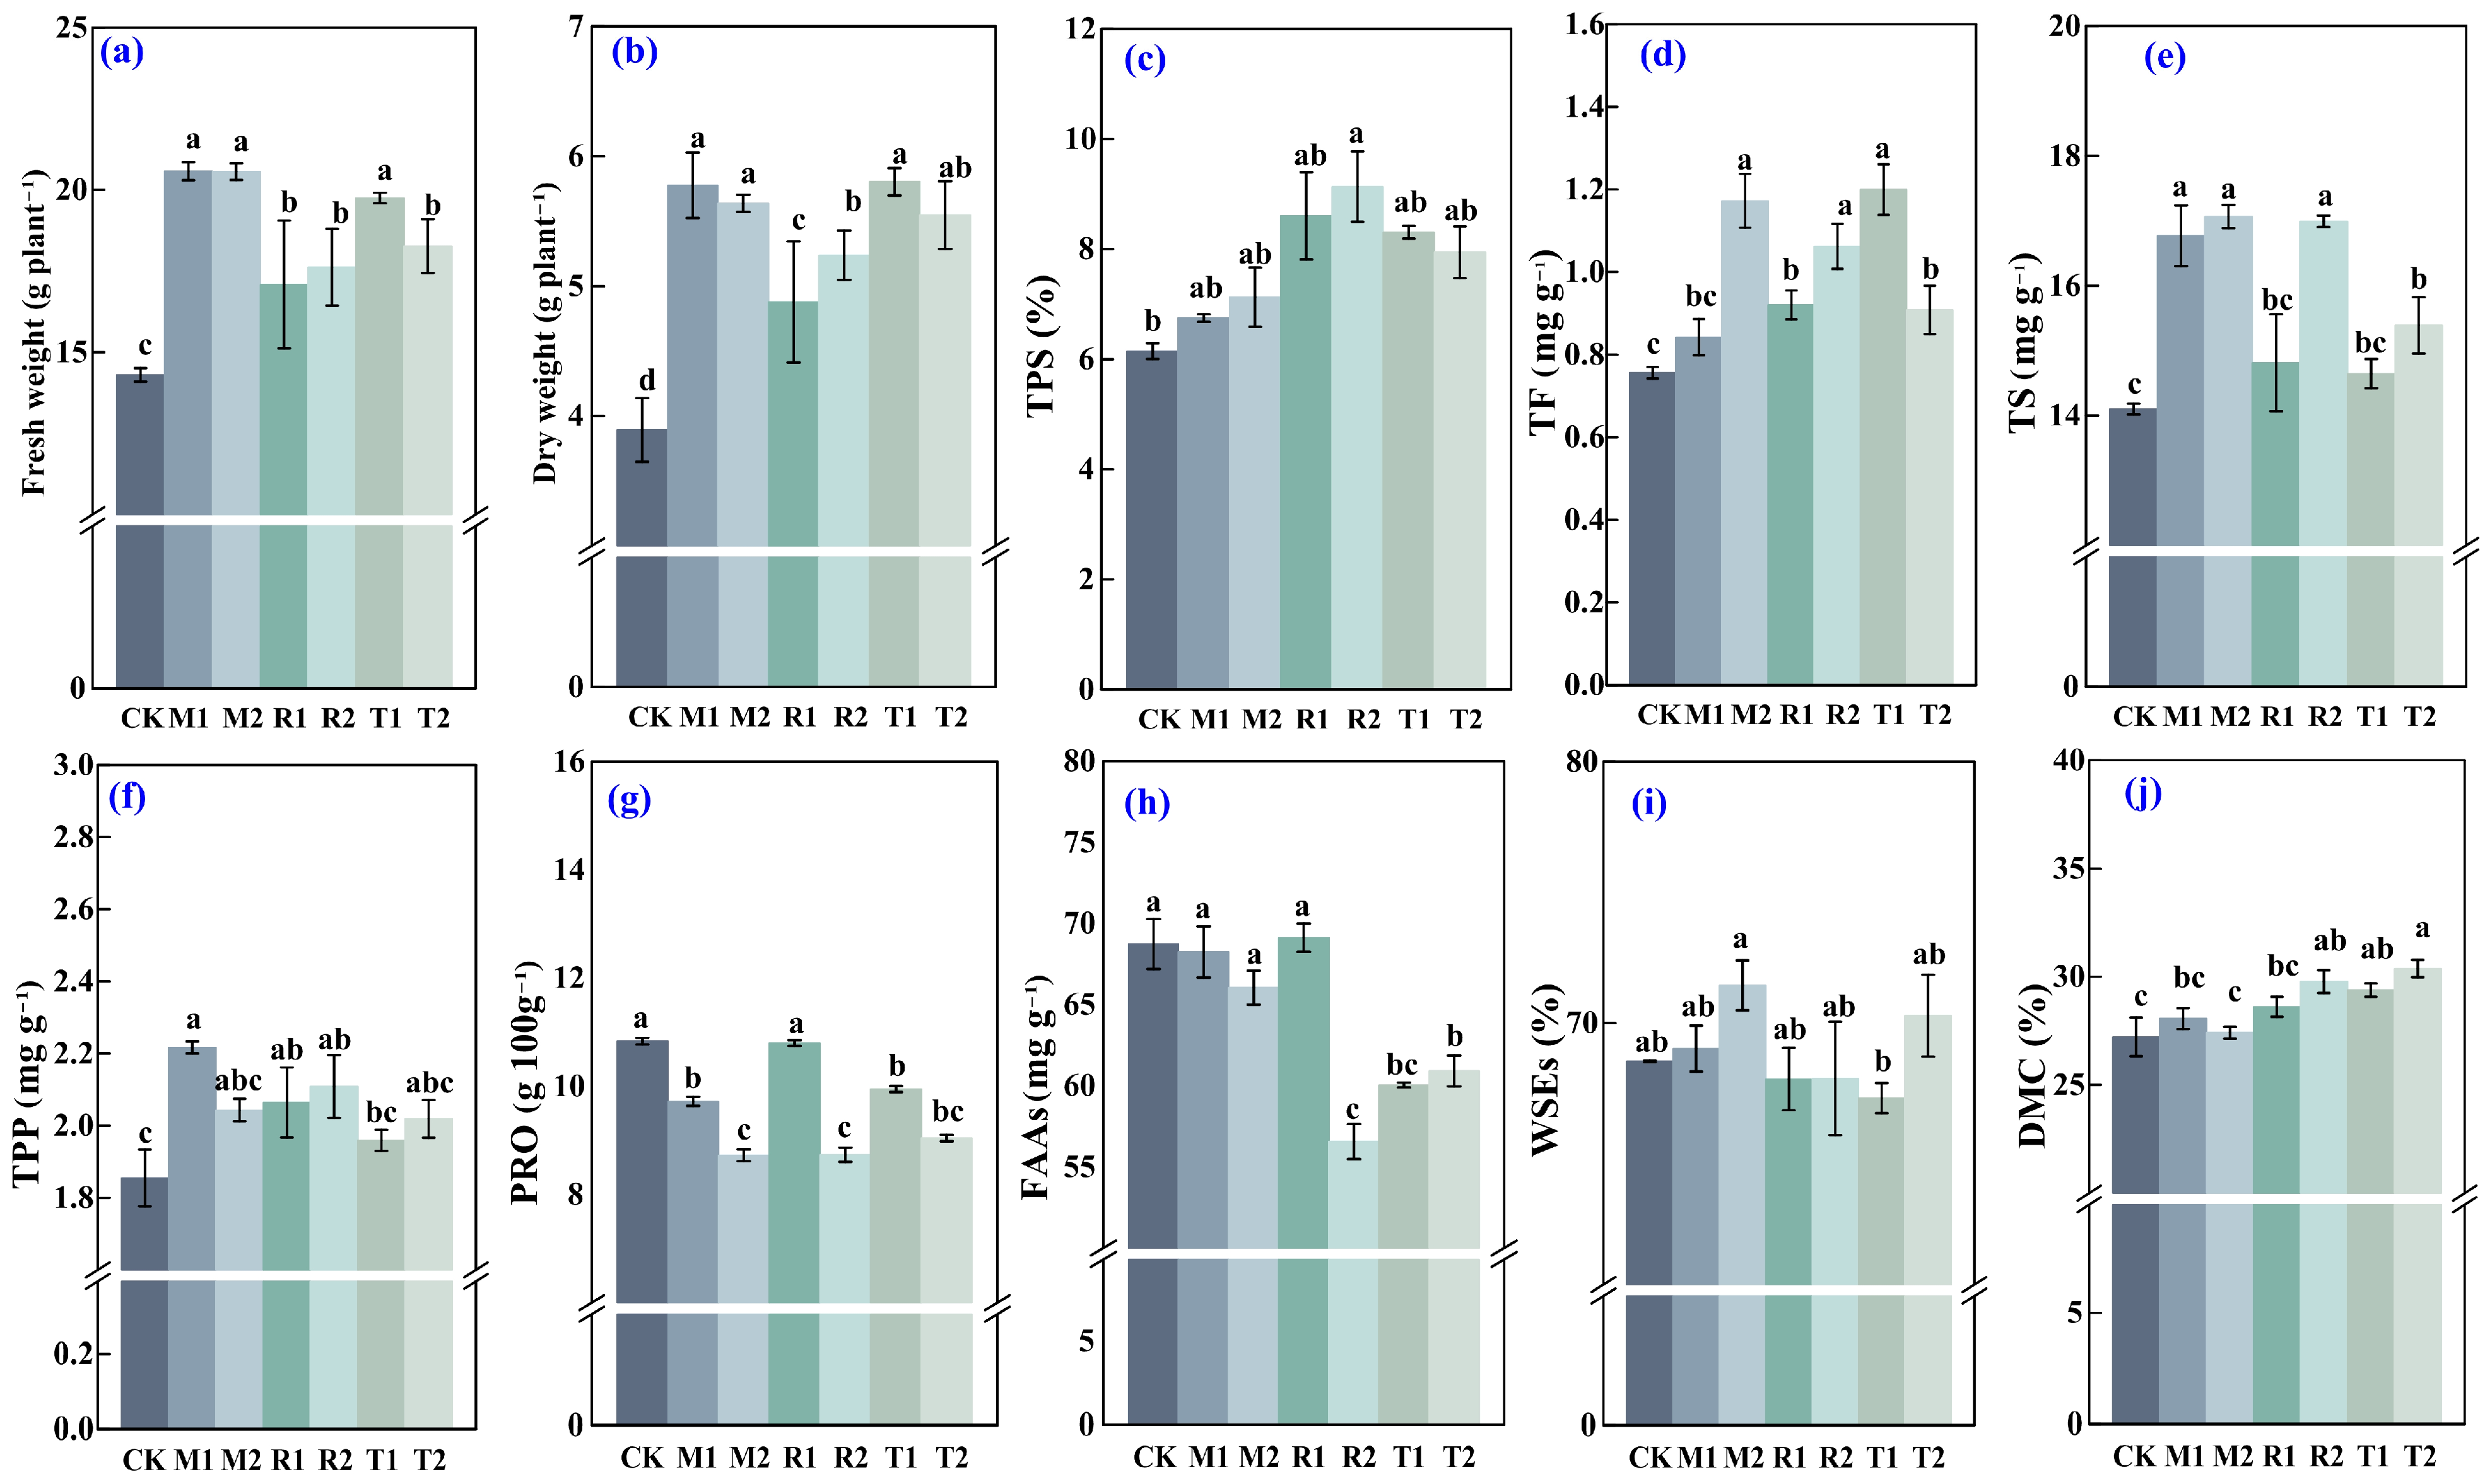
All biochar treatments significantly enhanced both fresh and dry weights of PCH rhizomes, with M1/2 and T1 treatments demonstrating the most pronounced yield improvements (Figure 4a,b). Biochar application generally increased TPS content, with the R2 treatment eliciting a significant 48.5% increase relative to the control (Figure 4c). TF content was significantly elevated under T1/2, R1/2, and M2 treatments, particularly in the M2, R2, and T1 groups (Figure 4d). TS content was significantly augmented by M1/2 and R2 treatments compared to the control (Figure 4e). TPP content increased significantly following M1, R1/2, and T1 treatments, with the M1 treatment showing the greatest effect (Figure 4f).
Conversely, PRO content was significantly reduced by all treatments except R1, especially at higher application rates of MB, RB, and TB (Figure 4g). FAA content decreased significantly under R2 and T1/2 treatments, notably in R2 (Figure 4h). DMC was significantly increased by R2 and T1/2 treatments (Figure 4j). Collectively, these findings suggest that the R2 treatment notably enhanced fresh and dry weights, TPS, TF, TS, TPP, and DMC, while reducing FAA and PRO levels (Figure 4).

3.5. Identification of Key Metabolites in PCH Rhizomes

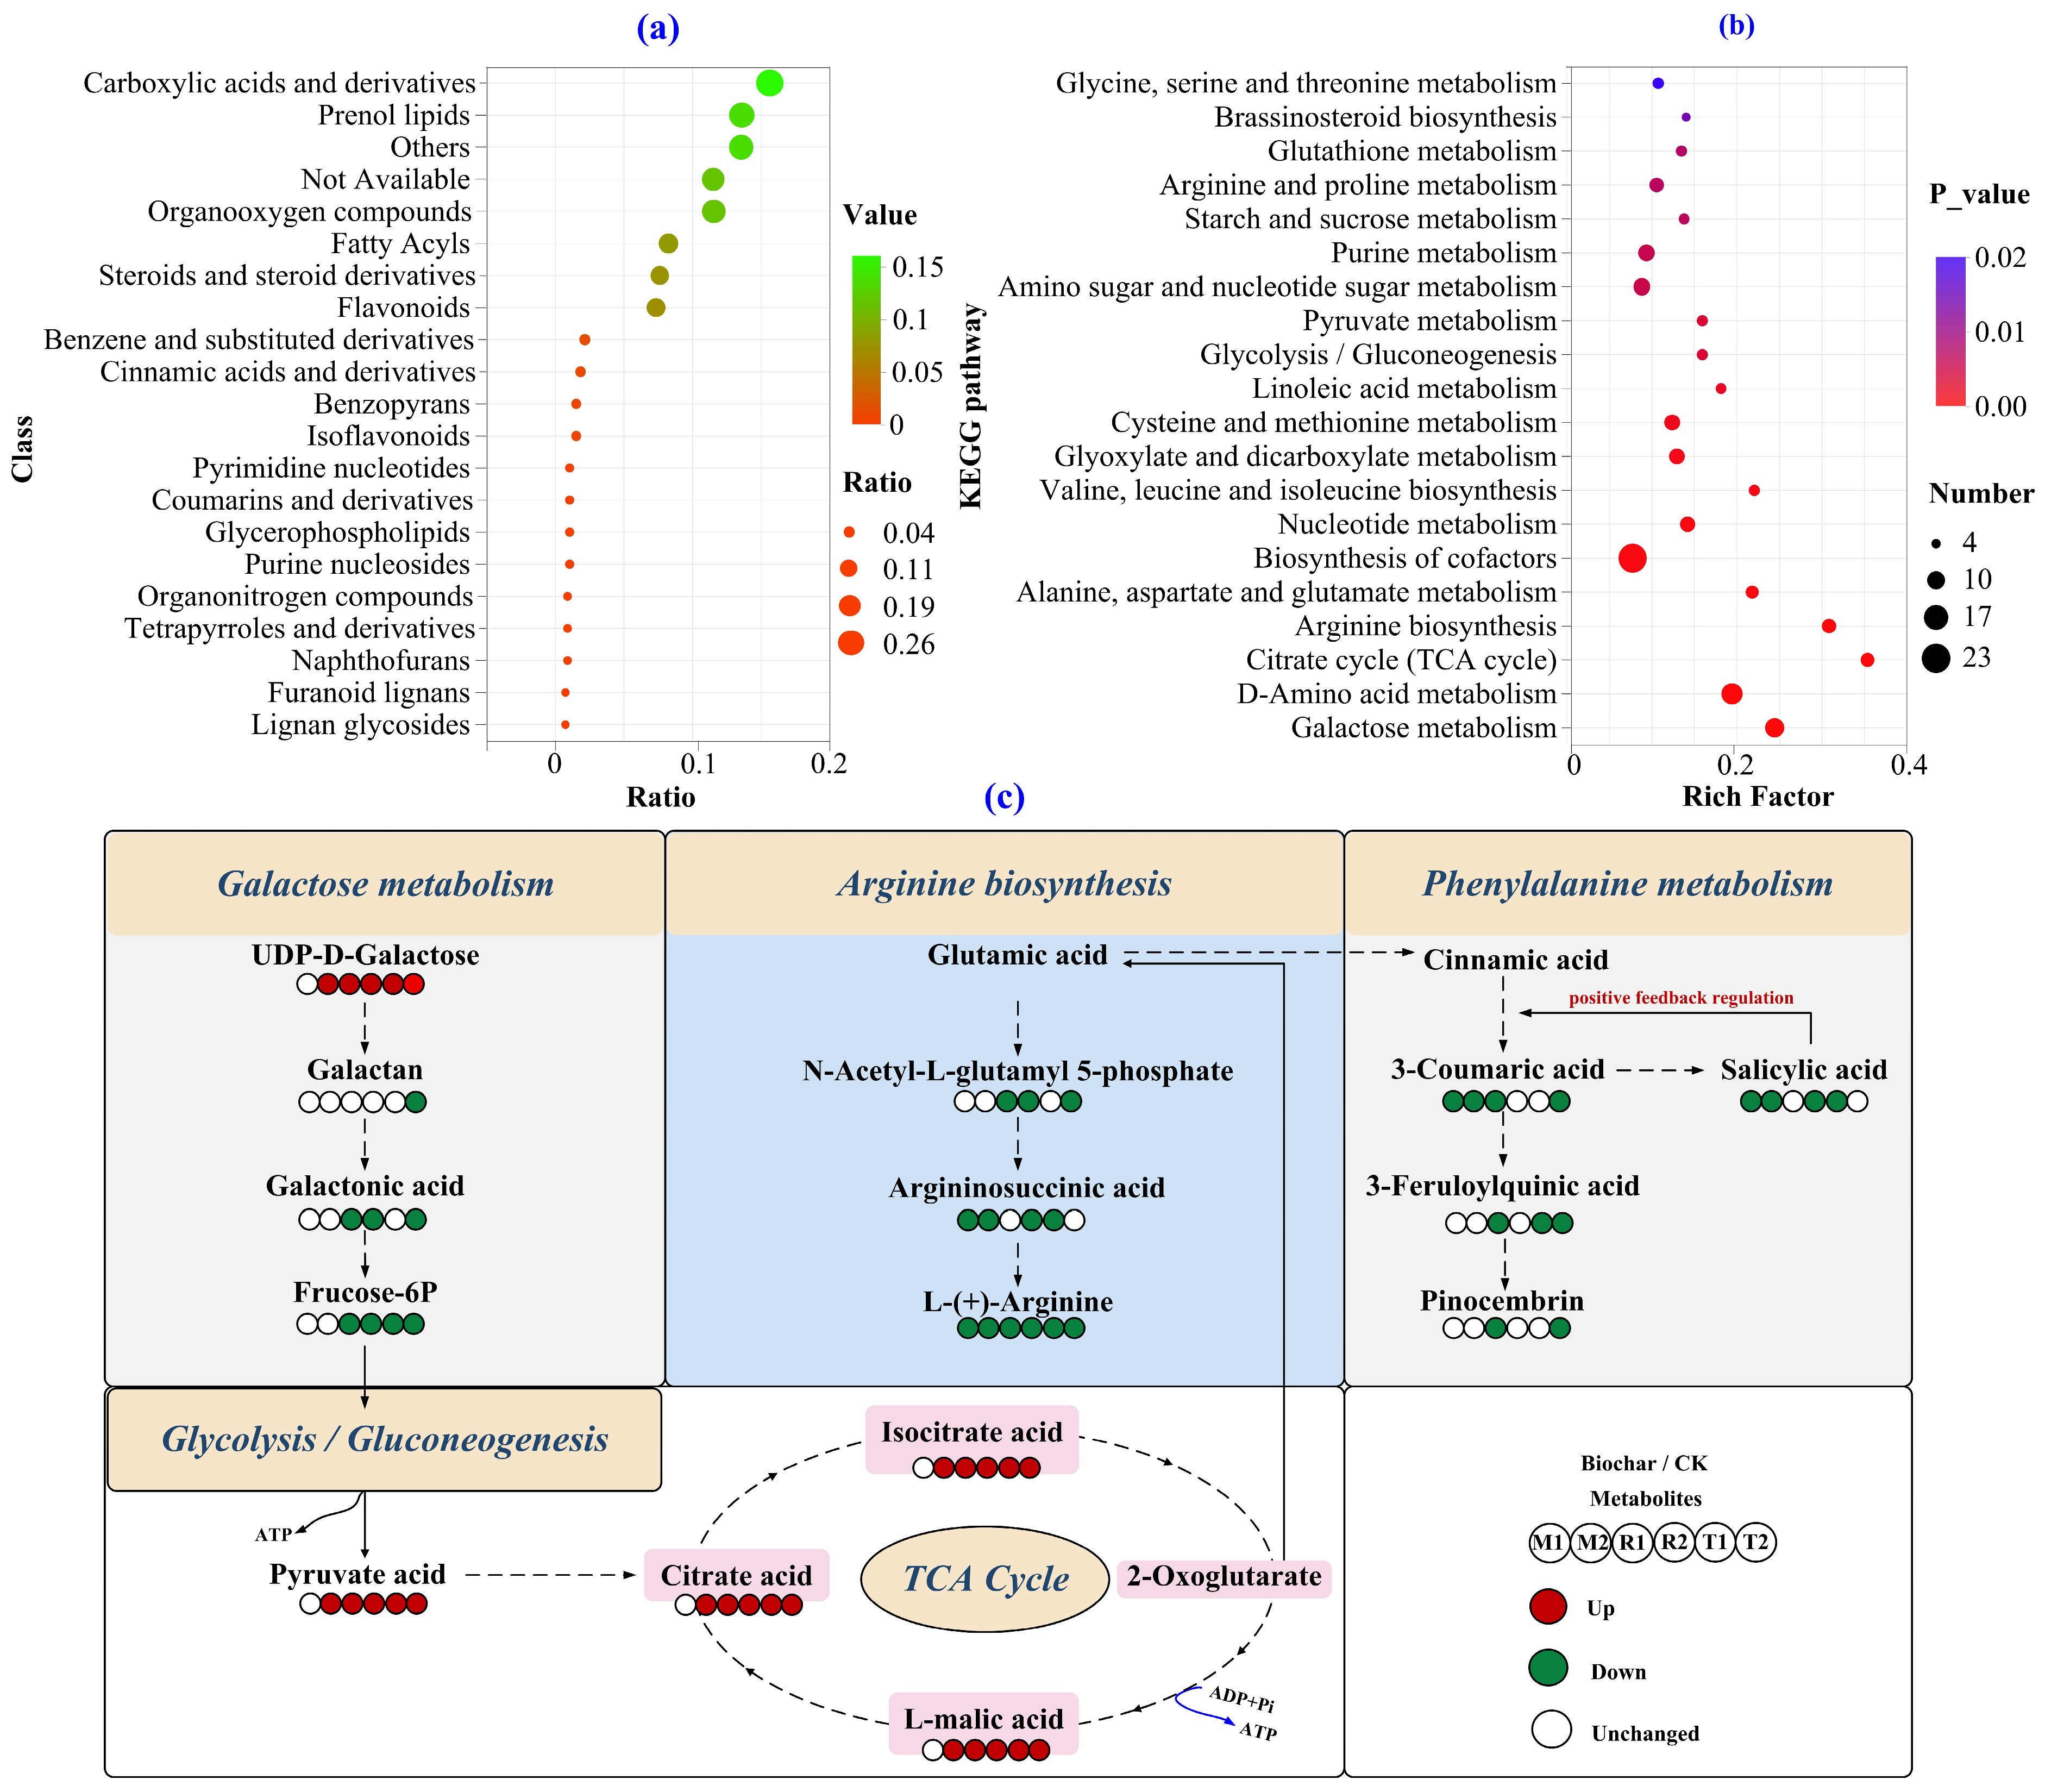
Non-targeted metabolomic profiling identified a total of 959 DAMs across all biochar treatments (Figures S2 and S3), with carboxylic acids and their derivatives being the most abundant metabolite class according to HMDB classification (Figure 5a). KEGG pathway enrichment analysis revealed that the citrate cycle, arginine biosynthesis, and galactose metabolism pathways were the top 3 significantly enriched pathways (p ≤ 0.05) (Figure 5b).
Key metabolites involved in the citrate cycle (including pyruvic acid, isocitric acid, L-malic acid, and citric acid) were significantly upregulated by M2, R1/2, and T1/2 treatments (Figure 5c and Figure S4a–d). Within the galactose metabolism pathway, UDP-D-galactose abundance was significantly increased by all biochar treatments (Figure 5c and Figure S4e). Conversely, levels of galactan, fructose-6-phosphate, and galactonic acid were significantly downregulated by M2, R1/2, and T1/2 treatments (Figure 5c and Figure S4f–h). Regarding arginine biosynthesis, L-(+)-arginine abundance was significantly reduced by all biochar treatments (Figure 5c and Figure S4i). Additionally, argininosuccinic acid levels were significantly decreased by M1/2 treatments, and N-acetyl-L-glutamyl 5-phosphate abundance was significantly lowered by M2 and R2 treatments (Figure 5c and Figure S4j,k).
These results collectively suggest that the citrate cycle may be enhanced while arginine biosynthesis may be suppressed under biochar amendments (MB, RB, TB). Furthermore, in galactose metabolism, the accumulation of UDP-D-galactose was promoted under the condition of biochar application. Among the treatments, R2 induced the most pronounced upregulation of UDP-D-galactose.

3.6. Abundance of Allelochemicals in PCH Rhizomes

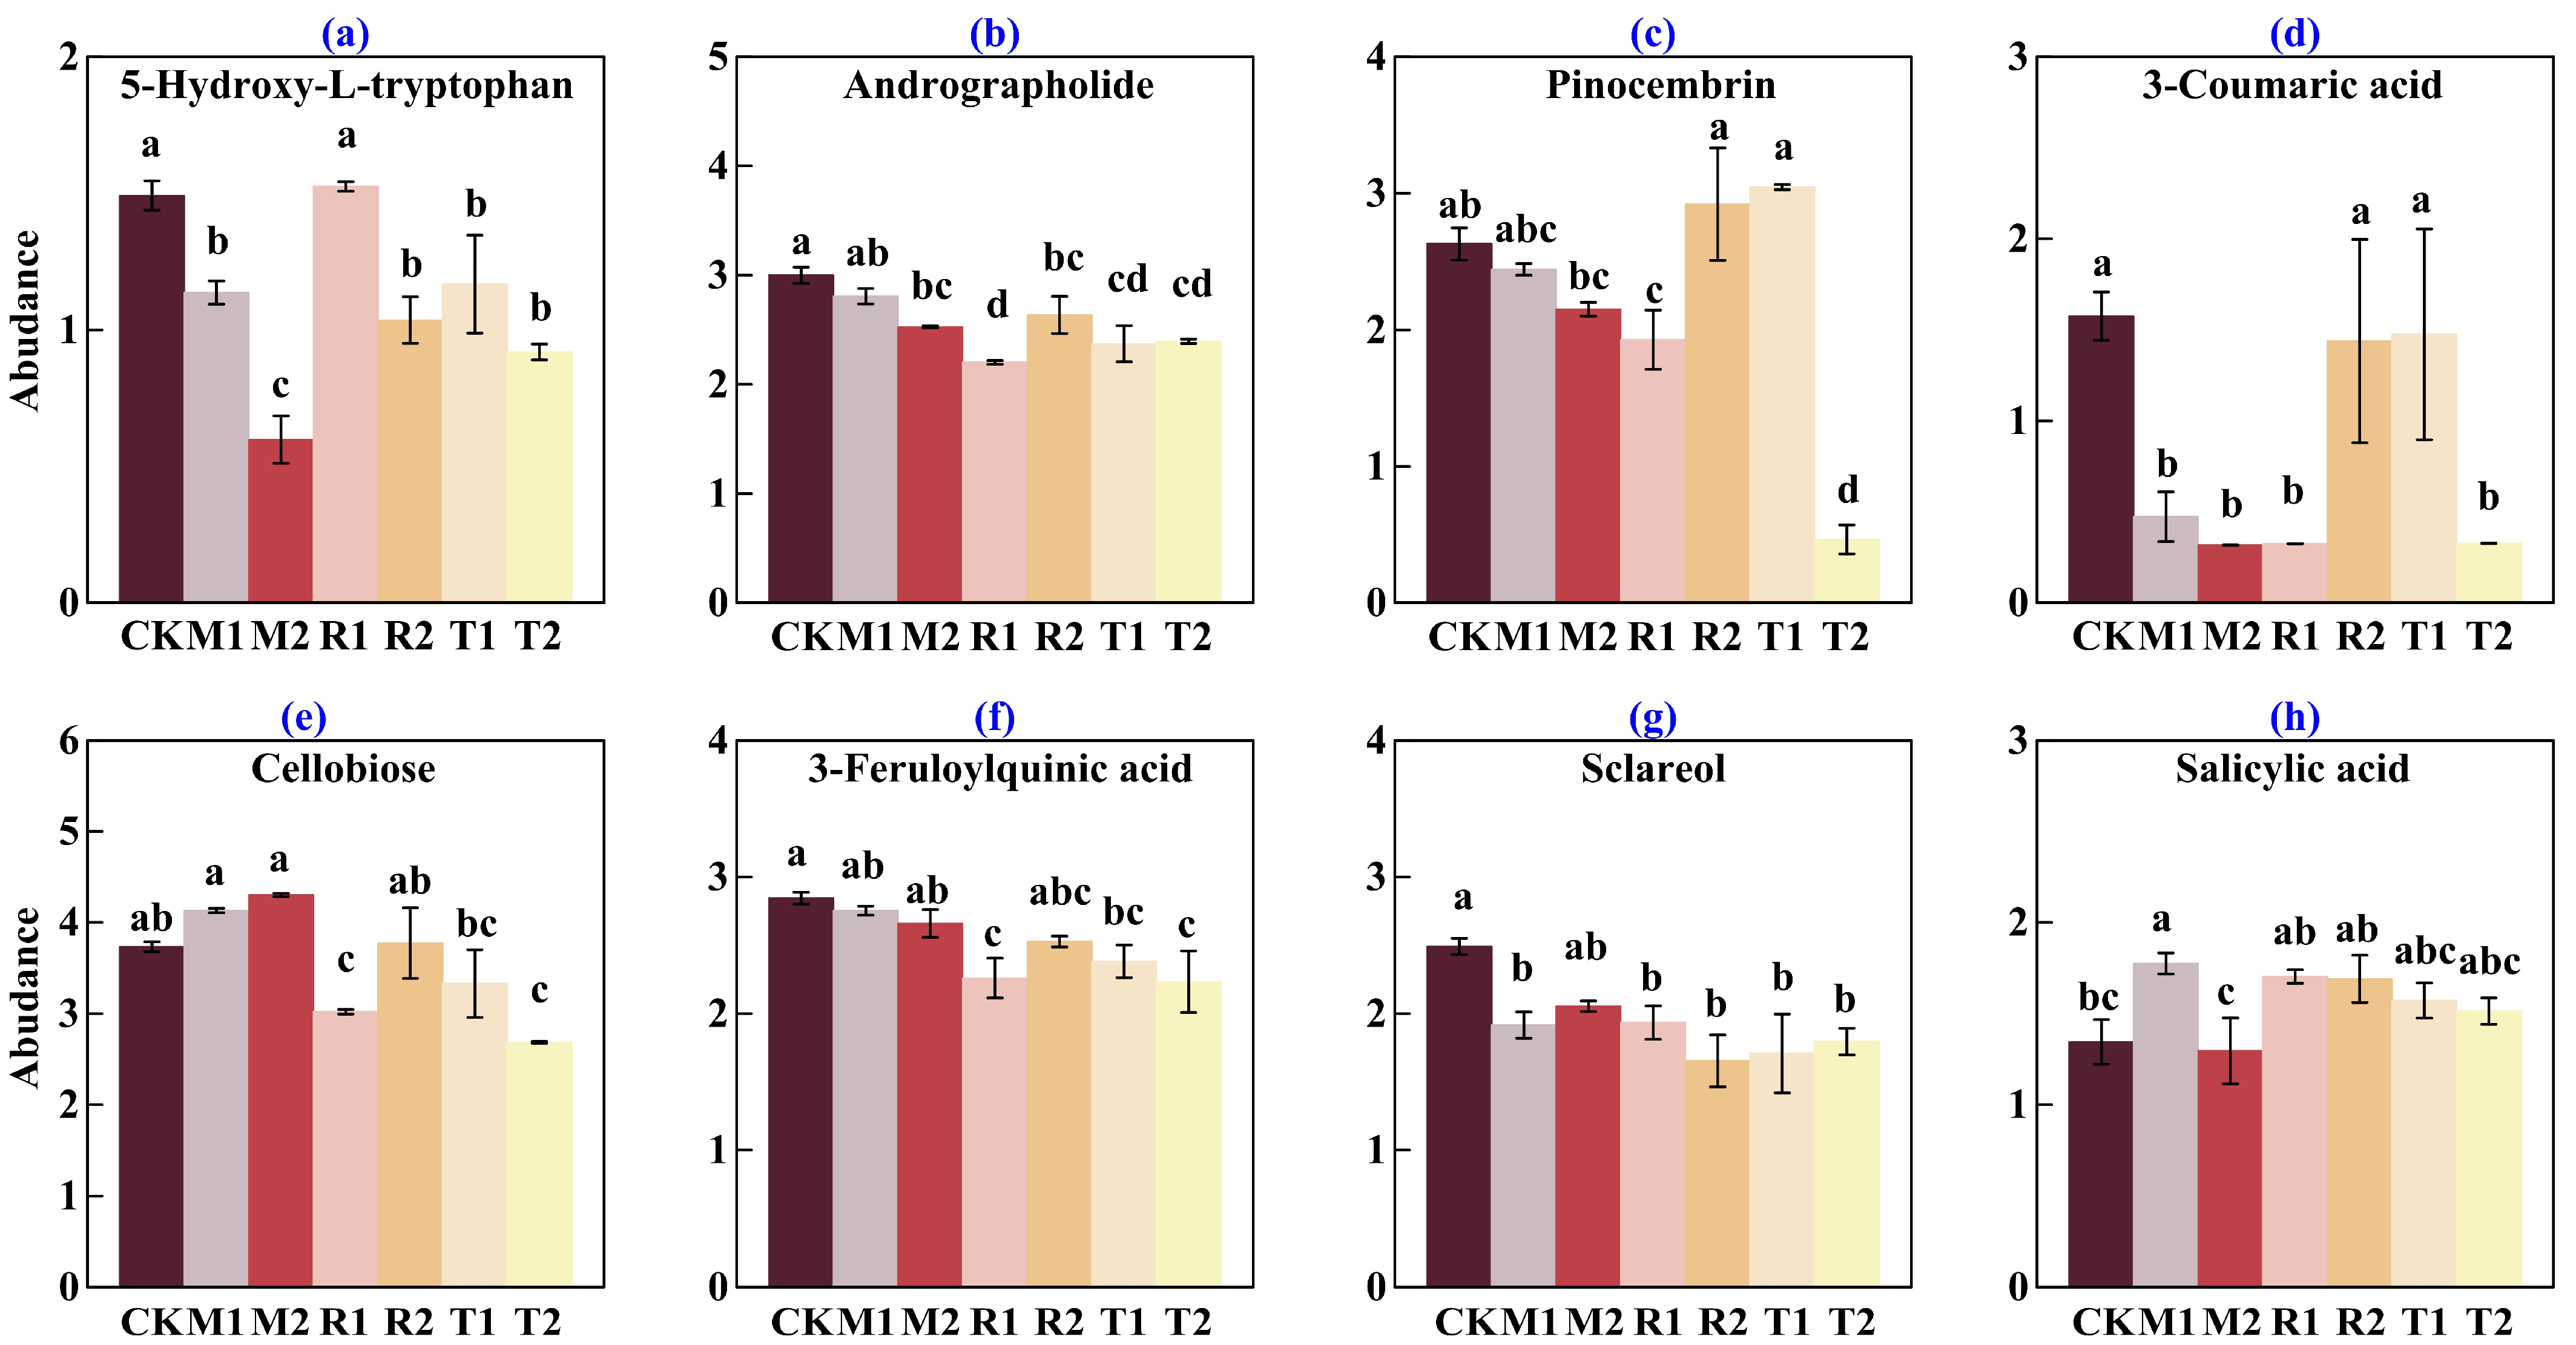
Among the DAMs previously identified, eight well-characterized, allelopathic compounds were detected, including 5-hydroxy-L-tryptophan [29], andrographolide [30], pinocembrin [31], 3-coumaric acid [32], cellobiose [33], 3-feruloylquinic acid [34], sclareol [35], and salicylic acid [36].
Relative to the CK, the abundance of 5-hydroxy-L-tryptophan was significantly decreased by the T1/2, M1/2, and R2 treatments, whereas the R1 treatment did not produce a statistically significant effect on its abundance (Figure 6a). Similarly, the abundance of andrographolide was markedly decreased by the T1/2, R1, and M2 treatments (Figure 6b).
The T2 treatment significantly elicited reductions in the abundances of pinocembrin, 3-coumaric acid, and cellobiose by 82.34%, 79.23%, and 28.14%, respectively, compared to the CK (Figure 6c–e). Additionally, the M1/2 treatments significantly diminished 3-coumaric acid levels, while cellobiose abundance was notably lowered by the R2 treatment. The relative abundance of 3-feruloylquinic acid was significantly reduced under the R1 and T2 treatments (Figure 6f), and the abundance of sclareol was significantly decreased by the M1, R1/2, and T1/2 treatments (Figure 6g). In contrast, salicylic acid abundance was significantly elevated following the M1 treatment (Figure 6h).
Collectively, these findings indicate that biochar application substantially suppressed the abundance of the majority of identified allelochemicals, with the T2 treatment demonstrating the most pronounced inhibitory effect.

3.7. Effects of Biochars on the Physicochemical Properties of Rhizosphere Soil

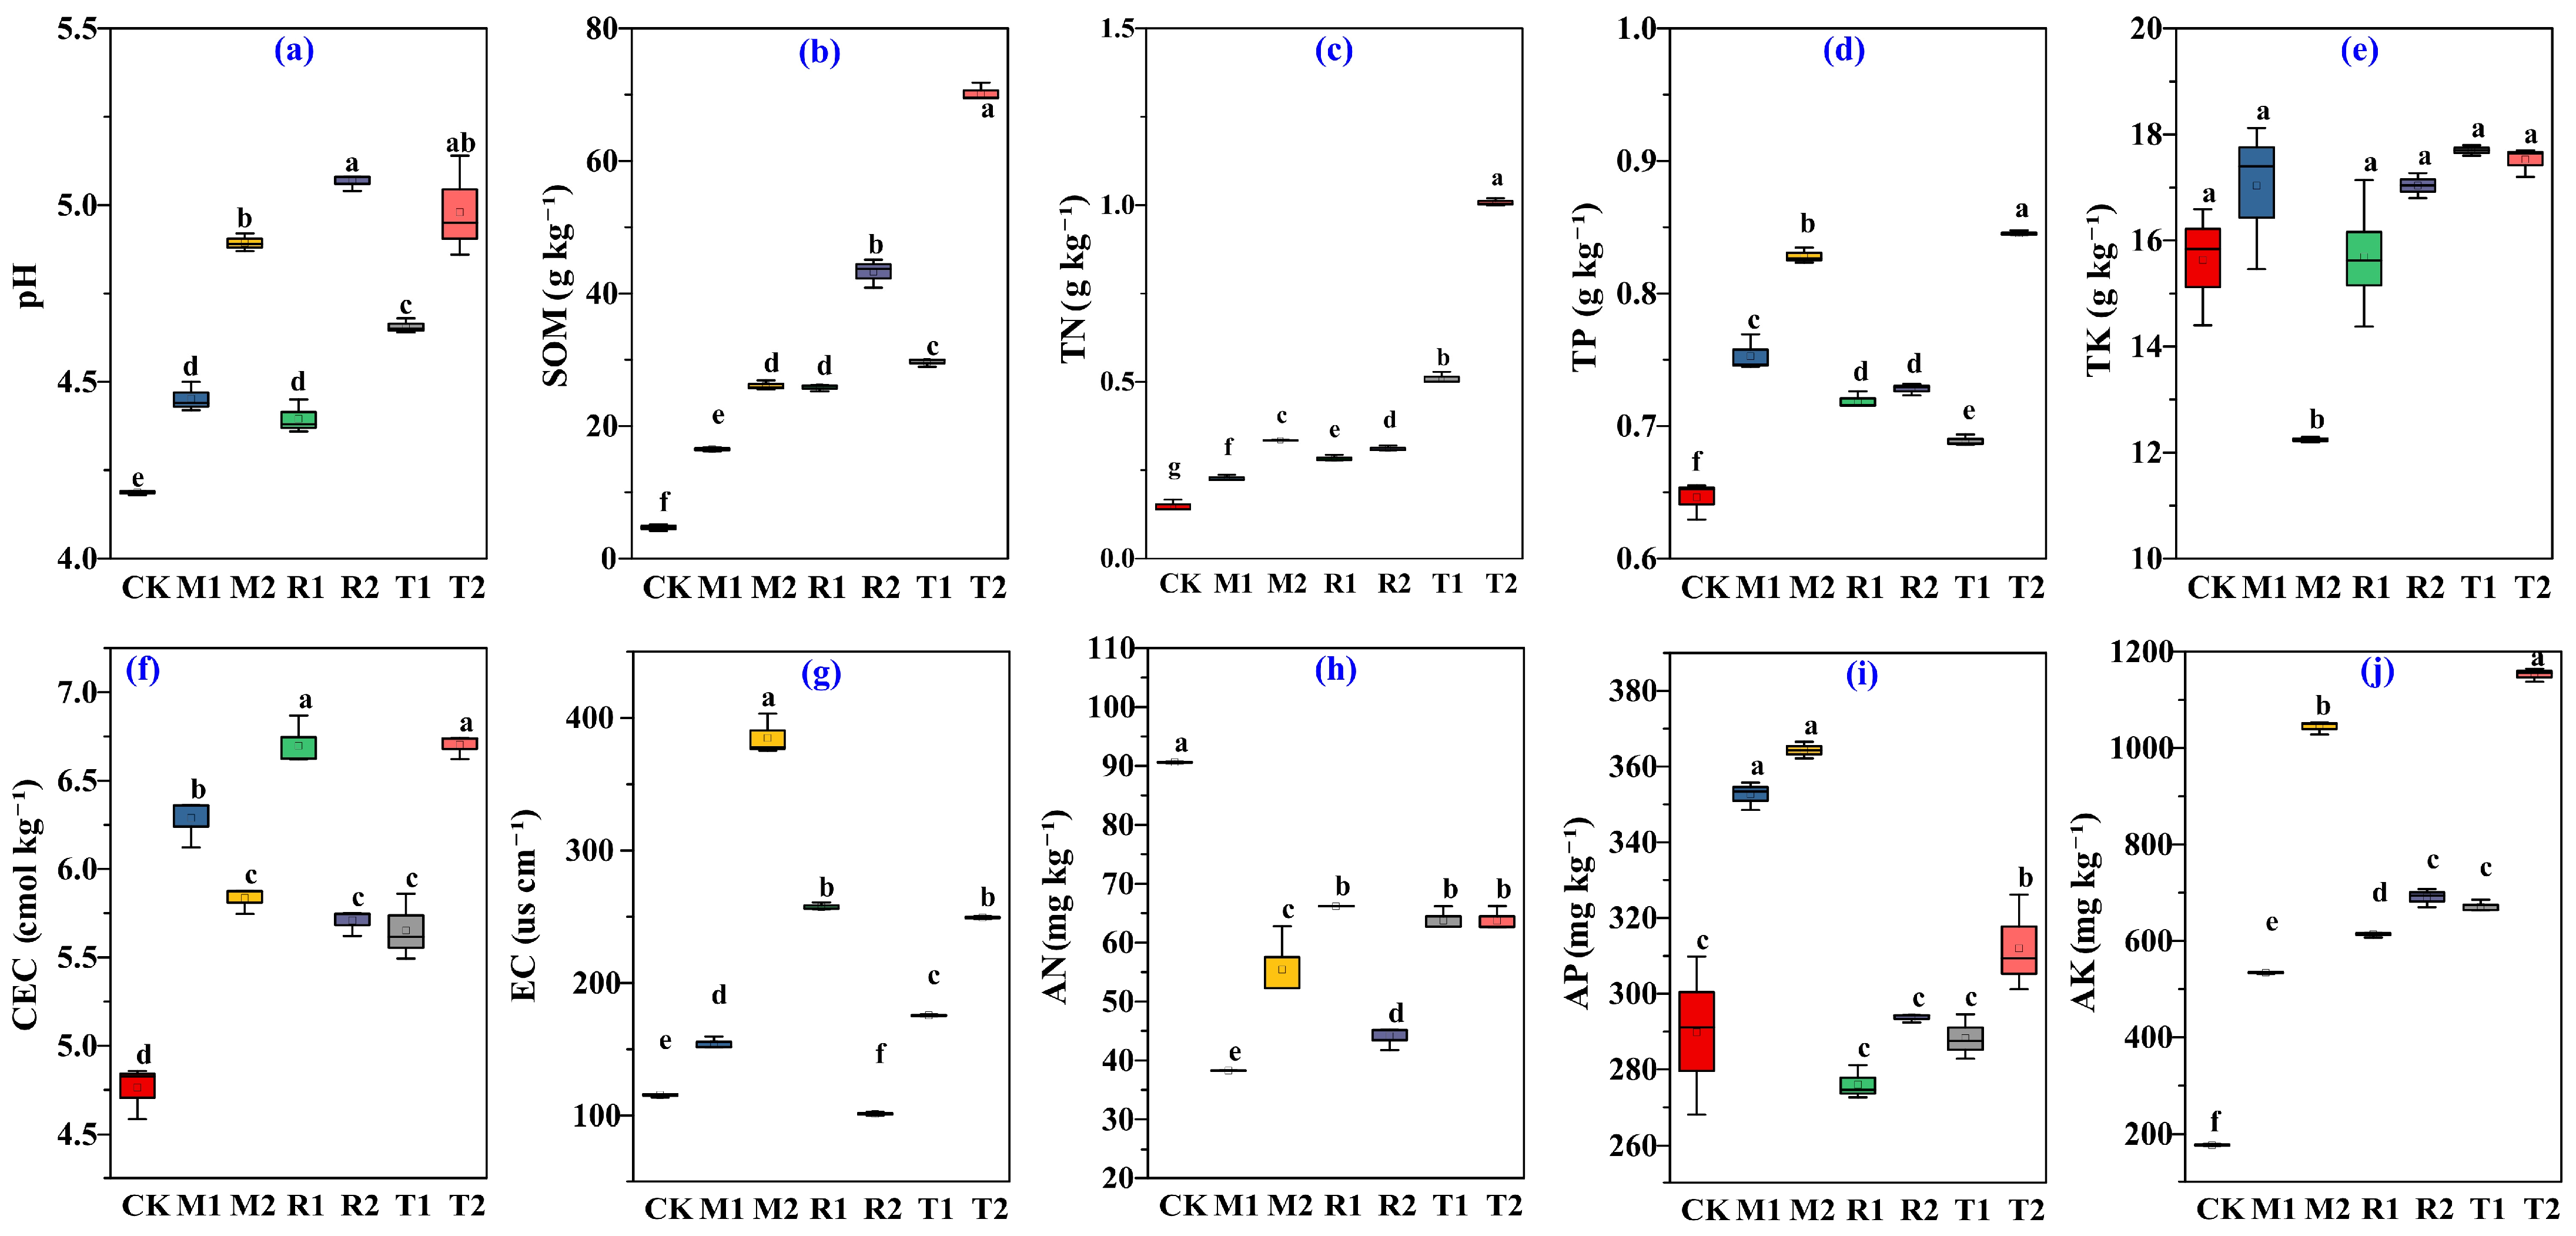
Application of biochar significantly enhanced soil pH, SOM, TN, and TP relative to the CK, and the values of pH, SOM, TN, and TP increased with these parameters increasing concomitantly with higher biochar application rates (Figure 7a–d). Notably, soil pH values in the R2 and T2 treatments were significantly elevated compared to other treatments (Figure 7a). The highest concentrations of SOM, TN, and TP were observed under the T2 treatment (Figure 7b–d). The TK content was significantly reduced only by the M2 treatment (Figure 7e). The CEC was significantly increased by all biochar treatments relative to the CK, particularly under the R1 and T2 treatments (Figure 7f). The EC was elevated by the M1/2, R1, and T1/2 treatments but decreased under the R2 treatment (Figure 7g). The AN content was significantly diminished by all biochar treatments, with the most pronounced reduction observed in the M1 treatment (Figure 7h). The AP was significantly increased by the M1/2 and T2 treatments (Figure 7i). The AK content was significantly enhanced by all biochar applications, especially under the T2 and M2 treatments (Figure 7j).
These results collectively suggest that biochar amendments markedly improved most physicochemical properties of the rhizosphere soil, with the exception of AN and TK. Among the treatments evaluated, T2 exhibited the greatest effectiveness in augmenting SOM, TN, TP, CEC, and pH.

3.8. Bacterial Community Structure in the Rhizosphere Soil of PCH

3.8.1. Alpha and Beta Diversity

High-throughput sequencing of 21 soil samples yielded a total of 22,041 ASVs (Table S2). Analysis of alpha diversity revealed that biochar amendments significantly increased the Shannon diversity index (Figure S5a) while concurrently decreasing the Simpson index relative to the CK (p ≤ 0.05) (Figure S5b), indicating an enhancement in both bacterial richness and community evenness. Principal coordinates analysis (PCoA) based on Bray–Curtis dissimilarities demonstrated a distinct separation of bacterial communities at the genus level across different treatments (ANOSIM, R = 0.7659, p ≤ 0.05) (Figure S5c,d), suggesting that biochar application substantially altered the structure of the rhizosphere bacterial community.

3.8.2. Bacterial Community Composition

Across all treatments, 252 microbial taxa were shared, with the T2 treatment harboring the highest number of unique taxa (1182), whereas the CK treatment contained 576 unique taxa (Figure S6a). Linear discriminant analysis effect size analysis (LEfSe) was employed to identify biomarker taxa distinguishing the treatments (LDA score > 3, p ≤ 0.05, Figure S6b,c). Notably, the phylum Actinobacteriota was enriched in the CK treatment; Firmicutes in R1; the family Rhizobiaceae in R2, the genus Chujaibacter in M1, the order Sphingomonadales in M2, the order Streptomycetales in T1, and the phylum Proteobacteria in T2, each representing key biomarkers differentiating the respective treatment groups.
The predominant bacterial phyla identified were Actinobacteriota (22.55–69.81%), Proteobacteria (11.97–36.34%), and Chloroflexi (4.04–27.16%) (Figure S7a). At the genus level, dominant taxa included Streptomyces (0.84–8.75%), norank_o_Gaiellales (0.28–8.50%), and Sphingomonas (1.81–9.89%) (Figure S7b).

3.8.3. Impact of Biochar on Bacterial Abundance at the Phylum and Genus Levels

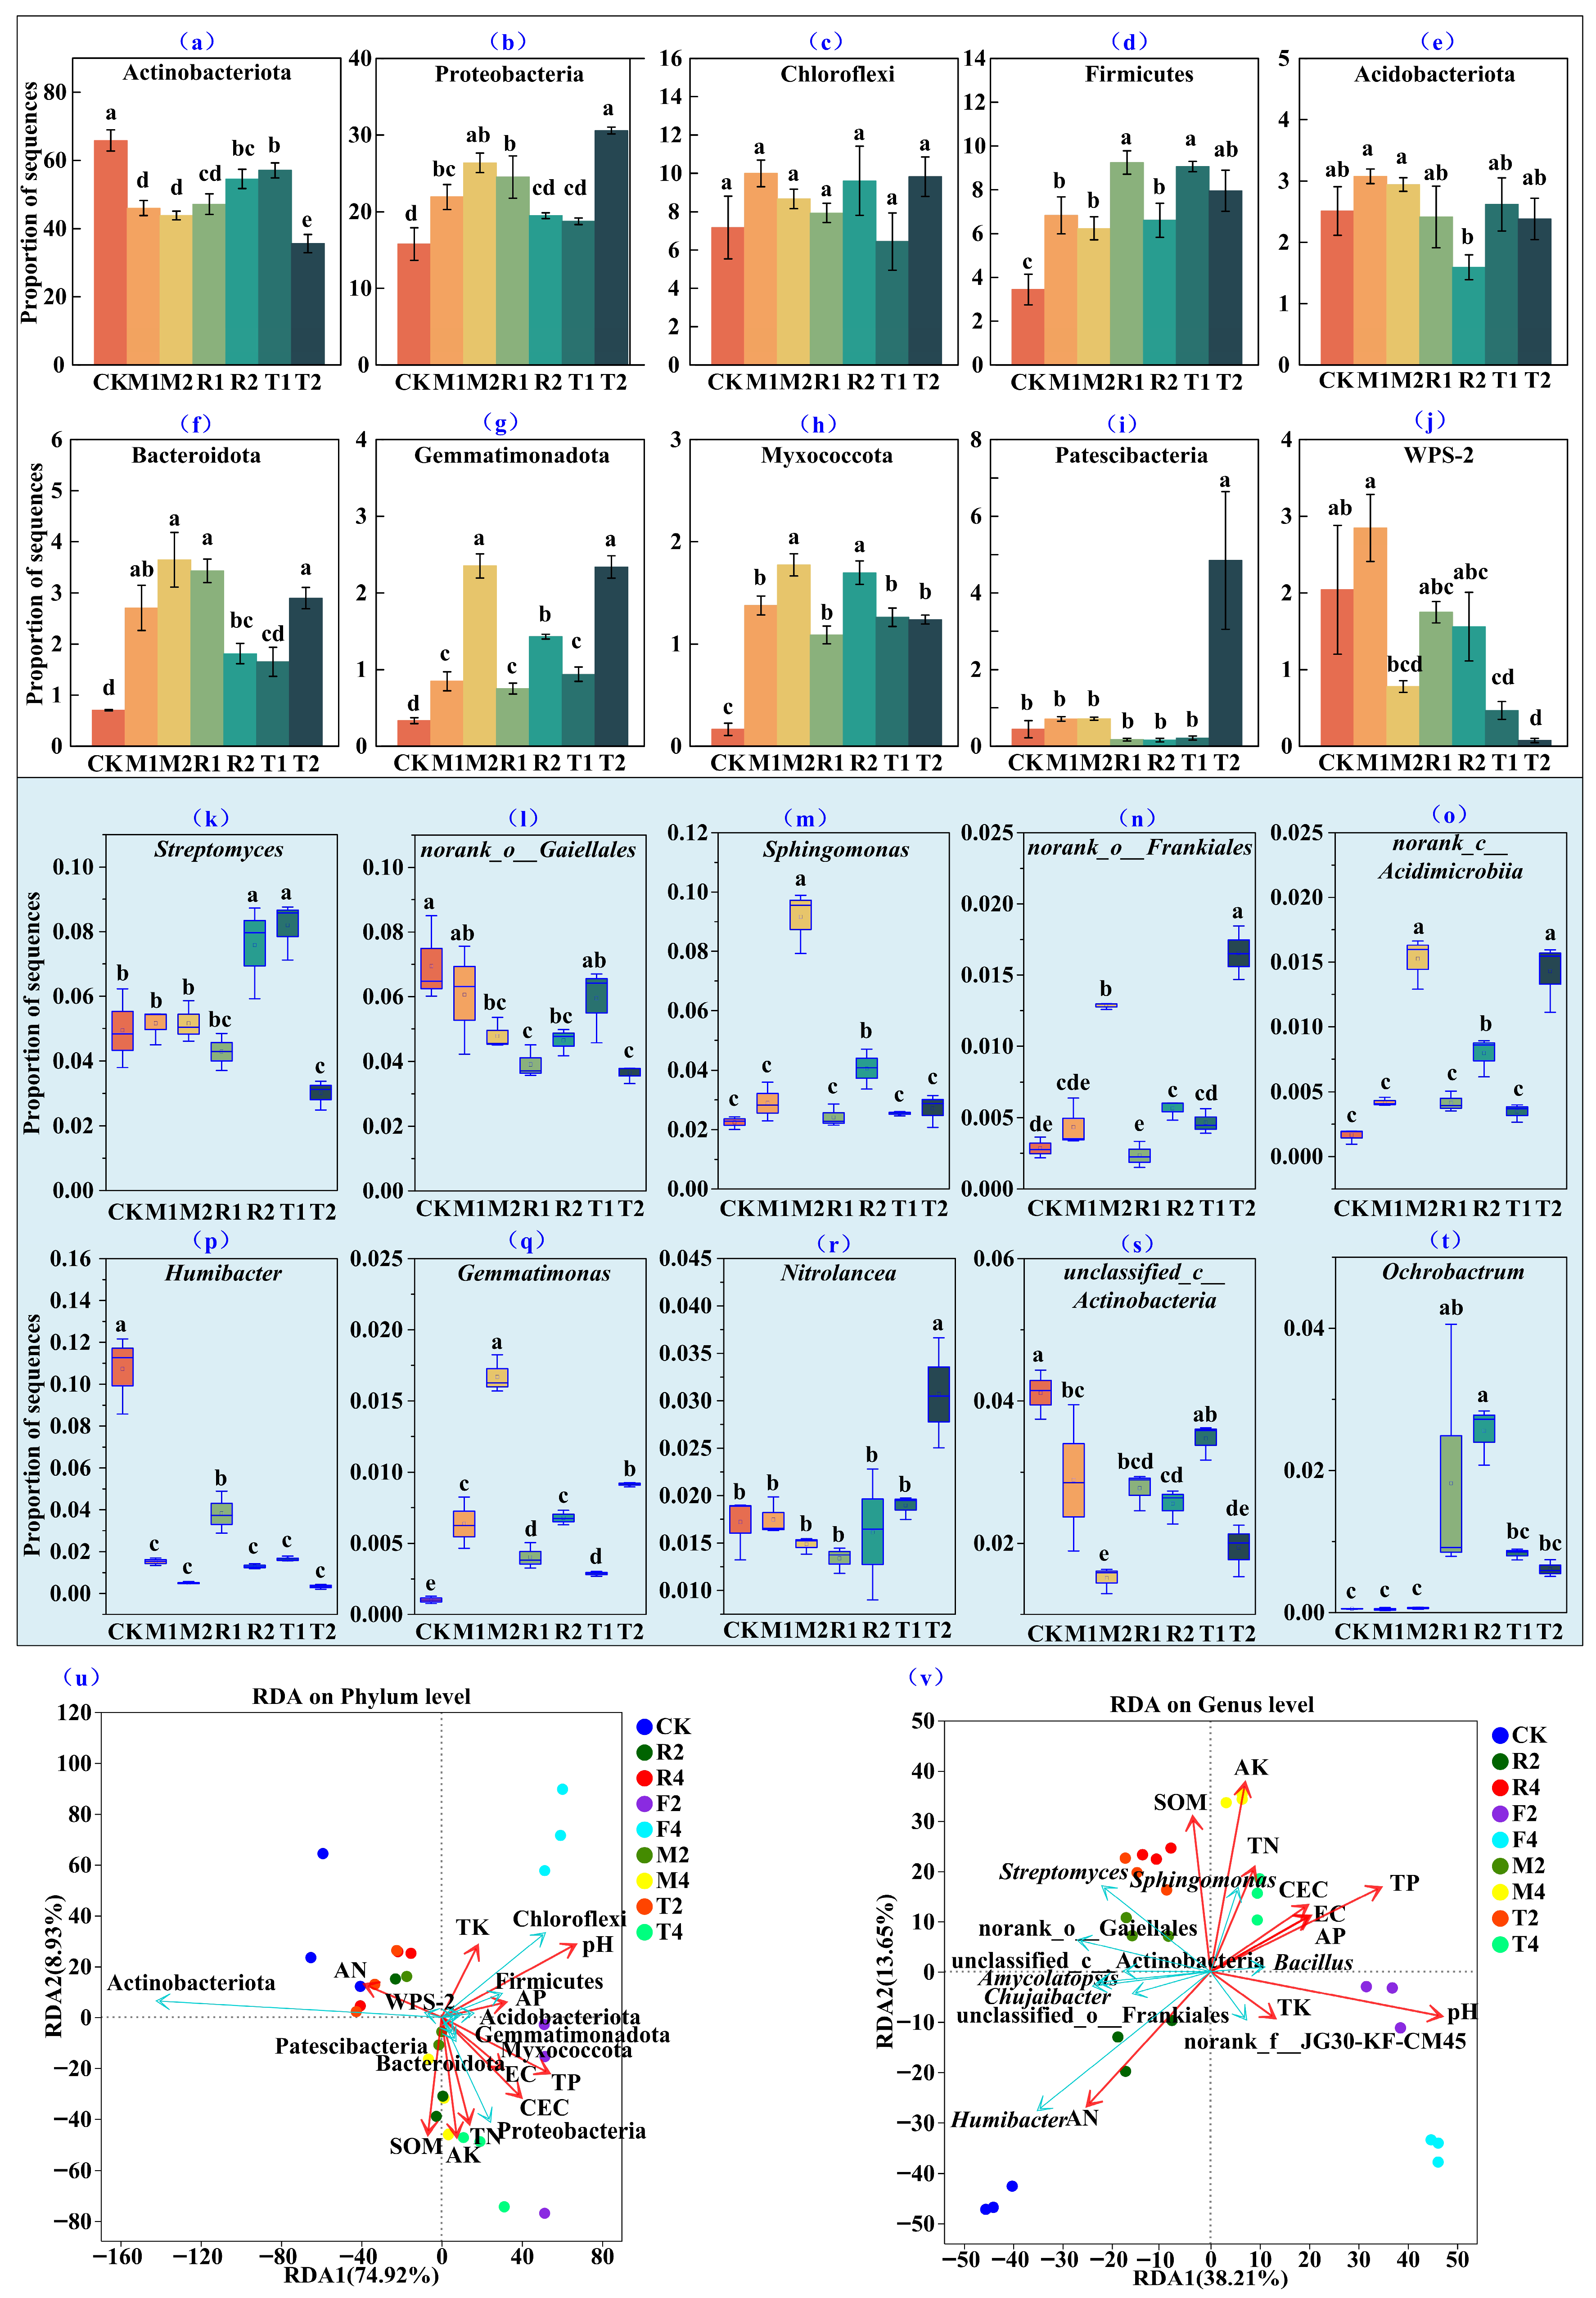
To elucidate the principal shifts in soil bacterial community structure induced by biochar application, the top 10 taxa at both phylum and genus levels exhibiting significant differences in relative abundance compared to the CK (p ≤ 0.05) were selected for further analysis (Figure 8). At the phylum level, the relative abundance of Actinobacteriota (Figure 8a) was significantly reduced by all biochar treatments. Conversely, the relative abundances of several phyla, including Firmicutes (Figure 8d), Bacteroidota (Figure 8f), Gemmatimonadota (Figure 8g), Myxococcota (Figure 8h), and Patescibacteria (Figure 8i), were significantly elevated in most biochar-amended soils.
At the genus level (Figure 8k–t), biochar amendments significantly increased the relative abundance of several dominant genera. For instance, Sphingomonas (Figure 8m) and Gemmatimonas (Figure 8q) were notably enriched by the M2 and R2 treatments, whereas Streptomyces abundance was significantly enhanced by the R2 and T1 treatments (Figure 8k). In contrast, the relative abundances of Humibacter (Figure 8p) and norank_o_Gaiellales (Figure 8l) were generally diminished following biochar application.
Redundancy analysis (RDA) was conducted to explore the relationships between bacterial community composition and soil physicochemical properties. At both phylum and genus levels, the first two RDA axes explained substantial cumulative variances of 83.99% and 72.23%, respectively. Among soil parameters, pH and AN emerged as the most influential factors associated with biochar-driven modifications in bacterial community structure (Figure 8u,v).

3.9. Functional Prediction Analysis

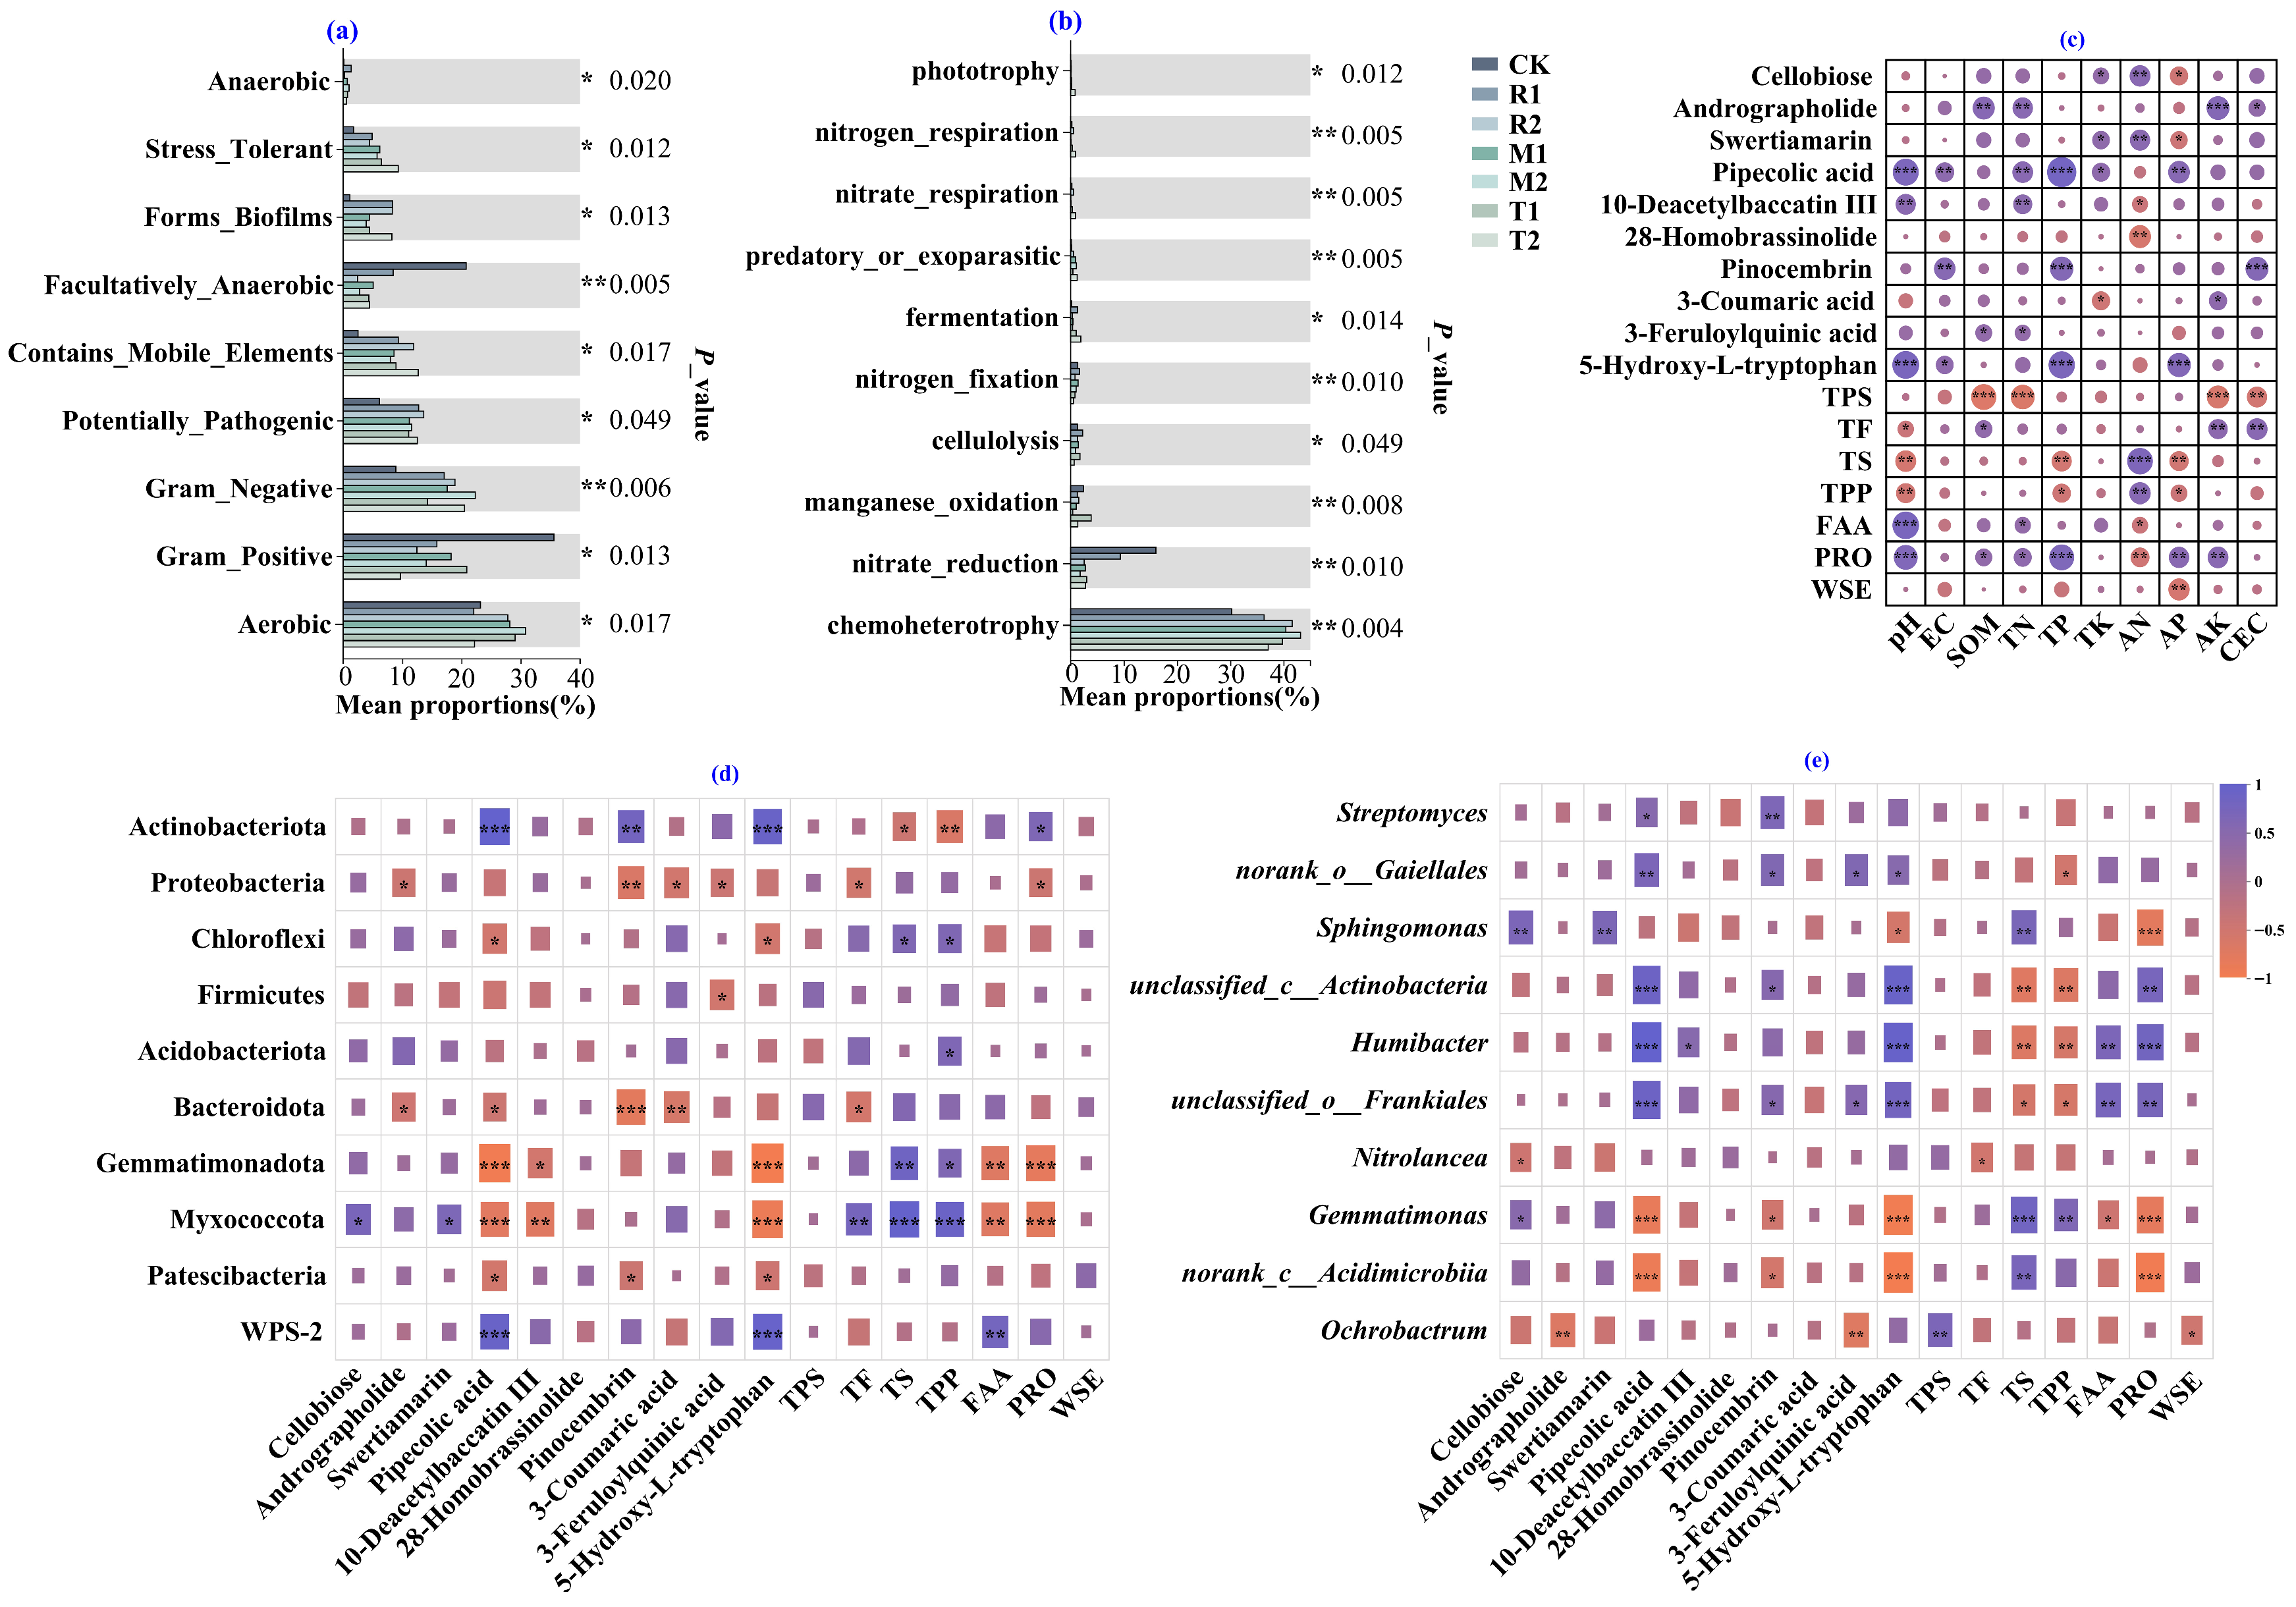
Functional predictions conducted using BugBase indicated that the application of biochar, particularly under the T2 treatment, may lead to an increased relative abundance of Gram_negative bacteria, as well as potential for mobile genetic elements, biofilm formation, and stress tolerance. Conversely, biochar application appeared to reduce the relative abundance of the facultative anaerobes and Gram_positive bacteria (Figure 9a).
Similarly, functional annotation via FAPROTAX suggested that biochar treatment may promote the relative abundance of chemoheterotrophic bacteria, while potentially diminishing the functions associated with nitrate_reducing bacteria (Figure 9b).

3.10. Correlation Analysis Among Key Compounds and Allelochemicals in PCH Rhizomes and Soil Parameters

3.10.1. Relationships Between Allelochemicals/Key Compounds in PCH Rhizomes and Soil Physicochemical Properties

The abundance of allelochemicals exhibited significant negative correlations with most soil physicochemical properties (Figure 9c). Specifically, Cellobiose was significantly negatively correlated with TK and AN. Andrographolide showed significant negative correlations with SOM, TN, AK, and CEC. Additionally, pinocembrin was significantly negatively correlated with EC, TP, and CEC; 3-coumaric acid with AK; 3-feruloylquinic acid with SOM and TN; and 5-hydroxy-L-tryptophan was significantly negatively correlated with pH, EC, TP, and AP. Notably, cellobiose was positively correlated with AP. Furthermore, 3-coumaric acid was positively correlated with TK (Figure 9c).
The TPS content in PCH rhizomes was significantly positively correlated with soil SOM, TN, AK, and CEC (Figure 9c). TF, TS, and TPP were significantly positively correlated with soil pH, whereas FAAs and PRO were negatively correlated. TPS showed positive correlations with SOM and TN, but negative correlations with TF and PRO in relation to SOM and with FAAs and PRO in relation to TN. TS and TPP were positively correlated with TP, negatively correlated with AN, and, along with WSEs, positively correlated with AP. PRO exhibited inverse trends, showing negative correlations with TP and AP and a positive correlation with AN. TPS was positively correlated with AK, while TF and PRO were negatively correlated with this parameter.

3.10.2. Associations Between Allelochemicals/Key Compounds in PCH Rhizomes and Soil Microbial Phyla

As illustrated in Figure 9d, the relationships between soil microbial phyla and the synthesis of allelochemicals and key quality compounds in PCH rhizomes are as follows: (1) The phylum Actinobacteriota appears to negatively influence the biosynthesis of allelochemicals such as pipecolic acid, pinocembrin, and 5-hydroxy-L-tryptophan, as well as the quality compound PRO, while promoting the formation of quality compounds such as TS and TPP. (2) Proteobacteria may enhance the synthesis of allelochemicals including andrographolide, pinocembrin, 3-coumaric acid, and 3-feruloylquinic acid, alongside quality compounds such as TF and PRO. (3) The phylum Chloroflexi may facilitate the production of allelochemicals like pipecolic acid and 5-hydroxy-L-tryptophan and may suppress the accumulation of quality compounds TS and TPP. (4) Firmicutes may contribute to increased synthesis of 3-feruloylquinic acid. (5) Acidobacteriota may negatively affect the formation of the quality compound TPP. (6) Bacteroidota may promote the biosynthesis of allelochemicals such as andrographolide, pipecolic acid, pinocembrin, and 3-coumaric acid, as well as quality compound TF. (7) Gemmatimonadota may stimulate the production of certain allelochemicals, including pipecolic acid and 5-hydroxy-L-tryptophan, and enhance the synthesis of FAAs and PRO, yet may inhibit the formation of TS and TPP. (8) Myxococcota appears to suppress the synthesis of allelochemicals such as cellobiose, as well as quality compounds TF, TS, and TPP, but may promote the formation of pipecolic acid, 5-hydroxy-L-tryptophan, FAA, and PRO. (9) Patescibacteria may encourage the biosynthesis of allelochemicals, including pipecolic acid, pinocembrin, and 5-hydroxy-L-tryptophan. (10) The phylum WPS-2 seems to be unfavorable for the formation of allelochemicals such as pipecolic acid and 5-hydroxy-L-tryptophan, as well as for FAA (Figure 9d) production.

3.10.3. Associations Between Allelochemicals/Key Compounds in PCH Rhizomes and Soil Microbial Genera

According to Figure 9e, the relationships between specific soil microbial genera and the synthesis of allelochemicals and key quality compounds in PCH rhizomes are detailed as follows: (1) The genus Streptomyces may not support the biosynthesis of allelochemicals such as pipecolic acid and pinocembrin. (2) The genus norank_o_Gaiellales may not be conducive to the synthesis of allelochemicals, including pipecolic acid, pinocembrin, 3-feruloylquinic acid, and 5-hydroxy-L-tryptophan, yet may facilitate the synthesis of TPP. (3) The Sphingomonas may negatively affect the production of allelochemicals such as cellobiose, as well as quality compound TS, but may enhance the synthesis of 5-hydroxy-L-tryptophan and PRO. (4) The genera unclassified_c_Actinobacteria, Humibacter, and unclassified_o_Frankiales generally do not facilitate the synthesis of pipecolic acid (specifically for Humibacter), pinocembrin (excluding Humibacter), 3-feruloylquinic acid (specifically for unclassified_o_Frankiales), and 5-hydroxy-L-tryptophan, nor the formation of FAAs (excluding unclassified_c_Actinobacteria) and PRO. However, these genera may stimulate the synthesis of quality compounds of TS and TPP. (5) The genus Nitrolancea may promote the formation of cellobiose and TF. (6) The genera Gemmatimonas and norank_c_Acidimicrobiia may not support the formation of cellobiose (only Gemmatimonas) or the synthesis of quality compounds TS and TPP (only Gemmatimonas), but they may facilitate the biosynthesis of allelochemicals such as pipecolic acid, pinocembrin, and 5-hydroxy-L-tryptophan, as well as the synthesis of FAAs (only Gemmatimonas) and PRO. (7) Ochrobactrum may enhance the synthesis of andrographolide, 3-feruloylquinic acid, and WSEs, while potentially inhibiting the synthesis of TPS in PCH rhizomes (Figure 9e).

4. Discussion

4.1. The Three Biochars Demonstrate Superior Physicochemical Properties, Enhancing Soil Physicochemical Properties and Promoting PCH Rhizome Development

Biochar, a commonly employed soil amendment, modulates soil physicochemical attributes, thereby fostering a conducive rhizosphere microenvironment that supports plant growth [37]. Ng et al. [38] observed that the incorporation of 3% phosphorus-modified peanut shell biochar elevated soil AP levels and significantly increased TPS content in Pseudostellaria heterophylla tubers by 44%. This enhancement was attributed to improved phosphorus bioavailability in soil, which augmented photosynthetic efficiency and consequently supplied greater carbon substrates necessary for polysaccharide biosynthesis. In this study, three distinct biochars, namely, MB, RB, and TB, were applied to assess their efficacy in improving the quality of PCH rhizomes and mitigating allelochemical accumulation within these rhizomes. Comparable stimulatory effects on PCH growth (Figure 4a–f) and soil physicochemical properties (Figure 7a–j) were observed, potentially attributable to the following factors.
Firstly, all three biochars exhibited alkaline characteristics, which can effectively alleviate soil acidification [39]. Specifically, MB, RB, and TB displayed elevated pH values of 9.72, 9.85, and 9.76, respectively (Table S1). These properties likely contributed to an increase in soil pH by 0.27 to 0.88 units relative to the CK treatment (initial soil pH: 4.18), with the R2 treatment notably raising soil pH to approximately 5.0 (Figure 7a). Previous studies have identified the optimal soil pH range for PCH growth as 4.52 to 6.81 [40]. Therefore, the observed elevation in soil pH values may represent a critical factor stimulating PCH growth (Figure 4a,b) and thriving of more microbial communities (enhanced Shannon index in Figure S5a).
Secondly, the biochars provided abundant nutrients essential for PCH development. These biochars are characterized by high contents of ash, TN, TP and TK (Table S1), as well as key elements including C, Si, O, K, Ca, and S (Figure S1). Such nutrient richness likely supports both plant growth and microbial activity. For instance, biochar application significantly increased soil SOM (Figure 7b), TN (Figure 7c), TP (Figure 7d), CEC (Figure 7f), EC (Figure 7g), and AK (Figure 7j) in the rhizosphere soil of PCH, particularly under the T2 treatment. Notably, TB is recognized for its superior adsorption capacity [41], enabling effective nutrient retention and reducing nutrient leaching. Given that N, P, and K are vital for plant growth, with K playing a pivotal role in photosynthesis [42], the combined effects of optimized soil pH and enhanced nitrogen bioavailability can improve photosynthetic carbon fixation [43,44]. This, in turn, supplies adequate carbon skeletons and metabolic energy necessary for the biosynthesis of secondary metabolites, especially TPS, within PCH rhizomes.
Thirdly, the three biochars possess a porous architecture (Figure 3a), abundant micropores with high specific surface areas (Figure 1), and numerous functional groups (Figure 3b and Figure S1). These features likely enhance water retention and nutrient adsorption capacities, as supported by N2 adsorption analysis (Figure 1a–f). For example, RB and MB uniquely contain C≡N and CO3 functional groups, respectively, whereas TB lacks the Si–O–Si functional group (Figure 3b). The C≡N bond is a strongly polar covalent triple bond, exhibiting partial negative charge at the N-terminus and partial positive charge at the C-terminus [45]. The CO32− group can complex with cations such as Ca2+, Fe3+, Zn2+, and Mn2+, thereby potentially reducing the bioavailability of these elements [46,47]. Additionally, the surface of silicon oxides (Si–O–Si) is highly polar and can bind metal cations, including Ca2+, Fe3+, and Al3+, through hydrogen bonding, electrostatic adsorption, and coordination bonds [48,49].

4.2. Biochar Amendments Enhance Soil Physicochemical Properties, Facilitating the Synthesis of Quality Components in PCH Rhizomes

The present study demonstrated that biochar application markedly increased the concentrations of key quality compounds in PCH rhizomes, such as TPS; notably under the R2 treatment (Figure 4c), TF (under M2, R1/2, and T1/2 treatments, Figure 4d), TS (M1/2, R2, and T2 treatments, Figure 4e), and TPP (under M1 and R1/2 treatments, Figure 4f). These enhancements were closely linked to biochar-induced improvements in the physicochemical properties of the rhizosphere soil. Specifically, (1) soil SOM, TN, AK, and CEC exhibited significant positive correlations with TPS content in PCH rhizomes (Figure 9c), with TPS content increasing by 48.5% under the R2 treatment (Figure 4a); (2) TF content was positively correlated with soil pH, but negatively correlated with SOM, AK, and CEC; and (3) TS and TPP showed significant positive correlations with soil pH, TP, and AP, while negatively correlating with AN. These findings align with prior studies, such as Yang et al. [50], who reported that RB enhanced saponin accumulation in Panax quinquefolius roots, and Zulfiqar et al. [51], who observed that wheat straw biochar increased total phenol and TF content in Alpinia zerumbet. Collectively, these results suggest that the application of various biochars optimizes soil physicochemical characteristics, particularly for soil pH, thereby promoting the accumulation of TPS, TF, TS, and TPP in PCH rhizomes.

4.3. Biochar-Induced Activation of the Citrate Cycle and Provision of Galactose Donors May Support Polysaccharide Biosynthesis in PCH Rhizomes

The citrate cycle constitutes a fundamental metabolic pathway for energy generation via aerobic respiration [52]. In this investigation, all three biochar treatments significantly elevated the abundance of key citrate cycle metabolites (Figure 5c), including pyruvic acid (Figure S4a), isocitric acid (Figure S4b), L-malic acid (Figure S4c), and citric acid (Figure S4d). These results indicate that biochar amendments were associated with the stimulation of energy metabolism in PCH rhizomes, thereby enhancing ATP production. Consistent with these findings, previous research has demonstrated that peanut shell biochar promotes plant growth by activating galactose metabolism pathways in tomatoes [53]. UDP-D-galactose, a critical glycosyl donor derived from galactose metabolism, plays a pivotal role in plant polysaccharide biosynthesis [54]. The abundance of UDP-D-galactose was significantly increased by all biochar treatments, particularly under the R2 treatment (Figure S4e). Therefore, biochar application, especially the R2 treatment, may augment energy supply by upregulating citrate cycle metabolites and facilitate polysaccharide synthesis through increased UDP-D-galactose availability in PCH rhizomes.

4.4. Biochar Application Reduces FAA and PRO Concentrations in PCH Rhizomes

Biochar amendments have been reported to influence amino acid and carbohydrate metabolic pathways [55,56]. For example, RB modulated the synthesis of carboxylic acids involved in the citrate cycle (e.g., citrate, malate, acetate, and oxalate) in rice roots [57], while 0.25% wheat straw biochar inhibited amino acid metabolism in wheat roots [58]. In the current study, several metabolites associated with the arginine biosynthesis pathway were significantly downregulated across all biochar treatments (Figure 5c and Figure S4i–k). These observations corresponded with reductions in FAAs (under R2 and T1/2 treatments, Figure 4h) and PRO (under M1/2, R2, and T1/2 treatments, Figure 4g) in PCH rhizomes. Similar decreases in FAA content have been documented in spinach [59] and protein content in soybean [60]. It is plausible that biochar amendments enhance soil nitrogen uptake and reduce substrate availability for amino acid biosynthesis [61,62].
Moreover, alterations in soil physicochemical properties induced by biochar treatments may influence FAA and PRO contents (Figure 8c). Specifically, (1) soil pH and TN exhibited negative correlations with FAA content; (2) soil pH, SOM, TN, TP, AP, and AK were negatively correlated with PRO content; and (3) the AN was positively correlated with both FAA and PRO contents (Figure 9c). Consequently, the generally increases in soil pH (Figure 7a), SOM (Figure 7b), TN (Figure 7c), TP (Figure 7d), AP (Figure 7i), and AK (Figure 7j), coupled with decreases in AN (Figure 7h), appear to be unfavorable for the accumulation of FAAs and PRO in PCH rhizomes.

4.5. Biochar Application Mitigates the Production of Established Allelochemicals in PCH Rhizomes

Medicinal plants frequently contain allelochemicals that are easily exuded, potentially leading to autotoxicity and challenges associated with continuous cropping [61]. The monoculture of Polygonatum species results in the exudation of root-derived allelochemicals, which substantially diminish crop yield and quality [3]. Specific allelochemicals including 5-hydroxy-L-tryptophan [29], andrographolide [30], pinocembrin [31], and 3-feruloylquinic acid [32], have been demonstrated to directly inhibit plant growth. Furthermore, cellobiose fosters the proliferation of pathogenic fungi such as Fusarium [33], while 3-coumaric acid adversely influences soil pH, SOM content, and rhizobacterial diversity [7], thereby degrading the rhizosphere environment. Saha et al. [62] reported that biochar derived from lemongrass distillation residues reduced andrographolide concentrations in Andrographis paniculata leaves. Consistently, the relative abundance of the allelochemicals depicted in Figure 6a–h was generally and significantly diminished by most biochar treatments compared to the CK. These observations may be attributed to several factors:
(1) Inhibition of Key Metabolic Pathways: Biochar treatments generally elevated salicylic acid levels in PCH rhizomes (Figure 6h), which may suppress the jasmonic acid signaling pathway, thereby modulating the biosynthesis of terpenoid allelochemicals (e.g., andrographolide) [63,64]. Furthermore, salicylic acid can interfere with the synthesis and metabolism of 5-hydroxy-L-tryptophan, a metabolite involved in the auxin biosynthesis pathway [65]. This partially accounted for the reduced abundance of this allelochemical.
(2) Optimization of Soil Physicochemical Properties: The abundance of these allelochemicals exhibited significant negative correlations with various physicochemical parameters of PCH rhizosphere soil (Figure 9c), including pH (pipecolic acid and 5-hydroxy-L-tryptophan), EC/TP (pipecolic acid, pinocembrin and 5-hydroxy-L-tryptophan), and AK (andrographolide and 3-coumaric acid). These findings suggest that biochar induces modifications of soil characteristics and contributes to the reduction in the accumulation of allelochemicals in PCH rhizomes.
(3) Modulation of Functional Microorganisms: Wang et al. [66] observed that biochar significantly inhibited the microbial metabolism of cellobiose, thereby reducing plant allelopathy. Shi et al. [12] reported that biochar derived from silkworm excrement enhanced soil bacterial abundance, promoted enrichment of stress-resistant bacterial genera, and decreased the prevalence of pathogenic genera. In the present study, biochar treatments (i) provided a stable habitat and carbon sources for microbes, significantly increasing microbial diversity (Figure S5a); (ii) altered the abundance of Gemmatimonadota (Figure 8g) and Myxococcota (Figure 8h). Li et al. [14] demonstrated that MB increased Gemmatimonas abundance in corn rhizosphere soil. Myxobacteria function as micro-predators preying on diverse bacteria, archaea, and fungi [67], secreting antibacterial compounds such as myxocins that inhibit soil-borne pathogens like Ralstonia solanacearum [68], thereby regulating microbial community assembly. Both Myxococcota and Gemmatimonadota produce extracellular enzymes (e.g., cellulase, ligninase, and chitinase) that degrade complex organic substrates such as chitin and cellulose [69]; (iii) reduced the relative abundance of the phylum Actinobacteriota (Figure 8a) and genus Humibacter (Figure 8p). As heterotrophic ammonifying bacteria, members of Actinobacteriota and Humibacter degrade nitrogenous SOM (e.g., proteins and peptides), releasing ammonium N (NH4+-N) [70]. The decreased abundance of these taxa partially accounts for the significant reduction in AN concentration observed in PCH rhizosphere soil (Figure 7h); and (iv) notably increased the relative abundance of the genus Ochrobactrum under R1/2 treatments (Figure 8t). Ochrobactrum species synthesize and secrete siderophores that chelate iron, forming soluble iron-siderophore complexes [71], which facilitate photosynthetic product synthesis at appropriate iron levels [72,73].
(4) Restructuring of Soil Microbial Community Composition: Correlation analyses revealed that phyla Myxococcota and Gemmatimonadota were significantly positively correlated with allelochemicals of pipecolic acid and 5-hydroxy-L-tryptophan, as well as contents of FAAs and PRO; conversely, phylum Actinobacteriota exhibited strong negative correlations with pipecolic acid, pinocembrin, and 5-hydroxy-L-tryptophan (Figure 9d). These results suggest a potential regulatory relationship between allelochemical accumulation in PCH rhizomes and the structure of the rhizosphere microbial community under biochar application.

5. Conclusions

The application of biochars significantly enhanced the quality of PCH rhizomes by stimulating the synthesis of TPS, TF, TS, and TPP, although they did not promote the synthesis of PRO and FAAs in PCH rhizomes. Non-targeted metabolomic analyses indicated that biochar amendments increased the abundance of various metabolites involved in the citrate cycle and elevated the abundance of UDP-D-galactose, thereby facilitating polysaccharide biosynthesis. Additionally, biochars suppressed various metabolites involved in the arginine biosynthesis pathway, partially accounting for the decreased PRO and FAA contents in PCH rhizomes. All biochar treatments significantly reduced the relative abundance of multiple allelochemicals, with the T2 treatment exhibiting the most pronounced effect. Moreover, biochars markedly improved soil physicochemical properties (e.g., pH, SOM, TN, and AK) and restructured the rhizosphere bacterial community by increasing the abundance of beneficial phyla such as Myxococcota and Gemmatimonadota. In summary, the three biochars likely enhance the content of quality components and reduce allelochemical accumulation in PCH rhizomes through the following mechanisms: (1) optimization of soil physicochemical properties; (2) alteration of the abundance of key metabolites such as salicylic acid involved in allelochemical synthesis within PCH rhizomes; (3) modulation of functional microbial abundance in the PCH rhizosphere; and (4) reconstruction of the soil microbial community structure in the PCH rhizosphere.

Supplementary Materials

The following supporting information can be downloaded at: https://www.mdpi.com/article/10.3390/horticulturae12030370/s1. The figures and tables presented in Supplementary File S1, are enumerated as follows: Figure S1: EDS images of biochars. Figure S2: Number of DAMs between different biochar treatments and the control group. Figure S3: Volcano plots of DAMs in rhizomes under different treatments (p ≤ 0.05). Figure S4: Effects of biochars on key differential metabolites. Figure S5: Effects of biochars on rhizobacterial diversity in the rhizosphere soil, including Shannon index (a), Simpson index (b), PCoA analysis at the phylum level (c), and PCoA analysis at the genus level (d). Figure S6: Core shared microbial taxa (a) and key differential taxa among distinct treatment groups (b,c). Figure S7: Effects of biochars on the bacterial community composition in the rhizosphere soil at the phylum level (a) and genus level (b). Table S1: Physicochemical properties of the biochars. Table S2: ASV numbers in the rhizosphere soil under different treatments. Supplementary File S2 provides a comprehensive description of the data analysis methodologies employed. References [74,75,76,77,78,79,80] are cited in the supplementary materials.

Author Contributions

Conceptualization, H.C.; methodology, Y.N.; software, J.Z.; formal analysis, W.L.; investigation, Y.Z. (Yanming Zhu); data curation, M.Z.; writing—original draft preparation, Y.Z. (Yanming Zhu); supervision, H.S. and Q.C.; writing—review and editing, Y.Z. (Yujing Zhu), R.Z., and R.F. All authors have read and agreed to the published version of the manuscript.

Funding

This research was supported by the Fujian Provincial Natural Science Foundation (Grant No. 2023J05066), the National Natural Science Foundation of China (Grant No. 32502827), the Fujian Provincial Public Welfare Research Project (Grant No. 2024R1080), and the Outstanding Science and Technology Innovation Talent Program of Fujian Academy of Agricultural Sciences (Grant No. YCZX202501).

Data Availability Statement

The original contributions presented in the study are publicly available. These data can be found here: https://www.ncbi.nlm.nih.gov/ (accessed on 27 December 2025), accession number PRJNA1394316.

Conflicts of Interest

There are no conflicts of interest associated with this manuscript, and it has been approved for publication by all authors. This manuscript is original and has not been published, in whole or in part, previously.

References

  1. National Pharmacopoeia Committee. Pharmacopoeia of the People’s Republic of China: Part, I, 2025 ed.; China Medical Science Press: Beijing, China, 2025; 319p. [Google Scholar]
  2. Lu, M.; Zhang, L.; Kang, S.; Ren, F.; Yang, L.; Zhang, Q.; Jia, Q. Comprehensive evaluation of the nutritional properties of different germplasms of Polygonatum cyrtonema Hua. Foods 2024, 13, 815. [Google Scholar] [CrossRef]
  3. Wang, Q.S.; Ban, J.J.; Cai, R.D.; Zhang, X.Y.; Lai, C.W.; Chen, Y.; Li, X.L.; Chen, C.R.; Chen, Y.K.; Zhang, Z.H.; et al. Metabolic composition and quality traits of Polygonatum cyrtonema Hua from different germplasms and age sections based on widely targeted metabolomics analysis. Int. J. Mol. Sci. 2023, 24, 6077. [Google Scholar] [CrossRef] [PubMed]
  4. Ni, X.Z.; Jin, C.Z.; Liu, A.Y.; Chen, Y.; Hu, Y.H. Physiological and transcriptomic analyses to reveal underlying phenolic acid action in consecutive monoculture problem of Polygonatum odoratum. BMC Plant Biol. 2021, 21, 362. [Google Scholar] [CrossRef]
  5. Rial, C.; Gómez, E.; Varela, R.M.; Molinillo, J.M.G.; Macias, F.A. Ecological relevance of the major allelochemicals in Solanum Lycopersicum roots and exudates. J. Agric. Food Chem. 2018, 66, 4638–4644. [Google Scholar] [CrossRef] [PubMed]
  6. Butnariu, M.; Koirala, N. Main Pathways Involved in the Production of Allelochemicals. In Allelopathy, 1st ed.; Apple Academic Press: New York, NY, USA, 2025; p. 34. [Google Scholar]
  7. Jia, M.; Wang, X.S.; Zhu, X.Q.; Du, Y.; Zhou, P.; Wang, G.; Wang, N.; Bai, Y.X. Accumulation of coumaric acid is a key factor in tobacco continuous cropping obstacles. Front. Plant Sci. 2024, 15, 1477324. [Google Scholar] [CrossRef] [PubMed]
  8. Scavo, A.; Abbate, C.; Mauromicale, G. Plant allelochemicals: Agronomic, nutritional and ecological relevance in the soil system. Plant Soil. 2019, 442, 23–48. [Google Scholar] [CrossRef]
  9. Arafat, Y.; Din, I.U.; Tayyab, M.; Jiang, Y.; Chen, T.; Cai, Z.; Zhao, H.; Lin, X.; Lin, W.; Lin, S. Soil sickness in aged tea plantation is associated with a shift in microbial communities as a result of plant polyphenol accumulation in the tea gardens. Front. Plant Sci. 2020, 11, 601. [Google Scholar] [CrossRef]
  10. Li, Y.L.; Dai, S.Y.; Wang, B.Y.; Jiang, Y.T.; Ma, Y.Y.; Pan, L.L.; Wu, K.; Huang, X.Q.; Zhang, J.B.; Cai, Z.C.; et al. Autotoxic ginsenoside disrupts soil fungal microbiomes by stimulating potentially pathogenic microbes. Appl. Environ. Microbiol. 2020, 86, e00130-20. [Google Scholar] [CrossRef] [PubMed]
  11. Xin, A.Y.; Jin, H.; Yang, X.Y.; Guan, J.F.; Hui, H.P.; Liu, H.Y.; Cui, Z.T.; Dun, Z.H.; Qin, B. Allelochemicals from the rhizosphere soil of potato (Solanum tuberosum L.) and their interactions with the soilborne pathogens. Plants 2022, 11, 1934. [Google Scholar] [CrossRef] [PubMed]
  12. Shi, S.J.; Yang, G.J.; Lin, M.T.; Chen, Q.Y.; Wang, B.; Zhao, J.Y.; Rensing, C.; Liu, H.; Fan, Z.L.; Feng, R.W. Using silkworm excrement to restore vegetation and soil ecology in heavily contaminated mining soils by multiple metal(loid)s: A recyclable sericulture measure. J. Hazard. Mater. 2023, 459, 132184. [Google Scholar] [CrossRef] [PubMed]
  13. Patel, M.R.; Panwar, N.L. Biochar from agricultural crop residues: Environmental, production, and life cycle assessment overview. Resour. Conserv. Recycl. Adv. 2023, 19, 200173. [Google Scholar] [CrossRef]
  14. Li, X.; Romanyà, J.; Li, N.; Xiang, Y.S.; Yang, J.F.; Han, X.R. Biochar fertilization effects on soil bacterial community and soil phosphorus forms depends on the application rate. Sci. Total Environ. 2022, 843, 157022. [Google Scholar] [CrossRef] [PubMed]
  15. Tian, G.L.; Bi, Y.M.; Jiao, X.L.; Zhang, X.M.; Li, J.F.; Niu, F.B.; Gao, W.W. Application of vermicompost and biochar suppresses Fusarium root rot of replanted American ginseng. Appl. Microbiol. Biotechnol. 2021, 105, 6977–6991. [Google Scholar] [CrossRef] [PubMed]
  16. Zhao, L.Y.; Xu, W.M.; Guan, H.L.; Wang, K.Y.; Xiang, P.; Wei, F.G.; Yang, S.Z.; Miao, C.P.; Ma, L.Q. Biochar increases Panax notoginseng’s survival under continuous cropping by improving soil properties and microbial diversity. Scotal Environ. 2022, 850, 157990. [Google Scholar] [CrossRef]
  17. Feng, Y.; Hu, X.; Guan, Y.H.; Chu, Z.X.; Du, X.F.; Xie, Y.Y.; Yang, S.Q.; Ye, S.R.; Zhang, L.; Ma, J.Y.; et al. Regulatory effects of different biochar on soil properties and microbial community structure in chrysanthemum continuous cropping soil. Agronomy 2024, 14, 2034. [Google Scholar] [CrossRef]
  18. Liu, H.; Li, C.; Lin, Y.; Chen, Y.J.; Zhang, Z.J.; Wei, K.H.; Lei, M. Biochar and organic fertilizer drive the bacterial community to improve the productivity and quality of Sophora tonkinensis in cadmium-contaminated soil. Front. Microbiol. 2024, 14, 1334338. [Google Scholar] [CrossRef] [PubMed]
  19. Farhangi-Abriz, S.; Ghassemi-Golezani, K. Improving electrochemical characteristics of plant roots by biochar is an efficient mechanism in increasing cations uptake by plants. Chemosphere 2023, 313, 137365. [Google Scholar] [CrossRef] [PubMed]
  20. Asadi, H.; Ghorbani, M.; Rezaei Rashti, M.; Abrishamkesh, S.; Amirahmadi, E.; Chen, C.R.; Gorji, M. Application of rice husk biochar for achieving sustainable agriculture and environment. Rice Sci. 2021, 28, 325–343. [Google Scholar] [CrossRef]
  21. Zheng, H.Y.; Zhu, Y.M.; Liao, P.H.; Lin, F.F.; Ye, W.; Mao, F.H.; Fang, L.; Fang, Y.H.; Su, H.L. Intercropping with Paris polyphylla and Ganoderma lucidum: Regulatory effects on the rhizosphere microbial community and the quality of Polygonatum cyrtonema. Front. Microbiol. 2025, 16, 1711104. [Google Scholar] [CrossRef] [PubMed]
  22. Ma, S.H.; Ma, S.; Yin, W.Q.; Wang, S.S.; Sheng, H.J.; Wang, X.Z. Effects of biochar on the availability of trace elements in different types of soil. Toxics 2025, 13, 169. [Google Scholar] [CrossRef]
  23. Lu, R.K. Methods of Soil Agricultural Chemical Analysis; China Agricultural Science and Technology Press: Beijing, China, 2000; pp. 12–226. [Google Scholar]
  24. Zhu, Y.M.; Li, Z.F.; Shen, J.; Wu, K.Y.; Zhao, P.P.; Wu, Z.H.; Liu, Z.Q.; Yang, J.G.; Liu, H.; Rensing, C.; et al. Toxicity of different forms of antimony to rice plants: Photosynthetic electron transfer, gas exchange, photosynthetic efficiency, and carbon assimilation combined with metabolome analysis. J. Hazard. Mater. 2022, 437, 129433. [Google Scholar] [CrossRef] [PubMed]
  25. Yuan, Q.; Han, Y.C.; Huang, J.W.; Liu, X.M. Seasonal variation of nutritional and bioactive constituents in Polygonatum odoratum. J. Food Compos. Anal. 2023, 124, 105655. [Google Scholar] [CrossRef]
  26. Peng, F.L.; Li, C.X.; Liu, H.L.; Chen, G.F.; Zhang, B.; Li, H.Y. Quality assessment of Polygonatum cyrtonema Hua from multiple origins and cultivation modes via UPLC-Q-Exactive-MS/MS-based untargeted metabolomics. Food Biosci. 2025, 68, 106713. [Google Scholar] [CrossRef]
  27. You, X.J.; Guo, R.; Wang, L.; Wang, J.R. Ultrasonic extraction process of saponins from Polygonatum sibiricum. J. Northwest For. Univ. 2010, 25, 163–166. [Google Scholar]
  28. GB 5009.124-2016; National Food Safety Standard-Determination of Amino Acids in Food. Standards Press of China: Beijing, China, 2016.
  29. Koyanagi, T.; Nakagawa, A.; Sakurama, H.; Yamamoto, K.; Sakurai, N.; Takagi, Y.; Minami, H.; Katayama, T.; Kumagai, H. Eukaryotic-type aromatic amino acid decarboxylase from the root colonizer Pseudomonas putida is highly specific for 3,4-dihydroxyphenyl-l-alanine, an allelochemical in the rhizosphere. Microbiology 2012, 158, 2965–2974. [Google Scholar] [CrossRef]
  30. Hu, L.; Xue, R.R.; Xu, C.R.; Zhang, Z.Y.; Zhang, G.; Zeng, R.S.; Song, Y.Y. Autotoxicity in the cultivated medicinal herb Andrographis paniculata. Allelopath. J. 2018, 45, 141–151. [Google Scholar] [CrossRef]
  31. Pistelli, L.; Giorgi, I. Antimicrobial properties of flavonoids. In Dietary Phytochemicals and Microbes; Springer: Dordrecht, The Netherlands, 2012; pp. 33–91. [Google Scholar]
  32. Othman, R.; Ramya, R.; Mohd Hassan, N.; Masyitah, W.D.W.; Nadia, J.N. Characterisation of allelochemical compounds signature in two mangrove forest species of Rhizophora apiculata and Acrostichum aureum and potential in suppressing weed growth. IOP Conf. Ser. Earth Environ. Sci. 2019, 380, 012016. [Google Scholar] [CrossRef]
  33. Asiegbu, F.O. Effects of carbohydrates, ethanol and selected cell wall phenolics on in vitro growth of necrotrophic fungi—Heterobasidion annosum and Fusarium avenaceum. J. Basic Microbiol. 2000, 40, 139–148. [Google Scholar] [CrossRef]
  34. Judžentienė, A.; Būdienė, J.; Labanauskas, L.; Stancelytė, D.; Nedveckytė, I. Allelopathic activity of canadian Goldenrod (Solidago canadensis L.) extracts on seed germination and growth of lettuce (Lactuca sativa L.) and garden pepper cress (Lepidium sativum L.). Plants 2023, 12, 1421. [Google Scholar] [CrossRef]
  35. Campbell, E.J.; Schenk, P.M.; Kazan, K.; Penninckx, I.A.M.A.; Anderson, J.P.; Maclean, D.J.; Cammue Bruno, P.A.; Ebert, P.R.; Manners, J.M. Pathogen-responsive expression of a putative atp-binding cassette transporter gene conferring resistance to the diterpenoid sclareol is regulated by multiple defense signaling pathways in arabidopsis. Plant Physiol. 2003, 133, 1272–1284. [Google Scholar] [CrossRef]
  36. Ghimire, B.K.; Ghimire, B.; Yu, C.; Chung, I.M. Allelopathic and autotoxic effects of medicago sativa—Derived allelochemicals. Plants 2019, 8, 233. [Google Scholar] [CrossRef]
  37. Yan, H.; Cong, M.F.; Hu, Y.; Qiu, C.C.; Yang, Z.L.; Tang, G.M.; Xu, W.L.; Zhu, X.P.; Sun, X.; Jia, H.T. Biochar-mediated changes in the microbial communities of rhizosphere soil alter the architecture of maize roots. Front. Microbiol. 2022, 13, 1023444. [Google Scholar] [CrossRef] [PubMed]
  38. Ng, C.W.W.; Wang, Y.C.; Ni, J.J.; So, P.S. Effects of phosphorus-modified biochar as a soil amendment on the growth and quality of Pseudostellaria heterophylla. Sci. Rep. 2022, 12, 7268. [Google Scholar] [CrossRef]
  39. Lan, Z.Y.; Deng, R.; Shang, X.L.; Chang, S.X.; Fang, S.Z. Biochar additions shape soil microbial community and leaf bioactive-substance accumulation in Cyclocarya paliurus grown on an acidic soil. Appl. Soil Ecol. 2024, 203, 105652. [Google Scholar] [CrossRef]
  40. Zhang, Q.; Cai, Y.; Zhang, L.; Lu, M.; Yang, L.; Jia, Q. The accumulation of active ingredients of Polygonatum cyrtonema Hua is associated with soil characteristics and bacterial community. Front. Microbiol. 2024, 15, 1347204. [Google Scholar] [CrossRef] [PubMed]
  41. Khalil, U.; Shakoor, M.B.; Ali, S.; Rizwan, M.; Alyemeni, M.N.; Wijaya, L. Adsorption-reduction performance of tea waste and rice husk biochars for Cr(VI) elimination from wastewater. J. Saudi Chem. Soc. 2020, 24, 799–810. [Google Scholar] [CrossRef]
  42. Hu, W.S.; Ren, T.; Meng, F.J.; Cong, R.H.; Li, X.K.; White, P.J.; Lu, J.W. Leaf photosynthetic capacity is regulated by the interaction of nitrogen and potassium through coordination of CO2 diffusion and carboxylation. Physiol. Plant. 2019, 167, 418–432. [Google Scholar] [CrossRef] [PubMed]
  43. Jia, X.L.; Zhang, Q.; Wang, Y.H.; Zhang, Y.; Li, M.Z.; Cheng, P.Y.; Chen, M.H.; Lin, S.X.; Zou, J.S.; Ye, J.H.; et al. Changes of physiological characteristics, element accumulation and hormone metabolism of tea leaves in response to soil pH. Front. Plant Sci. 2023, 14, 1266026. [Google Scholar] [CrossRef]
  44. Yue, X.L.; Liu, X.F.; Fang, S. Influence of nitrogen and phosphorus additions on parameters of photosynthesis and chlorophyll fluorescence in Cyclocarya paliurus seedlings. Photosynthetica 2023, 61, 318–327. [Google Scholar] [CrossRef] [PubMed]
  45. Zhao, Y.T.; Cheng, X.L. Atomic charges, surface electrostatic potential analysis, and bond order analysis on nitriles and isocyanides. J. Mol. Model. 2021, 27, 257. [Google Scholar] [CrossRef]
  46. Aljumaily, M.M.; Al-Hamandi, H.M.; Al-Obaidi, M.A.; AL-Zidan, R.R. The effect of calcium carbonate content on the zinc quantity-intensity relationship in some soils of Mosul, Irak. Cienc. Tecnol. Agropecu. 2022, 22, e2373. [Google Scholar] [CrossRef]
  47. Lin, Q.Q.; Gu, G.H.; Wang, H.; Wang, C.Q.; Liu, Y.C.; Zhu, R.F.; Fu, J.G. Separation of manganese from calcium and magnesium in sulfate solutions via carbonate precipitation. Trans. Nonferrous Met. Soc. China 2016, 26, 1118–1125. [Google Scholar] [CrossRef]
  48. Szymanek, K.; Charmas, R.; Piasecki, W. Investigations of mechanism of Ca2+ adsorption on silica and alumina based on Ca-ISE monitoring, potentiometric titration, electrokinetic measurements and surface complexation modeling. Adsorption 2021, 27, 105–115. [Google Scholar] [CrossRef]
  49. Miao, Y.Q.; Yan, H.S.; Qiu, X.H.; Zhou, X.W.; Zhu, D.M.; Li, X.B.; Qiu, T.S. Adsorption of hydrated Al3+ on the kaolinite (001) surface: A density functional theory study. Appl. Clay Sci. 2022, 223, 106498. [Google Scholar] [CrossRef]
  50. Yang, X.T.; Ran, Z.F.; Li, R.; Fang, L.; Zhou, J.; Guo, L.P. Effects of biochar on the growth, ginsenoside content, and soil microbial community composition of Panax quinquefolium L. J. Soil Sci. Plant Nutr. 2022, 22, 2670–2686. [Google Scholar] [CrossRef]
  51. Zulfiqar, F.; Chen, J.J.; Younis, A.; Abideen, Z.; Naveed, M.; Koyro, H.W.; Siddique, K.H.M. Biochar, compost, and biochar-compost blend applications modulate growth, photosynthesis, osmolytes, and antioxidant system of medicinal plant Alpinia zerumbet. Front. Plant Sci. 2021, 12, 707061. [Google Scholar] [CrossRef]
  52. Schmidtmann, E.; König, A.C.; Orwat, A.; Leister, D.; Hartl, M.; Finkemeier, I. Redox regulation of arabidopsis mitochondrial citrate synthase. Mol. Plant. 2014, 7, 156–169. [Google Scholar] [CrossRef]
  53. Zhu, Y.Y.; Di, Q.Q.; Li, M.; Du, Q.J.; Xiao, H.J. Effects of peanut shell biochar and fermented cow manure on plant growth and metabolism of tomato. Chem. Biol. Technol. Agric. 2024, 11, 113. [Google Scholar] [CrossRef]
  54. Seifert, G.J.; Barber, C.; Wells, B.; Dolan, L.; Roberts, K. Galactose biosynthesis in arabidopsis: Genetic evidence for substrate channeling from udp-d-galactose into cell wall polymers. Curr. Biol. 2002, 12, 1840–1845. [Google Scholar] [CrossRef] [PubMed]
  55. Wang, J.; Sun, L.J.; Sun, Y.F.; Yang, S.Y.; Qin, Q.; Xue, Y. Integrated enzyme activities and untargeted metabolome to reveal the mechanism that allow long-term biochar-based fertilizer substitution improves soil quality and maize yield. Environ. Res. 2025, 270, 120935. [Google Scholar] [CrossRef] [PubMed]
  56. Yang, H.Y.; Kerner, P.; Liang, X.; Struhs, E.; Mirkouei, A.; You, Y.O. Biochar amendment modulates root metabolome and rhizosphere microbiome of wheat. Biochar 2025, 7, 46. [Google Scholar] [CrossRef]
  57. Oladele, S.O. Effect of biochar amendment on soil enzymatic activities, carboxylate secretions and upland rice performance in a sandy clay loam alfisol of southwest nigeria. Sci. Afr. 2019, 4, e00107. [Google Scholar] [CrossRef]
  58. Yang, H.; Kerner, P.; Liang, X.; Struhs, E.; Mirkouei, A.; You, Y. Biochar modulates wheat root metabolome and rhizosphere microbiome in a feedstock-dependent manner. bioRxiv 2024. [Google Scholar] [CrossRef]
  59. Zemanová, V.; Břendová, K.; Pavlíková, D.; Kubátová, P.; Tlustoš, P. Effect of biochar application on the content of nutrients (Ca, Fe, K, Mg, Na, P) and amino acids in subsequently growing spinach and mustard. Plant Soil Environ. 2017, 63, 322–327. [Google Scholar] [CrossRef]
  60. Wang, L.X.; Yu, B.H.; Ji, J.M.; Khan, I.; Li, G.L.; Rehman, A.; Liu, D.; Li, S. Assessing the impact of biochar and nitrogen application on yield, water-nitrogen use efficiency and quality of intercropped maize and soybean. Front. Plant Sci. 2023, 14, 1171547. [Google Scholar] [CrossRef] [PubMed]
  61. Qiao, Y.J.; Gu, C.Z.; Zhu, H.T.; Wang, D.; Zhang, M.Y.; Zhang, Y.X.; Yang, C.R.; Zhang, Y.J. Allelochemicals of Panax notoginseng and their effects on various plants and rhizosphere microorganisms. Plant Divers. 2020, 42, 323–333. [Google Scholar] [CrossRef]
  62. Saha, A.; Basak, B.B.; Gajbhiye, N.A.; Kalariya, K.A.; Manivel, P. Sustainable fertilization through co-application of biochar and chemical fertilizers improves yield, quality of Andrographis paniculata and soil health. Ind. Crops Prod. 2019, 140, 111607. [Google Scholar] [CrossRef]
  63. Huang, H.L.; Qi, Q.; Yang, Z.L.; Chen, Z.R.; Zhong, M.X.; Zeng, H.S.; Lv, B.D.; Yang, C.Q.; Jin, H.L.; Wang, H.B. Warm temperatures regulate andrographolide biosynthesis through jasmonic acid signaling mediated by the ApMYC2-ApHSFB2b module in Andrographis paniculata. Plant J. 2025, 123, e70419. [Google Scholar] [CrossRef]
  64. Koornneef, A.; Leon Reyes, A.; Ritsema, T.; Verhage, A.; Den Otter, F.C.; Van, L.L.C.; Pieterse, C.M.J. Kinetics of salicylate-mediated suppression of jasmonate signaling reveal a role for redox modulation. Plant Physiol. 2008, 147, 1358–1368. [Google Scholar] [CrossRef]
  65. Zhong, Q.L.; Hu, H.L.; Fan, B.F.; Zhu, C.; Chen, Z.X. Biosynthesis and roles of salicylic acid in balancing stress response and growth in plants. Int. J. Mol. Sci. 2021, 22, 11672. [Google Scholar] [CrossRef]
  66. Wang, H.T.; Zhang, W.; Chen, L.J.; Xu, Q.S.; Jiang, Y.J.; Sun, B. Biochar induced negative priming effect on soil organic carbon mineralisation by changing the microbial community structure across plant growth stages. J. Soils Sediments 2020, 20, 3340–3350. [Google Scholar] [CrossRef]
  67. Zou, D.Y.; Zhang, C.J.; Liu, Y.Y.; Li, M. Biogeographical distribution and community assembly of Myxococcota in mangrove sediments. Environ. Microbiome 2024, 19, 47. [Google Scholar] [CrossRef]
  68. Zhang, L.L.; Bao, L.L.; Li, S.Y.; Liu, Y.; Liu, H.R. Active substances of myxobacteria against plant diseases and their action mechanisms. Front. Microbiol. 2024, 14, 1294854. [Google Scholar] [CrossRef] [PubMed]
  69. Saraf, N.; Sharma, G. Comparative genomic insight into the myxobacterial carbohydrate-degrading potential. Front. Microbiol. 2025, 16, 1550287. [Google Scholar] [CrossRef]
  70. Mitra, D.; Mondal, R.; Khoshru, B.; Senapati, A.; Radha, T.K.; Mahakur, B.; Uniyal, N.; Myo, E.M.; Boutaj, H.; Sierra, B.E.G.; et al. Actinobacteria-enhanced plant growth, nutrient acquisition, and crop protection: Advances in soil, plant, and microbial multifactorial interactions. Pedosphere 2022, 32, 149–170. [Google Scholar] [CrossRef]
  71. Singh, T.; Singh, D. Enhanced lindane degradation in the presence of root exudates of Acorus calamus and plant growth promoting rhizobacteria Ochrobactrum sp. strain A15. Environ. Exp. Biol. 2019, 17, 193–199. [Google Scholar]
  72. Larbi, A.; Abadía, A.; Abadía, J.; Morales, F. Down co-regulation of light absorption, photochemistry, and carboxylation in Fe-deficient plants growing in different environments. Photosynth. Res. 2006, 89, 113–126. [Google Scholar] [CrossRef] [PubMed]
  73. Kroh, G.E.; Pilon, M. Regulation of iron homeostasis and use in chloroplasts. Int. J. Mol. Sci. 2020, 21, 3395. [Google Scholar] [CrossRef] [PubMed]
  74. Nguyen, L.X.; Do, P.T.M.; Nguyen, C.H.; Kose, R.; Okayama, T.; Pham, T.N.; Nguyen, P.D.; Miyanishi, T. Properties of biochars prepared from local biomass in the Mekong Delta, Vietnam. Bio. Resour. 2018, 13, 7325–7344. [Google Scholar] [CrossRef]
  75. Chen, L.; Liu, M.J.; Ali, A.; Zhou, Q.C.; Zhan, S.W.; Chen, Y.C.; Pan, X.H.; Zeng, Y.J. Effects of biochar on paddy soil fertility under different water management modes. J. Soil Sci. Plant Nutr. 2020, 20, 1810–1818. [Google Scholar] [CrossRef]
  76. Chen, S.; Zhou, Y.; Chen, Y.; Gu, J. fastp: An ultra-fast all-in-one FASTQ preprocessor. Bioinformatics 2018, 34, i884–i890. [Google Scholar] [CrossRef] [PubMed]
  77. Magoč, T. FLASH: Fast length adjustment of short reads to improve genome assemblies. Bioinformatics 2011, 27, 2957–2963. [Google Scholar] [CrossRef] [PubMed]
  78. Douglas, G.M.; Maffei, V.J.; Zaneveld, J.R.; Yurgel, S.N.; Brown, J.R.; Taylor, C.M.; Huttenhower, C.; Langille, M.G. PICRUSt2 for prediction of metagenome functions. Nat. Biotechnol. 2020, 38, 685–688. [Google Scholar] [CrossRef]
  79. Schloss, P.D.; Westcott, S.L.; Ryabin, T.; Hall, J.R.; Hartmann, M.; Hollister, E.B.; Lesniewski, R.A.; Oakley, B.B.; Parks, D.H.; Robinson, C.J.; et al. Introducing mothur: Open-source, platform-independent, community-supported software for describing and comparing microbial communities. Appl. Environ. Microb. 2009, 75, 7537. [Google Scholar] [CrossRef]
  80. Barberan, A.; Bates, S.T.; Casamayor, E.O.; Fierer, N. Using network analysis to explore co-occurrence patterns in soil microbial communities. ISME J. 2012, 6, 343–351. [Google Scholar] [CrossRef] [PubMed]
Figure 1. Physicochemical and pore structure characteristics of biochars. Adsorption–desorption isotherms (ac). Pore size distribution curves (df). The abbreviations MB, RB, and TB denote biochars derived from maize straw, rice hull, and tea stem, respectively.
Horticulturae 12 00370 g001
Figure 2. SEM images (a) and FTIR spectra (b) of various biochars. The distinct peaks correspond to alterations in functional groups, with detailed information provided in panel (c). The abbreviations MB, RB, and TB denote biochars derived from maize straw, rice hull, and tea stem, respectively.
Horticulturae 12 00370 g002
Figure 3. XPS spectra of biochars. Survey spectra (ac). High-resolution C 1s spectra (df). High-resolution N 1s spectra (gi). High-resolution S 2p spectra (jl). The abbreviations MB, RB, and TB denote biochars derived from maize straw, rice hull, and tea stem, respectively.
Horticulturae 12 00370 g003
Figure 4. Effects of biochar amendments on growth and quality parameters of PCH rhizomes, including fresh weight (a), dry weight (b), total polysaccharides (TPS) (c), total flavonoids (TF) (d), total saponins (TS) (e), total phenolic compounds (TPP) (f), protein content (PRO) (g), free amino acids (FAAs) (h), water-soluble extractives (WSEs) (i), and dry matter content (DMC) (j). The treatment abbreviations of CK, M1, M2, R1, R2, T1, and T2 correspond to the control, 2% MB, 4% MB, 2% RB, 4% RB, 2% TB, and 4% TB, respectively. Error bars represent means ± standard error (n = 3). Different letters above bars denote statistically significant differences at p ≤ 0.05.
Horticulturae 12 00370 g004
Figure 5. HMDB annotation of differentially accumulated metabolites (DAMs) at the class level (a). KEGG pathway enrichment analysis of DAMs (b). Circle size and color intensity represent the quantities of DAMs and the corresponding p-values, respectively. The top 3 enrichment pathways of DAMs (c), namely, galactose metabolism, arginine biosynthesis, and phenylalanine metabolism. In panel (c), the green circles indicate metabolites significantly decreased by biochar treatments relative to the control; the white circles denote no significant differences; and red circles represent metabolites significantly increased by biochar application (p ≤ 0.05). The p-value was adjusted from the original p-values of Student’s t-test using the Benjamini–Hochberg method.
Horticulturae 12 00370 g005
Figure 6. Effects of biochar treatments on the relative abundance of allelochemicals in PCH rhizomes, including 5-hydroxy-L-tryptophan (a), andrographolide (b), pinocembrin (c), 3-coumaric acid (d), cellobiose (e), 3-feruloylquinic acid (f), sclareol (g), and salicylic acid (h). The treatment abbreviations of CK, M1, M2, R1, R2, T1, and T2 correspond to the control, 2% MB, 4% MB, 2% RB, 4% RB, 2% TB, and 4% TB, respectively. Data are presented as means ± standard error (n = 3). Different letters above bars denote statistically significant differences at p ≤ 0.05. The p-value was adjusted from the original p-values of Student’s t-test using the Benjamini–Hochberg method.
Horticulturae 12 00370 g006
Figure 7. Effects of biochars on the physicochemical properties of rhizosphere soil, including soil pH (a), SOM (b), TN (c), TP (d), TK (e), CEC (f), EC (g), AN (h), AP (i), and AK (j). Values represent means ± SE (n = 3). Different letters above bars indicate significant differences at p ≤ 0.05.
Horticulturae 12 00370 g007
Figure 8. Effects of biochar amendments on the relative abundance of bacterial taxa exhibiting significant differences at the phylum (aj) and genus (kt) levels. Data are presented as means ± standard error (n = 3). Different letters above bars denote statistically significant differences at p ≤ 0.05. Redundancy analysis (RDA) depicts the relationships between rhizosphere bacterial community composition and soil physicochemical properties at the phylum (u) and genus (v) levels.
Horticulturae 12 00370 g008
Figure 9. BugBase phenotypic predictions illustrating intergroup differences (a). The y-axis denotes phenotypic categories, and the x-axis represents the relative abundance percentage of each phenotype. FAPROTAX functional predictions of the top 10 functions (b). The y-axis indicates functional categories, and the x-axis shows the percentage representation of each function. The rightmost column presents corresponding p-values, where * and ** denote significant differences at 0.01 < p ≤ 0.05 and 0.001 < p ≤ 0.01, respectively. Panels (ce) depict the correlations between active components and allelochemicals in PCH rhizomes with soil factors (c), bacterial phyla (d), and bacterial genera in rhizosphere soil (e), respectively. Significance levels are indicated by *, **, and *** corresponding to p ≤ 0.05, p ≤ 0.01, and p ≤ 0.001 (n = 3).
Horticulturae 12 00370 g009
Disclaimer/Publisher’s Note: The statements, opinions and data contained in all publications are solely those of the individual author(s) and contributor(s) and not of MDPI and/or the editor(s). MDPI and/or the editor(s) disclaim responsibility for any injury to people or property resulting from any ideas, methods, instructions or products referred to in the content.