

Article

Dynamic Shifts in Rhizosphere Microbiome and Soil Nutrients Drive Tuber sinense Mycorrhizal Development in Castanea mollissima Seedlings


1
College of Plant Science and Technology, Beijing University of Agriculture, Beijing 102206, China
2
College of Horticulture, Xinjiang Agricultural University, Urumqi 830052, China
*
Author to whom correspondence should be addressed.
Horticulturae 2026, 12(3), 266; https://doi.org/10.3390/horticulturae12030266
Submission received: 18 January 2026 / Revised: 24 February 2026 / Accepted: 24 February 2026 / Published: 25 February 2026

Highlights

What are the main findings?
  • Inoculation with Tuber sinense significantly restructured rhizosphere microbial communities.
  • Co-occurrence network analysis showed 79.23% positive bacterial–fungal interactions, and Tuber was strongly positively correlated with Staphylotrichum and Spizellomyces.
  • Soil properties and microbial communities interacted dynamically, and Tuber exhibited significant positive correlations with TN, TK, AP, and Ca.
What are the implications of the main findings?
  • This study provides a systematic insight into rhizosphere microbial succession during T. sinense mycorrhizal development.
  • These findings support the microbe-mediated optimization of mycorrhizal seedlings and the sustainable cultivation of Chinese black truffles.

Abstract
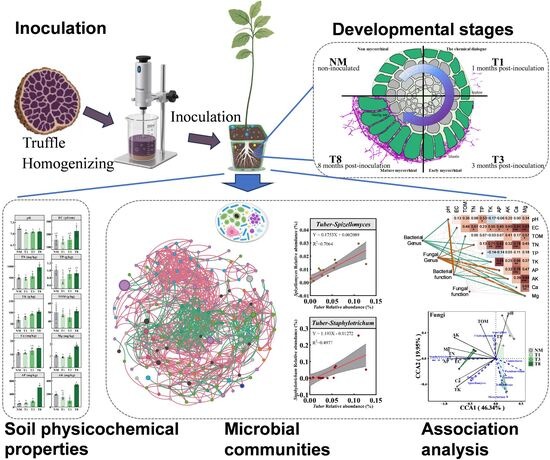
The Chinese black truffle (Tuber sinense) is an economically vital ectomycorrhizal fungus threatened by unsustainable harvesting. Cultivating truffles using mycorrhizal seedlings is essential for sustainable production, yet the rhizosphere microbiome dynamics remain unclear. This study explored microbial community succession in the rhizosphere of Chinese chestnut (Castanea mollissima) seedlings inoculated with T. sinense over 8 months. High-throughput sequencing and soil physicochemical analysis were conducted at 1, 3, and 8 months post-inoculation. Significant changes in soil properties, such as decreased pH and increased total nitrogen (TN), total potassium (TK), available phosphorus (AP), and calcium (Ca), influenced microbial assembly. Tuber relative abundance rose from 0.02% in non-inoculated samples to 8.81% at 8 months. Inoculation altered microbial structures, enriching fungal genera like Tuber, Staphylotrichum, and Sphaerosporella. Network analysis showed 79.23% positive bacterial-fungal interactions, crucial for rhizosphere stability. Tuber correlated positively with Staphylotrichum and Spizellomyces, indicating potential synergies in mycorrhizal development and nutrient cycling. Tuber also showed significant positive correlations with TN, TK, AP, and Ca, highlighting its preference for nutrient-enriched conditions. This study provides the first comprehensive profile of microbial succession during the mycorrhizal development of T. sinense on chestnut, offering a scientific basis for optimizing truffle seedling production and supporting sustainable cultivation.

Graphical Abstract

1. Introduction

Truffles, a highly prized group of hypogeous ascomycetes, are renowned for their unique and distinctive aroma. In China, truffle species are predominantly distributed in the southwestern region, with Tuber sinense being the most widespread and economically significant species [1]. Due to its aromatic and flavor resemblance to the highly coveted Tuber melanosporum, T. sinense has garnered substantial market demand both domestically and internationally, underscoring its considerable commercial value. However, similar to Tricholoma matsutake, unsustainable harvesting practices of truffles have led to severe degradation of natural habitats, resulting in a sharp decline in wild production and perpetuating a detrimental cycle of resource depletion [2]. For instance, annual wild truffle yields in Yunnan Province once peaked at approximately 1200 tons but have since plummeted to around 250 tons in recent years. In contrast, as early as the 2010s, over 80% of T. melanosporum in France was produced in managed plantations, ensuring stable and commercially viable yields [3]. This model highlights the potential of cultivated systems to meet market demand while conserving wild populations.
As ectomycorrhizal fungi, truffles require a mutualistic symbiosis with their host plants, such as Castanea, Corylus, Pinus, and Quercus species, to produce commercially valuable fruit bodies [4,5]. Truffle plantation establishment using ectomycorrhizal seedlings is therefore a pivotal strategy for mitigating wild resource depletion, promoting the artificial cultivation of Tuber species in China, and preserving ecological environments [6,7]. Such integrated approaches hold potential for ensuring both ecological sustainability and economic viability in truffle production.
High-throughput sequencing, with its ability to detect low-abundance and unculturable taxa, offers a powerful tool for dissecting the microbial mechanisms underlying truffle mycorrhizal development [8]. In truffle plantations established with Tuber borchii and four host plants (Pinus pinea, Quercus pubescens, Quercus robur, and Corylus avellana), the ectomycorrhizal fungal communities associated with P. pinea were found to differ significantly from those associated with the other broadleaf hosts, as revealed by high-throughput sequencing of ITS regions [9]. High-throughput sequencing analysis based on 16S and ITS regions revealed that inoculation with Tuber panzhihuanense significantly enhanced the diversity of the rhizosphere microbial community of its host plant, Corylus avellana [10]. Additionally, inoculation of host plants, such as Pinus seedlings, with T. melanosporum or T. sinense has been shown to alter bacterial community structures, including those carrying the phoD gene, with Pseudomonas being more abundant in truffle-colonized treatments [11]. Meanwhile, the succession of microbial communities during the formation of T. sinense–Castanea mollissima mycorrhizae under artificial conditions remains insufficiently studied.
Chinese chestnut (C. mollissima) has demonstrated considerable potential as a specialty tree species for truffle cultivation in China. It not only tolerates infertile soils well but also naturally forms stable ectomycorrhizal associations with various Tuber species, such as T. sinense, T. aestivum, and T. panzhihuanense, making it an excellent candidate for high-quality truffle production [12]. However, artificial inoculation techniques for truffle ectomycorrhizas in China are still in their infancy. Challenges include low inoculation efficiency, extended colonization periods, and vulnerability to microbial contamination, highlighting the need for further research and optimization. Successful seedling establishment depends heavily on the interplay of environmental factors (such as carbon, nitrogen, and phosphorus), host species, and the rhizosphere microbiome [13]. In Tuber borchii plantations, as the cultivation period extends, the dominance of T. borchii in the host rhizosphere is gradually replaced by Tomentella, Scleroderma, and Inocybe [9]. While research on truffle-associated microbiota has predominantly focused on microbial communities in production sites, inoculation efficacy, or the roles of individual mycorrhiza helper bacteria (MHB), limited attention has been given to the microbial community dynamics during the critical ectomycorrhizal seedling cultivation stage. This early developmental phase is crucial for establishing TuberCastanea symbiosis and improving seedling production efficiency. Understanding the temporal succession of microbial communities and their co-variation with soil environmental factors during this stage is therefore essential.
Early microscopic observations revealed that in the mycorrhizal symbiosis between T. sinense and Chinese chestnut, mycorrhizal structures began forming in small quantities three months after inoculation and entered a vigorous development phase by eight months [7]. We hypothesized that inoculation with T. sinense would significantly alter the physicochemical properties and microbial community structure of the rhizosphere soil in Chinese chestnut seedlings. To test this, rhizosphere soil samples were collected at 1, 3, and 8 months post-inoculation, and their physicochemical parameters were measured. High-throughput sequencing was employed to analyze the dynamic changes in microbial communities. This study aims to identify the key environmental factors and core microorganisms in the rhizosphere during the T. sinense-chestnut mycorrhizal formation process, providing both theoretical and experimental support for the efficient preparation of T. sinense mycorrhizal seedlings.

2. Materials and Methods

2.1. Materials

Seeds of the ‘Yanshan Hongli’ cultivar of Chinese chestnut were obtained from Beijing Huairou Chestnut Technology Experiment and Promotion Station, Beijing, China. The seeds, which were uniform in size and maturity and free from disease, were carefully selected and stored at −4 °C in a controlled-atmosphere cold room for one month prior to use. Fresh ascomata of T. sinense were sourced from the Mushuihua market in Kunming, Yunnan, China. After morphological confirmation, the ascocarps were thoroughly cleaned to remove surface soil contaminants and stored at −20 °C until further processing [7]. Sphagnum peat moss was obtained from Pindstrup (Denmark), while vermiculite and river sand were purchased from local agricultural suppliers.

2.2. Mycorrhizal Seedling Cultivation and Sampling Strategies

For inoculum preparation, the ascocarps were initially rinsed with sterile water and then homogenized in a blender at 15,000 rpm for 30 s with an appropriate volume of sterile water. The resulting suspension was adjusted to a final ratio of 1:5 (w/v, ascocarp mass to water volume) by adding sterile water [7]. This preparation served as the truffle inoculum suspension for subsequent experiments.
Seedling preparation and inoculation followed the methodology described by Huang, Li, Yuan, Wan, Colinas, He, Shi, Wang, and Yu [14]. A total of 150 Chinese chestnut seedlings were prepared, with 130 designated for inoculation and 20 serving as controls. Each inoculated seedling was cultivated in an F9 pot (9 × 9 × 13 cm) containing a standardized growing substrate. The substrate consisted of a mixture of vermiculite, sphagnum peat moss, and river sand at a volume ratio of 10:1:1 (v/v/v), uniformly amended with 10 mL of the inoculum suspension. This volume corresponded to 2 g of fresh ascocarp material per plant, as per the protocol established by Kinoshita, Obase, and Yamanaka [15]. Control seedlings were cultivated in the same substrate composition but received 10 mL of sterile water in place of the inoculum. Truffle mycorrhizal seedling cultivation adhered to the protocol described by Wang, Zhang, Cao, Yang, Qin, and Zhang [7]. To ensure consistency, both inoculated and control seedlings were maintained under identical conditions in a controlled-environment growth chamber throughout the study. Irrigation was performed every 3 to 4 days, with an additional monthly irrigation treatment consisting of 100 mL of a five-fold diluted Lloyd and McCown Woody Plant Basal Medium (WPM) with Vitamins (PhytoTech, Lenexa, KS, USA) per seedling to optimize growth conditions.
Rhizosphere soil samples from mycorrhizal seedlings were collected at 1, 3, and 8 months post-inoculation and designated as T1, T3, and T8, respectively. At each time point, seedling root systems were microscopically examined to evaluate ectomycorrhizal formation, characterized by swollen mycorrhizal structures. This analysis, based on morphological and structural characteristics, confirmed successful colonization by Tuber species [7].
Rhizosphere soil was collected using the shaking-root method [16]. Briefly, the entire root system of mycorrhizal seedlings was gently shaken to remove loosely adhering soil, and the soil tightly adhering to the roots was designated as rhizosphere soil. These samples were subsequently subjected to comprehensive analyses to determine their physicochemical properties and characterize the composition and structure of soil microbiome communities. For this experiment, soil samples from four seedlings were pooled to form one biological replicate, and four replicates (comprising 16 seedlings) were collected per treatment at each sampling time.

2.3. Analysis of Soil Physicochemical Properties

The physicochemical properties of soil were assessed using ten key indices, as described in our previous study [16]. These indices included pH, electrical conductivity (EC), total organic matter (TOM), total nitrogen (TN), total phosphorus (TP), total potassium (TK), available phosphorus (AP), available potassium (AK), calcium (Ca), and magnesium (Mg). Prior to analysis, air-dried soil samples were sieved to ensure uniformity. Soil pH and EC were measured in a 1:5 (w/v) soil-to-distilled water suspension. TOM content was quantified through combustion in a muffle furnace (Zhonghuan Electric, Tianjin, China). TN content was determined using the Kjeldahl method with an automatic analyzer (FOSS, Hillerød, Denmark). The concentrations of TP, TK, AP, AK, Ca, and Mg were measured using an inductively coupled plasma emission spectrometer (Thermo Scientific, Waltham, MA, USA).

2.4. High-Throughput Sequencing

Soil DNA (0.3 g) was extracted using a rapid soil DNA extraction kit (MP Biomedicals, Santa Ana, CA, USA). The internal transcribed spacer (ITS) region and 16S rDNA gene were targeted for amplification using the primer pairs ITS1-ITS2 (5′-CTTGGTCATTTAGAGGAAGTAA-3′ and 5′-GCTGCGTTCTTCATCGATGC-3′) and 338F-806R (5′-ACTCCTACGGGAGGCAGCAG-3′ and 5′-GGACTACHVGGGTWTCTAAT-3′), respectively [17]. PCR amplicons were subsequently prepared for sequencing, and the amplicon library was subjected to paired-end sequencing on an Illumina NovaSeq 6000 platform (Beijing Biomarker Technologies Co., Ltd., Beijing, China). The raw sequencing data have been deposited in the Genome Sequence Archive (GSA) under accession numbers CRA025686 and CRA025688. These datasets are publicly available at the GSA database (https://ngdc.cncb.ac.cn/gsa, accessed on 20 May 2025).

2.5. Bioinformatic Analyses

Initial sequence processing and analysis were conducted on the BMKCloud platform (www.biocloud.net, accessed on 22 July 2025). The raw sequencing reads were demultiplexed, quality-filtered by fastp v0.20.0, and merged by FLASH v1.2.11. The operational taxonomic units (OTUs) at a 97% similarity threshold using UPARSE v7.1, and chimeric sequences were identified and removed [17]. Taxonomic annotation of 16S rRNA gene sequences was performed using the Naive Bayes classifier implemented in QIIME2 (version 2023.9) [18], with the SILVA database (release 138.1) as the reference and a confidence threshold of 70% [19]. Similarly, taxonomic assignment of ITS sequences was conducted using the same classifier and confidence threshold (70%), but with the UNITE database (release 8.3) as the reference [20]. To eliminate biases caused by differences in sequencing depth, all samples were rarefied to a uniform sequencing depth based on the sample with the lowest valid read count. Functional predictions for bacterial and fungal communities were carried out using PICRUSt [21] and FUNGuild [22], respectively.
Soil physicochemical properties were analyzed, and bar plots were generated using GraphPad Prism 10. Data visualization was performed using the ggplot2 package in R 4.4.3 [23]. Rarefaction curves of microbial richness, alpha diversity analysis, and PCoA based on Bray–Curtis distance were conducted using the vegan package [24]. Alluvial diagrams were constructed with the ggalluvial package [25]. For taxonomic profiling, the top 10 phyla (or 20 genera) based on average relative abundance were selected for detailed visualization. Taxa with lower relative abundances were grouped as “others,” while unidentified taxa were labeled as “unclassified.” The core microbiome was defined based on taxa that were both highly abundant and ubiquitously present across samples [26]. Specifically, phyla with relative abundance above 10% were defined as dominant, and genera with mean relative abundance greater than 1% were retained for further analysis. Spearman correlations between microbial communities and soil physicochemical properties were visualized using the pheatmap package [27].
Microbial biomarkers were identified using Linear Discriminant Analysis (LDA) Effect Size (LEfSe) analysis, with a predefined LDA score threshold of 4.0, implemented through the R package Microeco [28]. Fungi-bacteria association networks were constructed using Microeco, with a correlation threshold of |r| > 0.7 and p < 0.05. Network topological properties, such as node degree, clustering coefficient, and shortest path length, were quantified to characterize network structure [28]. Networks were visually represented using Gephi v.0.10.1 [29]. To evaluate the relationships between microbial community composition and environmental factors, Mantel tests were performed using the R package linkET [30].

2.6. Statistical Analyses

Prior to statistical analysis, data normality and homogeneity of variances were assessed using the Shapiro–Wilk test and for homogeneity of variances via Levene’s test, respectively. Two-way analyses of variance (two-way ANOVA) were performed using GraphPad Prism 10 to evaluate differences among multiple groups. Post hoc comparisons were performed using Tukey’s honest significant difference (HSD) test to identify specific pairwise differences. For datasets that violated the assumption of homogeneity of variances and could not be normalized through data transformation (specifically, the predicted functional profiles of microbial communities), the non-parametric Kruskal–Wallis test was applied, followed by the Nemenyi post hoc test. All results are presented as means ± standard deviations (SD). Statistical significance was determined at p < 0.05, with significance levels denoted as follows: * 0.01 ≤ p < 0.05, ** 0.001 ≤ p < 0.01, and *** p < 0.001.

3. Results and Discussion

3.1. Soil Physicochemical Properties

3.1.1. pH and EC

The soil physicochemical properties underwent dynamic changes throughout the inoculation and cultivation process (Figure 1, Table A1). Across all treatments, pH values ranged from 7.07 to 7.22, indicating a neutral to slightly alkaline soil environment (Figure 1a). While Tuber mycorrhizal seedlings can tolerate pH levels between 5.5 and 9.5, optimal conditions for T. indicum mycorrhizal seedling cultivation are typically found in neutral to alkaline soils [26,30,31]. The soil pH in the non-mycorrhizal control (NM) was 7.22 ± 0.05, significantly (p < 0.05) higher than that of the other inoculated treatments. This reduction in pH following T. sinense inoculation aligns with previous findings [14] and may be attributed to fungal secretion of acidic substances that solubilize soil minerals, thereby lowering pH. Notably, no significant differences in pH were observed among the different inoculation time points (T1, T3, and T8), suggesting that the effect of Tuber colonization on soil pH occurs early and stabilizes thereafter, consistent with prior studies [11,12].
Regarding EC, the T8 samples exhibited the highest value (242.75 ± 71.22 μS/cm), whereas the EC of the T1 samples (141.50 ± 17.37 μS/cm) was comparable to that of the NM and T3 samples but significantly (p < 0.05) lower than that of T8 (Figure 1b). During the monthly supplementation of WPM in the preparation of mycorrhizal seedlings, the formation of mycorrhizae facilitated the uptake of mineral elements by the roots. As a result, EC demonstrated a gradual increase over the eight-month cultivation period, reflecting the progressive accumulation of soluble ions in the soil.

3.1.2. TOM and TN

No significant differences in TOM were observed among treatments (Figure 1c). However, TN in the T8 samples (952.41 ± 111.85 mg/kg) was significantly (p < 0.05) higher than the other three treatments (Figure 1d). As the mycorrhizal symbiosis matures, the host plant may allocate more photosynthates to the root system, providing additional carbon sources to the fungal partner in exchange for enhanced nitrogen acquisition. This nutrient exchange is strongly influenced by environmental conditions, symbiotic intensity, and interactions with the associated microbial community [32].

3.1.3. TP, TK, AP, and AK

TP content in the T1 samples was significantly (p < 0.05) lower than that in the NM treatment (Figure 1e), whereas no significant difference in AP was observed between these two treatments (Figure 1g). During early inoculation, T. sinense did not significantly enhance soil phosphorus availability, but its uptake or transformation activities likely contributed to a reduction in TP. Intriguingly, while TP in the T8 samples (0.92 ± 0.07 g/kg) was comparable to that of the other treatments, AP was significantly (p < 0.05) higher (596.46 ± 71.8 mg/kg). This indicates that prolonged inoculation significantly (p < 0.05) increased the pool of bioavailable phosphorus in the soil. Previous studies have demonstrated that ectomycorrhizal fungi enhance phosphorus availability by secreting organic acids and phosphatases, which solubilize otherwise inaccessible phosphorus compounds [33]. These mechanisms likely explain the marked increase in AP observed in the T8 samples.
For soil potassium, TK exhibited a continuous increasing trend across treatments (Figure 1f), while AK decreased from NM to T3 samples and then increased significantly (p < 0.05) at T8 samples (338.63 ± 3.36 mg/kg) (Figure 1h). This pattern may be associated with rapid consumption of potassium during early plant growth and the establishment of Tuber mycorrhizal symbiosis. During the early stages (NM to T3), high potassium demand by the host plant, coupled with an incompletely established symbiosis, likely led to transient depletion of AK in the soil. The recovery of AK at the T8 stage may reflect the maturation of the mycorrhizal network, enabling fungal mycelia to access and mobilize otherwise insoluble mineral sources [31,34].

3.1.4. Ca and Mg

Significant differences in Ca and Mg contents were observed across treatments. The T8 samples exhibited the highest Ca content (14.44 ± 0.16 mg/kg), significantly exceeding that of the NM and T1 samples (Figure 1i). Similarly, Mg content in the T8 samples (1.80 ± 0.14 mg/kg) was significantly (p < 0.05) higher than in all the other treatments (Figure 1j). The bioavailability of Ca and Mg is critical for Tuber growth, and enhancing their availability in the soil matrix is essential for successful cultivation [26].
Overall, the effects of inoculation timing on soil properties and nutrient dynamics exhibited distinct temporal patterns throughout the progression from initial inoculation to the formation of mature mycorrhizal associations. Mycorrhizal colonization rates and maturity at the T8 stage were significantly higher compared to the T3 stage [7]. As the symbiotic relationship evolves, the mature mycorrhizal system (at the T8 stage) plays a crucial role in enhancing soil fertility through mechanisms such as mineral weathering and mobilization of recalcitrant nutrients. In contrast, during early inoculation stages (e.g., T1 and T3), nutrient competition or incomplete functional activation of the symbiosis may limit its effects. These findings underscore the time-dependent nature of mycorrhiza-mediated modulation of the soil environment and highlight the dynamic interplay between plant-fungal interactions and soil nutrient dynamics.

3.2. Microbial Diversity and Community Structure

The amplicon sequencing data underwent rigorous quality control and preliminary processing, ensuring high-quality results for downstream analysis (Table A2). Rarefaction curves approached saturation (Figure A1), indicating sufficient sequencing depth and sample coverage. The sequencing and taxonomic profiling performance were consistent with previous studies on mycorrhizal seedling cultivation [14], confirming the reliability of the sequencing depth for microbial community characterization.
Microbial community structure and diversity were analyzed across different time points using richness indices (Chao and ACE) and diversity indices (Shannon and Simpson) to estimate microbial community diversity. For bacterial α-diversity analysis (Figure A2a, Table A3), the Chao and ACE indices were significantly lower in the T3 samples compared to the T8 samples. Similarly, the Shannon index of the T3 samples was significantly (p < 0.05) lower than that of both NM and T8 samples, while no significant differences were observed in the Simpson index among groups. The reduction in bacterial richness in the T3 samples may result from changes in soil physicochemical properties and selective microbial filtering during the early stages of symbiosis. By the T8 stage, the development of expanded mycelial networks and enhanced nutrient cycling likely improved the soil microenvironment, creating favorable niches for diverse functional bacteria and promoting community recovery and diversification.
For fungal α-diversity, no significant differences in richness (Chao and ACE) or diversity (Shannon and Simpson) indices were observed among treatment groups (Figure A2b, Table A3). This suggests that T. sinense inoculation did not substantially alter overall fungal community diversity. The limited impact on fungal diversity may be attributed to the high host specificity of ectomycorrhizal fungi, which primarily occupy distinct ecological niches during colonization without significantly disrupting other fungal taxa [35]. These findings are consistent with previous studies showing that T. borchii inoculation increases bacterial richness and diversity while having minimal effects on fungal community diversity [34].
Principal coordinate analysis (PCoA) further revealed distinct microbial community structures among treatments. For bacterial communities (Figure 2a), NM, T1, T3, and T8 samples were clearly separated, indicating significant (p < 0.05) differences in bacterial community structure among treatments. This finding aligns with prior studies demonstrating that Tuber inoculation significantly alters bacterial and fungal β-diversity [34]. In fungal PCoA (Figure 2b), NM and T8 samples were distinctly separated, whereas T1 and T3 samples formed a partially overlapping cluster, suggesting greater similarity in fungal community composition between these early time points. This pattern aligns with findings from long-term fungal community studies in truffle orchards, where temporal progression explains a substantial proportion of community variation [36].
Overall, the NM treatment exhibited distinct bacterial and fungal community structures, while T1 and T3 samples showed notable similarity, and T8 samples displayed differentiated microbial profiles. These results highlight the dynamic nature of microbial community assembly, which is strongly influenced by inoculation and temporal progression during mycorrhizal development. The findings further emphasize the role of Tuber inoculation in shaping microbial community structure over time, with pronounced effects on bacterial diversity and community composition as the mycorrhizal symbiosis matures.

3.3. Microbial Composition and Taxonomic Analyses

Phyla with relative abundance exceeding 10% were defined as dominant. In the NM, T1, and T3 samples, the dominant bacterial phyla were consistent: Proteobacteria, Chloroflexi, and Acidobacteriota (Figure 3a). However, the T8 samples also included Bacteroidota and Firmicutes. This taxonomic profile aligns with previous findings in C. rockii following T. indicum inoculation, where Proteobacteria, Chloroflexi, and Acidobacteria were identified as dominant [14]. The prevalence of these phyla may be due to their role as core components of truffle ascocarp-associated bacterial communities [37]. Proteobacteria, known for their metabolic versatility, are commonly abundant in soil and rhizosphere habitats [38], highlighting the stable core microbial composition associated with the host plant across different stages of Tuber inoculation.
At the bacterial genus level (Figure 3b), six genera exhibited mean relative abundances exceeding 1%: Pseudomonas (5.18%), Subgroup_10 (1.62%), Sphingomonas (1.61%), Devosia (1.16%), Ensifer (1.09%), and Massilia (1.08%). Pseudomonas is particularly notable due to its high abundance and ecological significance in truffle-associated microbiomes. As a key plant growth-promoting bacterium, Pseudomonas enhances mycorrhizal development by promoting spore germination and hyphal growth through bioactive metabolites and signaling molecules, supporting mycorrhizal symbiosis [39]. Subgroup_10 and Sphingomonas were positively correlated with rare earth elements, suggesting potential roles in elemental cycling under specific edaphic conditions [40]. These results indicate a dynamic restructuring of the bacterial community across developmental stages, suggesting niche partitioning over time [26,30].
At the fungal phylum level (Figure 3c), Ascomycota was predominant, with relative abundances exceeding 70% across all periods. The NM and T3 samples had no other dominant phyla, whereas the T1 and T8 samples additionally featured Basidiomycota (15.1%, 11.2%). Ascomycota is notably abundant in nearly all truffle-associated environments [26]. Wang, Xu, Guo, Wu, Chen, Liu, Tian, and Qiao [41] also found that Ascomycota and Basidiomycota dominate natural truffle habitats. Their high abundance may be linked to diverse ecological roles, including saprotrophy, pathogenicity, and symbiosis. The dominance of Ascomycota in truffle-associated soils suggests a stable fungal niche irrespective of the mycorrhizal development stage [26,42].
The fungal community composition exhibited significant (p < 0.05) shifts across developmental stages (Figure 3d). Sphaerosporella was the most abundant genus, although its relative abundance decreased from 26.48% in the NM samples to 15.11% in the T8 samples. As a common pioneer species in nurseries, Sphaerosporella often dominates early stages due to its rapid colonization [43]. Additionally, Pseudeurotium increased from 11.30% in the NM samples to 15.47% in the T3 samples but dropped sharply to 0.18% in the T8 samples, suggesting a stage-specific ecological role. Notably, Staphylotrichum remained low until the T8 stage, where it surged to 11.16%, indicating a role as a secondary colonizer, potentially exploiting organic-rich or aging substrates [44].
Tuber showed a steady increase from 0.02% in the NM samples to 8.81% in the T8 samples, indicating progressive enrichment during later developmental stages. Previous studies have shown that Tuber abundance can reach 43–97% in plant root tips and up to 40% in cultivated soils [31,34,38]. Compared with natural conditions, the abundance of Tuber in truffle shiro areas is generally 1–8%; however, in Yunnan’s truffle-producing regions, it can reach 40% [26,41]. Additionally, opportunistic genera such as Aspergillus, Fusarium, and Cladosporium maintained moderate abundances (1.16–3.99%), reflecting their cosmopolitan distribution in soil ecosystems. These compositional changes underscore the dynamic nature of fungal communities during ecosystem development, potentially driven by host plant interactions, nutrient availability, and microbial competition [35,45].

3.4. Differential Abundance Analysis Using LEfSe

The bacterial LEfSe analysis revealed 23 microbial taxa across various taxonomic levels with an LDA score threshold of 4 (Figure 4a), indicating significant enrichment in specific stages. In the T1 samples, 16 taxa were significantly enriched, the highest number among all samples, primarily represented by the genera Massilia, Sphingomonas, and Ensifer. The plant growth-promoting genera Massilia and Sphingomonas enhance rhizosphere functionality by synthesizing IAA and other metabolites, supporting plant growth, stress resilience, and potentially developmental processes [46]. Ensifer is increasingly recognized not only as a legume symbiont but also as a versatile rhizobacterium capable of promoting growth and stress tolerance in non-leguminous plants [47]. Advances in microbial compartments further enhance their survival and functionality in acidic soils—conditions common in truffle orchards—suggesting a potential supportive role in ectomycorrhizal symbiosis establishment [37].
In the T3 samples, five taxa were significantly enriched, including the family A4b, the phylum Patescibacteria, and the genus Pseudomonas. Pseudomonas species are recognized for suppressing pathogens, promoting plant growth, and inducing systemic resistance [48]. This suggests active interactions between the host plant and microbial community, potentially reflecting intensified symbiotic signaling and microbial mediation of plant fitness. In the T8 samples, two characteristic taxa were identified: the phylum Firmicutes and the class Clostridia. Clostridia include diverse fermentative bacteria involved in organic matter decomposition and carbon cycling [49]. The presence implies enhanced microbial-driven carbon metabolism in the rhizosphere following mycorrhizal maturation, supporting the stability and functionality of the established symbiosis by contributing to energy flow and nutrient recycling.
The fungal LEfSe analysis identified 17 characteristic microbial taxa at different taxonomic levels (Figure 4b). In the NM samples, Rozellomycota emerged as the sole characteristic taxon. This phylum, ubiquitous in soil environments, is typically associated with saprophytic or parasitic lifestyles, potentially occupying a dominant ecological niche in the non-mycorrhizal state [42]. In the T3 samples, nine characteristic microbial taxa were identified, including Metarhizium, Pseudeurotium, Candida, and Trichoderma. Metarhizium, known as an entomopathogenic fungus, can form endophytic associations with plants and enhance plant nitrogen uptake [50]. Trichoderma, as a classical biocontrol agent, exhibits antagonistic activity against plant pathogenic fungi and promotes plant growth. During early mycorrhizal establishment, it may protect the host by resisting microbial invasion [51].
In the T8 samples, seven characteristic microbial taxa were identified, notably including Tuber and Staphylotrichum. Tuber, the inoculated species in this experiment, showed significant enrichment, indicating successful mycorrhizal colonization and establishment as a key component of the fungal community. Staphylotrichum, a saprotrophic member of the order Hypocreales, may contribute to chitin degradation and organic matter turnover in the rhizosphere, potentially influencing nutrient availability and microbial community dynamics [44]. These temporal shifts in microbial community composition highlight the dynamic nature of the rhizosphere microbiome during the establishment and maturation of the truffle-host symbiosis.

3.5. Co-Occurrence Patterns of Microbial Community

To further investigate rhizosphere microbial interactions, co-occurrence networks at the genus level were constructed and analyzed across different developmental stages (Figure 5a). The topological properties of the network provide a precise description of the interaction patterns within the microbial community (Table A4). The network analysis revealed 188 nodes and 1045 edges, with an average degree of 11.11 and an average path length of 3.47, reflecting the complexity and interconnectedness of the microbial community. Notably, positive correlations accounted for 79.23% of all interactions, while negative correlations constituted 20.77%. The predominance of positive associations suggests that cooperative interactions, rather than competitive exclusion, played a dominant role in shaping the microbial community under the experimental conditions. These cooperative networks likely play a crucial role in maintaining the stability and functional integrity of the mycorrhizal seedling system, ultimately supporting host plant growth and health [52].
Moreover, topological analysis based on Zi and Pi values identified six key connectors in the bacterial-fungal cross-domain network: unclassified_LWQ8, YC_ZSS_LKJ147, Bryobacter, Lysobacter, Acremonium, and Xeromyces (Figure A3). These connectors primarily function to link different modules, facilitating inter-module information exchange. Lysobacter, an ECM-associated bacterium, has been detected in microbial communities associated with both T. aestivum and T. indicum [41]. These connectors are critical for maintaining overall network connectivity and functional integration, serving as key “bridges” within the microbial network [53]. Interestingly, most connectors belong to rare taxa but exhibit strong intermediary effects, emphasizing the importance of evaluating microbial ecological functions not only by abundance but also by their topological position and regulatory roles within the network.
Three fungal genera exhibited significant correlations with Tuber: two positive correlations (Staphylotrichum, 2.88%; Spizellomyces, 0.81%) and one negative correlation (Clonostachys, 0.22%) (Figure 5b,c). Staphylotrichum, a dominant taxon in the T8 samples, likely contributes to organic matter decomposition and nutrient cycling in mature mycorrhizal environments [44]. Spizellomyces, a ubiquitous soil-dwelling fungal genus, plays essential roles in terrestrial ecosystems and is often associated with mycorrhizal fungi, plants, and soil microorganisms, exhibiting both beneficial and detrimental effects [54]. While both Staphylotrichum and Spizellomyces are known for their roles in rhizospheric nutrient cycling, this study is the first to report their active and positive contributions during the formation of truffle mycorrhiza. Conversely, the negative correlation observed with Clonostachys, a saprophytic and parasitic fungus, suggests potential niche overlap and resource competition with the inoculated Tuber. This antagonistic relationship may be attributed to Tuber’s ability to modify the rhizosphere microenvironment or compete for resources, thereby inhibiting Clonostachys growth [55].
Interestingly, no bacterial genera showed significant correlations with Tuber in the current network. This may indicate that interactions between ectomycorrhizal fungi and bacteria influencing symbiotic efficiency occur primarily at specific developmental stages rather than throughout the entire symbiotic period. For instance, Pseudomonas, a known MHB, significantly increased in the T3 samples but decreased in the T8 samples. Future studies employing metagenomics or isolation and cultivation approaches could provide deeper insights into the cooperative mechanisms between Tuber and associated microorganisms [56].

3.6. Microbiome Predictive Functions

In the bacterial functional prediction based on KEGG pathway analysis, Level 2 results revealed that carbohydrate metabolism, amino acid metabolism, metabolism of cofactors and vitamins, and metabolism of terpenoids and polyketides were the dominant categories (Figure 6a). These findings indicate that bacteria play a critical role in promoting nutrient cycling in the rhizosphere (e.g., pH, TOM, TN, TK, etc.), thereby indirectly influencing the formation of Tuber mycorrhizae by modulating the rhizospheric microenvironment. Further analysis at Level 3 indicated that pathways such as the biosynthesis of secondary metabolites, biosynthesis of antibiotics, microbial metabolism in diverse environments, biosynthesis of amino acids, and ABC transporters exhibited the highest mean abundance values (Figure A4a). These results imply that bacteria not only actively synthesize compounds beneficial to both themselves and their host plants but also adapt to diverse environmental conditions through metabolic activities, thereby playing a pivotal role in the preparation of Tuber mycorrhizal seedlings.
For fungal functional predictions (Figure 6b and Figure A4b), the results indicated that saprotrophs and ectomycorrhizal fungi were the dominant functional categories across different samples, accounting for 38.6% and 35.8% of total abundance, respectively. This underscores their central role in the Tuber symbiotic system. Notably, ectomycorrhizal fungi and saprotrophic fungi exhibit a certain degree of mutual promotion in nutrient utilization [57]. These microbial interactions may indirectly enhance the stability and functionality of the mycorrhizal network by regulating interspecies competition or providing additional ecological services [36].
In this study, PICRUSt2 and FUNGuild were employed to predict the functional profiles of bacterial and fungal communities, respectively. It is important to note, however, that both tools infer functional potential based on the relative abundance of the 16S rRNA gene and ITS sequences. As a result, their predictions may not fully align with the actual functional gene profiles that would be obtained through metagenomic sequencing [58]. Therefore, future studies should integrate metagenomic or metatranscriptomic approaches to achieve a more accurate characterization of the functional traits of microbial communities.

3.7. Correlation Analyses Between Microbial Communities and Environmental Factors

In Canonical Correspondence Analysis (CCA), soil physicochemical properties, particularly TN, AK, and TP, significantly (p < 0.05) influenced the microbial community structure. Within the bacterial community, TN and AK showed significantly (p < 0.05) associations with Bacteroides, whereas TP affected other microbial taxa (Figure 6c and Figure A5a). These variations in soil properties may indirectly impact the Tuber-associated microbial community (Figure 6d). Microbial taxa correlated with Tuber, such as Staphylotrichum and Spizellomyces, may play important roles in promoting Tuber growth. Staphylotrichum was significantly (p < 0.05) correlated with AP, EC, TN, and Mg, whereas Tuber and Spizellomyces were significantly (p < 0.05) associated with Ca and TK, respectively (Figure 6d and Figure A5b). Variation Partitioning Analysis (VPA) effectively quantified the contribution of each environmental factor to total species variation. For the bacterial community, pH, AK, and Mg were significant factors (Figure A6a), while Mg, AP, AK, TN, and Ca emerged as key factors for the fungal community (Figure A6b). Consistent with previous studies, key microbial taxa showed clear correlations with soil environmental variables [26]. The results indicate that such factors may promote the successful establishment and development of Tuber mycorrhizae.
Furthermore, Mantel tests revealed significant (p < 0.05) correlations between soil physicochemical properties and microbial communities associated with Tuber mycorrhizal seedlings (Figure 6e and Figure A7). Soil pH, TK, AK, and Mg contents significantly (p < 0.05) influenced the composition of bacterial and fungal genera, as well as bacterial functional profiles. Although both bacterial and fungal communities were influenced by soil physicochemical properties, their response patterns to specific factors differed significantly (Figure 6e and Figure A5). Among the top 20 bacterial genera, over one-third exhibited negative correlations with pH, TN, AK, and Mg, with only a few genera showing significant positive correlations. In contrast, fungal genera such as Tuber, Staphylotrichum, and Spizellomyces demonstrated significant (p < 0.05) positive correlations with TN, TK, AP, and Ca, whereas Pseudeurotium and Coniochaeta were negatively correlated with EC and Mg. However, no significant associations were detected between soil physicochemical properties and fungal functional profiles. This may be attributed to the lifestyle of fungi, particularly ectomycorrhizal fungi, which primarily rely on carbon supplied by the host plant rather than directly absorbing nutrients from the soil [32]. Additionally, fungal communities have been reported to be significantly influenced by AP and exchangeable Mg, both of which exhibit strong positive correlations with fungal communities in plant systems [34].

3.8. Implications for Practical and Ecological Applications

The findings of this study have significant implications for both practical applications and ecological sustainability in truffle cultivation systems. During mycorrhizal development, key microbial taxa like Staphylotrichum and Sphaerosporella showed a clear trend of enrichment, indicating their potential role in enhancing the efficiency of mycorrhizal seedling production. By understanding the dynamic interactions between truffle-associated microorganisms and soil physicochemical properties, it is possible to develop targeted strategies for optimizing rhizosphere conditions, such as adjusting soil pH, nutrient availability (e.g., TN, TK, AP, and Ca), and microbial inoculants. These strategies can significantly improve the efficiency of ectomycorrhizal seedling preparation, reduce the time required for successful colonization, and enhance truffle yields in plantation systems.
From an ecological perspective, the predominance of cooperative microbial interactions within the rhizosphere network underscores the potential of truffle plantations to promote soil health and biodiversity. The ability of ectomycorrhizal fungi to mobilize recalcitrant nutrients, improve soil structure, and foster positive microbial relationships can contribute to long-term ecosystem sustainability. Additionally, the successful establishment of truffle plantations using Chinese chestnut also offers a viable approach to rehabilitating degraded lands and reducing pressure on wild truffle populations. By integrating these findings into sustainable agricultural practices, truffle cultivation has the potential to balance ecological conservation with economic profitability, providing a model for sustainable agroforestry systems in China and beyond.

4. Conclusions

In summary, during the development of T. sinense mycorrhizae on C. mollissima seedlings, significant (p < 0.05) alterations were observed in rhizosphere microbial communities. At the 8-month post-inoculation stage, key fungal genera such as Tuber, Staphylotrichum, and Sphaerosporella were notably enriched, indicating their roles in mycorrhizal maturation and nutrient cycling. Positive bacterial-fungal interactions contributed to the stability and resilience of the mycorrhizal system. Key soil factors, including pH, AK, and Mg, shaped microbial community assembly. Additionally, Tuber showed strong positive correlations with essential nutrients like TN, TK, AP, and Ca. These insights provide a basis for targeted soil and microbiome management strategies to enhance truffle seedling efficiency and promote sustainable agroforestry systems.

Author Contributions

Conceptualization: Y.-Y.W. and G.-Q.Z.; Methodology: Y.Q., Q.-Q.C. and G.-Q.Z.; Data curation: Y.-Y.W., W.-W.Z. and Y.-C.L.; Investigation: Y.-Y.W., W.-W.Z. and Y.-C.L.; Writing—original draft: Y.-Y.W.; Supervision: Y.Q. and G.-Q.Z.; Project administration: Q.-Q.C. and G.-Q.Z.; Writing—review and editing: G.-Q.Z. All authors have read and agreed to the published version of the manuscript.

Funding

This study was financially supported by the National Key R&D Program of China (2024YFD2200600) and the Beijing Innovation Consortium of Agriculture Research System (BAIC03).

Data Availability Statement

The original contributions presented in the study are included in the article, further inquiries can be directed to the corresponding author.

Conflicts of Interest

The authors declare no conflicts of interest.

Appendix A

Table A1. Soil physicochemical properties across different treatment groups.
TreatmentNMT1T3T8
pH7.22 ± 0.05 a7.03 ± 0.02 b7.07 ± 0.02 b7.08 ± 0.03 b
EC (μS/cm)157.00 ± 34.48 ab141.50 ± 17.37 b156.75 ± 35.00 ab242.75 ± 71.22 a
TOM (g/kg)50.01 ± 8.38 a47.63 ± 3.06 a44.07 ± 4.42 a51.18 ± 1.58 a
TN (mg/kg)476.20 ± 33.81 b462.40 ± 58.29 b567.65 ± 88.09 b952.41 ± 111.85 a
TP (g/kg)1.00 ± 0.10 a0.77 ± 0.14 b0.90 ± 0.10 ab0.92 ± 0.07 ab
TK (g/kg)67.10 ± 9.48 b77.88 ± 5.55 b91.96 ± 3.23 a103.51 ± 5.70 a
AP (mg/kg)101.39 ± 10.95 b110.96 ± 18.42 b169.88 ± 22.91 b596.46 ± 71.83 a
AK (mg/kg)190.12 ± 8.51 b154.53 ± 44.37 bc97.97 ± 35.14 c338.63 ± 13.36 a
Ca (mg/kg)10.71 ± 0.72 b10.72 ± 0.44 b12.77 ± 2.12 ab14.44 ± 0.16 a
Mg (mg/kg)1.00 ± 0.09 b0.88 ± 0.05 b0.90 ± 0.10 b1.80 ± 0.14 a
Note: NM: Non-inoculated control seedlings; T1, T3, and T8: Seedlings at 1, 3, and 8 months post-inoculation, respectively. Within each microbial group (bacterial or fungal), different lowercase letters in the same column denote significant differences among treatments (p < 0.05).
Table A2. Taxonomic annotation statistics of high-throughput sequencing data across different taxonomic levels.
TreatmentPhylumClassOrderFamilyGenusOTU
BacteriaNM4111229857411068205
T14110327553710067496
T340912414317705601
T845111304635134710,206
Total47124352754169327,383
FungiNM12411022174572331
T116491112545262958
T31344982204452143
T817491082325013034
Total18591403298059045
Note: NM: Non-inoculated control seedlings; T1, T3, and T8: Seedlings at 1, 3, and 8 months post-inoculation, respectively.
Table A3. Alpha diversity and richness indices of bacterial and fungal communities across different treatments.
TreatmentACEChao1PielouRichnessShannonSimpson
BacteriaNM2625.06 ± 316.92 ab2608.54 ± 313.69 ab0.88 ± 0.02 a2600.25 ± 314.02 ab9.93 ± 0.23 a0.9970 ± 0.0014 a
T12408.67 ± 307.69 ab2389.53 ± 305.52 ab0.86 ± 0.01 ab2381.25 ± 304.79 ab9.60 ± 0.24 ab0.9962 ± 0.0009 a
T31987.69 ± 115.24 b1968.91 ± 116.34 b0.84 ± 0.01 b1958.50 ± 114.15 b9.21 ± 0.09 b0.9950 ± 0.0004 a
T82953.93 ± 544.85 a2943.35 ± 546.67 a0.88 ± 0.01 a2935.25 ± 549.09 a10.07 ± 0.36 a0.9968 ± 0.0010 a
FungiNM750.82 ± 252.82 a743.47 ± 236.54 a0.61 ± 0.04 a702.25 ± 200.96 a5.76 ± 0.53 a0.9315 ± 0.0221 a
T1869.95 ± 352.21 a869.80 ± 349.89 a0.68 ± 0.08 a852.50 ± 348.55 a6.58 ± 1.15 a0.9463 ± 0.0339 a
T3672.33 ± 192.35 a672.07 ± 195.98 a0.65 ± 0.09 a636.75 ± 195.73 a6.04 ± 1.10 a0.9316 ± 0.0431 a
T8988.70 ± 368.53 a983.61 ± 364.96 a0.67 ± 0.09 a942.50 ± 347.48 a6.62 ± 1.20 a0.9477 ± 0.0410 a
Note: NM: Non-inoculated control seedlings; T1, T3, and T8: Seedlings at 1, 3, and 8 months post-inoculation, respectively. Within each bacterial or fungal group, different lowercase letters in the same column indicate significant differences among treatments (p < 0.05).
Table A4. Key topological properties of the bacterial-fungal co-occurrence network.
Network Indices
Number of nodes188
Number of edges1045
Average degree11.12
Average path length3.47
Average clustering coefficient0.499
Network diameter10
Modularity0.959
Positive links (%)79.23
Negative links (%)20.77

Appendix B

Figure A1. Rarefaction curves of microbial richness across different samples. (a) Bacterial rarefaction curves; (b) Fungal rarefaction curves. The vertical dotted line indicates the rarefaction depth to which all samples were subsampled for downstream analyses.
Horticulturae 12 00266 g0a1
Figure A2. Alpha diversity indices of bacterial (a) and fungal (b) communities across sampling stages. Different lowercase letters above bars indicate statistically significant differences at p < 0.05. NM: Non-inoculated control seedlings; T1, T3, and T8: Seedlings at 1, 3, and 8 months post-inoculation, respectively.
Horticulturae 12 00266 g0a2
Figure A3. Zi-Pi plot. The threshold values of Zi and Pi for categorizing the genus were 2.5 and 0.62, respectively.
Horticulturae 12 00266 g0a3
Figure A4. Predicted functional profiles of bacterial (a) and fungal (b) communities. Kruskal–Wallis test followed by Nemenyi post hoc test was used to detect significant differences among groups. Different lowercase letters above the bars indicate statistically significant differences at p < 0.05. NM: Non-inoculated control seedlings; T1, T3, and T8: Seedlings at 1, 3, and 8 months post-inoculation, respectively.
Horticulturae 12 00266 g0a4
Figure A5. Spearman correlation heatmap between soil physicochemical properties and bacterial (a) and fungal (b) community compositions. Color intensity indicates the correlation strength, with significance levels: * p < 0.05; ** p < 0.01. EC, electrical conductivity; TOM, total organic matter; TN, total nitrogen; TP, total phosphorus; TK, total potassium; AP, available phosphorus; AK, available potassium; Ca, calcium; Mg, magnesium. ANP_Rhizobium, Allorhizobium_Neorhizobium_Pararhizobium_Rhizobium; SCN_69_37, Acidobacteria_bacterium_SCN_69_37.
Horticulturae 12 00266 g0a5
Figure A6. Variation partitioning analysis (VPA) showing the contribution of individual environmental factors to the total variation in bacterial (a) and fungal (b) community composition. EC, electrical conductivity; TOM, total organic matter; TN, total nitrogen; TP, total phosphorus; TK, total potassium; AP, available phosphorus; AK, available potassium; Ca, calcium; Mg, magnesium.
Horticulturae 12 00266 g0a6
Figure A7. Pearson’s correlation and the Gaussian distribution of soil properties. The diagonals represent the distribution of each variable, * p < 0.05; ** p < 0.01; *** p < 0.001. EC, electrical conductivity; TOM, total organic matter; TN, total nitrogen; TP, total phosphorus; TK, total potassium; AP, available phosphorus; AK, available potassium; Ca, calcium; Mg, magnesium.
Horticulturae 12 00266 g0a7

References

  1. Fan, L.; Zhang, J.-L.; Li, T.; Sun, H.-J.; Xiong, W.-P.; Li, Y. Chinese black truffles: Tuber yigongense sp. nov., taxonomic reassessment of T. indicum s.l., and re-examination of the T. sinense isotype. Mycotaxon 2018, 133, 183–196. [Google Scholar] [CrossRef]
  2. Bi, Y.; Liu, B.; Chen, G.; Bu, T.; Zhang, P.; Zhou, Q.; Mu, L.; Fu, Y.; Shi, Y.; Yang, X.; et al. Large-scale interviews and plot-based data reveal declining yields of the prized matsutake mushrooms in the major producing areas of China. J. Environ. Manag. 2025, 382, 125305. [Google Scholar] [CrossRef]
  3. Murat, C. Forty years of inoculating seedlings with truffle fungi: Past and future perspectives. Mycorrhiza 2015, 25, 77–81. [Google Scholar] [CrossRef]
  4. Coleman, M.D.; Berch, S.; Bonito, G.; Allen, B.; Andrews, E.; Arechiga Carvajal, E.T.; Cook, S.P.; D’Amours, C.; Garibay-Orijel, R.; Guevara, G.; et al. Status of truffle science and cultivation in North America. Plant Soil 2025, 508, 625–661. [Google Scholar] [CrossRef]
  5. Galappaththi, M.C.A.; McComb, J.; Sapsford, S.J.; Hardy, G.E.S.J.; Burgess, T.I. The Australian truffle industry: History, challenges and opportunities. J. Agric. Food Res. 2025, 21, 101802. [Google Scholar] [CrossRef]
  6. Li, X.; Ye, L.; Zhang, X.; Tan, H.; Li, Q. Root-tip cutting and uniconazole treatment improve the colonization rate of Tuber indicum on Pinus armandii seedlings in the greenhouse. Microb. Biotechnol. 2020, 13, 535–547. [Google Scholar] [CrossRef]
  7. Wang, Y.; Zhang, W.; Cao, Q.; Yang, R.; Qin, Y.; Zhang, G. Description, identification, and growth of ectomycorrhizae in Tuber sinense-mycorrhized Castanea mollissima seedlings. Agriculture 2025, 15, 868. [Google Scholar] [CrossRef]
  8. Nilsson, R.H.; Anslan, S.; Bahram, M.; Wurzbacher, C.; Baldrian, P.; Tedersoo, L. Mycobiome diversity: High-throughput sequencing and identification of fungi. Nat. Rev. Microbiol. 2019, 17, 95–109. [Google Scholar] [CrossRef]
  9. Ori, F.; Leonardi, M.; Puliga, F.; Lancellotti, E.; Pacioni, G.; Iotti, M.; Zambonelli, A. Ectomycorrhizal fungal community and ascoma production in a declining Tuber borchii plantation. J. Fungi 2023, 9, 678. [Google Scholar] [CrossRef] [PubMed]
  10. Yang, M.; Zou, J.; Liu, C.; Xiao, Y.; Zhang, X.; Yan, L.; Ye, L.; Tang, P.; Li, X. Chinese white truffles shape the ectomycorrhizal microbial communities of Corylus avellana. Ann. Microbiol. 2019, 69, 553–565. [Google Scholar] [CrossRef]
  11. Zhang, X.; Li, X.; Ye, L.; Huang, Y.; Kang, Z.; Zhang, B.; Zhang, X. Colonization by Tuber melanosporum and Tuber indicum affects the growth of Pinus armandii and phoD alkaline phosphatase encoding bacterial community in the rhizosphere. Microbiol. Res. 2020, 239, 126520. [Google Scholar] [CrossRef] [PubMed]
  12. Huang, L.L.; Guerin-Laguette, A.; Wang, R.; Li, Y.M.; Yu, F.Q. Mycorrhizal synthesis of Tuber pseudohimalayense with seven broad-leaved trees and Pinus armandii. Mycoscience 2021, 62, 322–330. [Google Scholar] [CrossRef]
  13. Martin, F.M.; van der Heijden, M.G.A. The mycorrhizal symbiosis: Research frontiers in genomics, ecology, and agricultural application. New Phytol. 2024, 242, 1486–1506. [Google Scholar] [CrossRef]
  14. Huang, L.; Li, Y.; Yuan, J.; Wan, S.; Colinas, C.; He, X.; Shi, X.; Wang, Y.; Yu, F. Tuber indicum and T. lijiangense colonization differentially regulates plant physiological responses and mycorrhizosphere bacterial community of Castanopsis rockii seedlings. Front. Plant Sci. 2023, 14, 1134446. [Google Scholar] [CrossRef] [PubMed]
  15. Kinoshita, A.; Obase, K.; Yamanaka, T. Ectomycorrhizae formed by three Japanese truffle species (Tuber japonicum, T. longispinosum, and T. himalayense) on indigenous oak and pine species. Mycorrhiza 2018, 28, 679–690. [Google Scholar] [CrossRef]
  16. Xu, S.Y.; Wei, J.K.; Xue, F.Y.; Li, W.C.; Guan, T.K.; Hu, B.Y.; Chen, Q.J.; Han, Y.Y.; Liu, C.J.; Zhang, G.Q. Microbial inoculation influences microbial communities and physicochemical properties during lettuce seedling using composted spent mushroom substrate. Appl. Soil Ecol. 2022, 174, 104418. [Google Scholar] [CrossRef]
  17. Guo, Y.X.; Chen, Q.J.; Qin, Y.; Yang, Y.R.; Yang, Q.Z.; Wang, Y.X.; Cheng, Z.A.; Cao, N.; Zhang, G.Q. Succession of the microbial communities and function prediction during short-term peach sawdust-based composting. Bioresour. Technol. 2021, 332, 125079. [Google Scholar] [CrossRef] [PubMed]
  18. Bolyen, E.; Rideout, J.R.; Dillon, M.R.; Bokulich, N.A.; Abnet, C.C.; Al-Ghalith, G.A.; Alexander, H.; Alm, E.J.; Arumugam, M.; Asnicar, F.; et al. Reproducible, interactive, scalable and extensible microbiome data science using QIIME 2. Nat. Biotechnol. 2019, 37, 1091. [Google Scholar] [CrossRef]
  19. Quast, C.; Pruesse, E.; Yilmaz, P.; Gerken, J.; Schweer, T.; Yarza, P.; Peplies, J.; Glockner, F.O. The SILVA ribosomal RNA gene database project: Improved data processing and web-based tools. Nucleic Acids Res. 2013, 41, D590–D596. [Google Scholar] [CrossRef]
  20. Nilsson, R.H.; Larsson, K.H.; Taylor, A.F.S.; Bengtsson-Palme, J.; Jeppesen, T.S.; Schigel, D.; Kennedy, P.; Picard, K.; Glockner, F.O.; Tedersoo, L.; et al. The UNITE database for molecular identification of fungi: Handling dark taxa and parallel taxonomic classifications. Nucleic Acids Res. 2019, 47, D259–D264. [Google Scholar] [CrossRef]
  21. Langille, M.G.; Zaneveld, J.; Caporaso, J.G.; McDonald, D.; Knights, D.; Reyes, J.A.; Clemente, J.C.; Burkepile, D.E.; Vega Thurber, R.L.; Knight, R.; et al. Predictive functional profiling of microbial communities using 16S rRNA marker gene sequences. Nat. Biotechnol. 2013, 31, 814–821. [Google Scholar] [CrossRef]
  22. Nguyen, N.H.; Song, Z.; Bates, S.T.; Branco, S.; Tedersoo, L.; Menke, J.; Schilling, J.S.; Kennedy, P.G. FUNGuild: An open annotation tool for parsing fungal community datasets by ecological guild. Fungal Ecol. 2016, 20, 241–248. [Google Scholar] [CrossRef]
  23. Antunes, L.F.d.S.; Favero, V.O.; Santos, G.d.C.R.d.; Correia, M.E.F.; Coelho, M.R.R.; Guerra, J.G.M.; Xavier, G.R.; Rumjanek, N.G. Structure and succession of the microbiome during the millicomposting of agricultural and urban wastes. Microbe 2025, 9, 100599. [Google Scholar] [CrossRef]
  24. Wang, S.P.; Wang, L.; Sun, Z.Y.; Wang, S.T.; Yuan, H.W.; An, M.Z.; Tang, Y.Q.; Shen, C.H.; Kida, K. Effect of distillery sewage sludge addition on performance and bacterial community dynamics during distilled grain waste composting. Bioresour. Technol. 2022, 345, 126486. [Google Scholar] [CrossRef]
  25. Pan, Y.; Kang, P.; Qu, X.; Zhang, H.; Li, X. Response of the soil bacterial community to seasonal variations and land reclamation in a desert grassland. Ecol. Indic. 2024, 165, 112227. [Google Scholar] [CrossRef]
  26. Ye, L.; Yang, X.; Zhang, B.; Zhou, J.; Tian, H.; Zhang, X.; Li, X. Seasonal succession of fungal communities in native truffle (Tuber indicum) ecosystems. Appl. Environ. Microbiol. 2023, 89, e0019523. [Google Scholar] [CrossRef]
  27. Sequino, G.; Cobo-Diaz, J.F.; Valentino, V.; Tassou, C.; Volpe, S.; Torrieri, E.; Nychas, G.-J.; Ordóñez, A.Á.; Ercolini, D.; De Filippis, F. Environmental microbiome mapping in poultry processing chain and assessment of microbial dynamics in response to different storage conditions. Food Microbiol. 2025, 128, 104734. [Google Scholar] [CrossRef]
  28. Liu, C.; Cui, Y.; Li, X.; Yao, M. microeco: An R package for data mining in microbial community ecology. FEMS Microbiol. Ecol. 2021, 97, fiaa255. [Google Scholar] [CrossRef]
  29. Guan, T.K.; Wang, Q.Y.; Li, J.S.; Yan, H.W.; Chen, Q.J.; Sun, J.; Liu, C.J.; Han, Y.Y.; Zou, Y.J.; Zhang, G.Q. Biochar immobilized plant growth-promoting rhizobacteria enhanced the physicochemical properties, agronomic characters and microbial communities during lettuce seedling. Front. Microbiol. 2023, 14, 1218205. [Google Scholar] [CrossRef]
  30. Huang, Y.; Zou, J.; Kang, Z.; Zhang, X.; Penttinen, P.; Zhang, X.; Li, X. Effects of truffle inoculation on a nursery culture substrate environment and seedling of Carya illinoinensis. Fungal Biol. 2021, 125, 576–584. [Google Scholar] [CrossRef]
  31. Li, Q.; Yan, L.; Ye, L.; Zhou, J.; Zhang, B.; Peng, W.; Zhang, X.; Li, X. Chinese Black Truffle (Tuber indicum) alters the ectomycorrhizosphere and endoectomycosphere microbiome and metabolic profiles of the host tree Quercus aliena. Front. Microbiol. 2018, 9, 2202. [Google Scholar] [CrossRef]
  32. Shi, J.; Wang, X.; Wang, E. Mycorrhizal symbiosis in plant growth and stress adaptation: From Genes to Ecosystems. Annu. Rev. Plant Biol. 2023, 74, 569–607. [Google Scholar] [CrossRef]
  33. Chen, S.; Xing, Y.; Wang, T.; Zhang, Q.; Yu, W.; Fang, K.; Newhouse, A.E.; McGuigan, L.D.; Stewart, K.R.; Maynard, C.A.; et al. Ectomycorrhizae symbiosis in Castanea mollissima improves phosphate acquisition through activating gene expression and H+ efflux. Sci. Hortic. 2016, 210, 99–107. [Google Scholar] [CrossRef]
  34. Li, X.; Zhang, X.; Yang, M.; Yan, L.; Kang, Z.; Xiao, Y.; Tang, P.; Ye, L.; Zhang, B.; Zou, J.; et al. Tuber borchii shapes the ectomycorrhizosphere microbial communities of Corylus avellana. Mycobiology 2019, 47, 180–190. [Google Scholar] [CrossRef]
  35. Li, Q.; Zhao, J.; Xiong, C.; Li, X.; Chen, Z.; Li, P.; Huang, W. Tuber indicum shapes the microbial communities of ectomycorhizosphere soil and ectomycorrhizae of an indigenous tree (Pinus armandii). PLoS ONE 2017, 12, e0175720. [Google Scholar] [CrossRef]
  36. Oliach, D.; Castaño, C.; Fischer, C.R.; Barry-Etienne, D.; Bonet, J.A.; Colinas, C.; Oliva, J. Soil fungal community and mating type development of Tuber melanosporum in a 20-year chronosequence of black truffle plantations. Soil Biol. Biochem. 2022, 165, 108510. [Google Scholar] [CrossRef]
  37. Chen, J.; Li, J.M.; Tang, Y.J.; Xing, Y.M.; Qiao, P.; Li, Y.; Liu, P.G.; Guo, S.X. Chinese black truffle-associated bacterial communities of Tuber indicum from different geographical regions with nitrogen fixing bioactivity. Front. Microbiol. 2019, 10, 2515. [Google Scholar] [CrossRef]
  38. Zhang, X.; Ye, L.; Kang, Z.; Zou, J.; Zhang, X.; Li, X. Mycorrhization of Quercus acutissima with Chinese black truffle significantly altered the host physiology and root-associated microbiomes. PeerJ 2019, 7, e6421. [Google Scholar] [CrossRef]
  39. Sbrana, C.; Agnolucci, M.; Bedini, S.; Lepera, A.; Toffanin, A.; Giovannetti, M.; Nuti, M.P. Diversity of culturable bacterial populations associated to Tuber borchii ectomycorrhizas and their activity on T. borchii mycelial growth. FEMS Microbiol. Lett. 2002, 211, 195–201. [Google Scholar] [CrossRef][Green Version]
  40. Guan, H.; Mu, Y.; Song, R.; Lan, Y.; Du, X.; Li, J.; Chi, W.; Sang, W. Soil microbial communities in desert grassland around rare earth mine: Diversity, variation, and response patterns. Sustainability 2022, 14, 15629. [Google Scholar] [CrossRef]
  41. Wang, D.; Xu, Q.; Guo, W.; Wu, F.; Chen, J.; Liu, P.; Tian, W.; Qiao, P. Microbial communities of ascocarps and soils in a natural habitat of Tuber indicum. Arch. Microbiol. 2022, 204, 189. [Google Scholar] [CrossRef]
  42. Liu, D.; Perez-Moreno, J.; He, X.; Garibay-Orijel, R.; Yu, F. Truffle microbiome is driven by fruit body compartmentalization rather than soils conditioned by different host trees. mSphere 2021, 6, e0003921. [Google Scholar] [CrossRef]
  43. Marozzi, G.; Sanchez, S.; Benucci, G.M.; Bonito, G.; Falini, L.B.; Albertini, E.; Donnini, D. Mycorrhization of pecan (Carya illinoinensis) with black truffles: Tuber melanosporum and Tuber brumale. Mycorrhiza 2017, 27, 303–309. [Google Scholar] [CrossRef]
  44. Ali, A.; Ellinger, B.; Brandt, S.C.; Betzel, C.; Ruhl, M.; Wrenger, C.; Schluter, H.; Schafer, W.; Brognaro, H.; Gand, M. Genome and secretome analysis of Staphylotrichum longicolleum DSM105789 cultured on agro-residual and chitinous biomass. Microorganisms 2021, 9, 1581. [Google Scholar] [CrossRef]
  45. Bai, B.; Liu, W.; Qiu, X.; Zhang, J.; Zhang, J.; Bai, Y. The root microbiome: Community assembly and its contributions to plant fitness. J. Integr. Plant Biol. 2022, 64, 230–243. [Google Scholar] [CrossRef]
  46. Asaf, S.; Numan, M.; Khan, A.L.; Al-Harrasi, A. Sphingomonas: From diversity and genomics to functional role in environmental remediation and plant growth. Crit. Rev. Biotechnol. 2020, 40, 138–152. [Google Scholar] [CrossRef]
  47. Feng, Q.; Luo, Y.; Liang, M.; Cao, Y.; Wang, L.; Liu, C.; Zhang, X.; Ren, L.; Wang, Y.; Wang, D.; et al. Rhizobacteria protective hydrogel to promote plant growth and adaption to acidic soil. Nat. Commun. 2025, 16, 1684. [Google Scholar] [CrossRef]
  48. Li, Q.; Li, H.; Yang, Z.; Cheng, X.; Zhao, Y.; Qin, L.; Bisseling, T.; Cao, Q.; Willemsen, V. Plant growth-promoting rhizobacterium Pseudomonas sp. CM11 specifically induces lateral roots. New Phytol. 2022, 235, 1575–1588. [Google Scholar] [CrossRef]
  49. Shi, C.H.; Wang, X.Q.; Jiang, S.; Zhang, L.Q.; Luo, J. Revealing the role of the rhizosphere microbiota in reproductive growth for fruit productivity when inorganic fertilizer is partially replaced by organic fertilizer in pear orchard fields. Microb. Biotechnol. 2023, 16, 1373–1392. [Google Scholar] [CrossRef]
  50. Behie, S.W.; Moreira, C.C.; Sementchoukova, I.; Barelli, L.; Zelisko, P.M.; Bidochka, M.J. Carbon translocation from a plant to an insect-pathogenic endophytic fungus. Nat. Commun. 2017, 8, 14245. [Google Scholar] [CrossRef]
  51. Guzman-Guzman, P.; Etesami, H.; Santoyo, G. Trichoderma: A multifunctional agent in plant health and microbiome interactions. BMC Microbiol. 2025, 25, 434. [Google Scholar] [CrossRef]
  52. Yang, T.; Tedersoo, L.; Liu, X.; Gao, G.F.; Dong, K.; Adams, J.M.; Chu, H. Fungi stabilize multi-kingdom community in a high elevation timberline ecosystem. iMeta 2022, 1, e49. [Google Scholar] [CrossRef]
  53. Fang, K.; Kou, Y.P.; Tang, N.; Liu, J.; Zhang, X.Y.; He, H.L.; Xia, R.X.; Zhao, W.Q.; Li, D.D.; Liu, Q. Differential responses of soil bacteria, fungi and protists to root exudates and temperature. Microbiol. Res. 2024, 286, 127829. [Google Scholar] [CrossRef]
  54. Chen, S.; Yu, H.; Zhou, X.; Wu, F. Cucumber (Cucumis sativus L.) seedling rhizosphere Trichoderma and Fusarium spp. communities altered by vanillic acid. Front. Microbiol. 2018, 9, 2195. [Google Scholar] [CrossRef]
  55. Piombo, E.; Guaschino, M.; Jensen, D.F.; Karlsson, M.; Dubey, M. Insights into the ecological generalist lifestyle of Clonostachys fungi through analysis of their predicted secretomes. Front. Microbiol. 2023, 14, 1112673. [Google Scholar] [CrossRef]
  56. Du, Y.; Yang, Y.; Wu, S.; Gao, X.; He, X.; Dong, S. Core microbes regulate plant-soil resilience by maintaining network resilience during long-term restoration of alpine grasslands. Nat. Commun. 2025, 16, 3116. [Google Scholar] [CrossRef]
  57. Pena, R.; Awad, A.; Nawaz, A.; Shang, Y.; Wubet, T.; Tibbett, M. Unravelling the facilitation-competition continuum among ectomycorrhizal and saprotrophic fungi. Soil Biol. Biochem. 2025, 208, 109865. [Google Scholar] [CrossRef]
  58. Toole, D.R.; Zhao, J.; Martens-Habbena, W.; Strauss, S.L. Bacterial functional prediction tools detect but underestimate metabolic diversity compared to shotgun metagenomics in southwest Florida soils. Appl. Soil Ecol. 2021, 168, 104129. [Google Scholar] [CrossRef]
Figure 1. Soil physicochemical properties at different developmental stages. (a) pH; (b) electrical conductivity (EC); (c) total organic matter (TOM); (d) total nitrogen (TN); (e) total phosphorus (TP); (f) total potassium (TK); (g) available phosphorus (AP); (h) available potassium (AK); (i) calcium (Ca); (j) magnesium (Mg). NM: Non-inoculated control seedlings; T1, T3, and T8: Seedlings at 1, 3, and 8 months post-inoculation, respectively. Different lowercase letters above bars indicate statistically significant differences at p < 0.05.
Horticulturae 12 00266 g001
Figure 2. Principal Coordinate Analysis (PCoA) plots based on Bray–Curtis dissimilarity of bacterial (a) and fungal (b) communities across different developmental stages. Different lowercase letters above the boxplots indicate statistically significant differences at p < 0.05.
Horticulturae 12 00266 g002
Figure 3. Relative abundances of dominant bacterial (a,b) and fungal (c,d) taxa at the top 10 phyla and top 20 genera levels across different developmental stages. A-B-SCN_69_37: Acidobacteria_bacterium_SCN_69_37. A-N-P-Rhizobium: Allorhizobium_Neorhizobium_Pararhizobium_Rhizobium.
Horticulturae 12 00266 g003
Figure 4. LEfSe analysis identifying differentially abundant bacterial (a) and fungal (b) taxa between developmental stages. Circles from inner to outer rings represent taxonomic levels from kingdom to genus. The red dashed line indicates the LDA score threshold of 4.0.
Horticulturae 12 00266 g004
Figure 5. Co-occurrence network analysis at the genus level across different developmental stages. (a) Co-occurrence network of bacterial and fungal communities. Nodes represent individual genera, with size proportional to relative abundance and color indicating microbial phylum. Edge color indicates the nature of the correlation: green lines represent negative correlations, and pink lines represent positive correlations. Linear regression analyses showing positive correlations between Tuber and Staphylotrichum (b) and Spizellomyces (c). The red solid line represents the fitted linear regression, and the gray shaded area indicates the 95% confidence interval. Each dot represents an individual soil sample, with coordinates corresponding to the relative abundances of the two correlated genera.
Horticulturae 12 00266 g005
Figure 6. Microbial functional profiles and their relationships with environmental factors. Predicted functional profiles of bacterial (a) and fungal (b) communities across different developmental stages. Canonical correspondence analysis (CCA) ordination plots showing the relationships between soil bacterial (c) and fungal (d) communities and environmental variables. Black arrows represent environmental variables, while blue arrows represent microbial taxa. (e) Mantel tests showing correlations between microbial genera, predicted functions, and environmental factors. The embedded heatmap depicts pairwise Pearson correlations among environmental factors. Significance levels are indicated as: * 0.01 ≤ p < 0.05, ** 0.001 ≤ p < 0.01, and *** p < 0.001.
Horticulturae 12 00266 g006
Disclaimer/Publisher’s Note: The statements, opinions and data contained in all publications are solely those of the individual author(s) and contributor(s) and not of MDPI and/or the editor(s). MDPI and/or the editor(s) disclaim responsibility for any injury to people or property resulting from any ideas, methods, instructions or products referred to in the content.


