Article

Optimizing Light Environment for Pakchoi in Plant Factories: Interactive Effects of Photoperiod and Light Intensity on Growth, Photosynthesis, and Energy-Use Efficiency

1
Faculty of Urban Construction and Ecological Technology, Shanghai Institute of Technology, Shanghai 201418, China
2
Shanghai Key Laboratory of Protected Horticultural Technology, Horticulture Research Institute, Shanghai Academy of Agricultural Sciences, Shanghai 201403, China
3
School of Agriculture and Biology, Shanghai Jiao Tong University, Shanghai 200240, China
*
Authors to whom correspondence should be addressed.
These authors contributed equally to this work.
Horticulturae 2026, 12(2), 215; https://doi.org/10.3390/horticulturae12020215
Submission received: 24 December 2025 / Revised: 3 February 2026 / Accepted: 3 February 2026 / Published: 10 February 2026

Abstract

The light environment is a key factor in regulating crop growth and quality in plant factories, where both light intensity and photoperiod strongly influence photosynthetic productivity and energy consumption. This study aimed to elucidate the interactive effects of light intensity and photoperiod on the growth, photosynthetic performance, and energy-use efficiency of Pakchoi in a controlled environment, thereby optimizing lighting strategies. Here, three levels of light intensity (PPFD: 100, 175, and 250 μmol·m−2·s−1) and four photoperiods (8, 12, 16, and 20 h·d−1) were combined, resulting in twelve treatments. Plant growth parameters, chlorophyll content, gas exchange indices, CO2 response curves, and chlorophyll fluorescence characteristics were measured, along with analyses of light-use efficiency (LUE) and electrical energy-use efficiency (EUE). The highest biomass accumulation was observed under a 20 h·d−1–250 μmol·m−2·s−1 treatment. In contrast, the optimal LUE (9.69%) and EUE (4.98%) were observed under a 20 h·d−1–175 μmol·m−2·s−1 treatment. The best photosynthetic performance (Amax 32.61 μmol·m−2·s−1) occurred under a 16 h·d−1–250 μmol·m−2·s−1 treatment. This study integrates growth, photosynthetic physiology, and energy-use efficiency, revealing a trade-off between biomass production and energy utilization in Pakchoi cultivation. It clarifies that “moderate light intensity + long photoperiod” is the optimal strategy to balance yield and energy consumption in plant factories.

1. Introduction

Global climate change, water scarcity, and the continual loss of arable land have increased the demand for highly efficient and controlled agricultural systems [1]. Plant factories with artificial lighting, as closed and strictly controlled facilities, offer stable production with higher yields, cleanliness, year-round supply, and independence from external climate. However, the significant energy consumption associated with these systems, of which artificial lighting accounts for 60–80%, presents a major obstacle to their widespread commercialization and sustainability [2]. Therefore, improving resource use efficiency while maintaining crop yield is essential for the advancement of sustainable plant factory production.
Among lighting strategies, light intensity (photosynthetic photon flux density (PPFD)) and photoperiod are two fundamental factors regulating photosynthetic carbon assimilation and biomass production. An appropriate light environment promotes carbon assimilation and growth, whereas inadequate or excessive light disrupts metabolism and restricts yield [3]. Insufficient light disturbs physiological and biochemical processes and suppresses growth [4], with studies on lettuce demonstrating that low light intensity can cause a fresh weight reduction of approximately 40% [5]. In contrast, excessive light may overexcite photosystem II (PSII), inducing photoinhibition and generating reactive oxygen species (ROS). Conversely, a moderate extension of the photoperiod can increase dry weight in leafy vegetables, relieve low-light stress, and improve organic matter accumulation [6,7,8,9,10,11]; for example, extending the photoperiod of ‘Little Gem’ lettuce from 12 to 21 h increased its dry weight by 27.6%. However, the majority of existing studies have investigated the effects of light intensity and photoperiod in isolation. Evidence on their combined effects on photosynthesis, yield, and especially energy-use efficiency is still limited, creating a gap in optimizing lighting for both productivity and sustainability.
Leafy vegetables, such as Pakchoi (Brassica rapa ssp. chinensis var. communis), lettuce, and spinach, are major subjects of light regulation in plant factories. Pakchoi is rich in vitamin C, minerals, and phytochemicals, and represents an important dietary source [12]. Previous research on leafy vegetables has demonstrated that dry matter accumulation increases with light intensity within a certain range, but growth declines once a threshold is exceeded, although antioxidant enzymes can alleviate photoinhibition [13,14]. Similarly, extending the photoperiod to increase the daily light integral (DLI) promotes leaf expansion and fresh weight accumulation [15]. Although these studies have established the general effects on biomass, a deeper understanding is lacking. Specifically, how different PPFD–photoperiod combinations modulate the coordination between photosystem I (PSI) and PSII, dynamic photochemical regulation, and overall system-level energy-use efficiency remains insufficiently understood, particularly when different light strategies result in a similar DLI.
Therefore, to clarify the specific mechanisms by which light regimens influence plant growth, this study investigates the coupled effects of three light intensities (100, 175, and 250 μmol·m−2·s−1) and four photoperiods (8, 12, 16, and 20 h·d−1) on Pakchoi (cultivar ‘Xinxiaqing No. 9’) grown under plant factory conditions. By integrating chlorophyll fluorescence analyses (OJIP and PSI/PSII activity) with growth, gas exchange, and CO2 response curves, we aim to elucidate the physiological trade-offs between biomass production, photosynthetic performance, and electrical energy consumption. To achieve this, we distinguish light-use efficiency at two levels: physiological light-use efficiency (LUE), describing the effectiveness of converting absorbed photons to biomass, and energy-use efficiency (EUE), a system-level indicator defined as biomass produced per unit of electrical energy input. This distinction is critical because enhanced photosynthetic performance does not necessarily translate into higher EUE. This integrated framework provides a scientific basis for developing lighting strategies that move beyond simple DLI-based recommendations toward more efficient and physiologically informed optimization in plant factories.

2. Materials and Methods

2.1. Experimental Materials and Environment

The experiment was performed in a controlled-environment plant factory at the Shanghai Academy of Agricultural Sciences. Pakchoi cultivar No. 9 of Xinxiaqing, provided by the Horticultural Research Institute of the Shanghai Academy of Agricultural Sciences, was used as the experimental material. Seedling cultivation and lighting equipment were supplied by Assens Biotechnology Co., Ltd. (Shanghai, China). The LED light source had peak wavelengths of 660 nm (red, R) and 450 nm (blue, B), with an R:B photon flux ratio of 4:1.
During the experimental period, environmental conditions were maintained as follows: the air temperature was set at 24 °C during the light period and 22 °C during the dark period, while the relative humidity was controlled at 70–80% and the CO2 concentration was maintained at 400 ± 50 μmol·mol−1. Light exposure was regulated by an automated system, and the light intensity of each treatment combination was monitored using a spectroradiometer (JETI, Jena, Germany).

2.2. Experimental Design and Light Treatments

The experiment consisted of 12 light treatments, derived from a full orthogonal combination (4 × 3) of three light intensities and four photoperiods. The light intensities were 100, 175, and 250 μmol·m−2·s−1, and the photoperiods were defined by their light/dark durations: 8 h/16 h, 12 h/12 h, 16 h/8 h, and 20 h/4 h. To simplify subsequent references, these photoperiods will be denoted by their total light hours per day (8, 12, 16, and 20 h·d−1). Each treatment was designated by the format “photoperiod–light intensity” (e.g., “8–100” represents a photoperiod of 8 h·d−1 with 100 μmol·m−2·s−1 PPFD). The complete set of treatments included 8–100, 8–175, 8–250, 12–100, 12–175, 12–250, 16–100, 16–175, 16–250, 20–100, 20–175, and 20–250. To ensure uniform light distribution, the PPFD was measured at 9 points across the canopy level, and the average value was calculated for each treatment area. To minimize potential microclimate heterogeneity and positional effects within the plant factory, treatments were spatially distributed across the cultivation shelves using a randomized layout. The cultivation system consisted of 3 vertical layers, which served as 3 independent replicate plots for each treatment (n = 3), with each plot containing 18 plants. In addition, plant positions within each treatment area were periodically rotated during the experimental period to reduce edge effects and potential gradients in light and airflow. The vertical layer was treated as a blocking factor in the experimental design.
The daily light integral (DLI, mol·m−2·d−1) for each treatment was calculated using the following equation:
DLI = PPFD × Photoperiod × 0.0036
where PPFD is in μmol·m−2·s−1, and photoperiod is in h·d−1. The DLI values for each treatment are presented in Table 1.

2.3. Cultivation Management

Pakchoi seeds were disinfected by soaking in 75% ethanol for 30 s, followed by three rinses with distilled water, and then sown in 72-cell foam seedling trays. One liter of nutrient solution was added to the bottom of each tray, and the solution was regularly replenished and maintained at a consistent level. The composition of the nutrient solution is shown in Supplementary Table S1, with an electrical conductivity (EC) of 2.0 mS·cm−1 and pH of 6.0–6.5 [16]. When seedlings reached 4–5 true leaves, uniform plants were selected and transplanted into rockwool cubes with dimensions of 10 × 10 × 6.5 cm (length × width × height). The cubes were placed in a tidal-type automatic irrigation system supplied by Assens Biotechnology Co., Ltd. (Shanghai, China). The system had three layers, each measuring 120 cm in length, 70 cm in width, and 12 cm in height. Irrigation occurred every 360 min, with each event providing sufficient solution flow to ensure adequate root-zone hydration. The entire process was continuously monitored. The nutrient solution was automatically supplemented to maintain the desired EC and pH levels.

2.4. Measurement Indicators and Methods

2.4.1. Growth Parameters

Growth traits: At 20 days after treatment, plant height, plant width, and stem diameter of Pakchoi were measured using a ruler and a vernier caliper. Plants were harvested, and fresh weight was measured with an electronic balance. The samples were blanched at 105 °C for 1 h to inactivate enzymes, and then oven-dried at 60 °C to a constant weight. Dry weight was recorded for each treatment.
Chlorophyll content: At 14 days after treatment, 0.1 g of functional leaf tissue was sampled and extracted with 95% ethanol until the tissues were completely decolorized. Absorbance at 665, 649, and 470 nm was measured using a UV-visible spectrophotometer (Ultraviolet-2700; Shimadzu, Tokyo, Japan), and chlorophyll a, chlorophyll b, and total chlorophyll contents were calculated according to the following formulas [17]. All measurements were conducted in triplicate:
Chlorophyll a (mg·g−1 Fresh weight) = 13.95A665 − 6.88A649,
Chlorophyll b (mg·g−1 Fresh weight) = 24.96A649 − 7.32A665.
In the formulas, A665 and A649 represent the absorbance of chloroplast pigment extract at wavelengths of 665 nm and 649 nm, respectively.

2.4.2. Photosynthesis and CO2 Response Curves

At 14 days after treatment, the leaf net photosynthetic rate (Pn), transpiration rate (Tr), stomatal conductance (gs), and intercellular CO2 concentration (Ci) were measured using a portable photosynthesis system (LI-6400XT, LI-COR Biosciences, Lincoln, NE, USA), equipped with a red–blue LED light source. Measurements were conducted on fully expanded leaves under controlled chamber conditions. CO2 response curves were obtained by sequentially adjusting the reference CO2 concentration to 2000, 1800, 1500, 1200, 1000, 800, 600, 400, 300, 200, 150, 100, and 50 μmol·mol−1, while maintaining a constant photosynthetic photon flux density corresponding to each light treatment. The maximum rate of Rubisco carboxylation (Vcmax) and the maximum rate of photosynthetic electron transport (Jmax) were estimated by fitting the Farquhar, von Caemmerer, and Berry (FvCB) model to the CO2 response curve data using photosynthesis analysis software [18].

2.4.3. Chlorophyll Fluorescence Parameters

Chlorophyll fluorescence parameters were measured using a Dual-PAM-100 system (Walz, Effeltrich, Germany) in “SP-Analysis” and “P700+Fluo” modes. Prior to measurement, leaves were dark-adapted for 30 min. Under dark-adapted conditions, minimal fluorescence (FO), maximal fluorescence (Fm), and the maximal P700 signal of PSI (Pm) were determined using a saturating pulse (300 ms, 10,000 μmol·m−2·s−1), applied to induce maximal fluorescence and full oxidation of P700. During light-adapted measurements, actinic light corresponding to each treatment was applied to obtain steady-state fluorescence (Fs), maximal light-adapted fluorescence (Fm′), and the maximal oxidizable P700 signal (Pm′). Fluorescence parameters were calculated as described, with the specific formulas provided in the Supplementary Material (Table S2) [19].

2.4.4. Rapid Chlorophyll Fluorescence Induction Kinetics (OJIP Curves)

The OJIP curves were measured on fully expanded leaves using a Handy-PEA fluorometer (Hansatech Instruments, King’s Lynn, Norfolk, UK). Before measurements, leaves were dark-adapted for 30 min prior to measurement. A 1 s pulse of saturating red light (3000 μmol·m−2·s−1) induced fluorescence transients, with signals recorded from 20 μs to 1 s. The definitions of primary data points (e.g., Fo, Fj, and Fm) and the formulas for performance parameters calculated via the JIP-test (e.g., ABS/CSm, TR/ABS, and PIabs) are detailed in the Supplementary Material (Tables S3 and S4) [20,21].

2.4.5. Evaluation of Energy-Use Efficiency and Lighting Energy Consumption

In this study, EUE and LUE were used to comprehensively evaluate energy utilization under different light intensities and photoperiods. The calculation formulas are as follows [22]:
E U E = D W × W c h e × S × D P × t ,
where dry weight is the average dry weight of plants at harvest (g·plant−1), ignoring the dry weight of seedlings at transplanting, Wche is the chemical energy per gram of dry weight (2 × 10⁴ J·g−1) [23], and S is the effective cultivation area per treatment (120 cm × 70 cm = 0.84 m2). Each treatment contained 18 plants within this area, corresponding to a planting density (D) of 21 plants·m−2, and the number of plants per treatment (N) was, therefore, 18. P is the electrical power of the light source (W), and t is the cumulative lighting duration during the cultivation period, calculated as the product of daily photoperiod and total cultivation days. In the following formula:
L U E = D W × W c h e × D W r × t ,
dry weight, Wche, D, and t are defined as described above, and Wr is the photosynthetically active radiation received by the canopy per unit area (W·m−2), converted from measured PPFD values using a factor of 0.218 W·m−2 per μmol·m−2·s−1.
In addition, the lighting energy consumption per unit yield (E, kWh·kg−1) was calculated as:
E = P × t N × W f ,
where P is the electrical power of the light source (W), t is the total lighting duration (h), N is the number of plants per treatment (18 plants), and Wf is the fresh weight per plant (g·plant−1).
The total electrical energy consumption (Etotal, kWh) during the cultivation period was calculated as:
E t o t a l = P × t ,
representing the total electrical energy input from the lighting system over the entire cultivation period.

2.4.6. Data Analysis

Data were organized in Excel 2016 and analyzed using SPSS 25, with normality and homogeneity of variance checked using Shapiro–Wilk and Levene’s tests. Two-way ANOVA was performed to assess the effects of light intensity, photoperiod, and their interaction, with significant differences (p < 0.05) further compared using Duncan’s multiple range test. Pearson correlation and principal component analysis (PCA) were performed using treatment mean values to explore trait relationships and multivariate patterns. Prior to PCA, all variables were standardized using z-score transformation. Principal components were retained based on eigenvalues greater than 1 and their physiological interpretability. To analyze the relationship between fresh weight and energy-use efficiency, a quadratic polynomial regression model was fitted between fresh weight and both LUE and EUE. Graphs were generated using GraphPad Prism 9.

3. Results

3.1. Interactive Effects of Light Intensity and Photoperiod on the Growth, Biomass Accumulation, and Energy Efficiency of Pakchoi

The growth and biomass accumulation of Pakchoi were significantly influenced by the light environment across all twelve treatments. Plant height, plant width, stem diameter, fresh weight, and dry weight of Pakchoi increased significantly with increasing light intensity and photoperiod and were strongly correlated with DLI (Table 2). Fresh weight ranged from 27.74 g under the lowest DLI combination (8–100) to 236.75 g under the highest DLI (20–250), while dry weight increased more than nine-fold across the treatments. Overall, Pakchoi growth responded positively to both light intensity and photoperiod, reaching its maximum under the high light–long photoperiod combination (20–250).
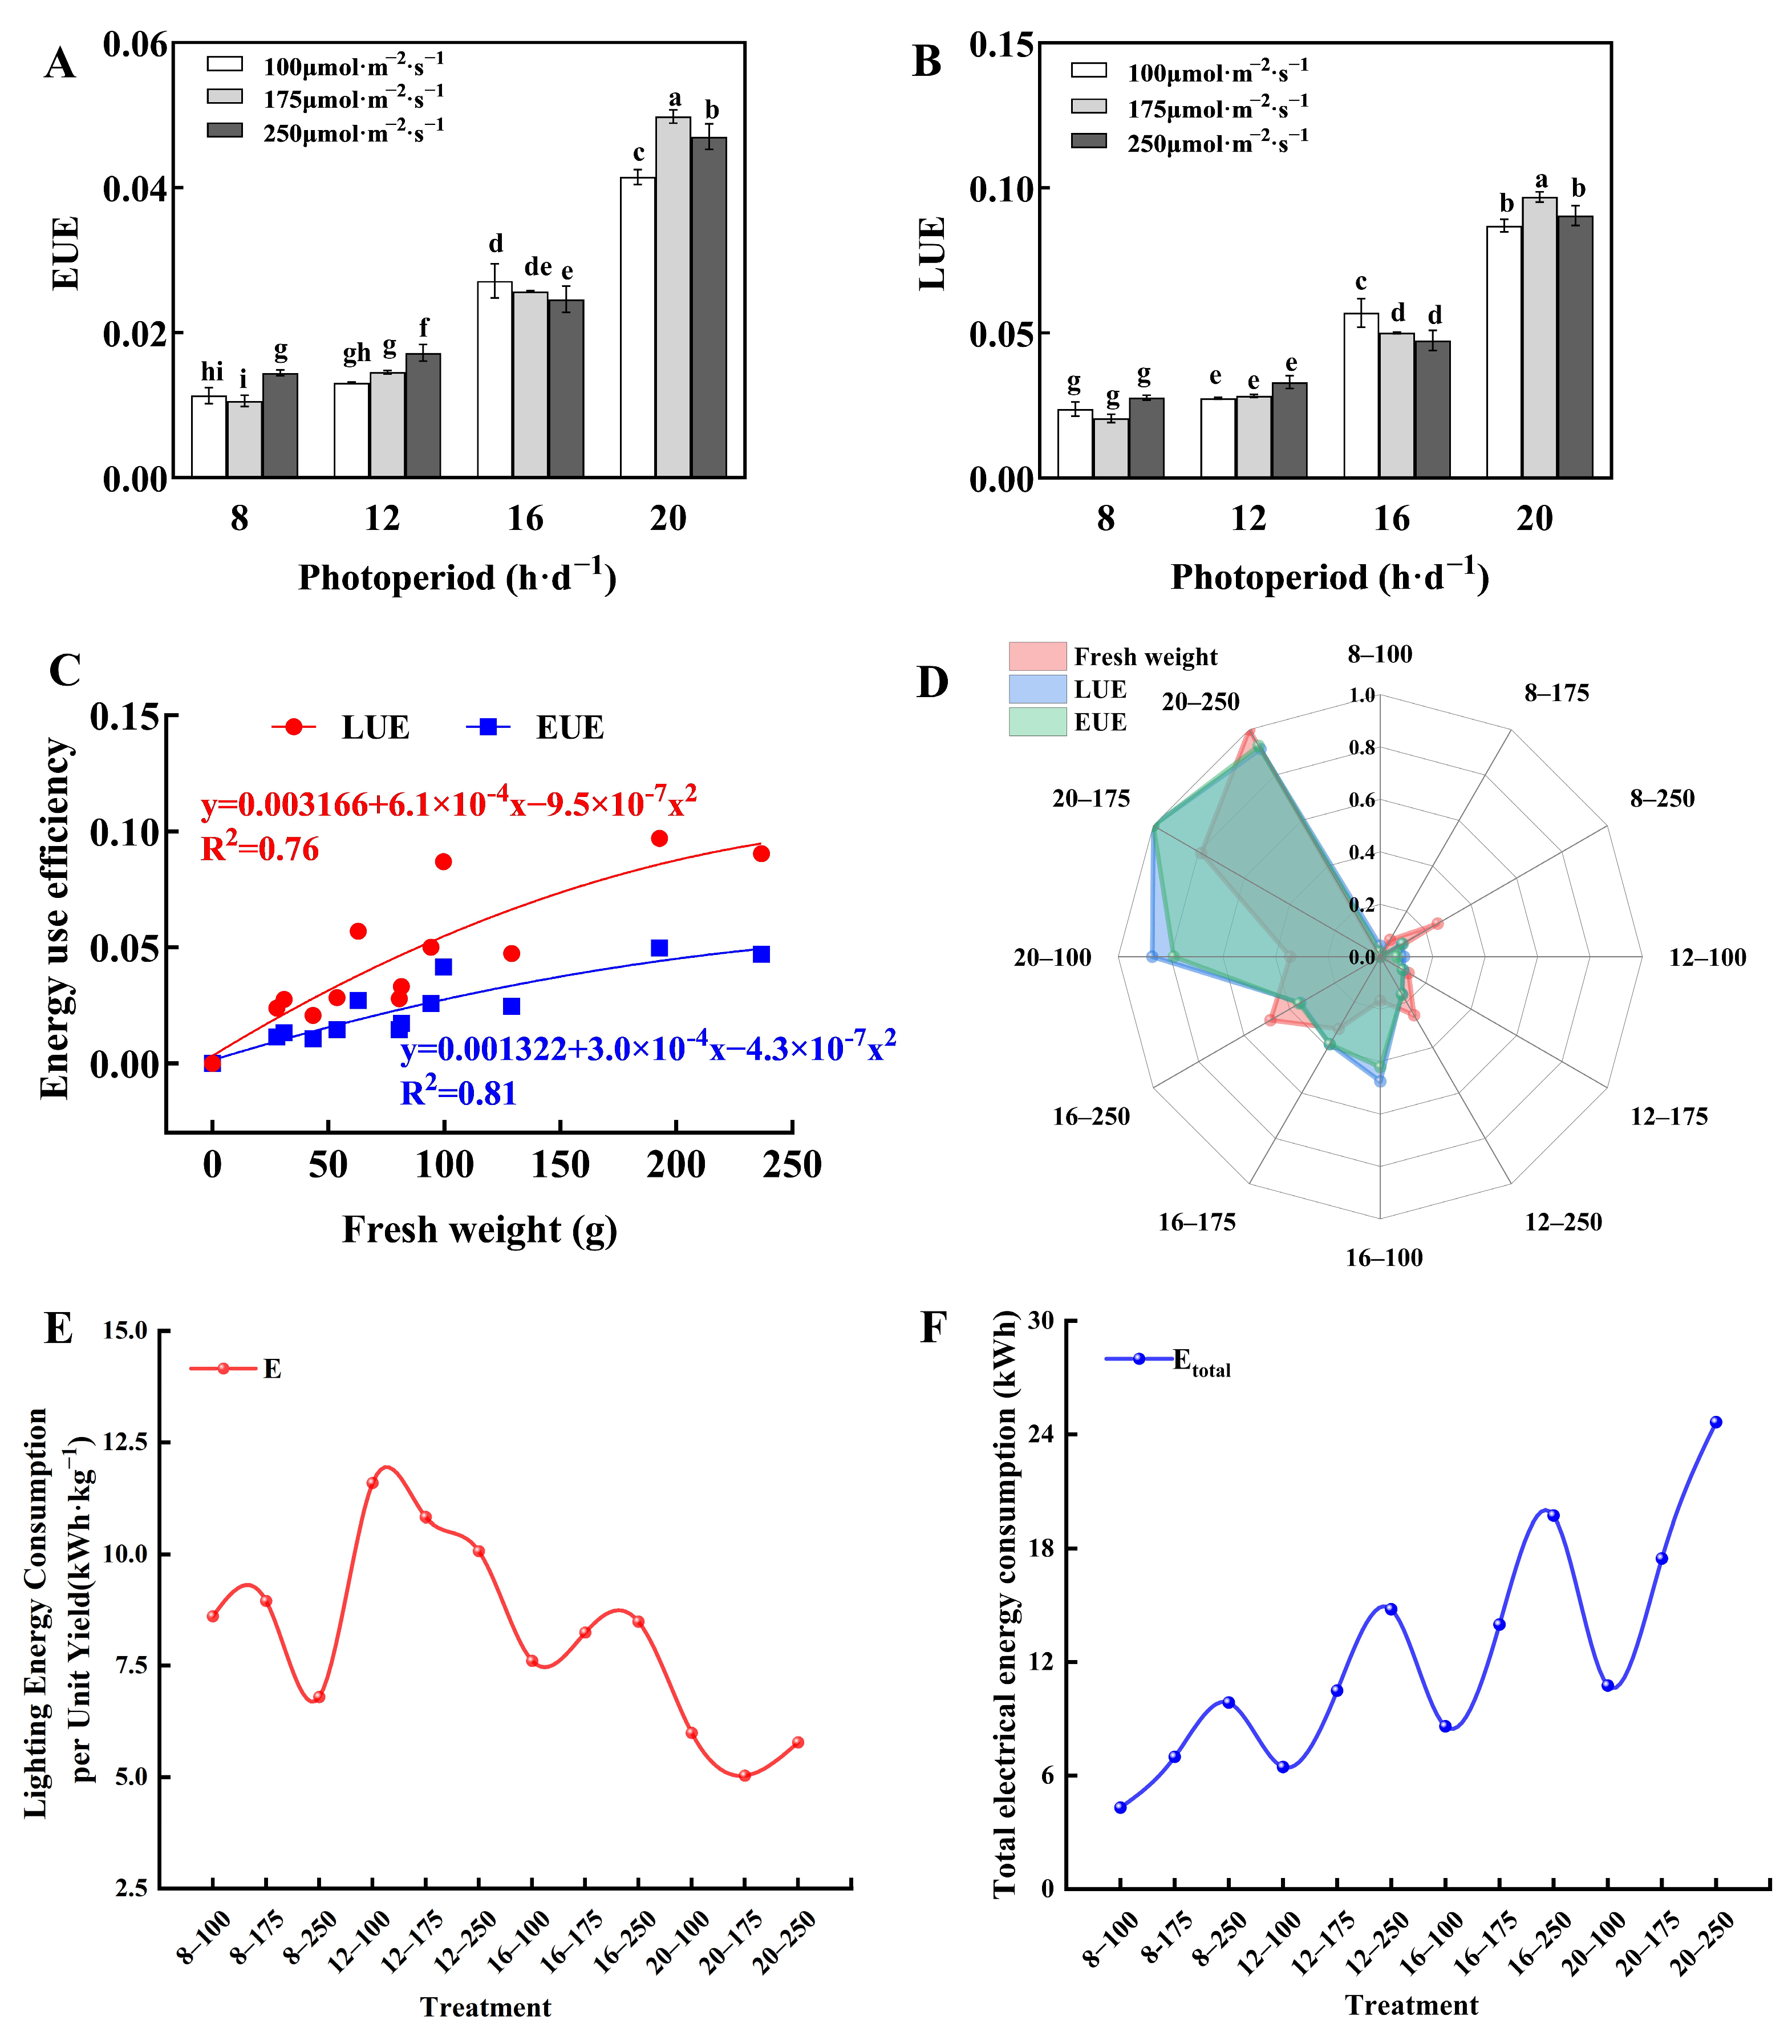
The LUE and EUE of Pakchoi were significantly affected by both light intensity and photoperiod (Figure 1). Both LUE and EUE gradually increased with the extension of the photoperiod and reached their maximum values under the 20–175 treatment (Figure 1A,B). Regression analysis revealed significant positive correlations between fresh weight and EUE, with coefficients of determination (R2) of 0.76 and 0.81 for LUE and EUE, respectively. This result indicated that the increase in biomass was accompanied by enhanced energy efficiency (Figure 1C).
The radar chart integrating fresh weight, LUE, and EUE showed that Pakchoi plants grown under the 20–250 treatment achieved the greatest biomass accumulation, whereas those under the 20–175 treatment displayed the highest energy efficiency (Figure 1D). Additionally, lighting energy consumption per unit yield (kWh·kg−1) varied markedly among treatments, with the 12–100 treatment resulting in the highest and the 20–175 treatment in the lowest consumption (Figure 1E). Although total electrical energy consumption exhibited a progressive increase with elevated light intensity and extended photoperiods, a comprehensive evaluation of yield-related and efficiency-related parameters indicated that the 20–175 treatment provided the optimal trade-off between production performance and energy utilization (Figure 1F).

3.2. Interactive Effects of Light Intensity and Photoperiod on Chlorophyll Content and Photosynthesis of Pakchoi

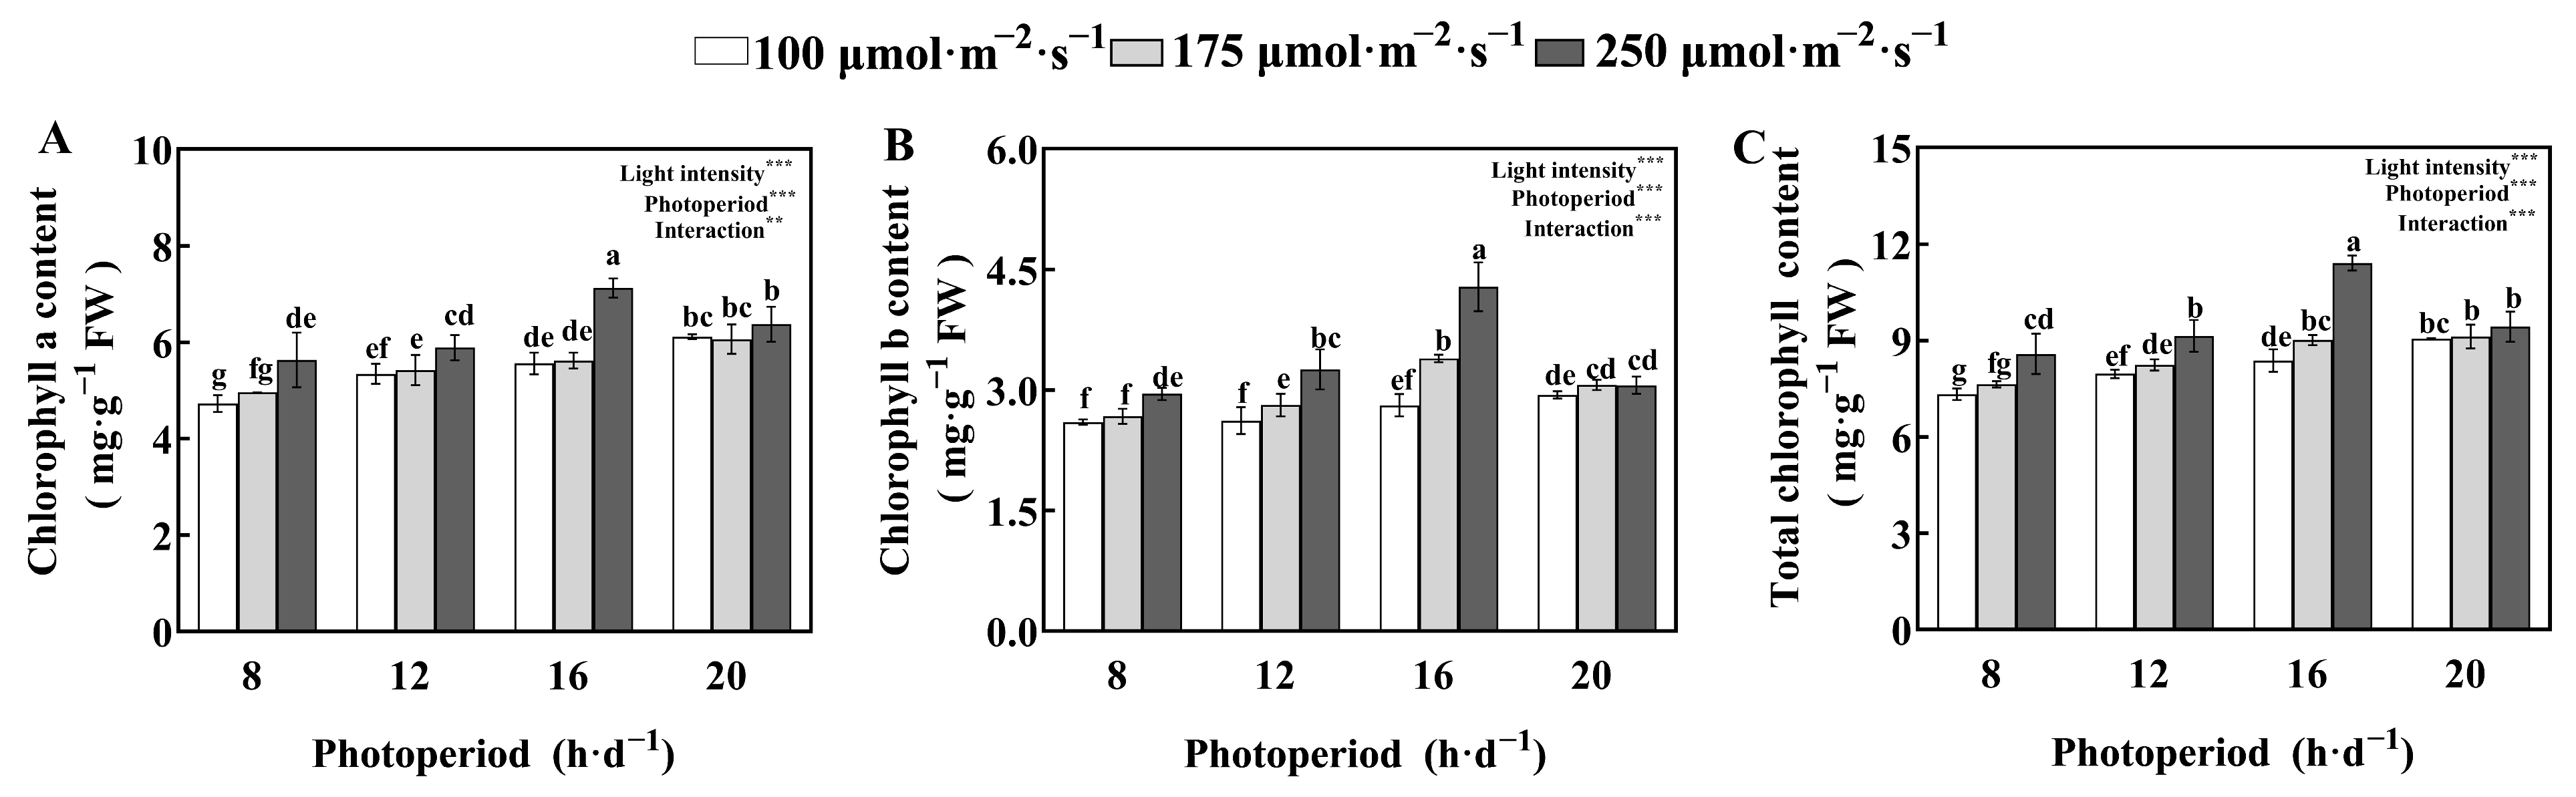
Chlorophyll a and chlorophyll b are the major photosynthetic pigments in chloroplasts, which are directly involved in light absorption and energy transfer. A higher total chlorophyll content is usually associated with a stronger light-harvesting capacity and a higher potential photosynthetic rate [24]. To evaluate the effects of light intensity and photoperiod on the photosynthetic capacity of Pakchoi, the contents of chlorophyll a, chlorophyll b, and total chlorophyll were measured. The results demonstrated statistically significant effects of light intensity–photoperiod regimes on all three parameters (Figure 2). At the same photoperiod, total chlorophyll content increased gradually with rising light intensity. Under low light intensities (100 and 175 μmol·m−2·s−1), chlorophyll content increased with photoperiod extension. However, under high light intensity (250 μmol·m−2·s−1), chlorophyll accumulation was promoted by extending the photoperiod to 16 h·d−1, but it declined when the photoperiod was further extended to 20 h·d−1.
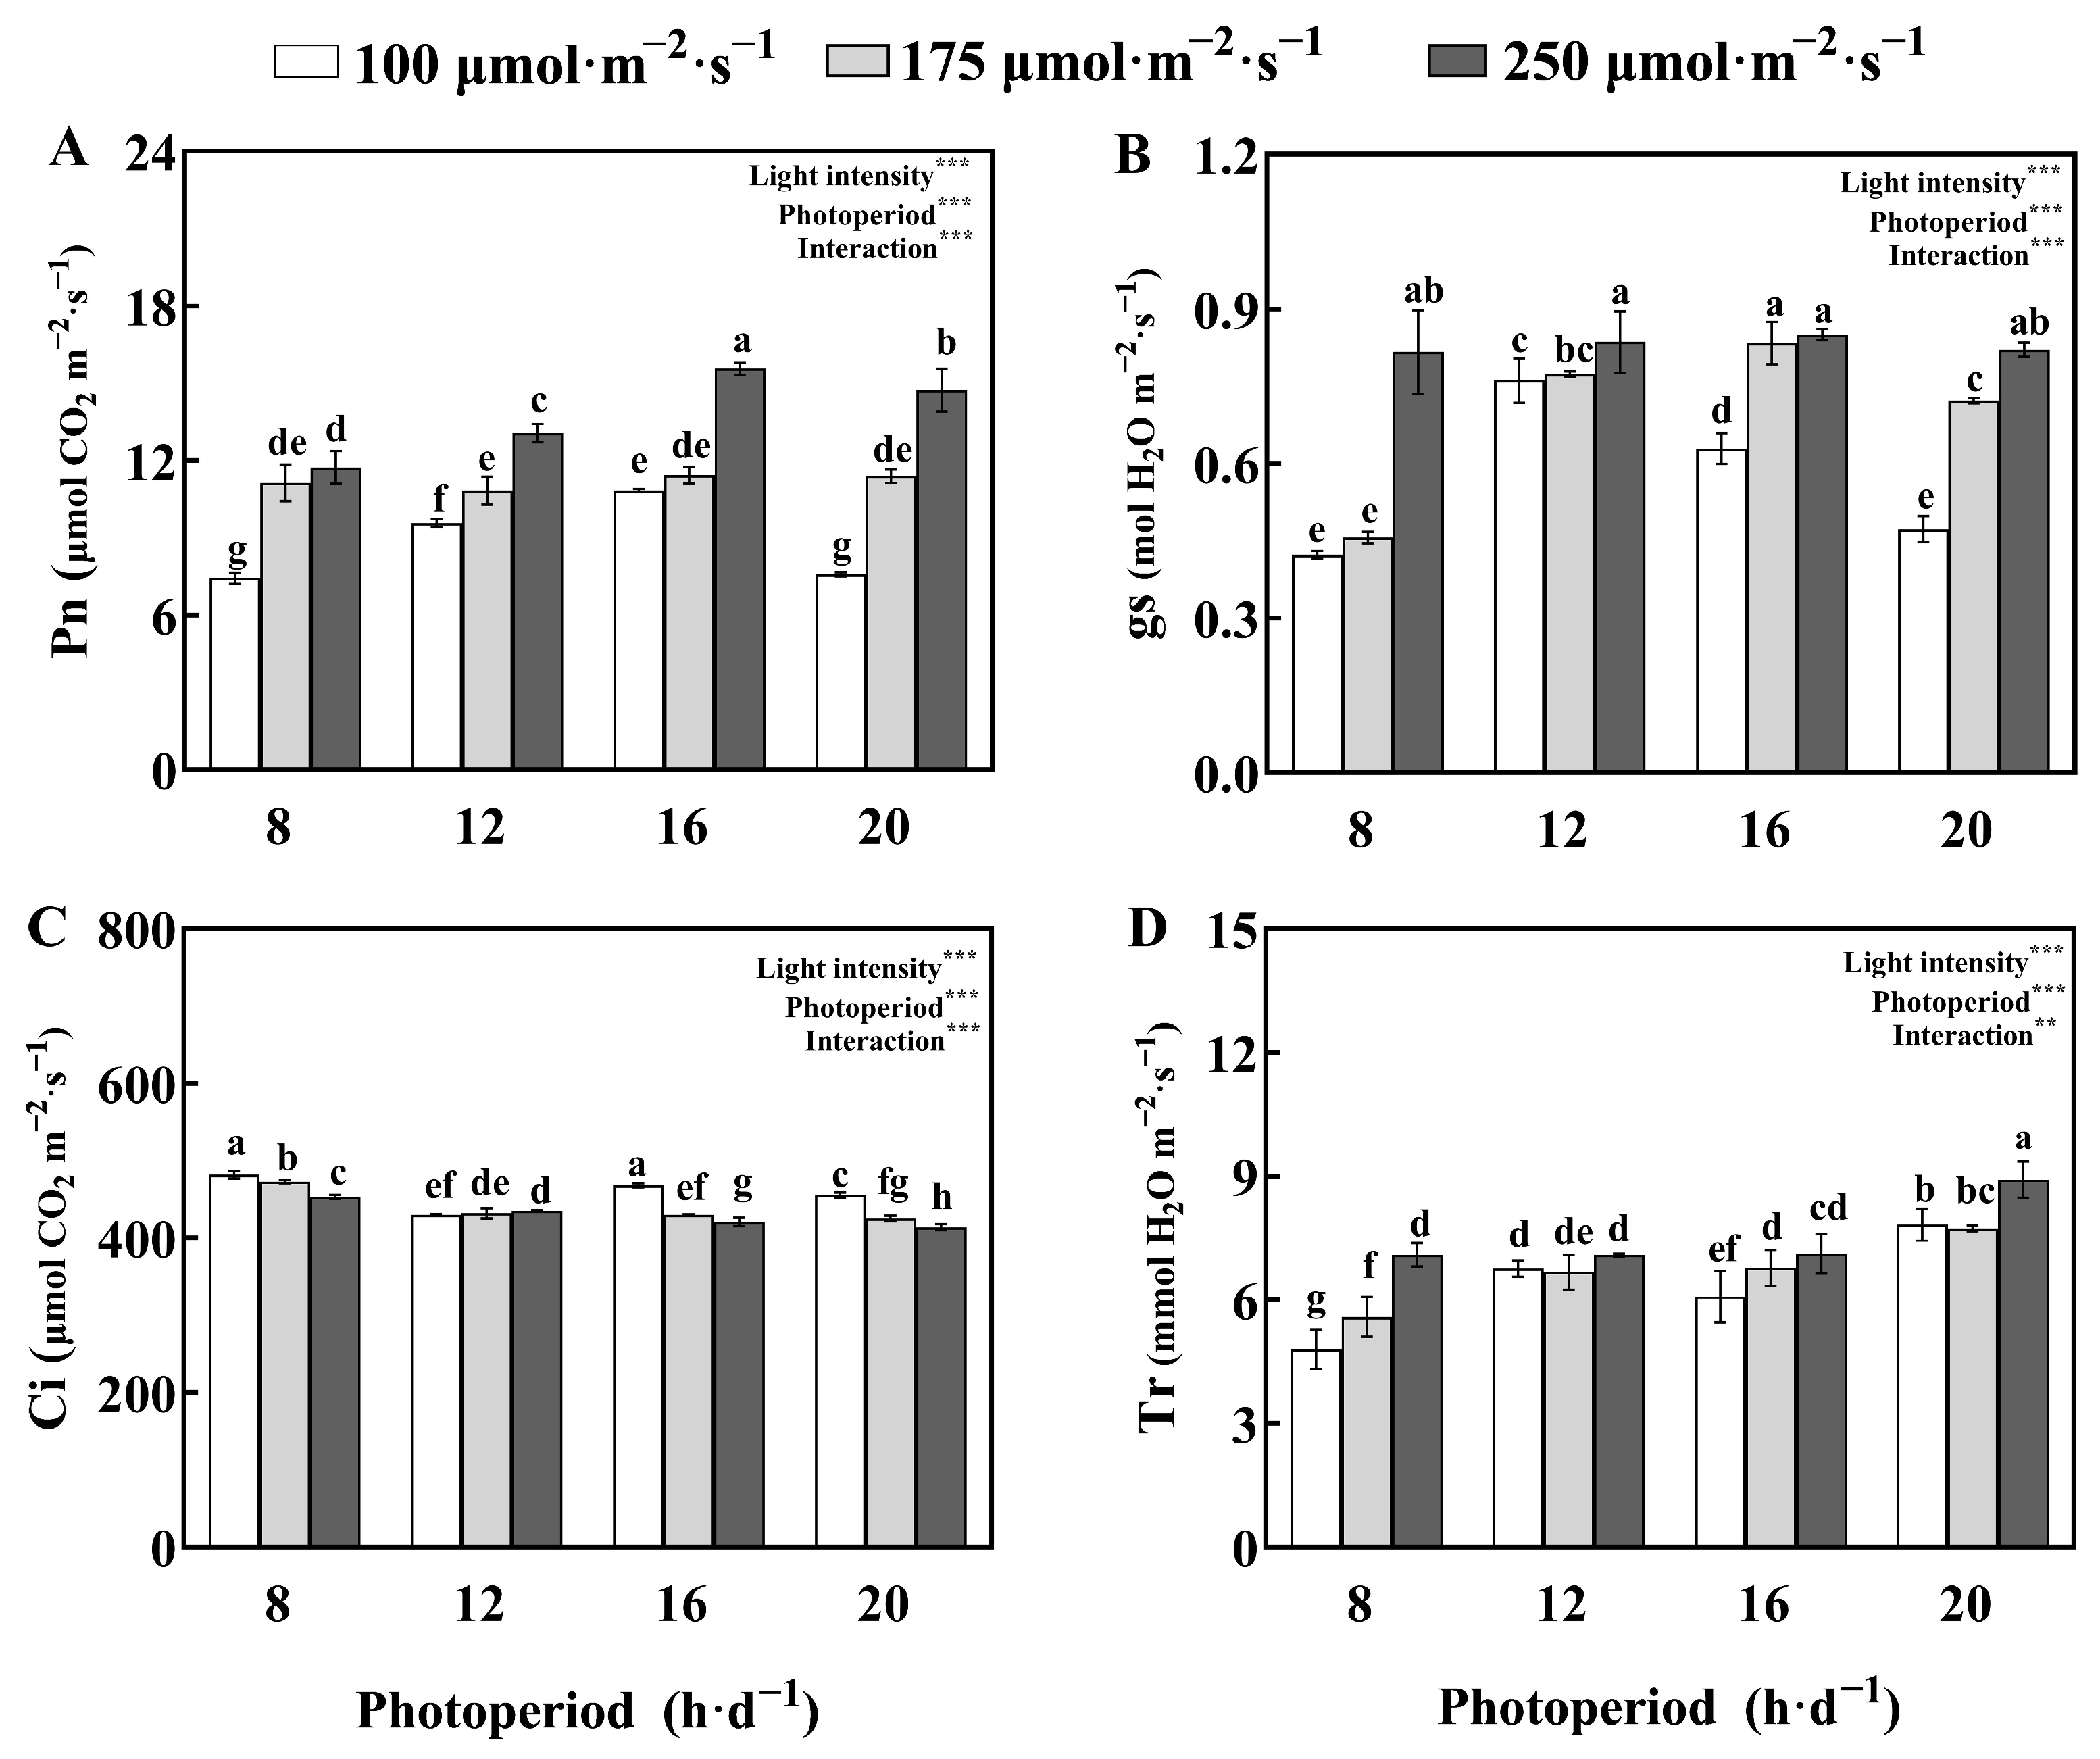
Light intensity and photoperiod also significantly modulated leaf gas exchange parameters, such as Pn, gs, Ci, and Tr (Figure 3). At the same photoperiod, increasing light intensity from 100 to 250 μmol·m−2·s−1 significantly enhanced Pn, gs, and Tr, while reducing Ci. For example, under an 8 h·d−1 photoperiod, Pn increased by 57.9% (from 7.43 to 11.73 μmol·m−2·s−1), gs nearly doubled, Tr increased by approximately 50%, and Ci decreased by about 6.2%. Notably, the photosynthetic rate under the 16–250 treatment (15.6 μmol·m−2·s−1) was 110.0% higher than that of the 8–100 treatment (7.43 μmol·m−2·s−1).
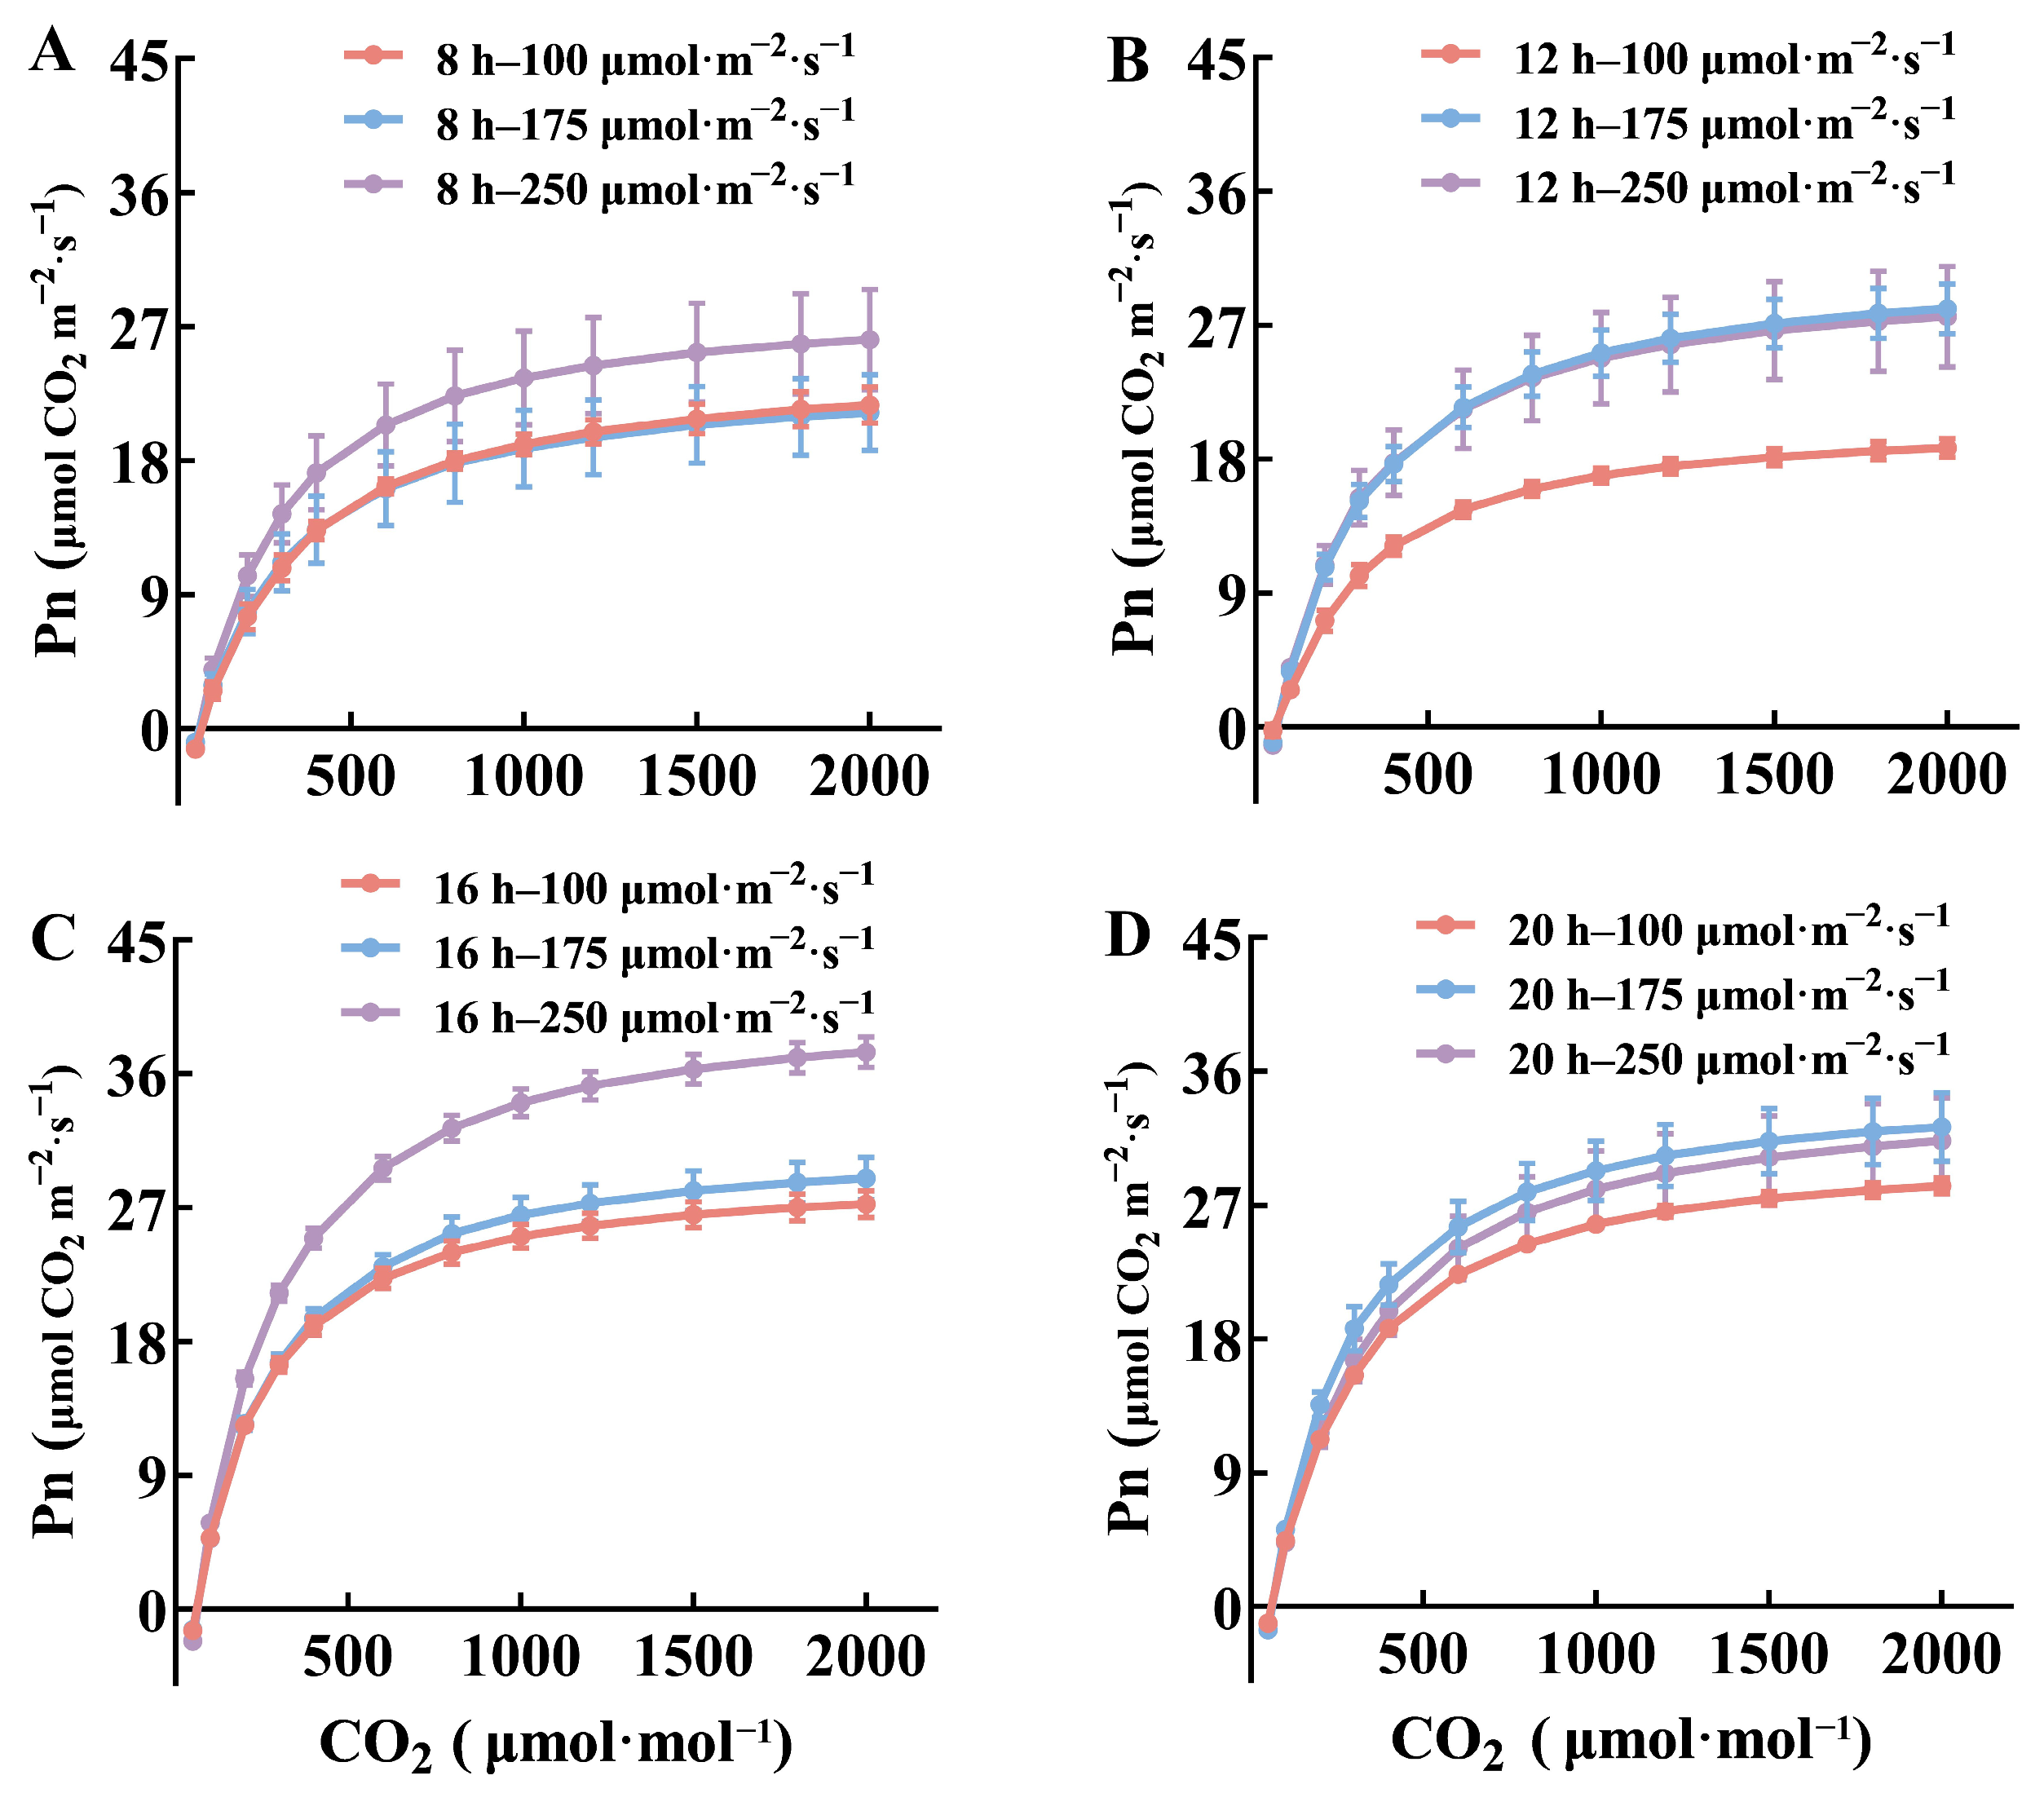
The response of Pn to the increasing external CO2 concentration followed a typical saturation curve (Figure 4). When the concentration of CO2 was below 1000 μmol·mol−1, Pn showed a strong response, whereas when the concentration of CO2 exceeded 1000 μmol·mol−1, the increase reached a plateau. Under the same photoperiod, with increasing PPFD, CO2 response curves gradually separated at low to medium CO2 levels, indicating a stronger enhancement of the photosynthetic response under higher light intensity. However, this separation was less pronounced under a 20 h·d−1 photoperiod. At a fixed PPFD, Pn curves at 100 μmol·m−2·s−1 largely overlapped across photoperiods; in contrast, at 250 μmol·m−2·s−1, the maximum Pn increased with photoperiod extension up to 16 h·d−1, reaching its peak under the 16–250 treatment, then declined.
Table 3 shows the effects of different light intensity and photoperiod combinations on CO2 response parameters of Pakchoi. Under a 16 h·d−1 photoperiod, increasing PPFD from 100 to 250 μmol·m−2·s−1 significantly enhanced Amax, α, Vcmax, and Jmax. Similarly, at a constant PPFD of 100 μmol·m−2·s−1, extending the photoperiod from 8 h·d−1 to 20 h·d−1 also markedly increased these parameters, with Amax rising from 18.13 to 32.61 μmol·m−2·s−1. Overall, the 16–250 treatment exhibited the best photosynthetic capacity, with Amax values approximately 1.8-fold greater than those of 8–100 treatment.

3.3. Interactive Effects of Light Intensity and Photoperiod on PSII Energy Transfer Efficiency and Electron Transport Characteristics of Pakchoi

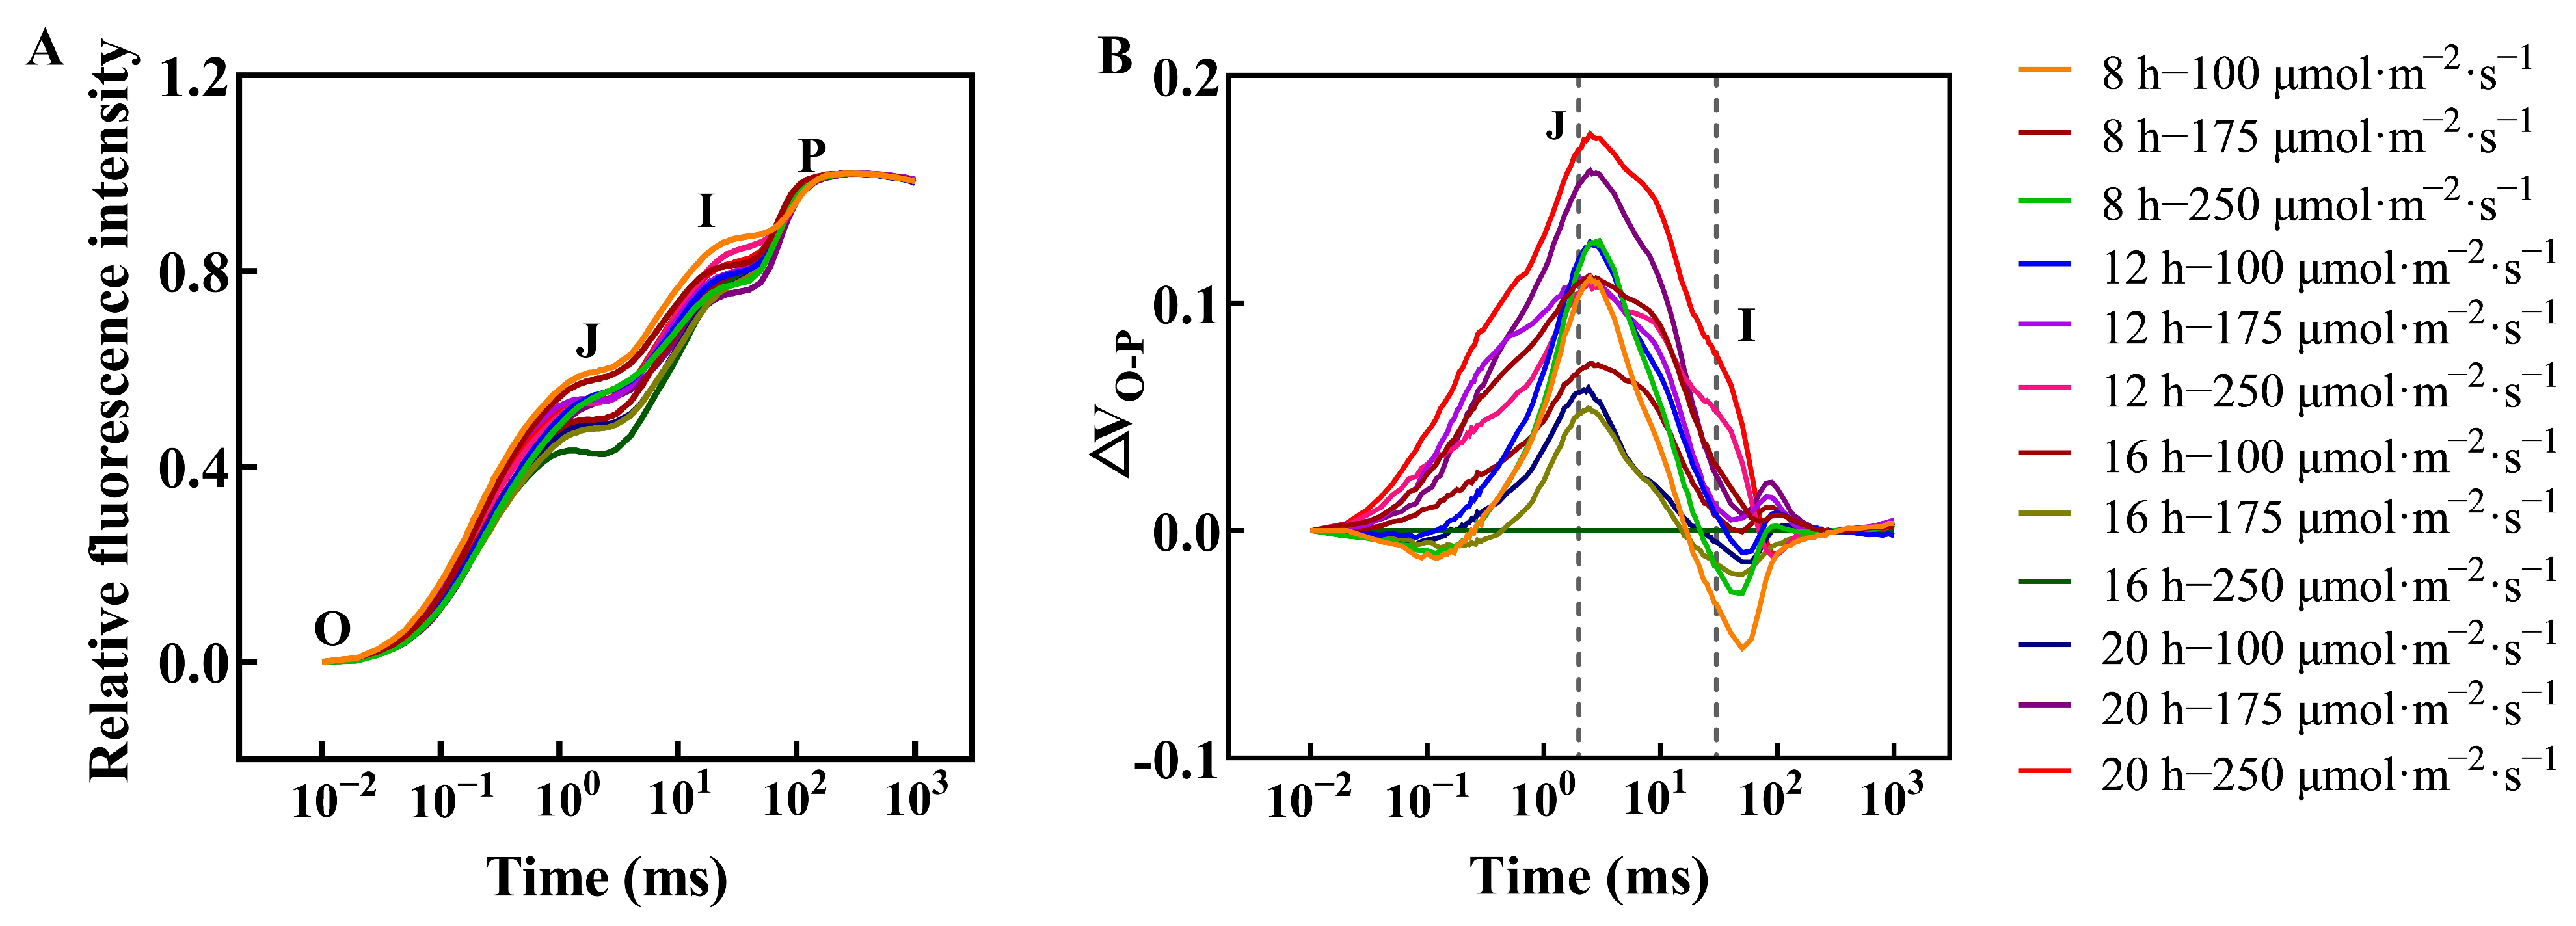
Figure 5A presents the normalized fast chlorophyll fluorescence induction kinetics (VO–P) of Pakchoi leaves under all treatments, and they exhibited the typical O–J–I–P four-phase rise curves [25], but with notable differences observed in the J–I rise rate and the fluorescence intensity at the P point, reflecting changes in PSII photochemical activity. Under a constant photoperiod, increasing PPFD accelerated the J–I rise and enhanced the P-point fluorescence. The 16–250 treatment exhibited the most rapid J–I–P rise and the highest P-point fluorescence, whereas the 8–100 treatment showed the slowest kinetics and lowest fluorescence yields. Figure 5B presents the ΔVO–P curves of each treatment relative to the 16–250 control. Within the 2–30 ms range (J–I phase), all treatments exhibited distinct differences. This indicated that varying light environments significantly affect the PSII electron transport process. With increasing PPFD, the positive peak of the ΔVO–P curves increased, and the amplitude of fluctuations became larger. Extending the photoperiod also increased the peak amplitude. The greatest deviations from 16–250 were observed under the high-PPFD, long-photoperiod treatments (especially 20–250). To further investigate the primary photochemical reactions and electron transport activity of PSII, the OJIP curves were analyzed using the JIP test, dividing the light energy transfer process into four stages: light absorption, capture by reaction centers, electron transport through the chain, and transfer to the PSI end [25].
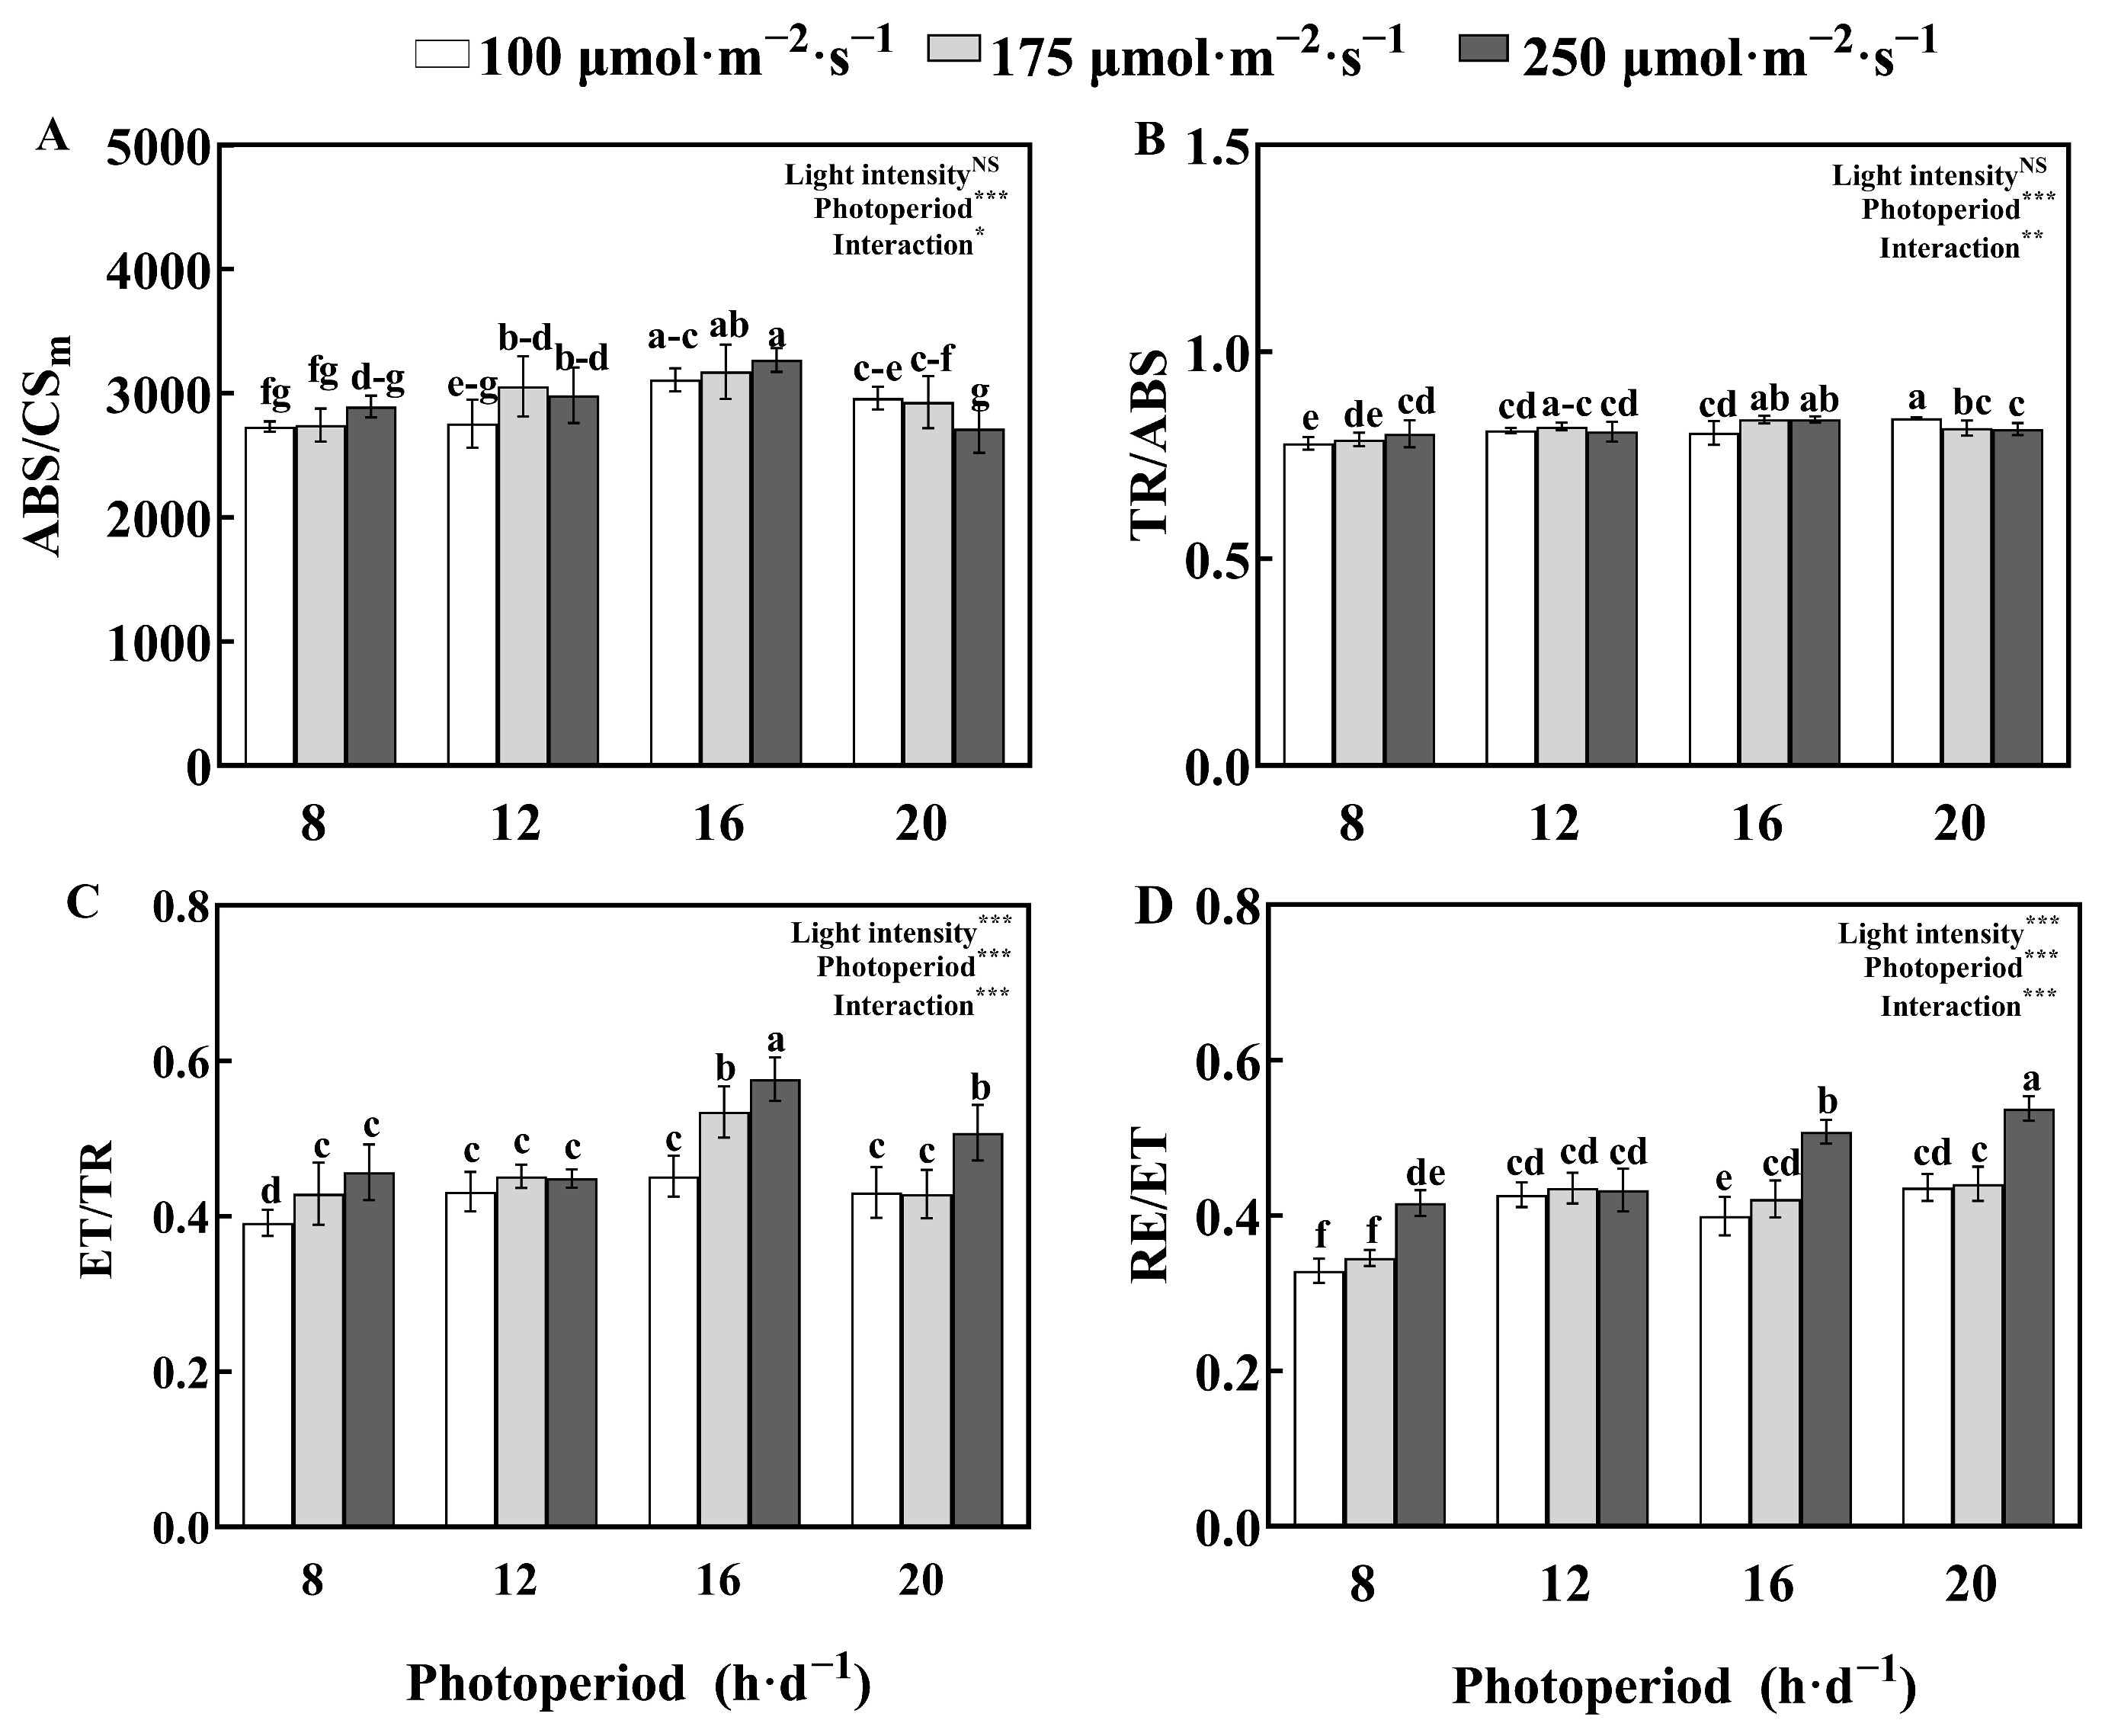
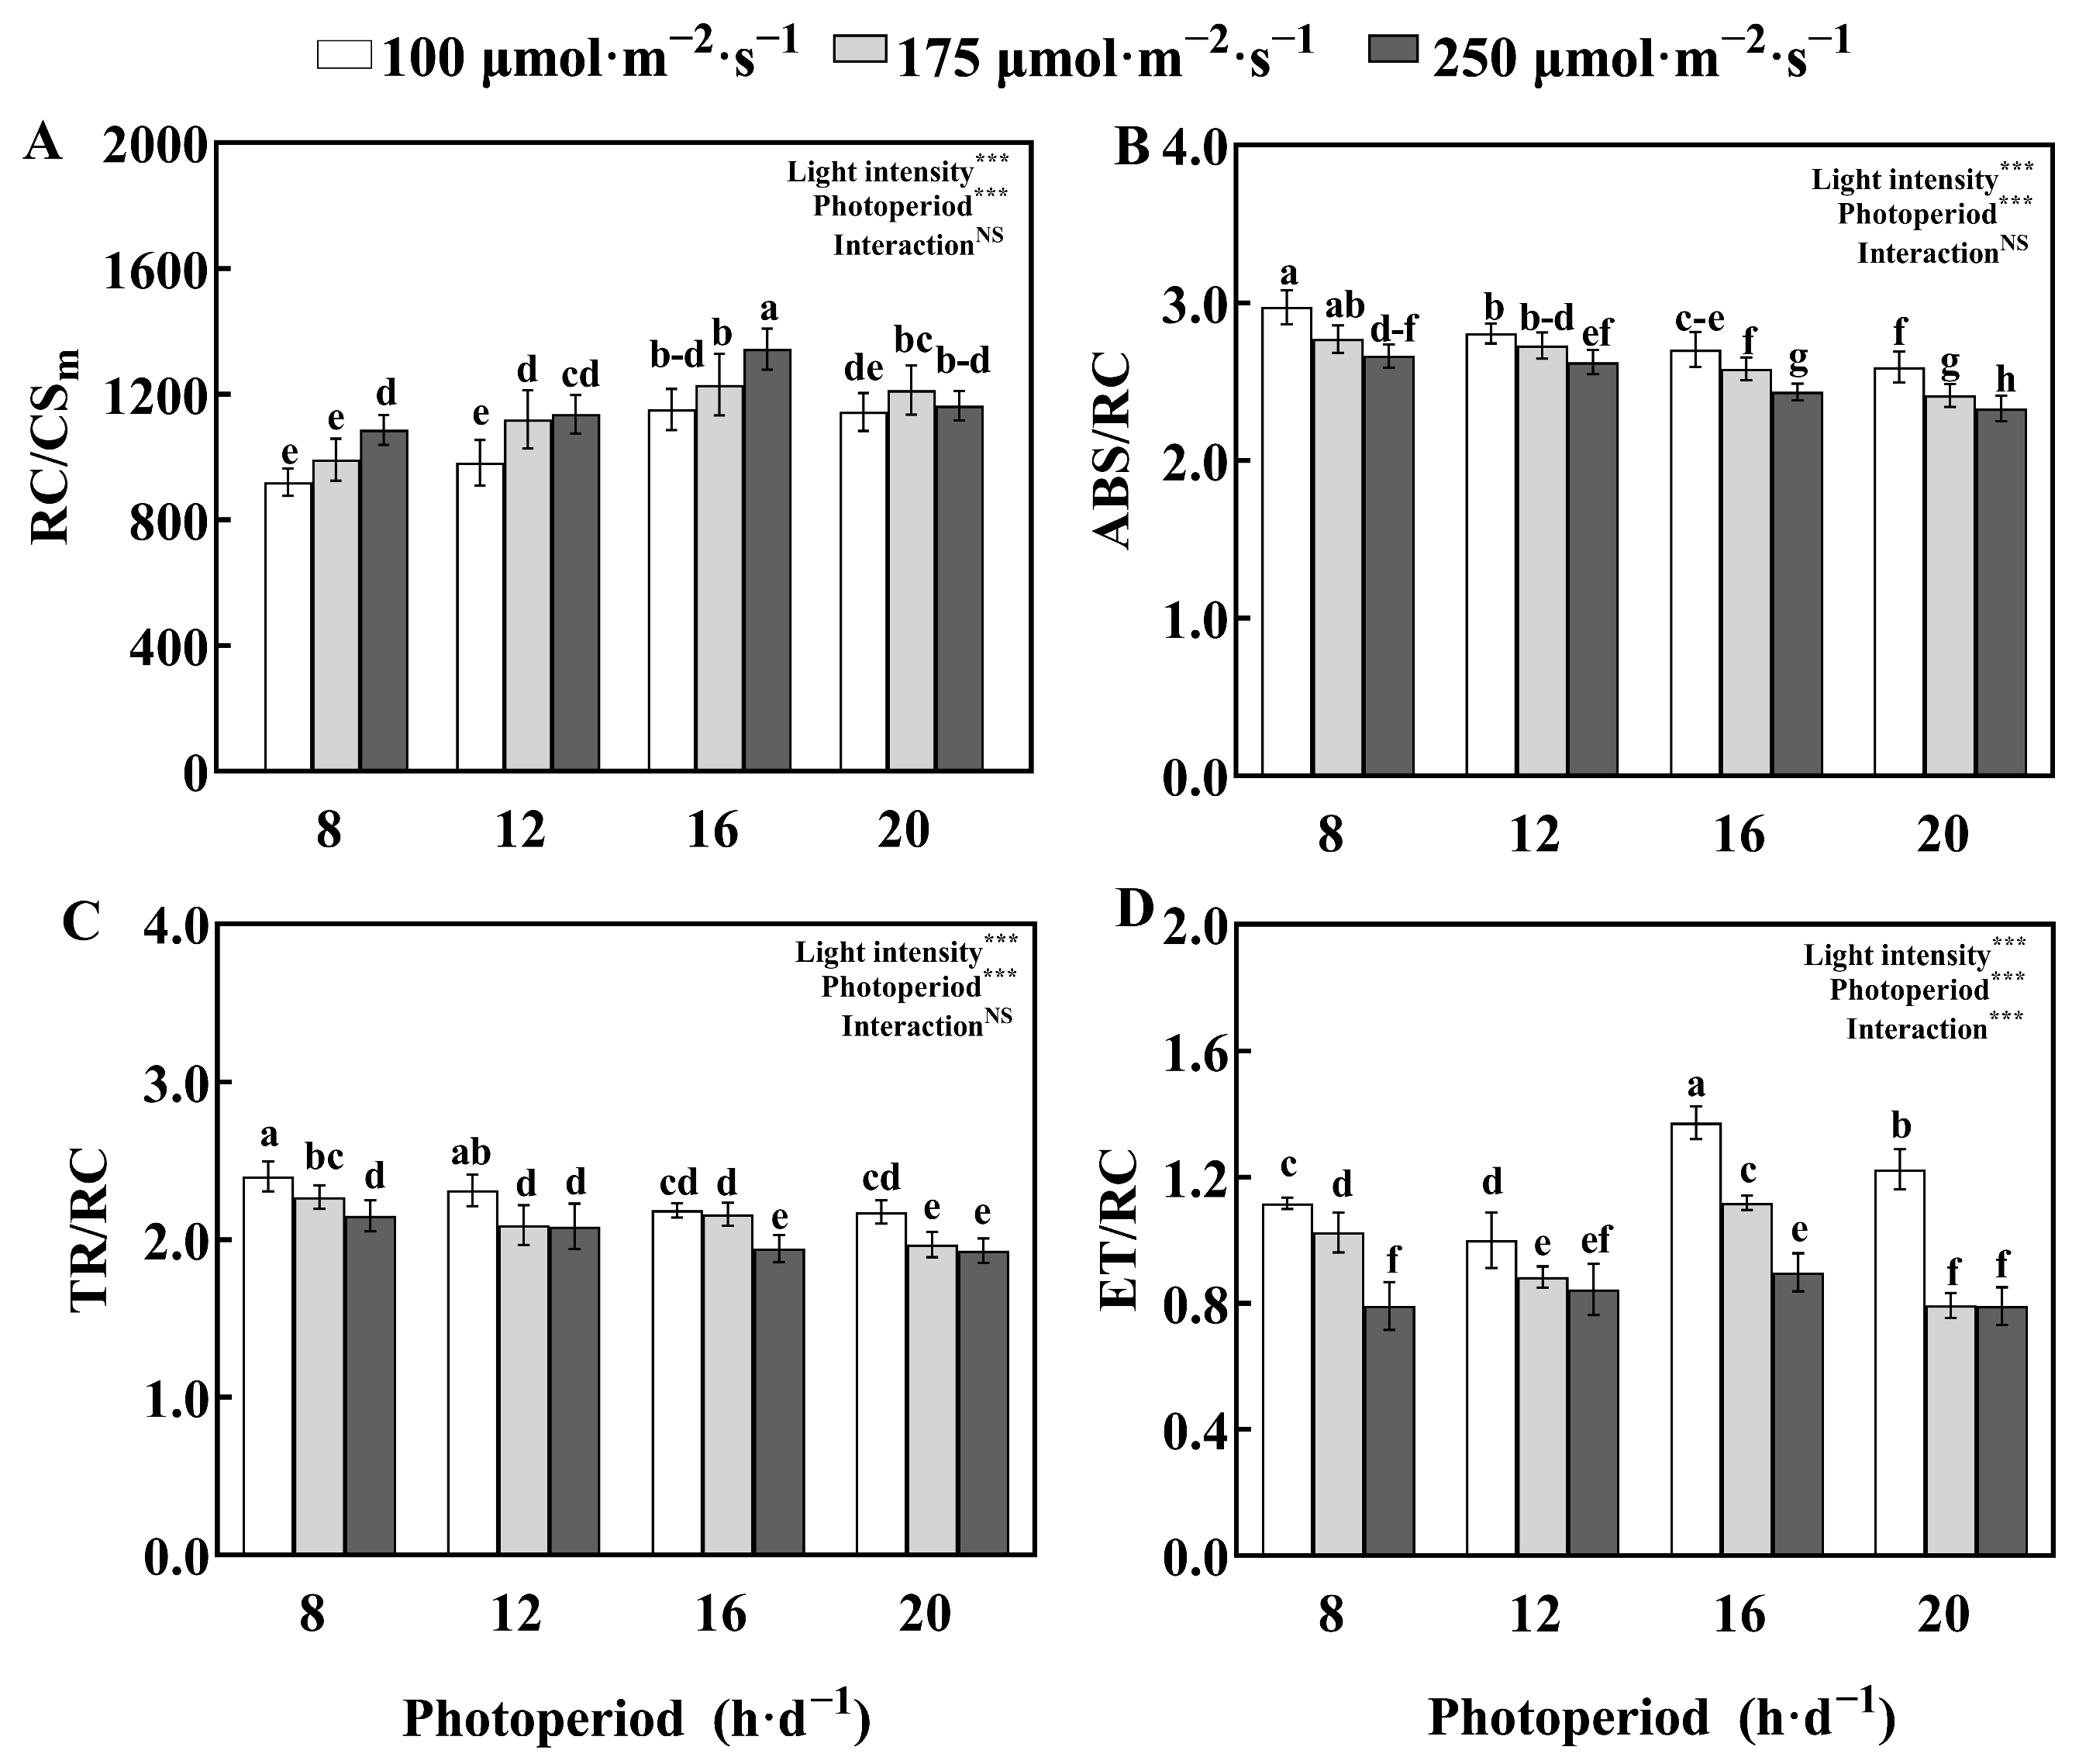
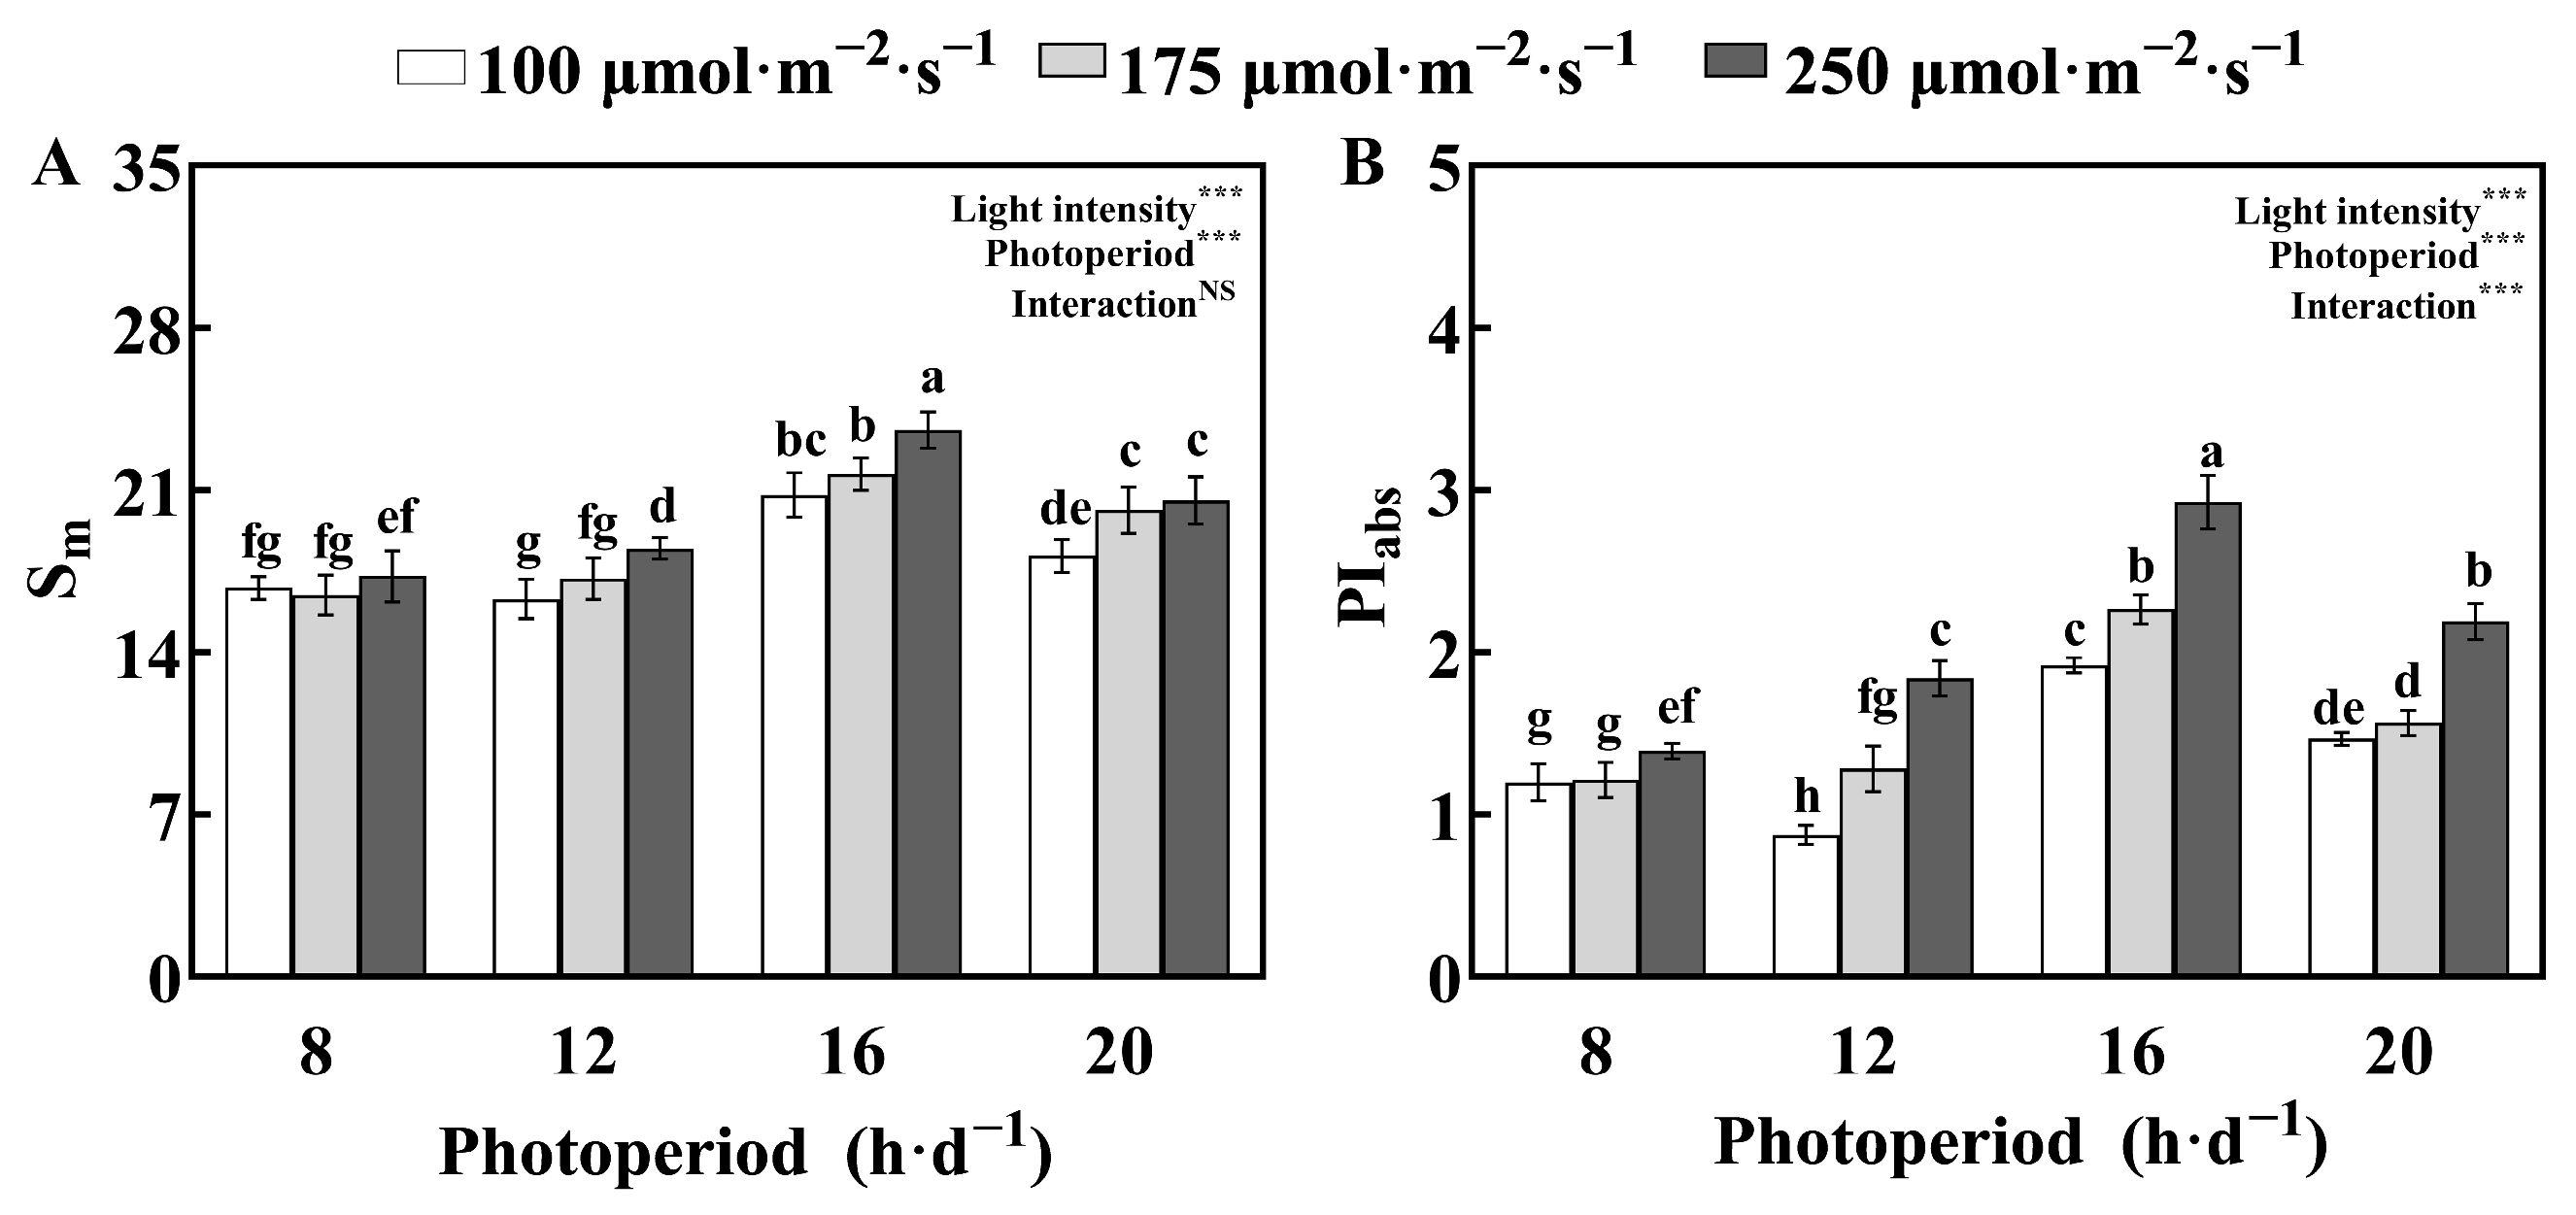
Under the same PPFD, the light energy absorbed per unit leaf area (ABS/CSm) generally increased as the photoperiod was extended from 8 h·d−1 to 16 h·d−1 but then decreased at the 20 h·d−1 photoperiod (Figure 6A). The trend for the efficiency of energy captured by PSII reaction centers (TR/ABS) was dependent on the light intensity: under medium (175 μmol·m−2·s−1) and high (250 μmol·m−2·s−1) PPFD, this efficiency first increased and then decreased with photoperiod extension, peaking at 16 h·d−1; however, under low PPFD (100 μmol·m−2·s−1), the efficiency continuously increased with the extension of the photoperiod (Figure 6B). Within the same photoperiod, the efficiency of electron transport (ET/TR) and the efficiency of electron transfer to the PSI end acceptors (RE/ET) generally increased with increasing PPFD. This trend was particularly evident under the 8 h·d−1, 16 h·d−1, and 20 h·d−1 photoperiods. However, under the 12 h·d−1 photoperiod, the effect of different light intensities on these two parameters was not significant (Figure 6C,D). The density of active reaction centers (RC/CSm) increased significantly with PPFD under short to moderate photoperiods (8–16 h·d−1) but declined under the 20 h·d−1 photoperiod, particularly at high PPFD, indicating a reduction in functional PSII reaction centers (Figure 7). In contrast, the energy fluxes per reaction center (ABS/RC, TR/RC, and ET/RC) decreased with increasing PPFD. Within the same photoperiod, the performance index of PSII (PIabs) and the total driving force for photosynthesis (Sm) increased with PPFD and were highest under the 16–250 treatment (Figure 8).
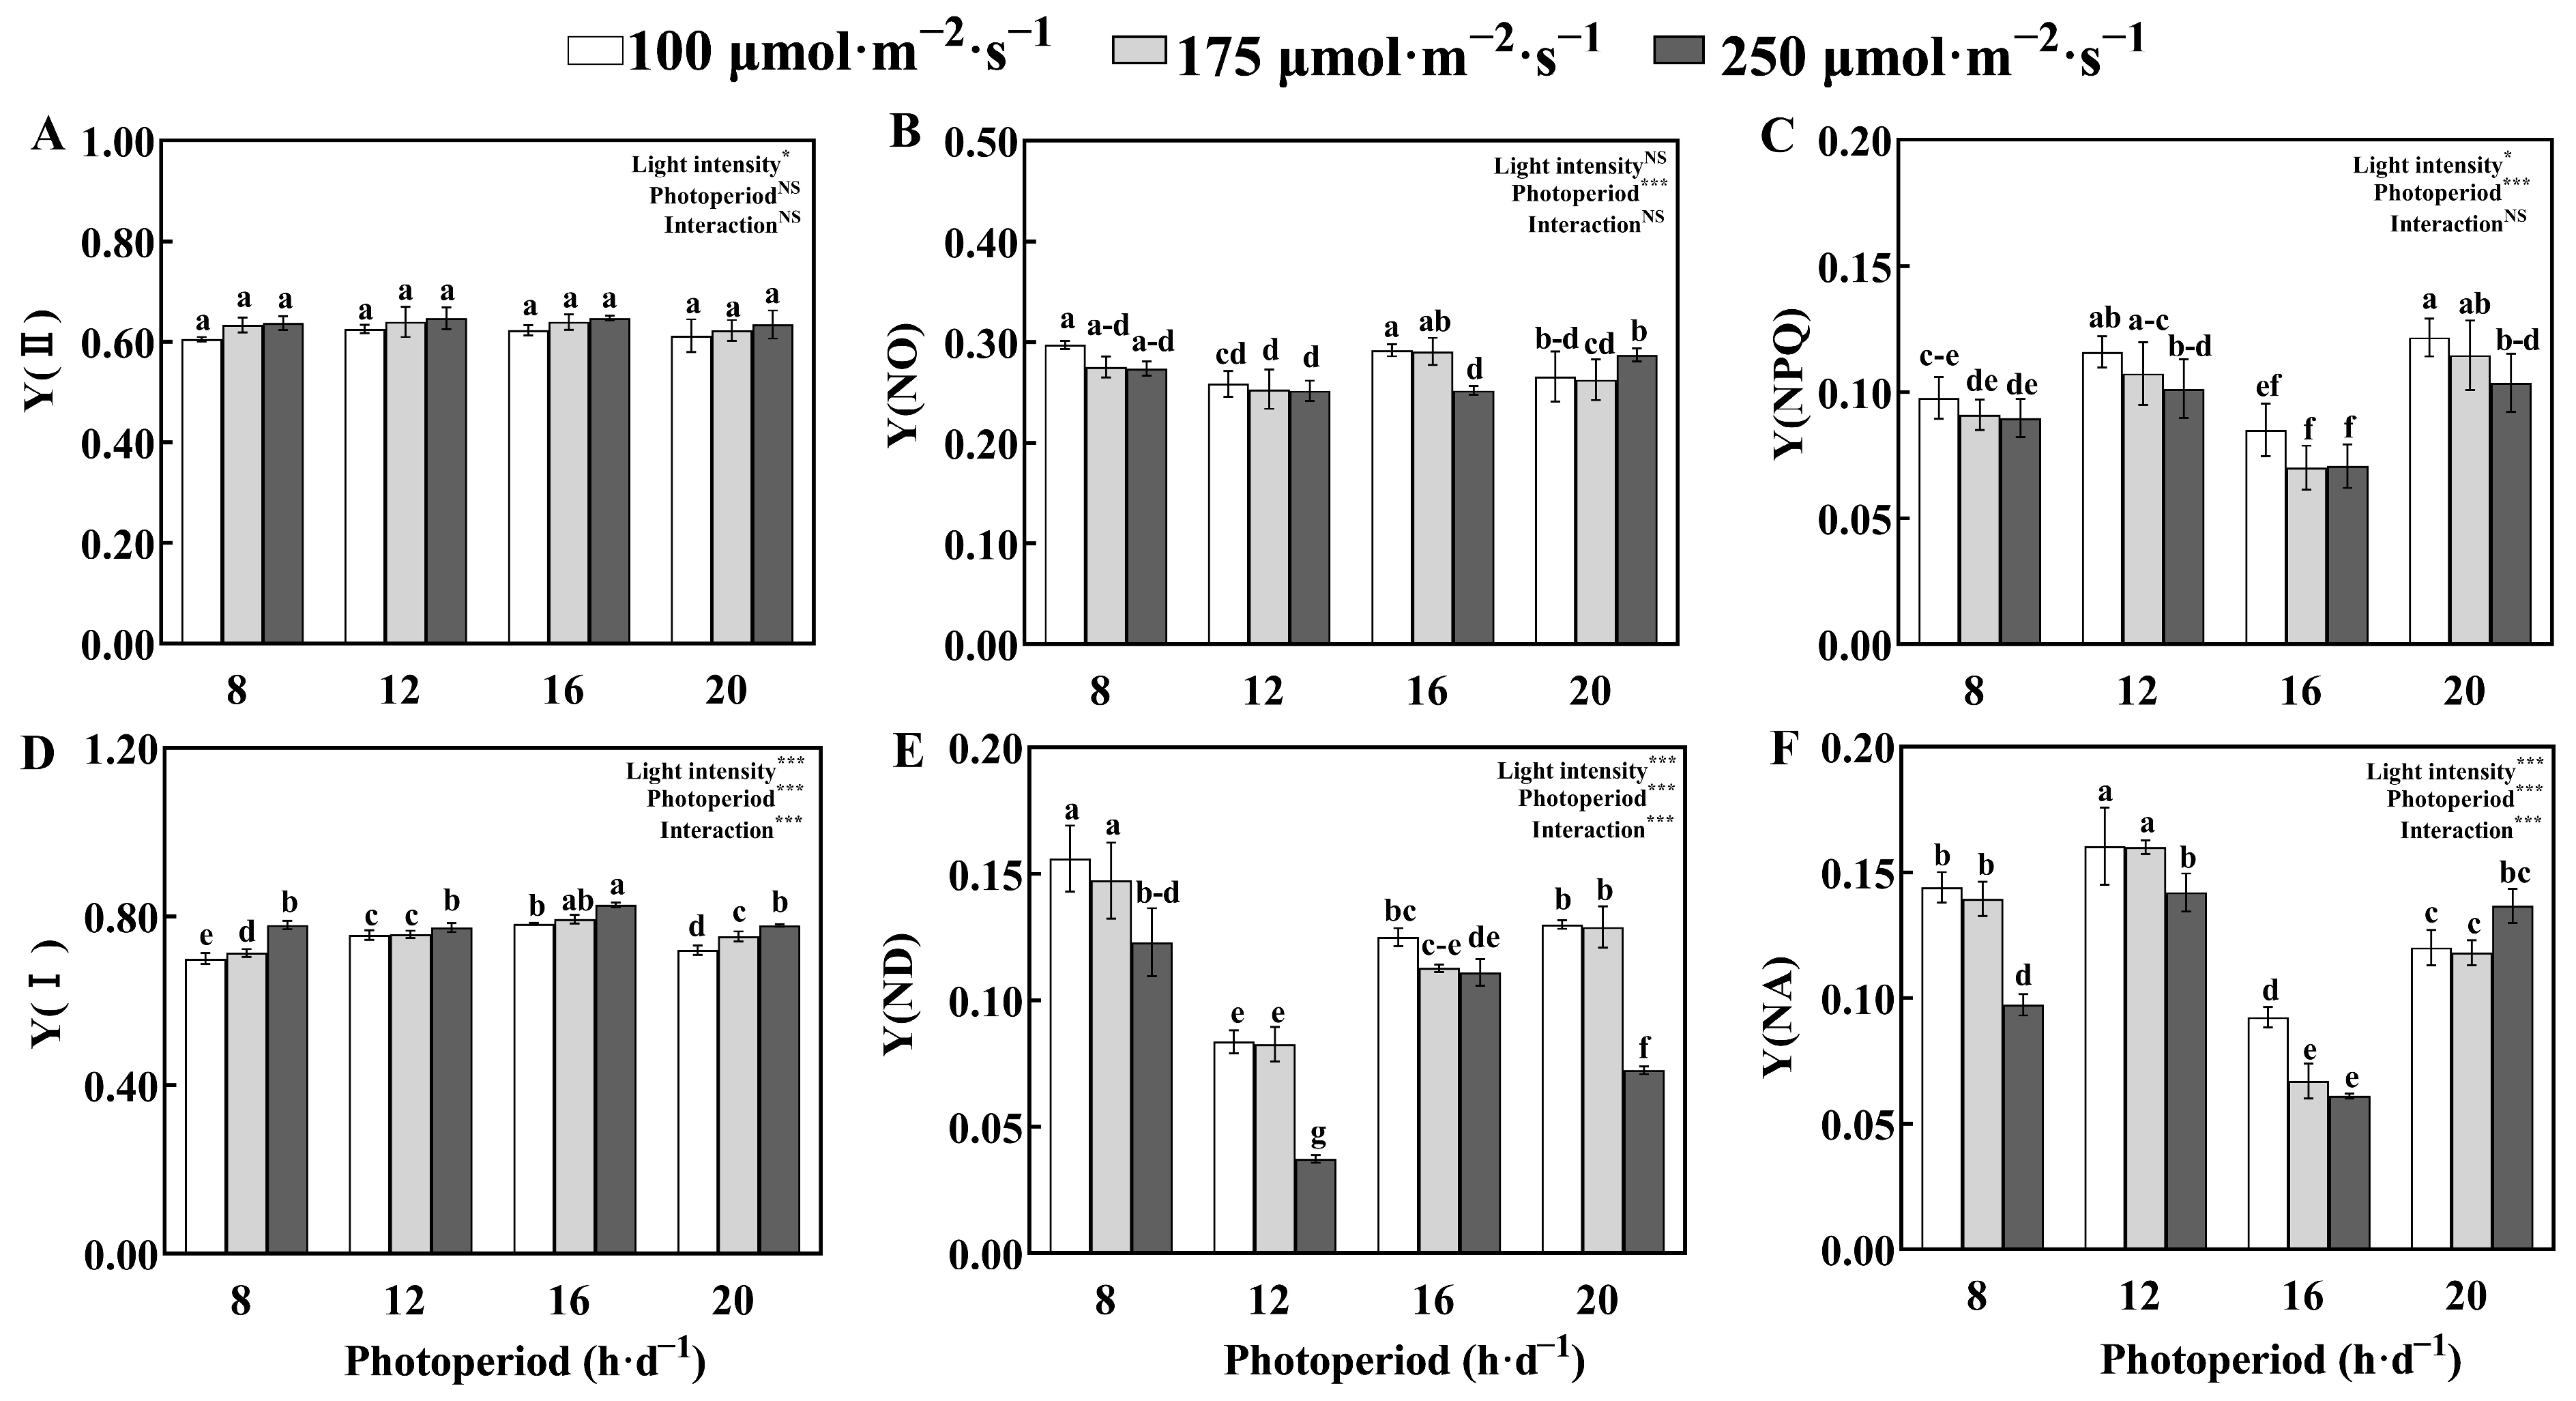
Within the same photoperiod, the effective quantum yield of PSII (Y(II)) showed a slight increase with PPFD, while Y(NPQ) decreased. In contrast, Y(NO) decreased with increasing PPFD in all photoperiods except the 20 h·d−1 photoperiod, indicating reduced non-photochemical quenching and lower regulated thermal dissipation. Similarly, the effective quantum yield of PSI (Y(I)) increased significantly with PPFD and reached its highest value (0.83) under the 16–250 treatment. Concurrently, the limitations of PSI, as reflected by Y(ND) and Y(NA), were alleviated (Figure 9).
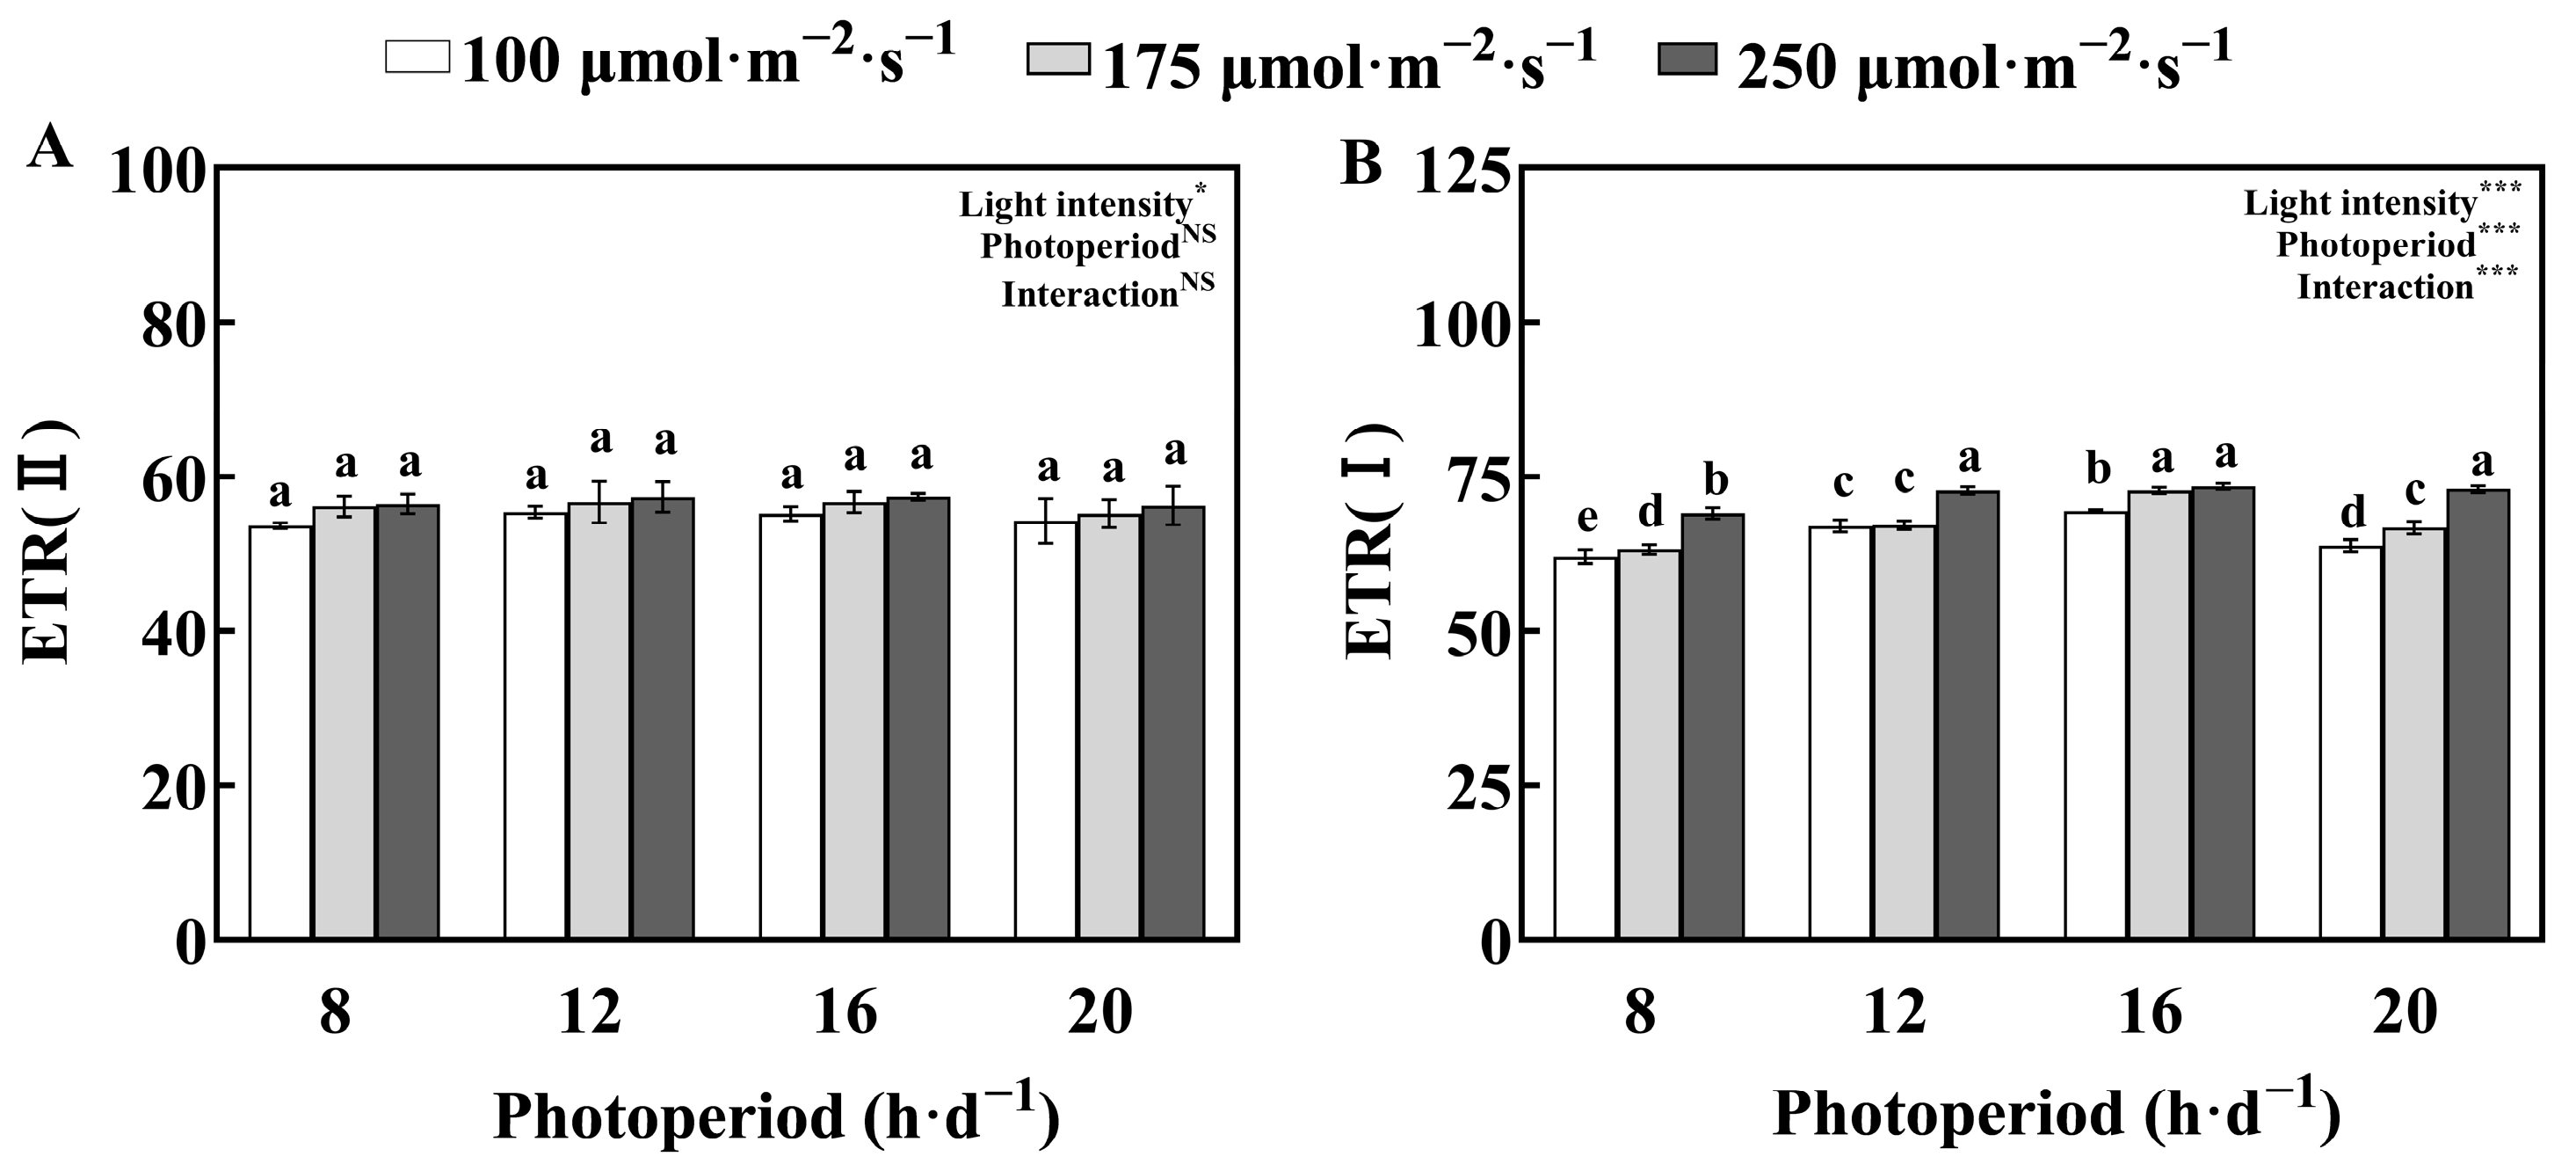
The electron transport rates of PSII (ETR(II)) and PSI (ETR(I)) responded differently to different PPFD and photoperiod combinations (Figure 10). Statistical analysis indicated that ETR(II) was primarily affected by PPFD, whereas ETR(I) was influenced by PPFD, photoperiod, and their interaction.

3.4. Correlation and PCA of Physiological and Fluorescence Parameters of Pakchoi Under the Interactive Effects of Light Intensity and Photoperiod

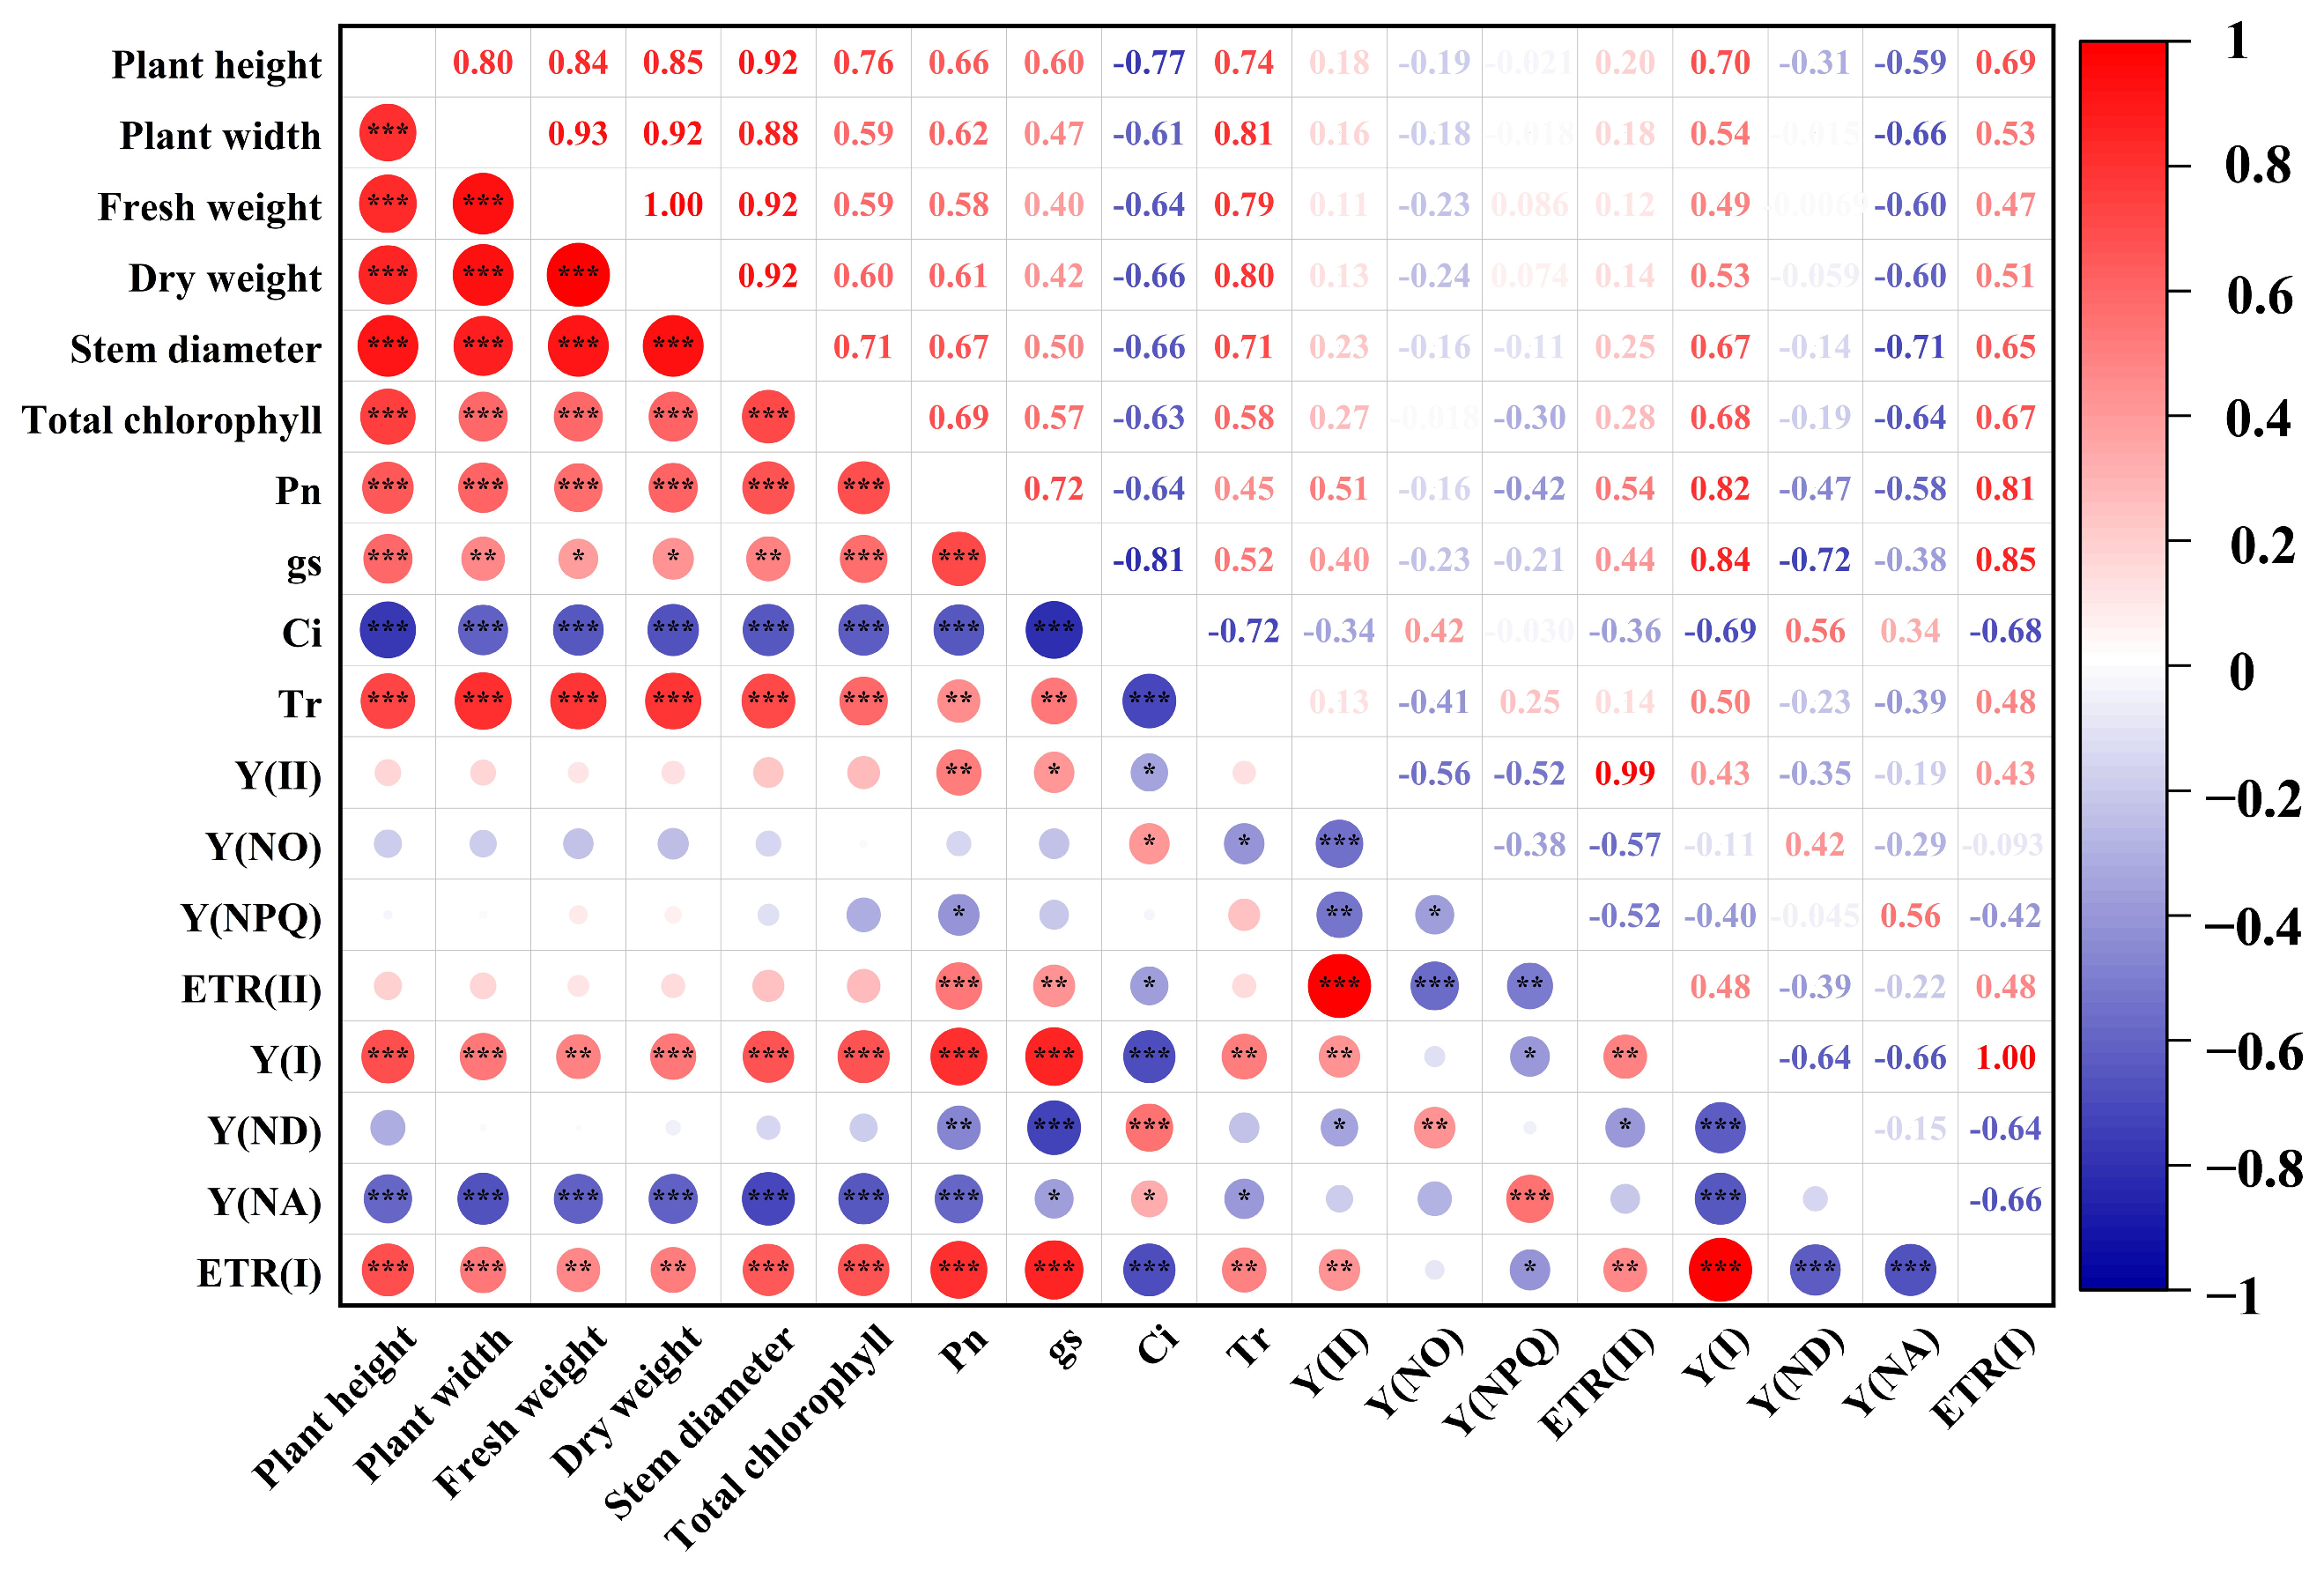
Correlation analysis was conducted to elucidate the relationships among morphological traits, photosynthetic capacity, and photosystem function in Pakchoi under different light intensity and photoperiod combinations (Figure 11). Morphological traits were strongly interrelated, as plant height showed significant positive correlations with plant width, fresh weight, and dry weight, while plant width exhibited even stronger associations with fresh weight and dry weight. These relationships indicate that canopy expansion plays a central role in biomass accumulation under varying light environments.
Photosynthetic parameters also displayed clear coordination. Pn was significantly positively correlated with total chlorophyll content, highlighting the fundamental contribution of chlorophyll to photosynthetic capacity. In addition, gs showed a strong positive correlation with Tr and a negative correlation with Ci, reflecting the regulatory role of stomatal behavior in balancing CO2 assimilation and water loss. Importantly, photosynthetic performance was closely linked to chlorophyll fluorescence characteristics. Pn exhibited significant positive correlation with Y(I) and ETR(I), indicating that enhanced PSI photochemical efficiency is a key driver of photosynthetic productivity. Y(II) was highly positively correlated with ETR(II), demonstrating the tight coupling between PSII photochemical efficiency and electron transport. Among fluorescence parameters, Y(I) was negatively correlated with Y(ND) and Y(NA), suggesting that increased PSI photochemical efficiency is accompanied by reduced donor- and acceptor-side energy dissipation.
Overall, Pakchoi biomass accumulation was closely associated with canopy expansion, chlorophyll content, and stomatal regulation. Photosynthetic rate showed strong associations with PSI/PSII photochemical efficiency and electron transport, while PSI energy dissipation was negatively related to its photochemical efficiency.
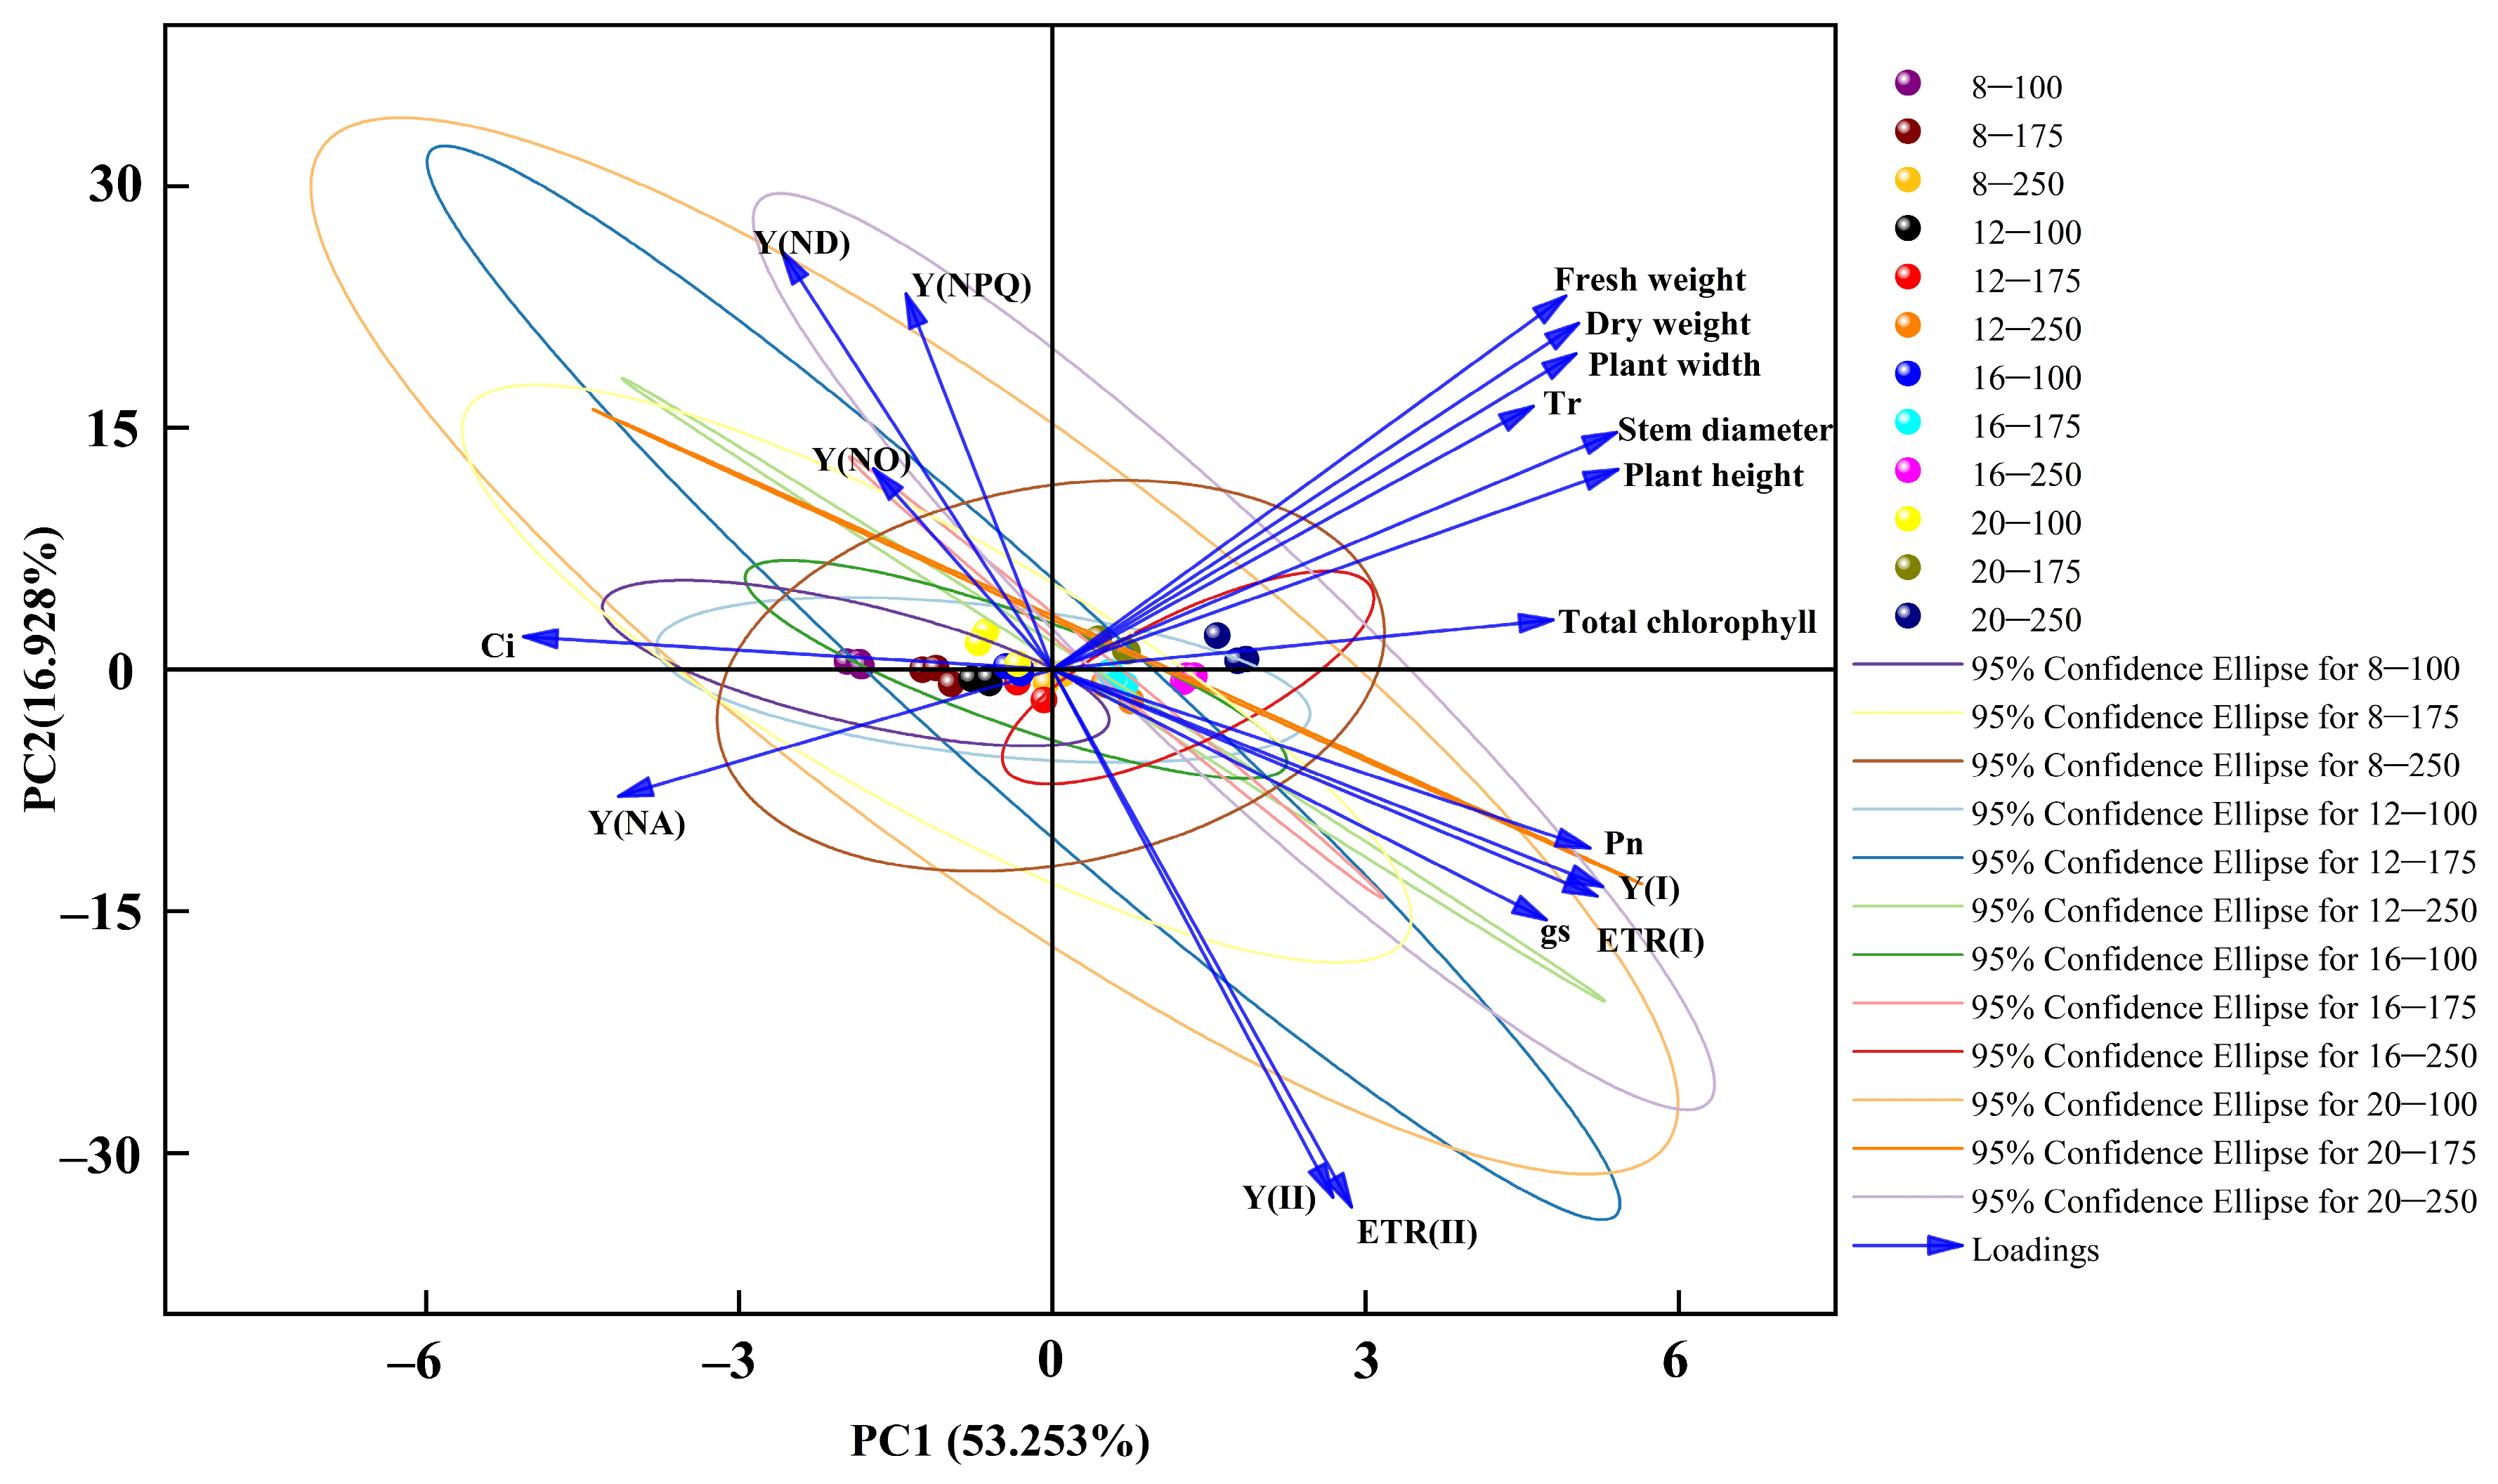
Principal component analysis (PCA) was conducted to characterize the integrated physiological responses of Pakchoi under different light regimes (Figure 12). The first four components exhibited eigenvalues greater than 1 (Supplementary Table S5), collectively accounting for 90.823% of the total variance (Table 4). However, a distinct inflection point (“elbow”) appeared after the second component in the scree plot (Supplementary Figure S1). Therefore, the first two principal components—explaining 70.181% of the cumulative variance—were retained for subsequent interpretation, providing a concise yet robust representation of the variation among treatments.
PC1 is primarily associated with the plant’s growth and photosynthetic capacity. Indicators such as fresh weight, dry weight, plant height, stem diameter, plant width, total chlorophyll, Pn, gs, and Tr all have high positive loadings on PC1, whereas Ci has a negative loading. This suggests that PC1 effectively separates treatments that promote growth from those that inhibit it. PC2 mainly reflects the plant’s strategy for light energy utilization. Y(II) and ETR(II) have negative loadings on PC2, while Y(NPQ) and Y(ND) have positive loadings. This indicates that PC2 distinguishes between different strategies for utilizing light energy for either photosynthesis or heat dissipation (Figure 12).
The patterns elucidated by the PCA are consistent with and supported by the preceding correlation analysis. Specifically, the co-location of multiple morphological and photosynthetic parameters (e.g., fresh weight, plant width, Pn, and gs) with high positive loadings on PC1 aligns with the significant positive correlations identified among these variables. This suggests that PC1 likely represents a composite axis reflecting overall plant productivity. Furthermore, the segregation of variables along the PC2 axis appears to visualize a key physiological trade-off. The opposition between photochemical efficiency indices (Y(II) and ETR(II)) on the negative side and energy dissipation indices (Y(NPQ) and Y(ND)) on the positive side is consistent with the negative correlation observed between these two functional groups. This indicates that PC2 likely represents the balance between light energy utilization for photochemistry and its dissipation via non-photochemical quenching.

4. Discussion

In controlled environments, crop growth depends on the coordination of light intensity, photoperiod, and DLI to achieve efficient resource use. Therefore, understanding plant responses to these factors is essential for developing optimal lighting strategies that balance productivity with energy consumption. Our study demonstrates that Pakchoi growth, photosynthetic performance, and energy-use efficiency are influenced by both light intensity and photoperiod, as well as their interaction. The 20–250 treatment produced the highest biomass (236.75 g fresh weight), while the 20–175 treatment yielded the highest energy efficiency (LUE 9.69% and EUE 4.98%). The 16–250 treatment, on the other hand, showed the greatest photosynthetic efficiency (Amax 32.61 μmol·m−2·s−1), highlighting the varied responses of Pakchoi to different light intensity and photoperiod combinations. These results highlight the trade-off between yield maximization, photosynthetic efficiency, and energy utilization, a key consideration in optimizing plant factory production.

4.1. Trade-Off Mechanism Between Growth and Energy-Use Efficiency

Light intensity, photoperiod, and their interaction significantly influenced the morphogenesis and biomass accumulation of Pakchoi by regulating DLI (Table 1). Under a constant photoperiod, increasing PPFD led to linear increases in plant width, stem diameter, fresh weight, and dry weight, a finding consistent with previous studies on coffee seedlings [26] and spinach [27] that found elevated irradiance enhanced carbon assimilation. The 20–250 treatment, which provided the highest DLI (18 mol·m−2·d−1), resulted in maximum fresh weight and dry weight, consistent with the DLI-driven dry matter accumulation model [28].
However, increasing DLI beyond a certain point did not proportionally enhance energy-use efficiency. Compared to the 20–250 treatment, the 20–175 treatment yielded slightly less biomass but achieved a 7.2% higher LUE, suggesting that moderate DLI levels can improve energy efficiency without significantly compromising yield. This reflects a “diminishing returns” effect under high DLI conditions. This trend is likely attributable to light saturation of photosynthesis and increased investment in photoprotective mechanisms, leading to higher thermal dissipation and reduced photon use efficiency [29], which suggest that excessive light may reduce photon use efficiency due to light saturation and increased thermal dissipation. Therefore, high light intensity–long photoperiod combinations are suitable for high-input systems targeting maximum yield, whereas medium light intensity–long photoperiod combinations are preferable for improving resource use efficiency. This guide provides strategies for optimizing light regimes according to production goals. Although 16–250 had the highest instantaneous photosynthetic efficiency, 20–250 produced more biomass due to its longer photoperiod, which increased total daily carbon gain despite a slightly lower peak efficiency.
Under high light intensity, extending the photoperiod to 20 h·d−1 exerted a moderate inhibitory effect on Pakchoi. This inference is supported by the observed decline in chlorophyll content under the 20–250 treatment: total chlorophyll increased with photoperiod extension up to 16 h·d−1 but decreased when the photoperiod was further prolonged to 20 h. Given the essential role of chlorophyll in light harvesting, this reduction suggests a down-adjustment of light absorption capacity under prolonged high light exposure. Consistent with this observation, photosystem measurements indicate increased photochemical pressure under the 20–250 treatment. The effective quantum yield of PSII showed limited enhancement with increasing PPFD, whereas Y(NPQ) did not show a clear increase with PPFD, suggesting that thermal energy dissipation alone was insufficient to fully alleviate excitation pressure during prolonged illumination. Meanwhile, PSI activity, reflected by Y(I) and ETR(I), was strongly influenced by the interaction between PPFD and photoperiod, indicating an increased reliance on PSI-driven electron transport to maintain photosynthetic balance. Overall, the decline in chlorophyll content and the altered coordination between PSII and PSI under the 20–250 treatment suggest that prolonged photoperiods under high light induce regulatory constraints on photosynthetic stability and carbon assimilation, despite high irradiance. Photoinhibition is generally considered a continuum of plant responses ranging from reversible regulatory down-adjustment to irreversible photodamage, depending on light intensity, duration, and photoprotective capacity [30]. In controlled environments, prolonged exposure to high irradiance has frequently been reported to induce regulatory photoinhibition characterized by enhanced energy dissipation and downregulation of photochemical efficiency, rather than permanent damage to the photosystem. Therefore, the moderate inhibitory effects observed under the 20–250 treatment in this study are interpreted as regulatory and potentially reversible responses associated with sustained excitation pressure, rather than irreversible photosystem damage.
Our results indicated that different combinations of light intensity and photoperiod significantly affected the growth, photosynthetic capacity, and resource use efficiency of Pakchoi and revealed a typical “yield–energy-use efficiency trade-off” phenomenon. Elevated irradiance increased leaf area index and photosynthate production, thereby enhancing yield but also raising energy demand. Consequently, optimizing lighting strategies requires balancing yield, quality, plant biology characteristics, and energy consumption to achieve the maximum comprehensive benefits under different production objectives. Beyond biomass and energy efficiency, the photosynthetic apparatus exhibited dynamic acclimation to varying light environments.

4.2. Dynamic Regulation and Adaptation of the Photosynthetic Apparatus to Light Environment

The chlorophyll content of Pakchoi reached the highest level (Figure 2C) under the 16–250 treatment, indicating that this light environment may promote chlorophyll biosynthesis in Pakchoi [31]. This treatment also elicited the highest photosynthetic capacity, with Amax reaching 32.61 μmol·m−2·s−1 (Table 3) and by concurrent increases in Vcmax (45.83 μmol·m−2·s−1) and Jmax (135.90 μmol·m−2·s−1). This reflects a coordinated enhancement of carbon assimilation and electron transport. This result aligns with previous studies [32], which reported that moderate extensions in total light exposure can optimize carbon assimilation and energy allocation, improving photosystem coordination and crop quality.
Under a moderately extended photoperiod and increased light intensity, Pakchoi exhibited pronounced photosynthetic acclimation. In the 16 h·d−1 photoperiod treatment, Pakchoi exhibited a significantly higher photosynthetic rate and carbon accumulation than those in short photoperiod treatments. Previous studies have suggested that under similar conditions, respiratory substrate consumption does not increase notably [33], which may reflect a greater degree of metabolic stability under these conditions. Long photoperiods have been reported to influence carbon–nitrogen metabolism and photosynthetic enzyme activity [34]. In this study, the increases in Vcmax and Jmax under the 16–250 treatment indicate that a 16 h·d−1 photoperiod under high light enhanced the biochemical capacity for CO2 assimilation through improvements in Rubisco-limited carboxylation and RuBP regeneration. Overall, these results suggest that Pakchoi can achieve efficient coordination of the photosynthetic apparatus and dynamic energy balance through adjustments in carboxylation capacity and RuBP regeneration under appropriate light conditions [35].

4.3. Photochemical Regulation, Photoprotection, and Optimization of Photosystem Function Under Different Light Intensity and Photoperiod Combinations

Numerous previous studies have demonstrated that biomass accumulation and photosynthesis in leafy vegetables are closely related to PPFD, photoperiod, or their integrated form as DLI [9,10]. However, DLI-based approaches implicitly assume that photons delivered at different intensities and durations are physiologically equivalent. By integrating PSI and PSII photochemical performance, OJIP transient analysis, and system-level energy-use efficiency, our study demonstrated that PPFD–photoperiod combinations with comparable DLI can exhibit fundamentally different photochemical regulation strategies and energy-use outcomes. Specifically, moderate PPFD supplied over an extended photoperiod promoted more balanced PSI–PSII coordination and lower excess energy dissipation than high PPFD applied over shorter durations, thereby achieving higher energy-use efficiency. These findings explain why the “moderate light intensity + long photoperiod” strategy cannot be interpreted simply as a DLI effect but rather reflects differences in photochemical regulation and electrical energy utilization.
The chlorophyll fluorescence analyses provided insights into the photochemical regulation underlying the observed growth and photosynthetic responses. Under the 16–250 treatment, OJIP curves and ΔVO–P analysis were consistent with enhanced electron transfer efficiency from QA to the secondary quinone acceptor (QB) and a more rapid turnover of the plastoquinone (PQ) pool, suggesting an increased PSII acceptor-side capacity [36]. The performance of PSI is particularly critical under high light conditions. The relatively high PSI quantum yield, Y(I), and low donor-side limitation, Y(ND), observed under the 16–250 treatment (Figure 9D,E) indicate a well-balanced electron flow from PSII to PSI, thereby avoiding excessive reduction pressure on the PSI donor side. Such optimization of PSI function may be associated with enhanced cyclic electron flow, which has been proposed to contribute to redox balance and photoprotection under high irradiance [37,38].
Under the long photoperiod and high light intensity combination (20–250), increased Y(NO) indicated enhanced passive energy dissipation. This pattern is consistent with regulatory photoinhibition and an increased requirement for photoprotective adjustments reported in previous studies under prolonged illumination [39]. In parallel, the reduction in PIabs suggests a regulatory down-adjustment of photochemical efficiency rather than irreversible PSII damage (Figure 8B) [40,41,42]. Compared with the 16–250 treatment, the shortened dark period under 20–250 likely limited recovery processes, resulting in increased excitation pressure, which is alleviated through enhanced NPQ and cyclic electron flow.
Compared with the 20–250 treatment, the 16–250 treatment exhibited higher Y(I) and lower Y(NA), indicating more efficient and balanced PSI electron flow. The higher Y(I) reflects enhanced photochemical utilization, whereas the lower Y(NA) suggests reduced acceptor-side constraints, facilitating electron transfer to downstream metabolic sinks. These patterns are consistent with models in which cyclic electron flow contributes to PSI redox regulation and overall photosystem coordination [37]. Under excessive light intensity or extended photoperiods, however, PSI may experience increased reduction pressure, elevating the risk of oxidative stress [43].
NPQ under the 20 h·d−1 photoperiod was higher than that under shorter photoperiods, indicating sustained excitation pressure on PSII during prolonged illumination. Increased NPQ represents a photoprotective adjustment that dissipates excess excitation energy and helps maintain photosystem stability [44]. In this context, the significant positive correlations between Pn and both Y(I) and ETR(I) highlight the central role of PSI electron transport in supporting photosynthetic productivity [45]. Overall, these results demonstrate that photochemical regulation and photoprotection differ markedly among light intensity–photoperiod combinations, emphasizing a principle likely applicable to many cultivated species: that optimizing photosystem function is key to improving energy-use efficiency in plant factory systems.

4.4. Limitations and Future Perspectives

The primary limitations of this study are its use of a single Pakchoi cultivar and a fixed light spectrum. We note, however, that the key physiological patterns observed are similar to findings from our related work on other cultivars [46]. Building on this foundation, future research should aim to validate these findings across a wider range of species, optimize light spectra to enhance both yield and nutritional quality, and conduct deeper metabolic investigations to support the development of more dynamic and intelligent lighting strategies.

5. Conclusions

The conclusions of this study offer specific, context-dependent recommendations for Pakchoi cultivation. While a high PPFD (250 μmol·m−2·s−1) combined with a long photoperiod (20 h·d−1) maximized biomass, it came at the cost of low energy efficiency. Therefore, for cultivation strategies where energy efficiency is paramount, we recommend a moderate PPFD (175 μmol·m−2·s−1) with a long photoperiod (20 h·d−1), as this represents the optimal balance between productivity and energy cost. Furthermore, photosynthetic capacity peaked under a 16 h·d−1 photoperiod at high PPFD, indicating that simply extending illumination does not guarantee proportional gains in photosynthetic performance.
Overall, these findings reveal a crucial trade-off between biomass accumulation, photosynthetic efficiency, and energy consumption. By clarifying the synergistic regulation of light intensity and photoperiod on yield and energy use, this study provides a valuable physiological reference for developing energy-saving cultivation strategies for Pakchoi and other leafy vegetables in controlled environments.

Supplementary Materials

The following supporting information can be downloaded at: https://www.mdpi.com/article/10.3390/horticulturae12020215/s1, Table S1: The nutrient solution formula for Pakchoi. Table S2: Formulas for calculating chlorophyll fluorescence parameters. Table S3: Primary fluorescence points from the OJIP curve. Table S4: Performance parameters derived from the JIP-test. Table S5: Eigenvalues from the ‘Total Variance Explained’ table. Figure S1: Scree plot for the principal component analysis.

Author Contributions

Proposed and designed the research, R.L., H.W., Y.J. and X.D.; investigation, R.L., J.C. (Jianwen Chen) and Z.Z.; performed the statistical analyses, R.L. and L.C.; writing—original draft preparation, R.L. and S.W.; writing—review and editing, Y.J. and X.D.; provision of test materials, H.W. and X.D.; supervision, Y.Z., J.C. (Jiawei Cui), C.Z. and C.M.; financial management, Y.J. and X.D. All authors have read and agreed to the published version of the manuscript.

Funding

This research was funded by the Shanghai Agricultural Science and Technology Innovation Project (Grant No. 2024-02-08-00-12-F00042), the Shanghai Academy of Agricultural Sciences, Smart Agriculture Research Center (HUNONGKE CENTER [2025]002), and the Shanghai Key Laboratory of Protected Horticulture Technology (Grant No. KF202503).

Data Availability Statement

The original contributions presented in this study are included in the article and Supplementary Material. Further inquiries can be directed to the corresponding authors.

Conflicts of Interest

The authors declare that they have no known competing financial interests or personal relationships that could have appeared to influence the work reported in this paper.

References

  1. Ali, S.; Liu, Y.; Ishaq, M.; Shah, T.; Abdullah; Ilyas, A.; Din, I.U. Climate change and its impact on the yield of major food crops: Evidence from Pakistan. Foods 2017, 6, 39. [Google Scholar] [CrossRef]
  2. Kozai, T. Sustainable Plant Factory: Closed Plant Production Systems with Artificial Light for High Resource Use Efficiencies and Quality Produce. Acta Hortic. 2013, 1004, 27–40. [Google Scholar] [CrossRef]
  3. Lin, K.H.; Shih, F.C.; Huang, M.Y.; Weng, J.H. Physiological Characteristics of Photosynthesis in Yellow-Green, Green and Dark-Green Chinese Kale (Brassica oleracea L. var. alboglabra Musil.) under Varying Light Intensities. Plants 2020, 9, 960. [Google Scholar] [CrossRef]
  4. Lu, D.; Liu, B.; Ren, M.; Wu, C.; Ma, J.; Shen, Y. Light deficiency inhibits growth by affecting photosynthesis efficiency as well as JA and ethylene signaling in endangered plant Magnolia sinostellata. Plants 2021, 10, 2261. [Google Scholar] [CrossRef]
  5. Song, J.; Huang, H.; Hao, Y.; Song, S.; Zhang, Y.; Su, W.; Liu, H. Nutritional quality, mineral and antioxidant content in lettuce affected by interaction of light intensity and nutrient solution concentration. Sci. Rep. 2020, 10, 2796. [Google Scholar] [CrossRef]
  6. Park, J.E.; Park, Y.G.; Jeong, B.R.; Hwang, S.J. Technology. Growth and anthocyanin content of lettuce as affected by artificial light source and photoperiod in a closed-type plant production system. Korean J. Hortic. Sci. Technol. 2012, 30, 673–679. [Google Scholar] [CrossRef]
  7. Mao, H.; Hang, T.; Zhang, X.; Lu, N. Both multi-segment light intensity and extended photoperiod lighting strategies, with the same daily light integral, promoted Lactuca sativa L. growth and photosynthesis. Agronomy 2019, 9, 857. [Google Scholar] [CrossRef]
  8. Lefsrud, M.G.; Kopsell, D.A.; Kopsell, D.E.; Randle, W.M. Kale carotenoids are unaffected by, whereas biomass production, elemental concentrations, and selenium accumulation respond to, changes in selenium fertility. Agric. Food Chem. 2006, 54, 1764–1771. [Google Scholar] [CrossRef] [PubMed]
  9. Weaver, G.; van Iersel, M.W. Longer photoperiods with adaptive lighting control can improve growth of greenhouse-grown ‘Little Gem’lettuce (Lactuca sativa). HortScience 2020, 55, 573–580. [Google Scholar] [CrossRef]
  10. Saapilin, N.S.; Yong, W.T.L.; Cheong, B.E.; Kamaruzaman, K.A.; Rodrigues, K.F. Physiological and biochemical responses of Chinese cabbage (Brassica rapa var. chinensis) to different light treatments. Chem. Biol. Technol. Agric. 2022, 9, 27. [Google Scholar] [CrossRef]
  11. Wang, S.; Fang, H.; Xie, J.; Wu, Y.; Tang, Z.; Liu, Z.; Lv, J.; Yu, J. Physiological responses of cucumber seedlings to different supplemental light duration of red and blue LED. Front. Plant Sci. 2021, 12, 709313. [Google Scholar] [CrossRef] [PubMed]
  12. Podsędek, A. Natural antioxidants and antioxidant capacity of Brassica vegetables: A review. LWT-Food Sci. Technol. 2005, 40, 1–11. [Google Scholar] [CrossRef]
  13. Genty, B.; Briantais, J.-M.; Baker, N.R. The relationship between the quantum yield of photosynthetic electron transport and quenching of chlorophyll fluorescence. Biochim. Biophys. Acta-Gen. Subj. 1989, 990, 87–92. [Google Scholar] [CrossRef]
  14. Niyogi, K.K. Photoprotection revisited: Genetic and molecular approaches. Annu. Rev. Plant Biol. 1999, 50, 333–359. [Google Scholar] [CrossRef]
  15. Yan, Z.; He, D.; Niu, G.; Zhai, H. Evaluation of growth and quality of hydroponic lettuce at harvest as affected by the light intensity, photoperiod and light quality at seedling stage. Sci. Hortic. 2019, 248, 138–144. [Google Scholar] [CrossRef]
  16. Cui, J.; Zhan, X.; Wang, Q.; Zhang, D.; Li, D.; Li, X.; Gao, L.; Zhu, H.; Chang, L.; Li, J.; et al. Principal Component Analysis and Cluster Analysis of Hydroponic Adaptation Potential in Different Pakchoi (Brassica campestris ssp. Chinensis) Parent Materials. Horticulturae 2025, 11, 822. [Google Scholar] [CrossRef]
  17. Lichtenthaler, H. Chlorophylls and Carotenoids: Pigments of Photosynthetic Biomembranes; Methods in Enzymology; Packer, L., Douce, R., Eds.; Academic Press: New York, NY, USA, 1987. [Google Scholar] [CrossRef]
  18. Farquhar, G.D.; von Caemmerer, S.; Berry, J.A. A biochemical model of photosynthetic CO2 assimilation in leaves of C3 species. Planta 1980, 149, 78–90. [Google Scholar] [CrossRef]
  19. Huang, W.; Yang, Y.-J.; Zhang, S.-B.; Botany, E. Photoinhibition of photosystem I under fluctuating light is linked to the insufficient ΔpH upon a sudden transition from low to high light. Environmental 2019, 160, 112–119. [Google Scholar] [CrossRef]
  20. Strasser, R.J.; Tsimilli-Michael, M.; Qiang, S.; Goltsev, V. Simultaneous in vivo recording of prompt and delayed fluorescence and 820-nm reflection changes during drying and after rehydration of the resurrection plant Haberlea rhodopensis. Biochim. Biophys. Acta-Bioenerg. 2010, 1797, 1313–1326. [Google Scholar] [CrossRef]
  21. Kalaji, H.M.; Jajoo, A.; Oukarroum, A.; Brestic, M.; Zivcak, M.; Samborska, I.A.; Cetner, M.D.; Łukasik, I.; Goltsev, V.; Ladle, R.J. Chlorophyll a fluorescence as a tool to monitor physiological status of plants under abiotic stress conditions. Acta Physiol. Plant. 2016, 38, 102. [Google Scholar] [CrossRef]
  22. Yang, Q.C.; Wei, L.L.; Liu, W.K.; Chen, R.F. Plant Factory Systems and Practices, 2nd ed.; Chemical Industry Press: Beijing, China, 2023; p. 167.
  23. Kozai, T. Resource use efficiency of closed plant production system with artificial light: Concept, estimation and application to plant factory. Proc. Jpn. Acad. Ser. B 2013, 89, 447–461. [Google Scholar] [CrossRef] [PubMed]
  24. Simkin, A.J.; Leepica, K.; Priya Doss, C.G.; Hofmann, T.A.; Tracy, L.; Siva, R. The role of photosynthesis related pigments in light harvesting, photoprotection and enhancement of photosynthetic yield in planta. Photosynth. Res. 2022, 152, 23–42. [Google Scholar] [CrossRef] [PubMed]
  25. Li, Y.-T.; Liang, Y.; Li, Y.-N.; Che, X.-K.; Zhao, S.-J.; Zhang, Z.-S.; Gao, H.-Y. Mechanisms by which Bisphenol A affect the photosynthetic apparatus in cucumber (Cucumis sativus L.) leaves. Sci. Rep. 2018, 8, 4253. [Google Scholar] [CrossRef] [PubMed]
  26. Rodríguez-López, N.F.; Martins, S.C.; Cavatte, P.C.; Silva, P.E.; Morais, L.E.; Pereira, L.F.; Reis, J.V.; Ávila, R.T.; Godoy, A.G.; Lavinski, A.O. Morphological and physiological acclimations of coffee seedlings to growth over a range of fixed or changing light supplies. Environ. Exp. Bot. 2014, 102, 1–10. [Google Scholar] [CrossRef]
  27. Proietti, S.; Paradiso, R.; Moscatello, S.; Saccardo, F.; Battistelli, A. Light intensity affects the assimilation rate and carbohydrates partitioning in spinach grown in a controlled environment. J. Plants 2023, 12, 804. [Google Scholar] [CrossRef]
  28. Kudirka, G.; Viršilė, A.; Laužikė, K.; Sutulienė, R.; Samuolienė, G. Photosynthetic photon flux density effects on Portulaca olearacea in controlled-environment agriculture. Plants 2023, 12, 3622. [Google Scholar] [CrossRef]
  29. Roberto, B.; Luca, D.O. Dissipation of Light Energy Absorbed in Excess: The Molecular Mechanisms. Annu. Rev. Plant Biol. 2021, 72, 47–76. [Google Scholar] [CrossRef]
  30. Luis, Q.J.; Rafael, V.; Teodoro, M.; Regino, Z. Interactions of drought and shade effects on seedlings of four Quercus species: Physiological and structural leaf responses. New Phytol. 2006, 170, 819–833. [Google Scholar] [CrossRef]
  31. Peng, W.; Bernhard, G. Connecting Chlorophyll Metabolism with Accumulation of the Photosynthetic Apparatus. J. Trends Plant Sci. 2021, 26, 484–495. [Google Scholar] [CrossRef]
  32. Feng, L.; Raza, M.A.; Li, Z.; Chen, Y.; Khalid, M.H.B.; Du, J.; Liu, W.; Wu, X.; Song, C.; Yu, L.; et al. The Influence of Light Intensity and Leaf Movement on Photosynthesis Characteristics and Carbon Balance of Soybean. Front. Plant Sci. 2019, 9, 1952. [Google Scholar] [CrossRef]
  33. Le, X.H.; Millar, A.H. The diversity of substrates for plant respiration and how to optimize their use. Plant Physiol. 2023, 191, 2133–2149. [Google Scholar] [CrossRef] [PubMed]
  34. Yin, Z.; Fan, S.; Xia, W.; Zhou, Y.; Zhou, X.; Zhang, X.; Li, C.; Guan, F. Response of growth, metabolism and yield of Dendrocalamopsis oldhami to long-day photoperiod and fertilizer compensation. J. For. Res. 2023, 34, 151–166. [Google Scholar] [CrossRef]
  35. Haque, M.S.; Kjaer, K.H.; Rosenqvist, E.; Ottosen, C.-O. Continuous light increases growth, daily carbon gain, antioxidants, and alters carbohydrate metabolism in a cultivated and a wild tomato species. Front. Plant Sci. 2015, 6, 522. [Google Scholar] [CrossRef] [PubMed]
  36. Strasser, R.J.; Tsimilli-Michael, M.; Srivastava, A. Analysis of the chlorophyll a fluorescence transient. In Chlorophyll a Fluorescence: A Signature of Photosynthesis; Springer: Berlin/Heidelberg, Germany, 2004; pp. 321–362. [Google Scholar]
  37. Suorsa, M.; Järvi, S.; Grieco, M.; Nurmi, M.; Pietrzykowska, M.; Rantala, M.; Kangasjärvi, S.; Paakkarinen, V.; Tikkanen, M.; Jansson, S. PROTON GRADIENT REGULATION5 is essential for proper acclimation of Arabidopsis photosystem I to naturally and artificially fluctuating light conditions. Plant Cell 2012, 24, 2934–2948. [Google Scholar] [CrossRef]
  38. Burlacot, A. Quantifying the roles of algal photosynthetic electron pathways: A milestone towards photosynthetic robustness. New Phytol. 2023, 240, 2197–2203. [Google Scholar] [CrossRef]
  39. Ruban, A.V.; Horton, P. The xanthophyll cycle modulates the kinetics of nonphotochemical energy dissipation in isolated light-harvesting complexes, intact chloroplasts, and leaves of spinach. Plant Physiol. 1999, 119, 531–542. [Google Scholar] [CrossRef]
  40. Kono, M.; Terashima, I. Long-term and short-term responses of the photosynthetic electron transport to fluctuating light. J. Photochem. Photobiol. B Biol. 2014, 137, 89–99. [Google Scholar] [CrossRef]
  41. Horton, P.; Ruban, A.; Walters, R. Regulation of light harvesting in green plants. Annu. Rev. Plant Biol. 1996, 47, 655–684. [Google Scholar] [CrossRef]
  42. Demmig-Adams, B.; Adams, W.W., III. Photoprotection and other responses of plants to high light stress. Annu. Rev. Plant Biol. 1992, 43, 599–626. [Google Scholar] [CrossRef]
  43. Lima-Melo, Y.; Alencar, V.T.; Lobo, A.K.; Sousa, R.H.; Tikkanen, M.; Aro, E.-M.; Silveira, J.A.; Gollan, P.J. Photoinhibition of photosystem I provides oxidative protection during imbalanced photosynthetic electron transport in Arabidopsis thaliana. Front. Plant Sci. 2019, 10, 916. [Google Scholar] [CrossRef]
  44. Zuo, G. Non-photochemical quenching (NPQ) in photoprotection: Insights into NPQ levels required to avoid photoinactivation and photoinhibition. New Phytol. 2025, 246, 1967–1974. [Google Scholar] [CrossRef]
  45. Suorsa, M.; Rossi, F.; Tadini, L.; Colombo, M.; Jahns, P.; Kater, M.M.; Leister, D.; Finazzi, G.; Aro, E.-M.; Barbato, R. PGR5-PGRL1-dependent cyclic electron transport modulates linear electron transport rate in Arabidopsis thaliana. Mol. Plant 2016, 9, 271–288. [Google Scholar] [CrossRef]
  46. Zhang, D.; Cui, J.; Miao, C.; Li, X.; Zhan, X.; Wang, Q.; Zhang, H.; Ding, X. Effects of different photoperiods on growth, quality, and photosynthetic parameters of pakchoi in artificial light plant factories. Acta Agric. Shanghai 2025, 41, 57–68. [Google Scholar] [CrossRef]
Figure 1. Effects of different light intensity and photoperiod combinations on LUE, EUE, and energy consumption of Pakchoi. (A) EUE under different light intensities and photoperiods. (B) LUE under different light intensities and photoperiods. (C) Correlation analysis between fresh weight and LUE and EUE. (D) Radar chart showing the comprehensive performance of fresh weight, LUE, and EUE under different treatments. (E) Lighting energy consumption per unit yield (kWh·kg−1) under different treatments. (F) Total electrical energy consumption (kWh) under different treatments. Data are presented as means ± SD (n = 3). Different letters indicate significant differences (p < 0.05) according to Duncan’s multiple range test.
Horticulturae 12 00215 g001
Figure 2. Effects of different light intensity and photoperiod combinations on chlorophyll a (A), chlorophyll b (B), and total chlorophyll contents (C) in Pakchoi measured 14 days after treatment. Vertical error bars represent standard deviations. Interaction denotes the interaction between light intensity and photoperiod. ** and *** indicate significance at p < 0.01 and p < 0.001 levels, respectively. Data are presented as means ± SD (n = 3). Different letters indicate significant differences (p < 0.05) according to Duncan’s multiple range test.
Horticulturae 12 00215 g002
Figure 3. Effects of different light intensity and photoperiod combinations on the photosynthesis of Pakchoi, measured 14 days after treatment. (A) Pn (net photosynthetic rate), (B) gs (stomatal conductance), (C) Ci (intercellular CO2 concentration), and (D) Tr (transpiration rate). Vertical error bars represent standard deviations. Interaction denotes the interaction between light intensity and photoperiod. ** and *** indicate significance at p < 0.01 and p < 0.001 levels, respectively. Data are presented as means ± SD (n = 3). Different letters indicate significant differences (p < 0.05) according to Duncan’s multiple range test.
Horticulturae 12 00215 g003
Figure 4. Effects of different light intensity and photoperiod combinations on CO2 response curves of Pakchoi leaves measured using the LI-6400XT system at 14 days after treatment. (AD) correspond to photoperiods of 8, 12, 16, and 20 h·d−1, respectively. In each subfigure, the colored curves represent light intensities of 100, 175, and 250 μmol·m−2·s−1. Pn, net photosynthetic rate; CO2, carbon dioxide concentration. Data are presented as means ± SD (n = 3).
Horticulturae 12 00215 g004
Figure 5. Effects of different light intensity and photoperiod combinations on normalized OJIP (VO–P) curves and ΔVO–P curves of Pakchoi. (A) Normalized OJIP (VO–P) curves. O, J, I, and P represent characteristic phases of the chlorophyll fluorescence induction process, reflecting dynamic changes in the photosynthetic electron transport chain and photosynthetic machinery. (B) ΔVO–P curves. Different colored curves represent different light intensity photoperiod combinations. The vertical dashed lines indicate the characteristic time points for the J-step (at 2 ms) and the I-step (at 30 ms). Data are presented as means ± SD (n = 3).
Horticulturae 12 00215 g005
Figure 6. Effects of different light intensity and photoperiod combinations on PSII light absorption and energy transfer efficiency of Pakchoi. (A) Light energy absorbed per unit leaf area (ABS/CSm). (B) Efficiency of light energy absorbed by the antennae captured by PSII reaction centers (TR/ABS). (C) Efficiency of energy captured by reaction centers entering the electron transport chain (ET/TR). (D) Efficiency of electrons transported through the electron transport chain to the PSI end (RE/ET). Vertical error bars represent standard deviations. Interaction denotes the interaction between light intensity and photoperiod. *, **, and *** indicate significance at p < 0.05, p < 0.01, and p < 0.001 levels, respectively. NS denotes no significant difference. Data are presented as means ± SD (n = 3). Different letters indicate significant differences (p < 0.05) according to Duncan’s multiple range test.
Horticulturae 12 00215 g006
Figure 7. Effects of different light intensity and photoperiod combinations on PSII reaction center density and energy transfer efficiency of Pakchoi. (A) Density of active reaction centers (RC/CSm). (B) Energy absorbed per reaction center (ABS/RC). (C) Energy trapped per reaction center (TR/RC). (D) Electron transport per reaction center (ET/RC). Vertical error bars represent standard deviations. Interaction denotes the interaction between light intensity and photoperiod. *** indicate significance at p < 0.001 levels. NS denotes no significant difference. Data are presented as means ± SD (n = 3). Different letters indicate significant differences (p < 0.05) according to Duncan’s multiple range test.
Horticulturae 12 00215 g007
Figure 8. Effects of different light intensity and photoperiod combinations on PSII performance parameters of Pakchoi. (A) Energy required to fully reduce QA (Sm). (B) PSII performance index based on absorbed light energy (PIabs). Vertical error bars represent standard deviations. Interaction denotes the interaction between light intensity and photoperiod. *** indicate significance at p < 0.001 levels. NS denotes no significant difference. Data are presented as means ± SD (n = 3). Different letters indicate significant differences (p < 0.05) according to Duncan’s multiple range test.
Horticulturae 12 00215 g008
Figure 9. Effects of different light intensity and photoperiod combinations on energy allocation in PSII and PSI of Pakchoi. (A) Y(II), actual PSII photochemical quantum yield. (B) Y(NO), quantum yield of PSII non-regulated energy dissipation. (C) Y(NPQ), quantum yield of PSII regulated thermal dissipation. (D) Y(I), PSI photochemical quantum yield. (E) Y(ND), PSI donor-side heat dissipation efficiency. (F) Y(NA), PSI acceptor-side heat dissipation efficiency. Vertical error bars represent standard deviations. Interaction denotes the interaction between light intensity and photoperiod. * and *** indicate significance at p < 0.05 and p < 0.001 levels, respectively. NS denotes no significant difference. Data are presented as means ± SD (n = 3). Different letters indicate significant differences (p < 0.05) according to Duncan’s multiple range test.
Horticulturae 12 00215 g009
Figure 10. Effects of different light intensity and photoperiod combinations on electron transport rates of Pakchoi. (A) ETR(II), electron transport rate of PSII. (B) ETR(I), electron transport rate of PSI. Vertical error bars represent standard deviations. Interaction denotes the interaction between light intensity and photoperiod. * and *** indicate significance at p < 0.05 and p < 0.001 levels, respectively. NS denotes no significant difference. Data are presented as means ± SD (n = 3). Different letters indicate significant differences (p < 0.05) according to Duncan’s multiple range test.
Horticulturae 12 00215 g010
Figure 11. Effects of different light intensity and photoperiod combinations on growth, photosynthetic, and chlorophyll fluorescence parameters of Pakchoi. The size of the circles represents the strength of the correlation, and color indicates direction (red = positive; blue = negative). *, **, and *** indicate significance at p < 0.05, p < 0.01, and p < 0.001 levels, respectively.
Horticulturae 12 00215 g011
Figure 12. Effects of different light intensity and photoperiod combinations on PCA of Pakchoi. PC1 and PC2 explain 70.181% of the total variance (PC1: 53.253%; PC2: 16.928%). Blue arrows represent variable loadings, and the symbols indicate the scores of each treatment group.
Horticulturae 12 00215 g012
Table 1. Light intensity, photoperiod, and DLI value of each treatment in the experiment.
TreatmentLight Intensity
(μmol·m−2·s−1)
Photoperiod
(h·d−1)
DLI
(mol·m−2·d−1)
8–10010082.88
12–100124.32
16–100165.76
20–100207.2
8–17517585.04
12–175127.56
16–1751610.08
20–1752012.6
8–25025087.2
12–2501210.8
16–2501614.4
20–2502018
Table 2. Effects of light intensity and photoperiod combinations on growth traits of Pakchoi.
Photoperiod
(h·d−1)
Light Intensity
(μmol·m−2·s−1)
Plant Height (cm)Plant Width (cm)Stem Diameter (mm)Fresh Weight (g)Dry Weight
(g)
810010.37 h ± 0.3826.33 i ± 1.056.95 i ± 0.2627.74 j ± 1.401.49 i ± 0.15
17511.17 g ± 0.2533.60 g ± 1.117.67 gh ± 0.1843.36 i ± 3.172.26 h ± 0.16
25011.50 g ± 0.2637.77 cd ± 0.818.64 f ± 0.1180.51 f ± 1.644.36 e ± 0.13
1210011.37 g ± 0.1530.60 h ± 0.447.11 hi ± 0.4030.92 j ± 1.351.73 i ± 0.02
17512.50 f ± 0.4032.73 g ± 0.218.31 fg ± 0.4053.79 h ± 2.473.11 g ± 0.06
25013.20 de ± 0.1034.07 fg ± 0.3810.25 de ± 0.3781.53 f ± 2.745.19 d ± 0.34
1610012.17 f ± 0.2535.20 ef ± 2.019.71 e ± 0.2562.80 g ± 2.653.57 f ± 0.31
17513.37 cd ± 0.1538.00 cd ± 0.6110.53 d ± 0.5194.15 e ± 1.885.49 d ± 0.03
25014.00 b ± 0.1738.37 c ± 0.6711.33 c ± 0.55128.98 c ± 1.747.43 c ± 0.55
2010012.73 ef ± 1.0136.57 de ± 0.969.61 e ± 0.5999.65 d ± 4.405.46 d ± 0.14
17513.93 bc ± 0.2543.37 b ± 0.5512.02 b ± 0.57192.75 b ± 3.5311.26 b ± 1.07
25014.63 a ± 0.2146.93 a ± 1.4613.05 a ± 0.58236.75 a ± 2.8914.19 a ± 0.53
Light intensity***************
Photoperiod***************
InteractionNS***********
Note: Data are presented as means ± SD (n = 3), measured 20 days after treatment. Within each column, means followed by different lowercase letters are significantly different (p < 0.05). “Light intensity”, “Photoperiod”, and “Interaction” represent the results from a two-way ANOVA. For these ANOVA effects, ** and *** indicate significance at the p < 0.01 and p < 0.001 levels, respectively; NS indicates no significant difference.
Table 3. Effects of different light intensity and photoperiod combinations on CO2 response curve fitted parameters of Pakchoi.
Photoperiod
(h·d−1)
Light Intensity
(μmol·m−2·s−1)
αAmax
(μmol·m−2·s−1)
Γ
(μmol·mol−1)
Vcmax
(μmol·m−2·s−1)
Jmax
(μmol·m−2·s−1)
81000.052 g ± 0.00218.13 h ± 1.3559.04 bc ± 1.1227.20 ef ± 3.0276.33 fg ± 7.15
1750.060 f ± 0.00319.18 g ± 1.4659.04 bc ± 2.2225.57 f ± 2.4672.17 g ± 7.5
2500.063 ef ± 0.00321.31 e ± 1.7261.43 a ± 0.66 29.73 de ± 2.0585.20 ef ± 5.81
121000.062 ef ± 0.00620.44 f ± 0.4259.39 b ± 1.3823.90 f ± 0.9267.30 g ± 2.55
1750.073 de ± 0.00123.31 d ± 0.6651.43 f ± 0.7135.60 c ± 1.87101.97 cd ± 5.85
2500.088 c ± 0.00525.86 cd ± 1.7056.41 de ± 1.5133.00 cd ± 0.6995.30 de ± 2.76
161000.075 d ± 0.003 25.37 cd ± 0.9857.38 cd ± 0.4335.27 c ± 1.20102.83 cd ± 3.51
1750.097 ab ± 0.00526.14 cd ± 1.7555.29 e ± 0.4539.80 b ± 2.69117.40 b ± 8.60
2500.102 a ± 0.00732.61 a ± 1.5058.27 bc ± 0.9545.83 a ± 3.42135.90 a ± 8.15
201000.095 b ± 0.00527.11 bc ± 1.1355.38 e ± 1.5834.33 c ± 2.25102.77 cd ± 7.56
1750.100 ab ± 0.00428.25 b ± 0.53 56.44 de ± 1.0136.37 bc ± 2.58107.70 bc ± 6.83
2500.102 a ± 0.00926.77 cd ± 1.5355.29 e ± 0.0239.53 b ± 2.83116.43 b ± 8.97
Light intensity***************
Photoperiod***************
Interaction*****NS******
Note: Data are presented as means ± SD (n = 3), measured 14 days after treatment. Within each column, means followed by different lowercase letters are significantly different (p < 0.05). “Light intensity”, “Photoperiod”, and “Interaction” represent the results from a two-way ANOVA. For these ANOVA effects, ** and *** indicate significance at the p < 0.01 and p < 0.001 levels, respectively; NS indicates no significant difference.
Table 4. PCA of Pakchoi under different light intensity and photoperiod combinations: component loadings and explained variance.
Component
1234
Plant height0.895
Stem diameter0.892
Y(I)0.871
ETR(I)0.862
Pn0.850
Ci−0.837
Dry weight0.8330.469
Plant width0.8280.428
Fresh weight0.8120.506
Total chlorophyll0.792
gs0.782
Tr0.760
Y(NA)−0.687 −0.636
ETR(II)0.473−0.728 0.486
Y(II)0.444−0.715 0.526
Y(ND)−0.4280.5660.4370.506
Y(NO) 0.807
Y(NPQ) 0.509−0.780
Variance contribution rate (%)53.25316.92812.5078.135
Cumulative contribution rate (%)53.25370.18182.68890.823
Disclaimer/Publisher’s Note: The statements, opinions and data contained in all publications are solely those of the individual author(s) and contributor(s) and not of MDPI and/or the editor(s). MDPI and/or the editor(s) disclaim responsibility for any injury to people or property resulting from any ideas, methods, instructions or products referred to in the content.