Article

Day/Night Temperature Treatments Induced Alterations in the Process of Flower Bud Differentiation and Floral Coloration in Dahlia


1
College of Horticulture, Hebei Agriculture University, Lekai South Street 2596, Baoding 071000, China
2
Baoding Dongfeng Park, Baoding 071030, China
*
Authors to whom correspondence should be addressed.
Horticulturae 2026, 12(10), 1246; https://doi.org/10.3390/horticulturae12101246
Submission received: 12 August 2026 / Revised: 30 September 2026 / Accepted: 1 October 2026 / Published: 7 October 2026

Abstract

Temperature is a key determinant of flowering time and floral pigmentation in plants, and dahlia (Dahlia pinnata) is particularly sensitive to thermal changes in its flower color. This study investigated how day/night temperature regimes regulate flower bud differentiation and coloration in the potted cultivar ‘Hypnotica Tropical Breeze’. Five temperature treatments (15/5, 20/10, 25/15, 30/20, and 35 °C/25 °C) were applied, and flower bud differentiation progression, colorimetric traits, and pigmentation-related differentially expressed genes were assessed. The 15/5, 20/10, and 25 °C/15 °C treatments all allowed successful bud differentiation and flowering, yet the duration varied considerably—46 days at 20 °C/10 °C and 41 days at 25 °C/15 °C versus 100 days at 15 °C/5 °C. Among these three regimes, 20 °C/10 °C gave the highest a* (red–green axis, positive = red) and lowest b* (yellow–blue axis, positive = yellow) at the ray floret tips. Moreover, the relative flavonoid and anthocyanin indices, as well as soluble sugar and starch contents, were all highest at 20 °C/10 °C and lowest at 15 °C/5 °C, with significant differences across treatments. Transcriptomic analysis revealed pronounced differential expression of anthocyanin-biosynthetic genes (CHI2, F3H, DFR, ANS, UFGT) and transcription factors (bHLH, MYB) among the three temperature groups. In particular, UFGT transcript abundance was lowest at 15 °C/5 °C, and FNSII expression was also reduced under this regime relative to 20 °C/10 °C. Together, these findings indicate that day/night temperature regimes are linked to bud differentiation and color development in dahlia, together with shifts in sugar metabolism and pigment-related gene expression.

1. Introduction

Flower bud differentiation is a critical developmental phase in which plants transition from vegetative to reproductive growth. This process involves complex morphological changes at the growing point and a series of physiological and metabolic activities, ultimately determining the formation of floral organs, flowering time, flower number, and flowering quality [1]. Flower bud differentiation is regulated by multiple internal and external factors, among which temperature is a key environmental factor that profoundly influences the flowering process by altering nutrient contents, hormone balances, and enzyme activities in plants [2]. However, the temperature response varies significantly among plant species. In some plants, low-temperature induction is an essential condition for flowering. For example, sustained low-temperature exposure significantly accelerated flower bud differentiation in Dendrobium, advancing flowering by nearly one month compared to plants under standard growth conditions [3]; inflorescence differentiation in Phalaenopsis aphrodite required at least 15 days of low-temperature induction [4]; under low temperatures (approximately 10–20 °C), flower bud formation in Nicotiana tabacum var. Virginica was markedly accelerated [5]. Similarly, low temperature significantly promoted flower bud differentiation in strawberry (Fragaria × ananassa), advancing the appearance of buds, flowering, and fruiting stages [6]. Sweet cherry treated at 12–15 °C flowered earlier than those at 21 °C, with faster bud differentiation [7]. Conversely, other species require moderate warmth to initiate differentiation: flower bud induction in tulip bulbs depends on relatively high ambient temperature, and 18 °C has been identified as a critical temperature for this process [8], whereas 5 °C inhibits bud differentiation and normal floral organ formation [9]; Narcissus tazetta requires 25 °C for a successful floral transition [10]. Unsuitable temperatures may cause bud abortion, pollen sterility, and other problems [11]. Thus, temperature regulation of flower bud differentiation is species-specific, and both the direction (chilling versus warming) and intensity of the temperature signal determine flowering success and quality.
Beyond flower bud differentiation, temperature is also recognized as a critical factor influencing flower color, mainly through the regulation of anthocyanin biosynthesis pathways [12]. Anthocyanins are the primary pigments determining floral color, and their biosynthesis involves multiple enzymatic reactions encoded by structural genes: chalcone synthase (CHS), chalcone isomerase (CHI), flavanone 3-hydroxylase (F3H), flavonoid 3’-hydroxylase (F3’H), and flavonoid 3’,5’-hydroxylase (F3’5’H); downstream structural genes include dihydroflavonol 4-reductase (DFR), anthocyanidin synthase (ANS), and UDP-glucose flavonoid-3-O-glucosyltransferase (UFGT) [13]. The expression of these structural genes is regulated by MYB transcription factors (TFs) or the MBW complex composed of MYB, bHLH, and WD proteins [14].
Studies have shown that low temperature generally promotes anthocyanin accumulation and the expression of related genes, while high temperature suppresses synthesis and even accelerates degradation [15]. For example, in strawberry at 4 °C, ANS, UFGT, and MYB10 were upregulated, and anthocyanin and proanthocyanidin accumulation increased [16]; in gerbera (Gerbera jamesonii), CHS1 and MYB1 were upregulated at 6 °C, with increased anthocyanin content [17]. In contrast, in chrysanthemum (Chrysanthemum morifolium) under heat stress, the transcription factor CmMYB012 inhibited CmDFR, CmANS, and CmUFGT expression, blocking anthocyanin synthesis [18]; in apple (Malus profusion), high temperature significantly downregulated MpCHS and other series genes, suppressing pigment accumulation [19]. Most of these studies, however, have examined extreme or constant temperatures [20]; the effects of different day/night temperature regimes on flower bud differentiation and subsequent color quality remain poorly understood.
Dahlia (Dahlia pinnata Cav.) is a tuberous herbaceous flower of the family Asteraceae with high ornamental and economic value. In China, it is widely grown as both potted plants and cut flowers in greenhouses in Yunnan [21,22], Shandong and Guangdong provinces [23]. Dahlia thrives in cool, well-ventilated conditions at approximately 15–25 °C, whereas temperatures above 30 °C induce semi-dormancy and poor flowering [23].
Flowering time and flower color are primary determinants of product grade, commercial value, and marketing window. Although dahlias display rich and vivid colors, growers in China have observed that plants of the same cultivar grown simultaneously in different locations can differ markedly in flower color. Previous work showed that the dark-red cultivar ‘Nessho’ fades toward orange from autumn to spring when the minimum temperature falls below 10 °C [24]. Muthamia et al. (2024) further reported that flavonoid accumulation is higher in orange-fading ray florets than in deep-red florets, that upregulation of the flavone synthase gene DvFNS is closely associated with this elevated flavonoid accumulation, and that DvFNS expression is higher in winter than in summer [25]. Nevertheless, the effects of temperature on flower bud differentiation and flower color in dahlia remain poorly documented. In this study, the potted cultivar ‘Hypnotica Tropical Breeze’ was subjected to different day/night temperature treatments to examine the effects of temperature on flower bud differentiation and flower color, providing a reference for flowering regulation, color breeding and color-quality improvement, and temperature management for protected dahlia production and marketing.

2. Materials and Methods

2.1. Experimental Design

The experiment was conducted at Hebei Agricultural University (115°28′57″ E, 38°50′59″ N). Potted cuttings of dahlia (Dahlia pinnata) cv. ‘Hypnotica Tropical Breeze’ were used as the plant material. In early March, the cuttings were potted in plastic pots (upper diameter, 14 cm; lower diameter, 10 cm; height, 12 cm) filled with a substrate of peat and perlite (3:1, v/v). Two weeks later, healthy, uniformly growing plants free of pests and diseases were selected, and their apical buds were removed to initiate the experiment.
Five day/night temperature regimes were established: 15 °C/5 °C, 20 °C/10 °C, 25 °C/15 °C, 30 °C/20 °C, and 35 °C/25 °C (day/night). Plants were placed in RLD1000E4DW intelligent light incubators (Ningbo Lede Instrument Manufacturing Co., Ltd., Ningbo, China), with three incubators per temperature treatment. For each treatment, plants were distributed equally among the three incubators, yielding three independent biological replicates of approximately 24 plants each (one replicate per incubator). The photoperiod was 13 h light/11 h dark, with the day temperature coinciding with the light period. The photosynthetic photon flux density (PPFD) at the canopy level was approximately 195.3 µmol m−2 s−1, provided by white LED lamps (400–700 nm). Relative humidity was maintained at 60 ± 5%. Within each incubator, plant positions were randomized weekly to minimize positional effects. All incubators were of the same model and were calibrated before the experiment. Treatments continued until full bloom.

2.2. Sampling Method

Apical buds were sampled between 8:30 and 10:00 a.m. during the treatment period. A 3-day sampling interval was applied for most of the experimental duration. At each sampling time point, five apical buds were randomly collected per treatment from three pots and prepared for paraffin sectioning to observe the process of flower-bud differentiation.
At the flowering stage, flowers at full bloom (defined as the stage when ray florets were fully expanded and tubular florets had begun to emerge) were collected. Part of the samples were placed in ice boxes for photography, colorimetry, and color index measurement; the other part was frozen in liquid nitrogen and stored at −80 °C for subsequent pigment and physiological index assays.
Most leaves of the plants in the 30 °C/20 °C and 35 °C/25 °C treatments were scorched, with only a few green leaves remaining after 12 days of treatment, and no flower bud differentiation was observed. These two high-temperature treatments were therefore not included in subsequent physiological and transcriptomic assays.

2.3. Observation of the Flower Bud Differentiation Process

Following the paraffin sectioning method of Li (2009) [26], freshly harvested apical buds were stripped of their outer leaves and immediately immersed in FAA fixative, which was prepared from 70% (v/v) ethanol, 40% (v/v) formaldehyde solution, and glacial acetic acid at a ratio of 90:5:5 (v/v/v; about 20 volumes of fixative were used per volume of tissue). Intercellular air was evacuated with a vacuum pump until the tissues were fully infiltrated and sank, after which fixation continued for at least 24 h at room temperature. The fixed buds were then dehydrated through a graded ethanol series (70%, 85%, 95%, and 100% ethanol), cleared successively in graded ethanol–xylene mixtures and in pure xylene, and infiltrated with and embedded in melted paraffin. Serial longitudinal sections 8–10 μm thick were cut on a rotary microtome, flattened and mounted onto glass slides, deparaffinized in xylene, and rehydrated through a descending ethanol series. The sections were double-stained with safranin and fast green, then dehydrated, cleared in xylene, and mounted in neutral balsam. All sections were observed under a microscope and photographed to record the stages of flower bud differentiation.

2.4. Determination of Flower Color Parameters

The color parameters of the ray floret tips were determined using a CM-700d colorimeter (Konica Minolta Sensing, Osaka, Japan). The L* (lightness, ranging from 0 = black to 100 = white), a* (red–green axis, positive = red, negative = green), and b* (yellow–blue axis, positive = yellow, negative = blue) values were recorded, and chroma C* was calculated according to Formula (1).
For each replicate, five flowers were collected from three plants and measured, with a total of three replicates.
C = a 2 + b 2

2.5. Determination of Physiological Index

The relative anthocyanin index was determined following the method of Fu et al. (2021) [27] with minor modifications. Fresh dahlia ray florets (0.1 g) were ground in 10 mL of 95% ethanol containing 0.1 mol/L hydrochloric acid, and extracted twice at 60 °C for 1 h each. The final extract was made up to 25 mL with ethanol–HCl mixture. Absorbance was measured at 530 nm and 650 nm using a Sense microplate reader (model 435-301, Hidex Oy, Turku, Finland), and the relative anthocyanin index was calculated using Equations (2) and (3) and expressed as U/g fresh weight (FW). The relative flavonoid index was estimated from absorbance at 325 nm (A325) using Equation (4) and is expressed as U/g FW.
Q = A λ   ×   V / W
A λ = A 530 − 0.25   ×   A 650
Q = A 325 × V / M
where A is the corrected absorbance, V is the extract volume (mL), and W is the fresh sample weight (g); 95% ethanol containing 0.1 mol/L HCl was used as blank.
Carotenoid content was determined by the methods described by Meng et al. (2023) [28] using 95% ethanol extraction. Fresh petals (0.1 g) were cut into small pieces and immersed in 10 mL of 95% ethanol in the dark for 72 h. Absorbance at 663, 645, and 470 nm was measured, and carotenoid content was calculated according to Equations (5)–(8). Carotenoid content was expressed as mg/g fresh weight (FW).
C h l a = 12.21 × A 663 − 2.81 × A 645
C h l b = 20.13 × A 645 − 5.03 × A 663
C a r o t e n o i d = ( 1000 × A 470 − 3.27 × C h l a − 104 × C h l b ) / 229
c a r o t e n o i d   c o n t e n t = C × V / ( M × 1000 )
Following the methods of Li (2000) [29], soluble sugars were extracted from 0.1 g of dried ray floret tissue using hot water extraction, and the extract was adjusted to a final volume of 25 mL. Starch was extracted from the same sample with graded concentrations of perchloric acid, and the volume was made up to 50 mL. Both soluble sugar and starch contents were then analyzed by the anthrone colorimetric method, with glucose as the calibration standard, and expressed as mg/g dry weight (DW).

2.6. RNA Extraction, Transcriptome Sequencing, and qRT-PCR Validation

Total RNA was extracted from ray florets at full bloom (S5) under the 15 °C/5 °C, 20 °C/10 °C, and 25 °C/15 °C treatments using the TransZol Plant RNA Extraction Kit (Meiji Technology, Shanghai, China), with three biological replicates per treatment (nine libraries). RNA integrity and concentration were assessed with an Agilent 5300 (Agilent Technologies, Santa Clara, CA, USA) Bioanalyzer and a NanoDrop 2000 (Thermo Fisher Scientific, Waltham, MA, USA). cDNA libraries were sequenced on the Illumina NovaSeq X Plus (Illumina, Inc., San Diego, CA, USA; PE150) by Shanghai Majorbio Bio-pharm Technology Co., Ltd. (Shanghai, China).
The raw paired-end reads were trimmed and quality-controlled with fastp using default parameters: adapter sequences and reads lacking inserted fragments were removed; low-quality bases (Phred score < 20) at the 3′ end were trimmed; reads containing >10% ambiguous “N” bases were discarded; and reads shorter than 20 bp after trimming were removed. Clean reads were retained after quality filtering. Clean reads were pooled and assembled using Trinity. Assemblies were optimized and filtered with TransRate, which removes chimeric, misassembled, incomplete, and base-error sequences, and redundant transcripts were clustered with CD-HIT to obtain non-redundant unigenes; completeness was assessed with BUSCO against conserved single-copy orthologs. The assembly yielded 171,964 transcripts and 102,268 unigenes.
Unigenes were annotated against six public databases—NR, Swiss-Prot, Pfam, eggNOG, GO, and KEGG—using Diamond v2.0.13 with an E-value cutoff of 1.0 × 10⁻⁵ (HMMER v3.3.2 for Pfam; BLAST2GO v5.2 for GO.
Clean reads were mapped back to the assembled transcripts and quantified with RSEM; transcript-level counts were aggregated to the unigene (gene) level and normalized to transcripts per million (TPM), with mapping ratios of 80.39–82.90% (mean 81.84%). Differential expression was analyzed with DESeq2 (v1.24.0), and genes satisfying |log2FC| ≥ 1 and FDR < 0.05 were defined as DEGs GO and KEGG over-representation analyses were performed with Goatools and KOBAS, respectively, using Fisher’s exact test with Benjamini–Hochberg (BH) correction against all annotated unigenes as the background gene set; gene ratio is the fraction of DEGs assigned to a given term/pathway, and terms/pathways with BH-adjusted p < 0.05 were considered significantly enriched.

2.7. Statistical Analysis

Morphological and physiological statistical analyses were performed with IBM SPSS Statistics 20. Normality and homogeneity of variance were first verified using the Shapiro–Wilk test and Levene’s test, respectively. Where the assumptions were met, one-way analysis of variance (ANOVA) was performed, followed by Duncan’s multiple range test for pairwise mean comparisons at p < 0.05. Data are expressed as mean ± standard error (SE), with n = 3 independent plants for color parameters and n = 3 independent pooled samples (each pooled from three plants) for pigment, soluble sugar/starch, and gene-expression analyses.

3. Results

3.1. Morphological Changes During Flower Bud Differentiation

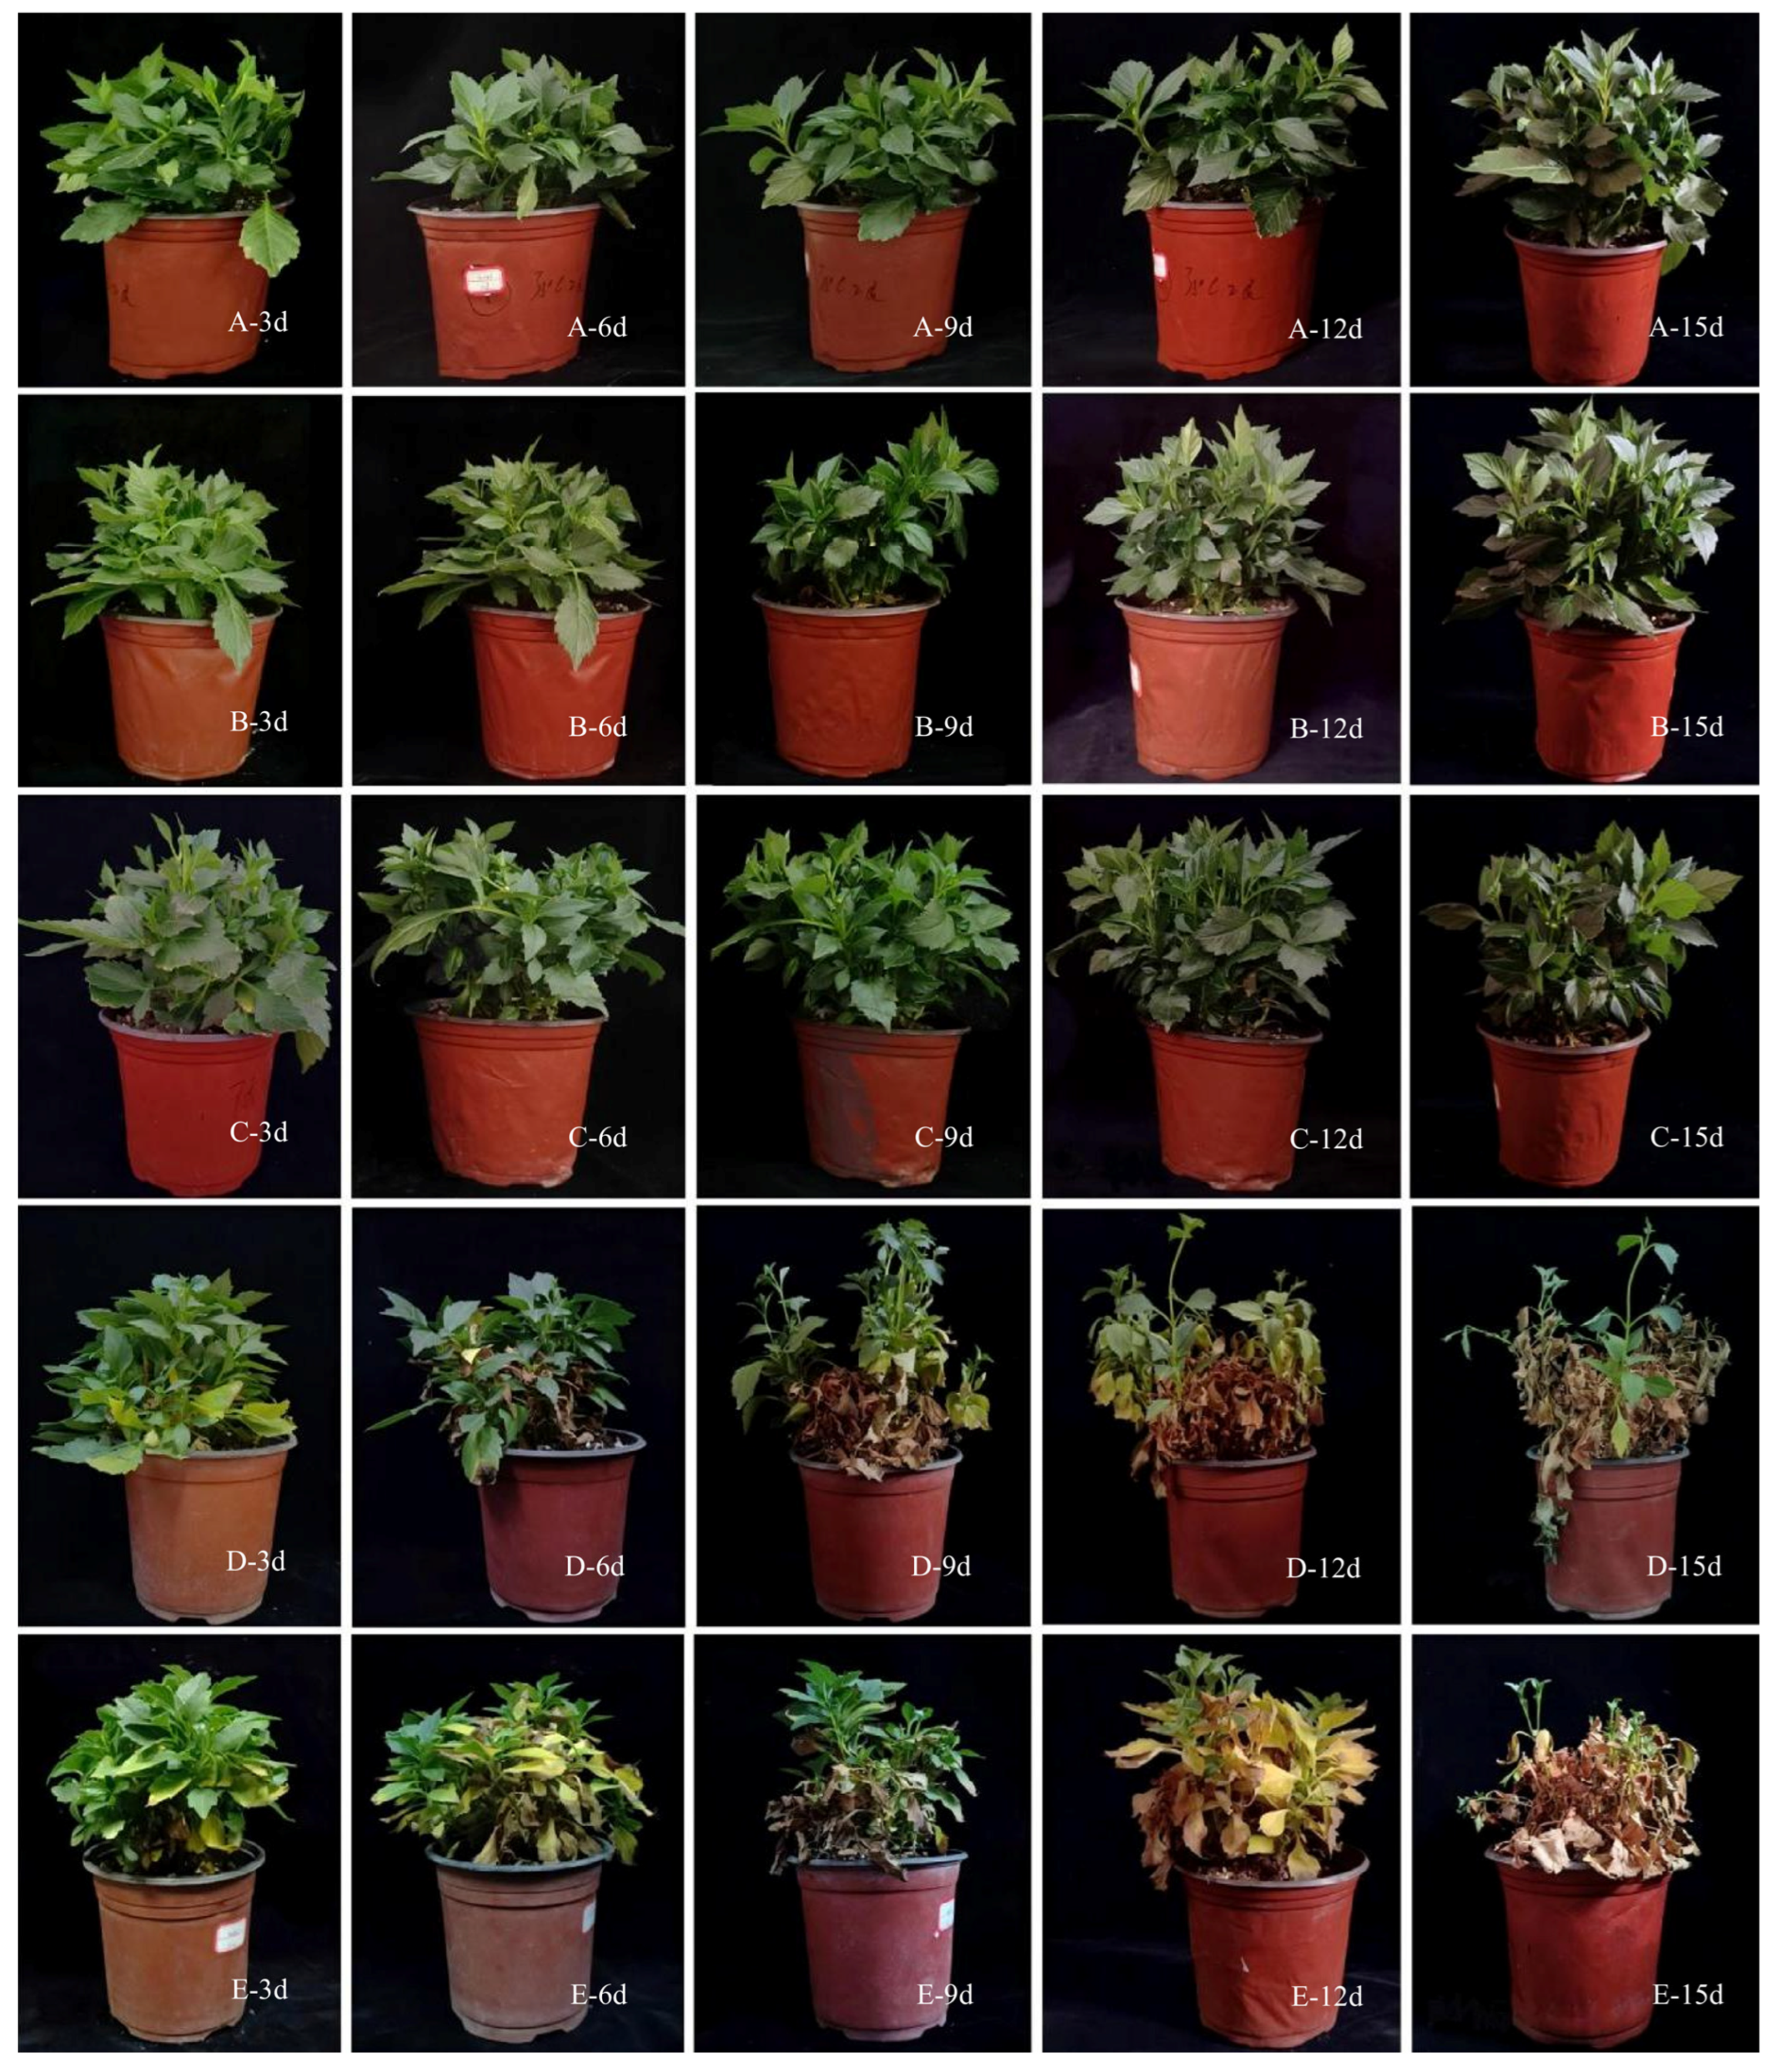
Morphological changes after different temperature treatments were distinctly different (Figure 1). Plants treated at 15 °C/5 °C, 20 °C/10 °C, and 25 °C/15 °C grew normally and underwent flower bud differentiation (Figure 1A–C). In the 30 °C/20 °C and 35 °C/25 °C treatments (Figure 1D,E), lower leaves began to yellow after 3 days; after 9 days, many middle and lower leaves withered; after 15 days, only a few green leaves remained, and no morphological flower bud differentiation was observed during the treatment period.

3.2. Stages and Progression of Flower Bud Differentiation

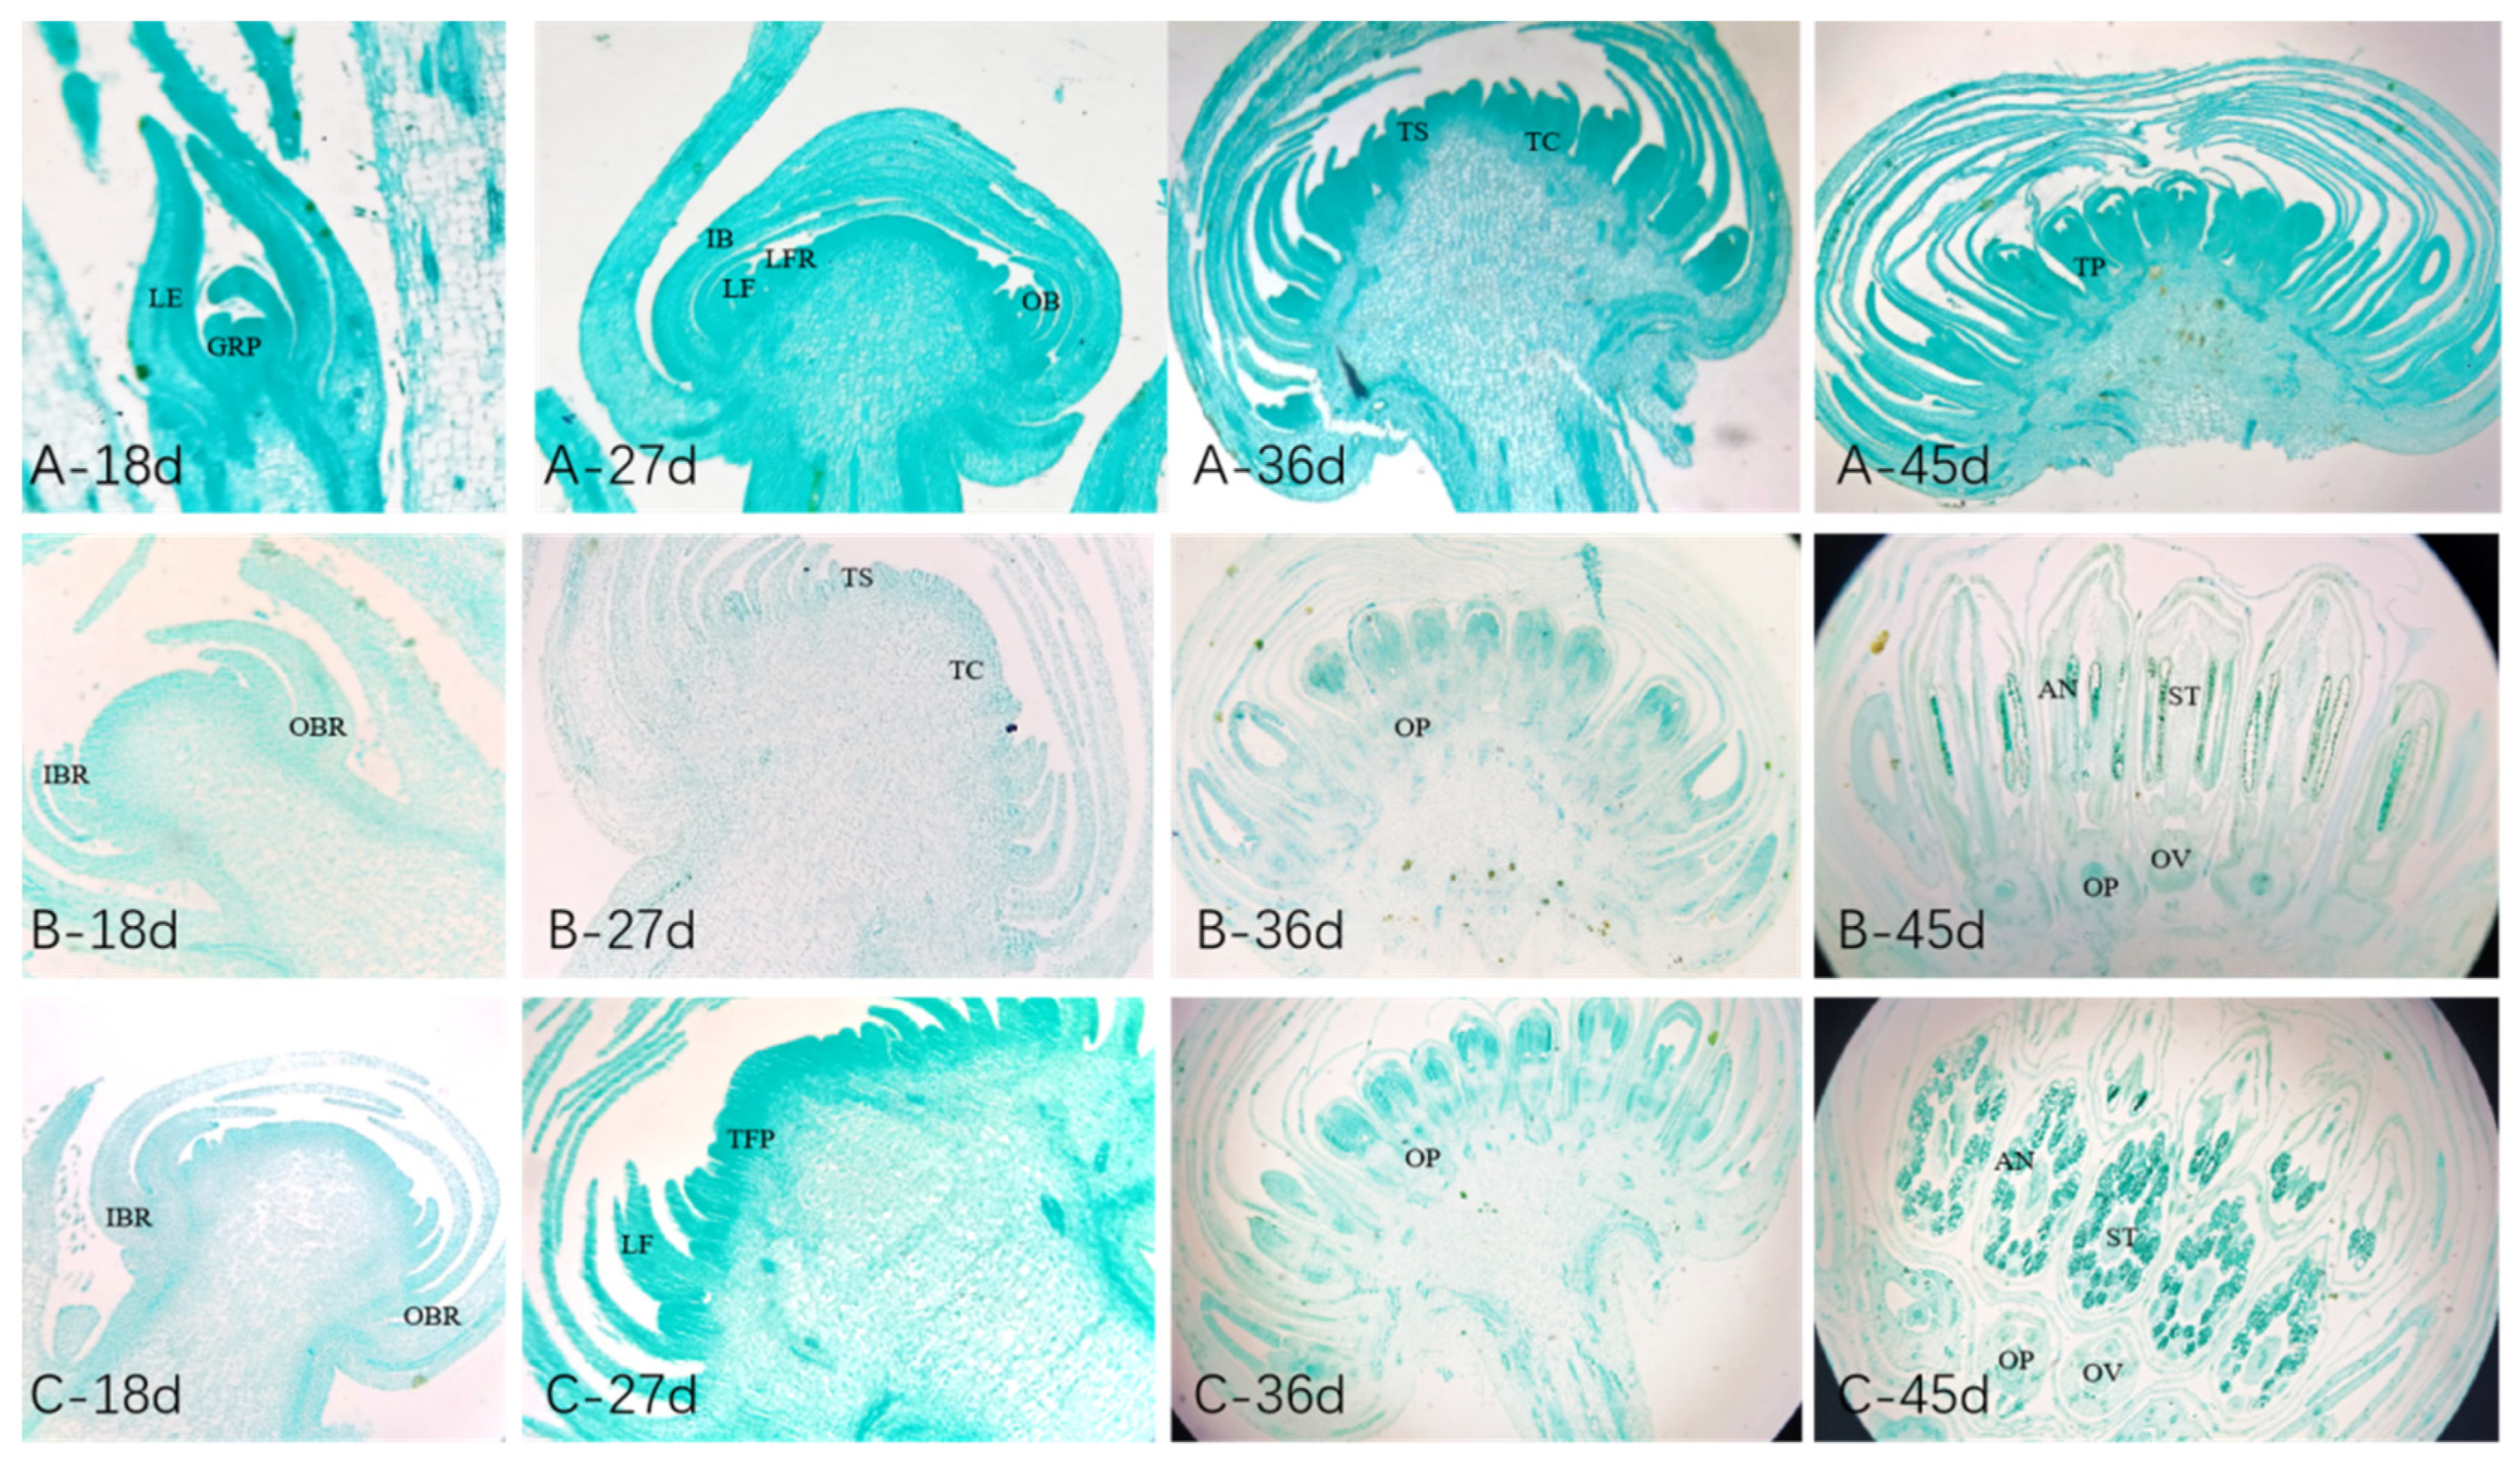
Paraffin sectioning of apical buds from ‘Hypnotica Tropical Breeze’ under different temperature treatments revealed that although the timing differed, the differentiation stages could be divided into five phases: initiation stage, bract primordium differentiation stage, ray floret differentiation stage, tubular floret differentiation stage, and ovule and pollen formation stage (Figure 2).
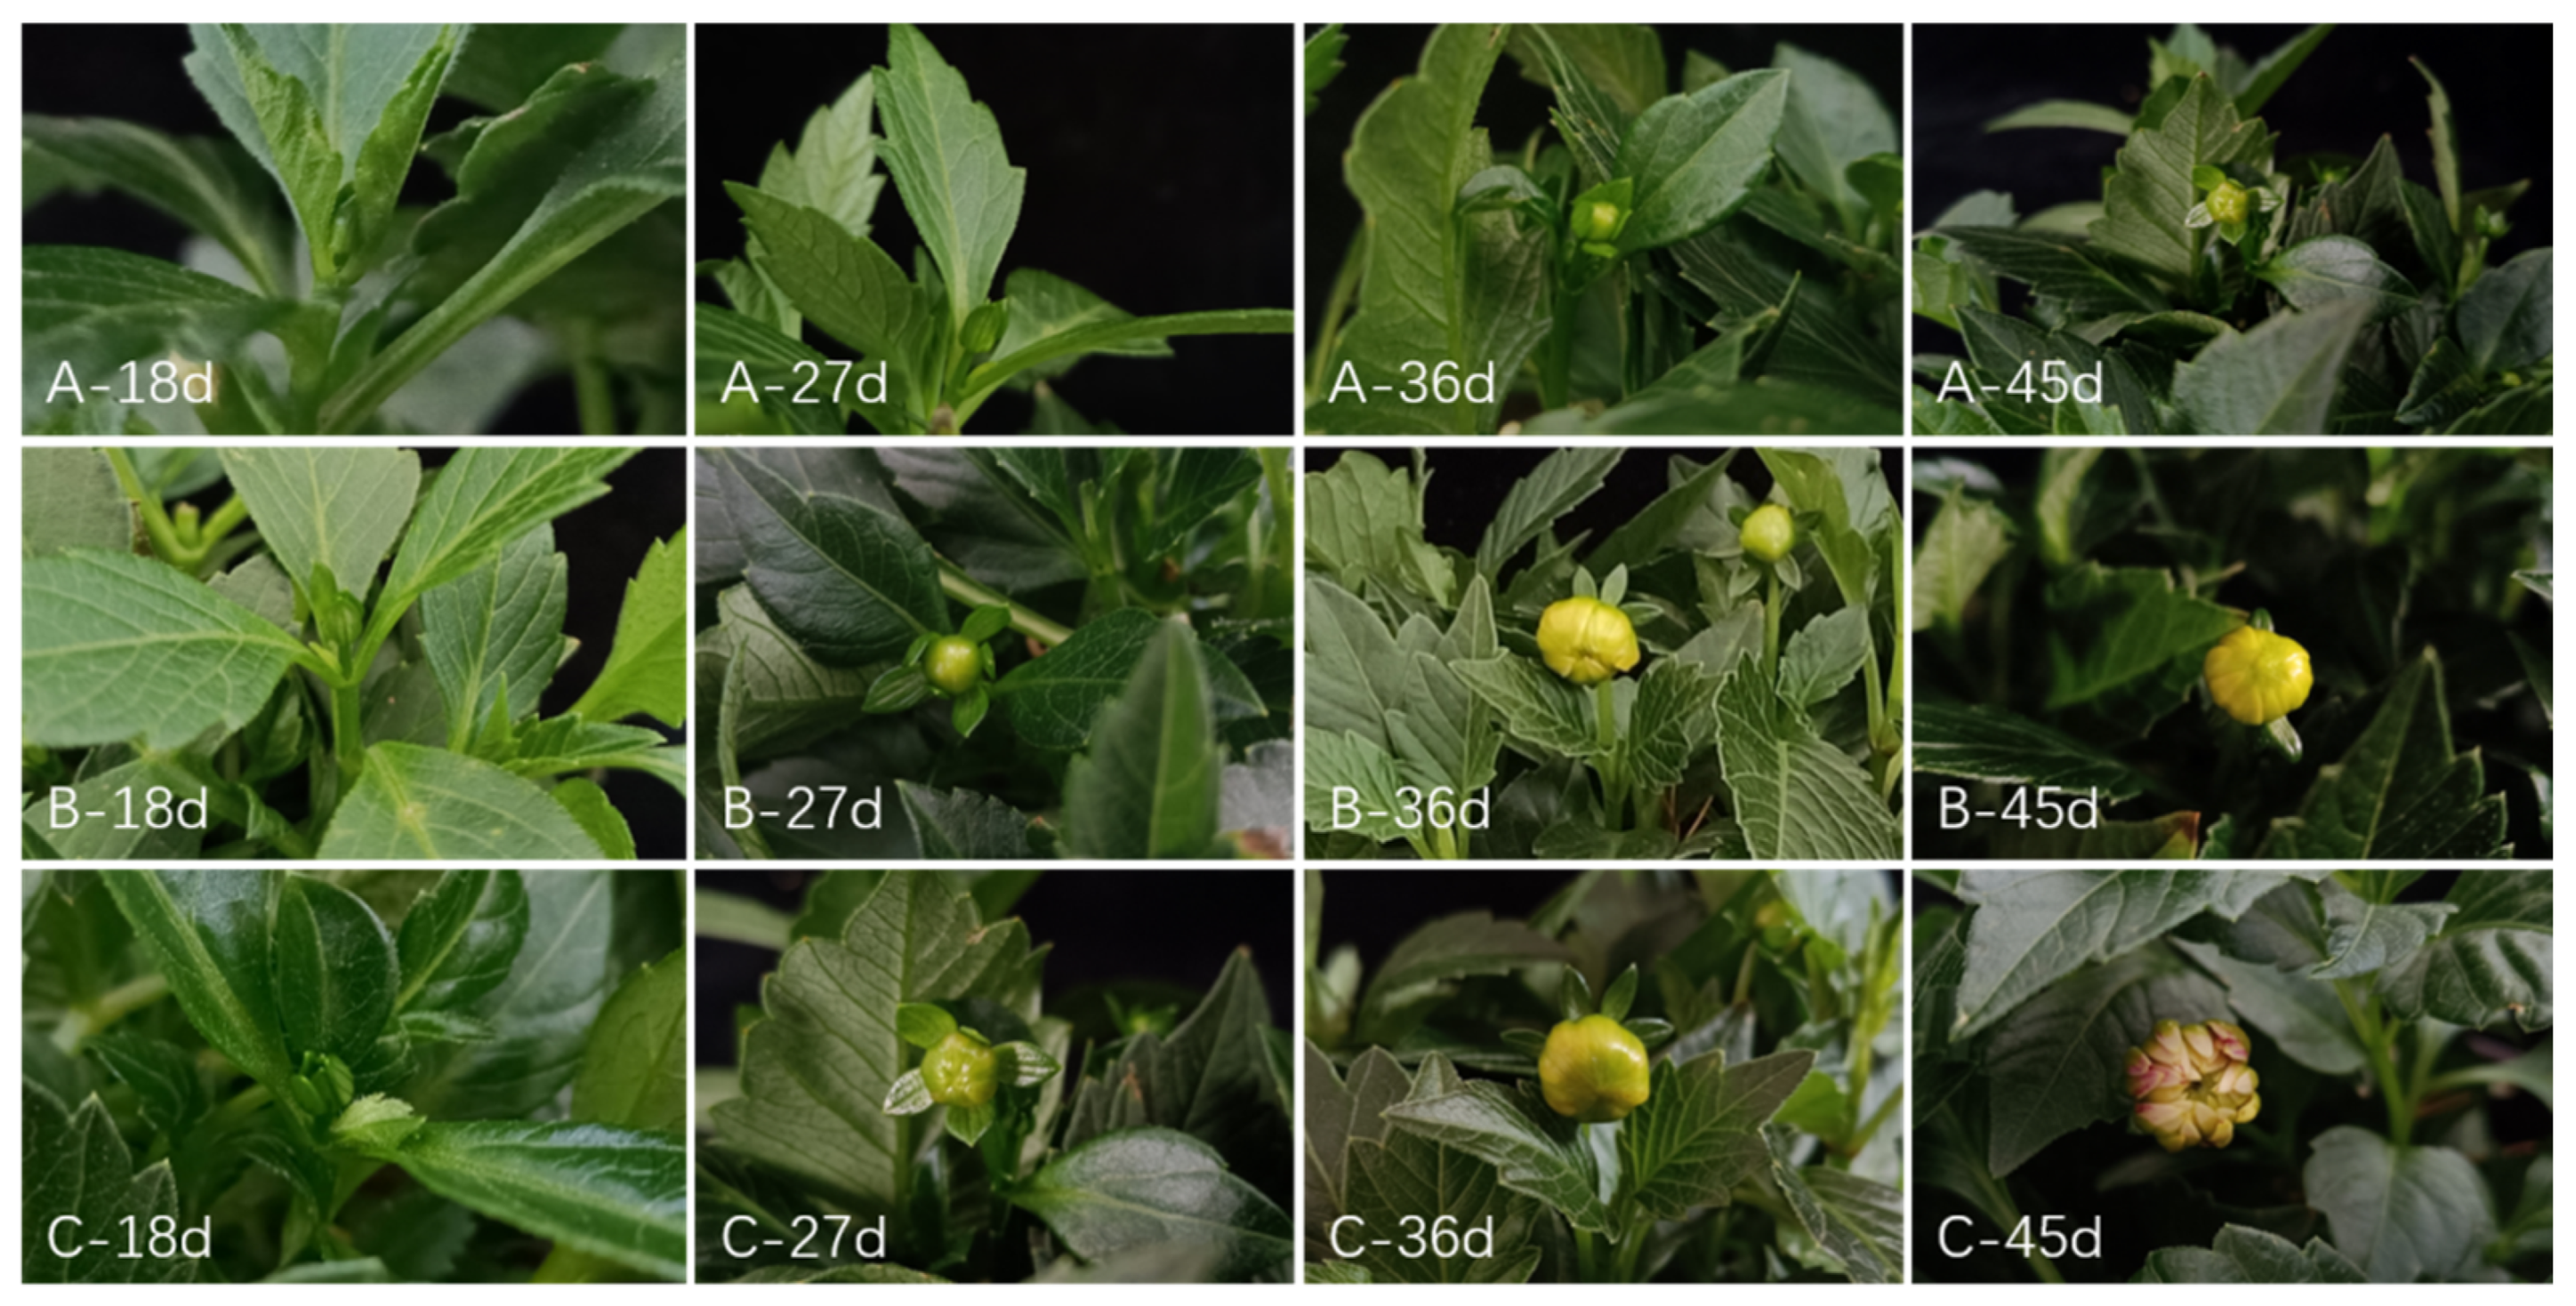
Temperature treatments significantly altered the progression of flower bud differentiation (Figure 3). The 25 °C/15 °C treatment completed differentiation in 41 days; 15 °C/5 °C required 100 days, and 20 °C/10 °C required 46 days. Compared with 25 °C/15 °C, the 15 °C/5 °C treatment delayed differentiation by 59 days, while 20 °C/10 °C delayed it by 5 days (Table 1).

3.3. Changes in Ray Floret Color Under Different Treatments

The CIELAB color system is widely used to characterize flower pigmentation. L*, a*, and b* values are related to brightness and color changes in ray floret tips. L* is negatively correlated with color intensity; darker colors correspond to lower L*. Colorimetric results showed significant differences in L*, a*, b*, and C values among the three treatments. Among them, the 20 °C/10 °C treatment had the smallest L* and b* values at the ray floret tips, and the largest a*, C values; the 15 °C/5 °C treatment had the largest L* and significantly lower a* and C than 20 °C/10 °C, but not significantly different from 25 °C/15 °C; its b* was significantly higher than that of 20 °C/10 °C (p < 0.05) (Table 2).

3.4. Changes in Pigment Contents of Ray Florets

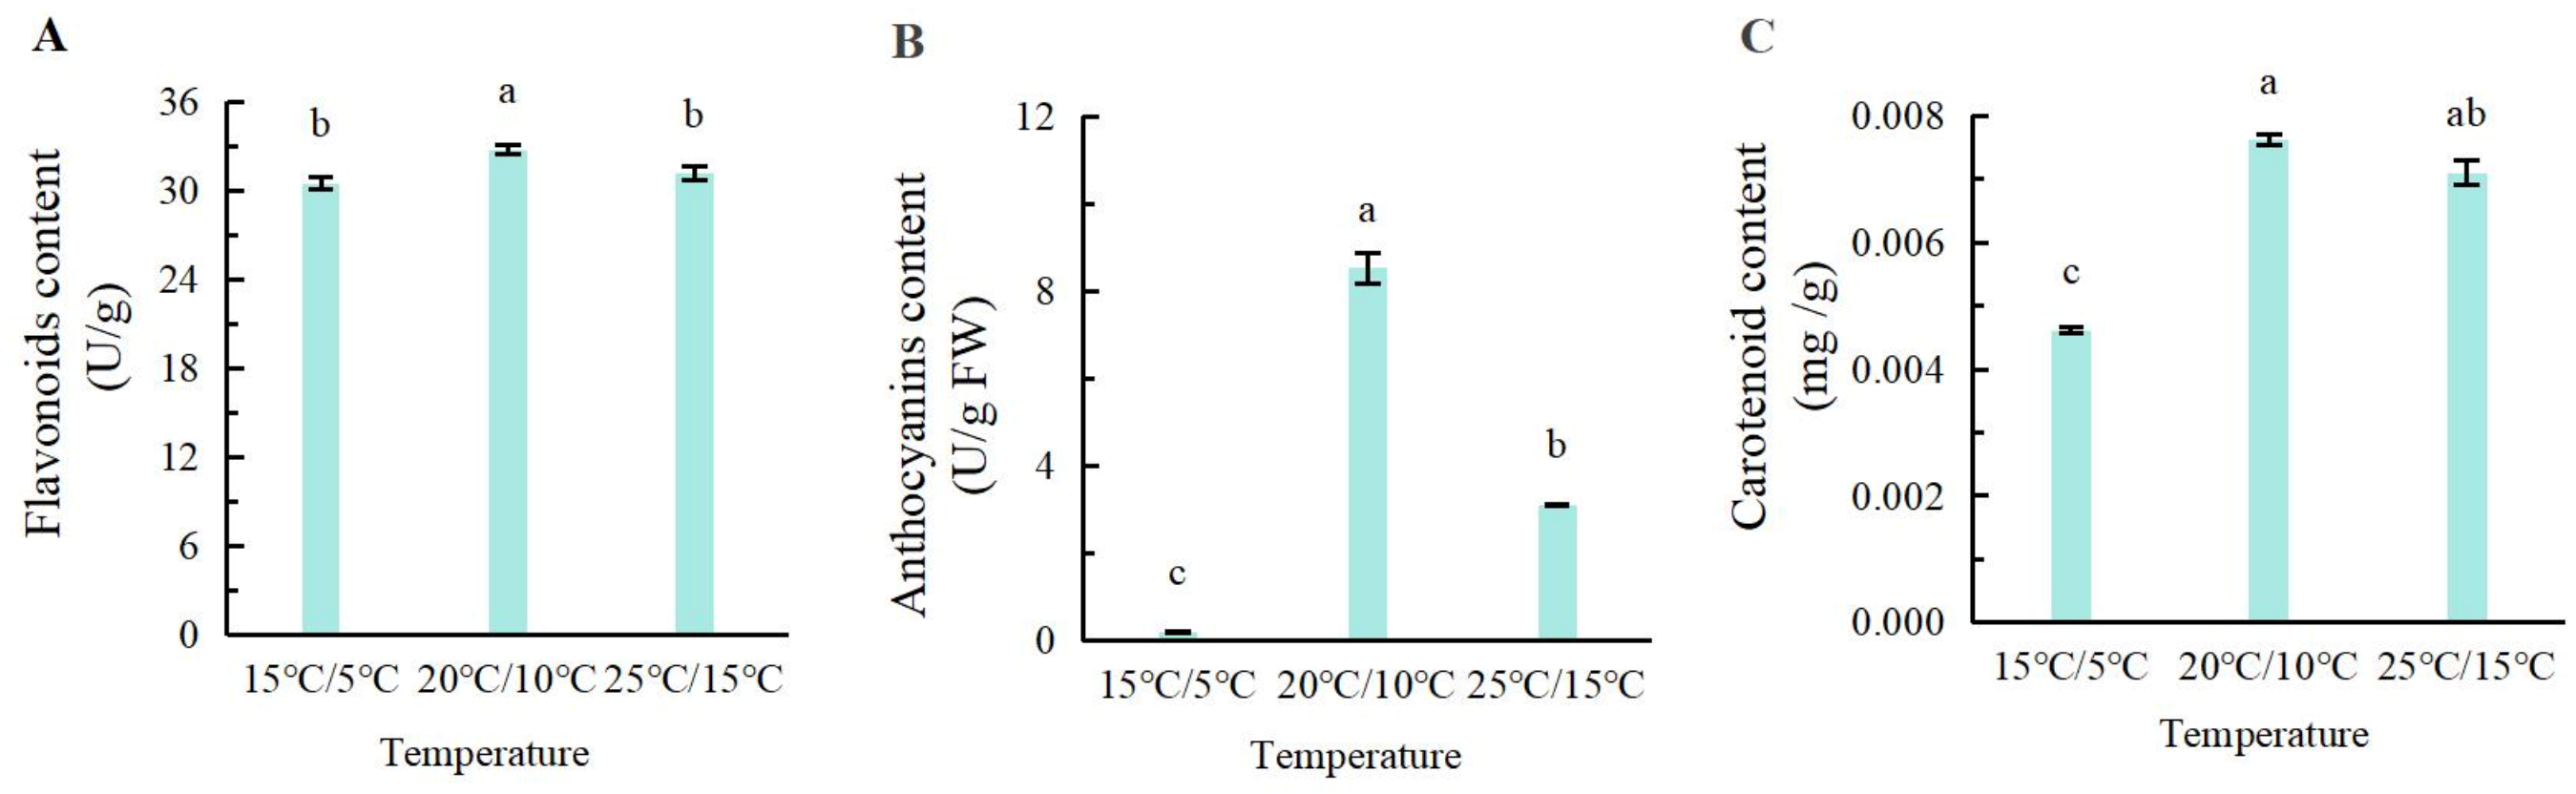
Ray florets of ‘Hypnotica Tropical Breeze’ showed high relative flavonoid and anthocyanin indices and a very low carotenoid content (Figure 4). Temperature treatments significantly altered the relative flavonoid and anthocyanin indices and carotenoid content. The relative flavonoid index was highest under 20 °C/10 °C (32.76 U/g FW), significantly higher than under 15 °C/5 °C and 25 °C/15 °C (Figure 4A). The relative anthocyanin index responded most dramatically to temperature, reaching 8.53 U/g FW at 20 °C/10 °C, which was 42-fold and 2.7-fold higher than at 15 °C/5 °C and 25 °C/15 °C, respectively (p < 0.05) (Figure 4B). Carotenoid content was highest at 20 °C/10 °C and lowest at 15 °C/5 °C, which was only 60.5% of that at 20 °C/10 °C (p < 0.05) (Figure 4C).

3.5. Changes in Nutrient Contents at the Flowering Stage

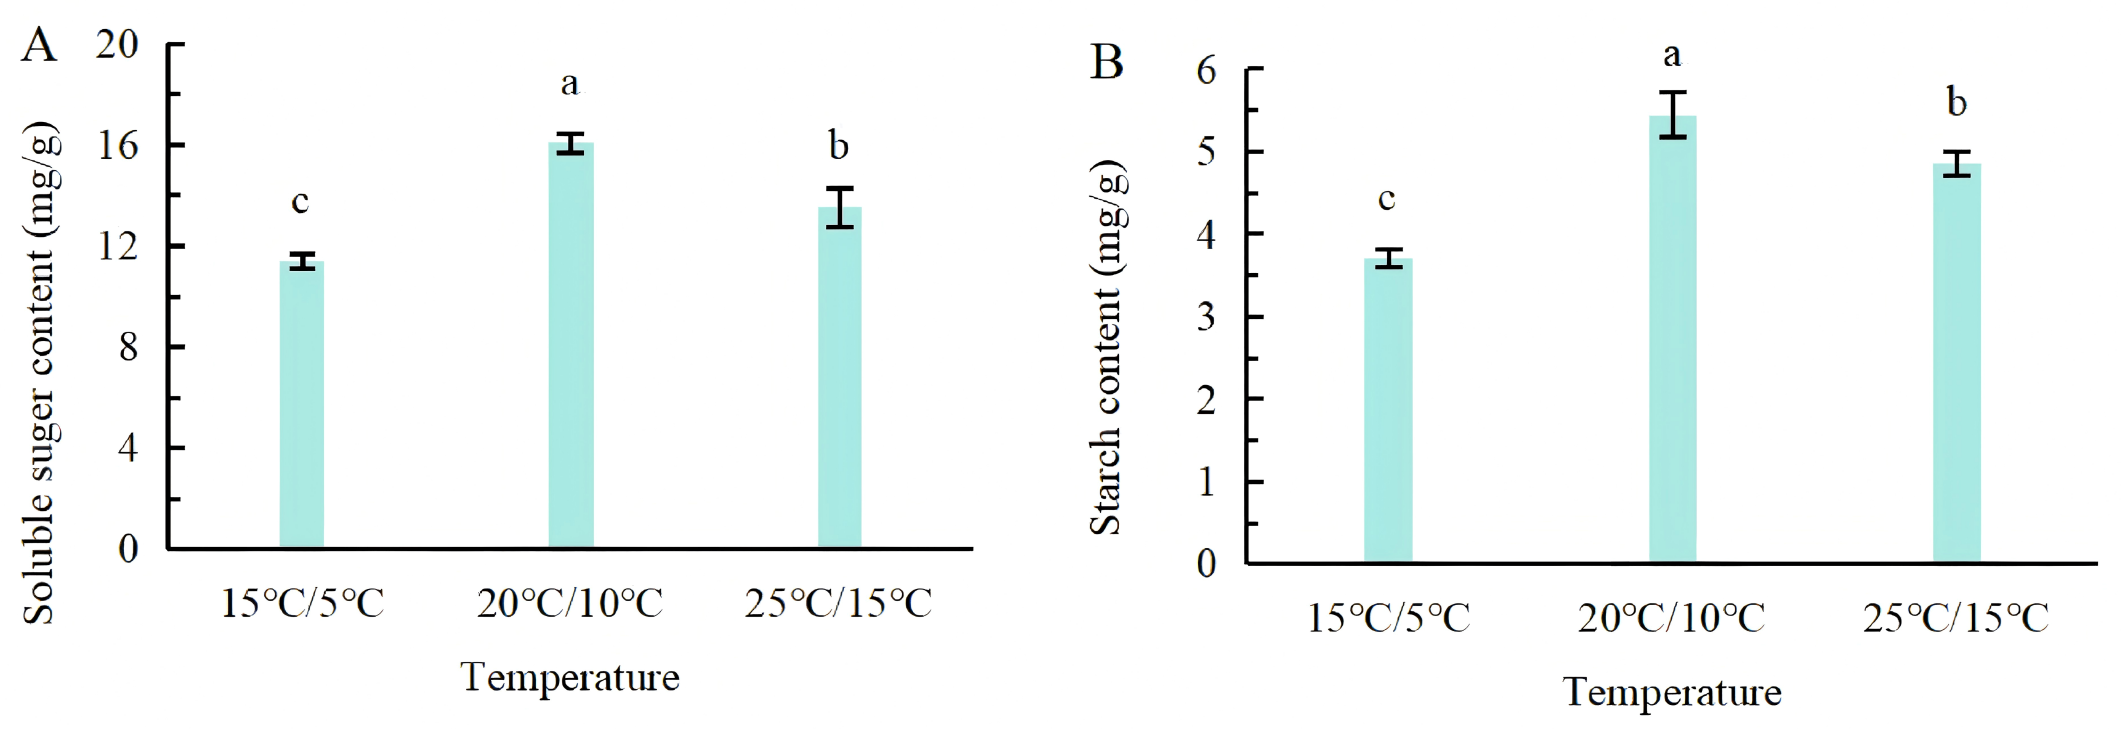
Different day/night temperature treatments significantly affected soluble sugar and starch contents in ray florets at full bloom (Figure 5). Soluble sugar content was highest at 20 °C/10 °C (16.06 mg/g DW), significantly higher than at 15 °C/5 °C and 25 °C/15 °C (p < 0.05) (Figure 5A). Starch content followed the same trend, being highest at 20 °C/10 °C and significantly higher than at 15 °C/5 °C and 25 °C/15 °C, with 25 °C/15 °C significantly higher than 15 °C/5 °C (p < 0.05) (Figure 5B). These results indicate that the 20 °C/10 °C day/night regime is most favorable for soluble sugar and starch accumulation, while both 15 °C/5 °C and 25 °C/15 °C significantly reduced their contents.

3.6. Transcriptomic Analysis and Functional Characterization of Differentially Expressed Genes (DEGs)

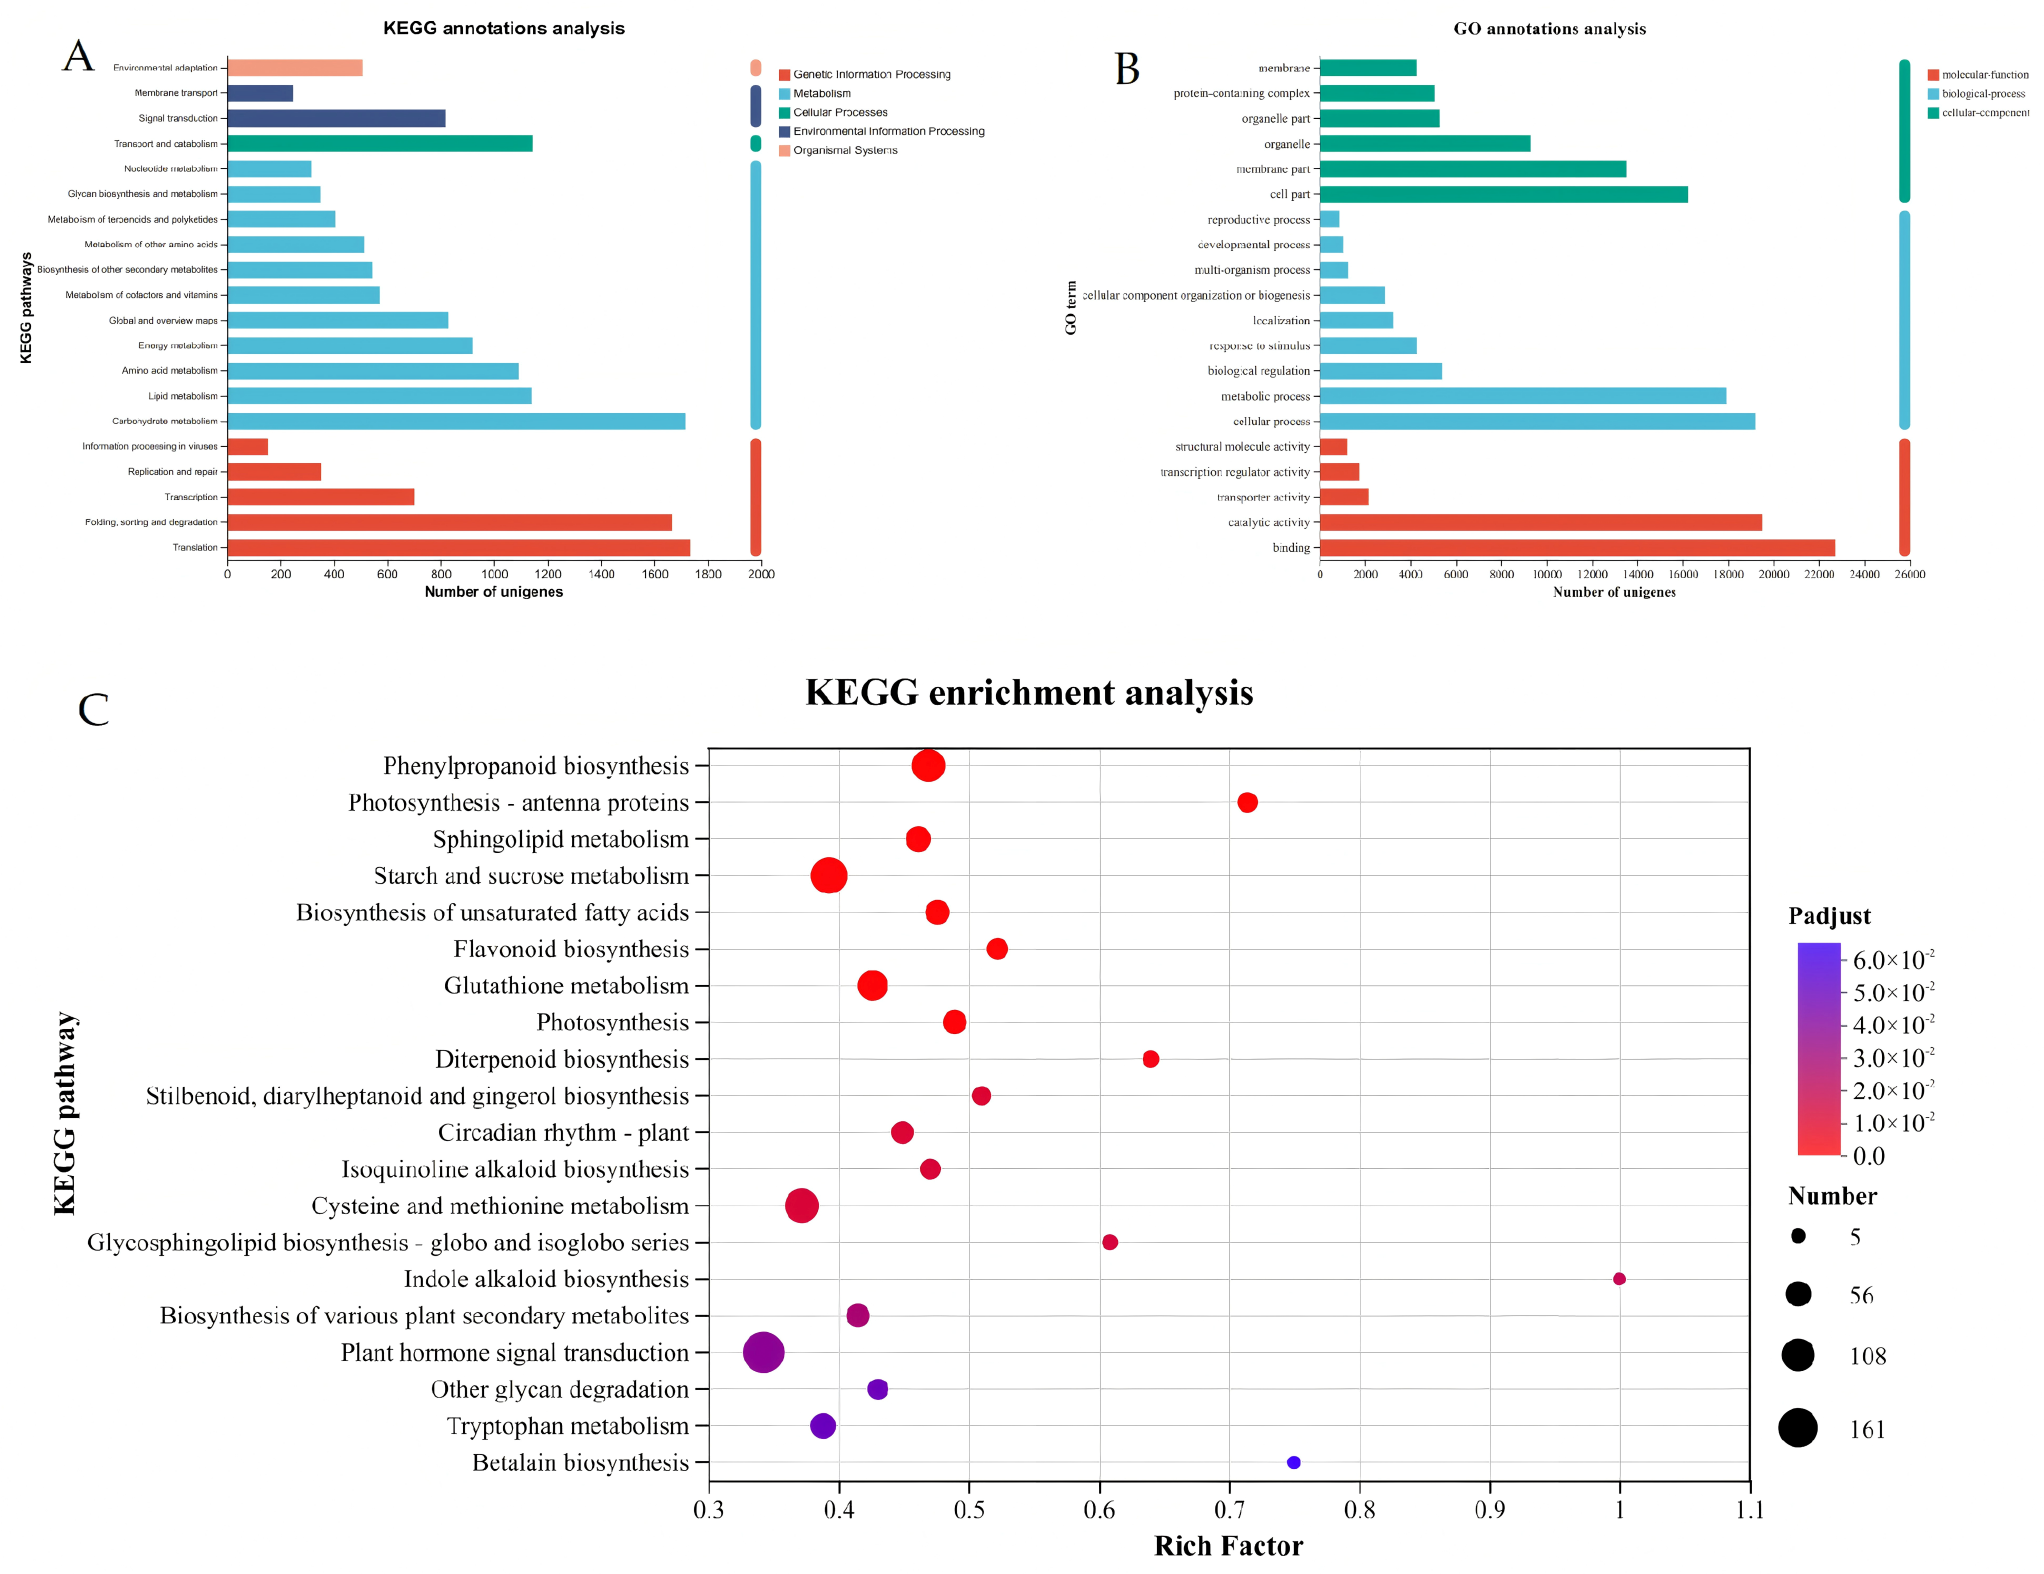
Sequencing data quality was excellent, with Q30 values above 94.69% and GC contents ranging from 43% to 44% (Table 3), fully meeting subsequent analysis requirements. The DEGs were functionally classified by Gene Ontology (GO) into three categories—molecular function (MF), cellular component (CC), and biological process (BP) (Figure 6A). In the 15/5 vs. 20/10 °C and 20/10 vs. 25/15 °C contrasts, 6085 and 5029 DEGs were assigned to MF, predominantly within binding and catalytic activities; 4650 and 3476 to CC, mainly cell and membrane parts; and 4398 and 4727 to BP, mainly metabolic and cellular processes, respectively. These GO results are functional classification counts (annotation distributions) rather than statistical enrichment results.
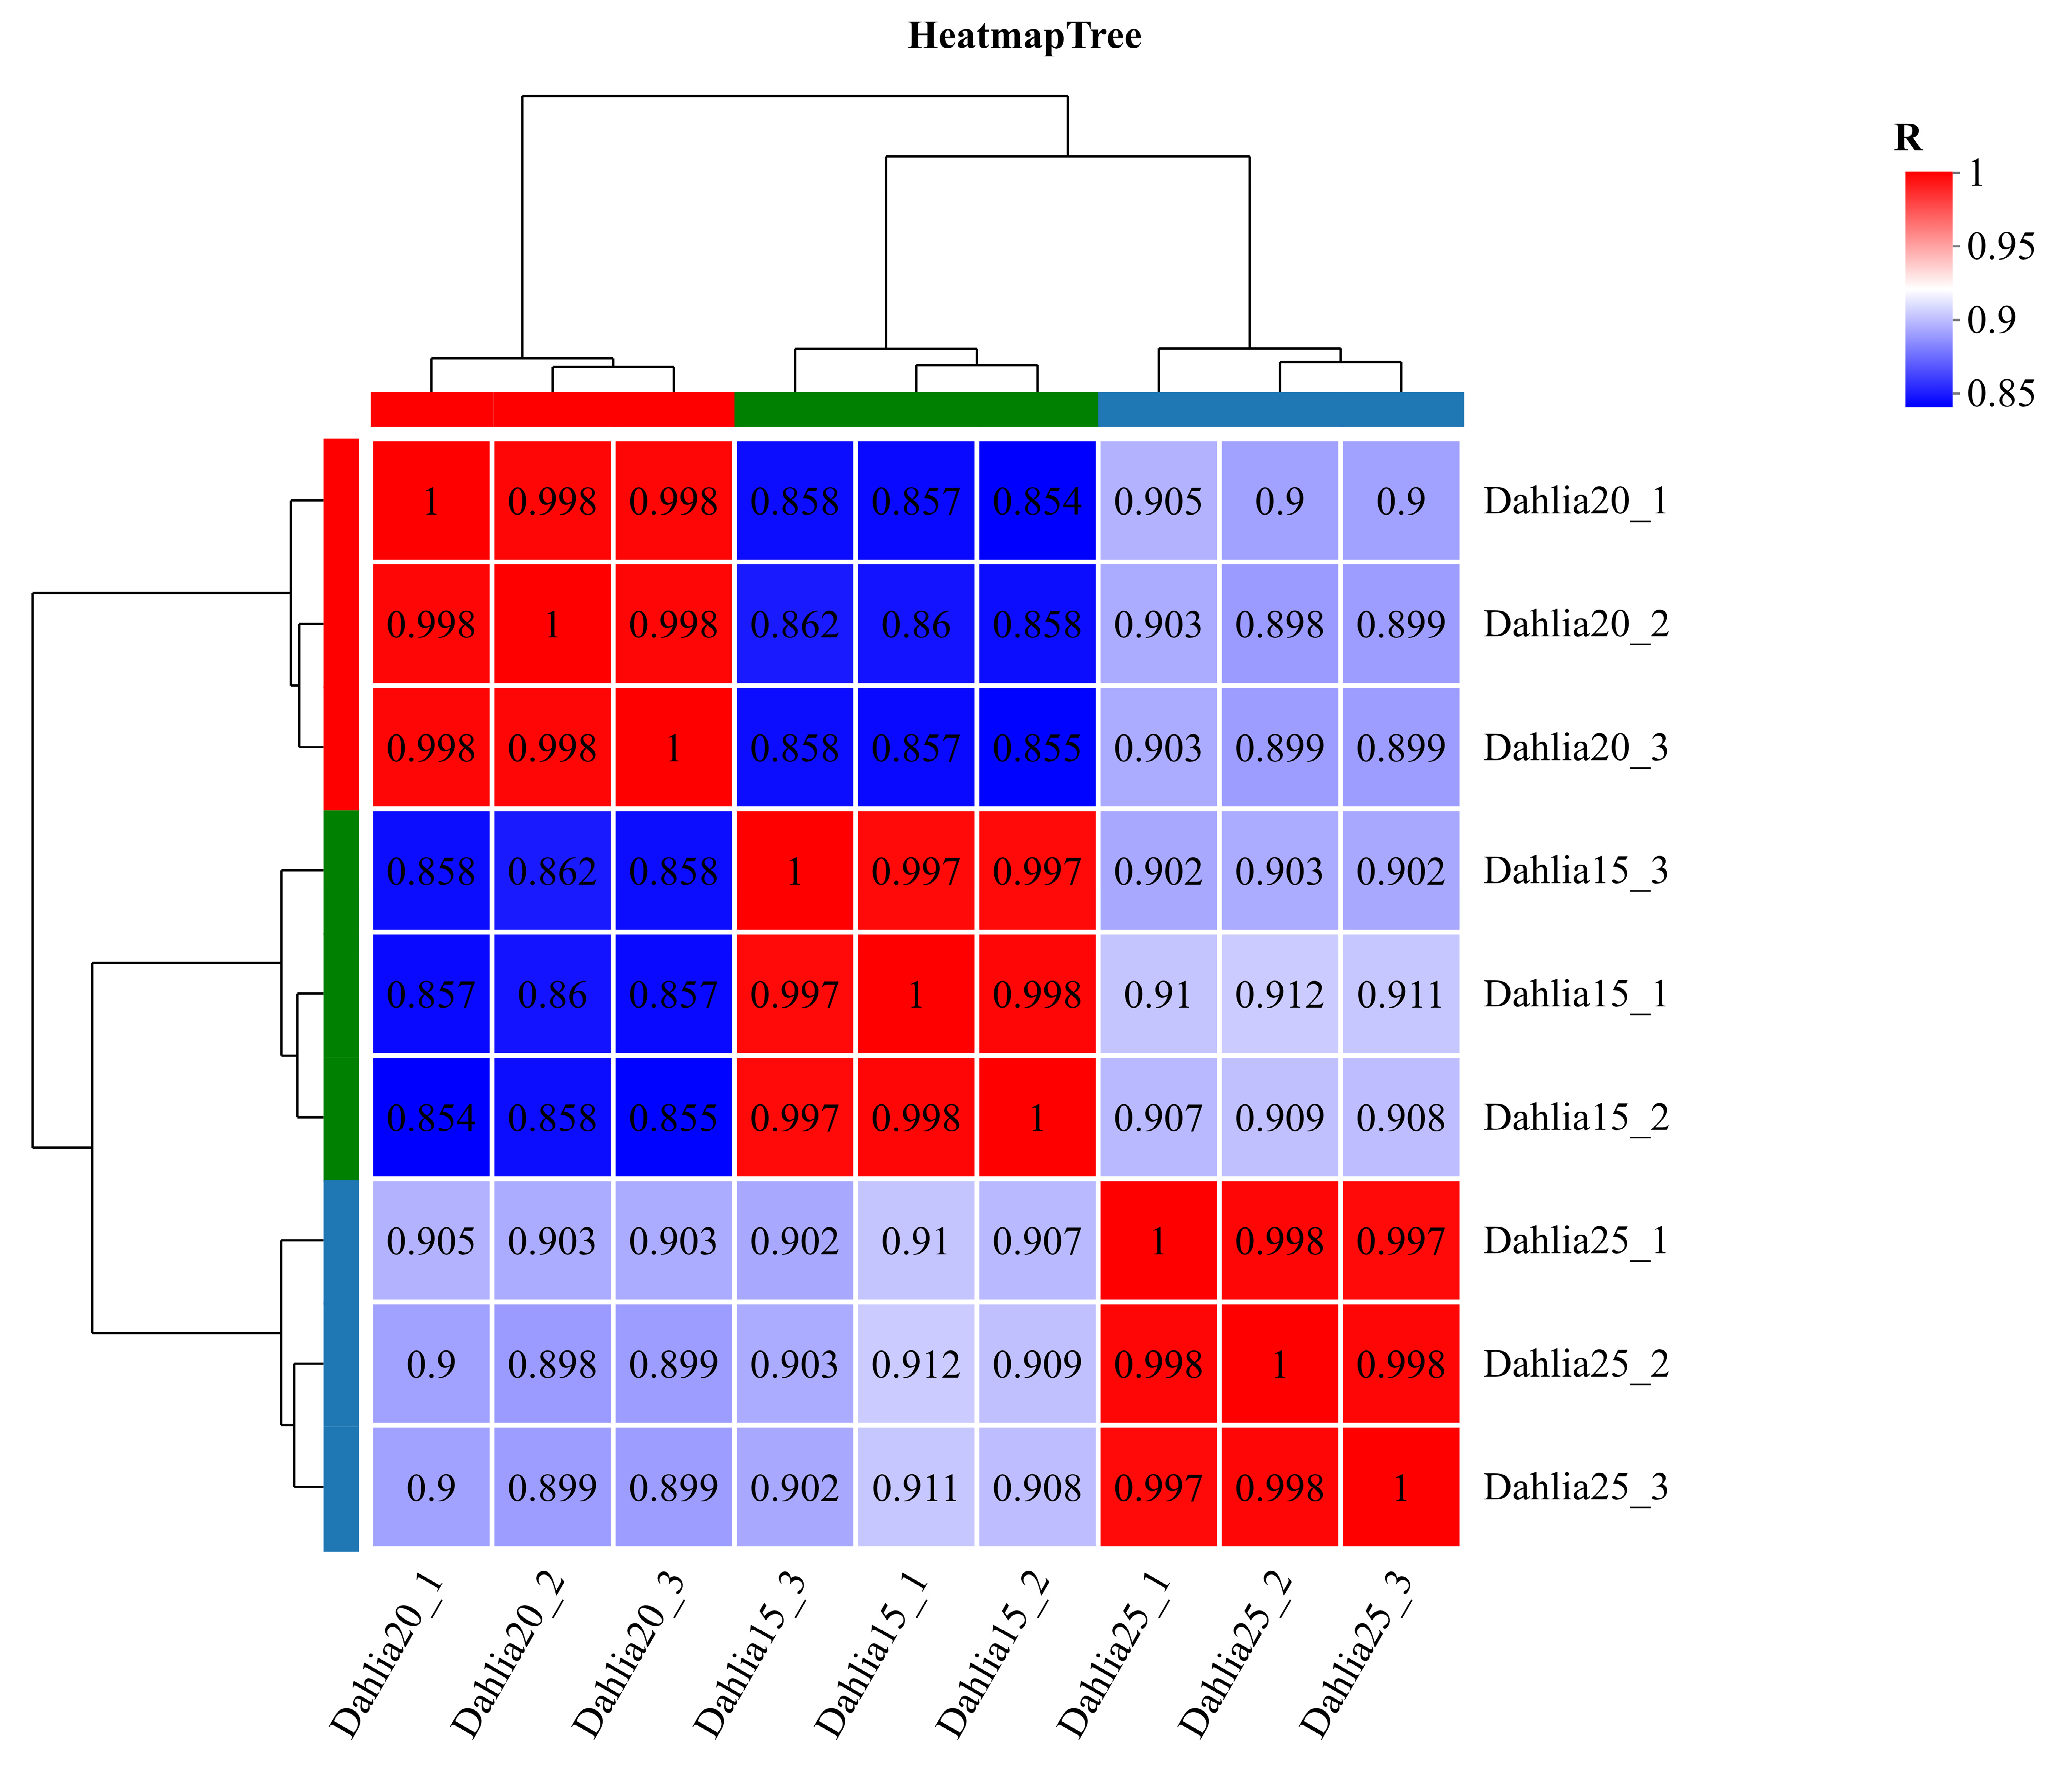
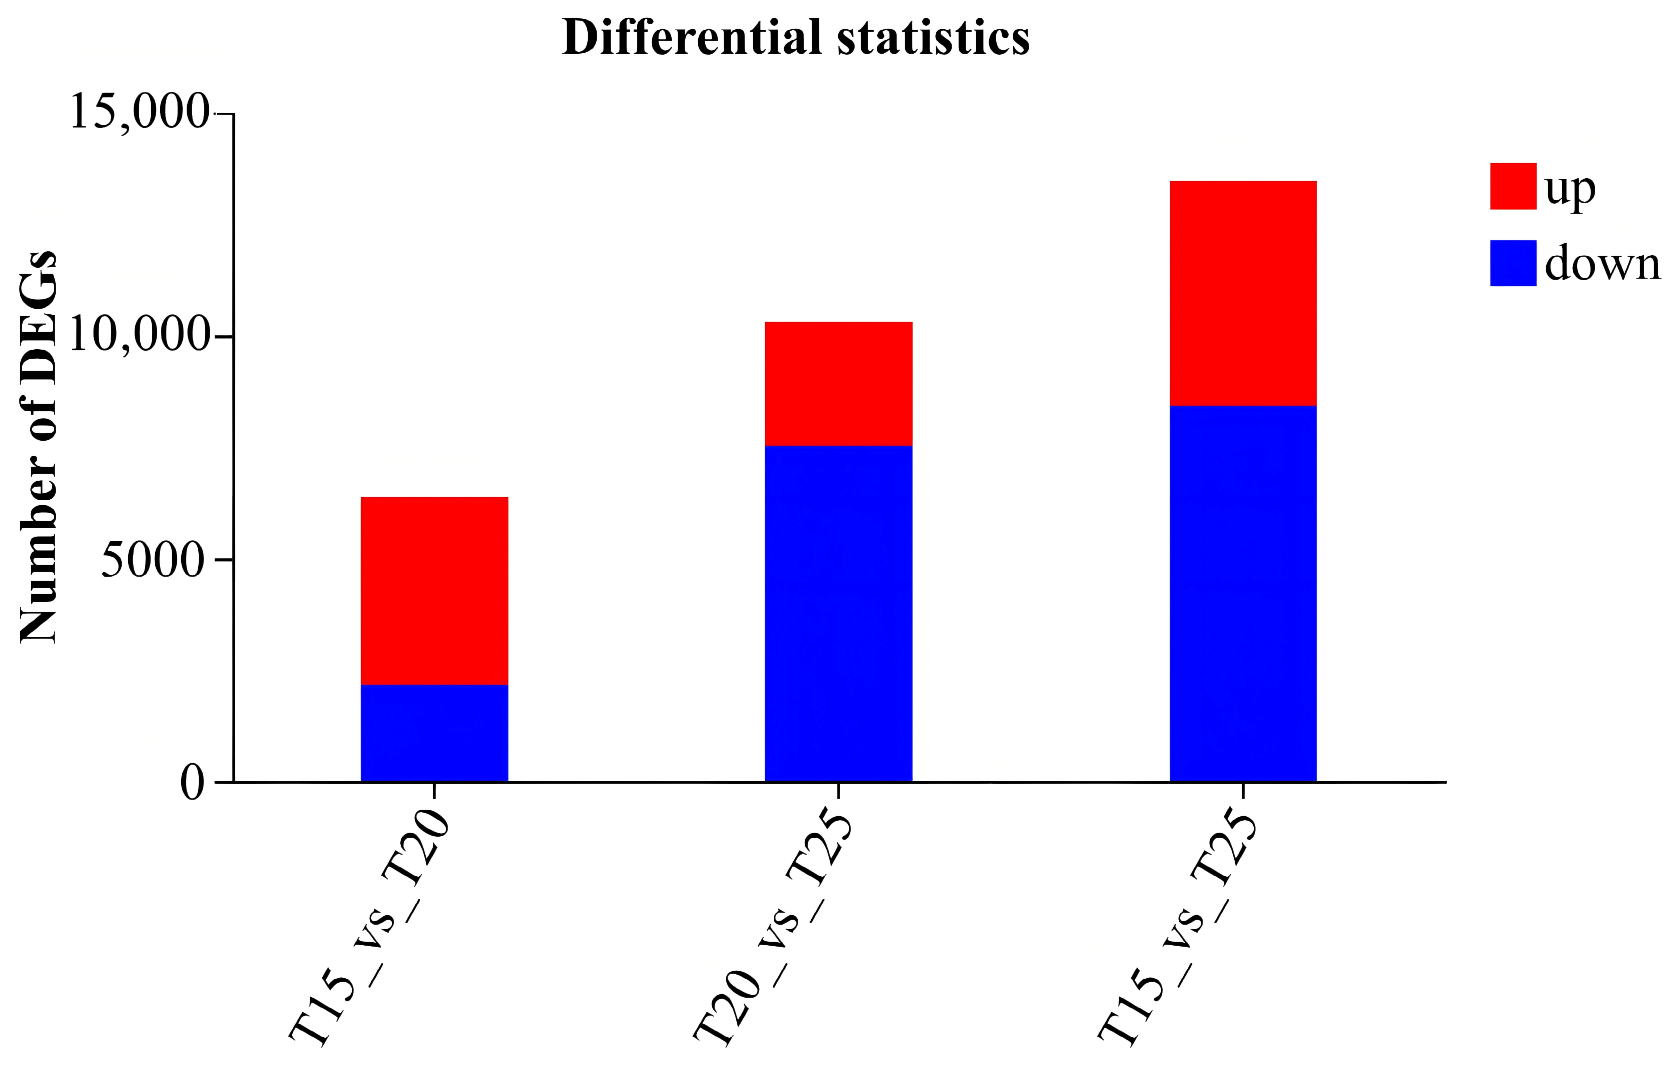
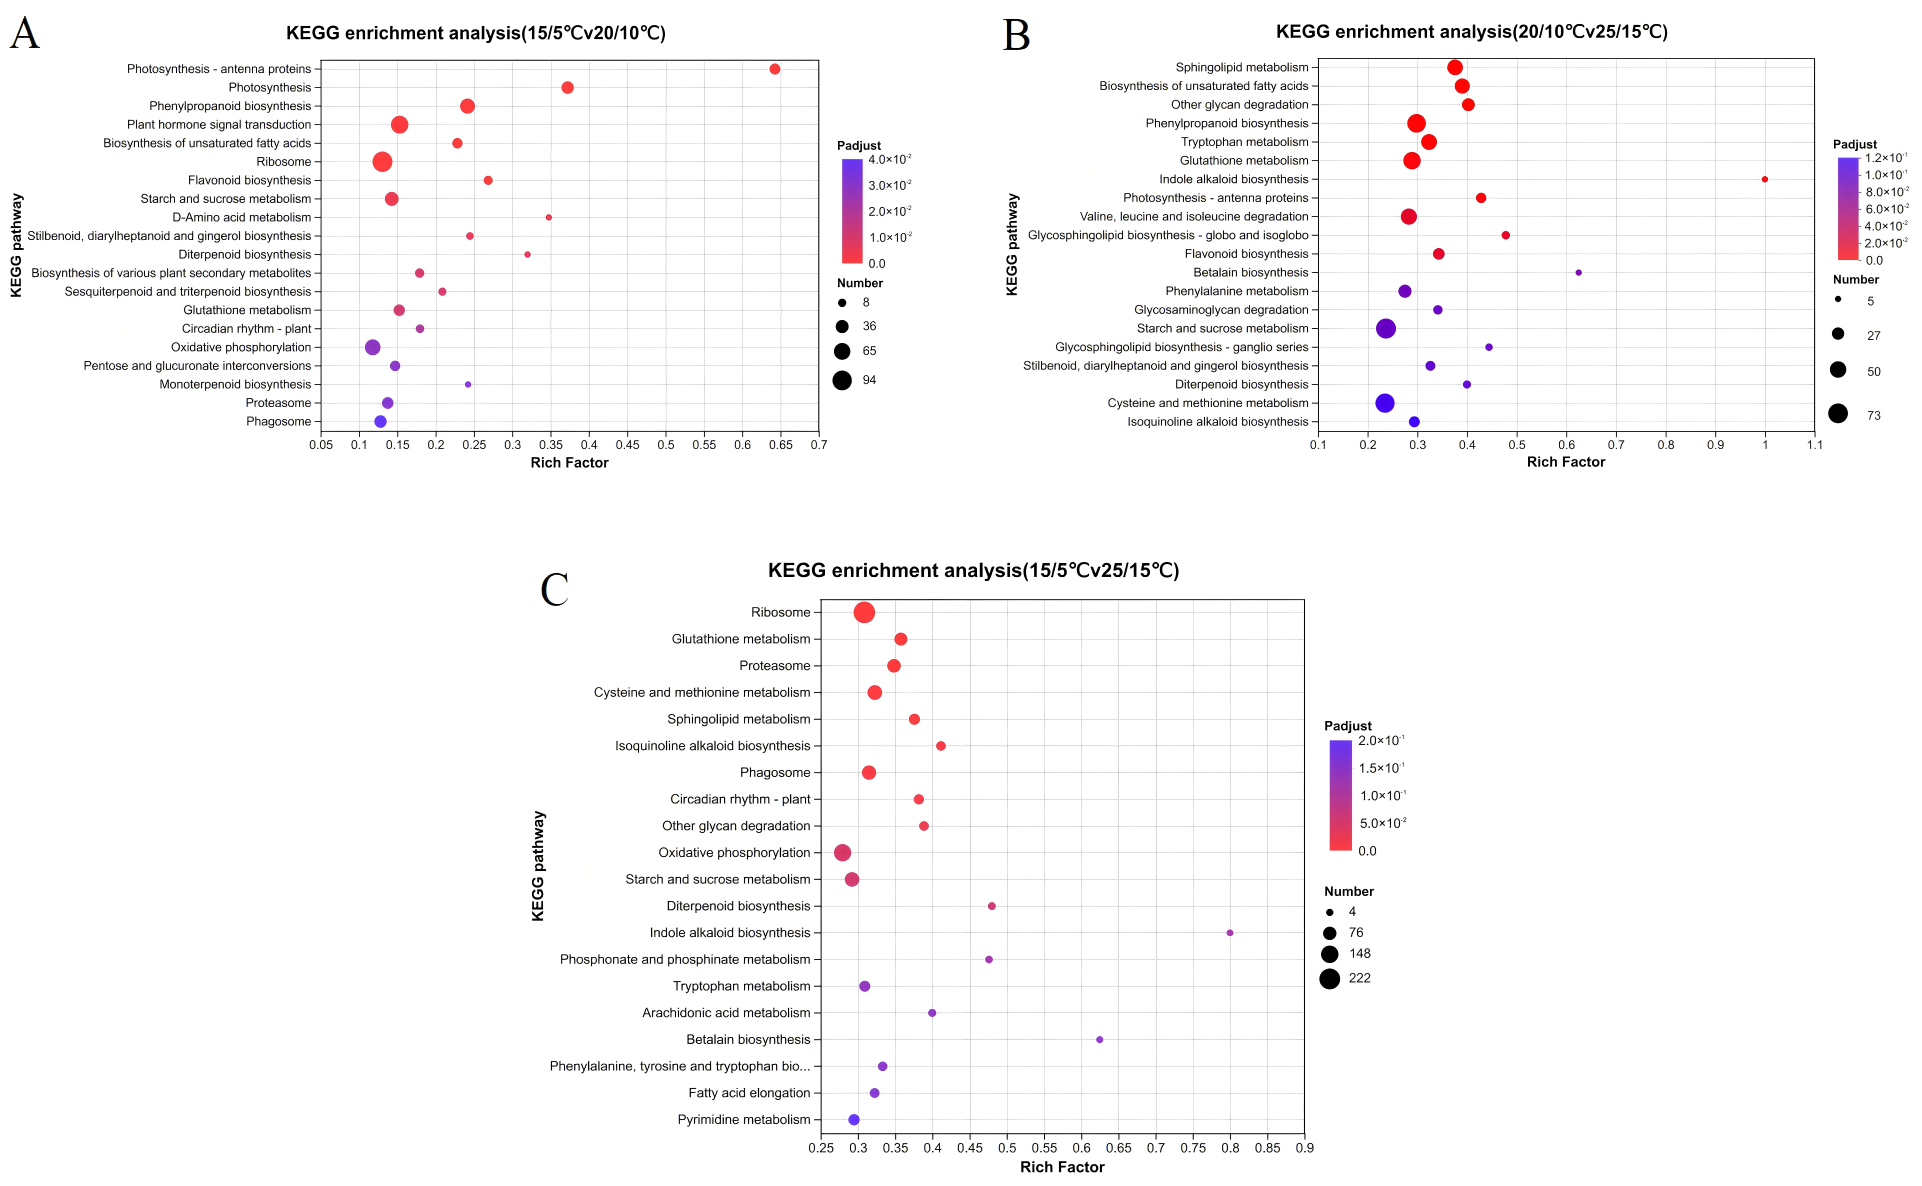
Based on sequence annotation, unigenes were assigned to KEGG pathways across five branches—metabolism, genetic information processing, environmental information processing, cellular processes, and organismal systems (Figure 6B). Unigenes were annotated against six public databases—NR, Swiss‑Prot, Pfam, eggNOG, GO, and KEGG—using Diamond with an E‑value cutoff of 1.0 × 10⁻⁵ (HMMER for Pfam; BLAST2GO for GO); 54,193 unigenes (53.58%) were annotated in at least one database (Figure 6C). The biological replicates were highly reproducible (within-treatment Pearson r = 0.997–1.000; Figure 7), and the numbers of up- and down-regulated DEGs in each pairwise contrast are shown in Figure 8. KEGG over-representation analysis was then conducted separately for each pairwise contrast, and the DEG number, gene ratio and adjusted p value of every enriched pathway are shown for the three contrasts in Figure 9A–C. The flavonoid biosynthesis pathway (map00941) underlying flower color was significantly enriched across the contrasts.
Figure 6. GO and KEGG functional classification of DEGs under different temperature treatments. (A): GO functional classification (molecular function, cellular component and biological process); (B): KEGG pathway classification (five first-level branches); (C): Distribution statistics of unigenes annotated against six public databases (NR, Swiss-Prot, Pfam, eggNOG, GO, KEGG). Panels (A–C) show annotation distributions rather than statistical enrichment; contrast-specific statistical enrichment is provided in Figure 9.
Horticulturae 12 01246 g006
Figure 7. Sample correlation and hierarchical clustering of the nine RNA-seq libraries. Colors and in-cell values indicate the pairwise Pearson correlation coefficient (R) between libraries. The three biological replicates of each temperature treatment cluster together, with within-treatment R of 0.997–1.000.
Horticulturae 12 01246 g007
Figure 8. Numbers of up- and down-regulated differentially expressed genes (DEGs) in each pairwise comparison. Red and blue denote up-and down-regulated genes, respectively (|log2FC| ≥ 1, FDR < 0.05). T15_vs_T20, T20_vs_T25 and T15_vs_T25 correspond to the 15/5 vs. 20/10, 20/10 vs. 25/15, and 15/5 vs. 25/15 °C comparisons, comprising 6384 (4231 up/2153 down), 10,286 (7511/2775), and 13,457 (5033/8424) DEGs, respectively.
Horticulturae 12 01246 g008
Figure 9. KEGG pathway enrichment of differentially expressed genes (DEGs) for each pairwise temperature comparison. (A), 15 °C/5 °C vs. 20 °C/10 °C; (B), 20 °C/10 °C vs. 25 °C/15 °C; (C), 15 °C/5 °C vs. 25 °C/15 °C. The horizontal axis is the enrichment factor; bubble size represents the number of DEGs assigned to the pathway, and bubble color denotes the adjusted p value.
Horticulturae 12 01246 g009
In the anthocyanin biosynthetic pathway, the key structural genes CHI2, DFR, ANS, and UFGT, together with the two F3H genes, exhibited the highest expression at 20/10 °C, with TPM values significantly higher than those at 15/5 °C and/or 25/15 °C. The expression pattern of FNSII differed from that of the other anthocyanin structural genes. FNSII (TRINITY_DN9969_c0_g1) was lowest at 15/5 °C and highest at 25/15 °C, and its expression at 15/5 °C was significantly lower than at 20/10 °C and 25/15 °C. Both MYB and bHLH transcription factors showed a consistent upregulation trend at 20/10 °C (Table 4).

3.7. qRT–PCR Validation

To validate the accuracy of the RNA-seq data, six DEGs, namely, CHS2, CHI2, MYBP, MYB1R1, R2R3MYB, and bHLH63, were randomly selected for qRT-PCR validation. The qRT-PCR and RNA-Seq results were essentially consistent, indicating the high accuracy of the RNA-Seq data and the reliability of the results (Figure S1).

4. Discussion

4.1. Effects of Temperature on Flower Bud Differentiation and Its Production Implications

Temperature significantly affected flower bud differentiation. Both 20 °C/10 °C and 25 °C/15 °C accelerated differentiation, which was completed in 46 and 41 d, respectively; although 20 °C/10 °C took 5 d longer, it produced the highest anthocyanin, flavonoid, and carotenoid accumulation and the most vivid flowers. The 15 °C/5 °C regime, although it ultimately allowed flowering, required up to 100 d and markedly delayed tubular-floret differentiation, ovule and pollen formation, and pigment accumulation, whereas the 30 °C/20 °C and higher regimes led to the cessation of flower bud differentiation and even withered aboveground plant parts, in line with reports that developmental rates decline at low temperatures and reproductive growth is inhibited above a mean daily temperature of about 30 °C [30]. Because crop time thus directly governs annual turnover and the heating, bench-space, and labor cost per plant, adjusting day/night temperature offers a practical means of scheduling flowering to high-demand, high-price festive and peak-market windows at minimum energy cost [31,32,33]. Among the treatments, 20 °C/10 °C combined a near-minimal cycle with the best visual quality and the highest pigment and carbohydrate levels; as flower color and overall appearance are the primary attributes driving consumer choice and determining potted-plant grade and price [34], this regime provided the best balance between quality and turnover. This approach—regulating the environmental temperature during the dahlia growing period—can not only adjust the time to market but also provide diverse flower colors. Compared with breeding approaches used to obtain cultivars with different flower colors, it is undoubtedly very economical.

4.2. Effects of Temperature on Flower Color

Flower color is one of the most important ornamental traits in ornamental plants. Dahlia flower color is closely associated with flavonoid accumulation; dark-red varieties accumulate more anthocyanins in their petals [5,35]. The expression of key structural genes in the anthocyanin biosynthetic pathway was consistent with the phenotype of the highest relative anthocyanin and flavonoid indices and the most vivid flower color at 20/10 °C. Anthocyanin accumulation is strongly temperature-dependent: low temperature generally promotes accumulation and intensifies color, whereas high temperature commonly causes color fading [36]. In cut peony flowers, low temperatures (15 °C and 4 °C) significantly increased anthocyanin content and upregulated structural genes including PsCHS1, PsCHI1, PsANS1, PsDFR1 and the transcription factor PsMYB2 [37]. Reducing day/night temperature from 25 °C/20 °C to 15 °C/10 °C nearly doubled anthocyanin content in chrysanthemum (Chrysanthemum morifolium) ray florets, changing color from light pink to deep rose, whereas 30 °C/25 °C high temperature almost completely blocked pigment accumulation and caused color fading [38]. Similar low-temperature-promoted anthocyanin accumulation has been repeatedly confirmed in rose, petunia, and herbaceous peony [39,40]. Upregulation of UFGT is important for the production of colored pigments and for stabilizing anthocyanins, and contributes to the accumulation of water-soluble pigments in the vacuole [41]. Reduced UFGT expression or activity is commonly associated with lower anthocyanin accumulation. Anthocyanin content changes in litchi (Litchi chinensis) pericarp were consistent with UFGT activity trends [42]. Studies in lotus (Nelumbo nucifera ‘Yehonglian’) [43] and grape (Vitis vinifera) [44] also indicated that UFGT was the most important gene related to anthocyanin biosynthesis and accumulation, and was crucial for red pigment accumulation.
However, among the three treatments (15 °C/5 °C, 20 °C/10 °C, and 25 °C/15 °C), the relative anthocyanin index was highest at 20 °C/10 °C and lowest at 15 °C/5 °C, suggesting that, within the tested range, 20 °C/10 °C was the most favorable regime for pigment accumulation in dahlia flowers. This is consistent with findings that apple peel anthocyanin content peaks at 15–20 °C [45] and grape ‘Kyoho’ coloration is deeper at 20 °C than at 15 °C [46]. The response of ‘Hypnotica Tropical Breeze’ resembles that of the red dahlia ‘Nessho’, which fades toward orange under low temperature; low temperature can enhance flavone synthase (DvFNS) expression and flavone accumulation at the expense of anthocyanin [21,22], whereas post-transcriptional silencing of FNS conversely leads to high anthocyanin accumulation in black dahlia cultivars [47]. The transcriptome analysis revealed that DEGs under different temperature treatments were mainly enriched in carbohydrate metabolism and flavonoid biosynthesis pathways. Under 20 °C/10 °C, both UFGT and FNSII had the highest expression levels; at 15 °C/5 °C, FNSII expression was relatively low, which is inconsistent with the conclusion that winter low temperature enhances FNSII expression [25]. Under the 15 °C/5 °C treatment, the night temperature of 5 °C resulted in less photosynthetic product accumulation; soluble sugar and starch contents were significantly lower than at 20 °C/10 °C and 25 °C/15 °C. Since soluble sugars serve as carbon skeletons for phenolic pigments such as anthocyanins and flavonoids [48], the low-temperature (15 °C/5 °C) treatment—which suppressed photosynthetic carbon assimilation and enzymatic activity—likely restricted carbohydrate accumulation in petals and delayed the carbohydrate reserves needed for flowering. In chrysanthemum, low night temperature increases starch accumulation at the expense of soluble sugars [49].

5. Conclusions

Among the tested day/night temperature regimes, 20 °C/10 °C was optimal for flower bud differentiation and flowering quality in dahlia ‘Hypnotica Tropical Breeze’, completing differentiation in 46 days and producing the most vivid ray florets with the highest relative anthocyanin and flavonoid indices. Temperatures above 30 °C should be avoided to prevent differentiation failure or plant death. Temperature-dependent color variation was associated with altered anthocyanin and flavonoid accumulation; the palest color and lowest relative anthocyanin index at 15 °C/5 °C may be related to reduced photosynthetic product accumulation. Transcriptomic analysis identified UFGT and FNSII as differentially expressed genes with lower expression at 15 °C/5 °C, consistent with the lower pigment contents, suggesting their possible involvement in temperature-mediated flower color regulation.

Supplementary Materials

The following supporting information can be downloaded at https://www.mdpi.com/article/10.3390/horticulturae12101246/s1. The Supplementary Material for this article can be found in Tables S1 and S2 and Figure S1. Table S1. List of qRT-PCR primers. Table S2. Composition of the 10 µL qRT-PCR reaction mixture per well. No ROX reference dye is required on the Roche LightCycler 96; each sample was run in three technical replicate wells, and a no-template control (NTC) was included. Figure S1. qRT-PCR validation of six differentially expressed genes. In panels (a–f), blue bars denote the mean qRT-PCR relative expression (left y-axis; mean ± SE, n = 3) and red lines with markers denote the RNA-seq TPM values (right y-axis; mean ± SE of three biological replicates) under the 15/5, 20/10, and 25/15 °C treatments. Panel (g) shows the agreement between the two platforms after within-gene min–max normalization across all 18 gene × treatment points (Pearson r = 0.798, p = 7.13 × 10⁻⁵).

Author Contributions

Conceptualization, D.X. and S.N.; methodology, J.L., Q.B.; investigation, Z.Z.; writing, W.W.; writing—review and editing, D.C. and L.H.; funding acquisition: D.X.; Resources, Y.C. All authors have read and agreed to the published version of the manuscript.

Funding

This work was supported by the Hebei Province Natural Science Foundation [grant number C2022204240] and the Open Fund of the National Engineering Research Center for Ornamental Horticulture and Yunnan Provincial Key Laboratory of Flower Breeding (Grant No. FKL-202305, FKL-202402).

Data Availability Statement

All data supporting the findings of this study are available within the paper and its Supplementary Materials published online. The RNA-seq raw reads and the de novo transcriptome assembly reported in this paper have been deposited in the NCBI Sequence Read Archive (SRA) under BioProject accession number PRJNA1531728 (https://www.ncbi.nlm.nih.gov/bioproject/PRJNA1531728, accessed on 18 September 2026).

Conflicts of Interest

The authors declare no conflicts of interest.

References

  1. Leeggangers, H.A.; Nijveen, H.; Bigas, J.N.; Hilhorst, H.W.M.; Immink, R.G.H. Molecular regulation of temperature-dependent floral induction in Tulipa gesneriana. Plant Physiol. 2017, 173, 1904–1919. [Google Scholar] [CrossRef] [Scilit] [PubMed]
  2. Horvath, D. Common mechanisms regulate flowering and dormancy. Plant Sci. 2009, 177, 523–531. [Google Scholar] [CrossRef] [Scilit]
  3. Lu, C.Q.; Wu, J.Q.; Gao, J.; Lin, Z.Y.; Li, S.H.; Zhang, K.R.; Wei, Y.L.; Li, J.; Xie, Q.; Jin, J.P.; et al. Comparative transcriptomic analysis identifies key regulatory factors in low temperature-induced flowering in Dendrobium. Ornam. Plant Res. 2026, 6, e017. [Google Scholar] [CrossRef] [Scilit]
  4. Zhang, Y.J.; Li, A.; Liu, X.Q.; Sun, J.X.; Guo, W.J.; Zhang, J.W.; Lyu, Y.M. Changes in the morphology of the bud meristem and the levels of endogenous hormones after low temperature treatment of different Phalaenopsis cultivars. S. Afr. J. Bot. 2019, 125, 499–504. [Google Scholar] [CrossRef] [Scilit]
  5. Muraoka, Y.; Ohori, K.; Sasaki, M. Studies on the abnormal acceleration of flowering in tobacco plant: II. Effect of temperature on the differentiation of flower bud. Jpn. J. Crop Sci. 2008, 21, 302–303. [Google Scholar]
  6. Hidaka, K.; Dan, K.; Imamura, H.; Takayama, T. Crown-cooling treatment induces earlier flower bud differentiation of strawberry under high air temperatures. Environ. Control Biol. 2017, 55, 21–27. [Google Scholar] [CrossRef] [Scilit][Green Version]
  7. Anita, S.; Ola, M.H. Temperature effects on growth and floral initiation in sweet cherry (Prunus avium L.). Sci. Hortic. 2019, 257, 108762. [Google Scholar] [CrossRef] [Scilit]
  8. Khodorova, N.V.; Boitel-Conti, M. The role of temperature in the growth and flowering of geophytes. Plants 2013, 2, 699–711. [Google Scholar] [CrossRef] [Scilit] [PubMed]
  9. Chen, X.C.; Zhao, H.M.; Wang, S.; Wu, S.M.; Xiang, L.; Chan, Z.L.; Wang, Y.P. Analysis of floral bud differentiation and related genes expression under different temperatures in Tulipa gesneriana. Acta Hortic. Sin. 2023, 50, 1037–1047. (In Chinese) [Google Scholar]
  10. Noy-Porat, T.; Flaishman, M.A.; Eshel, A.; Sandler-Ziv, D.; Kamenetsky, R. Florogenesis of the Mediterranean geophyte Narcissus tazetta and temperature requirements for flower initiation and differentiation. Sci. Hortic. 2009, 120, 138–142. [Google Scholar] [CrossRef] [Scilit]
  11. Kumar, S.; Malik, J.; Thakur, P.; Kaistha, S.; Sharma, K.D.; Upadhyaya, H.D.; Berger, J.D.; Nayyar, H. Growth and metabolic responses of contrasting chickpea (Cicer arietinum L.) genotypes to chilling stress at reproductive phase. Acta Physiol. Plant. 2011, 33, 779–787. [Google Scholar] [CrossRef] [Scilit]
  12. Zhang, Y.; Qu, X.; Li, X.; Ren, M.; Tong, Y.; Wu, X.; Sun, Y.; Wu, F.; Yang, A.; Chen, S. Comprehensive transcriptome and WGCNA analysis reveals the potential function of anthocyanins in low-temperature resistance of a red flower mutant tobacco. Genomics 2023, 115, 110728. [Google Scholar] [CrossRef] [Scilit] [PubMed]
  13. Liu, H.; Liu, Z.; Wu, Y.; Zheng, L.; Zhang, G. Regulatory mechanisms of anthocyanin biosynthesis in apple and pear. Int. J. Mol. Sci. 2021, 22, 8441. [Google Scholar] [CrossRef] [Scilit] [PubMed]
  14. Yan, H.; Pei, X.; Zhang, H.; Li, X.; Zhang, X.; Zhao, M.; Chiang, V.L.; Sederoff, R.R.; Zhao, X. MYB-mediated regulation of anthocyanin biosynthesis. Int. J. Mol. Sci. 2021, 22, 3103. [Google Scholar] [CrossRef] [Scilit] [PubMed]
  15. Huang, Z.A.; Zhao, T.; Fan, H.J.; Wang, N.; Zheng, S.S.; Ling, H.Q. The upregulation of NtAN2 expression at low temperature is required for anthocyanin accumulation in juvenile leaves of Lc-transgenic tobacco (Nicotiana tabacum L.). J. Genet. Genom. 2012, 39, 149–156. [Google Scholar] [CrossRef] [Scilit] [PubMed]
  16. Zhang, Y.; Liu, Y.; Hu, W.; Sun, B.; Chen, Q.; Tang, H. Anthocyanin accumulation and related gene expression affected by low temperature during strawberry coloration. Acta Physiol. Plant. 2018, 40, 192. [Google Scholar] [CrossRef] [Scilit]
  17. Naing, A.H.; Park, D.Y.; Park, K.I.; Kim, C.K. Differential expression of anthocyanin structural genes and transcription factors determines coloration patterns in gerbera flowers. 3 Biotech 2018, 8, 393. [Google Scholar] [CrossRef] [Scilit] [PubMed]
  18. Zhou, L.J.; Geng, Z.; Wang, Y.; Wang, Y.; Liu, S.; Chen, C.; Song, A.; Jiang, J.; Chen, S.; Chen, F. A novel transcription factor CmMYB012 inhibits flavone and anthocyanin biosynthesis in response to high temperatures in chrysanthemum. Hortic. Res. 2021, 8, 248. [Google Scholar] [CrossRef] [Scilit] [PubMed]
  19. Rehman, R.N.U.; You, Y.; Zhang, L.; Goudia, B.D.; Khan, A.R.; Li, P.; Ma, F. High temperature induced anthocyanin inhibition and active degradation in Malus profusion. Front. Plant Sci. 2017, 8, 1401. [Google Scholar] [CrossRef] [Scilit] [PubMed]
  20. Yamagishi, M. High temperature enhances anthocyanin coloration in Asiatic hybrid lily flowers via upregulation of the MYB12 positive regulator. Hortic. Plant J. 2022, 8, 769–776. [Google Scholar] [CrossRef] [Scilit]
  21. Li, Y.R.; Zhao, F.; Zhang, S.S.; Hong, Y.; Gesang, P.C.; Cui, Y.N.; Wang, Z.H.; Min, Z.P.; Zeng, X.L. Adaptive evaluation of special Dutch potted dahlia cultivars in a Lhasa greenhouse. J. Plateau Agric. 2019, 3, 198–202. (In Chinese) [Google Scholar]
  22. Duan, Q.; Wang, X.N.; Guo, Y. Introduction of dahlia cultivars and cut-flower production in the Kunming area. China Flowers Hortic. 2018, 18, 27. (In Chinese) [Google Scholar]
  23. Liu, A.C.; Wang, Q.; Pang, C.M. Advances in horticultural study of dahlia in China. North. Hortic. 2010, 11, 225–228. (In Chinese) [Google Scholar]
  24. Okada, H.; Tauchi, Y.; Asawa, Y.K.A.; Kikumura, T.; Kitamura, Y. A dahlia cultivar ‘Nessho’ comprises plants with various low temperature sensitivity for color fading occurrence in ray florets. J. Shita. 2020, 32, 29–36. [Google Scholar] [CrossRef] [Scilit]
  25. Muthamia, E.K.; Naito, K.; Okada, H.; Karasawa, Y.; Kikumura, T.; Nara, T.; Hamauzu, Y.; Motoki, K.; Yasuba, K.; Yoshida, Y.; et al. Elucidation of low-temperature regulated flavone synthesis in Dahlia variabilis and its effects on flower color. Hort. J. 2024, 93, 335–343. [Google Scholar] [CrossRef] [Scilit]
  26. Li, H.P. Plant Microtechnology; Science Press: Beijing, China, 2009; pp. 9–47. (In Chinese) [Google Scholar]
  27. Fu, M.; Yang, X.; Zheng, J.; Wang, L.; Yang, X.; Tu, Y.; Ye, J.; Zhang, W.; Liao, Y.; Cheng, S.; et al. Unraveling the regulatory mechanism of color diversity in Camellia japonica petals by integrative transcriptome and metabolome analysis. Front. Plant Sci. 2021, 12, 685136. [Google Scholar] [CrossRef] [Scilit] [PubMed]
  28. Meng, F.; Liu, H.; Hu, S.; Jia, C.; Zhang, M.; Li, S.; Li, Y.; Lin, J.; Jian, Y.; Wang, M.; et al. The brassinosteroid signaling component SlBZR1 promotes tomato fruit ripening and carotenoid accumulation. J. Integr. Plant Biol. 2023, 65, 1794–1813. [Google Scholar] [CrossRef] [Scilit] [PubMed]
  29. Li, H.S. Principles and Techniques of Plant Physiological Biochemical Experiment; Higher Education Press: Beijing, China, 2000; pp. 184–195. (In Chinese) [Google Scholar]
  30. Brøndum, J.J.; Heins, R.D. Modeling temperature and photoperiod effects on growth and development of dahlia. J. Am. Soc. Hortic. Sci. 1993, 118, 36–42. [Google Scholar] [CrossRef] [Scilit]
  31. Chandel, A.; Thakur, M.; Singh, G.; Dogra, R.; Bajad, A.; Soni, V.; Bhargava, B. Flower regulation in floriculture: An agronomic concept and commercial use. J. Plant Growth Regul. 2023, 42, 2136–2161. [Google Scholar] [CrossRef] [Scilit]
  32. Blanchard, M.G.; Runkle, E.S. The influence of day and night temperature fluctuations on growth and flowering of annual bedding plants and greenhouse heating cost predictions. HortScience 2011, 46, 599–603. [Google Scholar] [CrossRef] [Scilit]
  33. Runkle, E.S.; Blanchard, M.G.; Frantz, J.M. Using flowering and heat-loss models for improving greenhouse energy-use efficiency in annual bedding plant production. Acta Hortic. 2012, 957, 99–106. [Google Scholar] [CrossRef] [Scilit]
  34. Middleton, L. South African consumers’ selection criteria for ornamental plants: A market perspective. S. Afr. J. Plant Soil. 2015, 32, 253–255. [Google Scholar] [CrossRef] [Scilit]
  35. Ohno, S. Flavonoid biosynthesis in dahlia (Dahlia variabilis) flowers. Hort. J. 2025, 94, 429–437. [Google Scholar]
  36. Gu, K.; Wang, C.; Hu, D.; Hao, Y. How do anthocyanins paint our horticultural products? Sci. Hortic. 2019, 249, 257–262. [Google Scholar] [CrossRef] [Scilit]
  37. Du, D.; Zhang, C.; Gao, S.; Dong, L. Effect of low temperature on flower color and anthocyanin biosynthesis in tree peony( Paeonia suffruticosa) ‘Luoyang Hong’ cut flower. J. Plant Genet. Resour. 2016, 17, 295–302. (In Chinese) [Google Scholar]
  38. Chen, S.; Liu, Y.; Wang, L.; Zhang, Z. Low temperature enhances anthocyanin accumulation in Chrysanthemum morifolium by up-regulating structural genes. Sci. Hortic. 2019, 246, 100–107. [Google Scholar]
  39. Wang, H.; Liu, J.; Gao, M. Temperature-dependent regulation of anthocyanin biosynthesis in Rosa hybrida. Plant Physiol. Biochem. 2020, 152, 134–142. [Google Scholar]
  40. Zhang, Y.; Li, X.; Sun, J. Warm temperatures inhibit anthocyanin accumulation in herbaceous peony and petunia. Front. Plant Sci. 2021, 12, 658901. [Google Scholar] [PubMed]
  41. Wu, X.; Gong, Q.; Ni, X.; Zhou, Y.; Gao, Z. UFGT: The key enzyme associated with the petals variegation in Japanese apricot. Front. Plant Sci. 2017, 8, 108. [Google Scholar] [CrossRef] [Scilit] [PubMed]
  42. Wei, Y.Z.; Hu, F.C.; Hu, G.B.; Li, X.J.; Huang, X.M.; Wang, H.C. Differential expression of anthocyanin biosynthetic genes in relation to anthocyanin accumulation in the pericarp of Litchi chinensis Sonn. PLoS ONE 2011, 6, e19455. [Google Scholar] [CrossRef] [Scilit] [PubMed]
  43. Deng, J.; Li, J.J.; Su, M.Y.; Chen, L.; Yang, P.F. Characterization of key genes involved in anthocyanins biosynthesis in Nelumbo nucifera through RNA-Seq. Aquat. Bot. 2021, 174, 103428. [Google Scholar] [CrossRef] [Scilit]
  44. Kobayashi, S.; Ishimaru, M.; Ding, C.K.; Yakushiji, H.; Goto, N. Comparison of UDP-glucose: Flavonoid 3-O-glucosyltransferase (UFGT) gene sequences between white grapes (Vitis vinifera) and their sports with red skin. Plant Sci. 2001, 160, 543–550. [Google Scholar] [CrossRef] [Scilit] [PubMed]
  45. Wang, K.L.; Micheletti, D.; Palmer, J.; Volz, R.; Lozano, L.; Espley, R.; Hellens, R.P.; Chagnè, D.; Rowan, D.D.; Troggio, M.; et al. High temperature reduces apple fruit colour via modulation of the anthocyanin regulatory complex. Plant Cell Environ. 2011, 34, 1176–1190. [Google Scholar] [CrossRef] [Scilit] [PubMed]
  46. Yamane, T.; Jeong, S.T.; Goto-Yamamoto, N. Effects of temperature on anthocyanin biosynthesis in grape berry skins. Am. J. Enol. Vitic. 2006, 57, 54–59. [Google Scholar] [CrossRef] [Scilit]
  47. Deguchi, A.; Tatsuzawa, F.; Doi, M. Endogenous post-transcriptional gene silencing of flavone synthase resulting in high accumulation of anthocyanins in black dahlia cultivars. Planta 2013, 237, 1325–1335. [Google Scholar] [CrossRef] [Scilit] [PubMed]
  48. Solfanelli, C.; Poggi, A.; Loreti, E.; Alpi, A.; Perata, P. Sucrose-specific induction of the anthocyanin biosynthetic pathway in Arabidopsis. Plant Physiol. 2006, 140, 637–646. [Google Scholar] [CrossRef] [Scilit] [PubMed]
  49. Kjaer, K.H.; Thorup-Kristensen, K.; Rosenqvist, E.; Aaslyng, J.M. Leaf carbohydrate contents and growth of Chrysanthemum morifolium in response to low night temperatures and high CO2. Eur. J. Hortic. Sci. 2010, 75, 53–60. [Google Scholar] [CrossRef] [Scilit]
Figure 1. Morphology of dahlia plants subjected to different temperature treatments. (A), (B), (C), (D), and (E) denote the treatments at day/night temperatures of 15 °C/5 °C, 20 °C/10 °C, 25 °C/15 °C, 30 °C/20 °C, and 35 °C/25 °C, respectively.
Horticulturae 12 01246 g001
Figure 2. Comparison of floral bud development at different stages in dahlia following temperature treatments. (A–C) denote the treatments at day/night temperatures of 15 °C/5 °C, 20 °C/10 °C and 25 °C/15 °C respectively. LE: Leaf; GRP: Growing point; OBR: Out bract primordium; IBR: Inner bract primordium; LFP: Ligulate flower primordium; LF: Ligulate flower; OB: Out bract; IB: Inner bract; TFP: Tubular flower bud primordium; TC: Tubular corolla primordium; TS: Tubular stamen primordium; TP: Tubular pistil primordium; OP: Ovule primordium; AN: Anther; FI: Filament; ST: Style; OV: Ovary.
Horticulturae 12 01246 g002
Figure 3. Comparison of buds after the same number of days under different temperature treatments. (A–C) are the 15 °C/5 °C, 20 °C/10 °C and 25 °C/15 °C treatments respectively.
Horticulturae 12 01246 g003
Figure 4. Pigment contents in ray florets at the full bloom stage. (A) Relative flavonoid index (U/g FW); (B) Relative anthocyanin index (U/g FW); (C) Carotenoid content (mg/g FW). Different lowercase letters indicate remarkable differences among treatments at the 0.05 significance level. Anthocyanin and flavonoid values are relative spectrophotometric indices. Data are mean ± SE of three independent pooled samples (n = 3, each pooled from three plants).
Horticulturae 12 01246 g004
Figure 5. Soluble sugar and starch contents of ray florets at the full bloom stage. (A) Soluble sugar content (mg/g DW); (B) Starch content (mg/g DW). Different lowercase letters indicate distinct differences among treatments at the 0.05 significance level. Data are mean ± SE of three independent pooled samples (n = 3, each pooled from three plants).
Horticulturae 12 01246 g005
Table 1. Days required for flower bud differentiation to each stage under different temperature treatments. Values are the number of days from the start of treatment to each flower-bud differentiation stage, expressed as mean ± SE of three independent plants (n = 3). Different lowercase letters within a column indicate significant differences among temperature treatments at p < 0.05 by one-way ANOVA followed by Duncan’s multiple range test.
Differentiation StagesInitiation Stage of Flower Bud DifferentiationStage of Bract Primordium DifferentiationStage of Ray Floret DifferentiationStage of Tubular Floret DifferentiationStage of Ovule and Pollen FormationTotal Days
15 °C/5 °C9 ± 1.0 a19 ± 1.0 a26 ± 1.4 a67 ± 2.6 a100 ± 2.0 a100 ± 2.8 a
20 °C/10 °C6 ± 0.7 b10 ± 1.0 b14 ± 1.2 b30 ± 1.6 b46 ± 2.6 b46 ± 2.8 b
25 °C/15 °C6 ± 0.7 b9 ± 1.2 b12 ± 1.2 b27 ± 1.6 b41 ± 1.7 c41 ± 2.0 c
Table 2. Color parameters of the tip of ray florets under different temperature treatments. Color parameters were measured at the tip of ray florets. Data are mean ± SE of three independent plants (n = 3), with five flowers averaged per plant. Different lowercase letters indicate significant differences among treatments at the 0.05 level by one-way ANOVA followed by Duncan’s multiple range test. L* = lightness; a* = red–green axis (positive = red); b* = yellow–blue axis (positive = yellow); C* = chroma.
TreatmentFlower ColorL*
(Brightness)
a*
(Red–Green Axis,
Positive = Red)
b*
(Yellow–Blue Axis,
Positive = Yellow)
C*
(Chroma)
15 °C/5 °CHorticulturae 12 01246 i00190.15 ± 0.11 a−3.80 ± 0.17 b15.08 ± 0.67 a15.55 ± 0.65 b
20 °C/10 °CHorticulturae 12 01246 i00264.19 ± 0.53 c35.75 ± 0.69 a5.40 ± 0.28 b36.16 ± 0.04 a
25 °C/15 °CHorticulturae 12 01246 i00388.70 ± 0.16 b−3.75 ± 0.17 b17.56 ± 0.98 a17.96 ± 0.15 b
Table 3. Sample sequencing quality evaluation statistics.
Sample NameRaw ReadsClean ReadsError Rate (%)Q20(%)Q30(%)GC Content (%)
15 °C/5 °C-146,053,75045,741,6780.024398.3694.8944.01
15 °C/5 °C-241,328,48041,046,3660.024398.3594.8944.03
15 °C/5 °C-340,893,39040,639,9200.024298.4094.9744.03
20 °C/10 °C-147,861,16847,554,7060.024298.3894.9244.21
20 °C/10 °C-245,952,38045,667,0860.024198.4495.1244.22
20 °C/10 °C-345,627,36245,294,4020.02498.4595.1344.14
25 °C/15 °C-145,698,87045,424,9540.024198.4195.0043.96
25 °C/15 °C-241,782,48641,500,4540.02498.4795.2144.02
25 °C/15 °C-347,561,36647,231,0160.024298.3894.9643.96
Table 4. Normalized expression (TPM), log2 fold change (log2FC) and adjusted p value (FDR) of flower-color-related structural genes and MYB/bHLH transcription factors. Positive/negative log2FC indicates up-/down-regulation.
Gene idGene NameDescriptionNormalized Expression (TPM, Mean of n = 3)15/5 vs. 20/10 °C20/10 vs. 25/15 °C15/5 vs. 25/15 °C
15/5 °C20/10 °C25/15 °Clog2FCFDRlog2FCFDRlog2FCFDR
TRINITY_DN2545_c0_g1CHS2chalcone synthase 272.10124.4732.92——2.11<1.0 × 10−3001.261.25 × 10−101
TRINITY_DN28502_c0_g1CHSchalcone synthase0.050.133.48——−2.601.47 × 10-3−3.943.55 × 10−4
TRINITY_DN11590_c0_g1CHI2chalcone isomerase 26.1032.504.90−2.445.61 × 10−692.921.59 × 10−94——
TRINITY_DN12382_c0_g1F3′Hflavanone 3-hydroxylase1.9112.981.84−2.732.01 × 10−593.008.60 × 10−72——
TRINITY_DN17731_c0_g2F3Hflavanone 3-hydroxylase6.3214.970.70−1.271.27 × 10−214.629.91 × 10−783.322.67 × 10−30
TRINITY_DN22296_c0_g3DFRdihydroflavonol-4-reductase15.3867.167.42−2.153.39 × 10−203.383.85 × 10−2991.193.49 × 10−5
TRINITY_DN17227_c0_g1ANSanthocyanidin synthase1.685.731.02−1.801.92 × 10−162.686.34 × 10−29——
TRINITY_DN9969_c0_g1FNSIIflavone synthase II1.645.097.83−1.652.96 × 10−14——−2.122.38 × 10−27
TRINITY_DN1071_c0_g1UFGTUDP-glucose: flavonoid 3-O-glucosyltransferase14.2430.9817.45−1.171.81 × 10−521.046.06 × 10−47——
TRINITY_DN50720_c0_g2MYBR2R3-MYB transcription factor1.894.351.66−1.232.89 × 10−61.582.21 × 10−9——
TRINITY_DN14385_c0_g3bHLHbHLH transcription factor 1572.246.243.30−1.512.22 × 10−251.115.43 × 10−19——
TRINITY_DN1002_c1_g1bHLHbHLH transcription factor0.373.641.80−3.654.82 × 10−181.162.89 × 10−6−2.522.76 × 10−7
Disclaimer/Publisher’s Note: The statements, opinions and data contained in all publications are solely those of the individual author(s) and contributor(s) and not of MDPI and/or the editor(s). MDPI and/or the editor(s) disclaim responsibility for any injury to people or property resulting from any ideas, methods, instructions or products referred to in the content.