Article

Ginseng Quality Identification Based on Multi-Scale Feature Extraction and Knowledge Distillation

1
Institute of Information Technology, Jilin Agricultural University, Changchun 130118, China
2
College of Internet of Things Engineering, Wuxi University, Wuxi 214105, China
*
Author to whom correspondence should be addressed.
Horticulturae 2025, 11(9), 1120; https://doi.org/10.3390/horticulturae11091120
Submission received: 7 August 2025 / Revised: 1 September 2025 / Accepted: 12 September 2025 / Published: 15 September 2025
(This article belongs to the Section Medicinals, Herbs, and Specialty Crops)

Abstract

As demand for the precious medicinal herb ginseng continues to grow, its importance is becoming ever more prominent. Traditional manual methods are inefficient and inconsistent. Thus, improving the accuracy and efficiency of ginseng quality testing is the central objective of this study. We collected ginseng samples and expanded the dataset through augmentation, which added noise, varied lighting, and surface defects such as red rust and insect damage, to reflect real-world conditions. Because ginseng has intricate textures, irregular shapes, and unstable lighting, we built LLT-YOLO on the YOLOv11 framework, adding a DCA module, depth-wise separable convolutions, an efficient multi-scale attention mechanism, and knowledge distillation to boost accuracy on small devices. Tests showed a precision of 90.5%, a recall of 92.3%, an mAP50 of 95.1%, and an mAP50–95 of 77.4%, gains of 3%, 2.2%, 7.8%, and 0.5% over YOLOv11 with fewer parameters and smaller size, confirming LLT-YOLO as a practical tool for appearance-based ginseng grading that can be extended to other crops. The results indicate that LLT-YOLO offers a practical tool for appearance-based ginseng quality assessment and can be extended to other crops in future work.

1. Introduction

Ginseng (Panax ginseng C.A. Mey.) is a perennial herbaceous plant belonging to the Araliaceae family. Its rhizome has multiple effects, including replenishing qi, regulating the pulse, and strengthening the essence [1]. As the “King of Herbs,” ginseng has a medicinal history spanning over 5000 years [2,3]. Ginseng contains various active components; among them, ginsenosides are recognized as one of the primary pharmacologically active ingredients in ginseng. Ginsenosides are a group of natural bioactive compounds. They are a class of triterpenoid saponins with multiple biological activities [4], capable of regulating the functions of the cardiovascular, nervous, immune, and metabolic systems, as well as exhibiting antitumor effects [5]. They are the primary pharmacological components of ginseng [6]. They exhibit a rich structural diversity and are primarily divided into two major categories: ginsenoside diol types and ginsenoside triol types [7]. Traditional ginseng classification relies on root morphological features (such as internal structure, color, and shape), but this method suffers from low efficiency, intense subjectivity, and high professional barriers [8]. The morphological characteristics of ginseng roots directly influence the quality grades [9]. Manual grading is subjective, slow, and costly, and cannot be scaled; hence, an automated ginseng classification system is needed to improve accuracy, standardize quality control, and safeguard consumers.
New technology in computer vision and artificial intelligence (AI) [10] has changed farming. It now offers machines to check crops, which was previously conducted by hand [11]. Deep learning models (DL) for object detection offer several benefits over conventional machine learning techniques, particularly in terms of autonomous learning capabilities and image feature extraction. For instance, convolutional neural networks (CNNs) have shown outstanding potential in solving problems in complex farming environments. Li Dongming et al. [12] proposed an improved ResNet50 model for ginseng identification and grading [13]. Although these enhanced CNNs and similar methods yield good recognition results, they require a substantial amount of storage and computing resources [14], exhibit high computational complexity, and impose significant demands on hardware, making deployment on devices with limited resources challenging.
As research deepens, popular neural network algorithms, such as the YOLO series of models, have come to the forefront and gradually become the focus of attention, finding widespread application in the field of plant identification. Yang Haoyan et al. [15] developed MFD-YOLO based on YOLOv7t for strawberry growth monitoring, achieving 97.5% mAP0.5, 96.5% accuracy, 93.8% recall, and 95.0% F1 score. The model runs efficiently on desktop and Android devices, enabling rapid detection in resource-constrained environments. Li Hongwei et al. [16] enhanced YOLOv5s by integrating the ShuffleNetV2 backbone, C3RFE, BiFPN, SE attention mechanism, and simOTA, improving the speed and accuracy of dragon fruit recognition. The model achieved a classification accuracy of 97.8%, 139 FPS, and a size of 2.5 MB, making it suitable for real-time applications. Gai Rongli et al. [17] introduced an enhanced YOLO-V4, which uses DenseNet as the backbone network to enhance the extraction and fusion abilities. This method greatly improved how well small fruits like cherries are detected, achieving an F1 score of 0.947. Zhang Shujuan et al. [18] proposed an improved version of the YOLOv8n model, YOLO-RCS, which employs the RepGhostNet architecture as the backbone to achieve a lightweight design while significantly enhancing both recognition speed and precision. The resulting model occupies 4.90 MB–1.07 MB less space than YOLOv8n. Gao Jin et al. [19] created LACTA, a simple tool for finding cherry tomatoes. It achieves 94% precision, 92.5% recall, and 97.3% mean average precision (mAP). This helps automate picking cherry tomatoes. Jrondi et al. [20] examined how well DETR and YOLOv8 detect citrus fruits. DETR achieved an average precision (AP) of 0.156 across different IOU thresholds ranging from 0.50 to 0.95. This makes it suitable for finding large fruits. On the other hand, YOLOv8 was very precise and is excellent for quickly spotting different types of fruits. Wang Juxin et al. [21] developed a simple method called PG-YOLO to automatically detect pomegranate fruits. They improved YOLOv8 by changing its backbone network with Shufflenetv2. They also employed a different type of convolution in the neck layer and incorporated multi-head self-attention (MHSA) to enhance feature detection. After testing with their own pomegranate fruit dataset, the PG-YOLO model reached a mean average precision (mAP) of 93.4%. The model is only 2.2 MB in size, making it 89.9% smaller than the original YOLOv8. Jin Shouxang et al. [22] combined 3D point clouds with YOLOv11n to develop a camellia fruit detection and pose recognition model, resulting in CO-YOLO. Compared to YOLOv11n, the CO-YOLO model achieved significant improvements.
From existing studies, it can be seen that although the YOLO model has made significant progress in object detection, it still has several shortcomings in accurately detecting the appearance and quality of ginseng. In addition, early versions of the YOLO algorithm, such as YOLOv8, often have complex model architectures and high computational requirements, which can lead to insufficient feature extraction for small-sized and irregular ginseng roots, resulting in frequent missed detections and misdetections. YOLOv11, on the other hand, strikes a balance between computational efficiency and accuracy by enhancing feature extraction and optimizing the training process. However, there are several challenges in appearance-based ginseng quality detection: First, ginseng grading and quality assessment mostly rely on its relatively complex appearance features. Complex textures and irregular shapes make feature extraction and analysis more difficult because some key features of the root have small dimensions and uneven distributions, which significantly weaken the detection ability of object recognition. Secondly, ginseng appearance detection usually needs to be performed in a variety of backgrounds, and the surface may be damaged, infested, moldy, or discolored. Detecting these features requires high-precision image processing techniques. Thirdly, ginseng image acquisition requires fine control of illumination parameters, background selection, and angle configuration, as these factors can significantly affect the appearance of ginseng. To address these issues, this study developed an LLT-YOLO model based on YOLOv11, aiming to improve the effectiveness of ginseng appearance quality detection, achieve accurate grading, reduce the time and effort spent on manual inspection, and reduce the economic loss caused by wrong pickup and missed inspection, providing a landable intelligent solution for ginseng breeders and orchard managers.
The main contribution of this study is:
  • Replacing the original C3K2 module with the DCA module enhances the focus on key channels to capture detailed image features. It significantly enhances the ability to capture fine-grained texture and edge features, making it easier to extract small target features and thus improving detection accuracy.
  • Replacing traditional standard convolutions with DWSConv for downsampling can significantly reduce the number of parameters while improving detection accuracy.
  • We incorporate EMA’s attention mechanism to help the model focus on small target regions, mitigate the effects of irrelevant contextual variables, and improve detection accuracy by performing more stably, especially in complex background or occlusion scenes.
  • Channel-wise knowledge distillation (CWD) techniques are used to enable the model to learn the properties in the teacher model, resulting in a lightweight model and achieving better detection performance.

2. Materials and Methods

2.1. Data Set Construction

A market examination of various ginseng types, considering their complex morphological features, highlights the diverse applications of white ginseng in particular. A particular processing technique is used to create white ginseng, a kind of traditional Chinese medicine. Among processed products, aside from red ginseng, those such as sun-dried ginseng, sugar-coated ginseng, and dried ginseng are collectively referred to as white ginseng. Ginseng is made from fresh ginseng roots that have been cultivated for 4–6 years until they reach maturity. They undergo basic processing steps, including washing, dehydration, or sun drying, resulting in a slightly grayish-white to yellow color and excellent quality [23]. Most white ginseng is further processed into slices to meet different usage requirements. This study specifically selected white ginseng grown in Fusong County, Jilin Province, as the experimental material. White ginseng from Fusong County boasts unique chemical components and pharmacological effects, owing to its distinctive growing environment and proprietary processing techniques, making it a valuable resource for research. Furthermore, in-depth research on white ginseng can enhance our understanding of its application in traditional medicine and explore methods to improve its medicinal value through modern scientific and technological means.
To ensure the comprehensiveness and precision of the experiment’s outcomes, the researchers carefully selected and prepared the samples. Extracting samples from some pre-classified sample boxes was the first step in the sample-collecting procedure. Based on the “Jilin Province Roadside Medicinal Herbs Ginseng Edition,” the grading criteria were established, including principal ginseng, first-class ginseng, and second-class ginseng, which were classified and identified by local traditional Chinese medicine ginseng experts in Jilin, as detailed in Table 1.
The research team used compact, high-quality studio boxes (Sutefoto, Guangzhou, China) and smartphone cameras (Apple, Cupertino, CA, USA) to obtain visual data. The camera was positioned approximately 35 cm above the ginseng, at the highest point in the studio. For details, see Figure 1. This configuration ensured uniform angular positioning during sample imaging, thereby reducing variations in image quality caused by varying perspectives. We took 1343 RGB images using a camera with a size of 1280 × 720. To help train the model and ensure it works properly, we uniformly cropped the photos to 640 × 640, removing only the excess background to retain the ginseng sample information. These photos were taken from multiple angles. To ensure comparability and experimental reliability, multiple color backgrounds were used when taking the images to make the sample details more accurate.

2.2. Data Augmentation

The dataset used in this study is based on white ginseng collected by hand within Fushong County. The team used a small, high-quality camera box and an iPhone camera to acquire the visual data. The camera was placed approximately 35 cm above the ginseng, the highest point of the studio. The multiple camera angles and background colors were used to simulate real orchard environments, ensuring uniformity in the imaging angles of the samples and effectively suppressing fluctuations in image quality due to differences in viewing angles. We captured 1343 RGB images with a 1280 × 720 camera and manually annotated and classified them as “ginseng” using Roboflow. To help train the model and ensure it works properly, we cropped the images to a uniform size of 640 × 640, removing only the redundant backgrounds to retain the information from the ginseng samples. ginseng sample information.
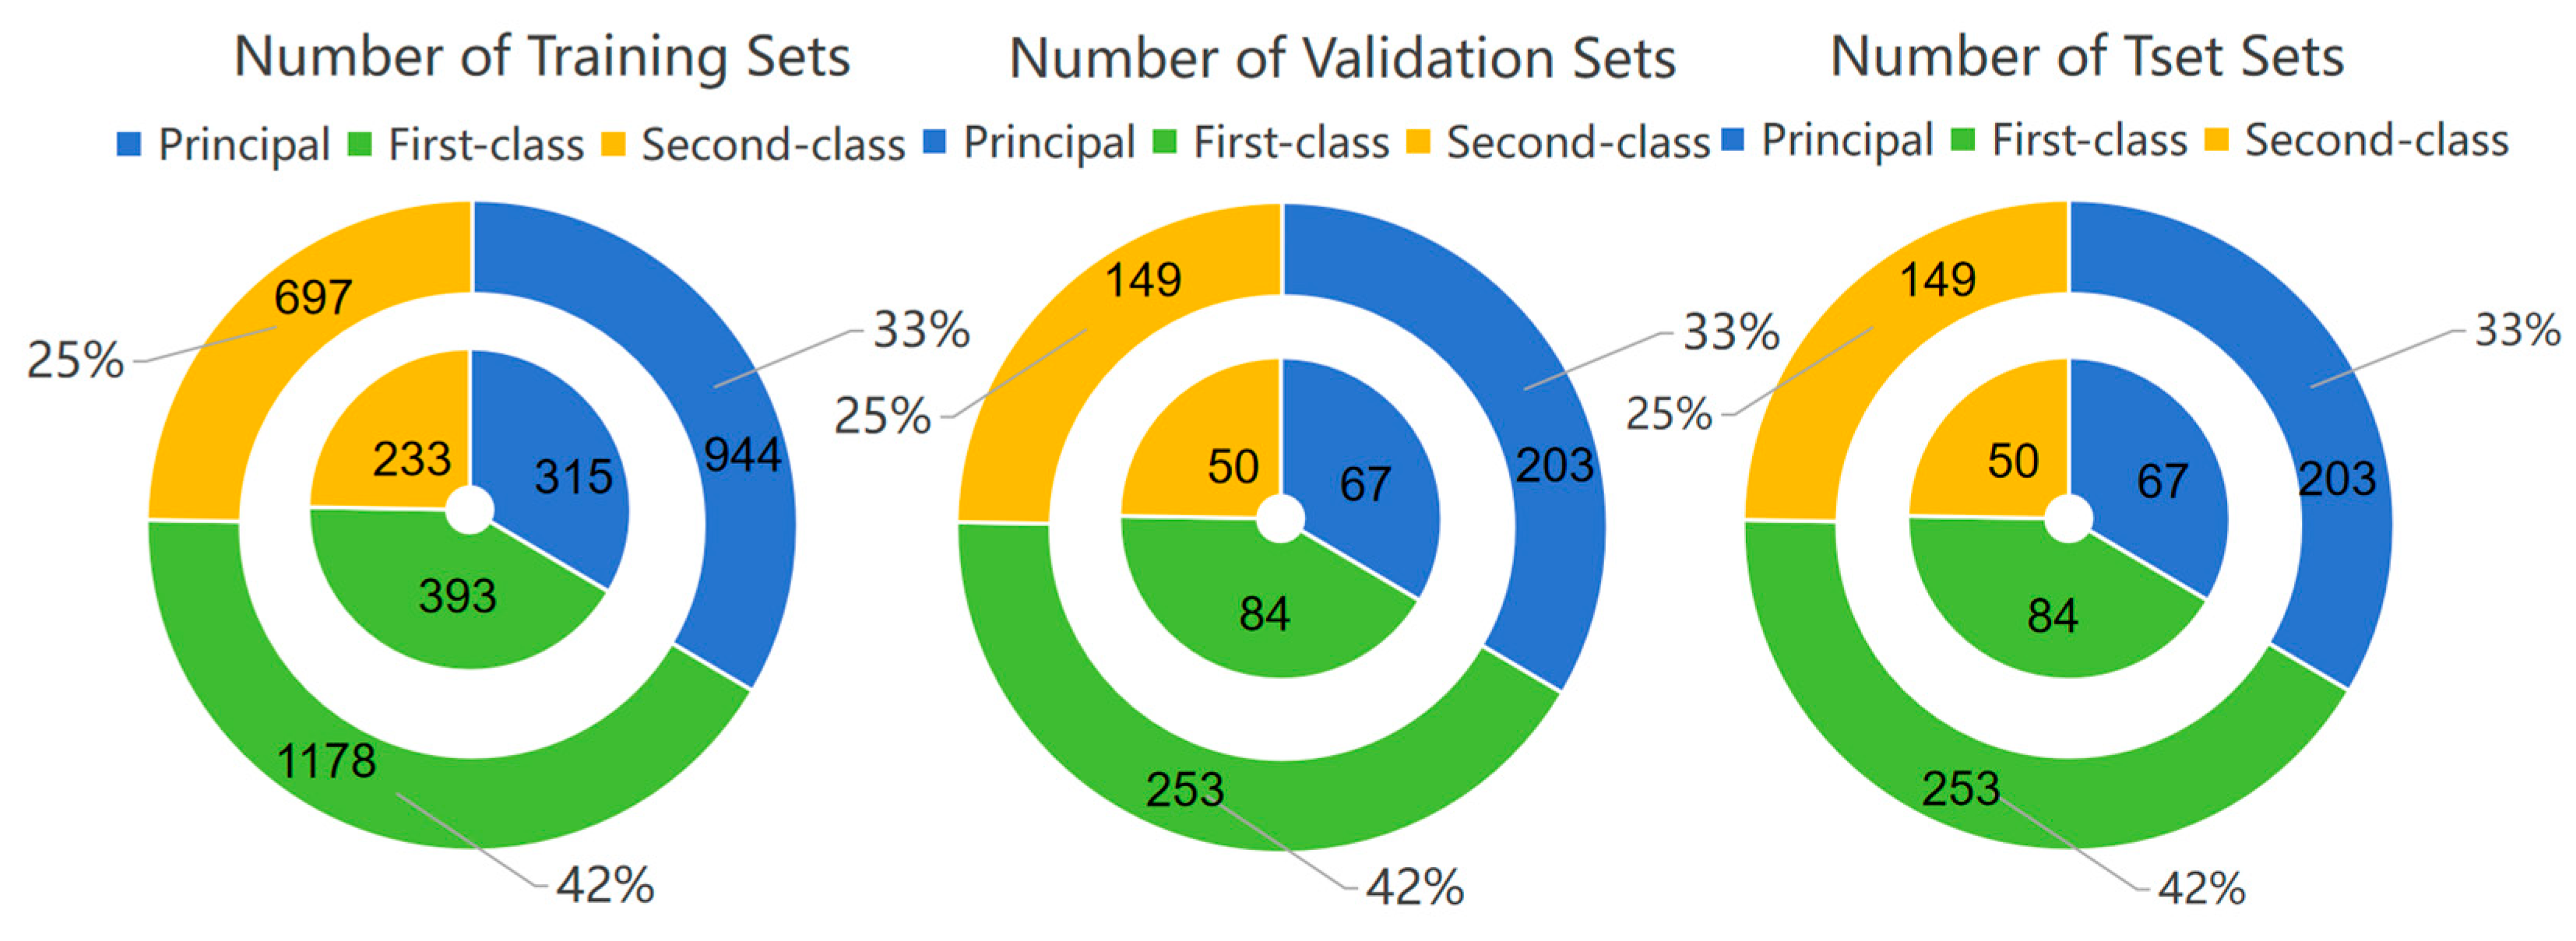
By expanding the dataset to utilize more data [24], the model’s learning ability and accuracy can be improved [25,26]. We randomly divided 1343 ginseng photos into a test set (941), a validation set (201), and a training set (201) in a ratio of 6:2:2 (Figure 2). Using the Roboflow platform to perform data enhancement techniques such as noise enhancement, rotation, and horizontal flipping on each subset, we expanded the dataset to 4029 images (Figure 3). In addition, we modeled potential cosmetic problems of ginseng, such as red rust and over-drying of the surface.

2.3. Novel Network Construction

2.3.1. LLT-YOLOV11 Network Structure

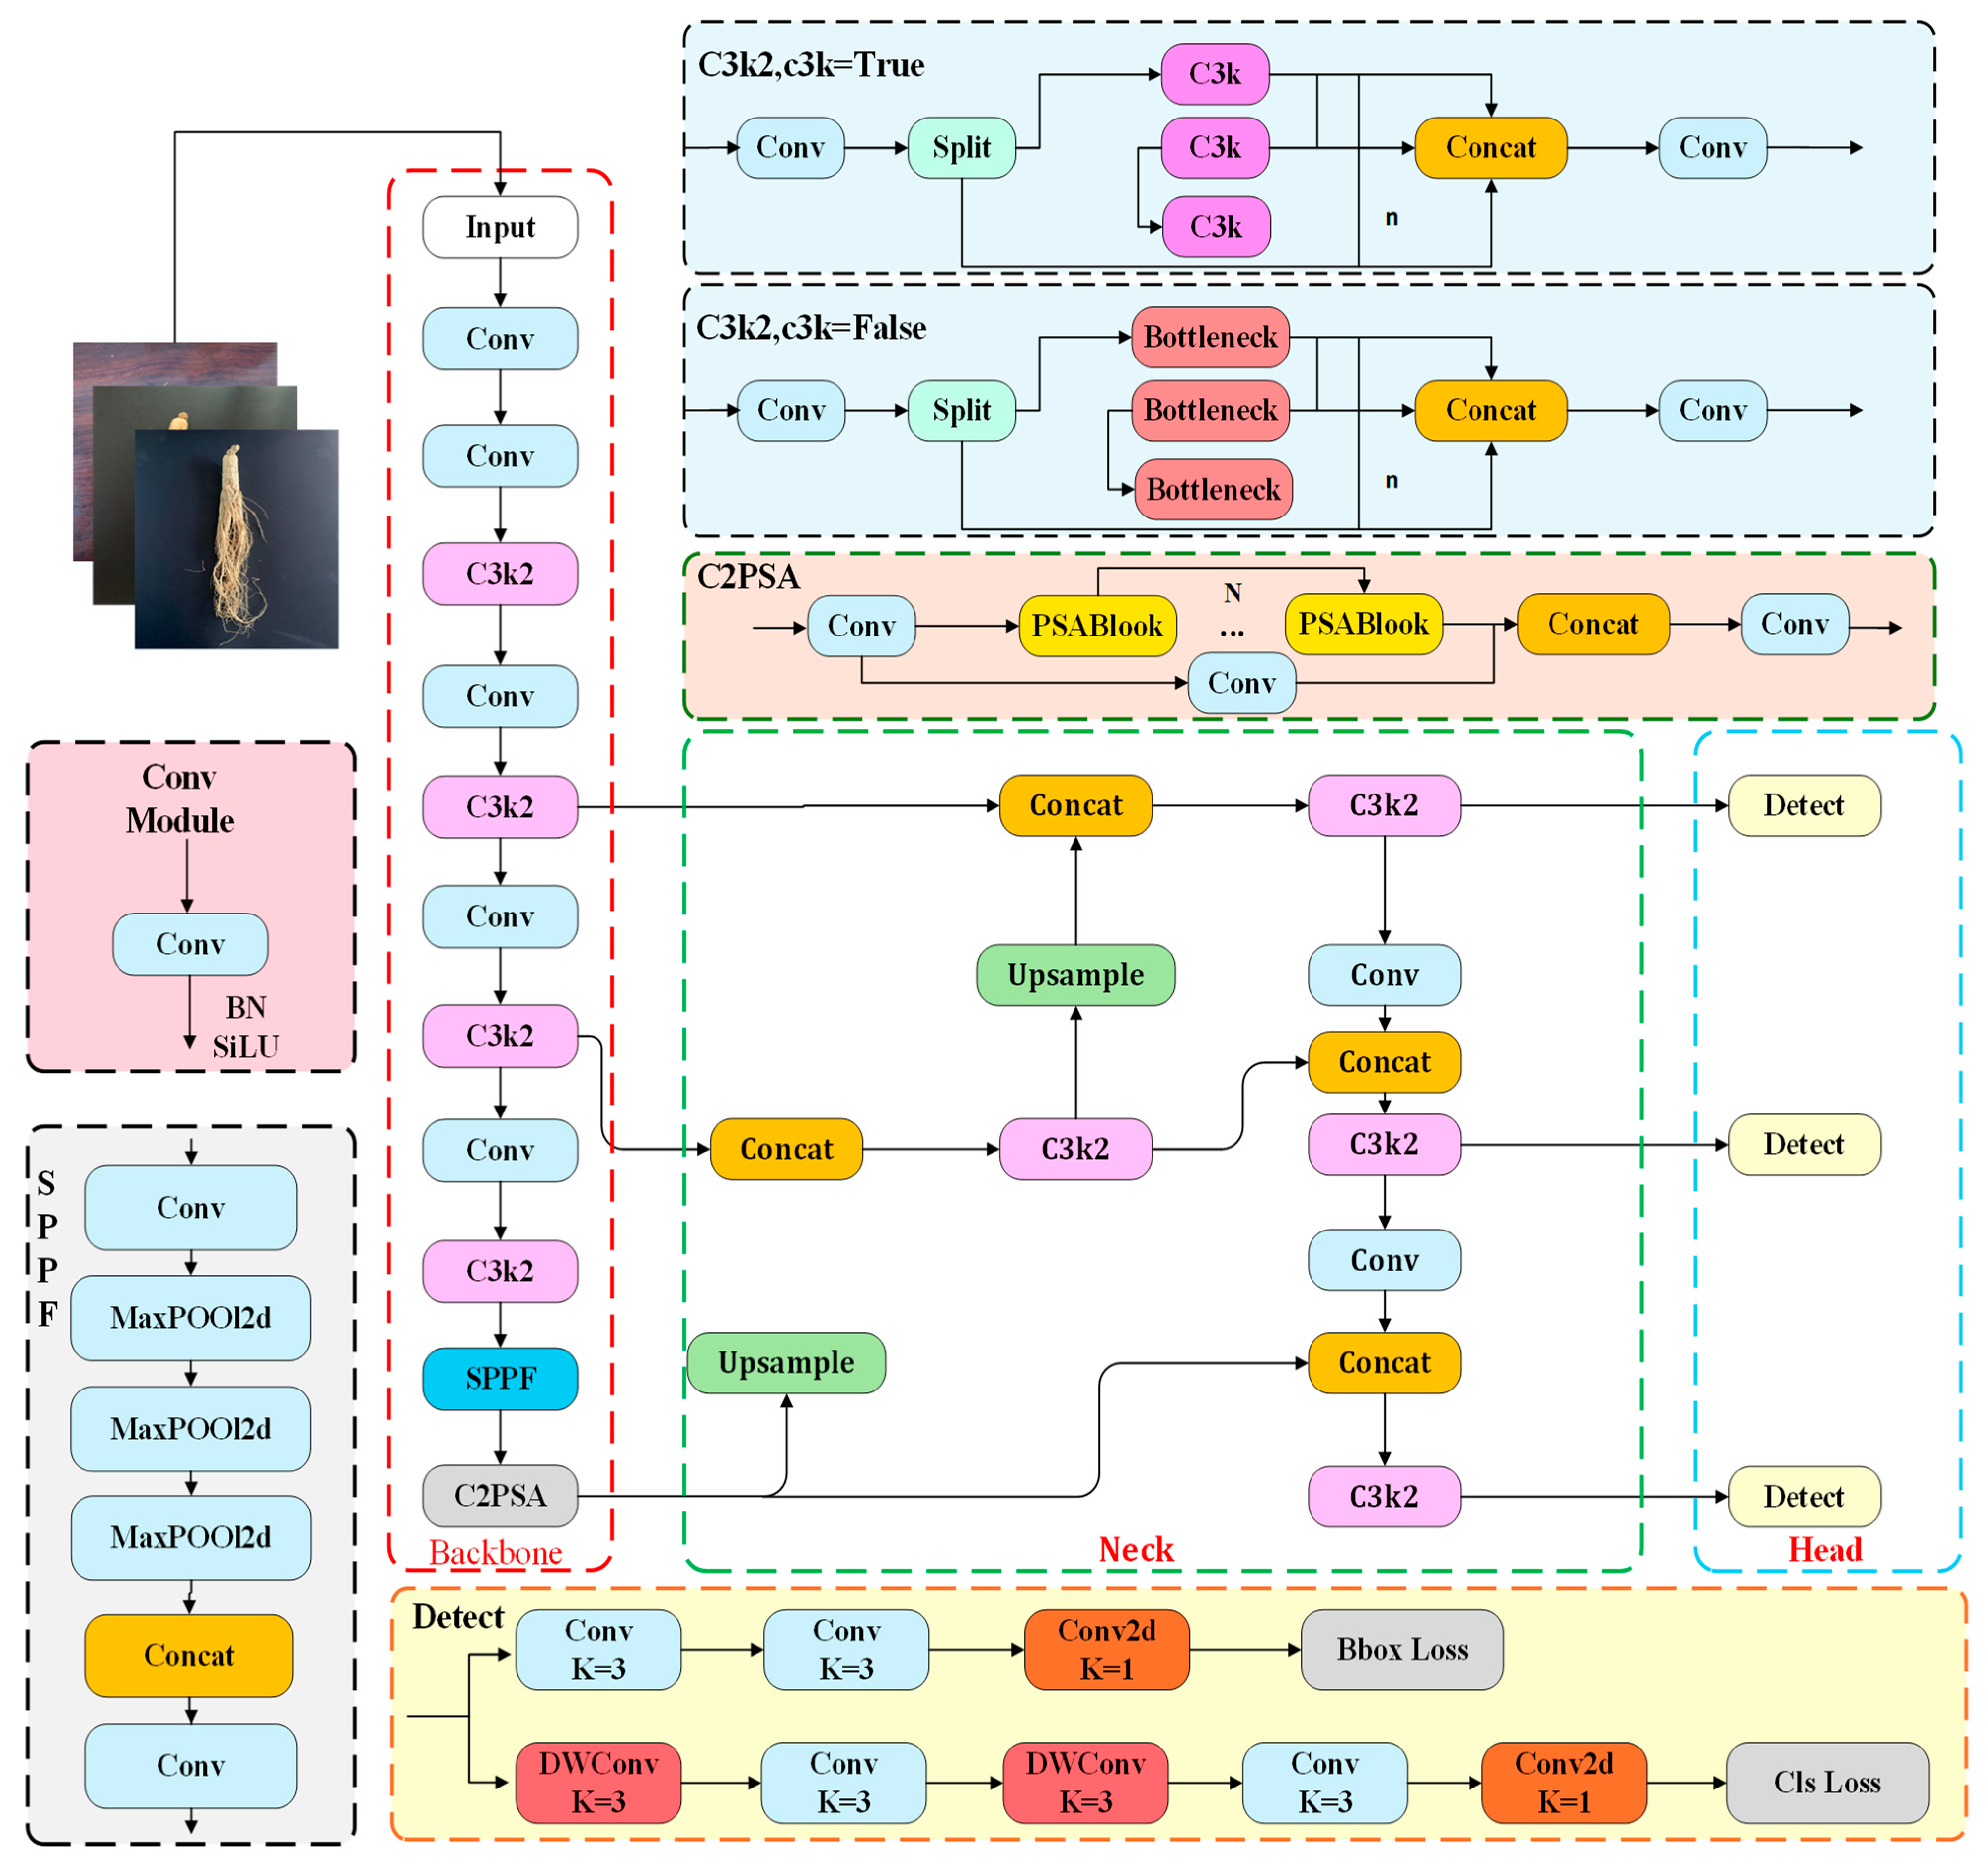
YOLOv11 [27] was developed by Ultralytics based on the YOLOv8 architecture and training methods [28], setting a new standard for real-time object detection with its exceptional precision, speed, and efficiency [29]. YOLOv11 utilizes an enhanced backbone and neck architecture, replacing the C2f module with the C3K2 module. It utilizes 3 × 3 small convolutions for parallel processing, followed by fusion, balancing accuracy and efficiency. The addition of C2PSA multi-scale attention focuses on occluded targets. While maintaining high accuracy overall and reducing computational complexity, it still struggles with complex scenes. Figure 4 provides a detailed illustration of YOLOv11’s network architecture, highlighting its complex yet elegant design and positioning YOLOv11 to be a cutting-edge item detection method. However, the traditional YOLOv11 model faces some challenges during object detection. Specifically, when detecting small objects such as ginseng, especially in complex environments, the YOLOv11 model often fails to capture these subtle details due to the variable shapes and complex textures of ginseng, resulting in detection omissions or incorrect detection boxes.
To deal with the problems listed above, this study suggests a new ginseng appearance recognition network model (as shown in Figure 5) aimed at effectively resolving these challenges:
  • The DCA module is added as a module for feature extraction that is lightweight, integrated into the YOLOv11n network, replacing the existing c3k2 module for feature extraction. This significantly enhances the model’s training speed while more accurately capturing the shape and features of target objects.
  • In the backbone network and neck network, deep separable convolutions (DWSConv) are used instead of conventional convolutions for downsampling, significantly reducing computational complexity and parameter counts.
  • To address the complexity of target features and help the model focus on small target regions, an efficient multi-scale attention mechanism (EMA) is introduced.
  • Knowledge distillation techniques are applied to increase the accuracy of the model.
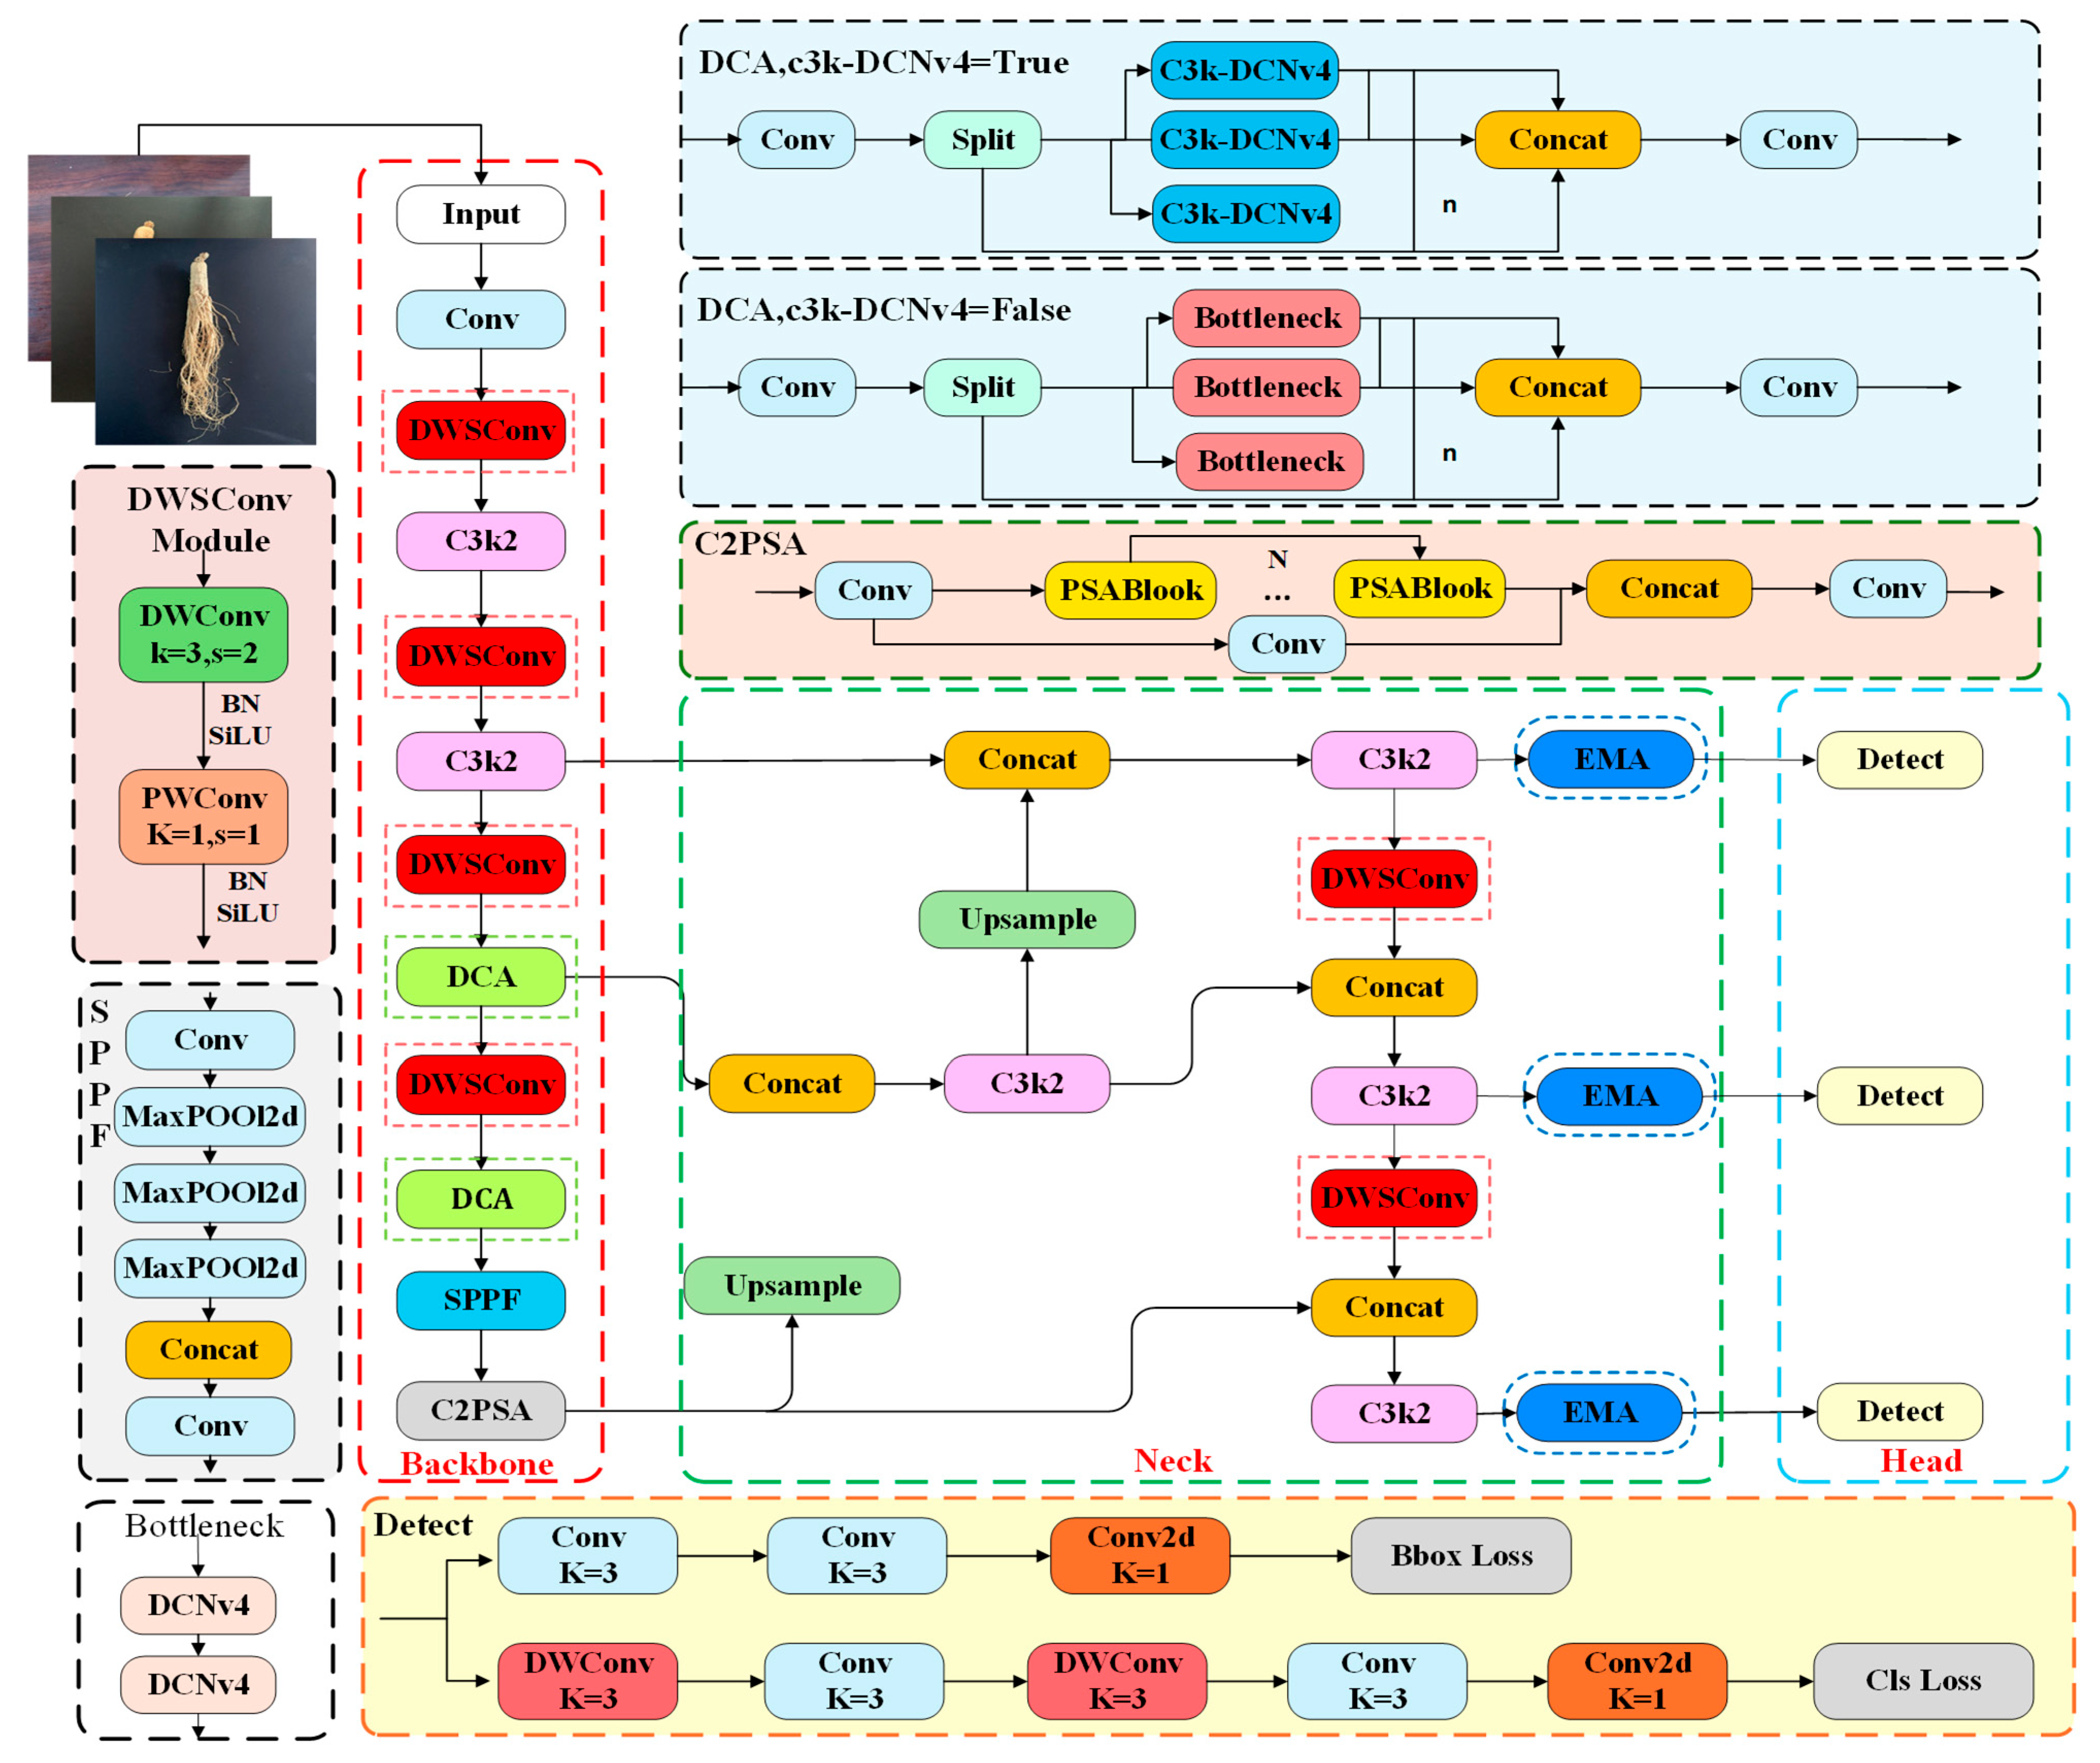
Figure 5. LLT-YOLOv11 model structure.
Horticulturae 11 01120 g005

2.3.2. DCA Module

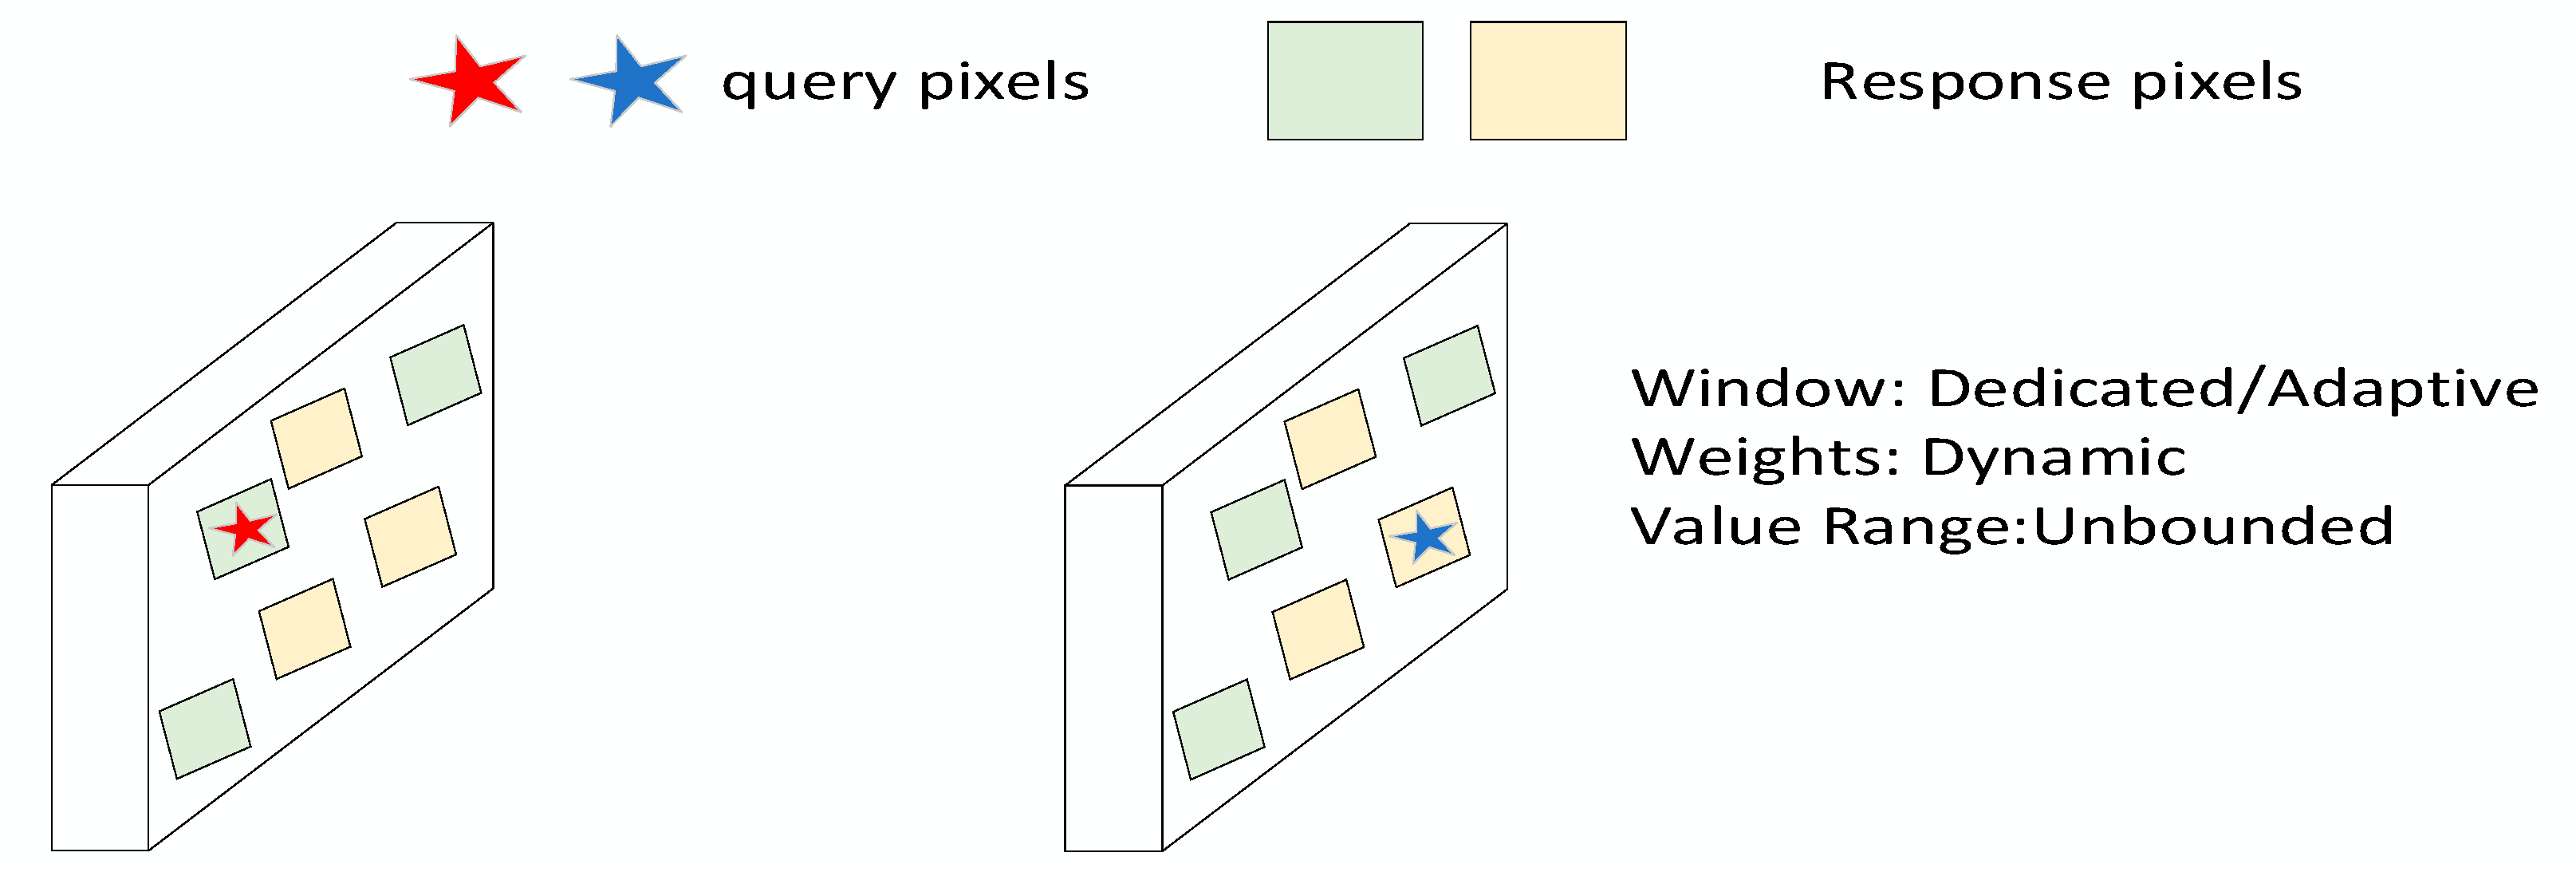
In traditional convolution methods, fixed-size convolution kernels (1 × 1, 3 × 3, 5 × 5) are typically used to sample input feature maps, resulting in suboptimal feature extraction performance when dealing with irregularly shaped objects. The subject of this study is white ginseng, which exhibits significant irregularity in its appearance. Therefore, traditional convolution methods struggle to achieve efficient feature extraction for such objects. To more accurately extract the features of ginseng appearance, this research proposes a multi-scale feature extraction (DCA) module, which replaces the Conv in C3K2 with Deformable Convolution v4 [30] for downsampling. DCNv4 adjusts the shape of the convolution kernel to adapt to the contours of different target objects, thereby more precisely capturing the shape and features of the target and significantly improving model precision. The core advantage of DCNv4 lies in eliminating Softmax normalization in spatial aggregation, thereby enhancing the dynamic characteristics and representational capacity of spatial aggregation (Figure 6) and optimizing memory access. This not only improves its dynamic characteristics but also enhances the feedforward propagation velocity by over 300%, thereby reducing model training time.
As shown in Figure 7, DCNv4’s fundamental framework integrates three principal elements: The DCNv4Conv operation layer includes a batch normalization process and activation using the Sigmoid-weighted linear unit. After processing the input feature map, we first divide the channels and then input the features. x R ( H × W × C ) (amount of lines C, height H, and width W) performs convolution operations on each group of features to obtain the corresponding offsets and weights. Finally, we merge these convolved results to generate the output features. The input calculation formula is as follows:
I g = k = 1 k m g k x g ( y 0 + y k + Δ y g k )
I = c o n c a t ( [ I 1 , I 2 , I G ] )
where x g   a n d   I g are characteristics that belong to the input and output groups, respectively. m g k denotes the kth sampling point weight of group g; Pk represents the private node k in the network; Δ p g k stands for the difference in P k . Compared to the base network, the rise in the number of concatenated image feature descriptions indicates that there are more descriptions of picture features.

2.3.3. Depth-Wise Separable Convolution

To effectively lower the parameter size for the YOLOv11n network and improve its computational efficiency, we optimized its architecture. In the backbone network and neck structure, some traditional convolutional modules were replaced by depth-wise separable convolution (DWSConv) modules [31], which significantly improved the efficiency of downsampling operations. Depth-wise separable convolutions (DWS) consist of two consecutive operations: both point-wise convolution (PWconv) and depth-wise convolution (DWconv), as shown in Figure 8. In DWconv, spatial convolution is performed separately on each input channel, allowing for the effective extraction of local features from each channel through channel-wise convolution. Subsequently, PWconv uses a 1 × 1 convolution kernel to integrate channel features generated by the depth convolution and produces the required number of output channels. This process enables convolution operations to require less computing power and fewer parameters. It maintains the number of output channels equal to the number of input channels. This enables the network to operate more efficiently without compromising its feature extraction capabilities. The computation for DWSConv is:
C × H × W × ( K 2 + C ) = C × K 2 × H × W + C × C × H × W
The height and width following an input of the convolution process are denoted by H′ and W′ in the formula, and output channel counts are indicated by C and C′, respectively; the size of a convolution kernel is K × K. In addition, to ensure that the network can precisely control the number of channels, we have specifically retained the first traditional convolutional module in the dominant network. It is responsible for mapping the original image into high-dimensional features, preventing loss of underlying details such as color and texture, and has an extremely low parameter count itself. The module initially expands the 3-channel input to 32 or 64 channel pairs of input data, providing high-quality input features for the subsequent deeply separable convolutional modules.

2.3.4. Efficient Multi-Scale Attention

In object detection tasks, researchers typically employ attention mechanisms to focus on target regions while filtering out perturbations arising from the non-salient areas, especially background interference, thereby enhancing the precision of object detection. For crops like ginseng, which have light colors and are highly similar to the background, background interference issues are particularly pronounced. A new efficient multi-scale attention (EMA) [32] module is introduced in this study to help solve this problem. This module improves pixel-level attention over high-level feature maps by incorporating feature grouping, parallel structure, and learning across spaces techniques, thereby eliminating the need for dimensionality reduction and enhancing the network’s object detection performance.
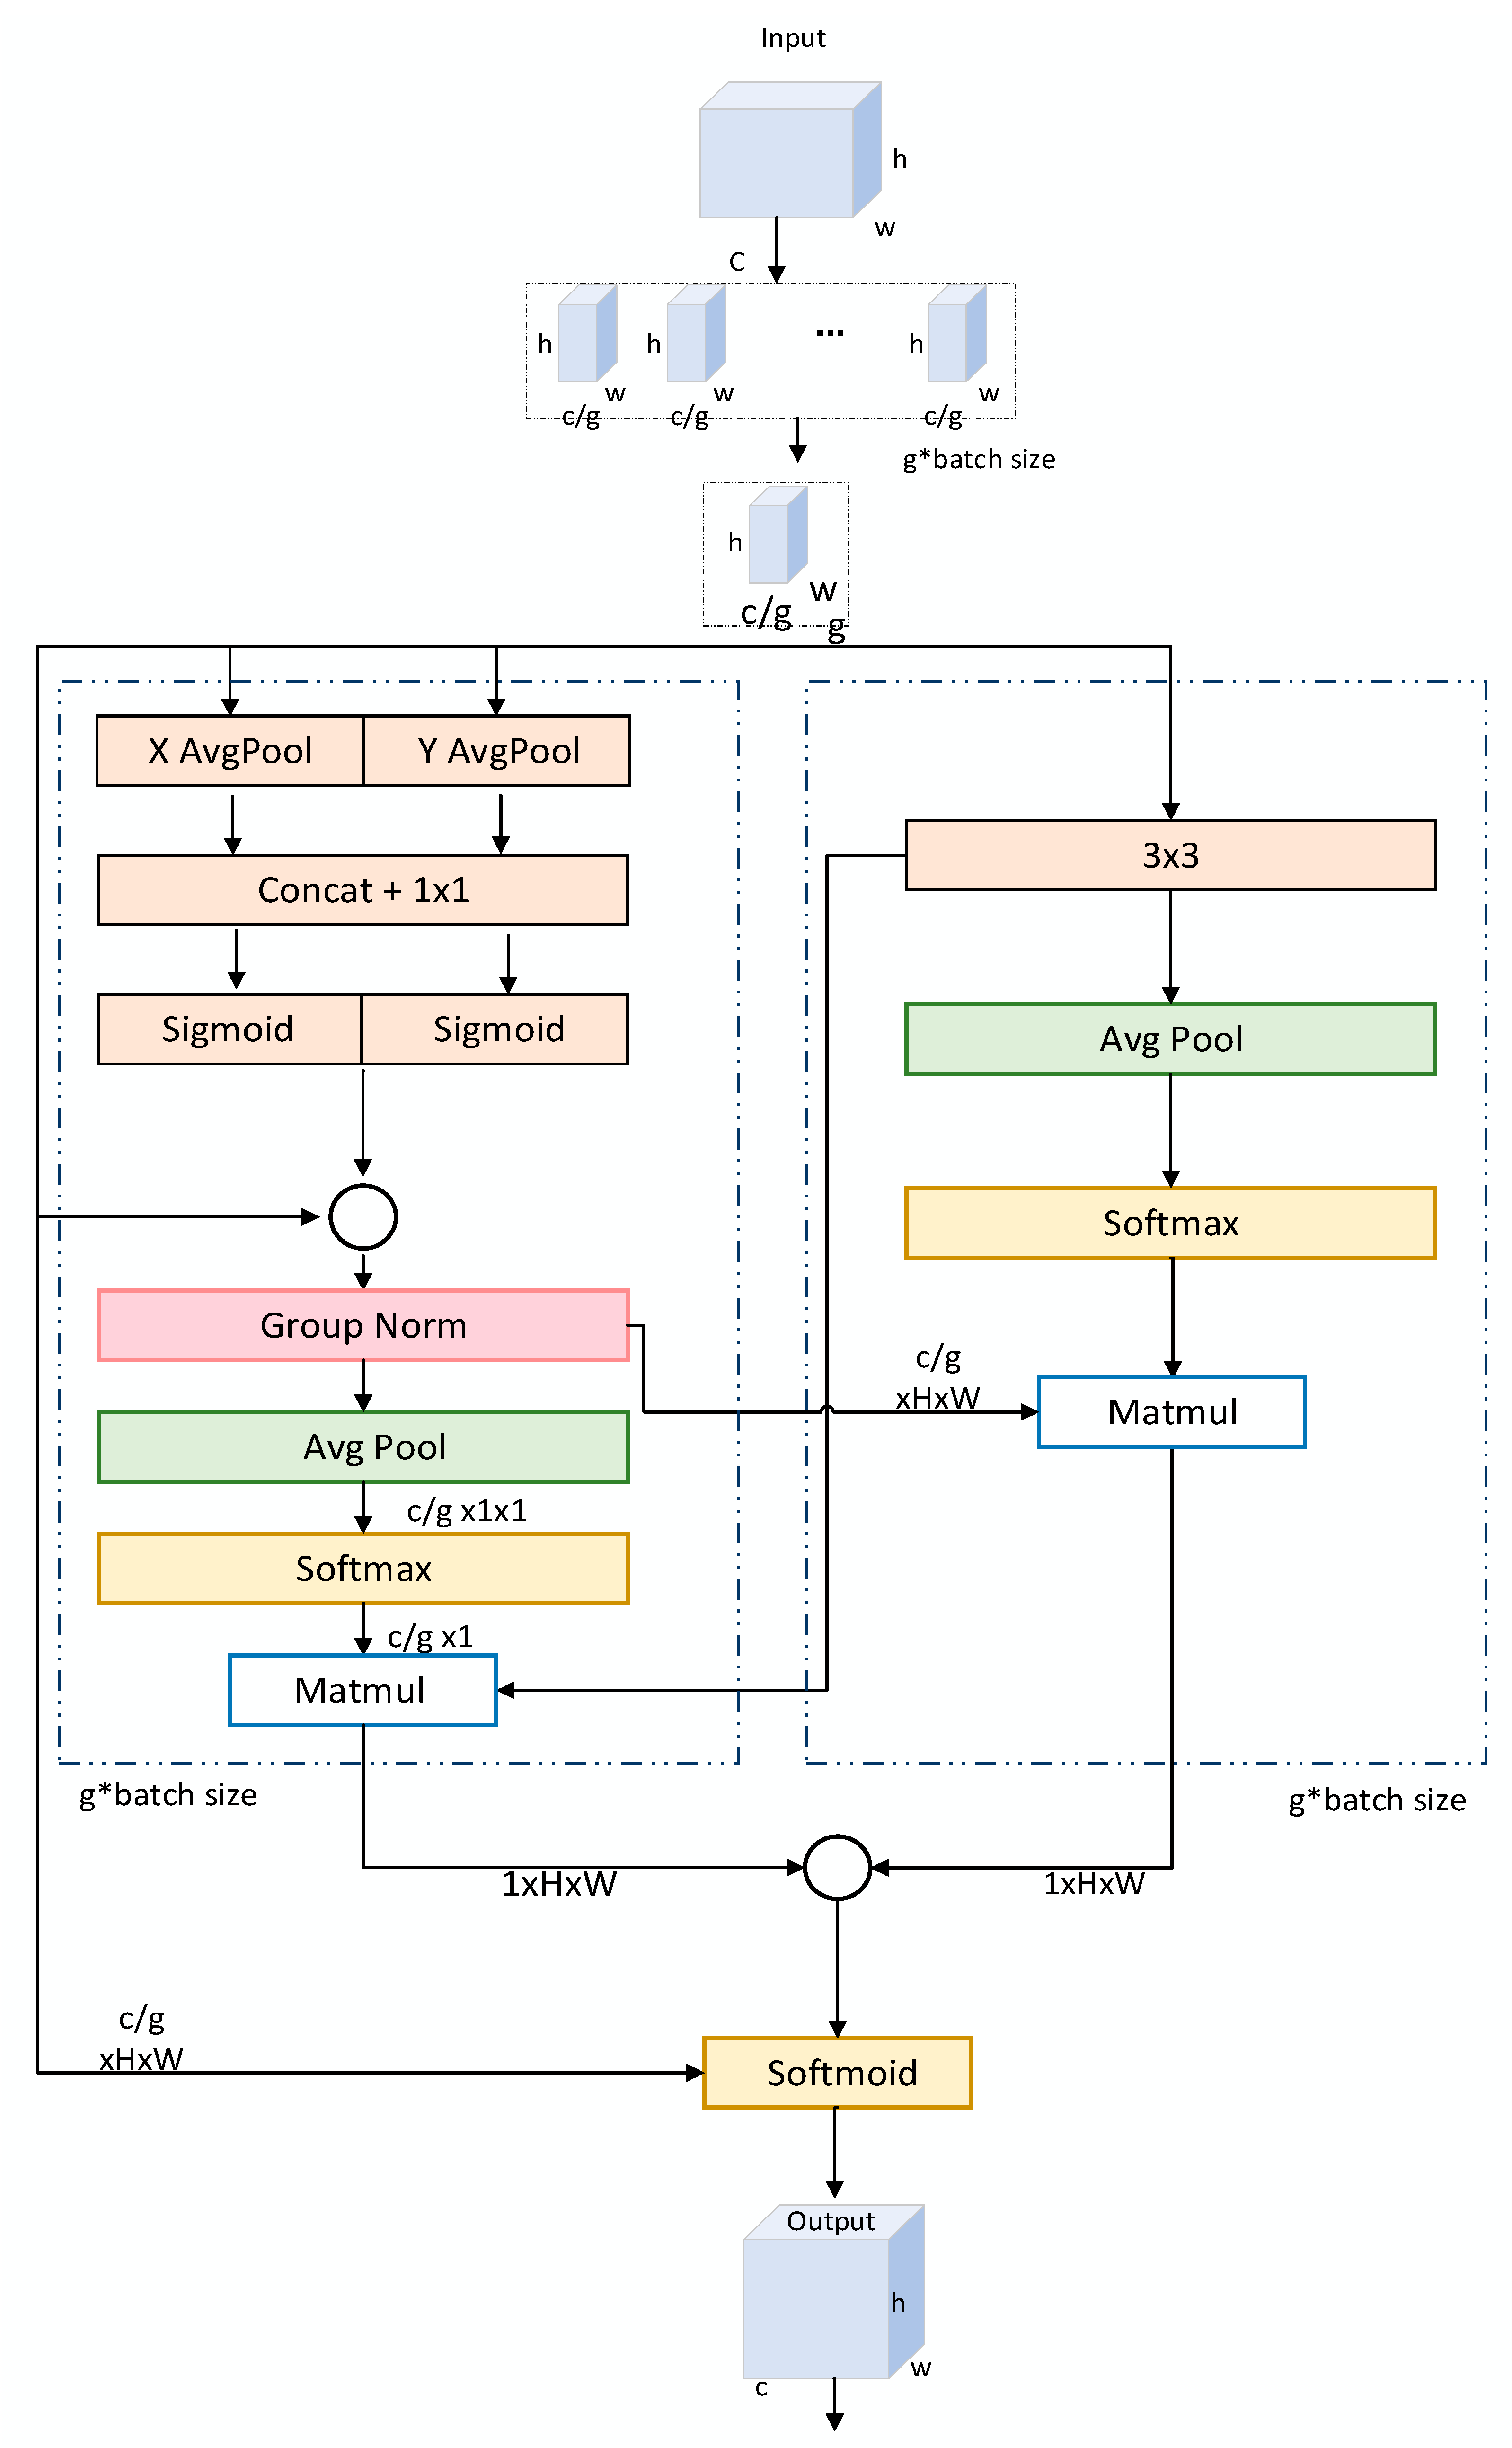
To improve computational efficiency while preserving channel information, the input feature maps are separated into g groups per channel using the EMA attention technique. This method employs a multi-path design to distribute spatial semantic features evenly. Mimicking the multi-branch architecture and multi-scale convolution operations of inception, the EMA module constructs three parallel subnetworks after feature grouping, with two subnetworks using 1 × 1 convolution branches and one subnetwork using 3 × 3 convolution branches, as shown in Figure 9.
In the 1 × 1 convolution layer, there is a parallel path that performs one-dimensional global average pooling on the characteristic data located in the horizontal direction. This creates a feature map Z c H ( H ) . This step helps capture long-range connections and position details in the horizontal space.
The formula is:
Z c H ( H ) = 1 W i = 0 W X c ( H , i )
Another path uses a global one-dimensional average pooling on the vertical feature information. This creates a characteristic map Z c W ( W ) , which helps capture long-distance connections and location details in the vertical space.
The formula is:
Z c W ( W ) = 1 H j = 0 H X c ( j , W )
The input feature of the cth channel is denoted by X c in the two formulations, and its horizontal and vertical positions are denoted by i and j, respectively.
Following the completion of one-dimensional global average pooling on the two parallel pathways’ horizontal and vertical dimensions, the characteristic maps Z c H ( H ) as well as Z c W ( W ) are concatenated along the vertical dimension. Finally, through a two-dimensional global pooling operation, the feature map z c is created by combining the outcomes of various simultaneous processing processes, which is fitted using the nonlinear function Softmax to approximate the linear transformation. The matrix dot product operation is then applied to the output.
As expressed by the equation:
Z c = 1 H × W j H i W X c ( i , j )
On the spatial dimension for C, the input feature at location (i, j) is represented by X c ( i , j ) , H is the height of a feature map, and W is the width of a characteristic map.
By using a 1 × 1 convolution kernel, we establish a correlation between channels and spatial positions, thereby promoting the separation of two feature maps signifying various spatial orientations. The feature maps go through the Softmax function. Then, the output is multiplied by the results from the 3 × 3 parallel branches to generate a map of spatial attention. Similarly, in the 3 × 3 branch, we employ two-dimensional global average pooling and the Softmax function to construct another spatial attention map. This map has detailed spatial location information. Finally, according to each group’s output feature maps, we obtain the weight values of the two spatially focused maps, and through the Sigmoid function we obtain the feature output.

2.3.5. Knowledge Distillation

Knowledge distillation is an effective method for training small networks. In this process, a larger and more powerful network can serve as a teacher network, guiding the student network to learn autonomously and master the data distribution characteristics contained in the teacher network. Through this method, the student model can not only efficiently acquire knowledge but also learn richer feature representations without increasing the computational burden, thereby potentially outperforming the teacher model in some instances.
This research employs an enhanced high-accuracy model as the teacher network, transferring its knowledge to a compact and efficient student architecture (YOLO11n) through distillation. The approach preserves detection accuracy while achieving the computational efficiency necessary for edge deployment in agricultural applications. Throughout the distillation process, the instructor model’s pre-trained parameters do not change. Knowledge distillation is applied across the three output layers between the student and instructor models, as the parameters of the output layer have the greatest impact on the model’s output, as shown in Figure 10. Channel-wise knowledge distillation (CWD) is a channel-based knowledge distillation method [33], primarily divided into two steps: creating a probability distribution map that shows the relative relevance or response intensity of every position inside a channel and normalizing each channel of the feature map using Softmax; determining the asymmetric KL divergence between the networks of students and teachers corresponding to channel probability distributions as the loss, which allows the student network to mimic the network of teachers in high-saliency areas. Letting S and N stand for the teacher and student networks, respectively, x S   a n d   x N are the associated activating maps. The loss from channel distillation is written as:
φ ϕ x S , ϕ x N = φ ϕ x c S , ϕ x c N
C denotes the channel; ϕ denotes the function used to convert activation values into probability distributions, thereby eliminating differences in value magnitude between large and small networks, as shown in the equation:
ϕ ( x c ) = exp x c , i T i = 1 W H exp x c , i T
Here, i is the pixel’s position in the channel. T is the hyperparameter (temperature). When T is bigger, the output probability distribution becomes softer. In other words, the region of interest in each channel becomes larger. The difference between the channel probability distributions of the teacher and student networks is reduced using the Kullback–Leibler (KL) divergence. The KL divergence is stated as follows:
φ x S , x N = T 2 C c = 1 C i = 1 W H ϕ x c , i S log ϕ x c , i S ϕ x c , i N
This guides the student model to focus more on imitation regions with significant activation values. This enhances accuracy in applications that require precise forecasts.

3. Result and Analysis

3.1. Experimental Environment

In this study, to guarantee the impartiality and dependability of the experimental findings, we trained all models under the same experimental conditions. Additionally, the same hyperparameter configurations were uniformly applied in ablation experiments, while each model used its default hyperparameter configurations in comparative experiments. The experiments were conducted using a Linux-based operating system with PyTorch as the deep learning framework. Experiments were run on a Linux workstation with PyTorch 2.5.0 and CUDA 12.4. The machine is equipped with an AMD EPYC 9754 CPU (1.50 GHz, 128 cores) and an NVIDIA RTX 4090D GPU (24 GB VRAM). The specific hyperparameter configurations are detailed in Table 2

3.2. Evaluation Criteria

Deep learning detection models must be evaluated using several key evaluation metrics. To accurately assess the performance of YOLOv11 and its upgraded models, this study employs the evaluation metrics of recall, precision, average precision (AP), and mean average precision (mAP).
P = T P T P + F P
R = T P T P + F N
A P = 0 1 P r e c i s i o n ( R e c a l l ) d R e c a l l
m A P = 1 N i = 1 N A P i
In the formula: TP (true positive) represents the number of samples correctly identified by the model; FP (false positive) represents the quantity of incorrect detections where plants that are not ginseng are identified as ginseng; the number of real ginseng plants that we were unable to find is shown by the symbol FN (False Negative); the percentage of real ginseng plants that we successfully recognized is shown by recall (R); precision (P) indicates the proportion of correct recognized ginseng out of the sum number of actual ginseng identified; the class-specific average precision (AP) is computed by comparing the sum of correct detections and missed detections, then dividing it by the total number of instances (N). The mean average precision (mAP) is the mean of AP values for all categories checked, with higher values denoting higher average precision for each category. We use GFLOPs (GigaFLOPs), model size (in MegaBytes), and parameters (in Mega) to assess the computational complexity and model complexity, and FPS to ascertain the model’s inference speed. Applying these evaluation standards, we can comprehensively assess the model’s performance in ginseng appearance detection tasks in complex environments, evaluating its performance from different perspectives on precision, efficiency, and speed.

3.3. Experiments and Analysis of Results

The experimental results demonstrate that the improved LLT-YOLOv11 model performs exceptionally well in the ginseng appearance detection task, outperforming over the course of 300 training iterations. LLT-YOLOv11 exhibited consistent advantages over the original YOLOv11 in three critical aspects: classification precision, mAP50, and mAP50–95. The model’s sustained high precision and reduced performance fluctuations suggest more reliable mitigation of false positives.
Notably, LLT-YOLOv11 maintained a high level of assay reliability across all assessment metrics in the overall category. Precision and recall improved by 3% and 2.6% and by 7.8% and 2.2% in the mAP50 and mAP50–95 assessments, respectively. LLT-YOLOv11 improves detection accuracy and significantly improves the model’s immunity to interference. After 300 training iterations, the validated LLT-YOLOv11 model outperformed the original YOLOv11 model in several evaluation categories. As shown in Table 3, LLT-YOLOv11 significantly improves the precision and recall of the top categories by 4.3% and 5.9% for mAP50 and mAP50–95, respectively. In the primary category, LLT-YOLOv11 also performs well, improving recall and precision by 2.6% and 10.7%, respectively, with significant improvements in mAP50 and mAP50–95. In the secondary category, LLT-YOLOv11 exhibits the most significant performance improvement, with a 14.3% increase in precision, as well as 8.7% and 5.7% improvements in the mAP50 and mAP50–95 metrics, respectively.
These results demonstrate the significant gains in mean average precision (mAP) and precision achieved by LLT-YOLOv11 across all categories, with awe-inspiring progress in the secondary categories. These significant advancements demonstrate that the LLT-YOLOv11 model offers superior detection precision.

3.4. Before and After Data Enhancement Comparison

To empirically assess the impact of data augmentation on model generalization enhancement and overfitting mitigation, we conducted controlled comparative experiments, maintaining identical hyperparameters while systematically varying only the data augmentation conditions. As demonstrated in Figure 11, the comparison highlights the changes before and after data augmentation. As demonstrated in Table 4, precision (P) showed consistent growth throughout the experiment, achieving a final value of 90.5% from a baseline of 87.1%, R increased from 86.4 to 92.7, mAP50 rose from 91.89 to 95.1, and mAP50–95 improved from 71.77 to 79.0 after data augmentation. These revisions indicate that the data augmentation enhances a model’s overall performance.
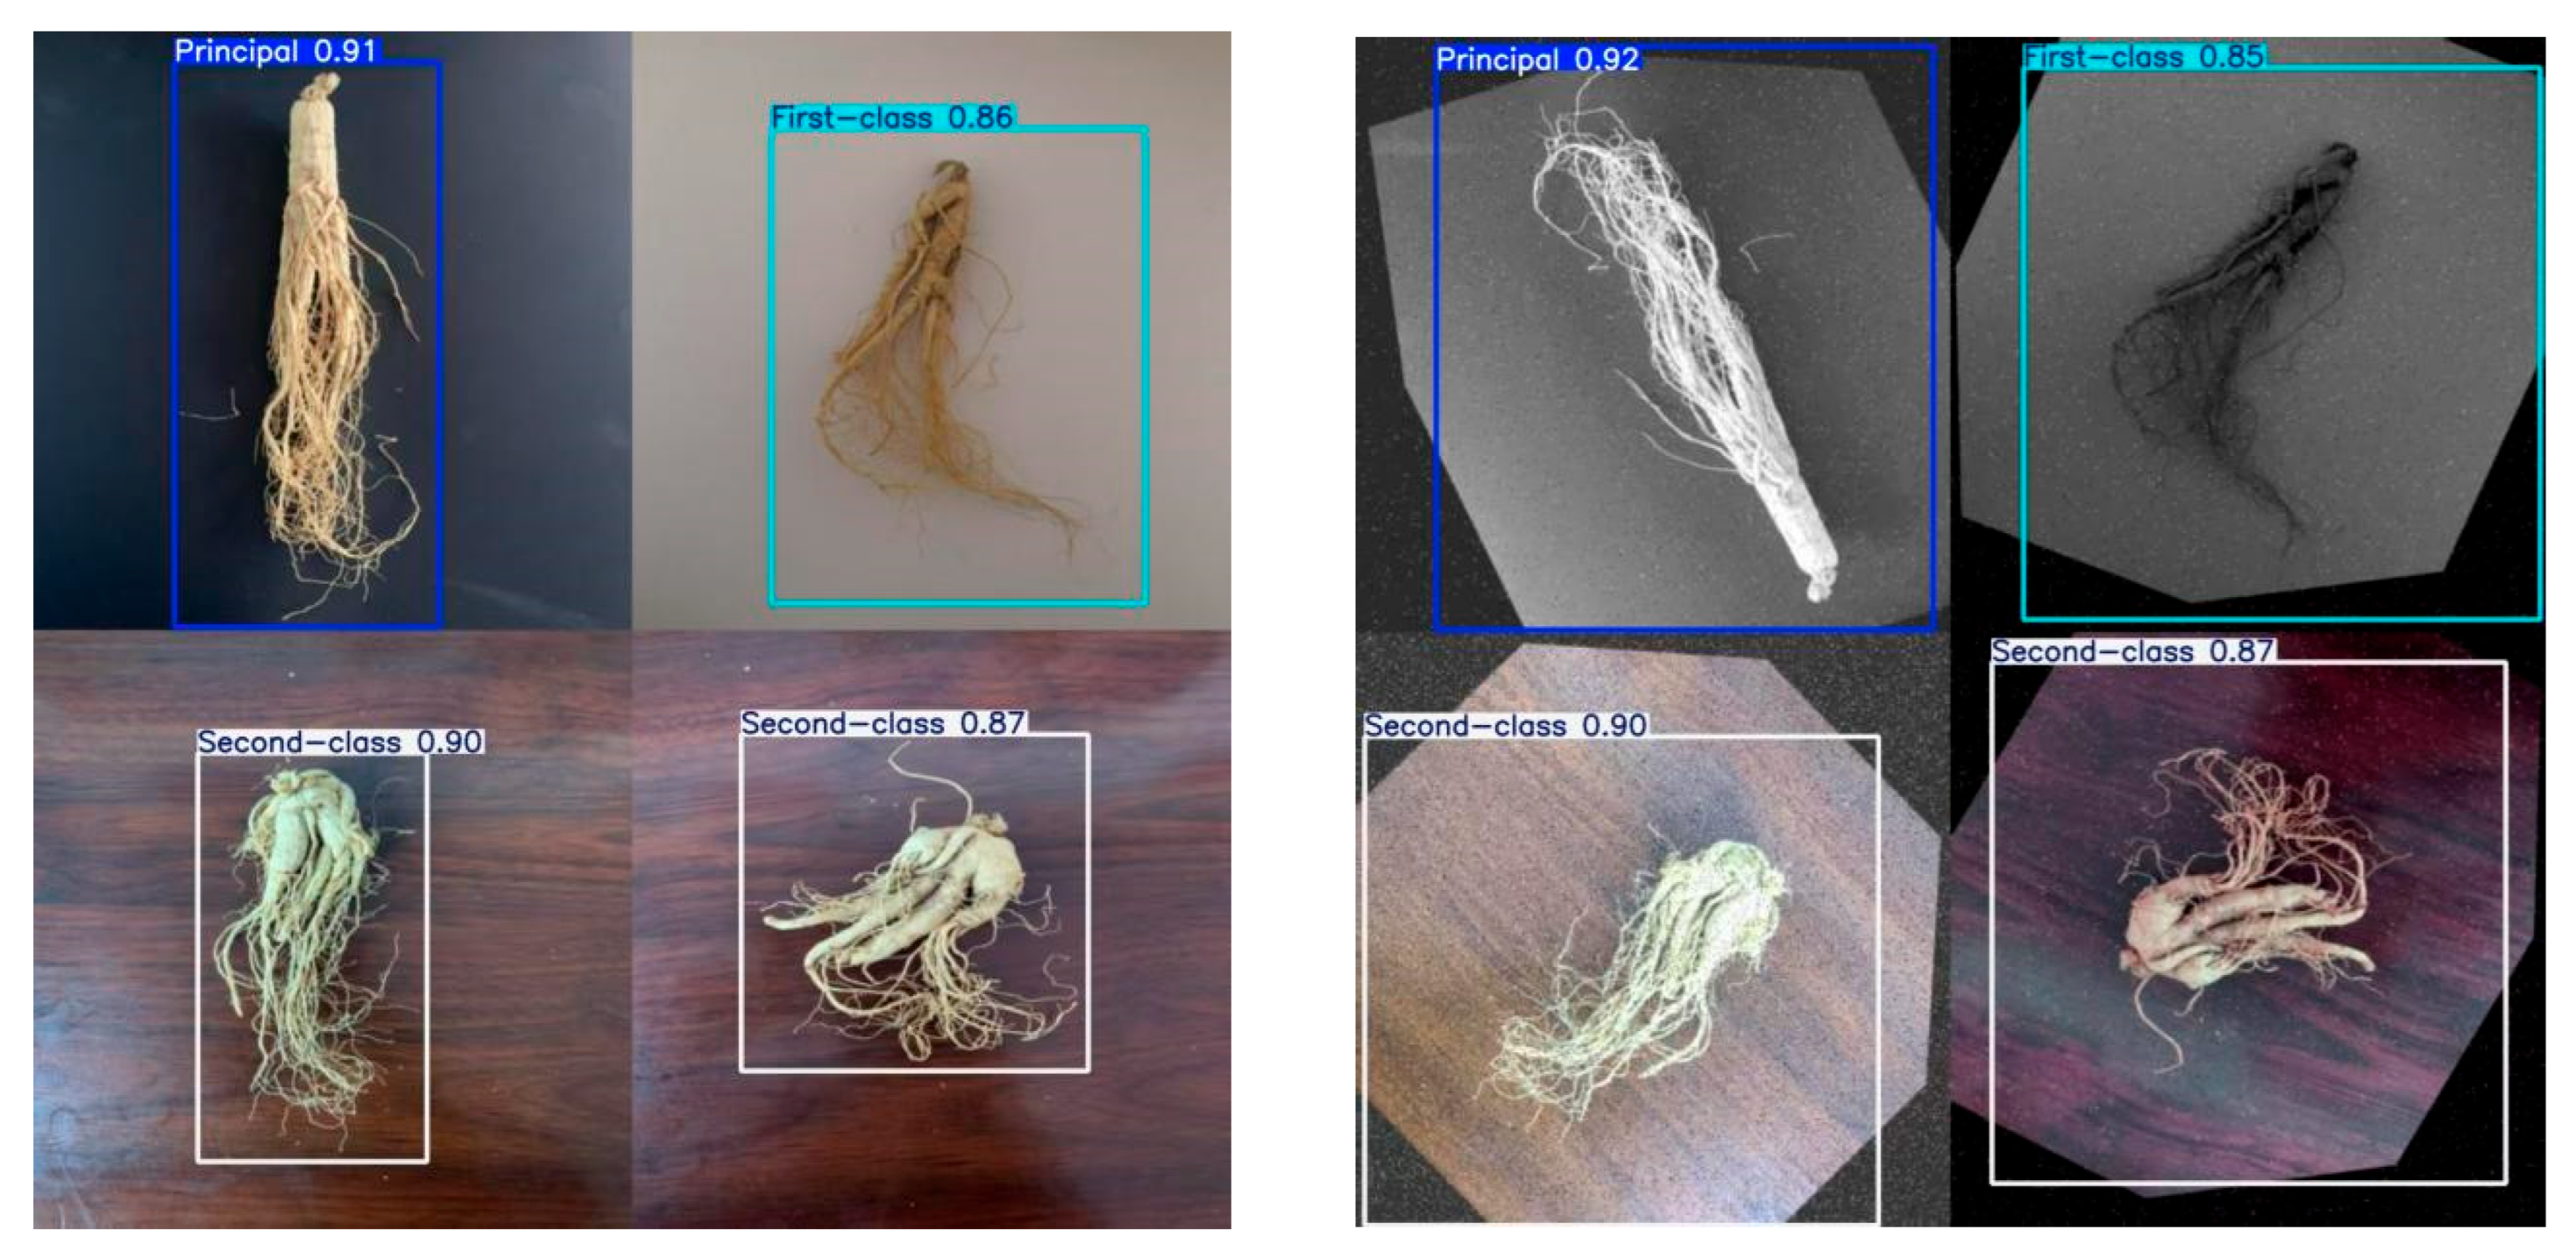
As demonstrated in Figure 12, this study’s model has the ability to recognize many objects, enabling it to locate and identify many things in a picture at the same time. This capability performs exceptionally well for crops with complex appearance characteristics, such as ginseng, significantly increasing the model’s generalization capabilities.

3.5. Ablation Experiment

We conducted a systematic ablation study to evaluate the contribution of key modules to the quality testing of ginseng. The experiment started with the original YOLOv11n and gradually added optimization modules to observe their impact on performance. In Table 5, in A, we added the DCA module. Compared with the original YOLOv11n model, although the precision and recall rates decreased slightly, the mAP50 value increased from 87.3% to 92.4%. In B, DWSConv was introduced as an alternative to traditional convolution, achieving an accuracy of 84.4%, a recall rate of 87.2%, and an mAP50 value of 93.8%. Although GFlops decreased, the overall effect was not ideal. The EMA module in C adds focused attention that highlights key regions, sharpening the model’s ability to detect subtle human features while maintaining only 2.59 million parameters and a model size of 5.19 MB. It is worth noting that this improvement was achieved without a significant increase in computational overhead. In D, when the DCA module is used in combination with DWSConv, the model recall improves to 93.4%, and mAP50 increases to 96.3%, but the precision is not satisfactory. Among them, E is the integration of DCA and EMA, which combines cutting-edge feature extraction technology with attention mechanisms. The mAP50 is 96.1%, and the precision is 89.1%. Although this inevitably leads to an increase in the number of parameters and model size, the model has achieved significant improvements in identifying detailed features, enabling it to capture key information with higher precision. In F, combining DWSConv with the EMA module enhances the model’s focus on basic features, thereby significantly improving overall recognition performance. mAP50 is 95.7%, and the model size is reduced to 4.07 MB. However, accuracy has decreased. This optimization strategy enhances the model’s sensitivity to key features while effectively reducing model complexity, allowing the model to achieve improved recognition performance across various test scenarios. Among them, G integrates three proposal modules, achieving the best overall performance: recall reaches 92.7%, mAP50 rises to 96.1%, and mAP50–95 attains 79.0%. At the same time, the model remains compact with a minimal parameter count and file size.
Additionally, we implemented a channel-based knowledge distillation method to further optimize the model’s performance. The experimental results are presented in a tabular form. Through the implementation of these strategies, the integration of DWS, DCA, and EMA modules with CWD for distillation resulted in a post-distillation LLT-YOLOV11 model with a precision of 90.5%, a recall rate of 92.3%, an mAP50 of 95.1%, and an mAP50–95 of 77.4%. As shown in the table, this integration not only successfully reduces the model’s complexity and computational resource requirements but also achieves significant improvements across all performance metrics, fully demonstrating the exceptional efficacy of these modules in enhancing the model’s overall performance.
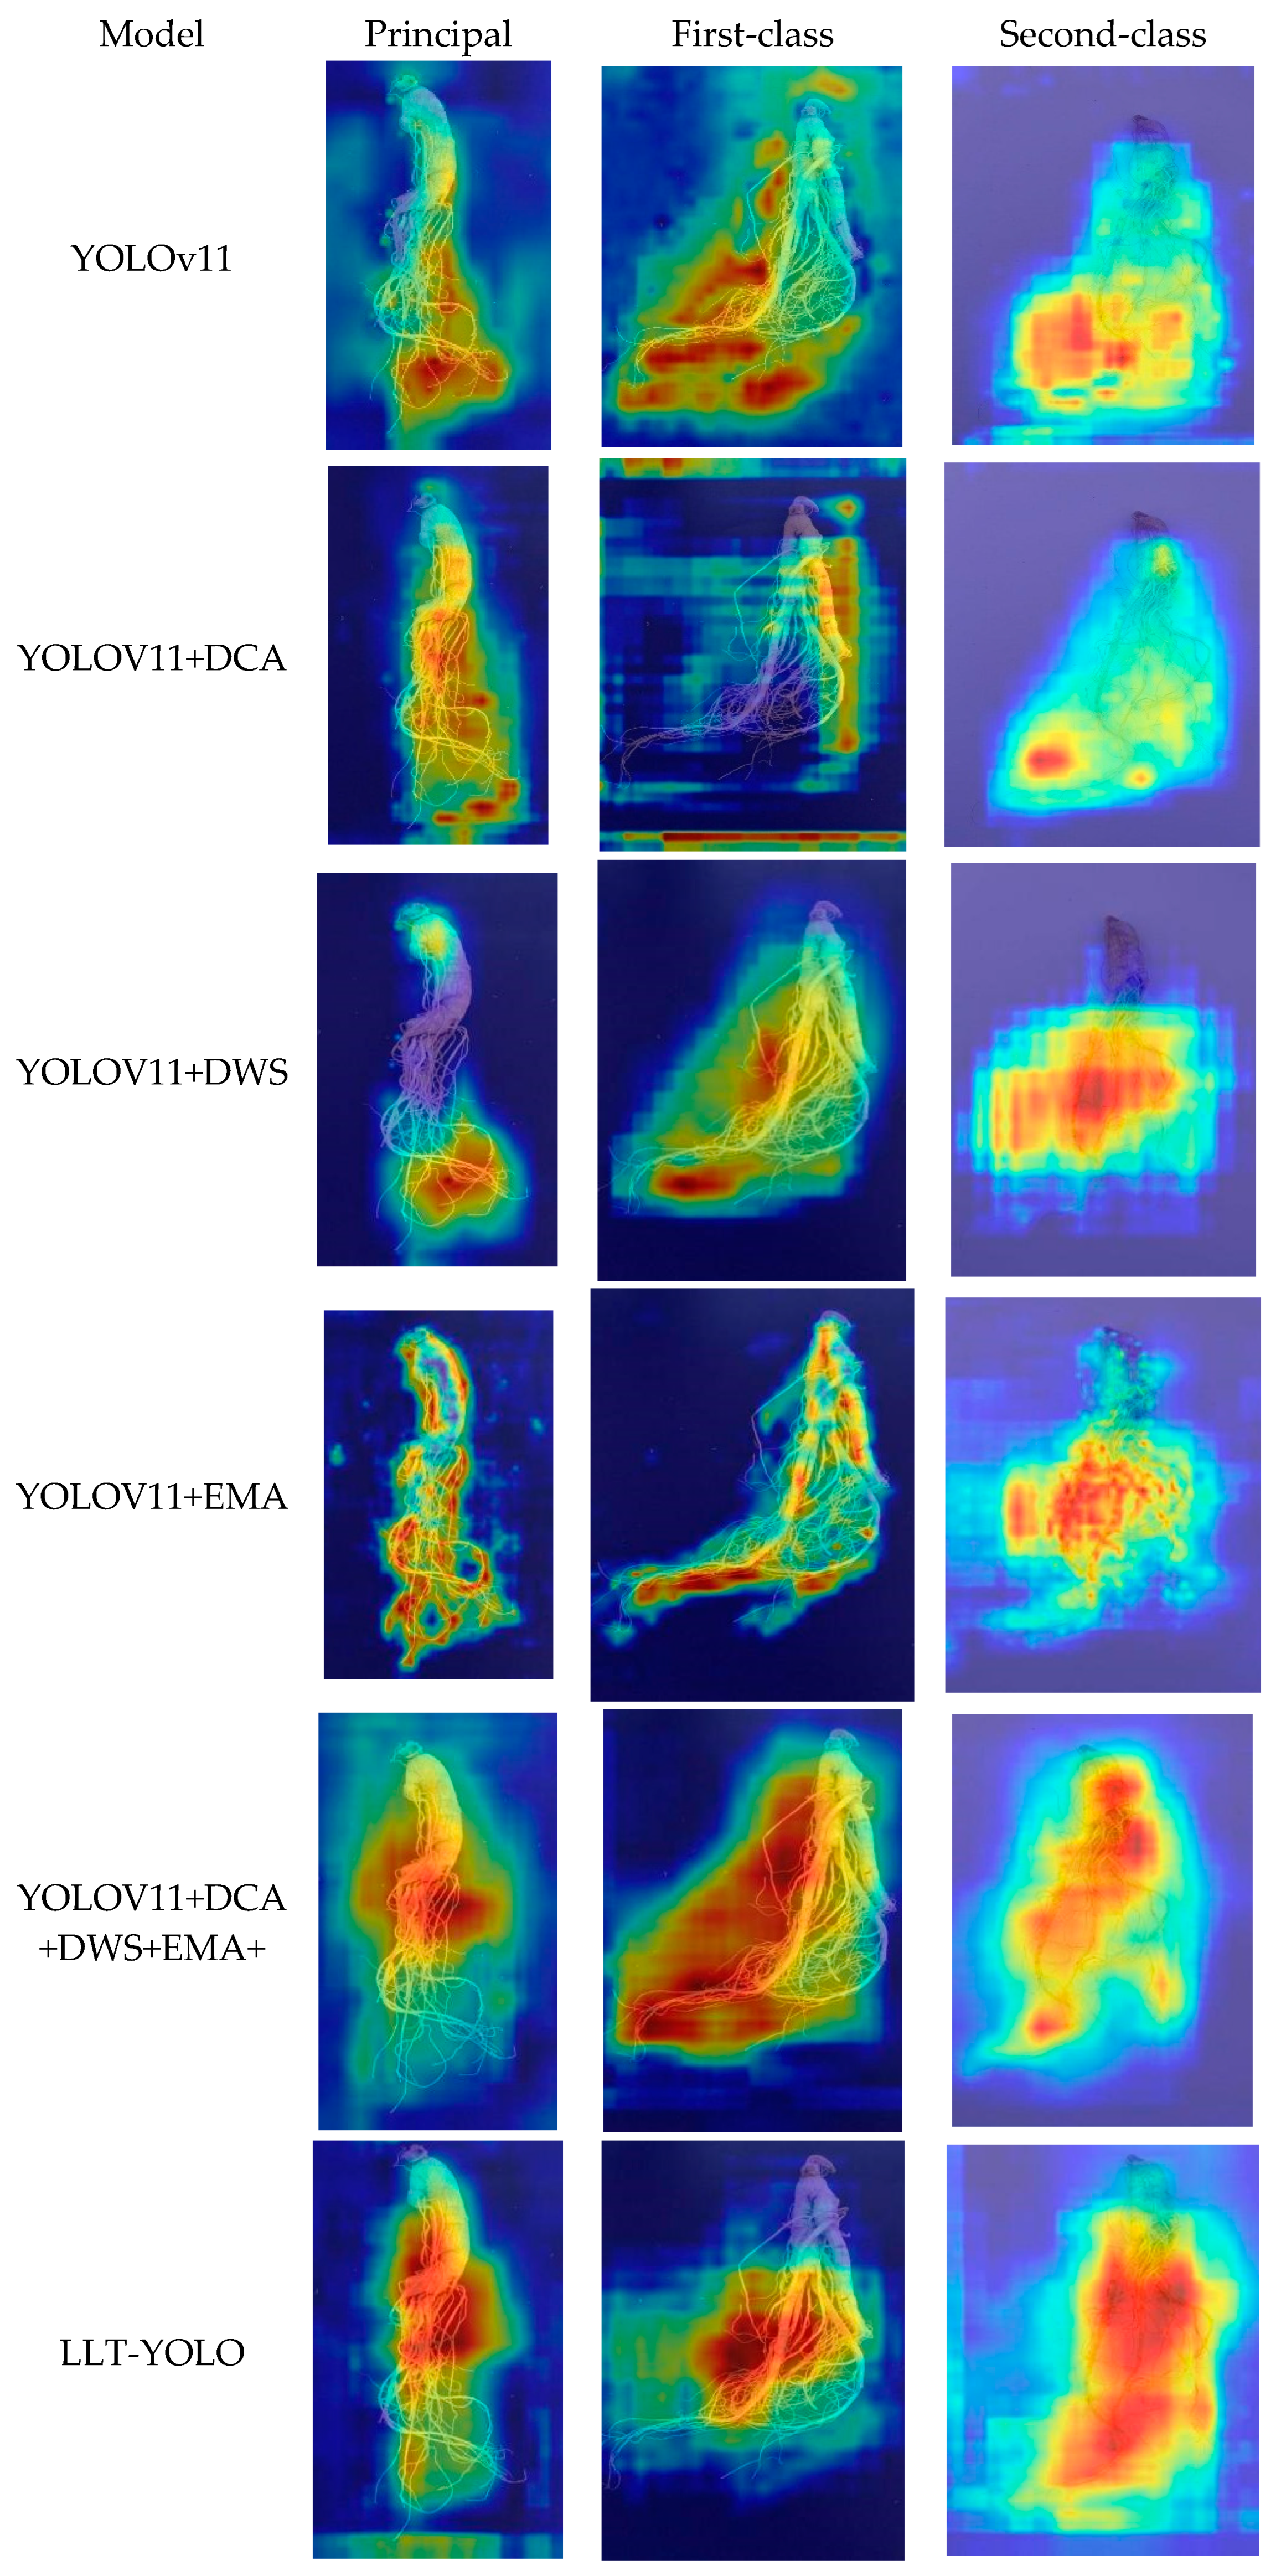
Additionally, we used Grad-CAM (Gradient-Weighted Class Activation Mapping) technology to visually assess the contributions of each improvement strategy [34]. Figure 13 shows the visualization results of ginseng appearance detection at different levels. As modules are introduced layer by layer, high-response areas transition from light pink to deep red, and the focus shifts from background noise to the main root texture, ginseng head, and lateral root edges, indicating a significant improvement in the network’s sensitivity to discriminative features. In the LLT-YOLOv11 images, the deep red regions are the most concentrated and continuous. Even under extremely lightweight conditions of 4.12 MB, the model can accurately locate subtle differences in ginseng appearance, fully validating its interpretability and robustness.

3.6. The Attention Mechanism on Model Performance

This research undertook a comprehensive examination of the effects of various attention mechanisms on the performance models of neural networks. To this end, we integrated multiple attention mechanisms into a superior iteration of the YOLOv11 architecture and compared them with EMA, as shown in Table 6. The specific attention mechanisms integrated are as follows: The context-based multi-head attention (CBMA) framework [35] effectively combines channel-wise and spatial attention mechanisms through complementary fusion, substantially improving feature representation capability; coordinate attention (CA) [36] cleverly combines information to capture long-term connections accurately; squeeze-and-excitation (SE) [37] modifies channel weights using global average pooling to enhance feature representations; the global attention mechanism (GAM) [38] employs global contextual data for including feature interdependencies; the non-local attention mechanism (NAM) [39] employs normalization techniques to stabilize the computation of attention weights; the simple attention module (SimAM) [40] effectively evaluates and weights neurons in feature maps using an energy function, improving the model’s representational capacity and performance; the channel attention module (ECA) enhances the feature representation capabilities of deep convolutional neural networks by capturing dependencies between channels.
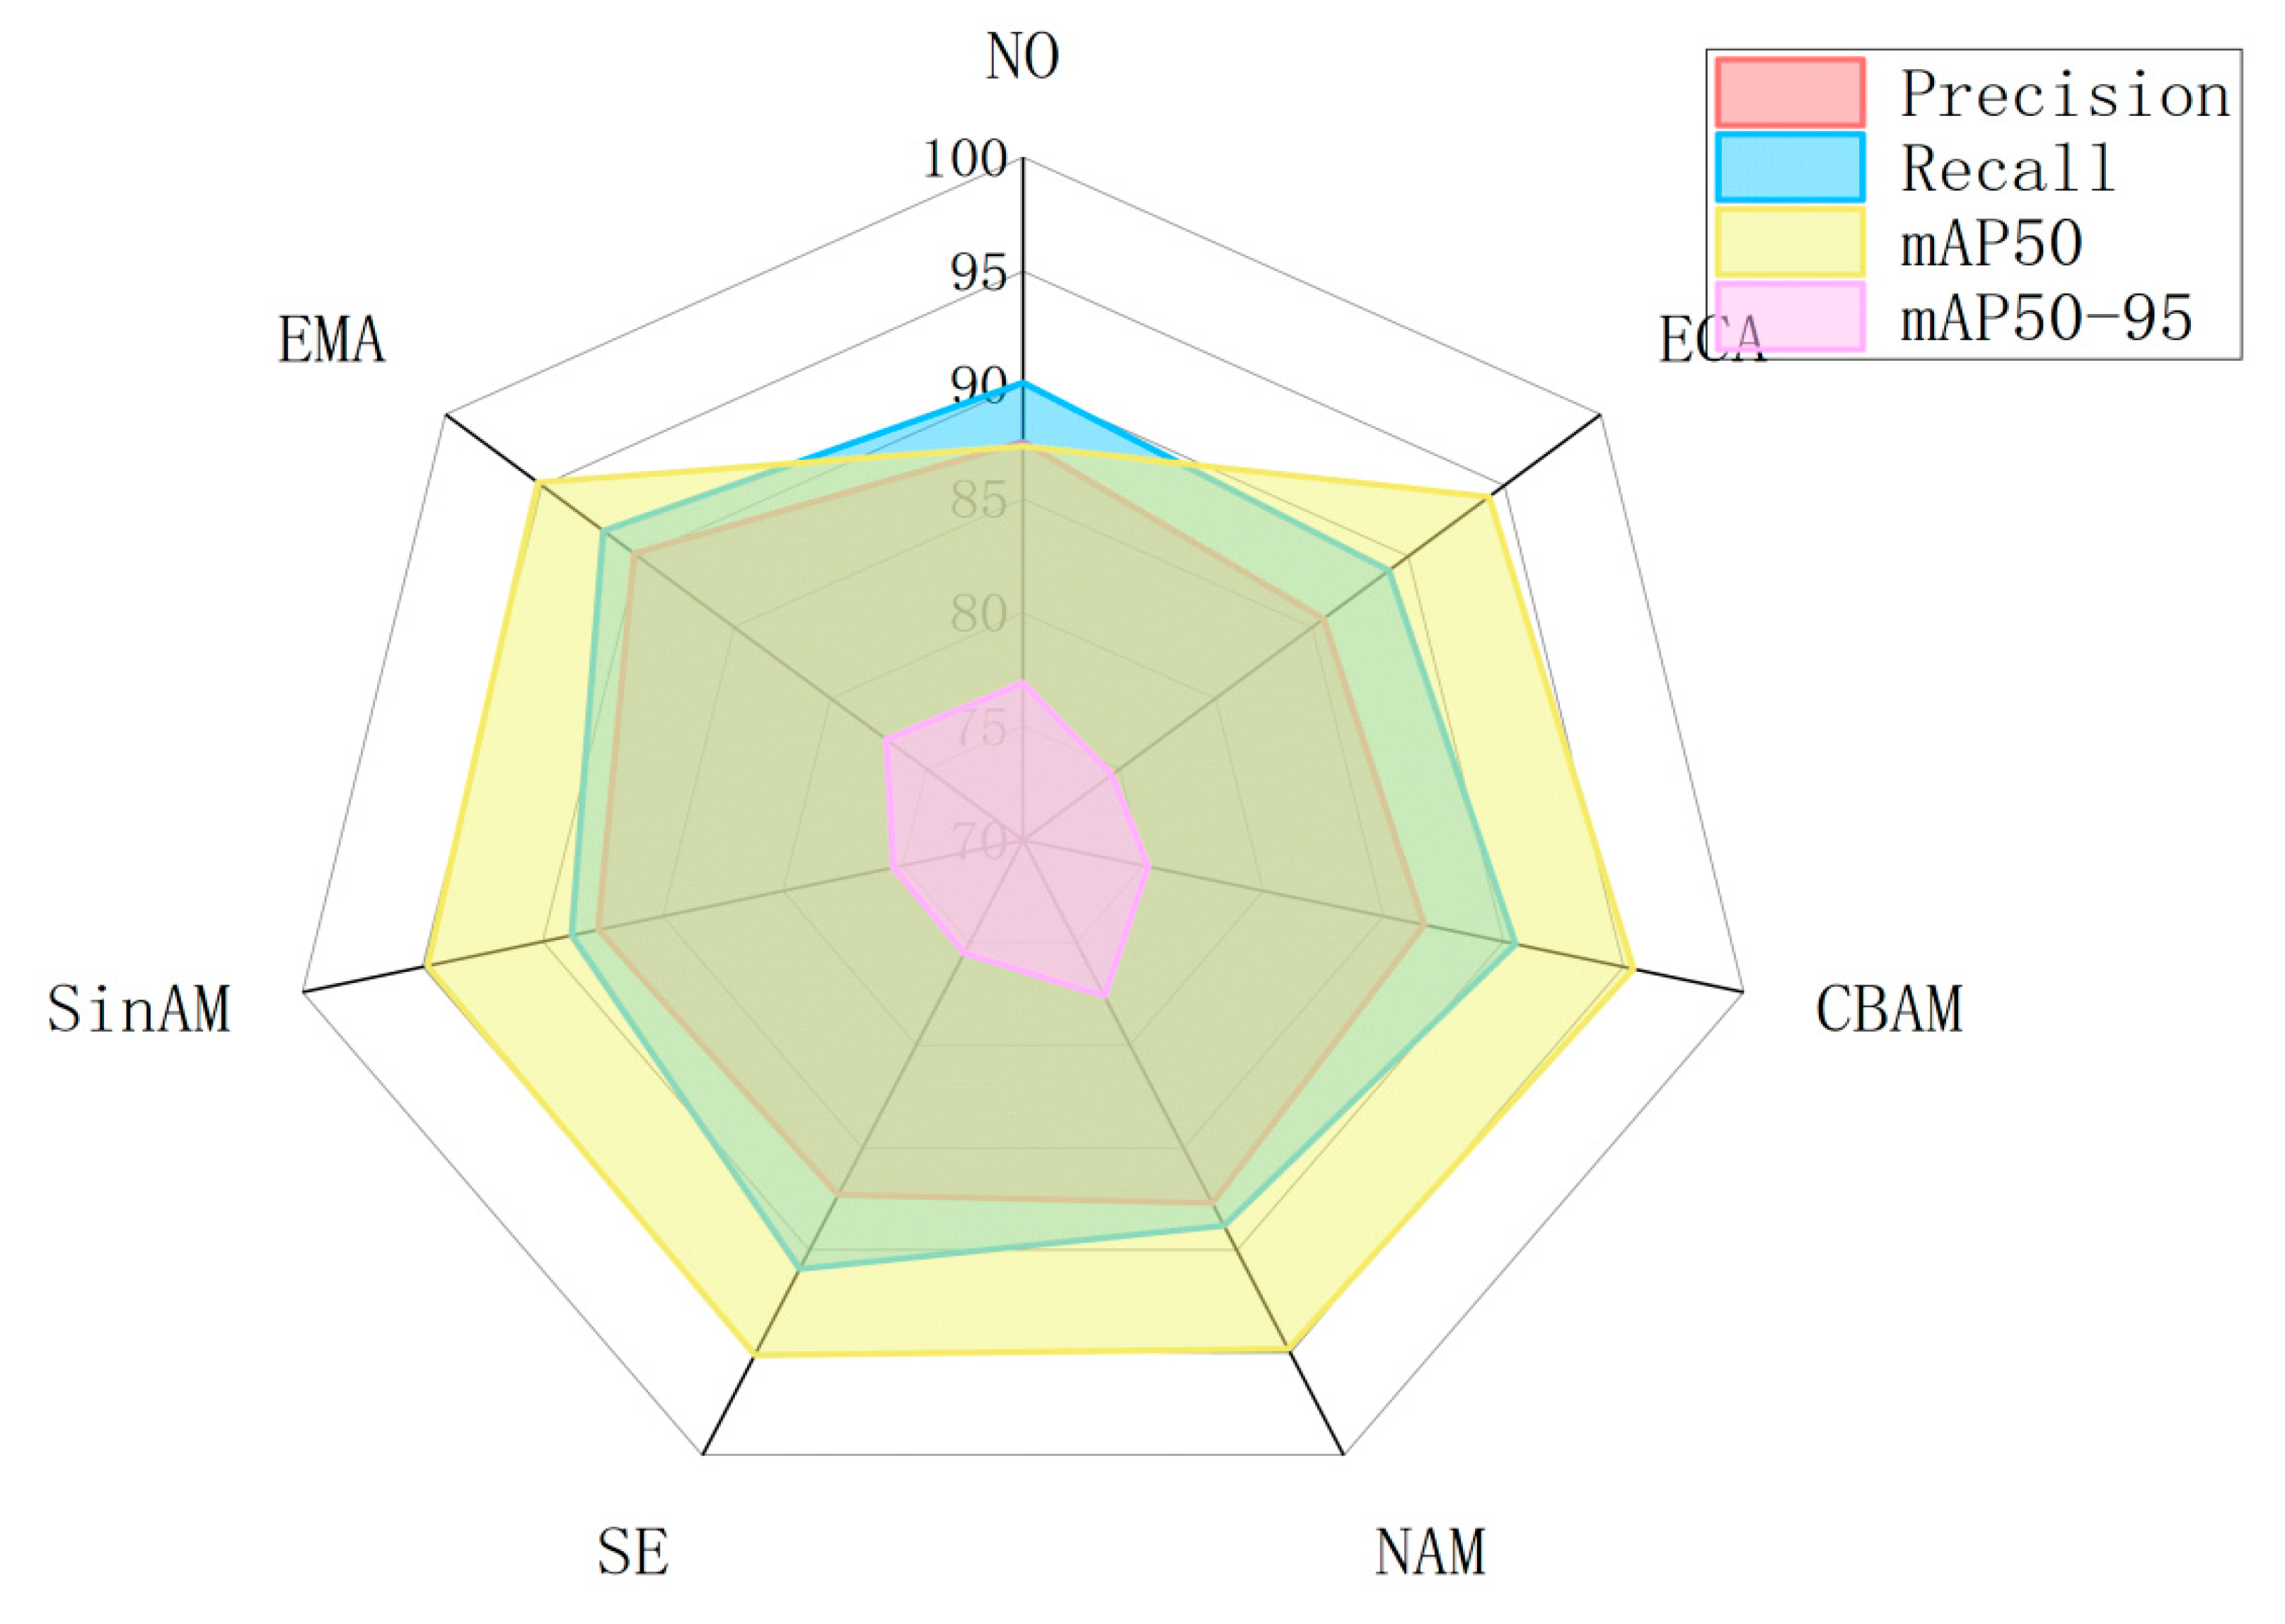
As shown in Table 6 and Figure 14, after introducing the attention module, most models outperform the unmodified YOLOv11 baseline on key metrics. Specifically, ECA improves the mAP50 by 6.9%. The FPS reaches a maximum of 146.32. However, the precision and recall decrease slightly, suggesting that its gains are mainly concentrated around the IoU = 0.5 threshold with limited contribution to metrics requiring high localization accuracy. CBAM’s mAP50 reaches a maximum of 95.4% with a recall of 90.5%, suggesting the accuracy of its channel space. The mAP50–95 of NAM improves 0.7% from the baseline, which is the highest among all modules, but has a relatively low recall, indicating that it achieves more accurate localization under stringent IoU conditions but still misses some instances and has the largest model size among all modules. The SE module achieves a recall of 90.9% and a recall of 95.1% for the mAP50, indicating that the channel space is not as accurate as the baseline and contributes limitedly to the more demanding metrics. CBAM achieves the highest mAP50 of 95.4% and a recall of 90.5%, indicating that its channel space is effectively augmenting its feature representations, and 95.1%, indicating that the channel re-tagging mechanism is beneficial to the overall recall performance. SimAM achieves 87.7% precision, mAP50 reaches 94.8%, and FPS verifies the effectiveness of parameter-free attention on fine-grained features. After a comprehensive comparison, EMA leads the overall performance with 90.2% precision, 91.8% recall, 95.2% mAP50, and 77.1% mAP50–95, and the other metrics are also very superior, indicating that it can help to focus on the critical areas of small targets and maintain high-precision detection in complex environments.

3.7. Experiments on Knowledge Distillation

3.7.1. Selection of Teacher Models

In this study, the performance of different YOLOv11 model architectures in the ginseng appearance grading task was compared. As demonstrated in Table 7, YOLOv11s achieves 95.7% mAP50 and 85.7% mAP50–95, while maintaining 93.8% precision and 95.3% recall, with a model size of merely 14.0 MB, thus establishing itself as the most superior in performance. In contrast, while YOLOv11x demonstrates a marginally higher mAP50 of 95.3%, its mAP50–95 is only 82.5%, exhibiting suboptimal performance under strict IoU thresholds, and its 71.5 MB size is considerably redundant; YOLOv11l exhibits the highest recall rate of 96.0%, rendering it suitable for scenarios sensitive to missed detections, but its size is similarly substantial; YOLOv11m exhibits an accuracy of 93.8% and a recall rate of 95.3%. Despite the efficacy of the evaluation metrics employed, given the intricate structural characteristics of ginseng, YOLOv11s emerges as the optimal Selection.

3.7.2. Analysis of Knowledge Distillation Scheme Selection

The present study explored a range of distillation methodologies, encompassing channel-based knowledge distillation (CWD), incorporating masked generative distillation (MGD) [41]. The enhancement of student representations is achieved by masking certain student attributes and reconstructing the entire teacher graph. The following knowledge distillation methods are based on the L1 loss function (L1) [42], Student models are trained by aligning teacher and student outputs with the L1 loss. The knowledge distillation method based on the L2 distance metric (L2) [43] is a process by which knowledge transfer is achieved by reducing the L2 distance between the outputs of the teacher and student models. Table 8: The experimental results are displayed in Table 8, where MGD demonstrates the poorest performance, achieving a precision of 88.1%. The recall rate of 90.7% indicates that the masking reconstruction strategy is not sufficiently adaptable to small-feature tasks. L1 91.2% precision, coupled with an mAP50 of 91.7%, exhibits the lowest recall rate and model size was the largest. This finding underscores the inherent limitation of a solitary L1 metric, namely its susceptibility to localization bias. Conversely, L2 achieves a 90.8% recall, accompanied by an mAP50 of 92.4%, demonstrating a higher recall capacity. In contrast, CWD demonstrates a high level of efficacy, with 90.5%, 92.3%, 95.1%, and 77.4% precision, recall, mAP50, and mAP50–95, respectively, and the model size is minimized (4.12). This suggests that CWD effectively preserves the generalization ability of the teacher model and significantly improves the performance of the student model, yielding excellent results.

3.8. Comparison Experiment

To further validate the superior performance of our model, this study conducted comparative experiments with other currently popular lightweight object detection models. The models included in the comparison are YOLOv5n, YOLOv7, YOLOv8n, YOLOv9s, YOLOv10n, YOLOv11n, and YOLOv12. In the experiments, all models were evaluated using a unified training set, validation set, and test set to ensure the fairness and comparability of the results. As shown in Table 9, LLT-YOLOv11 demonstrated superior performance in multiple key performance metrics compared to other models, indicating its high practicality and feasibility in real-world applications.
This study conducted a comprehensive evaluation of performance across several key metrics, including precision, recall, mAP50, and mAP50–95. Additionally, we look at the number of model sizes and parameters for each model to evaluate the model’s efficiency and practicality comprehensively. Through a detailed comparative analysis, the results show that LLT-YOLOv11 outperforms the other models in most performance measures. This finding not only demonstrates LLT-YOLOv11’s high performance in object detection tasks but also provides strong support for its application in resource-constrained environments.
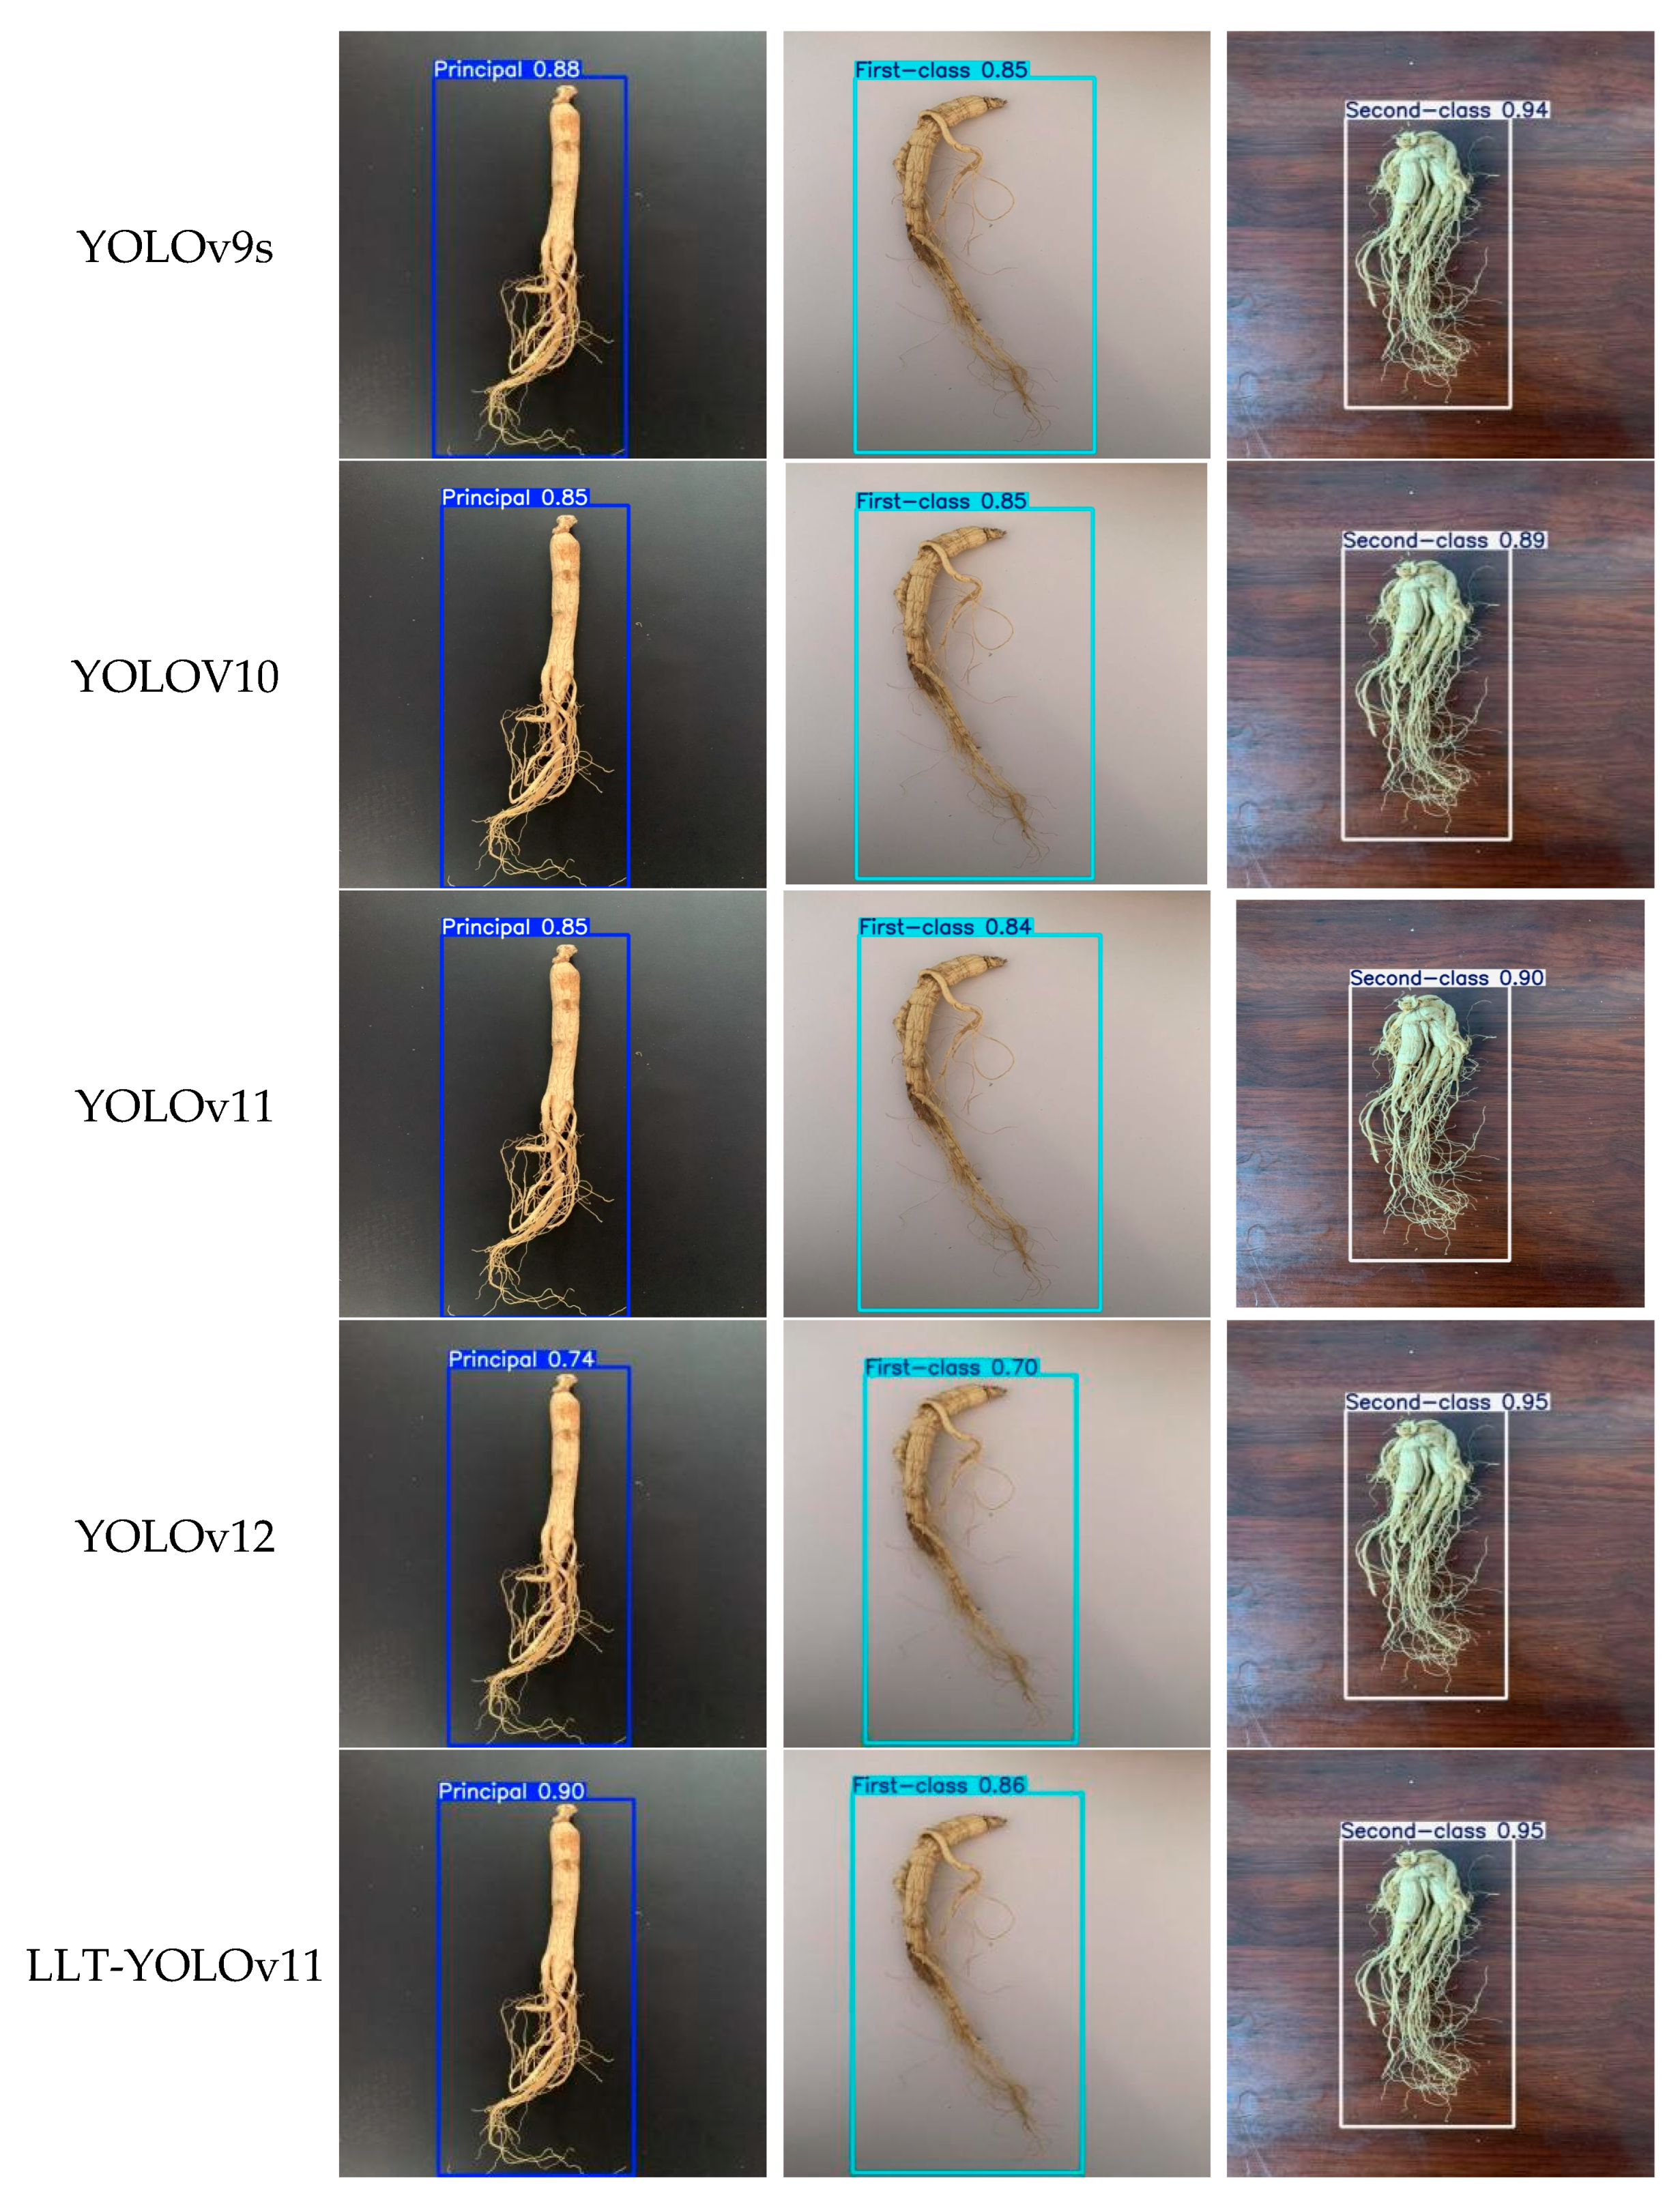
In this study, the performance of several key metrics such as precision, recall, mAP50, and mAP50–95 were comprehensively evaluated. Additionally, we examined the model size and the number of parameters for each model to fully assess the efficiency and utility of the models. Through detailed comparative analyses, the results show that LLT-YOLOv11 outperforms other models in most performance metrics. This result not only proves the high performance of LLT-YOLOv11 in object detection tasks, but also provides strong support for its application in resource-constrained environments. In contrast, YOLOv7, YOLOv7-tiny, and YOLOv9s are larger in terms of model size and number of parameters, among which YOLOv7’s model size and number of parameters are even higher than 74.7 and 37.21. While YOLOv5n, YOLOv8n, YOLOv11n, and YOLOv12n all demonstrate good accuracy and small parameter sizes, and are superior in specific metrics, the YOLOv5 model has the smallest size and parameter counts, at 4.43 and 2.18, respectively. Additionally, YOLOv11 achieves 87.5% and 90.1% in precision and recall, respectively. However, none of them is as good as LLT-YOLO. Figure 15 illustrates the performance of several object recognition models, including LLT-YOLOv11, YOLOv5n, YOLOv7, YOLOv8n, YOLOv9s, YOLOv10n, YOLOv11n, and YOLOv12n, on a specific test set. A comparative analysis reveals that LLT-YOLOv11 exhibits a significant advantage in terms of both accuracy and stability. This result indicates that LLT-YOLOv11 not only achieves high accuracy in the object detection task but also maintains consistency and reliability in its results. These characteristics are important in real-world applications where stringent demands are placed on detection performance. Therefore, the LLT-YOLOv11 model has considerable potential for applications and research in the field of object detection.

3.9. Interference Robustness Test

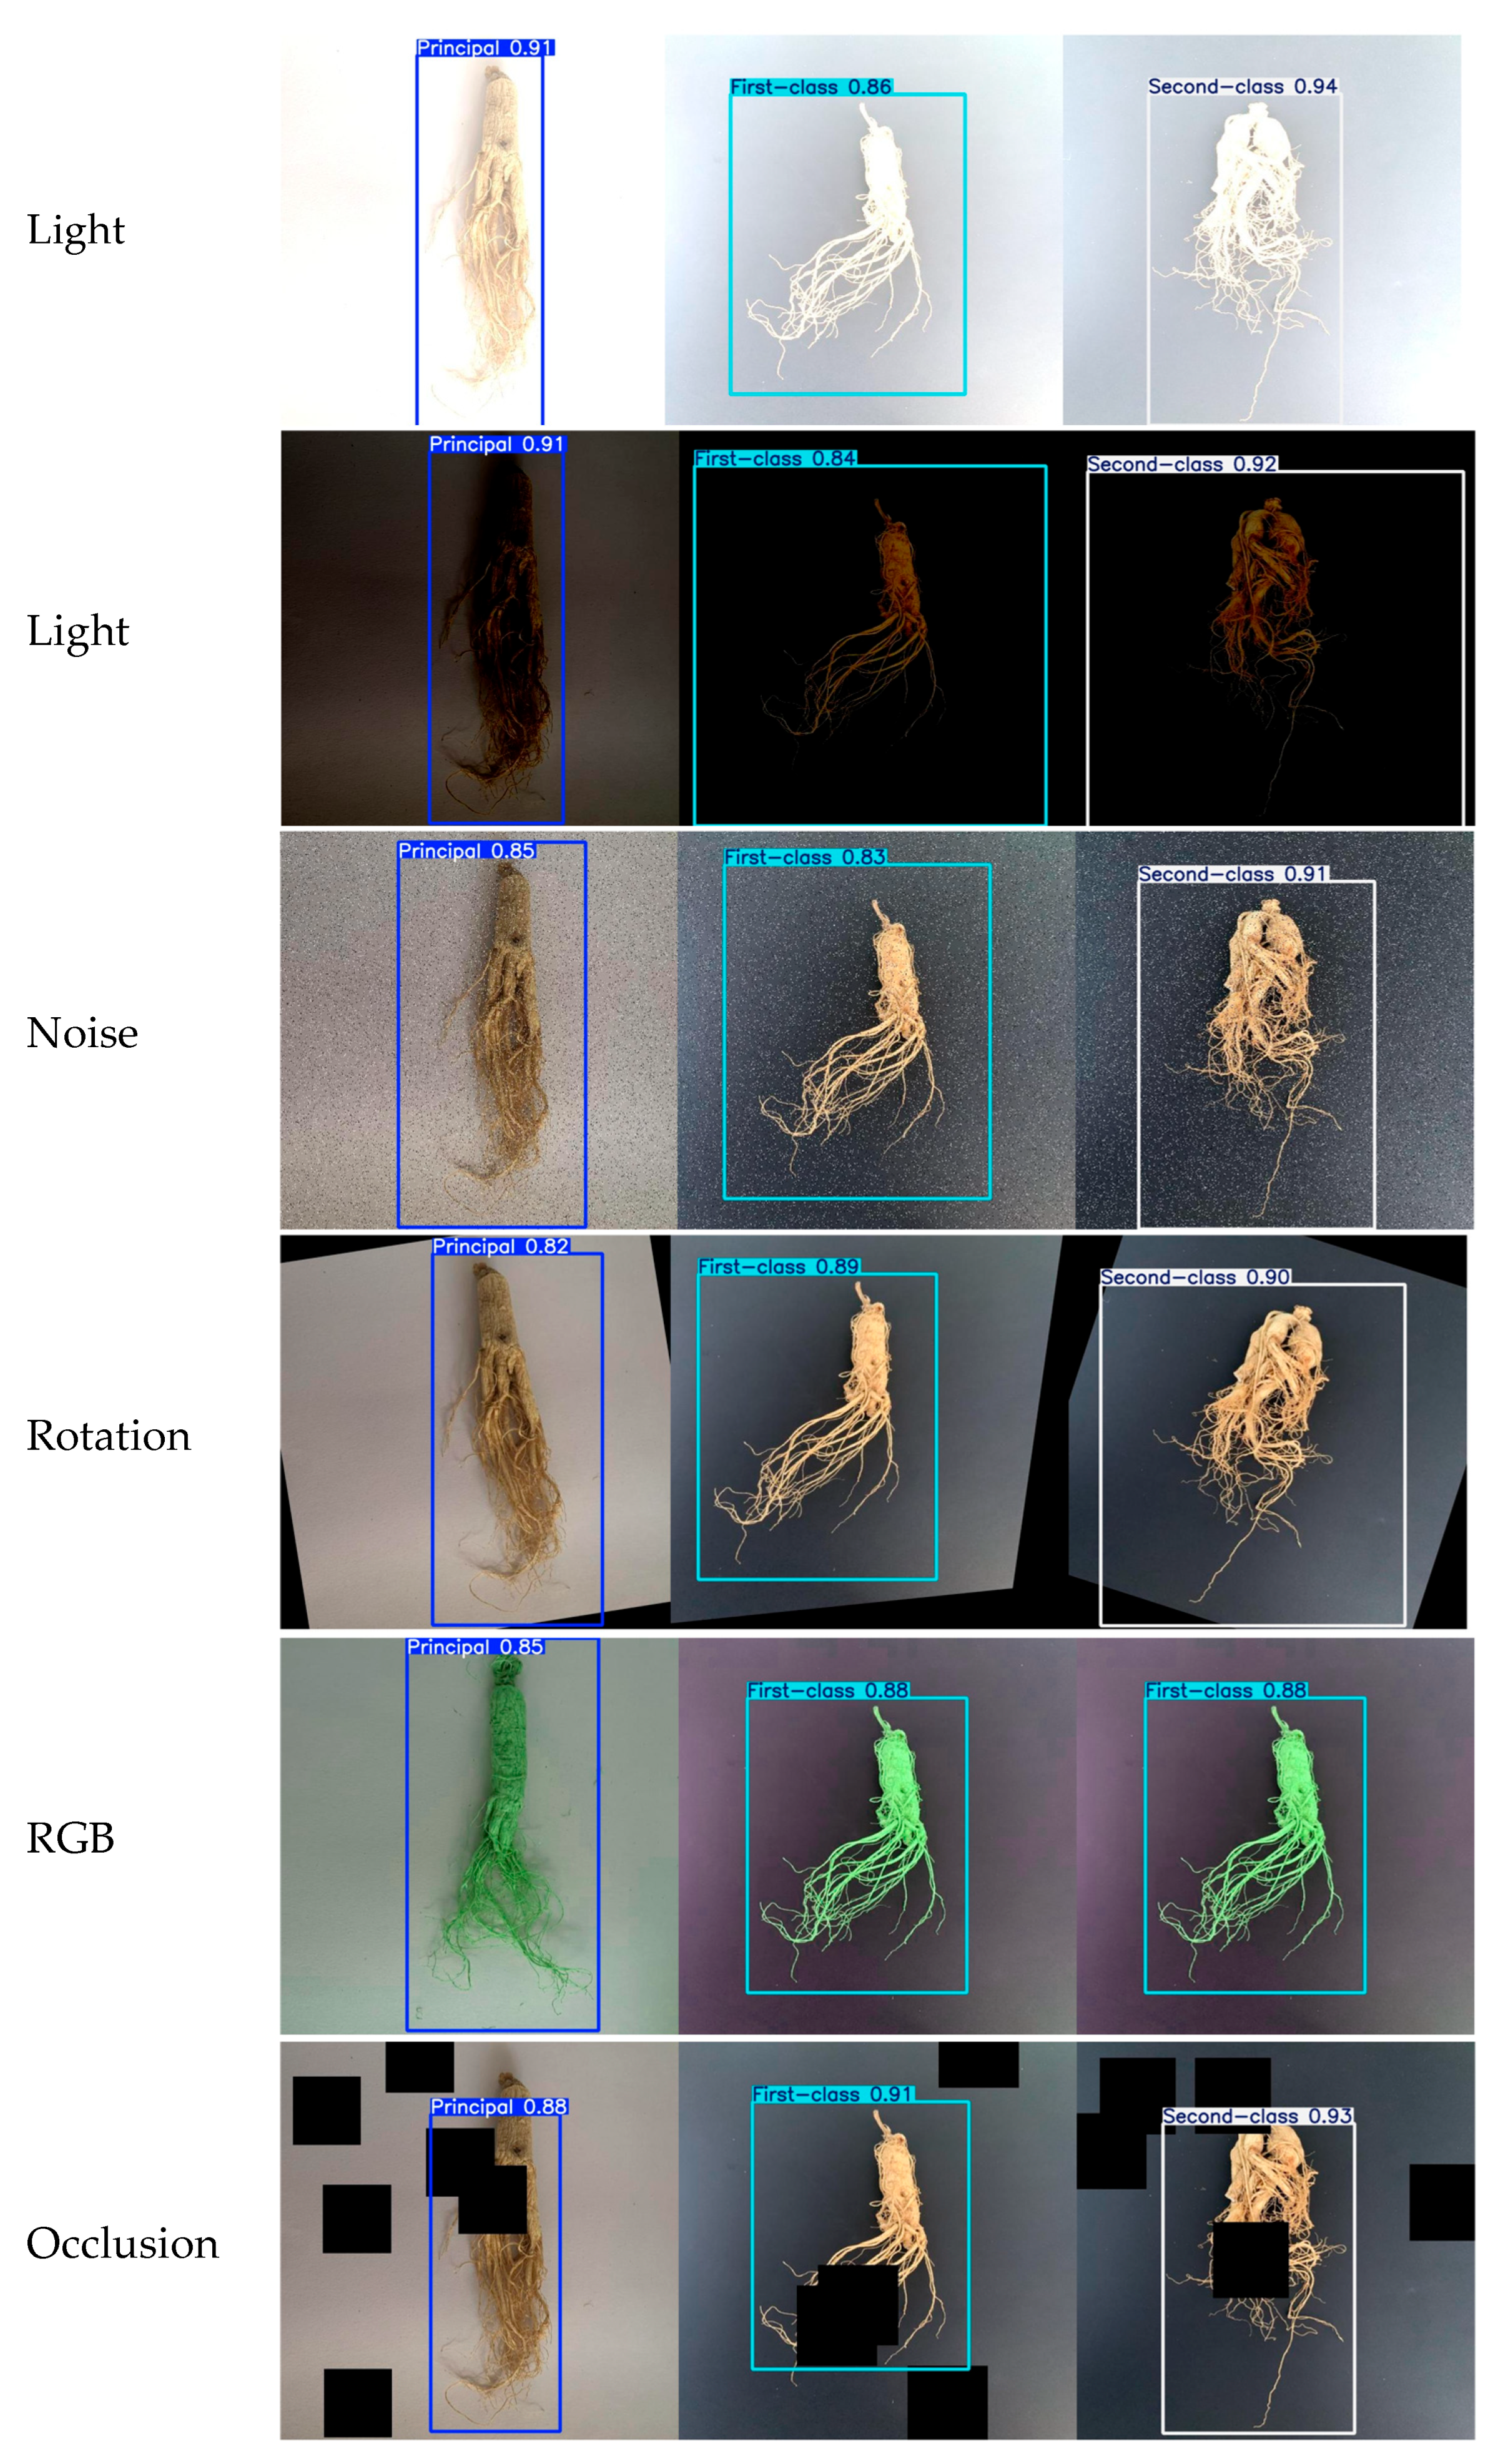
To comprehensively verify the reliability of LLT-YOLO in complex farmland environments, this study systematically constructs a test set encompassing five types of interference scenarios, including different lighting conditions (strong light, shadow), Gaussian noise, random occlusion, and background mixing. As shown in Figure 16, the visualization results further indicate that LLT-YOLO can still focus on the main root texture and key features of the reed head in the interference region, thus fully proving its robustness and practical application value in complex environments.

4. Discussion

Appearance-based ginseng quality inspection is of critical importance at every stage of the process, from harvesting to processing. It enables accurate identification of grades and defects, thereby ensuring grading accuracy. Furthermore, it significantly reduces the time and effort required for manual inspection, lowering labor costs and ensuring the final product quality. The LLT-YOLO model proposed in this paper achieves enhanced computational efficiency while maintaining high accuracy and high mAP. Although GFLOPs have increased slightly, model file memory usage has decreased by 35%, and the number of parameters has also decreased accordingly. The lightweight architecture of the model can be directly deployed on low-power edge devices, thereby significantly reducing hardware costs and effectively overcoming the speed and resource bottlenecks of traditional CNNs on small terminals. Furthermore, the study undertook detection experiments in a variety of interference conditions (including different lighting, noise, and background changes) in order to systematically evaluate the model’s stability in complex environments, thereby significantly enhancing the robustness of LLT-YOLO.
However, LLT-YOLO still has the following limitations: the diversity of ginseng samples in terms of varieties, growth stages and processing states makes it difficult and expensive to obtain large-scale annotated data, thus limiting the ability of the model to generalize; in real agricultural scenarios, the processing of high-resolution images and large-scale data still brings inference delays; the interference conditions in the experimental simulation are not enough to cover the lighting in real environments completely, The interference conditions simulated in the experiment are not yet sufficient to fully cover the drastic changes in light, season and complex background in the real environment, which may further affect the accuracy and stability; the model has not yet been deployed on the edge devices to verify its real-time performance and stability, and the subsequent work will be carried out in the following directions: Expand the dataset to include samples of red ginseng, western ginseng, and samples of different origins, planting methods, and processing phases, as well as to introduce a variety of processing statuses, such as fresh ginseng, dried ginseng, and sliced ginseng; In the real agricultural environment To validate the robustness of the model in real farmland environments with variable light, seasons and complex backgrounds; to optimize the inference speed for high-resolution images and large-scale data scenarios; to validate the model by deploying it on low-power platforms, such as the Jetson Orin Nano, to comprehensively evaluate the model’s performance in terms of power consumption, temperature, memory consumption and stability; and to explore the model’s cross-domain migration for morphologically similar crops, in order to further enhance its versatility and practical application value. And practical application value.

5. Conclusions

In this study, an appearance-based ginseng quality detection model, LLT-YOLO, was constructed using YOLOv11n as the basic framework. By integrating the DCA module, deep separable convolution DWSConv, and multi-scale attention mechanism EMA, assisted by channel-level knowledge distillation, the experimental results show that the model is significantly improved for the detection of ginseng samples with small targets and complex morphology. Compared with the baseline model YOLOv11n, precision and recall are improved by 3% and 2.2%, respectively, and the mAP50 reaches 95.1%, and the model size is greatly reduced (4.12 MB), which achieves an effective balance between accuracy and light weight. However, this study still has some limitations, including the use of a single dataset, the potential for leakage detection under complex interference conditions, and the fact that it has not yet been deployed and validated on edge devices. Subsequent research can be focused on increasing the detection performance under complex interference conditions and reducing the computational effort. In addition, we have plans to expand the dataset to include ginseng of different varieties, growth stages, and processing stages, thereby achieving sample diversity and experimental robustness. Meanwhile, the model has been extended for damage assessment of ginseng and quality inspection of similar crops, and has been deployed on real-time edge platforms such as the Jetson series for validation. This research provides strong technical support for the advancement of smart agriculture and contributes to more efficient and effective farm management practices.

Author Contributions

Conceptualization, Y.L. and H.Y.; methodology, Y.L.; software, Y.L.; validation, Y.L. and H.Y.; formal analysis, Y.L.; investigation, Y.L.; resources, L.Z.; data curation, H.Y.; writing—original draft preparation, Y.L.; writing—review and editing, L.Z. and J.L.; visualization, Y.L.; supervision, L.Z. and J.L.; project administration, L.Z.; funding acquisition, L.Z. All authors have read and agreed to the published version of the manuscript.

Funding

Jilin Provincial Science and Technology Development Program (Grant No. 20250201081GX); Supported by the Jilin Provincial Science and Technology Department-Jilin Provincial Cross-Regional Collaborative Innovation Center for Agricultural Intelligent Equipment; Scientific Research Project of the Jilin Provincial Department of Education (Grant No. JJKH20250574BS); Science and Technology Project of the Jilin Provincial Department of Agriculture and Rural Affairs (Grant No. 2024PG1204).

Data Availability Statement

Data are contained within the article.

Acknowledgments

The author thanks Ultralytics for providing YOLOv11 architecture and open-source implementation. We thank the anonymous reviewers for their helpful and constructive comments.

Conflicts of Interest

The authors declare no conflicts of interest.

References

  1. Coon, J.T.; Ernst, E.  Panax ginseng. Drug Saf. 2002, 25, 323–344. [Google Scholar] [CrossRef] [PubMed]
  2. Irfan, M.; Kwak, Y.-S.; Han, C.-K.; Hyun, S.H.; Rhee, M.H. Adaptogenic effects of Panax ginseng on modulation of cardiovascular functions. J. Ginseng Res. 2020, 44, 538–543. [Google Scholar] [CrossRef] [PubMed]
  3. Kitts, D.D.; Hu, C. Efficacy and safety of Ginseng. Public Health Nutr. 2000, 3, 473–485. [Google Scholar] [CrossRef]
  4. Liu, S.; Ai, Z.; Hu, Y.; Ren, G.; Zhang, J.; Tang, P.; Zou, H.; Li, X.; Wang, Y.; Nan, B.; et al. Ginseng glucosyl oleanolate inhibits cervical cancer cell proliferation and angiogenesis via PI3K/AKT/HIF-1α pathway. npj Sci. Food 2024, 8, 105. [Google Scholar] [CrossRef]
  5. Lee, K.-Y.; Shim, S.-L.; Jang, E.-S.; Choi, S.-G. Ginsenoside stability and antioxidant activity of Korean red ginseng (Panax ginseng CA Meyer) extract as affected by temperature and time. LWT 2024, 200, 116205. [Google Scholar] [CrossRef]
  6. Mancuso, C.; Santangelo, R. Panax ginseng and Panax quinquefolius: From pharmacology to toxicology. Food Chem. Toxicol. 2017, 107, 362–372. [Google Scholar] [CrossRef]
  7. Zhou, Z.; Li, M.; Zhang, Z.; Song, Z.; Xu, J.; Zhang, M.; Gong, M. Overview of Panax ginseng and its active ingredients’ protective mechanism on cardiovascular diseases. J. Ethnopharmacol. 2024, 334, 118506. [Google Scholar] [CrossRef]
  8. Fang, J.; Xu, Z.-F.; Zhang, T.; Chen, C.-B.; Liu, C.-S.; Liu, R.; Chen, Y.-Q. Effects of soil microbial ecology on ginsenoside accumulation in Panax ginseng across different cultivation years. Ind. Crops Prod. 2024, 215, 118637. [Google Scholar] [CrossRef]
  9. Ye, X.-W.; Li, C.-S.; Zhang, H.-X.; Li, Q.; Cheng, S.-Q.; Wen, J.; Wang, X.; Ren, H.-M.; Xia, L.-J.; Wang, X.-X.; et al. Saponins of ginseng products: A review of their transformation in processing. Front. Pharmacol. 2023, 14, 1177819. [Google Scholar] [CrossRef]
  10. Dong, S.; Wang, P.; Abbas, K. A survey on deep learning and its applications. Comput. Sci. Rev. 2021, 40, 100379. [Google Scholar] [CrossRef]
  11. Chen, H.; Engkvist, O.; Wang, Y.; Olivecrona, M.; Blaschke, T. The rise of deep learning in drug discovery. Drug Discov. Today 2018, 23, 1241–1250. [Google Scholar] [CrossRef]
  12. Li, D.; Yang, C.; Yao, R.; Ma, L. Origin identification of Saposhnikovia divaricata by CNN Embedded with the hierarchical residual connection block. Agronomy 2023, 13, 1199. [Google Scholar] [CrossRef]
  13. Li, D.; Piao, X.; Lei, Y.; Li, W.; Zhang, L.; Ma, L. A Grading Method of Ginseng (Panax ginseng C. A. Meyer) Appearance Quality Based on an Improved ResNet50 Model. Agronomy 2022, 12, 2925. [Google Scholar] [CrossRef]
  14. Li, D.; Zhai, M.; Piao, X.; Li, W.; Zhang, L. A Ginseng Appearance Quality Grading Method Based on an Improved ConvNeXt Model. Agronomy 2023, 13, 1770. [Google Scholar] [CrossRef]
  15. Yang, H.; Yang, L.; Wu, T.; Yuan, Y.; Li, J.; Li, P. MFD-YOLO: A fast and lightweight model for strawberry growth state detection. Comput. Electron. Agric. 2025, 234, 110177. [Google Scholar] [CrossRef]
  16. Li, H.; Gu, Z.; He, D.; Wang, X.; Huang, J.; Mo, Y.; Li, P.; Huang, Z.; Wu, F. A lightweight improved YOLOv5s model and its deployment for detecting pitaya fruits in daytime and nighttime light-supplement environments. Comput. Electron. Agric. 2024, 220, 108914. [Google Scholar] [CrossRef]
  17. Gai, R.; Chen, N.; Yuan, H. A detection algorithm for cherry fruits based on the improved YOLO-v4 model. Neural Comput. Appl. 2023, 35, 13895–13906. [Google Scholar] [CrossRef]
  18. Ren, R.; Zhang, S.; Sun, H.; Wang, N.; Yang, S.; Zhao, H.; Xin, M. YOLO-RCS: A method for detecting phenological period of ’Yuluxiang’ pear in an unstructured environment. Comput. Electron. Agric. 2025, 229, 109819. [Google Scholar] [CrossRef]
  19. Gao, J.; Zhang, J.; Zhang, F.; Gao, J. LACTA: A lightweight and accurate algorithm for cherry tomato detection in unstructured environments. Expert Syst. Appl. 2024, 238, 122073. [Google Scholar] [CrossRef]
  20. Jrondi, Z.; Moussaid, A.; Hadi, M.Y. Exploring End-to-End object detection with transformers versus YOLOv8 for enhanced citrus fruit detection within trees. Syst. Soft Comput. 2024, 6, 200103. [Google Scholar] [CrossRef]
  21. Wang, J.; Liu, M.; Du, Y.; Zhao, M.; Jia, H.; Guo, Z.; Su, Y.; Lu, D.; Liu, Y. PG-YOLO: An efficient detection algorithm for pomegranate before fruit thinning. Eng. Appl. Artif. Intell. 2024, 134, 108700. [Google Scholar] [CrossRef]
  22. Jin, S.; Zhou, L.; Zhou, H. CO-YOLO: A lightweight and efficient model for Camellia oleifera fruit object detection and posture determination. Comput. Electron. Agric. 2025, 235, 110394. [Google Scholar] [CrossRef]
  23. Zhang, Z.; Chen, X.; Zhang, K.; Zhang, R.; Wang, Y. Research on the current situation of ginseng industry and development counter-measures in Jilin Province. J. Jilin Agric. Univ. 2023, 45, 649–655. [Google Scholar]
  24. Jiang, M.; Liang, Y.; Pei, Z.; Wang, X.; Zhou, F.; Wei, C.; Feng, X. Diagnosis of breast hyperplasia and evaluation of RuXian-I based on metabolomics deep belief networks. Int. J. Mol. Sci. 2019, 20, 2620. [Google Scholar] [CrossRef]
  25. Zhou, F.; Jin, L.; Dong, J. A Survey on Convolutional Neural Networks. Chin. J. Comput. 2017, 40, 1229–1251. [Google Scholar]
  26. Zheng, Y.; Li, G.; Li, Y. A Survey on the Application of Deep Learning in Image Recognition. Comput. Eng. Appl. 2019, 55, 20–36. [Google Scholar]
  27. Terven, J.; Córdova-Esparza, D.-M.; Romero-González, J.-A. A comprehensive review of yolo architectures in computer vision: From YOLOv1 to YOLOv8 and YOLO-NAS. Mach. Learn. Knowl. Extr. 2023, 5, 1680–1716. [Google Scholar] [CrossRef]
  28. Khanam, R.; Hussain, M. Yolov11: An overview of the key architectural enhancements. arXiv 2024, arXiv:2410.17725. [Google Scholar] [CrossRef]
  29. Shao, Y.; Zhang, D.; Chu, H.; Zhang, X.; Rao, Y. A Survey on YOLO Object Detection Based on Deep Learning. J. Electron. Inf. Technol. 2022, 44, 3697–3708. [Google Scholar]
  30. Xiong, Y.; Li, Z.; Chen, Y.; Wang, F.; Zhu, X.; Luo, J.; Wang, W.; Lu, T.; Li, H.; Qiao, Y.; et al. Efficient deformable convnets: Rethinking dynamic and sparse operators for vision applications. In Proceedings of the IEEE/CVF Conference on Computer Vision and Pattern Recognition, Seattle, WA, USA, 16–22 June 2024; pp. 5652–5661. [Google Scholar]
  31. Chollet, F. Xception: Deep Learning with Depthwise Separable Convolutions. In Proceedings of the 30th IEEE Conference on Computer Vision and Pattern Recognition (CVPR), Honolulu, HI, USA, 21–26 July 2017; pp. 1251–1258. [Google Scholar]
  32. Ouyang, D.; He, S.; Zhang, G.; Luo, M.; Guo, H.; Zhan, J.; Huang, Z. Efficient multi-scale attention module with cross-spatial learning. In Proceedings of the ICASSP 2023—2023 IEEE International Conference on Acoustics, Speech and Signal Processing (ICASSP), Rhodes Island, Greece, 4–10 June 2023; IEEE: New York, NY, USA, 2023; pp. 1–5. [Google Scholar]
  33. Shu, C.; Liu, Y.; Gao, J.; Yan, Z.; Shen, C. Channel-wise knowledge distillation for dense prediction. In Proceedings of the IEEE/CVF International Conference on Computer Vision, Montreal, BC, Canada, 11–17 October 2021; pp. 5311–5320. [Google Scholar]
  34. Selvaraju, R.R.; Cogswell, M.; Das, A.; Vedantam, R.; Parikh, D.; Batra, D. Grad-cam: Visual explanations from deep networks via gradient-based localization. In Proceedings of the IEEE International Conference on Computer Vision, Venice, Italy, 22–29 October 2017; pp. 618–626. [Google Scholar]
  35. Woo, S.; Park, J.; Lee, J.-Y.; Kweon, I.S. Cbam: Convolutional block attention module. In Proceedings of the European Conference on Computer Vision (ECCV), Munich, Germany, 8–14 September 2018; pp. 3–19. [Google Scholar]
  36. Hou, Q.; Zhou, D.; Feng, J. Coordinate attention for efficient mobile network design. In Proceedings of the IEEE/CVF Conference on Computer Vision and Pattern Recognition, Nashville, TN, USA, 20–25 June 2021; pp. 13713–13722. [Google Scholar]
  37. Hu, J.; Shen, L.; Sun, G. Squeeze-and-excitation networks. In Proceedings of the IEEE Conference on Computer Vision and Pattern Recognition, Salt Lake City, UT, USA, 18–22 June 2018; pp. 7132–7141. [Google Scholar]
  38. Liu, Y.; Shao, Z.; Hoffmann, N. Global attention mechanism: Retain information to enhance channel-spatial interactions. arXiv 2021, arXiv:2112.05561. [Google Scholar] [CrossRef]
  39. Liu, Y.; Shao, Z.; Teng, Y.; Hoffmann, N. NAM: Normalization-based attention module. arXiv 2021, arXiv:2111.12419. [Google Scholar] [CrossRef]
  40. Yang, L.; Zhang, R.Y.; Li, L.; Xie, L. Simam: A simple, parameter-free attention module for convolutional neural networks. In Proceedings of the International Conference on Machine Learning, Online, 18–24 July 2021; Volume 139, pp. 11863–11874. [Google Scholar]
  41. Yang, Z.; Li, Z.; Shao, M.; Shi, D.; Yuan, Z.; Yuan, C. Masked generative distillation. In Proceedings of the European Conference on Computer Vision, Tel Aviv, Israel, 23–27 October 2022; Springer Nature: Cham, Switzerland, 2022; pp. 53–69. [Google Scholar]
  42. Kim, J.; Park, S.U.; Kwak, N. Paraphrasing complex network: Network compression via factor transfer. arXiv 2018, arXiv:1802.04977. [Google Scholar]
  43. Romero, A.; Ballas, N.; Kahou, S.E.; Chassang, A.; Gatta, C.; Bengio, Y. Fitnets: Hints for thin deep nets. arXiv 2014, arXiv:1412.6550. [Google Scholar]
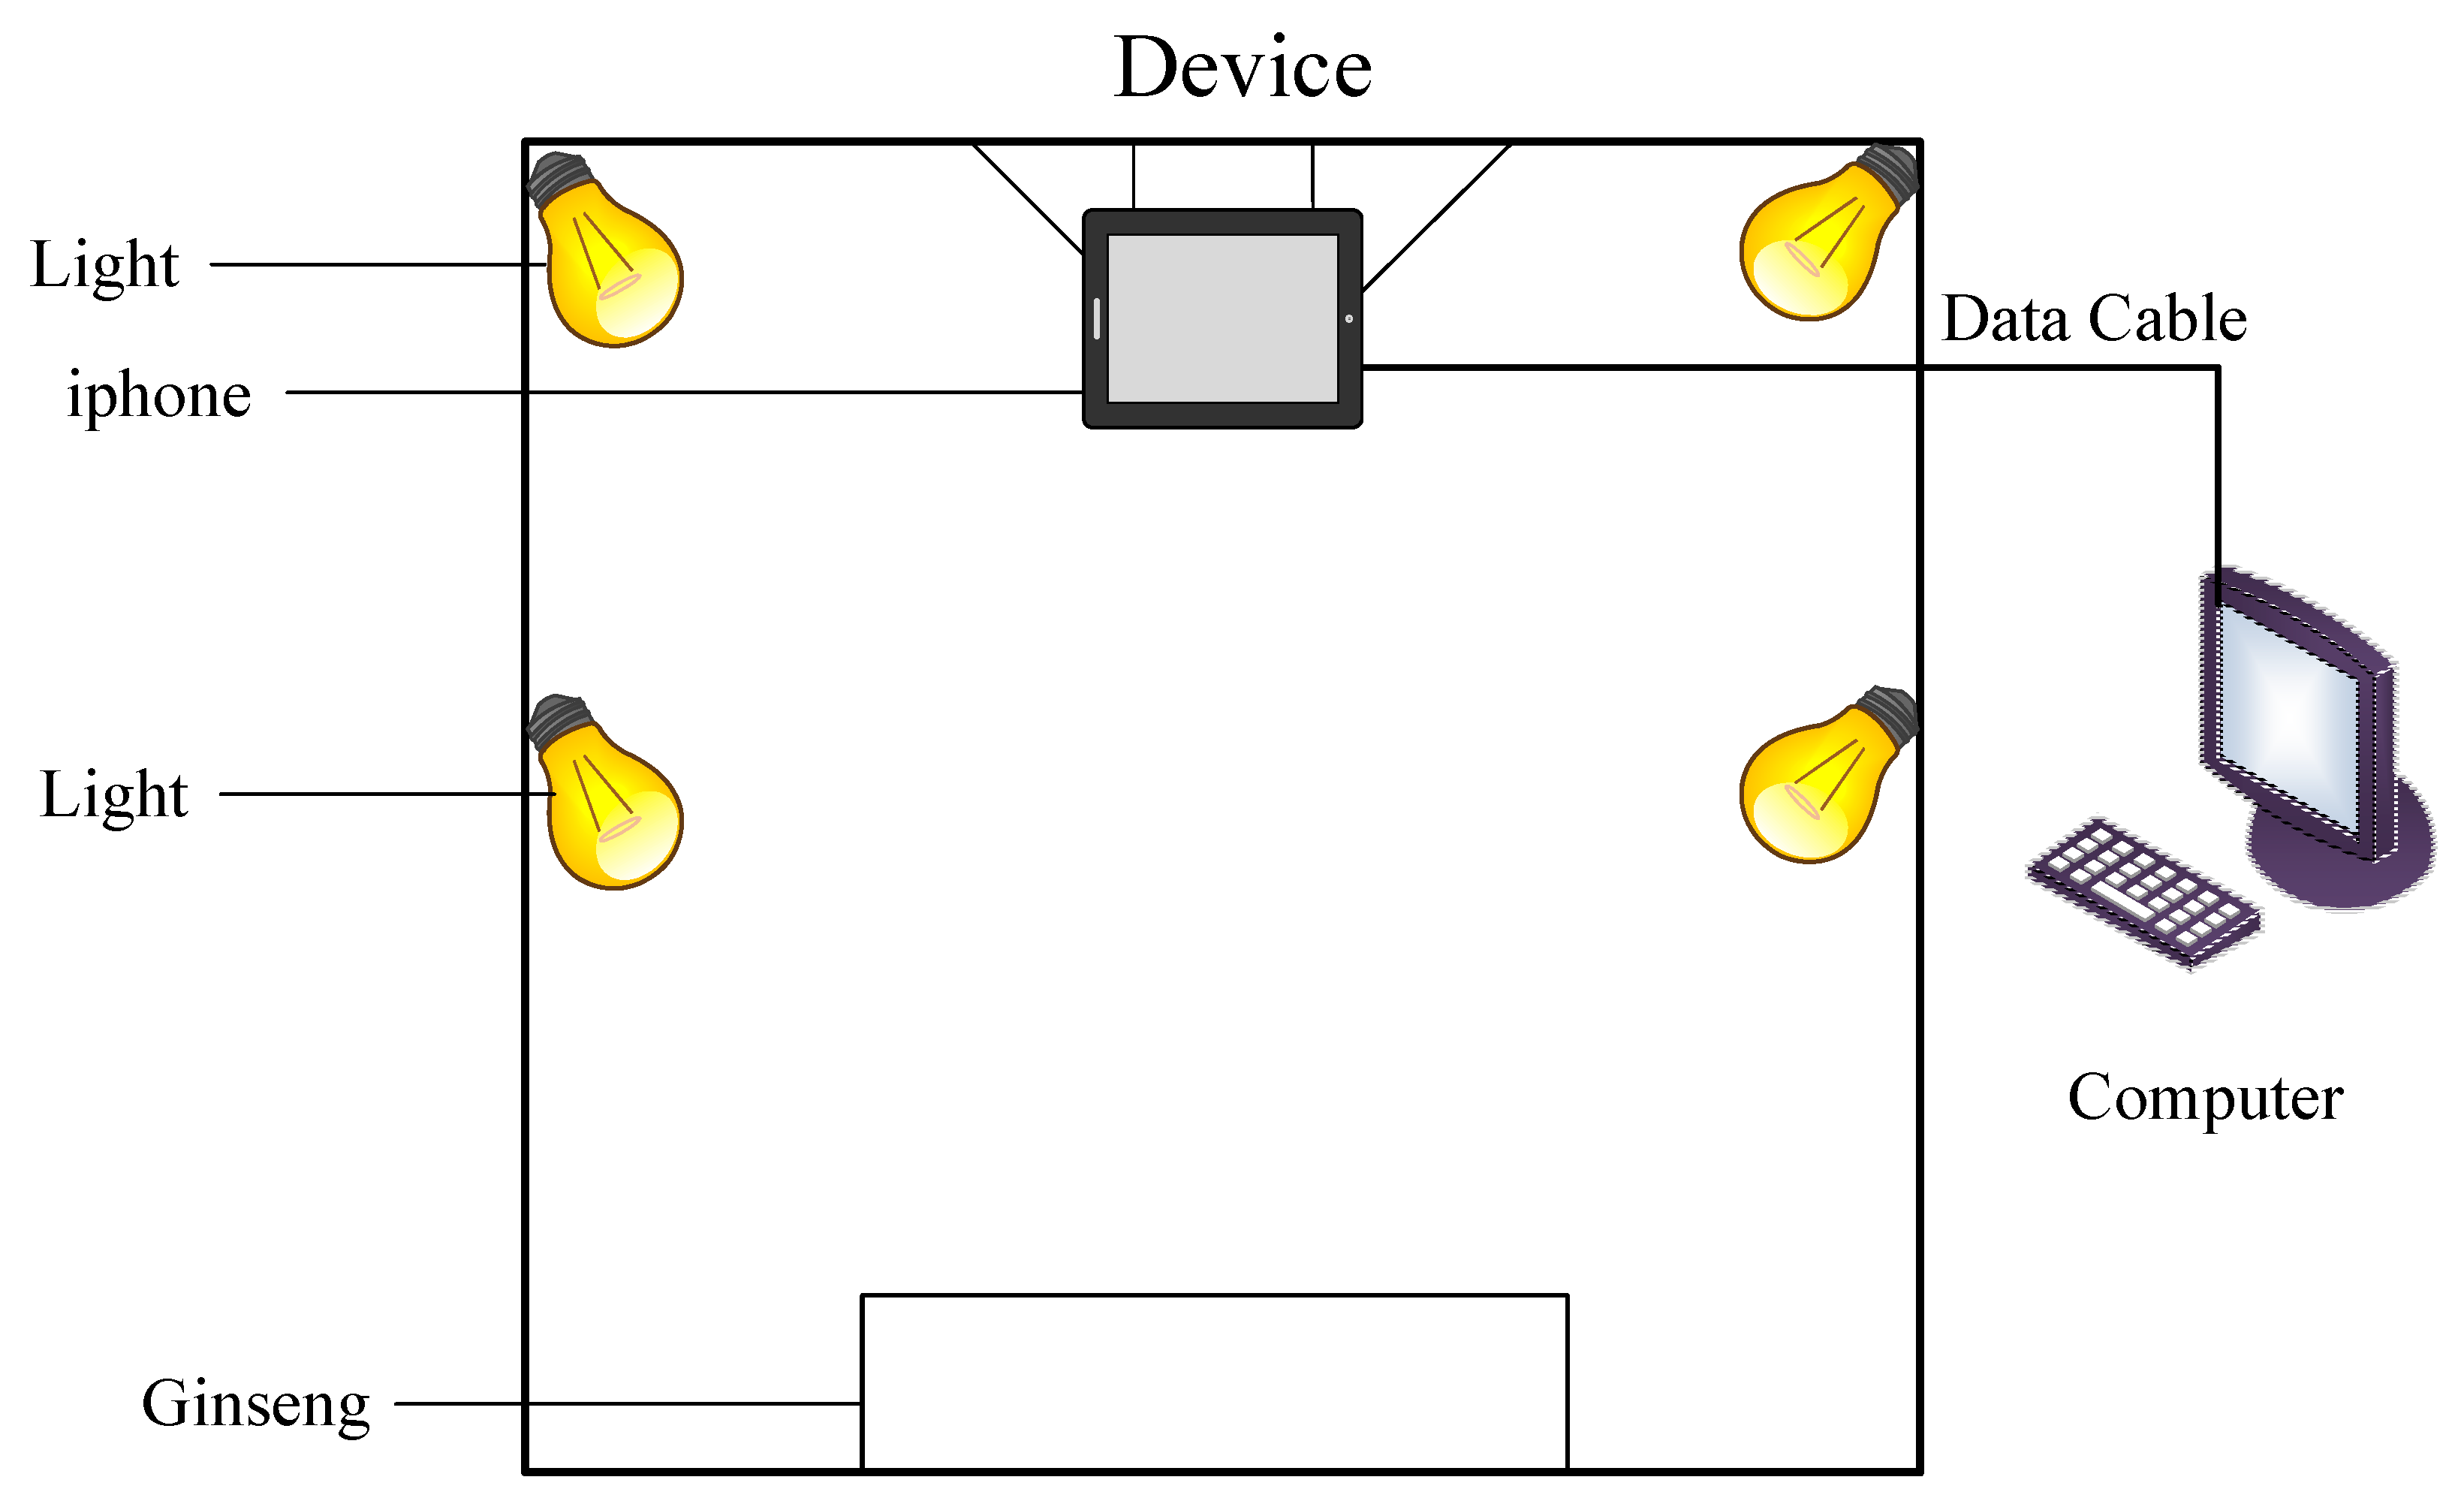
Figure 1. An apparatus for capturing ginseng images.
Horticulturae 11 01120 g001
Figure 2. Dataset classification.
Horticulturae 11 01120 g002
Figure 3. Ginseng image collection: (a) raw dataset; (b) augmented dataset.
Horticulturae 11 01120 g003
Figure 4. YOLOv11 model structure.
Horticulturae 11 01120 g004
Figure 6. The main job of DCNv4 is to spatially aggregate query pixels from multiple places in the same channel.
Horticulturae 11 01120 g006
Figure 7. The topological organization of the DCA neural network framework.
Horticulturae 11 01120 g007
Figure 8. Schematic of depth-wise separable convolution.
Horticulturae 11 01120 g008
Figure 9. EMA Module Structure.
Horticulturae 11 01120 g009
Figure 10. Knowledge distillation structure diagram.
Horticulturae 11 01120 g010
Figure 11. Comparison of data-enhanced metrics.
Horticulturae 11 01120 g011
Figure 12. Images illustrating the detection results of several models.
Horticulturae 11 01120 g012
Figure 13. Visualization results. Vibrant colors are key detection.
Horticulturae 11 01120 g013
Figure 14. Performance evaluation of various attention mechanisms integrated with StarBlock on test dataset.
Horticulturae 11 01120 g014
Figure 15. Images showing the various models’ detection outcomes.
Horticulturae 11 01120 g015aHorticulturae 11 01120 g015b
Figure 16. Detection result images under various interference conditions.
Horticulturae 11 01120 g016
Table 1. Grading specifications for Panax species.
ProjectsPrincipal GinsengFirst-Class GinsengSecond-Class Ginseng
Main RootLike a cylindrical
Branch RootThere are two to three clear branching roots, and the thickness is more evenOne to four branches, some rough and others smooth
RutabagaWith a reed head and ginseng fibrous rootsThe reed head and ginseng’s fibrous roots are more completeRutabaga and ginseng with roots that are not fully fibrous
GrooveGrooves that are clearNot a clear, distinct grooveWithout grooves
SurfaceLight yellow or pale yellow, no rust in water, and no draw linesGrayish-yellow or yellowish-white, with light water rust, or with holes for pumpsyellowish-white or grayish-yellow, with a little more water rust and holes for pumps
TextureHarder, powdery, non-hollow
Gross-sectionPowdery and yellowish-white in color, with a resinous tract that may be seen
Diameter Length≥3.53.0–3.492.5–2.99
Damage, ScarsNo significant injuryMinor injuryMore serious
Insects, Mildew, ImpuritiesNoneMildPresence
SectionSection neat, clearSegment is obviousSegments are not obvious
SpringtailsSquare or rectangularMade conical or cylindricalIrregular shape
Weight500 g/root or more250–500 g/root100–250 g/root
Table 2. Specific experiment hyperparameters.
HyperparametersValue
Image size640 × 640
Epochs300
OptimizerSGD
Batch Size32
Initial Learning Rate0.01
Final Learning Rate0.01
Close MosaicLast ten epochs
Workers8
Weight-decay0.0005
Momentum0.937
Table 3. Enhanced ginseng categorization performance.
LevelModelPrecision (%)Recall (%)mAP (%)mAP50–95 (%)
ALLYOLOV1187.590.187.376.9
LLT-YOLOv1190.592.395.177.4
PrincipalYOLOV1191.391.692.472.9
LLT-YOLOv1195.791.696.778.8
First-classYOLOV1182.283.087.767.0
LLT-YOLOv1184.893.794.275.2
Second-classYOLOV1176.681.185.772.6
LLT-YOLOv1190.986.994.478.3
Table 4. Comparison of data-enhanced metrics.
Augmentation StrategyPrecision (%)Recall (%)mAP50 (%)mAP50–95 (%)
original87.186.491.8971.77
Data enhancement90.592.395.177.4
Table 5. Ablation experiments.
ModelPrecision
(%)
Recall
(%)
mAP50
(%)
mAP50–95
(%)
GFlopsFPSModel Size
(MB)
Parameters
(M)
YOLOV1187.590.187.376.96.3111.905.242.58
A79.489.792.472.26.6104.115.262.24
B84.487.293.872.95.3608.274.102.15
C90.291.895.277.16.5477.075.192.59
D85.793.496.377.76.7106.184.152.32
E89.190.396.177.66.985.655.232.47
F87.290.895.775.66.788.934.072.36
G88.192.796.179.07.087.004.122.00
LLT-YOLOv1190.592.395.177.47.2114.454.122.00
Table 6. Performance comparison among various attention architectures.
Attention MechanismsPrecision (%)Recall (%)mAP50 (%)mAP50–95 (%)FPSGflopsWeight
NO87.590.187.376.9111.906.35.24
ECA85.689.094.274.6146.326.35.35
CBAM86.790.595.475.2111.296.45.52
NAM87.788.894.877.6126.476.37.03
SE87.390.995.175.5105.386.55.36
SimAM87.788.894.875.4130.496.35.35
EMA90.291.895.277.1114.216.55.19
Table 7. Comparison of the YOLOv11 Series Models.
ModelPrecision/%Recall/%mAP50/%mAP50–95/%Model Size/MB
YOLOv11m93.895.395.083.938.6
YOLOv11l93.196.095.185.448.8
YOLOv11x92.494.395.382.571.5
YOLOv11s93.995.795.785.714.0
Table 8. Comparison of results of different knowledge distillation methods.
MethodPrecision/%Recall/%mAP50/%mAP50–95/%Model Size/MB
MGD88.190.791.577.04.22
L191.290.391.777.64.63
L289.790.892.478.24.47
CWD90.592.395.177.44.12
Table 9. Comparative analysis of diverse attention architectures’ performance metrics.
ModelPrecision/%Recall/%mAP50/%mAP50–95/%Model Size/MBParameters/%FPS
YOLOV5n86.590.691.271.84.432.18163.38
YOLOv771.6375.9181.7751.674.737.2166.31
YOLOv7-tiny63.678.67248.712.36.0357.91
YOLOv8n87.688.291.974.65.362.68151.24
YOLOv9s85.894.695.078.212.66.1984.79
YOLOv10n77.589.889.371.45.492.69135.70
YOLOv11n87.590.187.376.95.242.58111.90
YOLOv12n88.283.387.875.25.322.5087.22
LLT-YOLOv1190.592.395.177.44.122.00114.45
Disclaimer/Publisher’s Note: The statements, opinions and data contained in all publications are solely those of the individual author(s) and contributor(s) and not of MDPI and/or the editor(s). MDPI and/or the editor(s) disclaim responsibility for any injury to people or property resulting from any ideas, methods, instructions or products referred to in the content.