Article

Structural Variation and Evolutionary Dynamics of Orobanchaceae from the Perspective of the Mitochondrial Genomes Pedicularis kansuensis and Pedicularis chinensis

1
State Key Laboratory of Plateau Ecology and Agriculture, Qinghai University, Xining 810016, China
2
Qinghai Academy of Animal and Veterinary Science, Qinghai University, Xining 810016, China
*
Author to whom correspondence should be addressed.
Horticulturae 2025, 11(9), 1095; https://doi.org/10.3390/horticulturae11091095
Submission received: 14 May 2025 / Revised: 1 September 2025 / Accepted: 6 September 2025 / Published: 10 September 2025
(This article belongs to the Section Genetics, Genomics, Breeding, and Biotechnology (G2B2))

Abstract

To better understand the mitochondrial genome evolution within the genus Pedicularis, we investigated two representative species, Pedicularis kansuensis and Pedicularis chinensis. We sequenced and assembled the mitochondrial genomes of two Pedicularis species, P. kansuensis and P. chinensis, using Nanopore technology. Both genomes showed irregular morphological characteristics, with P. chinensis measuring 225,612 bp and P. kansuensis 273,598 bp, and GC (guanine and cytosine) contents of 44.42% and 44.29%, respectively. Each genome encodes 36 unique protein-coding genes, 3 rRNA genes, and varying numbers of tRNA genes (P. chinensis: 20; P. kansuensis: 19). Codon usage analysis revealed distinct preferences, while repeat sequence analysis identified significant differences in SSRs, tandem repeats, and dispersed repeats between the two genomes. Structural analyses highlighted genome recombination facilitated by repeat sequences. Phylogenetic analysis confirmed the placement of Pedicularis within Orobanchaceae, clustering P. kansuensis and P. chinensis with Castilleja paramensis and other genera in the family, thus resolving longstanding taxonomic uncertainties regarding their relationship with Scrophulariaceae. RNA editing events were predominantly C-to-U, ccmB and nad4 exhibiting the highest editing frequencies. Synteny analysis revealed frequent rearrangements, underscoring the dynamic evolution of Pedicularis mitochondrial genomes. These findings provide valuable insights into the structure, function, and evolution of mitochondrial genomes in parasitic plants.

1. Introduction

Plant cells encompass two sorts of organelles possessing their individual genomes, namely mitochondria and chloroplasts. The mitochondrial genomes (mitogenomes) primarily encode proteins engaged in respiration, while the chloroplast genomes (plastomes) mainly encode proteins implicated in photosynthesis [1,2,3]. The mitogenomes of plants display considerable variability in both size and structure across different species, ranging from 66 kb to 11.7 Mb, and exist in various molecular forms, including circular, linear, and branched [4,5,6]. The sequence and structure information of plant mitogenomes is of significance for comprehending the evolutionary history, phylogenetic relationships, genetic diversity, and functional attributes of plants. Assembling complete plant mitogenomes is challenging because of structural variation, long repetitive sequences, and the transfer of DNA between the nucleus, mitochondria, and plastids. So far, more than 16,700 complete plastomes have been reported (https://ngdc.cncb.ac.cn/cgir/, accessed on 8 July 2023), whereas fewer than 700 complete mitogenomes are available in the NCBI Nucleotide database [2].
Pedicularis constitutes a considerable genus of parasitic plants within the family Orobanchaceae, encompassing approximately 600 species, primarily distributed in Asia, Europe, and North America [7,8]. Pedicularis plants display high morphological diversity and ecological adaptability, and thereby constitute ideal materials for the study of plant evolution and ecology. Nevertheless, the mitogenome information of Pedicularis plants remains scarce, with only a few species having partial or complete mitogenome sequences reported. For example, the known mitochondrial genome of P. rex is 219,859 bp in length and contains 56 genes, including 34 protein-coding genes, 19 tRNA genes, and 3 rRNA genes [9]. P. chinensis and P. kansuensis are distributed in montane grasslands of central and western China. As typical root hemiparasitic plants, both species interact with grasses or legumes through haustoria, thereby influencing community structure and interspecific competition [10]. Driven by multiple factors such as climate warming, high seed reproductive capacity, and low palatability to herbivores, P. kansuensis has widely spread across degraded grasslands on the Qinghai–Tibet Plateau [11,12].
While their ecological roles have been well recognized, the mitochondrial genomic characteristics of Pedicularis species remain poorly explored. To bridge this knowledge gap, we employed high-throughput sequencing technology to assemble the entire mitogenomes of two Pedicularis species: P. chinensis and P. kansuensis. We compared and analyzed the structure, gene content, synteny, phylogeny, and RNA editing of the mitogenomes of these two species, and contrasted them with other known Pedicularis and Orobanchaceae plant mitogenomes. Our study offers novel insights into the mitogenome characteristics and evolution of Pedicularis plants, and lays a molecular foundation for further exploration of the diversity and adaptability of Pedicularis plants.

2. Materials and Methods

2.1. Plant DNA Extraction and Sequencing

Fresh leaves of P. kansuensis and P. chinensis were collected from their natural habitats in northwest China. Both species are wild-type root hemiparasitic plants with no specific variety designation. After collection, the leaves were immediately frozen in liquid nitrogen and stored at −80 °C to preserve tissue integrity and DNA stability. Genomic DNA was extracted using the cetyltrimethyl ammonium bromide (CTAB) method, with an optimized extraction buffer composed of 2% CTAB, 100 mM Tris-HCl (pH 8.0), 20 mM EDTA, and 1.4 M NaCl, supplemented with 2% PVP-40 (to bind polyphenols), 0.2% β-mercaptoethanol, and 1% spermidine (to reduce DNA fragmentation).Fresh leaf tissues were ground in liquid nitrogen, mixed with preheated extraction buffer (65 °C), incubated at 65 °C for 30–60 min with gentle inversion, followed by chloroform/isoamyl alcohol extraction and isopropanol precipitation. The integrity of the extracted DNA was assessed by agarose gel electrophoresis, and its concentration was measured using a Qubit fluorometer to guarantee the reliability of subsequent sequencing data [13]. The above reagents are all produced by Sigma-Aldrich (Shanghai) Trading Co., Ltd. Shanghai, China.
The extracted genomic DNA was sequenced using both Illumina and Nanopore platforms. For Illumina sequencing, paired-end libraries with an insert size of 300 bp were constructed using the Nextera DNA Flex Library Prep Kit (Illumina, San Diego, CA, USA). Sequencing was carried out on the Illumina NovaSeq 6000 platform (Illumina, San Diego, CA, USA). For Oxford Nanopore sequencing, libraries were prepared using the SQK-LSK110 ligation sequencing kit following the standard protocol. The purified libraries were loaded onto preconditioned R9.4 Spot-On Flow Cells and sequenced on the PromethION platform (Oxford Nanopore Technologies, Oxford, UK) for 48 h.

2.2. Mitochondrial Genome Assembly and Annotation

The mitochondrial genomes were assembled de novo using Flye software (v2.8) with long-read sequencing data generated from Nanopore. Default parameters were used for graphical assembly, producing GFA files [14]. The GFA files were visualized using Bandage software (v0.8.1) to analyze mitochondrial genome contigs [15]. To further confirm mitochondrial contigs, conserved mitochondrial genes from Arabidopsis thaliana (NC_037304) were used as query sequences, and all contigs were aligned using the BLASTn program (v2.13.0) to identify mitochondrial-related sequences [16]. The BLAST parameters were set to -evalue 1 × 10⁻⁵-outfmt 6-max_hsps 10-word_size 7-task blastn-short to ensure high-sensitivity alignments.
Next, long-read data were mapped to the mitochondrial contigs using BWA software (v0.7.17), and the alignment results were processed and extracted with SAMtools (v1.9) to resolve connections caused by repeat sequences [17,18]. Additionally, Illumina short-read data were mapped to the mitochondrial genome, and combined with the long-read data, the resulting data were input into Unicycler software (v0.4.8) for hybrid assembly, yielding high-quality final mitochondrial genome sequences [19].
Mitochondrial genome annotation was performed using GeSeq software (v2.03), with A. thaliana (NC_037304) and Liriodendron tulipifera (NC_021152.1) as reference genomes for annotating protein-coding genes [20]. For tRNA genes, annotation was conducted using tRNAscan-SE software (v2.0.11), which identified tRNA genes based on structural characteristics and sequence homology [21]. rRNA genes were annotated using the BLASTn program (v2.13.0) [16]. Errors or incomplete annotations were manually corrected using Apollo software (v1.11.8) to ensure accuracy [22]. We further performed annotation refinement using PMGA [23] with a reference database comprising 319 mitochondrial genomes. The results showed that all protein-coding gene annotations were consistent with the previous annotations.

2.3. Codon Usage Bias Analysis

The protein-coding gene sequences of the mitochondrial genome were extracted using PhyloSuite software (v1.1.16) [24]. Codon usage bias analysis was performed using MEGA software (v7.0) [25]. The relative synonymous codon usage (RSCU) values of each gene were calculated to evaluate codon preference and its relationship with translation efficiency.

2.4. Repeat Sequence Analysis

Repeat sequences in the mitochondrial genome, including microsatellite repeats, tandem repeats, and dispersed repeats, were identified using MISA (v2.1), Tandem Repeats Finder (TRF, v4.09), and the REPuter online tool [26,27,28]. The results were visualized using R to clearly display the distribution and characteristics of different repeat types, further exploring their impact on genome stability and evolutionary processes.

2.5. Structural Analysis of the Mitochondrial Genome

The mitochondrial genome was assembled graphically using GetOrganelle software (v1.7.5.0), with the recommended default parameters for plant mitochondrial genomes and the embplant_mt database [29]. To resolve repetitive regions in the graphical genome, BWA software (v0.7.17) was used to align long reads to the repeat sequences. Reads spanning the repeats were used to infer the most likely mitochondrial genome structure [17].

2.6. Phylogenetic Analysis

Sixteen conserved protein-coding genes (e.g., atp1, atp4, ccmB, ccmC, cob) were extracted from the mitochondrial genomes of closely related species. Multiple sequence alignment was performed using MAFFT software (v7.505) [30]. Phylogenetic trees were constructed using IQ-TREE software (v1.6.12) based on the maximum likelihood (ML) method, with 1000 bootstrap replicates to assess the robustness of the tree topology [31].

2.7. RNA Editing Event Analysis

RNA editing events in protein-coding genes of the mitochondrial genome were predicted using the DeepRed-Mt tool (v1.0), which employs a convolutional neural network model for high-accuracy prediction. Editing sites with a probability greater than 0.9 were retained for further analysis [32].

2.8. Collinearity Analysis

BLASTn was used to perform pairwise comparisons of mitochondrial genomes, retaining regions longer than 500 bp as conserved collinear blocks. The collinear blocks were visualized as collinearity plots [33]. Detailed analysis was conducted to explore the evolutionary patterns of mitochondrial genome structure and collinearity changes among different species.

3. Results

3.1. Structural Characteristics of the Mitochondrial Genomes of Pedicularis kansuensis and Pedicularis chinensis

We assembled and visualized the mitochondrial genomes of P. kansuensis and P. chinensis using long-read sequencing data. Both genomes exhibit a circular structure and consist of three contigs, represented as nodes in the draft assembly. Black lines connecting the nodes indicate overlaps, forming a multibranch closed genome structure representing the complete mitochondrial genomes (Figure 1A). After resolving branching caused by long repeat sequences, a master circular structure was obtained for each genome (Figure 1B). Additionally, evidence from long-read data suggested an alternative configuration where the master circle splits into two smaller rings, likely facilitated by the longest repeat sequences (7160 bp in P. chinensis and 8155 bp in P. kansuensis) (Figure 1C).
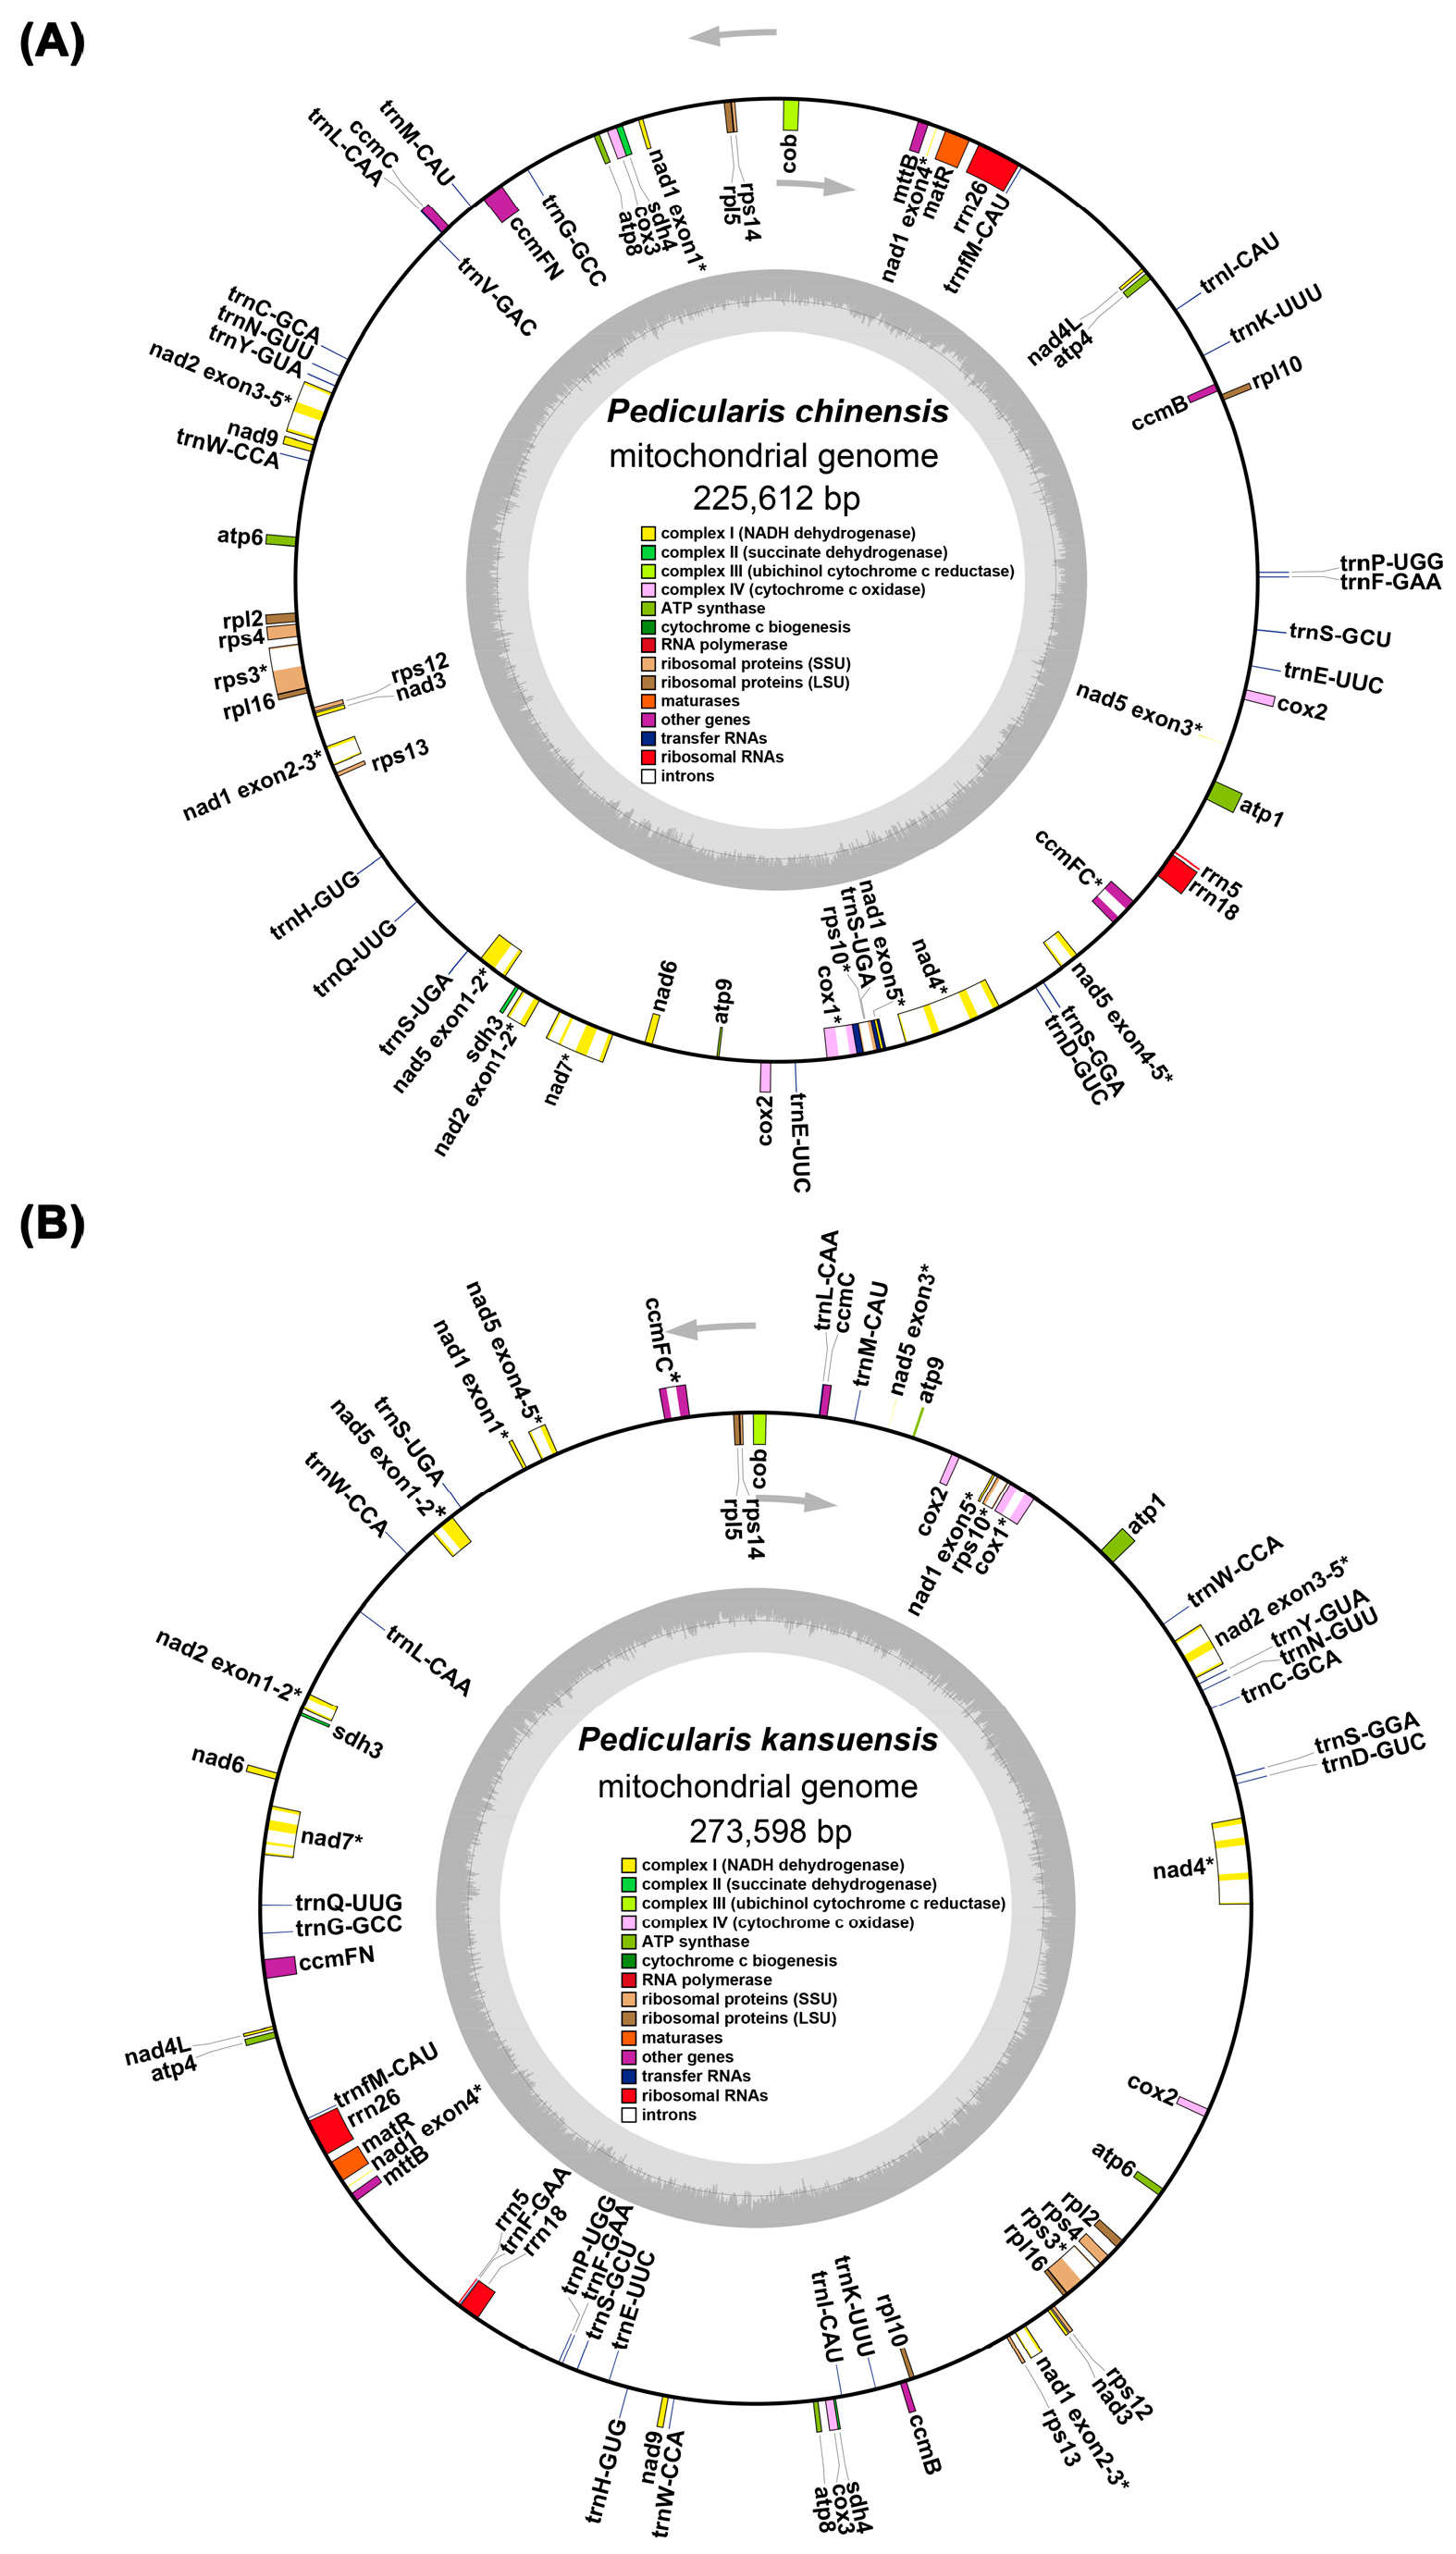
The final assembled mitochondrial genomes measured 225,612 bp for P. chinensis and 273, 598 bp for P. kansuensis, with GC contents of 44.42% and 44.29%, respectively (Figure 2A,B). Despite these differences in genome size and GC content, both genomes share a highly conserved gene composition, including 36 unique protein-coding genes, 3 rRNA genes, and several tRNA genes. The 36 protein-coding genes can be categorized into 24 core genes and 12 non-core genes. The core genes include five ATP synthase genes (atp1, atp4, atp6, atp8, atp9), nine NADH dehydrogenase genes (nad1, nad2, nad3, nad4, nad4L, nad5, nad6, nad7, nad9), four cytochrome c biogenesis genes (ccmB, ccmC, ccmFC, ccmFN), three cytochrome c oxidase genes (cox1, cox2, cox3), one membrane transport protein gene (mttB), one maturation enzyme gene (matR), and one ubiquinol-cytochrome c reductase gene (cob). The non-core genes comprise four ribosomal large subunit genes (rpl2, rpl5, rpl10, rpl16), six ribosomal small subunit genes (rps3, rps4, rps10, rps12, rps13, rps14), and two succinate dehydrogenase genes (sdh3, sdh4).
A notable difference between the two genomes lies in their tRNA gene content. P. chinensis encodes 20 tRNA genes, including 2 multicopy tRNAs (Table S1), while P. kansuensis contains 19 tRNA genes, with 3 being multicopy (Table S2) These distinctions in tRNA composition, alongside variations in genome size and GC content, underscore the diversity and evolutionary nuances between the mitochondrial genomes of these closely related species.

3.2. Codon Usage Bias Analysis of Mitochondrial Genes

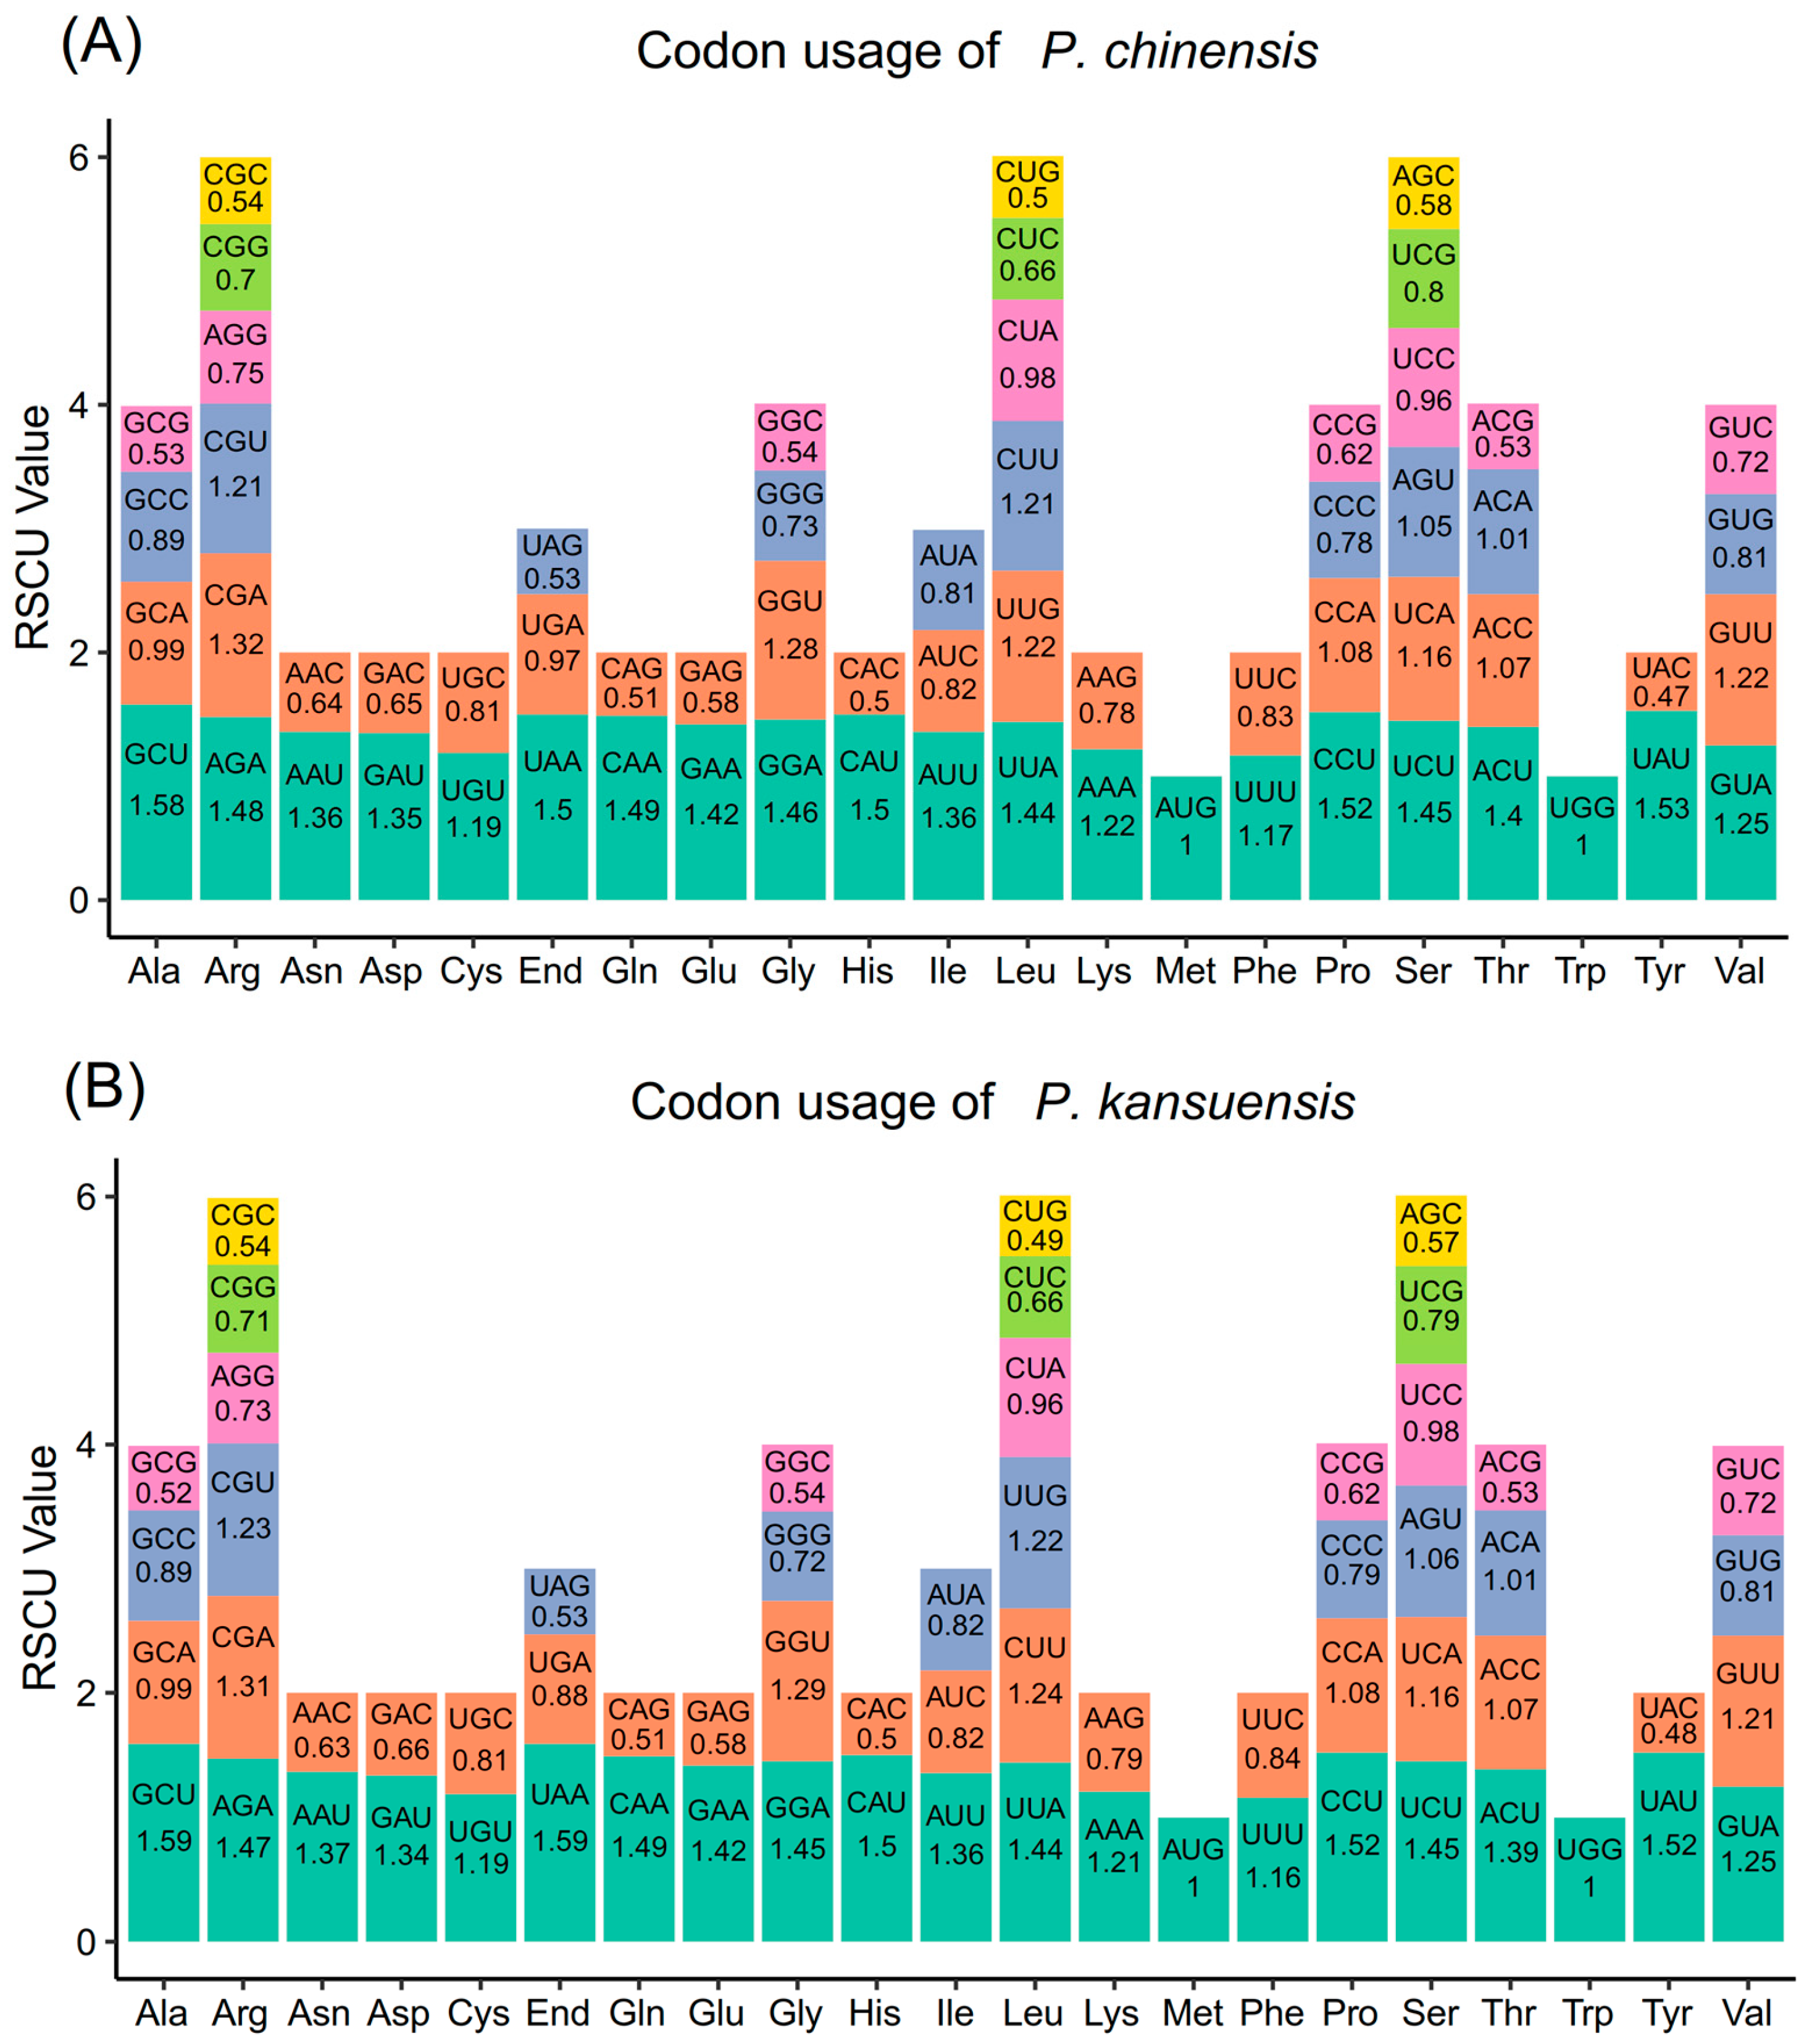
We analyzed the codon usage bias (CUB) of the 36 unique protein-coding genes in the mitochondrial genomes of P. chinensis and P. kansuensis to identify preferential codon usage patterns (Figure 3A,B). Codons with relative synonymous codon usage (RSCU) values greater than 1 were considered preferentially used. In the P. chinensis genome, the codon GCU, encoding alanine (Ala), showed the highest RSCU value of 1.58, followed by UAU for tyrosine (Tyr) with a value of 1.53. Notably, cysteine (Cys) and phenylalanine (Phe) exhibited lower maximum RSCU values, each below 1.2, indicating weak codon usage preference for these amino acids. The start codon AUG and tryptophan (UGG) maintained RSCU values of 1, showing no preferential bias (Table S3).
In the P. kansuensis genome, similar trends were observed, but with some notable differences (Table S4). The codon GCU for alanine (Ala) exhibited the highest RSCU value of 1.59, followed closely by UAA, the stop codon, at 1.52. Additionally, tyrosine (Tyr) and proline (Pro) showed preference for UAU and CCU, respectively, each with RSCU values of 1.52. Like P. chinensis, cysteine (Cys) and phenylalanine (Phe) in P. kansuensis displayed minimal preference, with maximum RSCU values below 1.2. The start codon AUG and tryptophan (UGG) also exhibited RSCU values of 1.
A comparative analysis revealed shared general codon usage patterns between P. chinensis and P. kansuensis, but with slight species-specific variations. While alanine (GCU) consistently demonstrated the highest codon preference in both species, P. chinensis displayed a stronger preference for tyrosine (UAU), whereas P. kansuensis exhibited a higher preference for the stop codon (UAA) and proline (CCU). These differences in codon usage bias reflect subtle distinctions in translational optimization and evolutionary adaptation between the two species.

3.3. Divergent Repeat Sequence Profiles of the Mitochondrial Genomes in Pedicularis kansuensis and Pedicularis chinensis

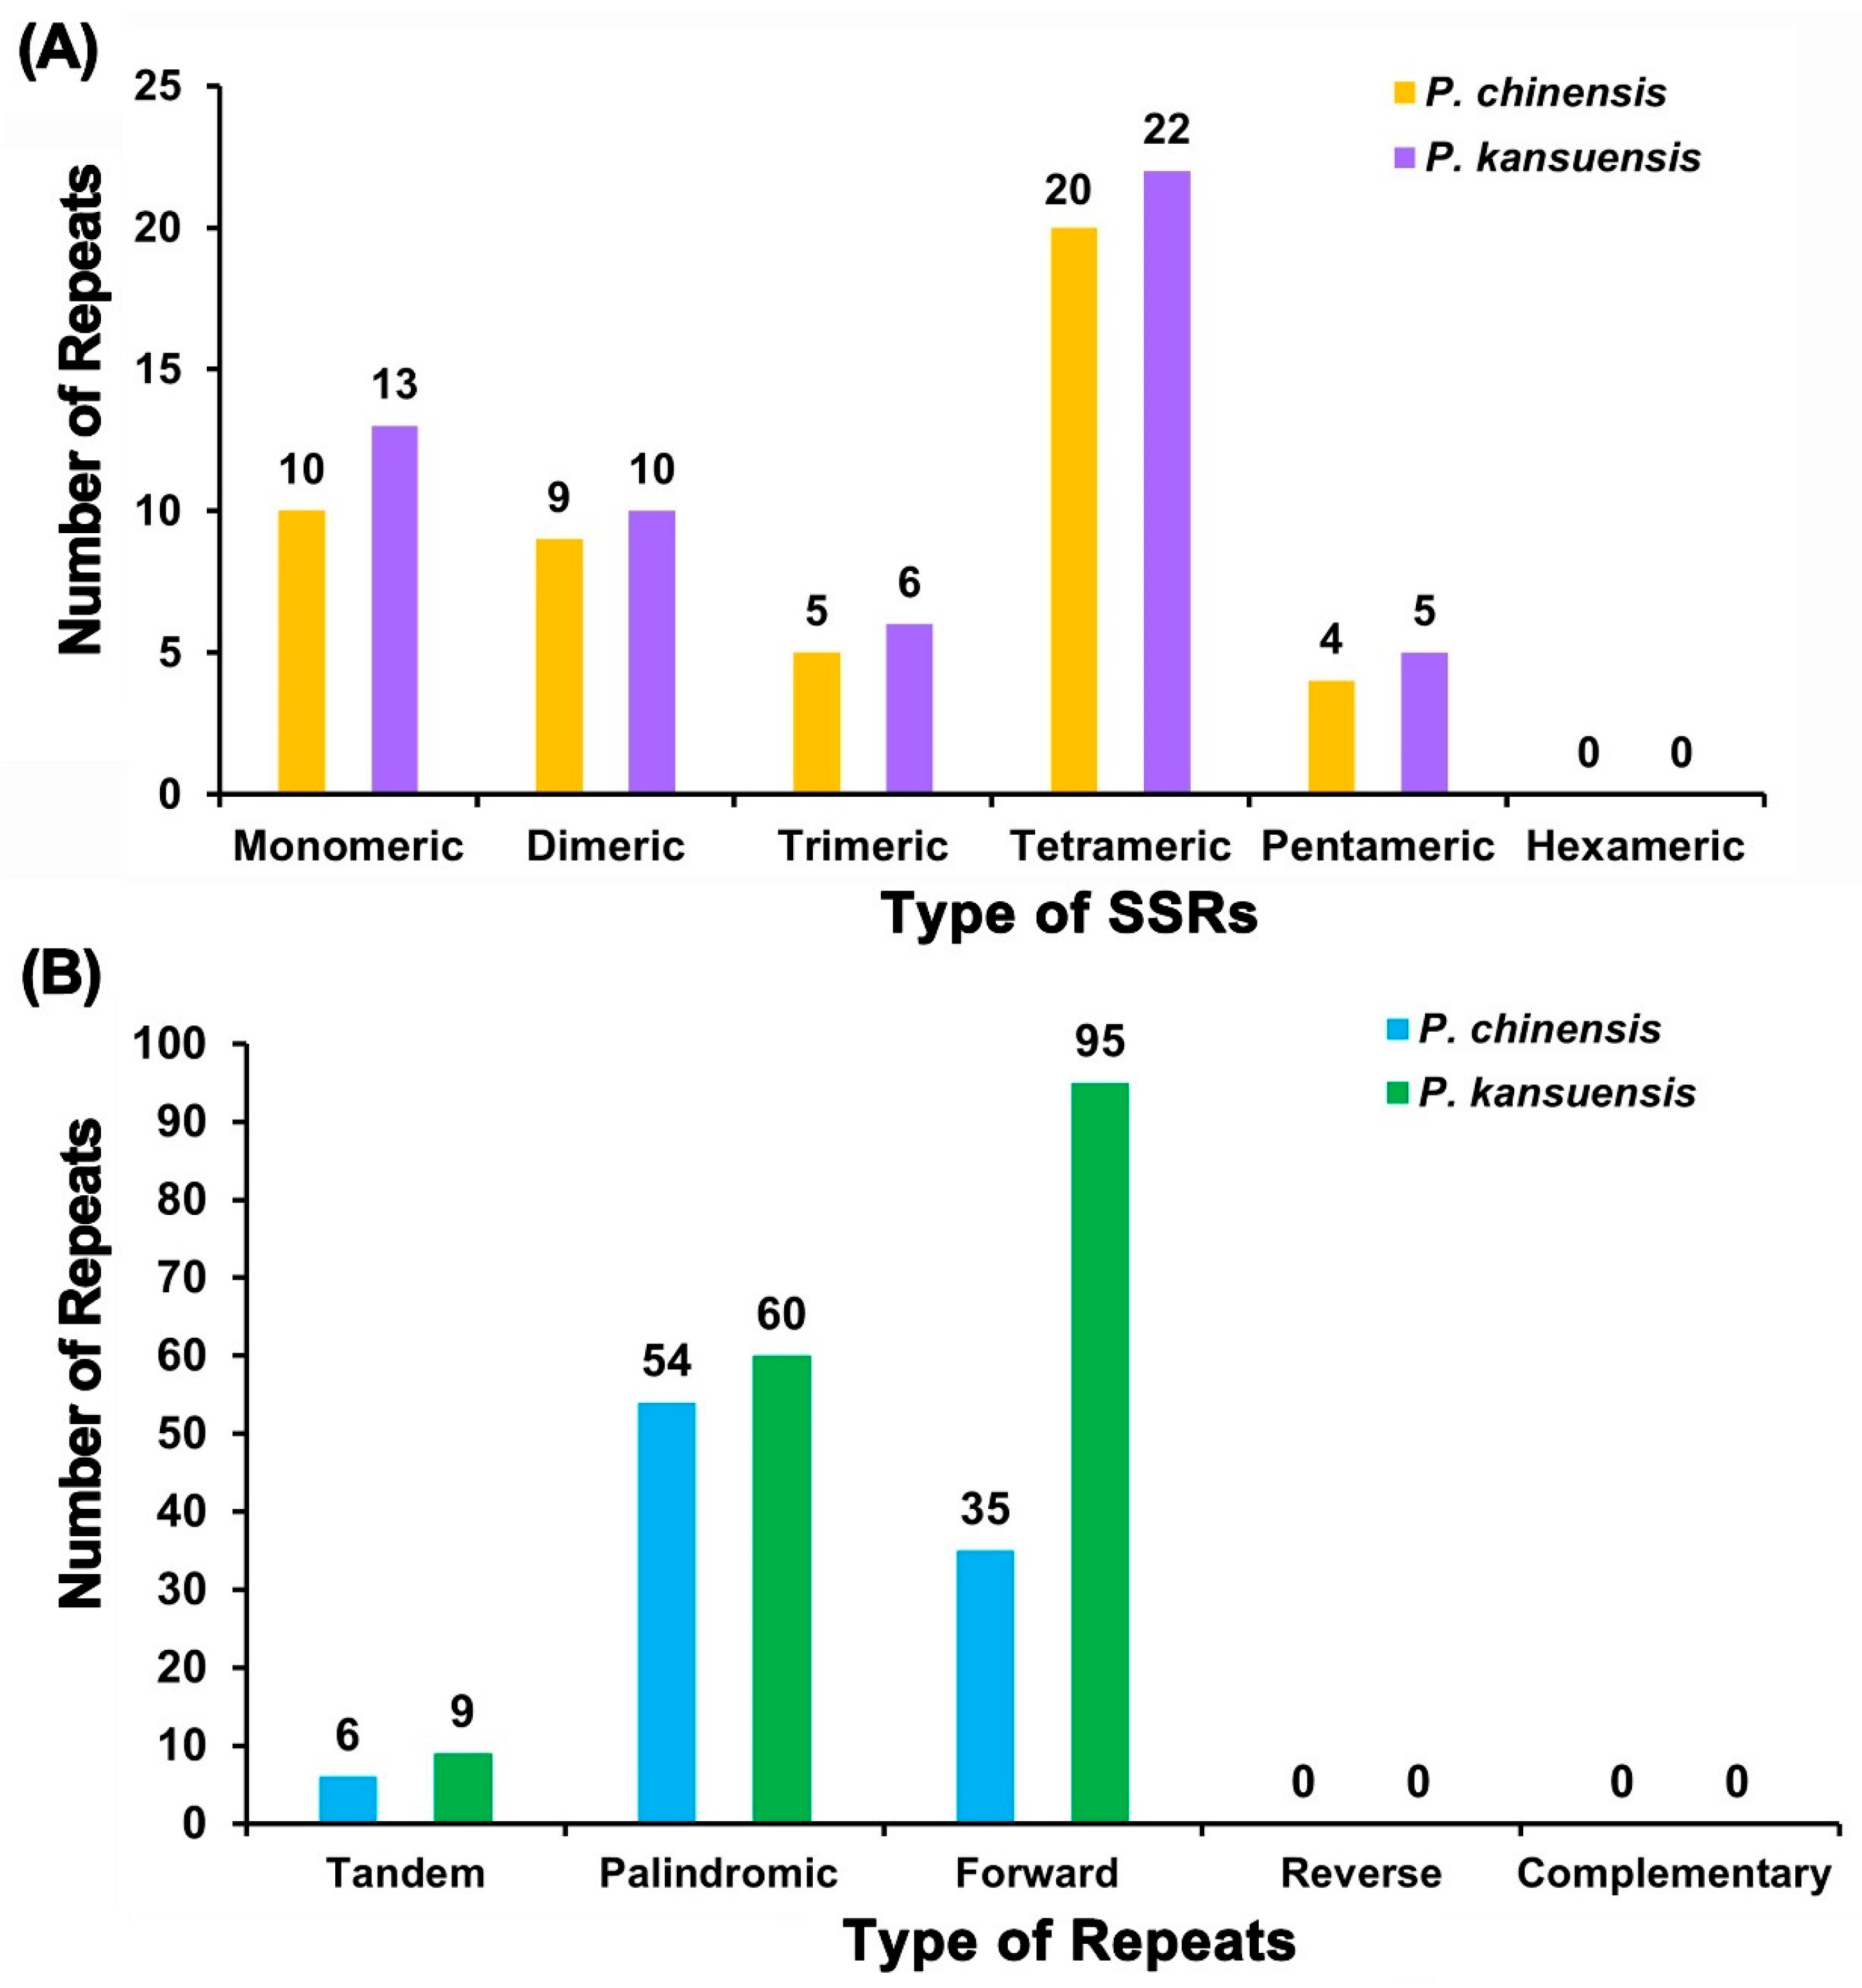
We analyzed the repeat sequences of the mitochondrial genomes of P. chinensis and P. kansuensis, identifying both shared features and species-specific variations. In P. chinensis, we detected 48 simple sequence repeats (SSRs), with mononucleotide and dinucleotide SSRs comprising 39.58% of the total (Figure 4A and Table S5). Among these, adenine (A) mononucleotide repeats were dominant, accounting for 70% of the 10 mononucleotide SSRs. No hexanucleotide SSRs were observed. Additionally, six tandem repeats, ranging from 13 to 72 bp in length and with match degrees exceeding 77%, were identified (Table S6). Dispersed repeat sequences included 89 pairs of repeats ≥30 bp, consisting of 54 palindromic and 35 forward repeats, with the longest palindromic and forward repeats measuring 73 bp and 7160 bp, respectively (Figure 4B and Table S7).
In P. kansuensis, we identified 56 SSRs, with mononucleotide and dinucleotide SSRs comprising 41.07% of the total (Table S8). Thymine (T) mononucleotide repeats were most prevalent, accounting for 46.15% of the 13 mononucleotide SSRs (Figure 4A). Similar to P. chinensis, no hexanucleotide SSRs were detected. P. kansuensis contained nine tandem repeats, ranging from 13 to 72 bp in length and with match degrees exceeding 86% (Table S9). Dispersed repeat sequences were more abundant, with 155 pairs of repeats ≥30 bp, including 60 palindromic and 95 forward repeats (Table S10). The longest palindromic and forward repeats measured 219 bp and 8155 bp, respectively (Figure 4B).
Comparatively, both genomes lacked hexanucleotide SSRs and featured tandem repeats, consistent with their shared evolutionary background. However, P. kansuensis exhibited a greater abundance and diversity of repeats, including longer palindromic and forward repeats, while P. chinensis showed a higher proportion of adenine-based SSRs. Meanwhile, some SSRs, such as the pentameric repeat ACTAGACTAGACTAG within matR and AAAAGAAAAGAAAAG within cob, were found to be conserved in both species. These conserved loci could potentially be used to study genetic diversity in other species of Pedicularis. These differences may reflect distinct evolutionary pressures and genome stability mechanisms between the two Pedicularis species.

3.4. Analysis of Mitochondrial Genomic Sequence Variations of Pedicularis kansuensis and Pedicularis chinensis

3.4.1. Synteny Analysis

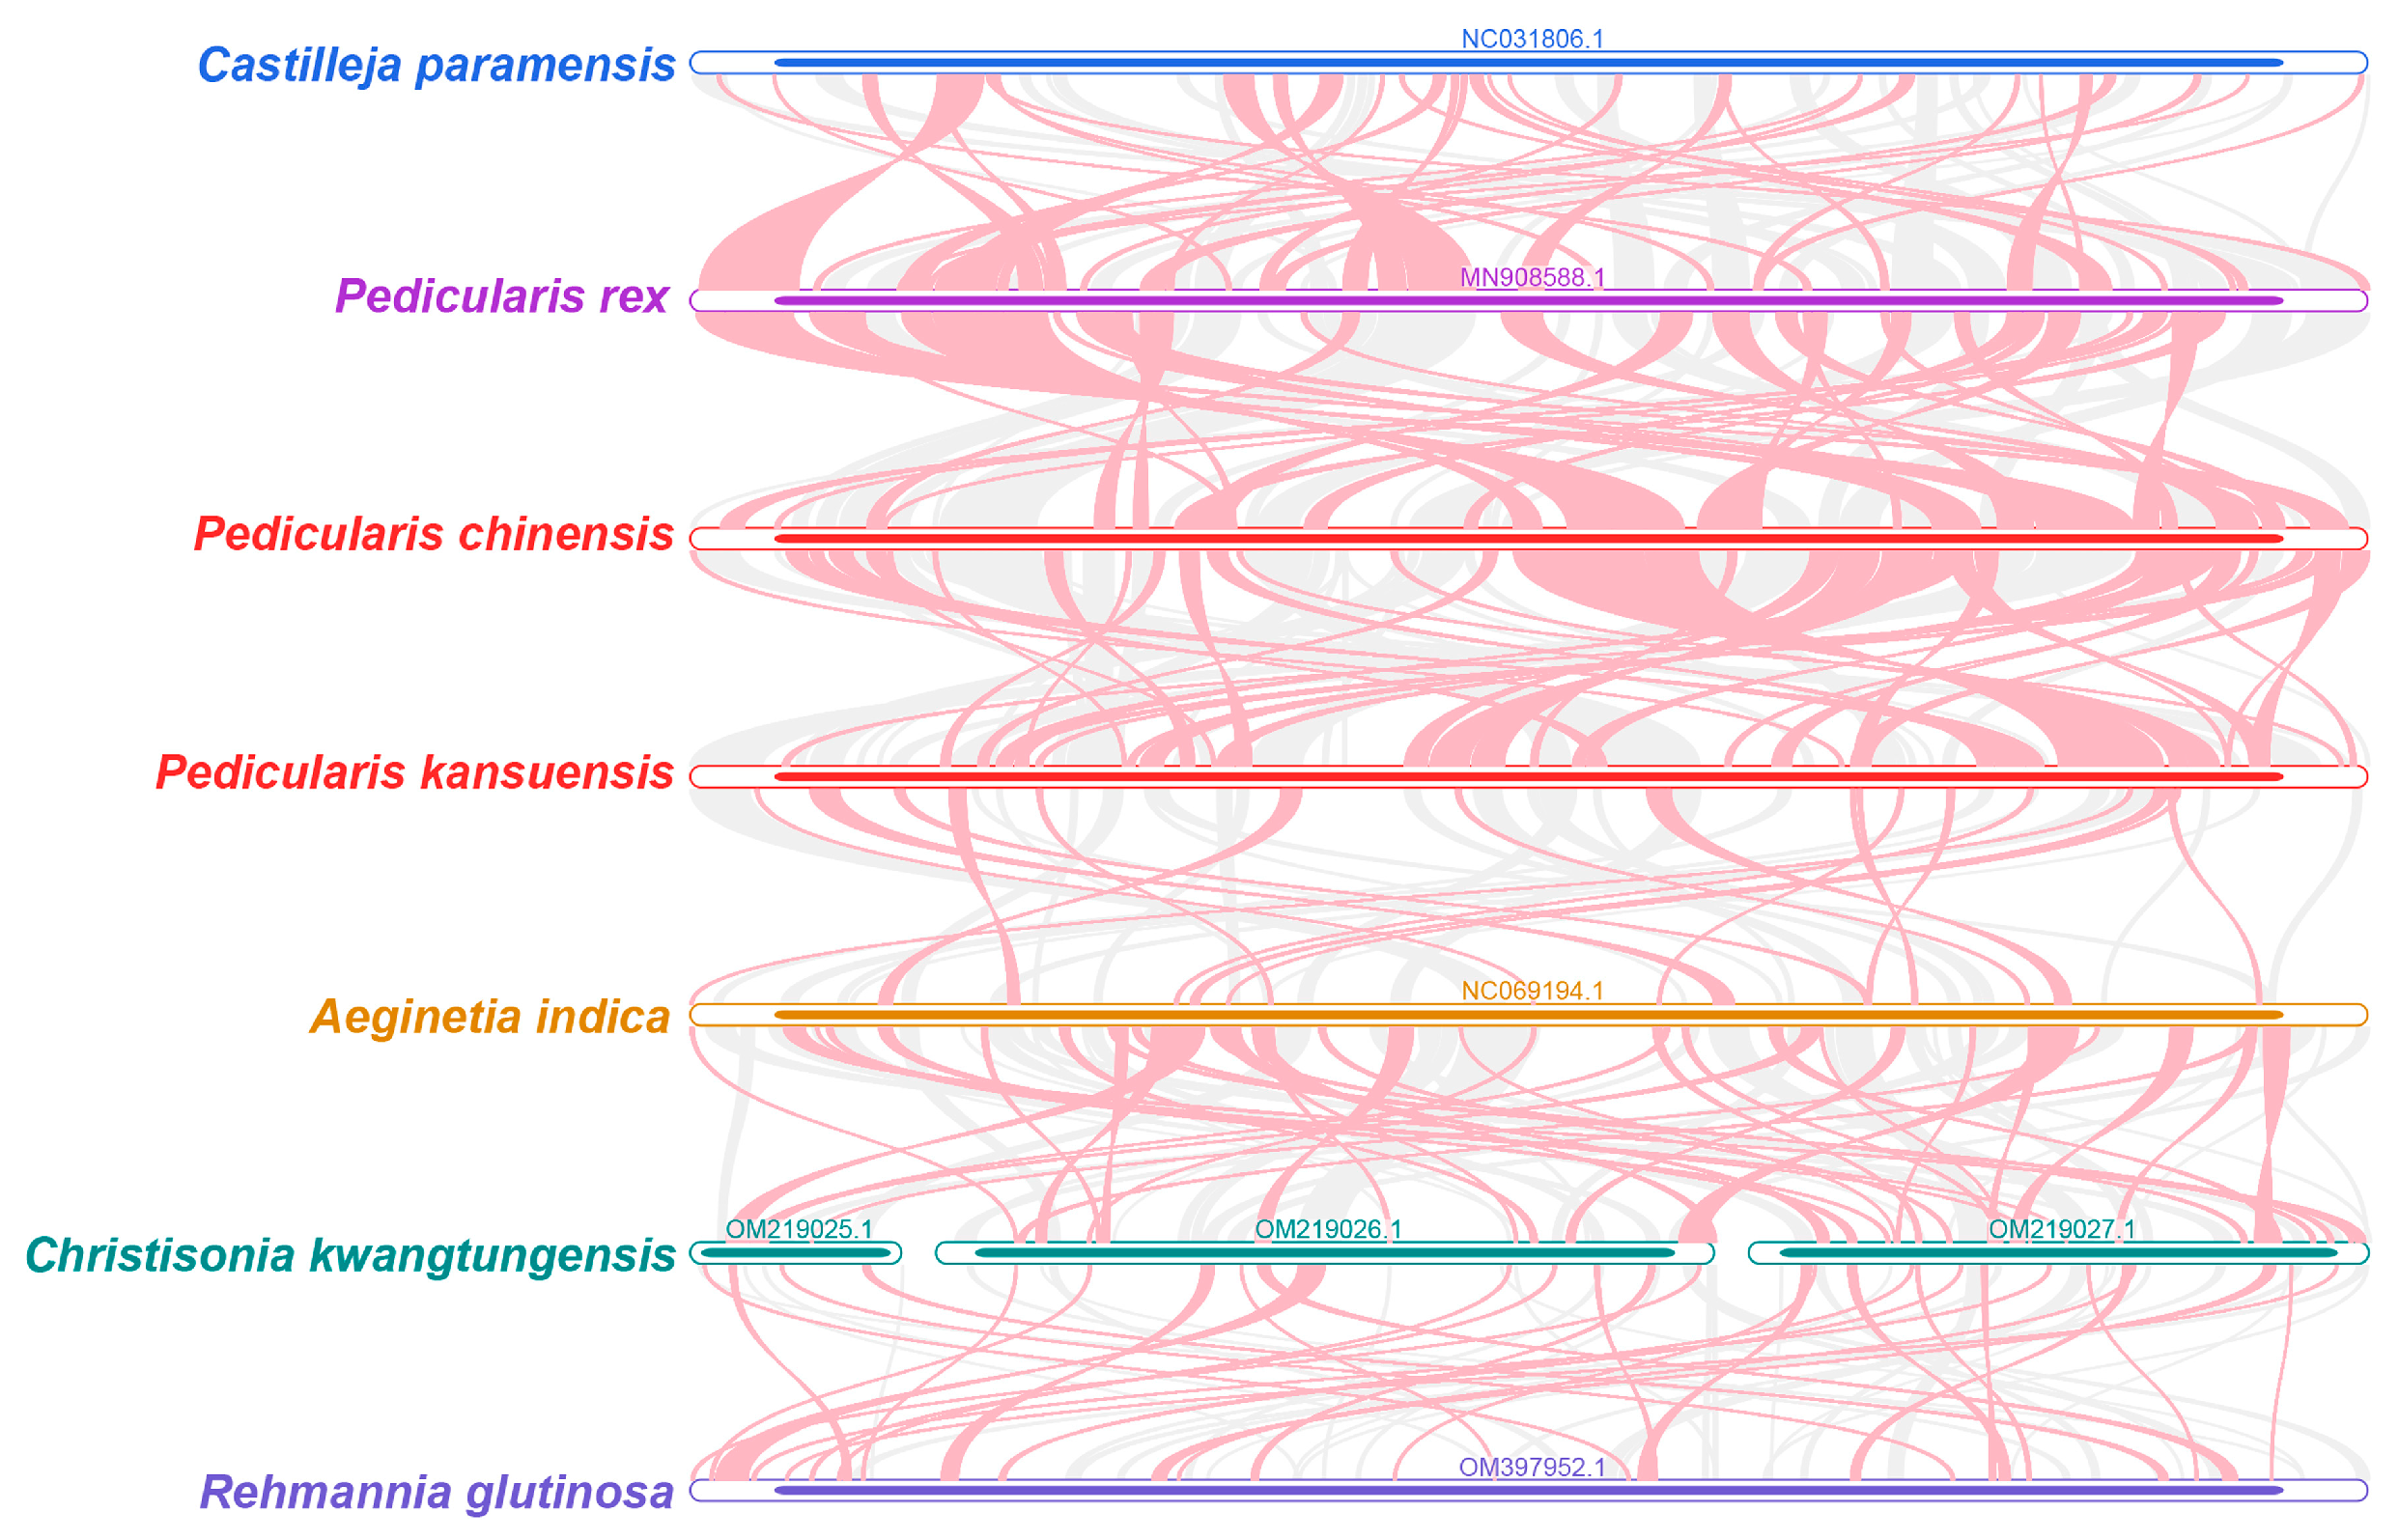
To further explore the structural dynamics of mitochondrial genomes in Pedicularis species and their relatives, we performed a collinearity analysis to compare genome arrangements. The red arcs represent inverted regions, while the gray regions indicate areas with high sequence homology. To improve the clarity of the results, collinear blocks shorter than 0.5 kb were excluded from the analysis. Numerous homologous collinear blocks were identified between the two Pedicularis species and their closely related species within the Orobanchaceae family; however, these blocks were relatively short in length. Additionally, unique blank regions were observed in the Pedicularis species, which showed no homology with other species (Figure 5).
The results revealed significant inconsistencies in the arrangement of collinear blocks among the mitochondrial genomes of Orobanchaceae species. The mitochondrial genomes of the two Pedicularis species exhibited extensive genome rearrangements when compared with closely related species (Table S11). Overall, the mitochondrial genome sequences of the seven analyzed Orobanchaceae species displayed highly unconserved arrangement orders and frequent genome recombination events.

3.4.2. RNA Editing Events in Mitochondrial Genes

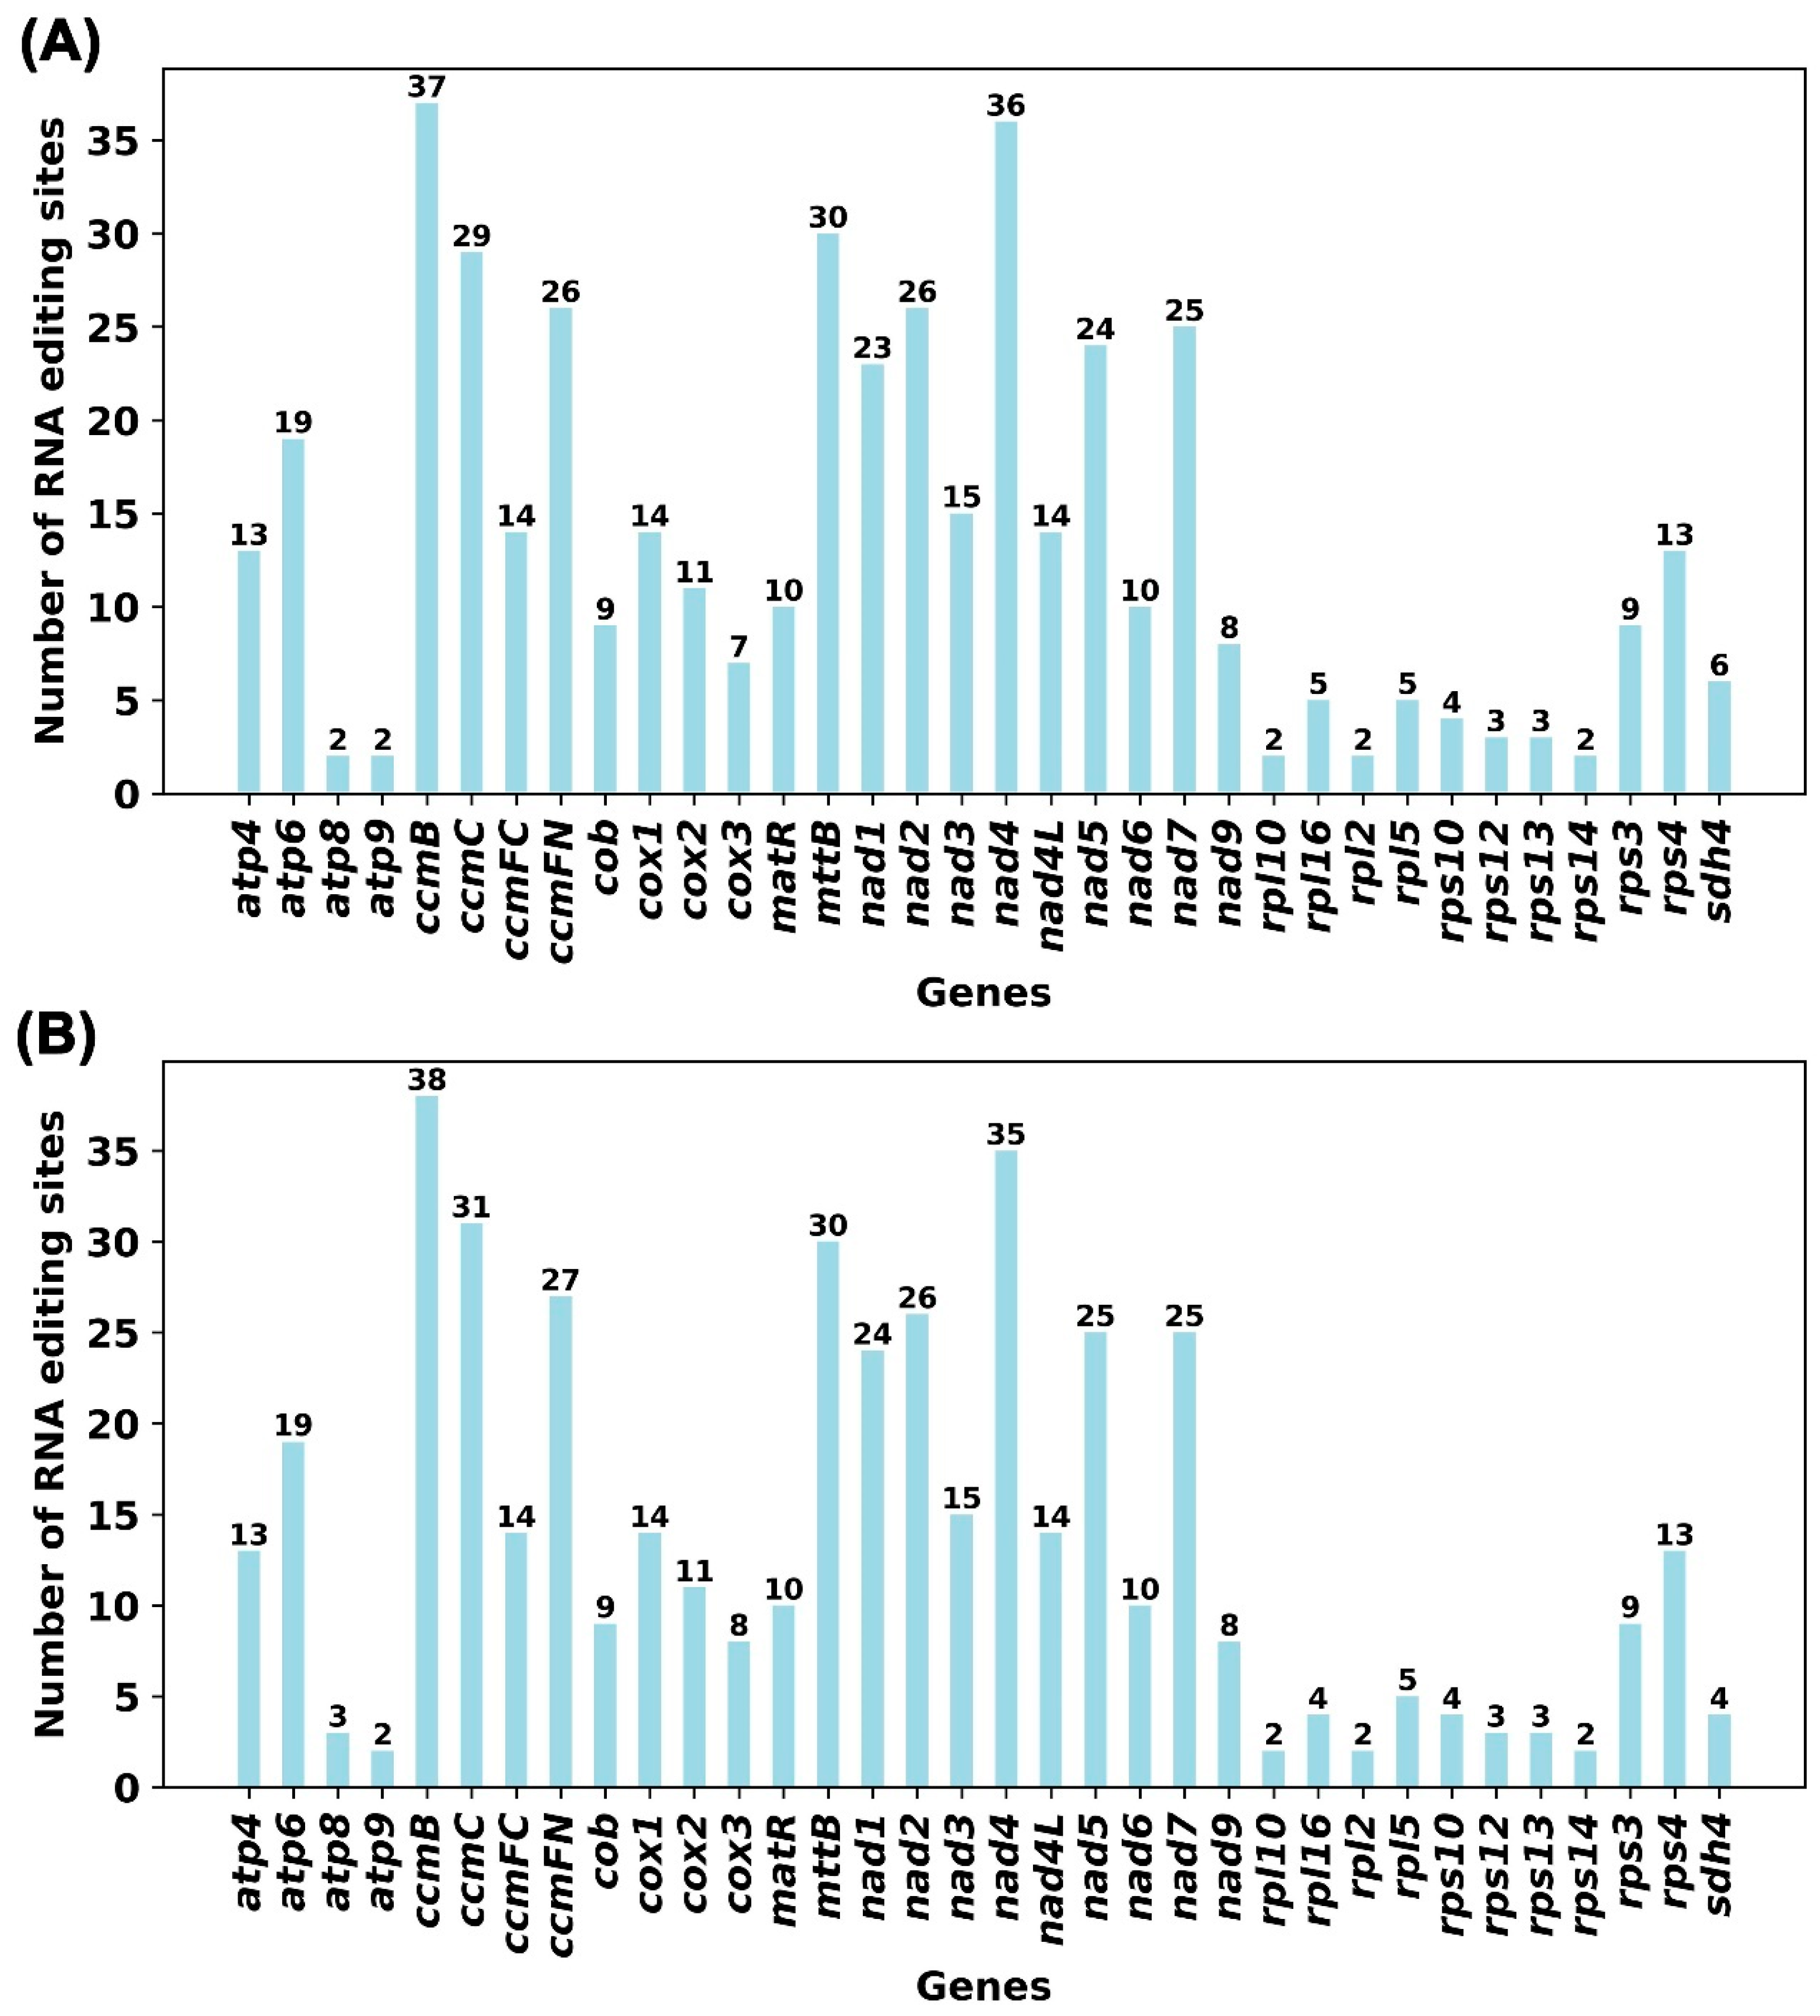
We analyzed RNA editing events in the 36 unique protein-coding genes of the P. chinensis mitochondrial genome, using a cutoff value of 0.9. Based on this criterion, we identified 458 potential RNA editing sites across the P. chinensis, all of which involved cytosine-to-uracil (C-to-U) conversions. Among these, the ccmB gene exhibited the highest number of editing events, with 37 identified sites, followed by the nad4 gene, which had 36 RNA editing sites (Figure 6A). Similarly, RNA editing events were identified in the 36 unique protein-coding genes of the P. kansuensis mitochondrial genome, also using a cutoff value of 0.9. A total of 462 potential RNA editing sites were detected, all involving C-to-U conversions. Consistent with P. chinensis, the ccmB gene in P. kansuensis displayed the highest number of editing events, with 38 identified sites. The nad4 gene ranked second, with 35 editing events (Figure 6B). These findings highlight extensive RNA editing in both P. chinensis and P. kansuensis mitochondrial genomes, with ccmB and nad4 consistently identified as the most edited genes, suggesting their potential functional importance in mitochondrial activity.

3.5. Phylogenetic Analysis Based on Mitochondrial Gene

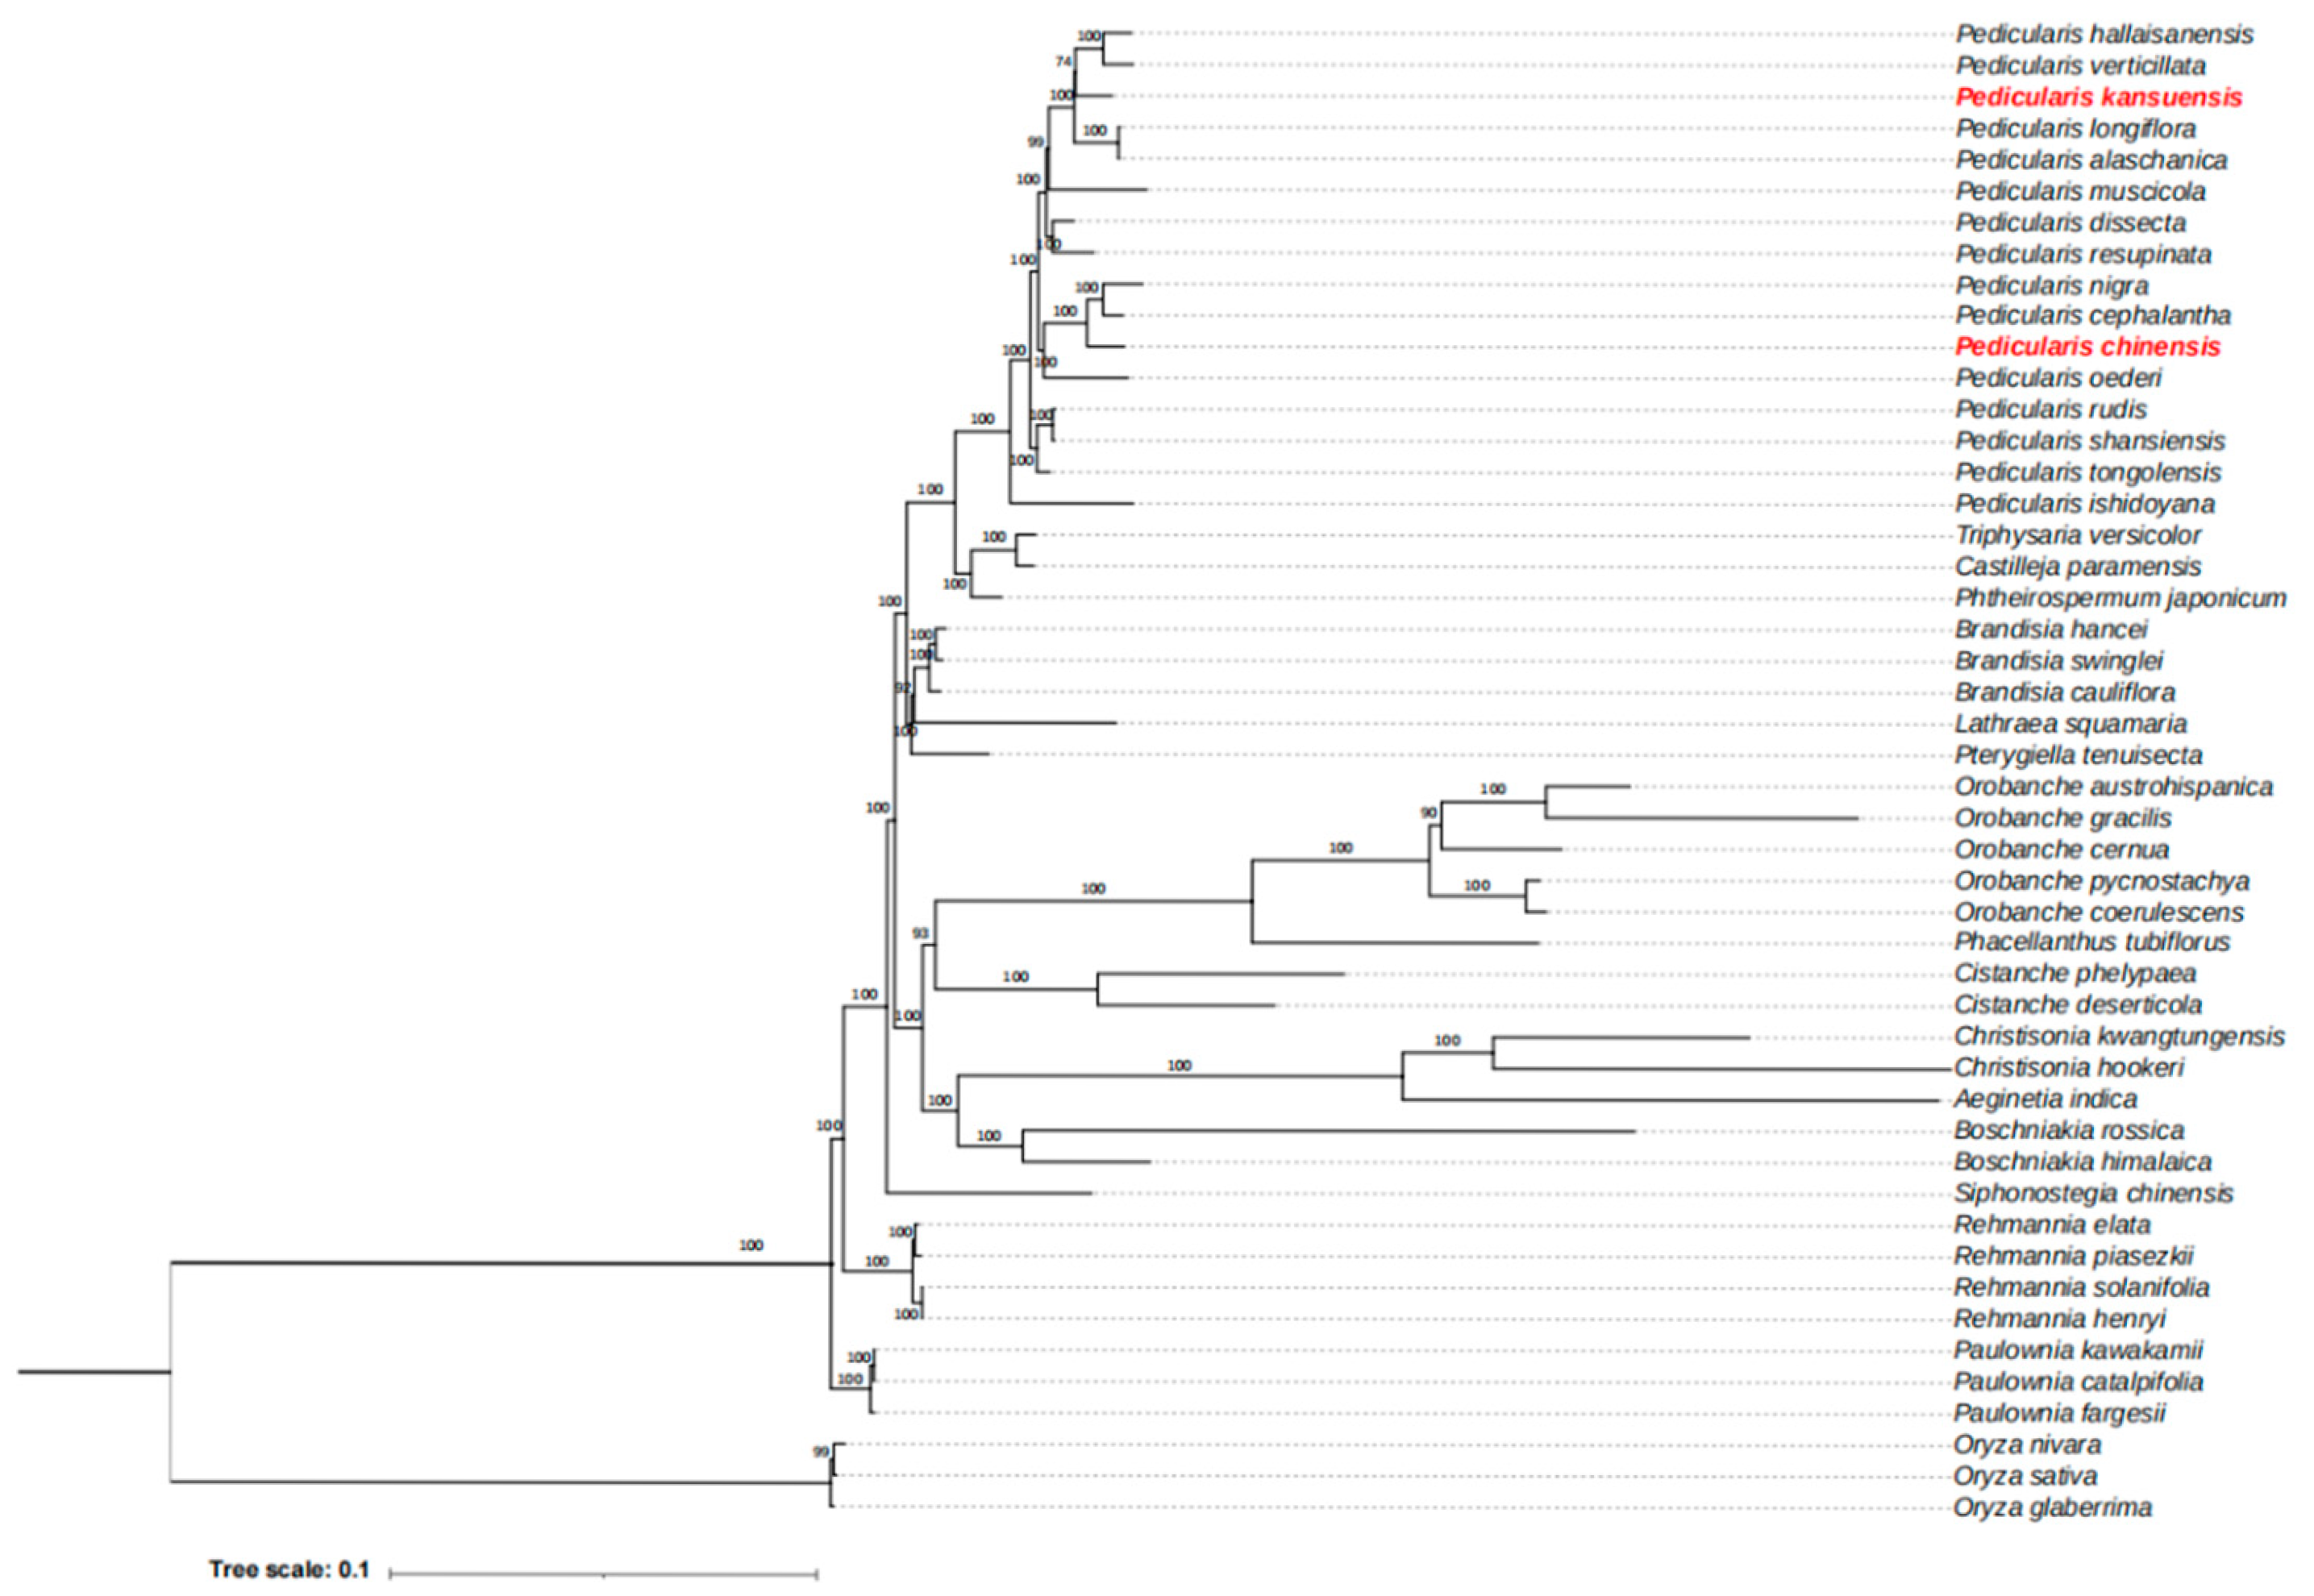
We constructed a phylogenetic tree for 48 species from seven angiosperm families based on the DNA sequences of 16 conserved mitochondrial protein-coding genes (atp1, atp4, ccmB, ccmC, ccmFC, ccmFN, cob, cox2, cox3, matR, nad1, nad2, nad3, nad5, nad6, and rps13) (Figure 7 and Table S12). Details of the species and their mitochondrial genome sequences are provided in Supplementary Materials. Three Oryza species were used as outgroups to root the tree. The resulting phylogenetic tree aligns with the latest classification system of the Angiosperm Phylogeny Group (APG). P. chinensis and P. kansuensis form a distinct monophyletic clade within the Orobanchaceae family, indicating their close evolutionary relationship (Figure 7). Both species belong to the order Lamiales, family Orobanchaceae, and genus Pedicularis. Within the Orobanchaceae family, Pedicularis occupies an independent monophyletic clade, clearly separated from other genera such as Castilleja and Orobanche, demonstrating its distinct phylogenetic position. High bootstrap values at key nodes support the reliability of the tree and reinforce the evolutionary relationships among these species.

4. Discussion

This study successfully assembled and annotated the mitochondrial genomes of P. kansuensis and P. chinensis, providing a comprehensive perspective on their structure, function, and evolution. Through comparative analysis, we addressed several key aspects, including genome organization, codon usage bias, and RNA editing, while also clarifying the phylogenetic placement of Pedicularis within the Orobanchaceae family.
The mitochondrial genomes of P. chinensis and P. kansuensis shared highly conserved structural features, including a circular configuration and 36 protein-coding genes, 3 rRNA genes, and a set of tRNA genes. However, differences in repeat content were evident: P. kansuensis displayed a higher abundance and diversity of repeats, including longer palindromic and forward sequences, compared to P. chinensis. These variations may reflect differences in genomic stability and recombination frequency between the two species. To gain a more comprehensive understanding of the structural and evolutionary characteristics of mitochondrial genomes in Pedicularis, we compared the mitochondrial genomes of P. chinensis and P. kansuensis assembled in this study with the previously published genome of P. rex [9]. The results revealed notable differences among the three species in terms of genome length, the number of tRNA genes, and the copy number of certain protein-coding genes. The mitochondrial genome of P. rex is relatively compact, with a length of 219,859 bp and a total of 56 genes, including 34 protein-coding genes, 19 tRNA genes, and 3 rRNA genes. In contrast, P. chinensis and P. kansuensis possess mitochondrial genomes of 225,612 bp and 273,598 bp, respectively. Both species encode 36 unique protein-coding genes and 3 rRNA genes, while the number of tRNA genes is 20 in P. chinensis and 19 in P. kansuensis.
These differences may be attributed to several factors, such as the expansion of repetitive sequences, insertion of foreign DNA, gene loss, or genome rearrangements. They suggest that the mitochondrial genomes of different Pedicularis species may have undergone varying degrees of dynamic structural changes during adaptation to their environments.
Notably, the presence of long repeats facilitated the coexistence of alternative circular and sub-circular configurations in both species, highlighting the dynamic nature of their mitochondrial genomes. Our results align with previous findings in plant mitochondrial genomics, where repetitive sequences have been linked to genome rearrangements and variability [34,35]. The structural differences between P. chinensis and P. kansuensis could represent species-specific adaptations to environmental pressures, with recombination events potentially playing a role in maintaining mitochondrial function under stress.
A major focus of this study was resolving the phylogenetic position of Pedicularis. Traditional taxonomy placed Pedicularis in the Scrophulariaceae family, based on morphological traits such as floral structure and growth form [36]. However, modern molecular evidence, including chloroplast and nuclear gene analyses, has suggested reclassifying Pedicularis under the Orobanchaceae family [37]. Our phylogenetic tree, constructed using mitochondrial protein-coding genes, provides strong support for this reclassification. In our results, P. chinensis and P. kansuensis formed a well-supported monophyletic clade within Orobanchaceae, clearly separating from Scrophulariaceae species. The close clustering of Pedicularis with genera such as Castilleja and Orobanche reinforces its placement in Orobanchaceae. High bootstrap values at critical nodes confirm the robustness of these relationships, resolving previous taxonomic discrepancies. This finding aligns with modern Angiosperm Phylogeny Group (APG) classifications, further highlighting the utility of mitochondrial genomes in resolving evolutionary relationships [38,39].
The codon usage bias analysis revealed a strong preference for specific codons, such as GCU (alanine) and UAU (tyrosine), which may reflect translational optimization in mitochondrial genes. The consistent under-representation of codons encoding cysteine and phenylalanine suggests conserved constraints in mitochondrial gene expression [40]. Differences in codon preferences between P. chinensis and P. kansuensis indicate subtle species-specific adaptations, which may influence mitochondrial protein synthesis efficiency. RNA editing, particularly C-to-U conversions, was extensive in both genomes, with ccmB and nad4 consistently showing the highest editing frequencies. These genes are essential for mitochondrial function, particularly in respiratory chain complexes [41]. The high levels of editing in these genes could represent adaptive responses to maintain mitochondrial functionality under varying environmental conditions.
Additionally, collinearity analysis revealed extensive genome rearrangements and a lack of conserved synteny between Pedicularis and other Orobanchaceae species. Unique blank regions in P. chinensis and P. kansuensis suggest lineage-specific rearrangements, reflecting evolutionary plasticity. These findings support the hypothesis that dynamic genome rearrangements enable Pedicularis to adapt to diverse habitats, providing a competitive advantage [42].

5. Conclusions

Our study resolves the phylogenetic placement of Pedicularis within Orobanchaceae, supporting its divergence from Scrophulariaceae based on mitochondrial genome evidence. The dynamic structural features, extensive RNA editing, conserved SSRs, and recombination events further underscore the complexity and adaptability of Pedicularis mitochondrial genomes. These results not only clarify taxonomic uncertainties but also provide a robust framework for understanding mitochondrial genome evolution and its role in plant adaptation.

Supplementary Materials

The following supporting information can be downloaded at: https://www.mdpi.com/article/10.3390/horticulturae11091095/s1, Table S1: The mitochondrial genome-encoded genes of P. chinensis. Table S2: The mitochondrial genome-encoded genes of P. kansuensis. Table S3: RSCU of codons for each amino acid in the P. chinensis mitochondrial genome. Table S4: RSCU of codons for each amino acid in the P. kansuensis mitochondrial genome. Table S5: SSRs in the mitochondrial genome of P. chinensis. Table S6: Tandem repeat sequences in the mitochondrial genome of P. chinensis. Table S7: Dispersed repeat sequences in the mitochondrial genome of P. chinensis. Table S8: SSRs in the mitochondrial genome of P. kansuensis. Table S9: Tandem repeat sequences in the mitochondrial genome of P. kansuensis. Table S10: Dispersed repeat sequences in the mitochondrial genome of P. kansuensis. Table S11: Comparative analysis of mitochondrial genome synteny among P. chinensis and P. kansuensis and three related species. Table S12: Species information for phylogenetic tree construction.

Author Contributions

Conceptualization, Q.S.; methodology, Y.L.; validation, X.L. and Q.S.; formal analysis, X.L.; investigation, all authors; writing—review and editing, X.L. and Y.L.; funding acquisition. All authors have read and agreed to the published version of the manuscript.

Funding

This research was supported by The National Natural Science Foundation of China (32360349); the Chinese Academy of Sciences—People’s Government of Qinghai Province on Sanjiangyuan National Park (LHZX-2022-01); and Wild Ophiocordyceps sinensis Identification and Application Project (QHRD-2025-004).

Data Availability Statement

The assembled mitochondria genome sequences of P. chinensis and P. kansuensis have been uploaded to and deposited in GenBank under accession numbers NC_072955.1 and NC_072932.1, respectively. The first author and corresponding author can provide all relevant raw data if required.

Conflicts of Interest

The authors declare no conflicts of interest.

References

  1. Gray, M.W.; Burger, G.; Lang, B.F. Mitochondrial evolution. Science 1999, 283, 1476–1481. [Google Scholar] [CrossRef] [PubMed]
  2. Wang, J.; Kan, S.L.; Liao, X.Z.; Zhou, J.W.; Tembrock, L.R.; Daniell, H.; Jin, S.X.; Wu, Z.Q. Plant organellar genomes: Much done, much more to do. Trends Plant Sci. 2024, 29, 754–769. [Google Scholar] [CrossRef] [PubMed]
  3. Daniell, H.; Lin, C.S.; Yu, M.; Chang, W.J. Chloroplast genomes: Diversity, evolution, and applications in genetic engineering. Genome Biol. 2016, 17, 134. [Google Scholar] [CrossRef] [PubMed]
  4. Gualberto, J.M.; Newton, K.J. Plant mitochondrial genomes: Dynamics and mechanisms of mutation. Annu. Rev. Plant Biol. 2017, 68, 225–252. [Google Scholar] [CrossRef]
  5. Skippington, E.; Barkman, T.J.; Rice, D.W.; Palmer, J.D. Miniaturized mitogenome of the parasitic plant Viscum scurruloideum is extremely divergent and dynamic and has lost all nad genes. Proc. Natl. Acad. Sci. USA 2015, 112, E3515–E3524. [Google Scholar] [CrossRef]
  6. Putintseva, Y.A.; Bondar, E.I.; Simonov, E.P.; Sharov, V.V.; Oreshkova, N.V.; Kuzmin, D.A.; Konstantinov, Y.M.; Shmakov, V.N.; Belkov, V.I.; Sadovsky, M.G.; et al. Siberian larch (Larix sibirica Ledeb.) mitochondrial genome assembled using both short and long nucleotide sequence reads is currently the largest known mitogenome. BMC Genom. 2020, 21, 654. [Google Scholar] [CrossRef]
  7. Frezza, C.; Venditti, A.; Toniolo, C.; Vita, D.; Serafini, I.; Ciccòla, A.; Franceschin, M.; Ventrone, A.; Tomassini, L.; Foddai, S.; et al. Pedicularis L. Genus: Systematics, botany, phytochemistry, chemotaxonomy, ethnopharmacology, and other. Plants 2019, 8, 306. [Google Scholar] [CrossRef]
  8. Yatoo, M.I.; Dimri, U.; Gopalakrishnan, A.; Karthik, K.; Gopi, M.; Khandia, R.; Saminathan, M.; Saxena, A.; Alagawany, M.; Farag, M.R.; et al. Beneficial health applications and medicinal values of Pedicularis plants: A review. Biomed. Pharmacother. 2017, 95, 1301–1313. [Google Scholar] [CrossRef]
  9. Li, X.; Lin, C.Y.; Yang, J.B.; Yu, W.B. De novo assembling a complete mitochondrial genome of Pedicularis rex (Orobanchaceae) using GetOrganelle toolkit. Mitochondrial DNA Part B 2020, 5, 1056–1057. [Google Scholar] [CrossRef]
  10. Sui, X.L.; Guan, K.Y.; Chen, Y.; Xue, R.J.; Li, A.R. A legume host benefits more from Arbuscular mycorrhizal fungi than a grass host in the presence of a root hemiparasitic plant. Microorganisms 2022, 10, 440. [Google Scholar] [CrossRef]
  11. Wei, W.R.; Zhen, Q.Y.; Deng, J.; Yue, H.L.; Qin, M.S.; Oosthuizen, M.K. Grazing during the grassland greenup period promotes plant species richness in alpine grassland in winter pastures. Front. Plant Sci. 2022, 13, 973662. [Google Scholar] [CrossRef]
  12. Wang, D.; Cui, B.C.; Duan, S.S.; Chen, J.J.; Fan, H.; Lu, B.B.; Zheng, J.H. Moving north in China: The habitat of Pedicularis kansuensis in the context of climate change. Sci. Total Environ. 2019, 697, 133979. [Google Scholar] [CrossRef]
  13. Doyle, J. A rapid DNA isolation procedure for small quantities of fresh leaf tissue. Phytochem. Bull. 1987, 19, 11–15. [Google Scholar]
  14. Kolmogorov, M.; Yuan, J.; Lin, Y.; Pevzner, P.A. Assembly of long, error-prone reads using repeat graphs. Nat. Biotechnol. 2019, 37, 540–546. [Google Scholar] [CrossRef]
  15. Wick, R.R.; Schultz, M.B.; Justin, Z.; Holt, K.E. Bandage: Interactive visualization of de novo genome assemblies. Bioinformatics 2015, 31, 3350–3352. [Google Scholar] [CrossRef] [PubMed]
  16. Chen, Y.; Ye, W.C.; Zhang, Y.D.; Xu, Y.S. High speed BLASTN: An accelerated MegaBLAST search tool. Nucleic Acids Res. 2015, 43, 7762. [Google Scholar] [CrossRef]
  17. Li, H.; Durbin, R. Fast and accurate short read alignment with burrows-wheeler transform. Bioinformatics 2009, 25, 1754–1760. [Google Scholar] [CrossRef] [PubMed]
  18. Li, H.; Handsaker, B.; Wysoker, A.; Fennell, T.; Ruan, J.; Homer, N.; Marth, G.; Abecasis, G.; Durbin, R. The sequence alignment/map format and SAMtools. Bioinformatics 2009, 25, 2078–2079. [Google Scholar] [CrossRef]
  19. Wick, R.R.; Judd, L.M.; Gorrie, C.L.; Holt, K.E. Unicycler: Resolving bacterial genome assemblies from short and long sequencing reads. PLoS Comput. Biol. 2017, 13, e1005595. [Google Scholar] [CrossRef]
  20. Michael, T.; Pascal, L.; Tommaso, P.; Ulbricht-Jones, E.S.; Axel, F.; Ralph, B.; Stephan, G. GeSeq-versatile and accurate annotation of organelle genomes. Nucleic Acids Res. 2017, 45, W6–W11. [Google Scholar]
  21. Lowe, T.M.; Eddy, S.R. tRNAscan-SE: A program for improved detection of transfer RNA genes in genomic sequence. Nucleic Acids Res. 1997, 25, 955–964. [Google Scholar] [CrossRef]
  22. Lewis, S.E.; Searle, S.M.J.; Harris, N.; Gibson, M.; Lyer, V.; Richter, J.; Wiel, C.; Bayraktarogli, L.; Birney, E.; Crosby, M.A.; et al. Apollo: A sequence annotation editor. Genome Biol. 2002, 3, 1–14. [Google Scholar] [CrossRef]
  23. Li, J.L.; Ni, Y.; Lu, Q.Q.; Chen, H.M.; Liu, C. PMGA: A plant mitochondrial genome annotator. Plant Commun. 2025, 6, 101191. [Google Scholar] [CrossRef] [PubMed]
  24. Zhang, D.; Gao, F.L.; Jakovlić, I.; Zou, H.; Zhang, J.; Li, W.X.; Wang, G.T. PhyloSuite: An integrated and scalable desktop platform for streamlined molecular sequence data management and evolutionary phylogenetics studies. Mol. Ecol. Resour. 2020, 20, 348–355. [Google Scholar] [CrossRef] [PubMed]
  25. Kumar, S.; Stecher, G.; Tamura, K. MEGA7: Molecular evolutionary genetics analysis version 7.0 for bigger datasets. Mol. Biol. Evol. 2016, 33, 1870–1874. [Google Scholar] [CrossRef] [PubMed]
  26. Sebastian, B.; Thomas, T.; Thomas, M.; Uwe, S.; Martin, M. MISA-web: A web server for microsatellite prediction. Bioinformatics 2017, 33, 2583–2585. [Google Scholar] [CrossRef]
  27. Gary, B. Tandem repeats finder: A program to analyze DNA sequences. Nucleic Acids Res. 1999, 27, 573–580. [Google Scholar] [CrossRef]
  28. Kurtz, S.; Choudhuri, J.V.; Ohlebusch, E.; Schleiermacher, C.; Stoye, J.; Giegerich, R. REPuter: The manifold applications of repeat analysis on a genomic scale. Nucleic Acids Res. 2001, 29, 4633–4642. [Google Scholar] [CrossRef]
  29. Yu, W.B.; Yang, J.B.; Song, Y.; DePamphilis, C.W.; Yi, T.S.; Li, D.Z. GetOrganelle: A fast and versatile toolkit for accurate de novo assembly of organelle genomes. Genome Biol. 2020, 21, 241. [Google Scholar] [CrossRef]
  30. Katoh, K.; Standley, D.M. MAFFT multiple sequence alignment software version 7: Improvements in performance and usability. Mol. Biol. Evol. 2013, 30, 772–780. [Google Scholar] [CrossRef]
  31. Nguyen, L.T.; Schmidt, H.A.; Von Haeseler, A.; Minh, B.Q. IQ-TREE: A fast and effective stochastic algorithm for estimating maximum-likelihood phylogenies. Mol. Biol. Evol. 2015, 32, 268–274. [Google Scholar] [CrossRef]
  32. Edera, A.A.; Small, I.; Milone, D.H.; Sanchez-Puerta, M.V. Deepred-Mt: Deep representation learning for predicting C-to-U RNA editing in plant mitochondria. Comput. Biol. Med. 2021, 136, 104682. [Google Scholar] [CrossRef]
  33. Wang, Y.P.; Tang, H.B.; Debarry, J.D.; Tan, X.; Li, J.P.; Wang, X.Y.; Lee, T.H.; Jin, H.Z.; Marler, B.; Guo, H.; et al. MCScanX: A toolkit for detection and evolutionary analysis of gene synteny and collinearity. Nucleic Acids Res. 2012, 40, e49. [Google Scholar] [CrossRef]
  34. Alverson, A.J.; Xiaoxin, W.; Rice, D.W.; Stern, D.B.; Kerrie, B.; Palmer, J.D. Insights into the evolution of mitochondrial genome size from complete sequences of Citrullus lanatus and Cucurbita pepo (Cucurbitaceae). Mol. Biol. Evol. 2010, 27, 1436–1448. [Google Scholar] [CrossRef]
  35. Kozik, A.; Rowan, B.A.; Lavelle, D.; Berke, L.; Schranz, M.E.; Michelmore, R.W.; Christensen, A.C. The alternative reality of plant mitochondrial DNA: One ring does not rule them all. PLoS Genet. 2019, 15, e1008373. [Google Scholar] [CrossRef] [PubMed]
  36. Raven, R.H.; Hong, D.Y.; Wu, Z.Y.; Raven, R.H.; Hong, D.Y. History of the flora of China. Flora China 2013, 1, 1–21. [Google Scholar]
  37. Wicke, S.; Müller, K.F.; de Pamphilis, C.W.; Quandt, D.; Wickett, N.J.; Zhang, Y.; Renner, S.S.; Schneeweiss, G.M. Mechanisms of functional and physical genome reduction in photosynthetic and nonphotosynthetic parasitic plants of the broomrape family. Plant Cell 2013, 25, 3711–3725. [Google Scholar] [CrossRef] [PubMed]
  38. T.A.P. GROUP. An update of the Angiosperm Phylogeny Group classification for the orders and families of flowering plants: APG IV. Bot. J. Linn. Soc. 2016, 141, 436. [Google Scholar]
  39. Mower, J.P.; Sloan, D.B.; Alverson, A.J. Plant mitochondrial genome diversity: The genomics revolution. In Plant Genome Diversity Volume 1: Plant Genomes, Their Residents, and Their Evolutionary Dynamics; Wendel, J.F., Greilhuber, J., Dolezel, J., Leitch, I.J., Eds.; Springer: Vienna, Austria, 2012; pp. 123–144. [Google Scholar]
  40. Morton, B.R. Selection on the codon bias of chloroplast and cyanelle genes in different plant and algal lineages. J. Mol. Evol. 1998, 46, 449–459. [Google Scholar] [CrossRef]
  41. Maier, R.M.; Zeltz, P.; Kössel, H.; Bonnard, G.; Gualberto, J.M.; Grienenberger, J.M. RNA editing in plant mitochondria and chloroplasts. Plant Mol. Biol. 1996, 32, 343–365. [Google Scholar] [CrossRef]
  42. Sloan, D.B.; Alverson, A.J.; Wu, M.; Palmer, J.D.; Taylor, D.R. Recent acceleration of plastid sequence and structural evolution coincides with extreme mitochondrial divergence in the angiosperm genus Silene. Genome Biol. Evol. 2012, 4, 294–306. [Google Scholar] [CrossRef]
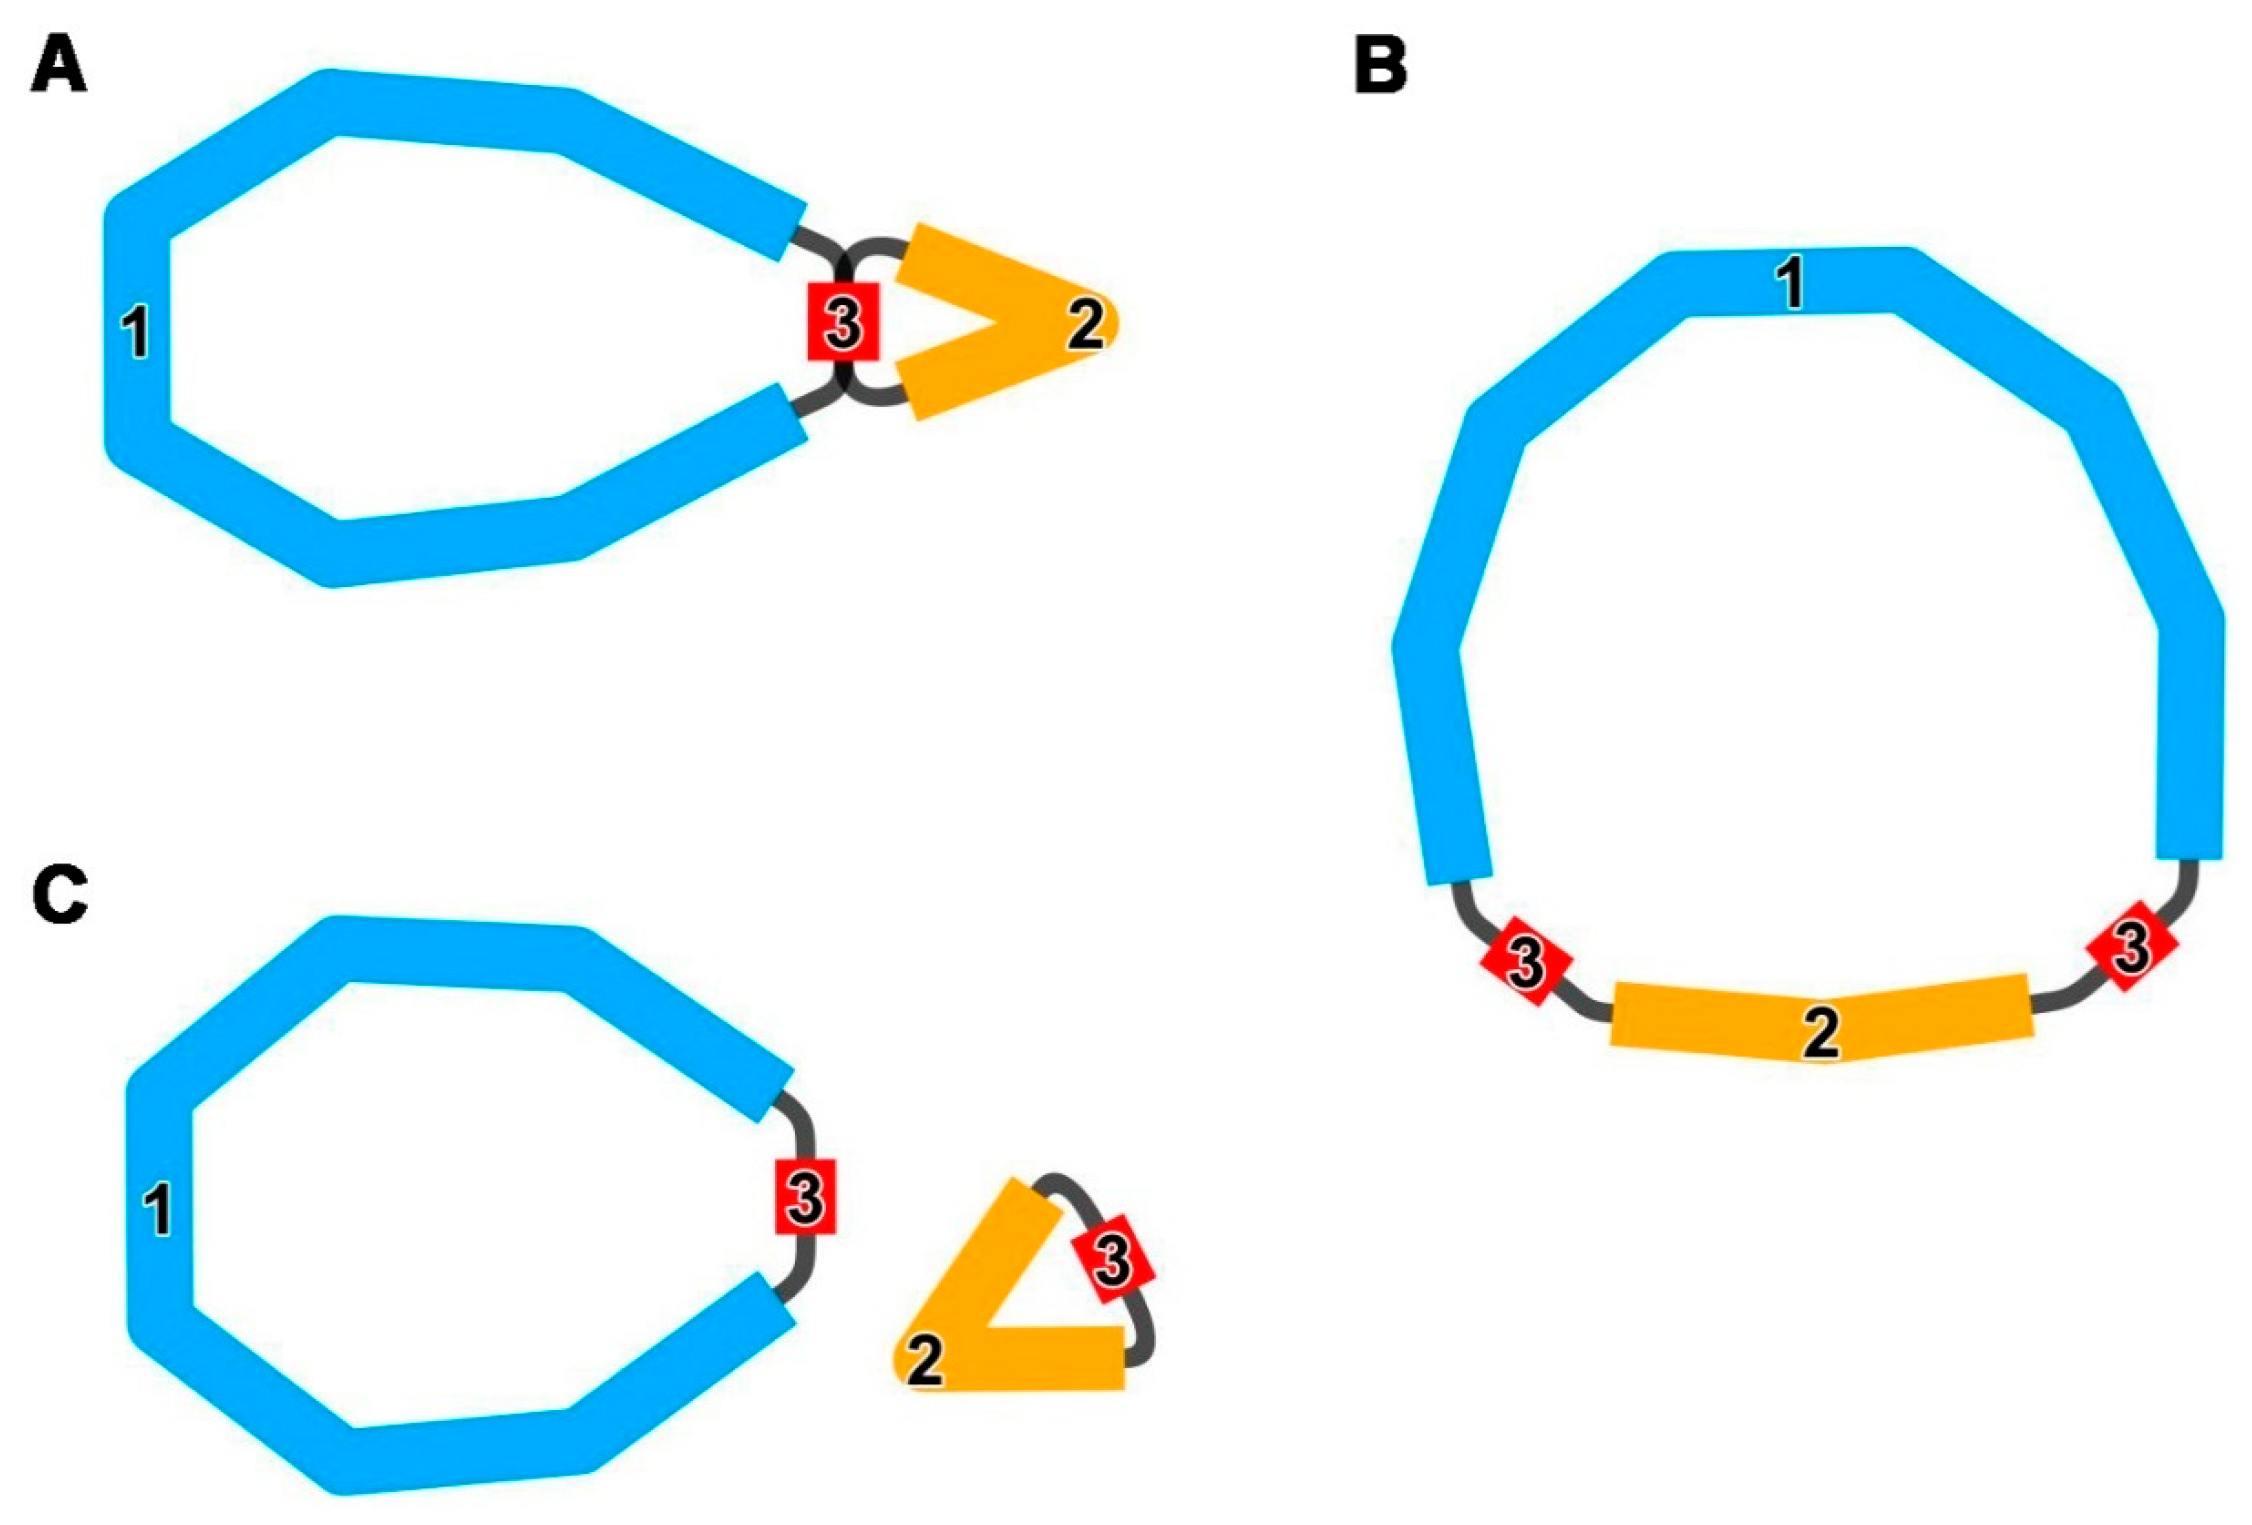
Figure 1. A network of the mitochondrial contigs of P. chinensis and P. kansuensis visualized in Bandage. Panel (A) shows the assembly results generated using Flye. Panel (B) illustrates a schematic diagram of the main circular structure, while panel (C) depicts how the main circle splits into two smaller circles mediated by repetitive sequences. This model diagram is applicable to both the Pk (P. kansuensis) and Pc (P. chinensis) mitochondrial genomes.
Horticulturae 11 01095 g001
Figure 2. Mitochondrial genome map of P. chinensis (A) and P. kansuensis (B). Genomic features on transcriptionally clockwise and counterclockwise strands are drawn on the inside and outside of the three circles, respectively. GC content of each chromosome is represented on the inner circle by the dark gray plot.
Horticulturae 11 01095 g002
Figure 3. RSCU in the P. chinensis (A) and P. kansuensis (B) mitogenome. The x-axis represents codon families, while the RSCU values indicate the frequency at which a specific codon is observed relative to the expected frequency based on uniform synonymous codon usage.
Horticulturae 11 01095 g003
Figure 4. Analysis of repetitive sequences in P. chinensis and P. kansuensis. (A) The SSR analysis. The x-axis represents types of SSRs, while the y-axis indicates the count of repetitive segments. The yellow legend corresponds to P. chinensis, and the purple legend to P. kansuensis. (B) Dispersed repetitive sequence analysis. The x-axis represents the types of repetitive sequences, while the y-axis indicates the count of repetitive segments. The blue legend corresponds to P. chinensis, and the green legend corresponds to P. kansuensis.
Horticulturae 11 01095 g004
Figure 5. Comparative analysis of mitochondrial genome synteny among P. chinensis and P. kansuensis and five related species. The red curved regions indicate the regions where inversions have occurred, while the gray regions represent the regions with good homology.
Horticulturae 11 01095 g005
Figure 6. Predicted RNA editing site counts of mitochondrial protein-coding genes. (A) Predicted RNA editing site counts in P. chinensis. (B) Predicted RNA editing site counts in P. kansuensis.
Horticulturae 11 01095 g006
Figure 7. Maximum likelihood (ML) phylogenetic tree of P. chinensis and P. kansuensis, along with 48 species in the Tubiflorae, constructed based on common protein-coding genes. P. chinensis and P. kansuensis are highlighted in red. Oryza nivara, Oryza sativa, and Oryza glaberrima were chosen as outgroup species for the tree construction. Bootstrap support of 60% or greater is indicated above the branches.
Horticulturae 11 01095 g007
Disclaimer/Publisher’s Note: The statements, opinions and data contained in all publications are solely those of the individual author(s) and contributor(s) and not of MDPI and/or the editor(s). MDPI and/or the editor(s) disclaim responsibility for any injury to people or property resulting from any ideas, methods, instructions or products referred to in the content.