Article

Transcriptome Analysis of Adventitious Bulblet Initiation in Lilium lancifolium Thunb

1
Institute of Grassland, Flowers and Ecology, Beijing Academy of Agriculture and Forestry Sciences, Beijing 100097, China
2
Bioengineering College, Chongqing University, Chongqing 400044, China
3
College of Horticulture, Hebei Agriculture University, Baoding 071000, China
*
Author to whom correspondence should be addressed.
These authors contributed equally to this work.
Horticulturae 2025, 11(9), 1084; https://doi.org/10.3390/horticulturae11091084
Submission received: 28 July 2025 / Revised: 25 August 2025 / Accepted: 2 September 2025 / Published: 9 September 2025
(This article belongs to the Section Floriculture, Nursery and Landscape, and Turf)

Abstract

Bulblet initiation in Lilium lancifolium is a critical yet understudied aspect of lily development. Prior research has predominantly focused on bulb production and tissue culture techniques, with limited exploration of regulatory mechanisms. This study investigates the initiation process through histological, biochemical, and molecular approaches. Scales from tissue-cultured bulblets were analyzed for sugar content and gene expression. Results revealed significant increases in sucrose levels at the scale base during culture, paralleled by transcriptomic enrichment in hormone signaling, cell cycle, DNA replication, and sugar metabolism pathways. These findings, validated by quantitative real-time polymerase chain reaction (qRT-PCR), offer valuable insights into the molecular basis of bulblet initiation in L. lancifolium, providing a foundation for future research into lily developmental mechanisms.

1. Introduction

Lilium lancifolium Thunb., a plant of considerable significance in China for ornamental, edible, and medicinal purposes, exhibits substantial commercial potential due to its diverse applications across multiple industries [1]. However, as a triploid species, its primary mode of reproduction is asexual, with in vitro scale-induced adventitious bud initiation serving as a key method [2]. Lily bulbil originates from the leaf axils. Lily scales can regenerate adventitious bulblet at their base [3,4]. Existing research on bulb initiation in L. lancifolium predominantly centers on exogenous hormone and carbohydrate treatments in vitro scales [5,6]. Despite these investigations, the genetic mechanisms underpinning adventitious bulblet initiation remain largely unexplored.
The concept of plant cell totipotency, which enables plants to regenerate, is fundamental to understanding plant development [7]. However, not all cell types possess the potential to generate complete plants. Cells with regeneration capacity are typically situated in specific regions, such as the pericycle cells adjacent to the xylem. Studies have shown that inhibiting pericycle cell division can fully suppress callus tissue formation, underscoring the critical role of these cells in plant regeneration [8]. Moreover, procambium cells, which are precursors to vascular tissues, also serve as the origin of bud and root regeneration [9,10]. Therefore, the interaction between procambium and pericycle cells is fundamental to plant regeneration and crucial for understanding adventitious bulb formation in L. lancifolium. However, there are relatively few studies on the observation of cell morphology during the regeneration process of lily bulblet.
Sucrose, the principal form of carbohydrates in plants, plays a pivotal role in regulating carbon metabolism and energy distribution [11]. During the critical period of bulblet formation, which signifies the onset of bulb development from in vitro scales, sucrose metabolism becomes particularly significant [12]. As the primary component of phloem transport in lilies, sucrose not only serves as a carbon source but also functions as a signaling molecule that influences various physiological processes [13]. Research has demonstrated that sucrose and starch metabolism are central metabolic pathways in lily bulblet regeneration. The hydrolysis and translocation of sucrose supply essential precursors for starch synthesis, which is a hallmark of lily bulblet development [6]. During lily scale cutting, the starch content in mother scales decreases while that in bulblets increases, reflecting the dynamic carbon partitioning during this process [14]. In the early stages of Lycoris bulb regeneration, sucrose is metabolized into soluble sugars, coinciding with elevated expression levels of CWIN and SUS [15]. Significantly, CWIN has been shown to interact with hormonal signaling pathways [16]; when using the oriental lily hybrid Star Gazer as an explant, appropriate concentrations of sucrose can increase the number of bulblets [17]. However, there is a lack of research on whether there is a relationship between sucrose content and bulblet initiation during bulblet initiation.
The initiation of lily bulblets begins within the vascular bundles of scales, where a substantial increase in starch content is observed. Simultaneously, the expression levels of genes involved in starch synthesis display a significant upward trend [6]. In the context of plant hormone signal transduction pathways, diverse hormones exert distinct effects on bulblet initiation. Auxin and cytokinin, in particular, are essential hormones for bulbil initiation in bulbous flowers [2,18]. The exogenous application of 2,4-D, a synthetic auxin, has been demonstrated to enhance auxin signaling and promote bulblet formation. Likewise, the application of exogenous cytokinin (CTK) markedly stimulates bulbil formation, especially during the initial phase [19].
This study initially investigated the regeneration process of in vitro scales of L. lancifolium. The cell morphology of the initiation bulblet of L. lancifolium was observed, and the dynamic changes in cell morphology at the bulblet generation site were clarified. The sucrose content was determined and the dynamic changes in sucrose during the regeneration of bulbils from in vitro scales of L. lancifolium dandelion were explored. Relevant pathways and genes potentially involved in the initiation of L. lancifolium bulbs were preliminarily identified. This study provides new evidence to verify the role of related genes in the formation of L. lancifolium bulblets.

2. Materials and Methods

2.1. Plant Materials and Growth Conditions

L. lancifolium scales were sourced from tissue cultures cultivated for 0 to 6 days at the Institute of Grassland, Flower and Landscape Ecology, Beijing Academy of Agriculture and Forestry Sciences. The culture medium comprised 4.74 g/L MS (Hopebio, Qingdao, China), 30 g/L sucrose, 0.5 mg/L TDZ (Solarbio, Beijing, China), 0.2 mg/L NAA (Solarbio, Beijing, China), and 7 g/L plant agar (Coolaber, Beijing, China). The cultures were maintained under 16 h light and 8 h dark conditions. L. lancifolium scales were layered from the base to the top, with each millimeter constituting one layer, totaling 10 layers. Layers 1 to 10 were sampled for sucrose, glucose, and fructose content determination. The first (S1), fourth (S4), and sixth (S6) layers of tissue culture samples were selected for transcriptome sequencing, with each sample triplicated, comprising 21 samples in total. Samples were quickly frozen in liquid nitrogen (Hope Erkang Technology Co., Ltd., Beijing, China) and subsequently stored at −80 °C.

2.2. Sucrose, Glucose, and Fructose Content Determination

Sucrose, glucose, and fructose contents were quantified by HPLC [20], with three biological repeats. An Agilent 1100 liquid chromatograph (Thermo Fisher Scientific, Waltham, MA, USA), equipped with a Thermo Corona Ultra RS electrospray detector was employed. The chromatographic column (Thermo Fisher Scientific, Waltham, MA, USA) was a Prevail Carbohydrate ES (5 μm, 4.6 mm × 250 mm). Chromatographic conditions included a column temperature of 35 °C, an injection volume of 10 μL, and a detection wavelength of 254 nm. The mobile phase consisted of A: acetonitrile–water (Solarbio, Beijing, China) (1:9) and B: acetonitrile (Solarbio, Beijing, China), using gradient elution. The peak areas of glucose, fructose, and sucrose in the chromatograms were measured, and their contents were calculated based on standard curves. The standard curve formulas were fructose (area = 4.77399 × amount + 3.19443), glucose (area = 4.78035 × amount + 1.61275), and sucrose (area = 3.38456 × amount + 6.26311).

2.3. Histomorphological Observation During Scale Initiation

Based on the previous paraffin-section method [21], the test was further improved according to the experimental requirements to obtain a method suitable for our own experiments. The bases of scales cultured daily were sampled and fixed in FAA fixative (Servicebio, Wuhan, China) (50% ethanol). Dehydration was performed using a gradient ethanol series (50%, 70%, 85%, 95%, and 100% ethanol for 1 h each), followed by clearing in 50% ethanol/50% xylene at room temperature for 1 h, then in 100% xylene for 1 h (repeated three times). Samples were embedded in paraffin overnight. On the second day, the paraffin melted at 50 °C, and fresh paraffin was applied at 60 °C for three consecutive days. Serial sections (5 μm thickness) were cut using a Leica RM2235 Manual Rotary Microtome (Leica, Wetzlar, Germany), stained with 5% Fast Green and 0.5% Safranin, and imaged using a Leica MZ 16F (Leica, Wetzlar, Germany).

2.4. RNA Extraction and cDNA Synthesis

Total RNA was isolated from different layers of sampled scales using the FastPure Plant Total RNA Isolation Kit (Polysaccharides and Polyphenolics-rich) (Vazyme, Nanjing, China). Subsequently, cDNA was synthesized using the HiScript III All-in-one RT SuperMix (Vazyme, China) for subsequent qRT-PCR analysis, following the manufacturer’s instructions [22].

2.5. Gene Expression Analysis by qRT-PCR

The qRT-PCR primers were designed using Primer Premier 6.0 software. The primer sequences are listed in File S1 (Supplementary Materials). All reactions were performed on a CFX96 RealTime system (Bio-Rad, Hercules, CA, USA). The FP gene, encoding the F-BOX family protein, was employed as the internal reference [23]. Each reaction comprised 1 μL cDNA, 0.5 μL forward primer, 0.5 μL reverse primer, 5 μL TB Green® Fast qPCR Mix (RR430A, TaKaRa, Beijing, China), and 3 μL ddH2O. The relative expression levels were calculated using the 2−ΔΔCT method. All qRT-PCR experiments were conducted with three biological replicates and three technical replicates [18].

2.6. Transcriptome Sequencing, RNA-Seq Data Processing, and Transcripts De Novo Assembly

Total RNA was isolated using the FastPure Plant Total RNA Isolation Kit (Polysaccharides and Polyphenolics-rich) (Vazyme, China) following the manufacturer’s instructions. RNA integrity and total amount were precisely measured using an Agilent 2100 bioanalyzer (Agilent Technologies, Santa Clara, CA, USA). mRNA was enriched using Oligo (dT) magnetic beads (Rebece, Nanjing, China), then fragmented with a fragmentation buffer to construct a cDNA library. The insert size of the library was detected using an Agilent 2100 bioanalyzer to ensure library quality of the library [24]. The library was sequenced on the Illumina NovaSeq 6000 platform (Illumina, San Diego, CA, USA), and low-quality reads were removed. Subsequent analyses were performed based on clean data. Clean reads were assembled using Trinity software (Trinity-v2.15.1) to obtain reference sequences for further analysis [5]. Corset hierarchical clustering and BUSCO transcript quality assessment were conducted on the de novo assembled transcripts to obtain unigenes for subsequent analysis.

2.7. Gene Annotation, KEGG Enrichment, and Differential Expression Analysis

The unigenes were compared against the GenBank Non-Redundant, Swiss-Prot, Protein Family (PFAM), Karyotic Ortholog Groups (KOG), Kyoto Encyclopedia of Genes and Genomes (KEGG), and Gene Ontology (GO) databases to obtain annotation information. KEGG functional enrichment and differential expression analysis were performed using KOBAS (v2.0.12) [25]. DESeq2 was used for analysis, and the differentially expressed genes were screened based on the criteria of |log2 (FoldChange)| > 1 and padj < 0.05 [25].

2.8. Statistical Analysis

Three biological replicates were conducted for each sample. Data visualization was accomplished using GraphPad Prism (version 8.0.2). Statistical analysis was performed using one-way analysis of variance (ANOVA) via SPSS 26.0 to compare differences among various indices or treatments. Significant differences were indicated by * p < 0.05 and ** p < 0.01.

3. Results

3.1. Histological Observation During Adventitious Bulblet Initiation

At the onset of scale culture (D0) (Figure 1A,B), aggregated cells were evident between the concave and convex surfaces. By D1 (Figure 1C,D), the number of cells aggregated at D0 had increased. On D2 (Figure 1E,F), the dense cell cluster initially observed at D0 extended toward the concave surface, indicating a connection to the initial cells. The cells accumulated on the concave surface were linked to the initial cells from D0. The number of accumulated cells further increased on D3 (Figure 1G,H). By D4 (Figure 1I,J), the cell cluster was larger and more numerous than on D3, yet still did not protrude from the concave surface. On D5 (Figure 1K,L), dense cell clusters began to slightly protrude from the concave surface. By D6 (Figure 1M,N), visible protrusions were evident on the concave surface. In summary, bulblet initiation was linked to the initial dense cells at D0. As culture progresses, these cells divided and migrated toward the concave surface, eventually forming bulblets.

3.2. Changes in Sugar Contents During Scale Culture

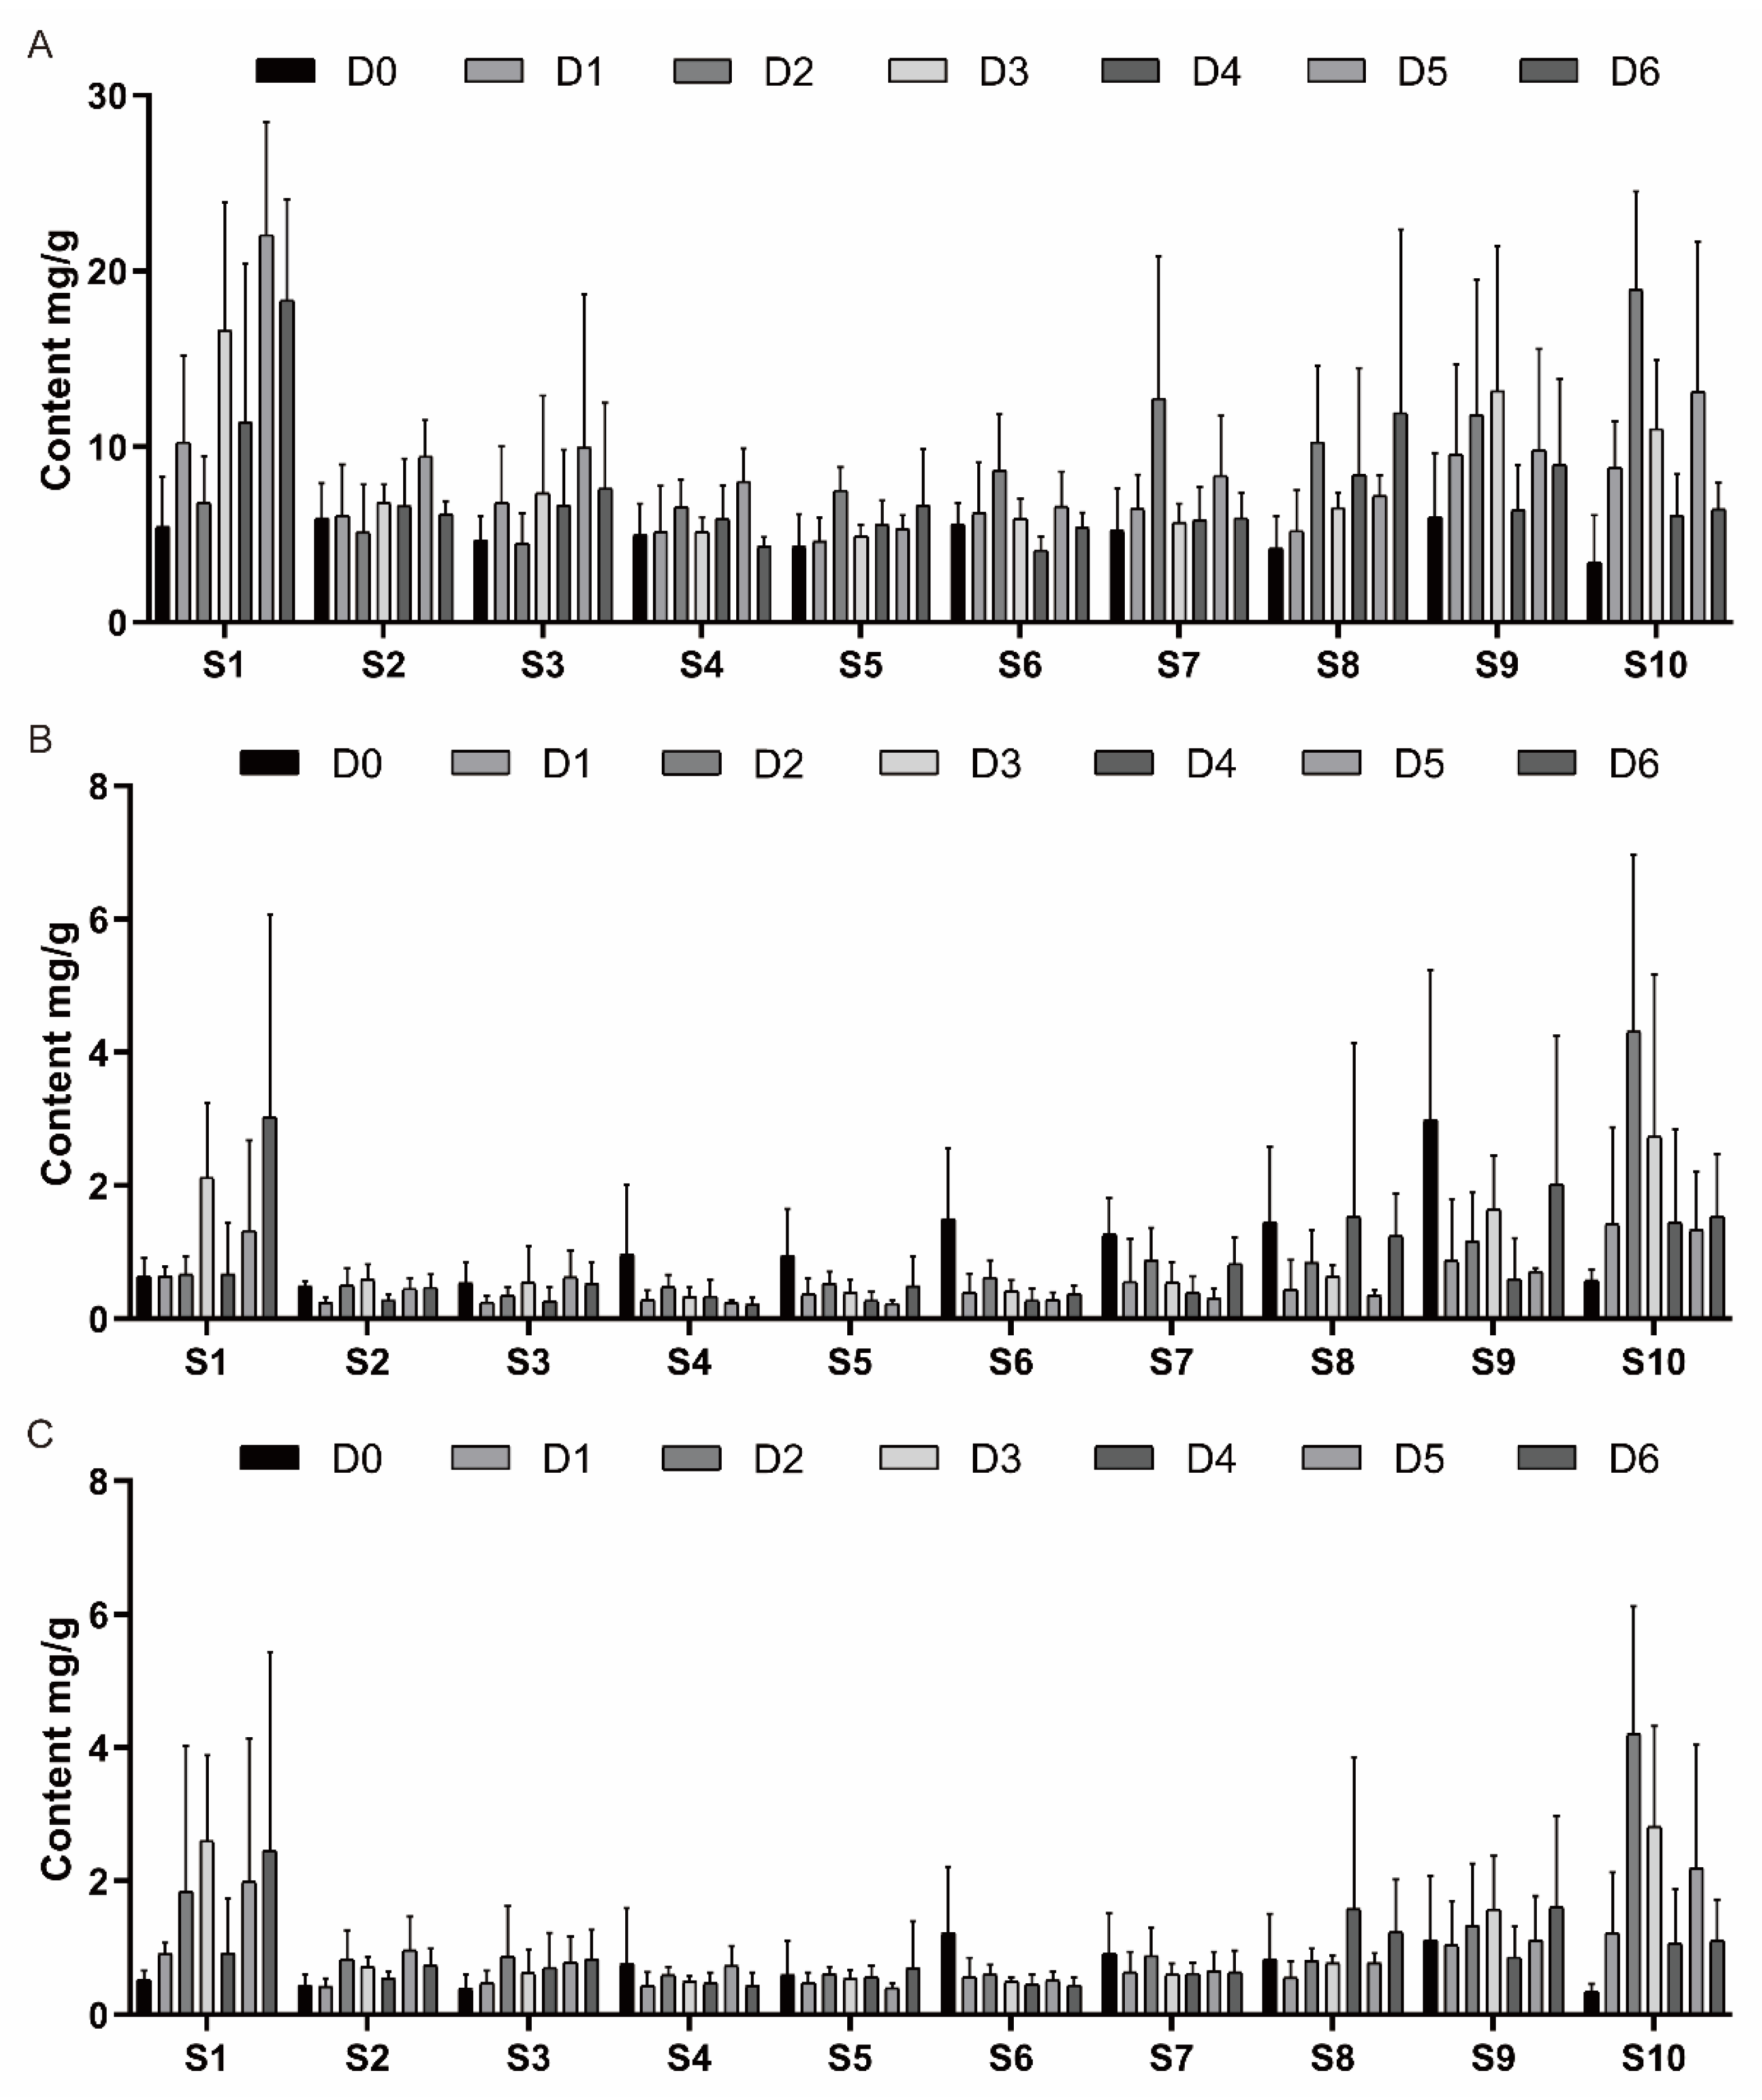
Throughout the scale culture period, sucrose, glucose, and fructose levels (Figure 2) in the basal region of the scales showed a steady increase. When the scales were cultured to D5, the sucrose content reached its highest value, which was 405.3% of the sucrose content at D0. When the scales were cultured to D6, the glucose content reached its highest value, which was 473.8% of the glucose content at D0. When the scales were cultured to D4, the fructose content reached its highest value, which was 489.5% of the fructose content at D0. In the middle region, sucrose concentrations remained constant, whereas glucose and fructose levels progressively decreased. At the top region of the scales, sugar contents first rose and then fell as cultivation progressed.

3.3. RNA-Sequencing Statistics and Assembly Overview for L. lancifolium

Under normal conditions, lily scales induce bulblet initiation only at the base of the scales. Our sugar content data showed that there was a significant difference between S1, and the rest of the layers, while there were no significant differences between the rest of the layers. Therefore, the rest of the layers had no real morphological or biological differences. Based on the method mentioned in the previous study, and with modifications, we selected S1, S4, and S6 for subsequent experiments.
In the RNA-seq statistics for L. lancifolium (Supplementary Table S1), each sample generated 20.47–27.64 million raw reads. After filtering out adapter-containing and low-quality reads, clean reads per sample ranged from 20.36 to 27.32 million, with a clean reads’ ratio of 95.56% to 99.23%. Clean bases ranged from 6.1 to 8.2 Gb, and high Q20 (≥96.51%) and Q30 (≥91.23%) values indicated high-quality RNA-seq data. The RNA-seq produced 189,067 unigenes, with lengths from 301 bp to 33,848 bp. Unigene and transcript N50 values were 1132 and 1412, respectively, with N90 values at 383 and 423. These metrics suggested the RNA-seq data was suitable for subsequent analysis (Supplementary Tables S2 and S3).

3.4. Screening of Differentially Expressed Genes (DEGs) Related to Bulblet Initiation

DEGs were screened in L. lancifolium scale samples cultivated on different days. A total of 50,505 DEGs were identified, with 33,067 up-regulated and 17,438 down-regulated. Up-regulated DEGs consistently outnumbered down-regulated DEGs across all periods. Except on the second day of culture, the number of DEGs in the first layer exceeded those in the fourth and sixth layers on other days, suggesting bulblet initiation-related genes are primarily expressed in the first layer (Figure 3A–C). In significantly enriched KEGG pathways, up-regulated genes in different layers at each stage outnumbered down-regulated genes. The number of DEGs in S1 peaked on D3, while that in layer S4 peaked on D2, and subsequently declined. Layer S6 exhibited the fewest DEGs (Figure 3D–F).
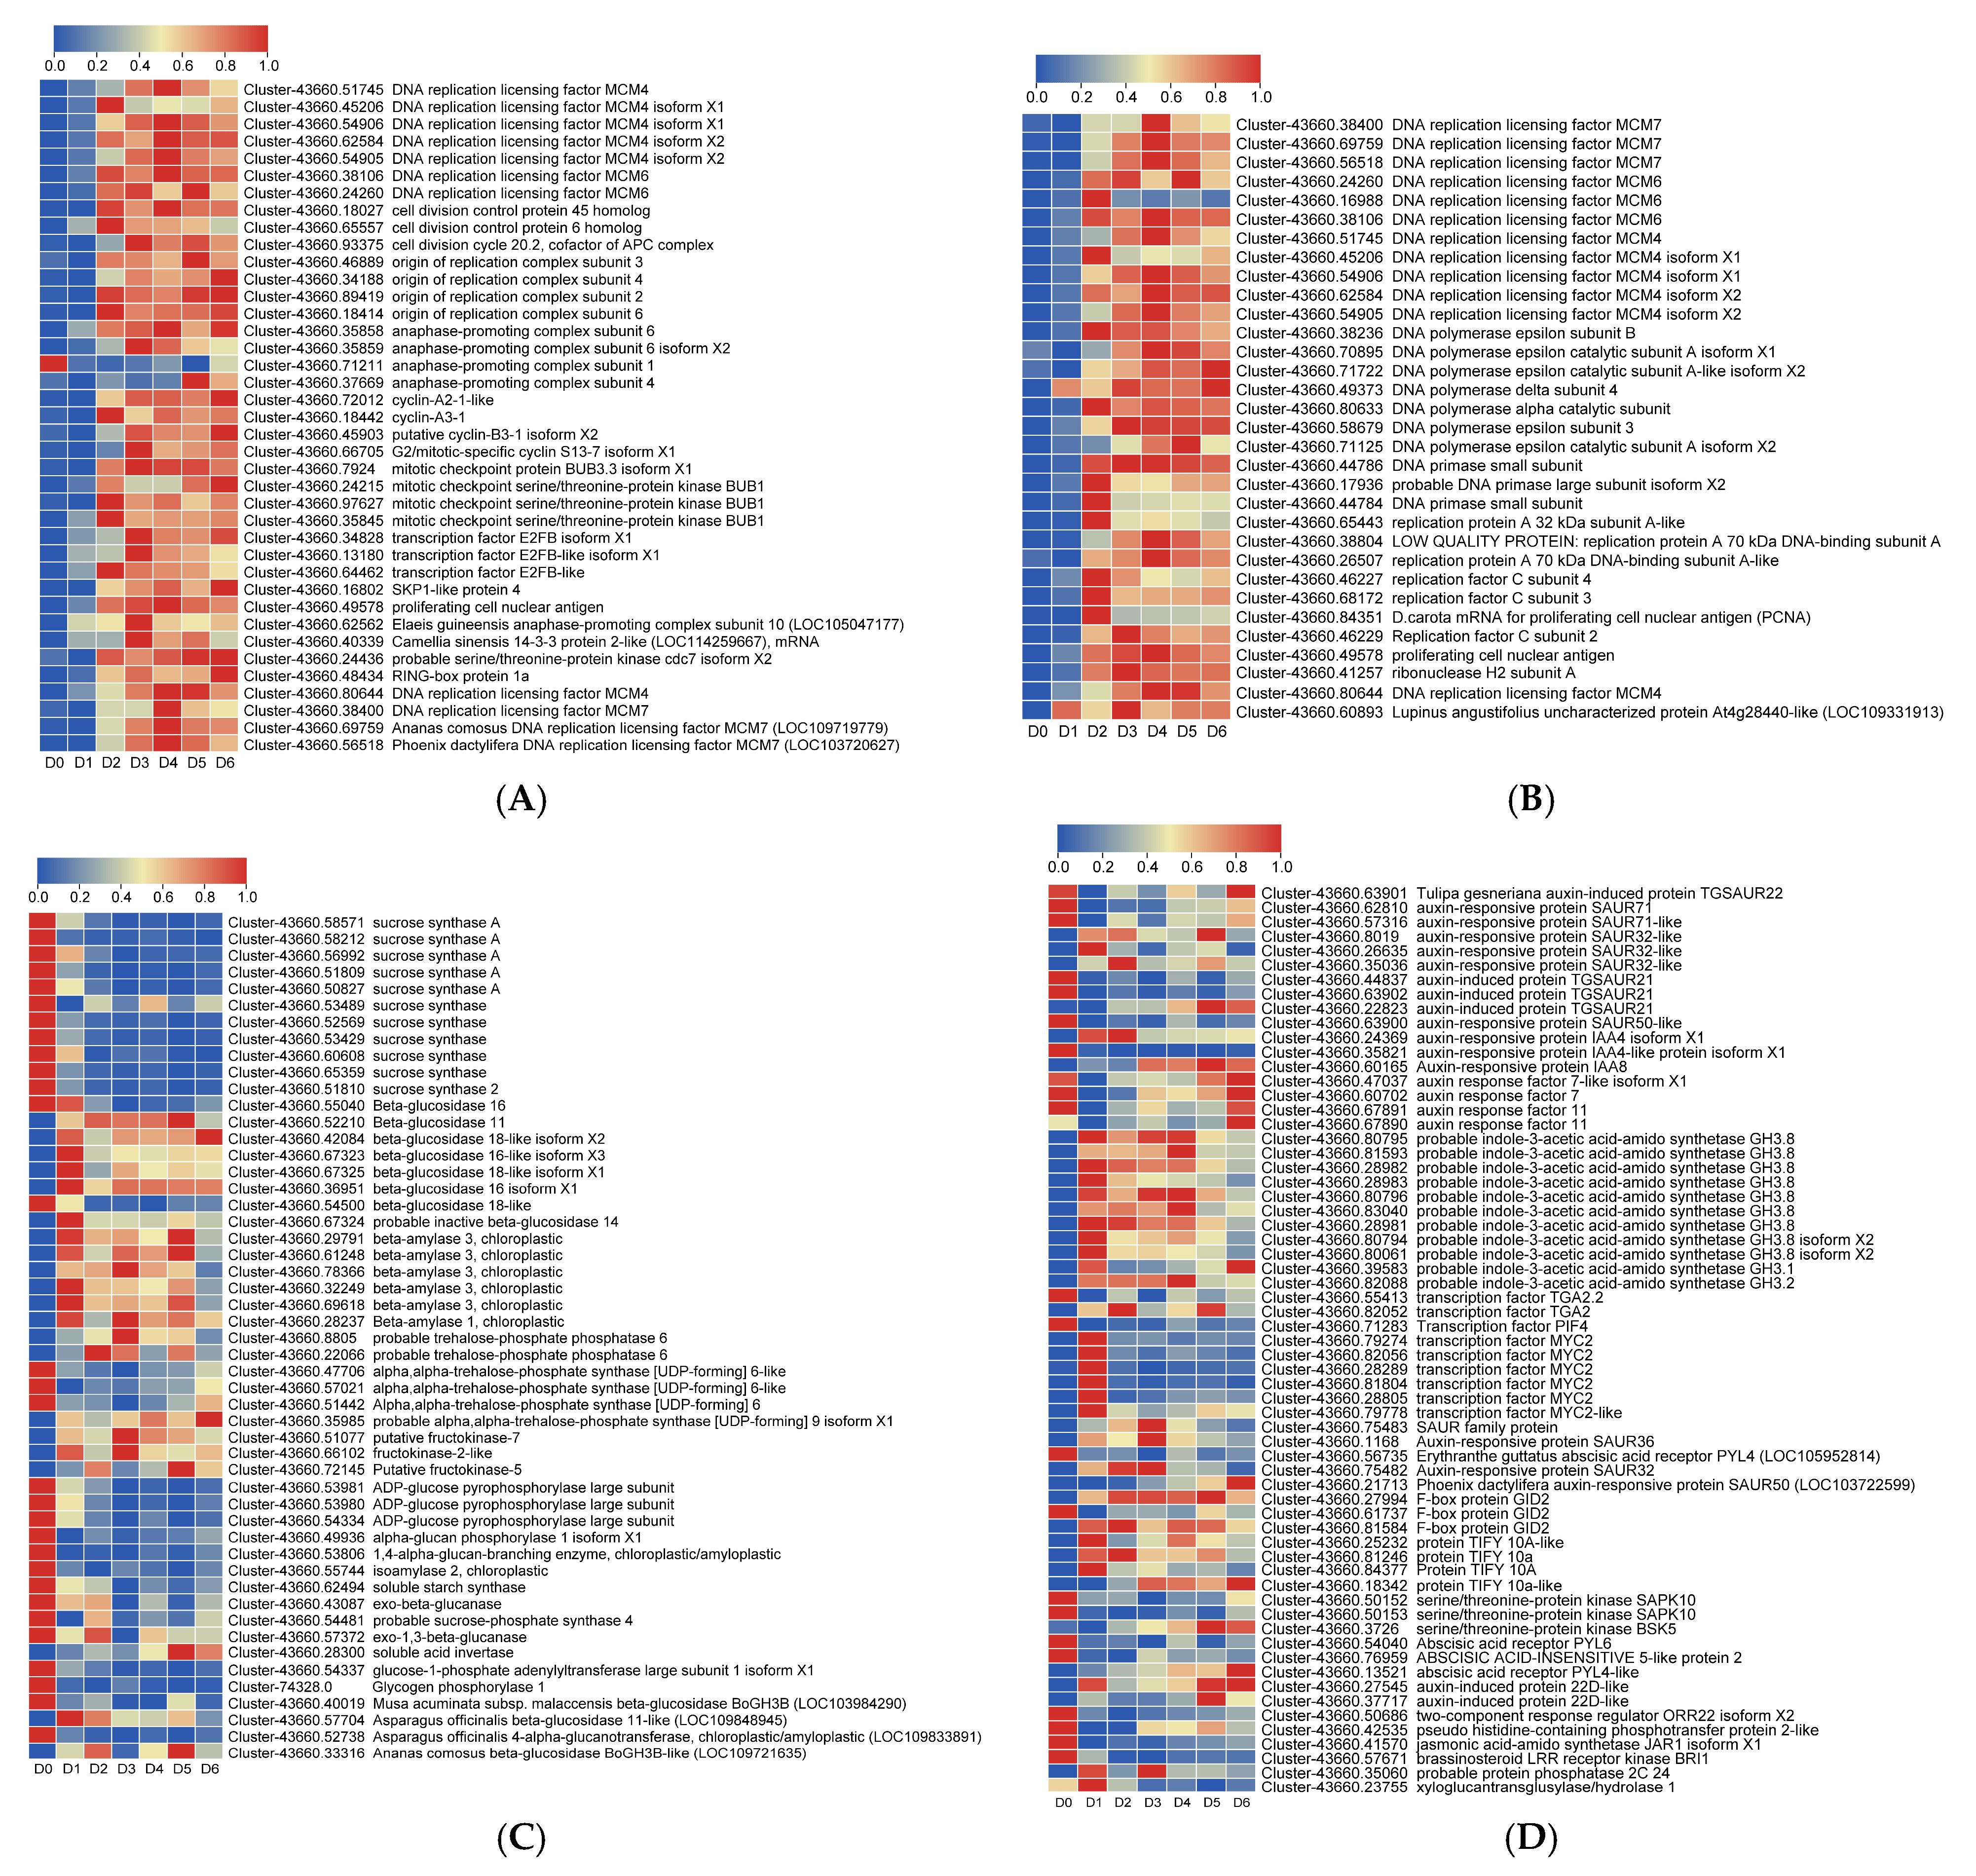
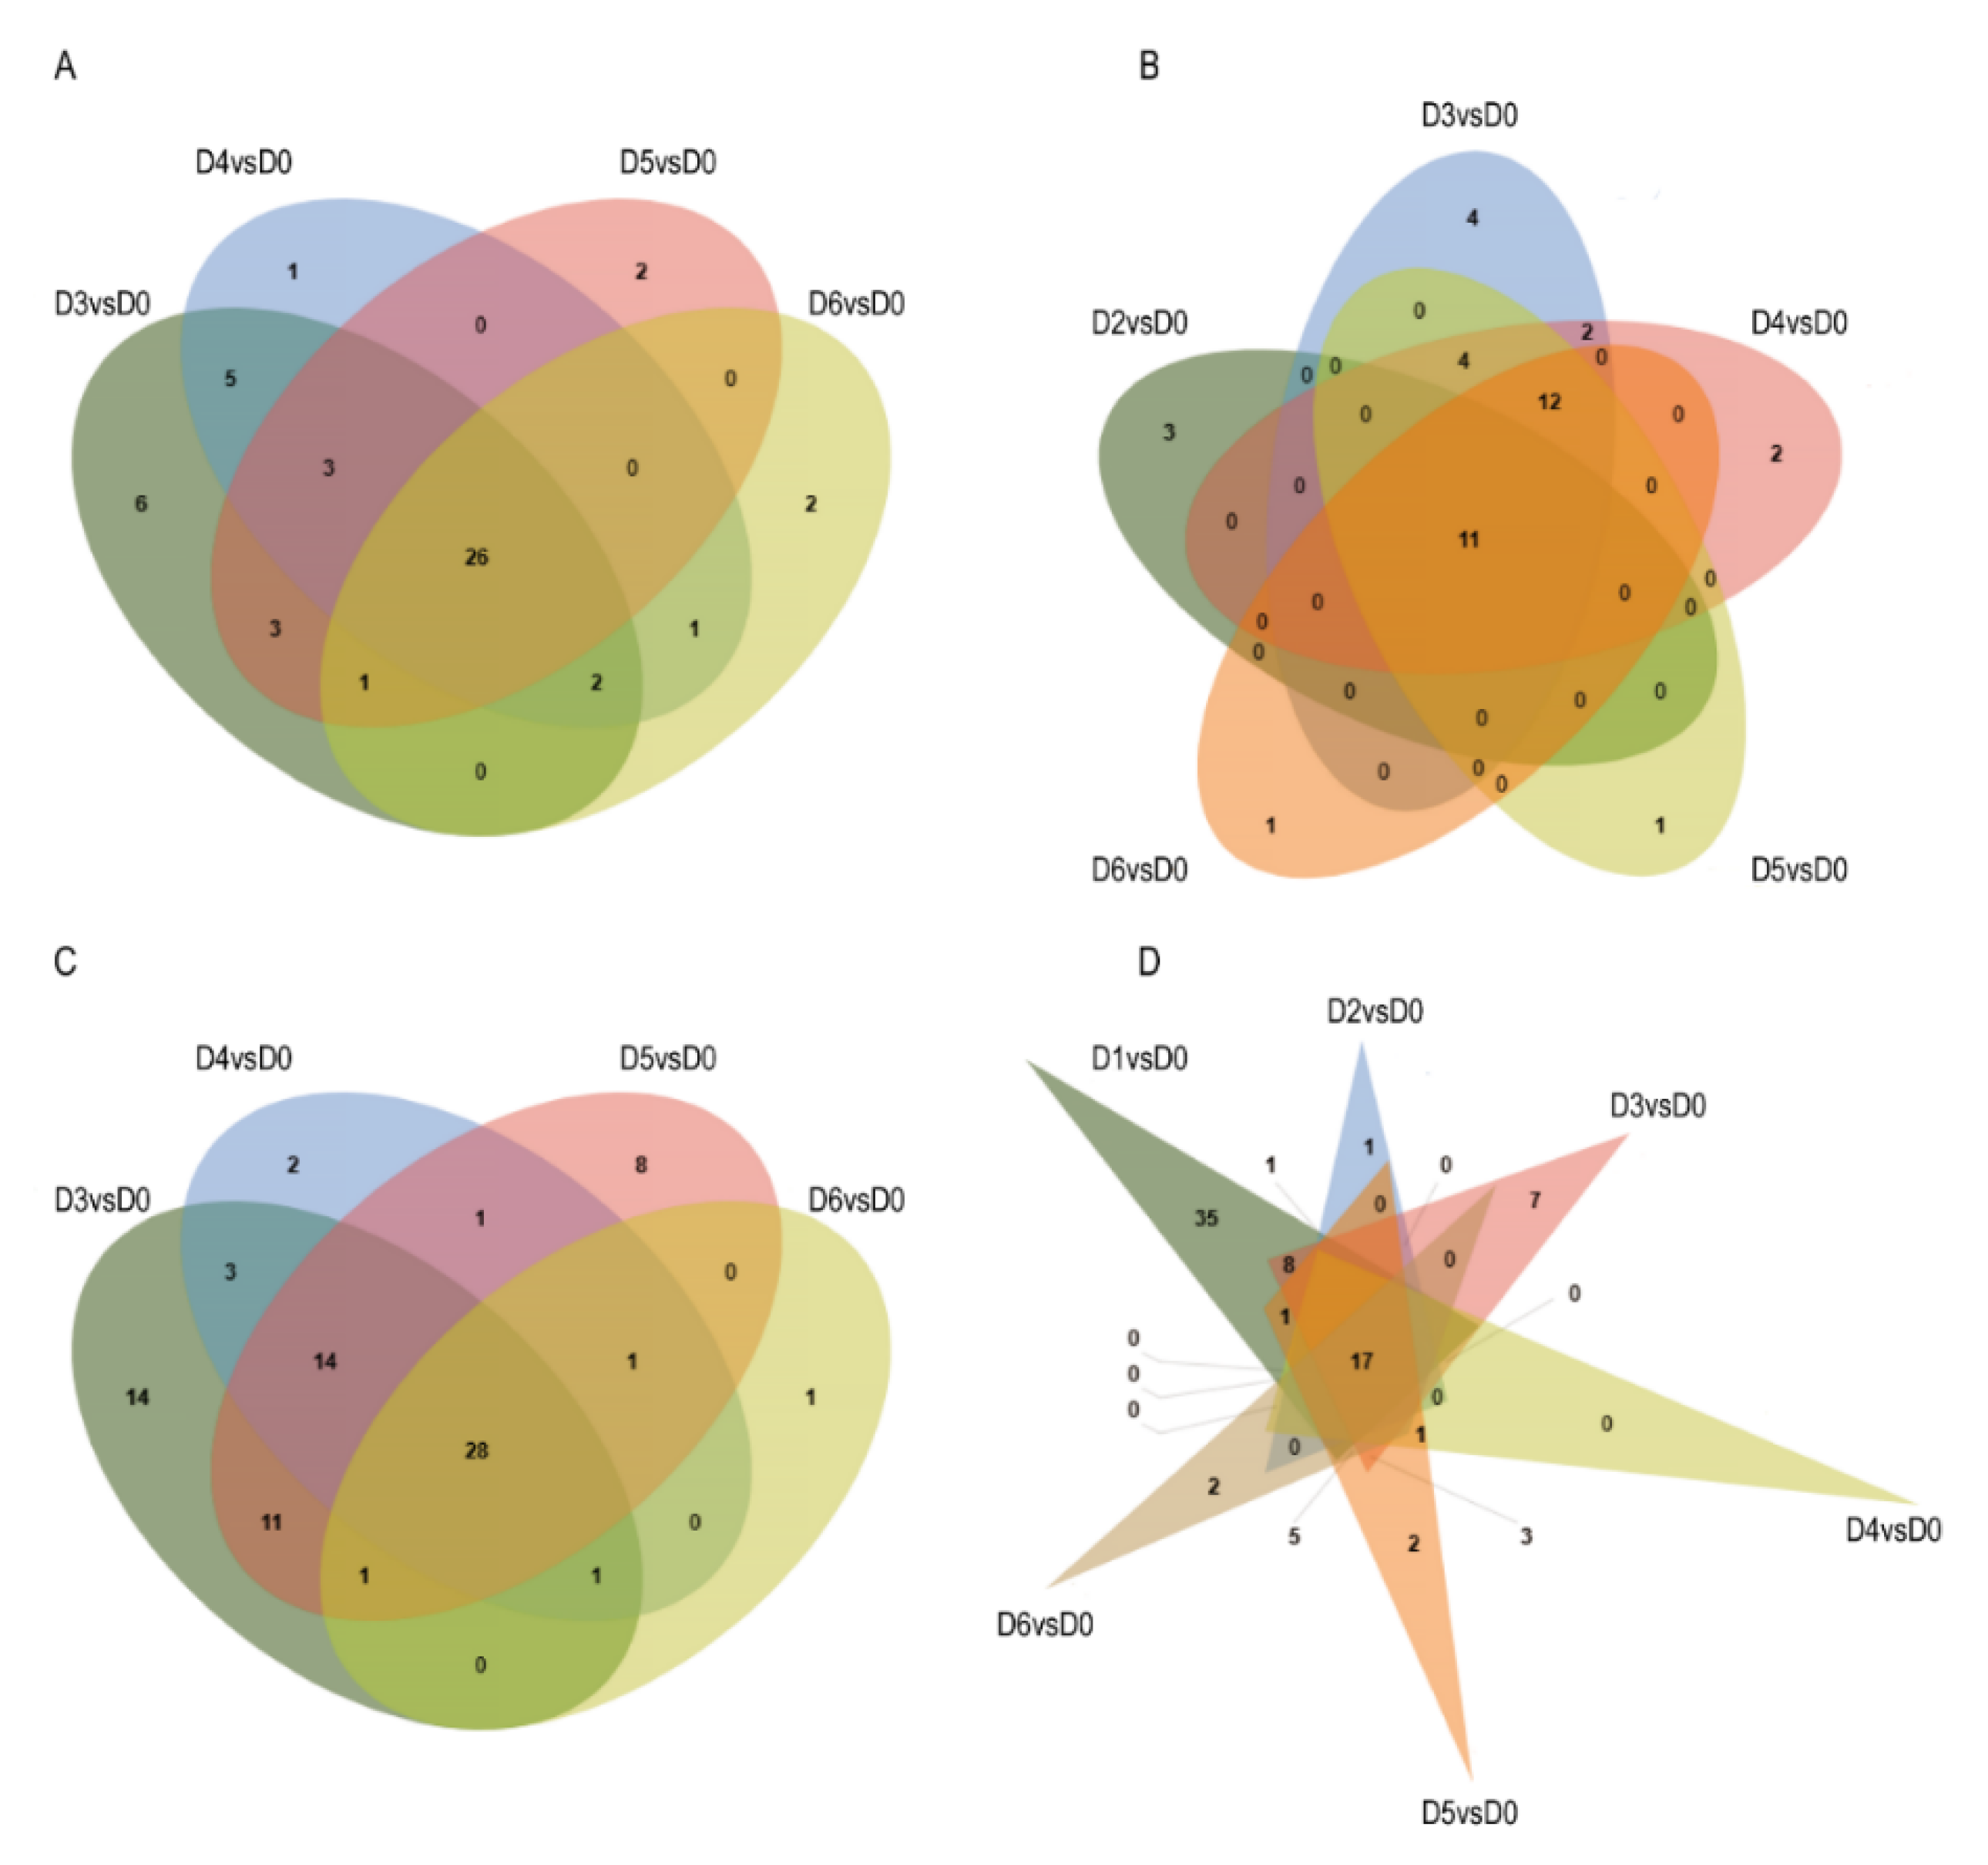
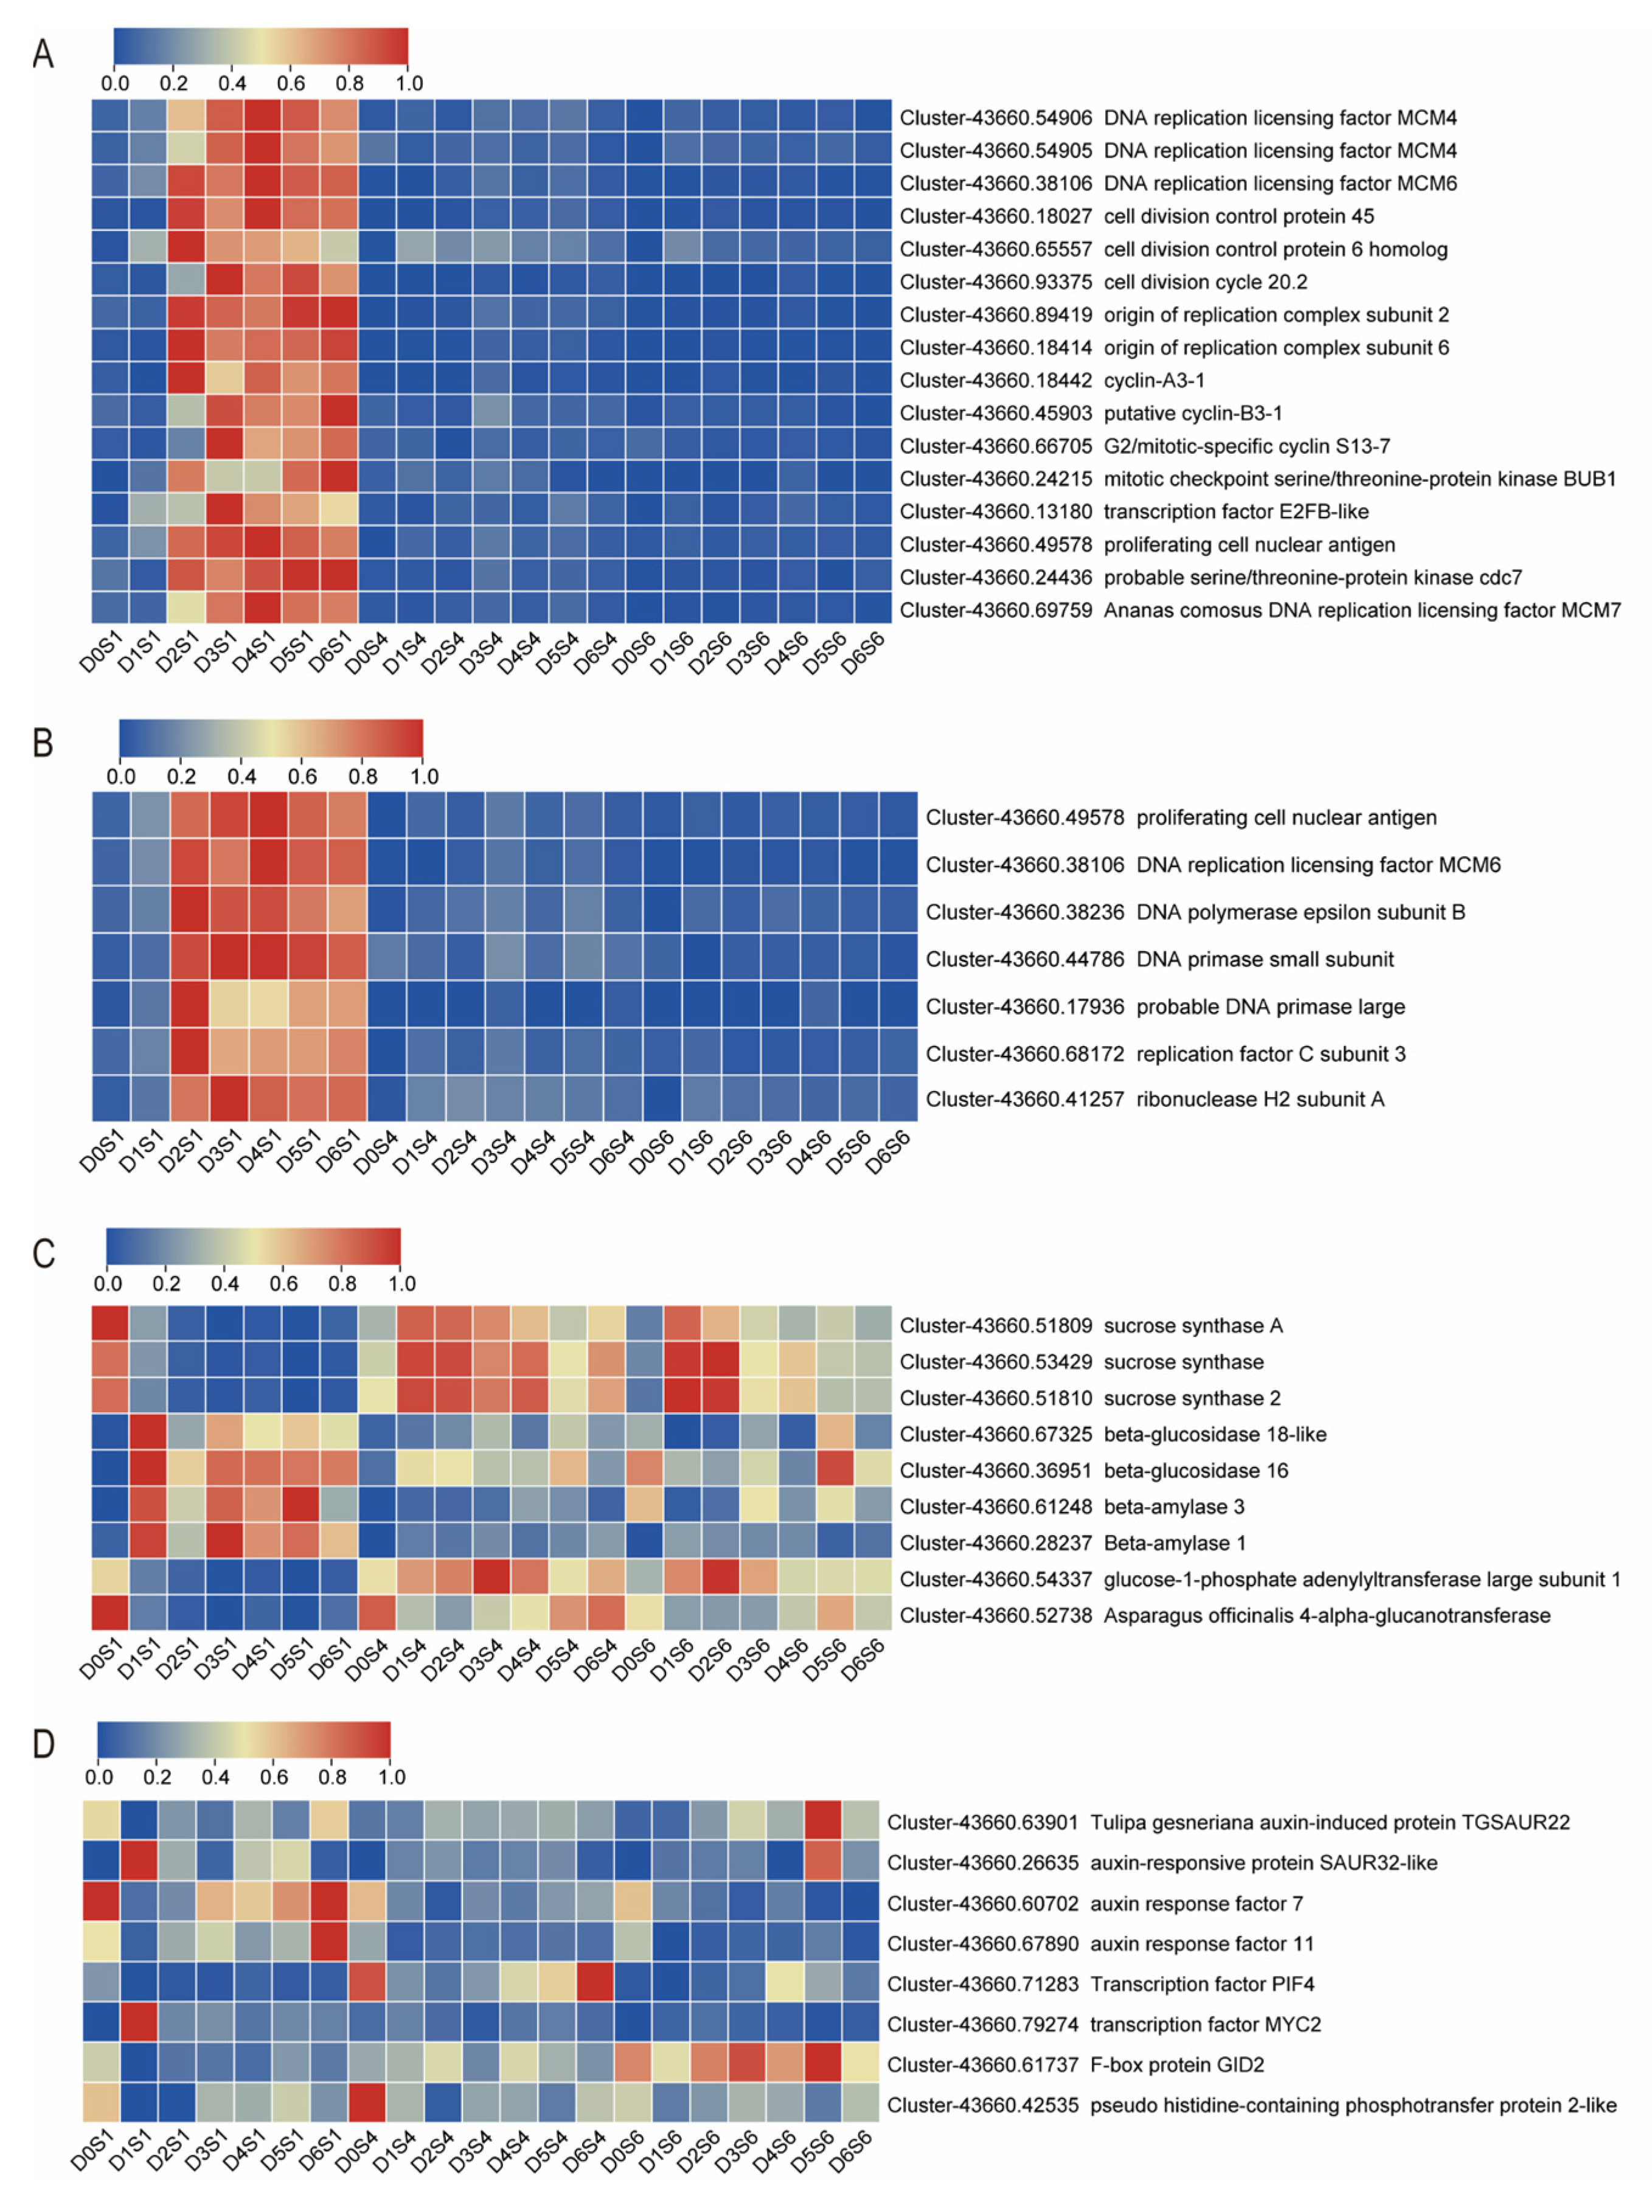
Further analysis of KEGG results revealed significant enrichment of DEGs in plant hormone signal transduction in S1 during days 1–6 of culture, and in DNA replication during days 2–6. From days 3–6, DEGs were significantly enriched in cell cycle and starch and sucrose metabolism pathways, but not in S4 and S6 (Supplementary File S2). The number of DEGs in S1 for these pathways was presented in Figure 3G–J. We screened DEGs in these four KEGG pathways by performing correlation analysis on FPKM trends of different layers during scale culture. Unigenes significantly correlated with S4, S6, and S1 were removed, retaining those with no correlation for further analysis. This resulted in 185 DEGs: 63 in plant hormone signal transduction, 51 in starch and sucrose metabolism, 39 in cell cycle, and 32 in DNA replication. There were 12 common DEGs between DNA replication and cell cycle pathways (Figure 4A–D). VENN diagrams were constructed to analyze DEGs across these four key KEGG pathways (Figure 5A–D). In the plant hormone signal transduction pathway, DEG numbers declined with cultivation time, particularly between D1 and D0. For DNA replication, cell cycle, and starch and sucrose metabolism pathways, we focused on overlapping DEGs across all periods and identified a total of 60 DEGs: 16 in plant hormone signal transduction, 19 in starch and sucrose metabolism, 20 in cell cycle, and 9 in DNA replication. Notably, 4 DEGs were shared between DNA replication and cell cycle pathways (Figure 6A–D).

3.5. Validation of DEGs by qRT-PCR Analysis

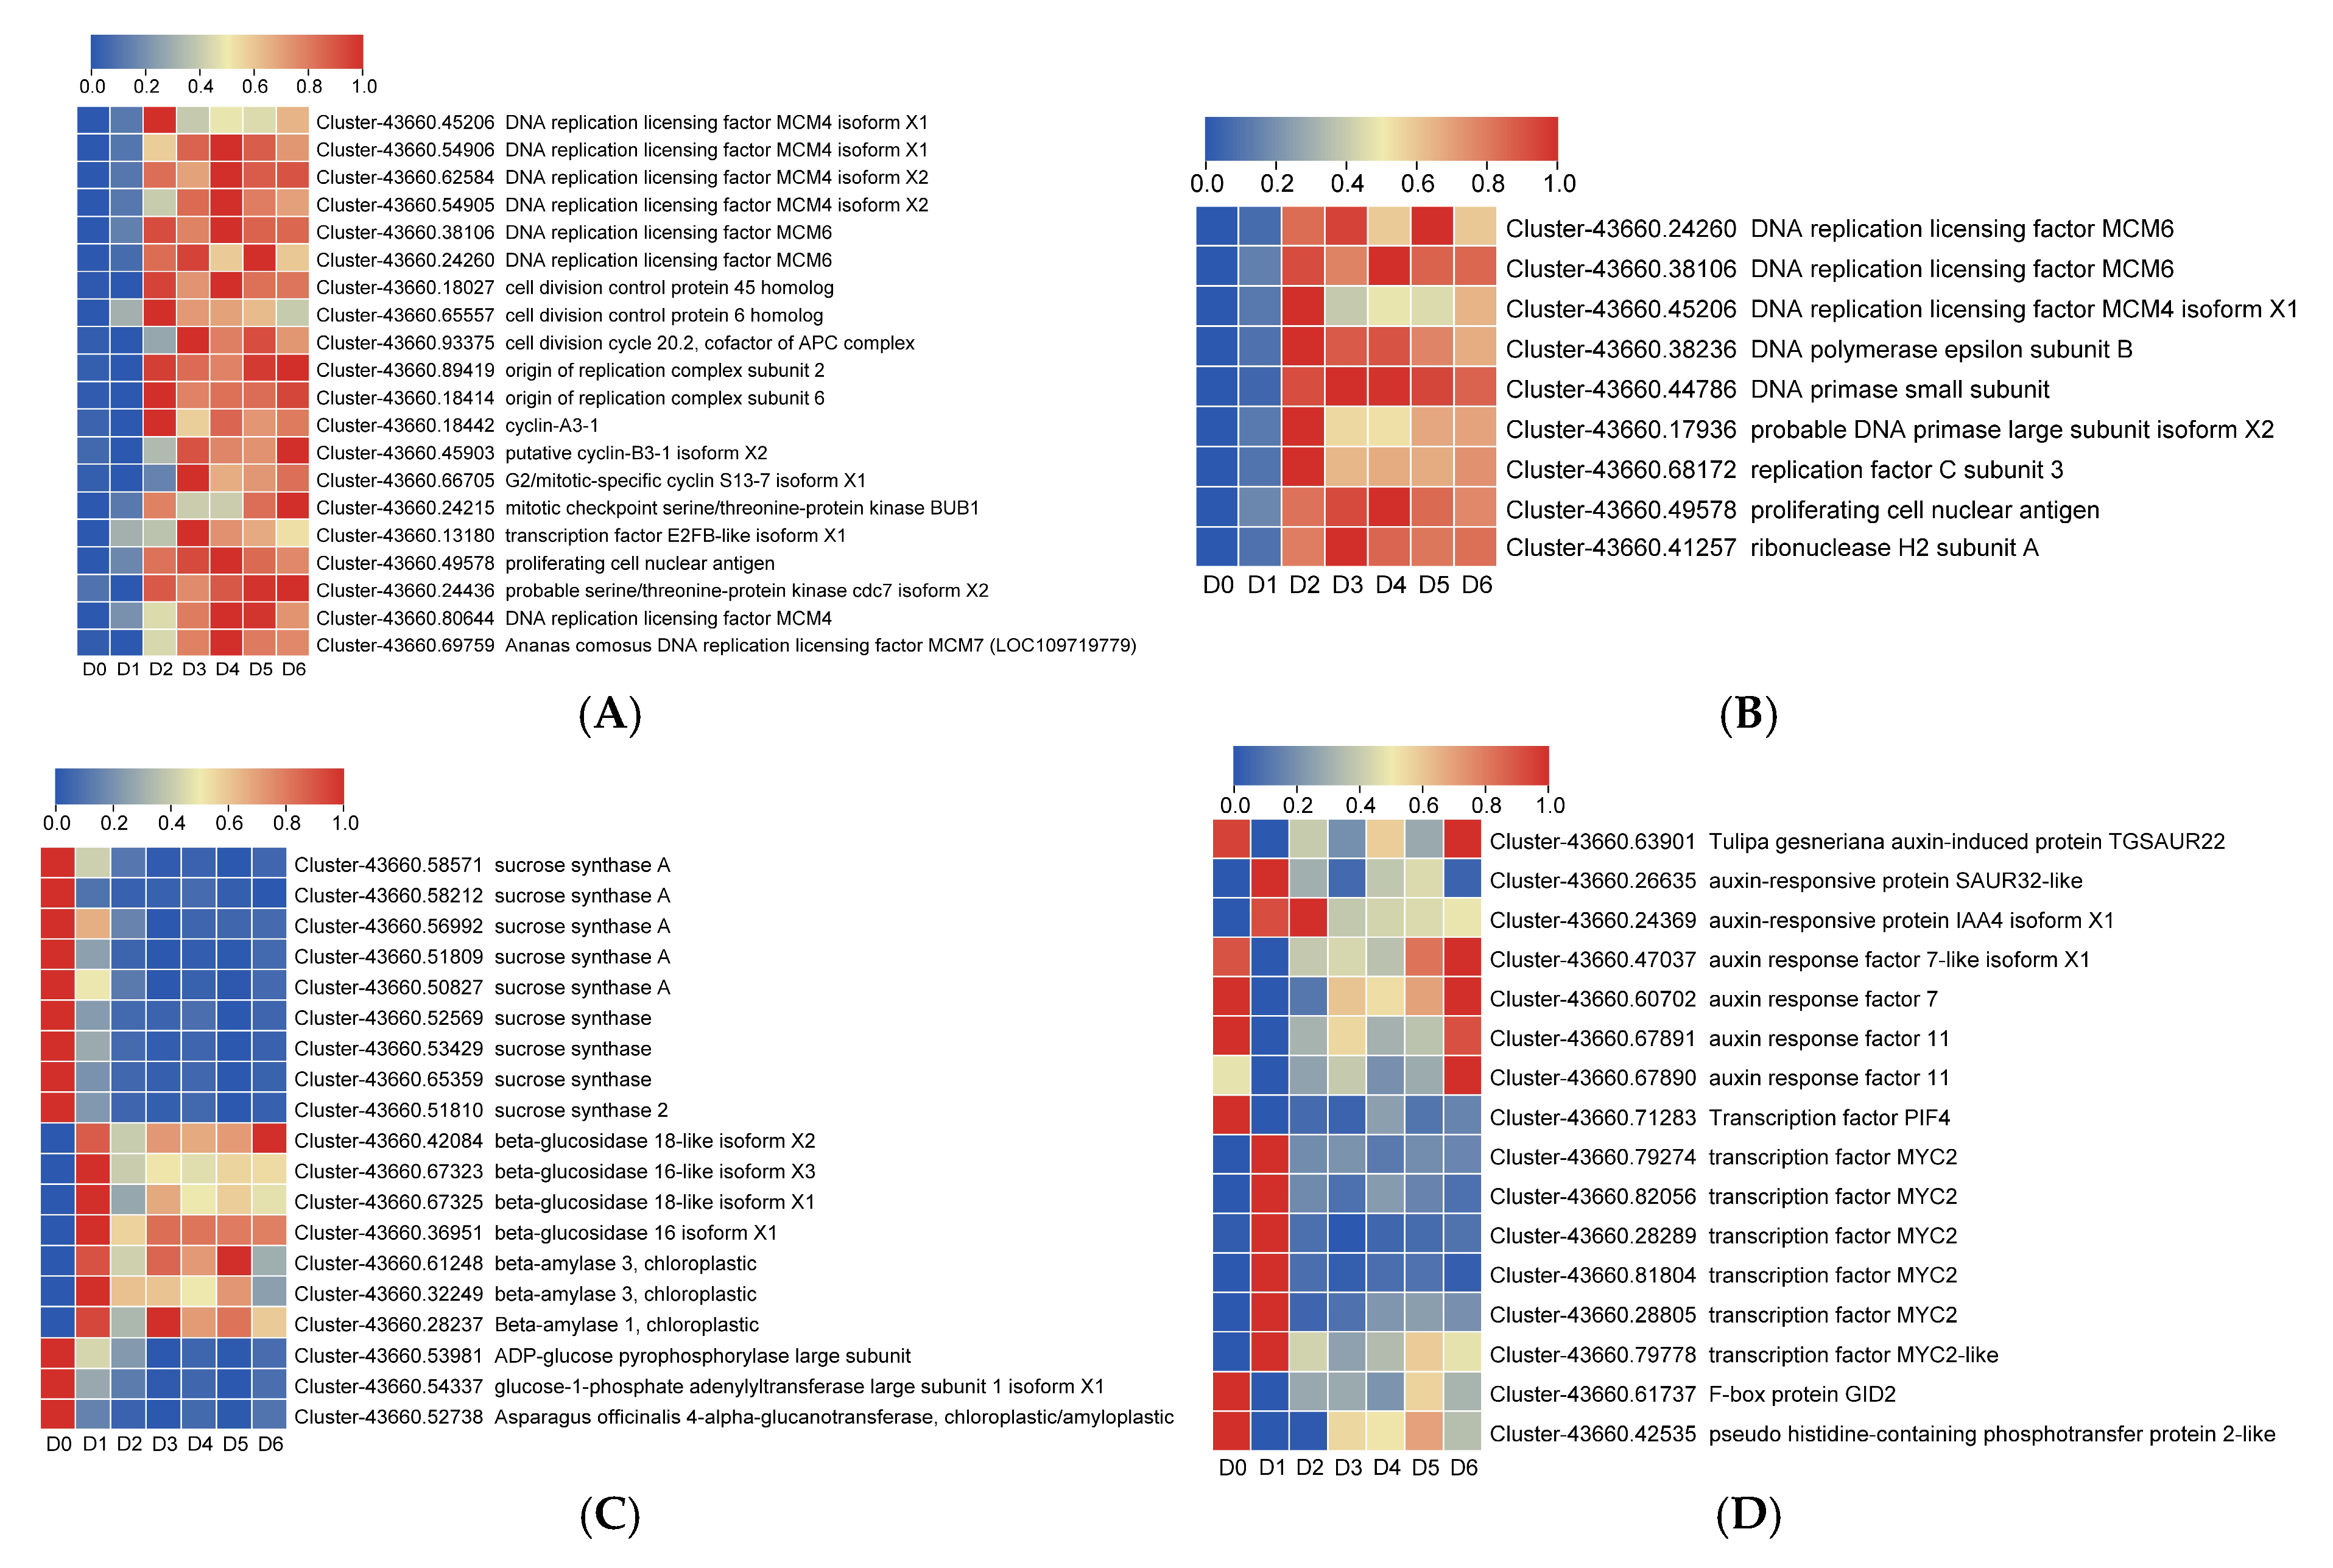
To validate the RNA-seq data, qRT-PCR was performed on the DEGs identified in four key pathways. After NCBI BLAST v2.17 comparisons and removing duplicates, we obtained 16 DEGs in the cell cycle pathway, 7 in DNA replication, 9 in starch and sucrose metabolism, and 8 in plant hormone signal transduction, with 2 shared between DNA replication and cell cycle pathways (Figure 7A–D).
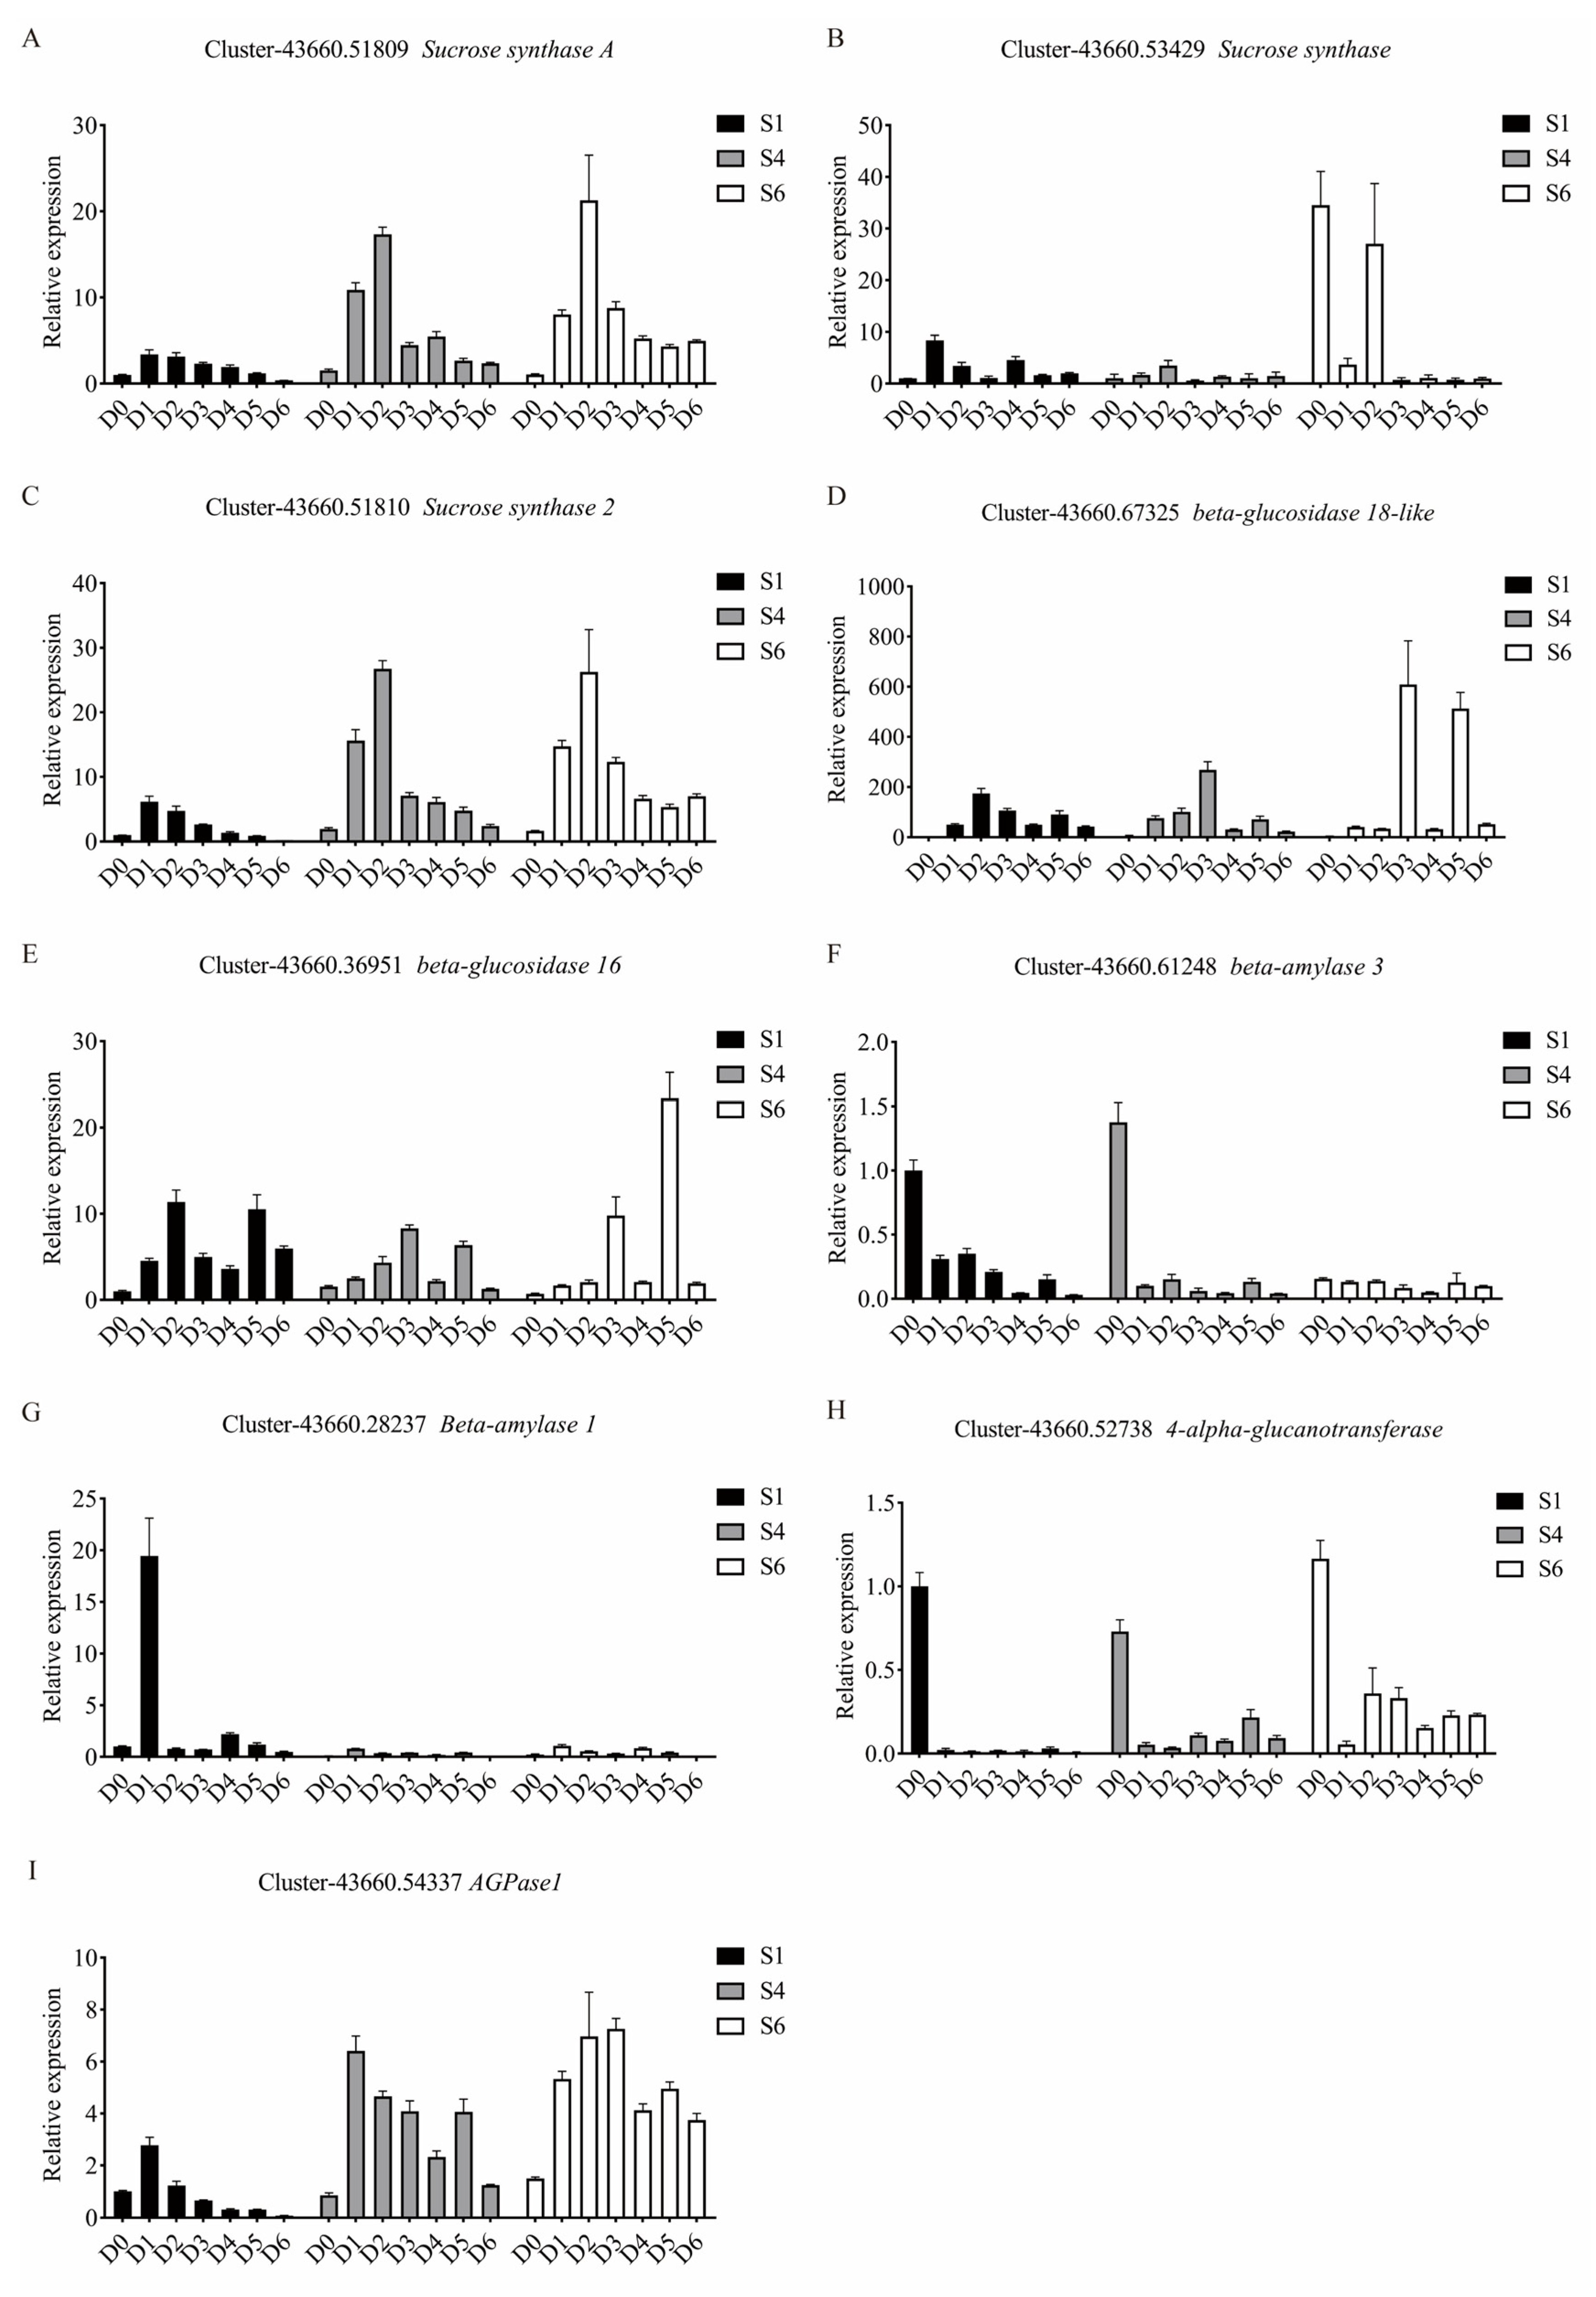
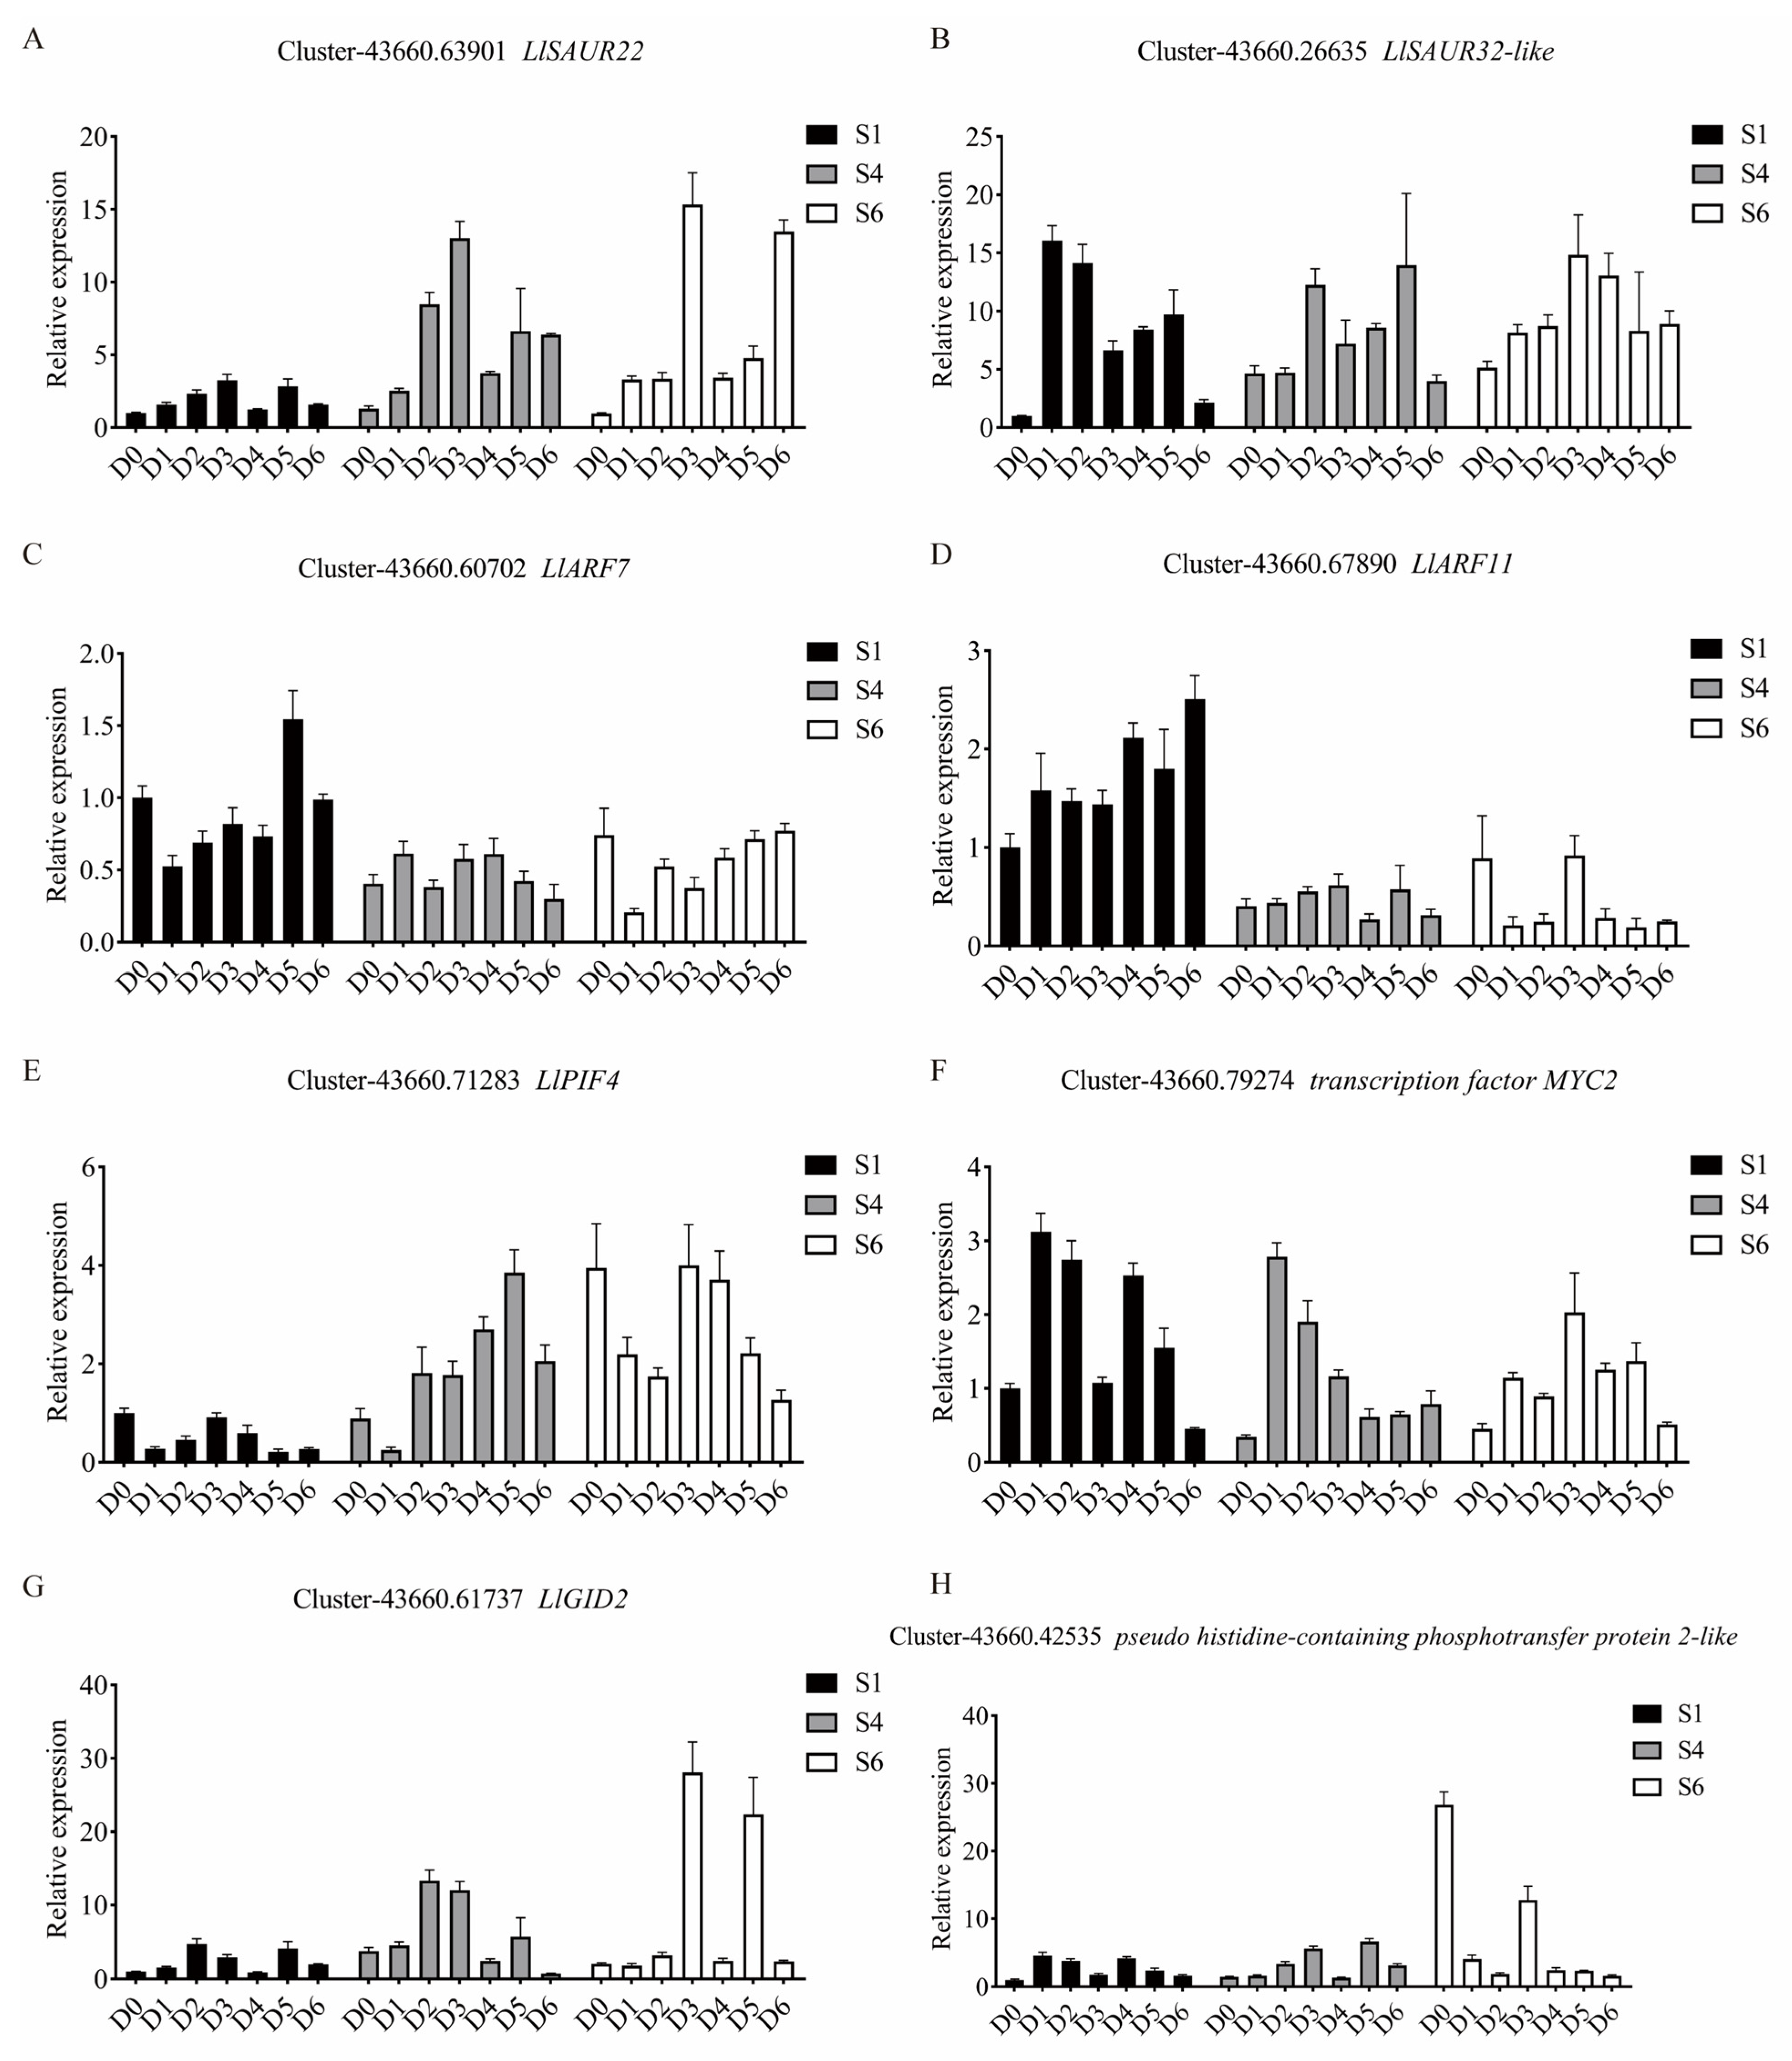
The qRT-PCR results for S1, S4, and S6 samples showed gene expression trends that were largely consistent with the RNA-seq data (Figure 8, Figure 9, Figure 10 and Figure 11), particularly in the cell cycle, DNA replication, and plant hormone signal transduction pathways. In the starch and sucrose metabolism pathway, most genes also aligned with the RNA-seq data, except for sucrose synthase (Cluster-43660.51809, Cluster-43660.53429, Cluster-43660.51810), β-α amylase (Cluster-43660.61248), and 4-α glucose transferase (Cluster-43660.52738).

4. Discussion

Research indicates that bulblet initiation shares similarities with axillary bud formation [26,27] and is regulated by carbohydrates and hormones [13]. Bulblet formation typically begins at the detachment site of scales and bulbs, where trauma signals are crucial. This aligns with reports of de novo regeneration of shoots and roots in many other plants [28]. Bulblets arise from the base of exfoliated scales, aligning with petiole meristem regeneration. While most scale anatomy studies focus on the bulb base, which is the relationship between “sink” and “source” [29,30], there are relatively few detailed reports on the morphological changes during bulblet initiation [31]. Pericycle cells, vital for monocot root and leaf development, show totipotency [32,33]. Previous studies suggest lily bulblets originate from cambium cells near vascular bundles [34]. This study chronologically and anatomically clarifies cell changes before meristem formation, highlighting pericycle-adjacent cambium cells’ role in bulblet development.
In this study, full-length transcripts of L. lancifolium bulblet initiation were obtained using Illumina NovaSeq 6000 sequencing platforms. High-throughput sequencing is widely used in plants, especially those without sequenced genomes, providing data for gene annotation and molecular mechanism analysis [35,36]. The data derived from this technology serve as a robust foundation for gene annotation and the in-depth analysis of the molecular mechanisms underlying various biological processes. For instance, it has been instrumental in studies of lily bulblet regeneration, lily bulbil regeneration, and Lycoris radiata bulblet regeneration [5,13,18]. Throughout the L. lancifolium bulblet initiation process, our transcriptome analysis identified DEGs associated with cell cycle regulation, DNA replication, plant hormone signal transduction, and starch/sucrose metabolic pathways. These findings indicate that DEGs within these key KEGG pathways significantly contribute to bulblet regeneration. DNA replication, a tightly regulated process, ensures genetic material is accurately transmitted [37]. To date, over 200 proteins participating in this process have been identified [38]. For instance, AtRFC4 is essential for maintaining DNA replication [39]. In Arabidopsis, partial loss of DNA polymerases results in an extended cell cycle [40,41]. Our study revealed high DNA polymerase epsilon subunit B expression in S1 but not in S4 and S6, highlighting their critical role in bulblet initiation. MCM2–7 proteins have been detected in numerous higher plants [42]. The AtMCM7 mutant halts embryo sac development at the four-nucleate stage, a phenomenon closely resembling the arrested development observed in our study’s bulblet initiation process. This suggests MCM7 may positively regulate bulblet development. AtRFC4 participates in both DNA replication and mitosis. Post-knockout of AtRFC4, embryonic cell proliferation exhibited severe delays [40], demonstrating AtRFC4’s indispensability in sustaining cell division and its essential role in DNA replication.
Auxin response factors (ARFs) play a crucial role in the entire life activities of plants. In Arabidopsis, different ARFs exert distinct effects on lateral root formation. For example, AtARF7 and AtARF19 can directly activate LBD/ASL genes to regulate lateral root formation, while the double mutants of AtARF10 and AtARF16 result in the loss of lateral root formation capability [43]. During adventitious root formation, AtARF6 and AtARF8 positively regulate this process, whereas AtARF17 negatively regulates adventitious root formation in Arabidopsis [44]. Additionally, AtARF7 and AtARF3 can synergize with AtARF5 to maintain meristems and induce leaf formation [45]. In other species, similar regulatory roles have been observed. In tomato, high expression of SlARF2 promotes lateral root formation [46], while in rice, OsARF3 is crucial for shoot regeneration [47]. Furthermore, the upregulation of SAUR32-like serves as a reliable gene expression marker and plays a key role in somatic embryogenesis in Hevea brasiliensis [48]. These studies collectively demonstrate that ARFs exhibit multiple modes of action on organ regeneration across model plants. In this study, LlARF7 and LlARF11 were found to be continuously highly expressed in S1 throughout the bulblet development process, a pattern not observed in S4 and S6. This indicates that these two genes are positively correlated with the bulblets initiation process. In Arabidopsis, ARF7 and ARF19 regulate the formation of lateral roots by directly activating the LBD/ASL genes [49]. TaAFR11 also plays an important role in the tillering process of wheat [50].
In bulbous plants, sucrose is the predominant form of soluble sugar [51], and sucrose metabolism significantly influences bulblet development. During Lycoris bulblet development, increased soluble sugar content in the scales promotes the expression of D-type cell cycle proteins, thereby accelerating bulblet development [13]. In tobacco shoot apical meristem, elevated sucrose levels influence the expression of WUS and CycD3 [52], a finding closely resembling our results. Similarly, sucrose functions as a signaling molecule during the induction of Lilium sargentiae bulblets [53]. In the early stages of Lycoris bulblet formation, sucrose degradation is considered a key factor for bulblet initiation [54]; however, the sucrose content was increasing during the 1–6 days of culture, which is very similar to our research results. Specific genes, such as SUS and ADP glucose pyrophosphorylase (AGPase), are crucial for bulblet initiation [13]. Sucrose can be unloaded from the phloem into sink cells via the apoplast or symplast pathway [55]. Sucrose unloaded via the symplast pathway is absorbed through plasmodesmata or by sucrose transporters and subsequently degraded by SUS [56]. Numerous studies demonstrate that SUS is highly expressed in phloem microtubule tissue [57,58], where it facilitates phloem unloading [59]. In our study, the high expression of SUS in S4 and S6 likely facilitates this function. In gladiolus, silencing GhAGPL1 reduces the number of bulblets produced [60], yet no studies have demonstrated whether AGPase exerts similar effects on different scale regions during bulblet initiation.

5. Conclusions

In this study, it is demonstrated that during the day-by-day culture of scales, cells accumulate at the base of the scales, ultimately forming bulblet. Sucrose content at the base of the scales increased significantly during bulblet initiation. DEGs related to cell cycle, DNA replication, plant hormone signal transduction, and starch and sucrose metabolism may play a key role in regulating the early stages of bulblet initiation. The expression patterns of DEGs, combined with sucrose content measurements, demonstrated a correlation between sucrose and scale-induced bulblet initiation. This suggests that sucrose is crucial for scale-induced bulblet initiation. These findings provide valuable reference data for understanding the mechanism of bulblet initiation in L. lancifolium induced by scales.

Supplementary Materials

The following supporting information can be downloaded at: https://www.mdpi.com/article/10.3390/horticulturae11091084/s1, Table S1. Summary of transcriptome dataset values. Table S2. Number of transcripts and unigene. Table S3. Length distribution and total nucleic acid number of transcripts and unigenes. File S1. The primer sequences; File S2. DEGs show dynamic pathway enrichment during early culture stages.

Author Contributions

X.C. designed the project. C.X., P.G., J.X., X.Z., X.W., H.L., J.Q. and G.S. performed the experiments. C.X. and P.G. wrote and modified the manuscript. All authors have read and agreed to the published version of the manuscript.

Funding

This work was supported by Platform Development and Scientific and Technological Capability Enhancement for Beijing Bulb Flowers Industrial Technology Research Institute (CYJS202502) and Science and Technology innovation capacity building project of BAAFS (KJCX20240316).

Data Availability Statement

All relevant data are included within the article and its Supplementary Files.

Conflicts of Interest

All authors have read and approved this version of the article, and due care has been taken to ensure the integrity of this work. All the authors have declared no conflicts of interest.

References

  1. Hao, C.; Yang, P.; Qu, Y.; Hao, Z.; Yin, X.; Tang, Y.; Bi, M.; Xu, L.; Hu, F.; Ming, J. Sucrose function on the bulbil formation of Lilium lancifolium. Sci. Hortic. 2024, 323, 112538. [Google Scholar] [CrossRef]
  2. He, G.; Yang, P.; Cao, Y.; Tang, Y.; Wang, L.; Song, M.; Wang, J.; Xu, L.; Ming, J. Cytokinin Type-B Response Regulators Promote Bulbil Initiation in Lilium lancifolium. Int. J. Mol. Sci. 2021, 22, 3320. [Google Scholar] [CrossRef] [PubMed]
  3. Wang, M.; Li, J.; Pan, W.; Sang, Q.; Liang, J.; Zhang, X.; Kang, S.; Zhang, M.; Zhang, X.; Yu, X.; et al. Auxin regulates bulbil development by affecting carbohydrate metabolism in Lilium lancifolium. Sci. Hortic. 2025, 341, 113972. [Google Scholar] [CrossRef]
  4. Askari, N.; Visser, R.G.F. The role of scale explants in the growth of regenerating lily bulblets in vitro. Plant Cell Tissue Organ Cult. (PCTOC) 2022, 149, 589–598. [Google Scholar] [CrossRef]
  5. Gao, C.; Zhang, L.; Xu, Y.; Liu, Y.; Xiao, X.; Cui, L.; Xia, Y.; Wu, Y.; Ren, Z. Full-length transcriptome analysis revealed that 2,4-dichlorophenoxyacetic acid promoted in vitro bulblet initiation in lily by affecting carbohydrate metabolism and auxin signaling. Front. Plant Sci. 2023, 14, 1236315. [Google Scholar] [CrossRef]
  6. Wu, Y.; Ren, Z.; Gao, C.; Sun, M.; Li, S.; Min, R.; Wu, J.; Li, D.; Wang, X.; Wei, Y.; et al. Change in Sucrose Cleavage Pattern and Rapid Starch Accumulation Govern Lily Shoot-to-Bulblet Transition in vitro. Front. Plant Sci. 2020, 11, 564713. [Google Scholar] [CrossRef]
  7. Sang, Y.L.; Cheng, Z.J.; Zhang, X.S. Plant stem cells and de novo organogenesis. New Phytol. 2018, 218, 1334–1339. [Google Scholar] [CrossRef]
  8. Sugimoto, K.; Jiao, Y.; Meyerowitz, E.M. Arabidopsis regeneration from multiple tissues occurs via a root development pathway. Dev. Cell 2010, 18, 463–471. [Google Scholar] [CrossRef]
  9. Xu, L.; Huang, H. Genetic and epigenetic controls of plant regeneration. Curr. Top. Dev. Biol. 2014, 108, 1–33. [Google Scholar]
  10. Liu, J.; Sheng, L.; Xu, Y.; Li, J.; Yang, Z.; Huang, H.; Xu, L. WOX11 and 12 are involved in the first-step cell fate transition during de novo root organogenesis in Arabidopsis. Plant Cell 2014, 26, 1081–1093. [Google Scholar] [CrossRef]
  11. Bavnhøj, L.; Driller, J.H.; Zuzic, L.; Stange, A.D.; Schiøtt, B.; Pedersen, B.P. Structure and sucrose binding mechanism of the plant SUC1 sucrose transporter. Nat. Plants 2023, 9, 938–950. [Google Scholar] [CrossRef]
  12. Li, W.; Huang, D.; Wang, B.; Hou, X.; Zhang, R.; Yan, M.; Liao, W. Changes of starch and sucrose content and related gene expression during the growth and development of Lanzhou lily bulb. PLoS ONE 2022, 17, e0262506. [Google Scholar] [CrossRef] [PubMed]
  13. Xu, J.; Li, Q.; Yang, L.; Li, X.; Wang, Z.; Zhang, Y. Changes in carbohydrate metabolism and endogenous hormone regulation during bulblet initiation and development in Lycoris radiata. BMC Plant Biol. 2020, 20, 180. [Google Scholar] [CrossRef]
  14. Sun, H.; He, L.; Wang, W.; Jia, Z.; Li, T. Mechanism of Starch-Sucrose Metabolism Regulated by IBA asWell as GA3 During Scale Cutting Propagation in Lilium. Sci. Agric. Sin. 2011, 44, 798–806. [Google Scholar]
  15. Ren, Z.M.; Zhang, D.; Jiao, C.; Li, D.Q.; Wu, Y.; Wang, X.Y.; Gao, C.; Lin, Y.F.; Ruan, Y.L.; Xia, Y.P. Comparative transcriptome and metabolome analyses identified the mode of sucrose degradation as a metabolic marker for early vegetative propagation in bulbs of Lycoris. Plant J. Cell Mol. Biol. 2022, 112, 115–134. [Google Scholar] [CrossRef]
  16. Zhang, L.; Li, X.H.; Gao, Z.; Shen, S.; Liang, X.G.; Zhao, X.; Lin, S.; Zhou, S.L. Regulation of maize kernel weight and carbohydrate metabolism by abscisic acid applied at the early and middle post-pollination stages in vitro. J. Plant Physiol. 2017, 216, 1–10. [Google Scholar] [CrossRef]
  17. Kumar, S.; Kashyap, M.; Sharma, D.R. In vitro regeneration and bulblet growth from lily bulbscale explants as affected by retardants, sucrose and irradiance. Biol. Plant. 2005, 49, 629–632. [Google Scholar] [CrossRef]
  18. Xin, Y.; Chen, X.; Liang, J.; Wang, S.; Pan, W.; Wu, J.; Zhang, M.; Zaccai, M.; Yu, X.; Zhang, X.; et al. Auxin regulates bulbil initiation by mediating sucrose metabolism in Lilium lancifolium. Hortic. Res. 2024, 11, uhae054. [Google Scholar] [CrossRef]
  19. He, G.; Yang, P.; Tang, Y.; Cao, Y.; Qi, X.; Xu, L.; Ming, J. Mechanism of exogenous cytokinins inducing bulbil formation in Lilium lancifolium in vitro. Plant Cell Rep. 2020, 39, 861–872. [Google Scholar] [CrossRef]
  20. Georgelis, N.; Fencil, K.; Richael, C.M. Validation of a rapid and sensitive HPLC/MS method for measuring sucrose, fructose and glucose in plant tissues. Food Chem. 2018, 262, 191–198. [Google Scholar] [CrossRef]
  21. Mo, J.; Qu, Y.; He, G.; Yang, P.; Wang, L.; Zhang, L.; Wu, X.; Zhang, D.; Li, L.; Ming, J. Effect of exogenous 6-BA induced Lilium lancifolium bulblets formation in aerial cultivation. Sci. Hortic. 2023, 309, 111644. [Google Scholar] [CrossRef]
  22. Sun, J.; Lu, J.; Bai, M.; Chen, Y.; Wang, W.; Fan, C.; Liu, J.; Ning, G.; Wang, C. Phytochrome-interacting factors interact with transcription factor CONSTANS to suppress flowering in rose. Plant Physiol. 2021, 186, 1186–1201. [Google Scholar] [CrossRef]
  23. Zhang, J.; Gai, M.Z.; Xue, B.Y.; Jia, N.N.; Sun, H.M. The use of miRNAs as reference genes for miRNA expression normalization during Lilium somatic embryogenesis by real-time reverse transcription PCR analysis. Plant Cell Tissue Organ Cult. 2016, 129, 105–118. [Google Scholar] [CrossRef]
  24. Nachamkin, I.; Panaro, N.J.; Li, M.; Ung, H.; Yuen, P.K.; Kricka, L.J.; Wilding, P. Agilent 2100 bioanalyzer for restriction fragment length polymorphism analysis of the Campylobacter jejuni flagellin gene. J. Clin. Microbiol. 2001, 39, 754–757. [Google Scholar] [CrossRef]
  25. Love, M.I.; Huber, W.; Anders, S. Moderated estimation of fold change and dispersion for RNA-seq data with DESeq2. Genome Biol. 2014, 15, 550. [Google Scholar] [CrossRef]
  26. Trapnell, C.; Williams, B.A.; Pertea, G.; Mortazavi, A.; Kwan, G.; van Baren, M.J.; Salzberg, S.L.; Wold, B.J.; Pachter, L. Transcript assembly and quantification by RNA-Seq reveals unannotated transcripts and isoform switching during cell differentiation. Nat. Biotechnol. 2010, 28, 511–515. [Google Scholar] [CrossRef]
  27. Liang, J.; Wu, Z.; Zheng, J.; Koskela, E.A.; Fan, L.; Fan, G.; Gao, D.; Dong, Z.; Hou, S.; Feng, Z.; et al. The GATA factor HANABA TARANU promotes runner formation by regulating axillary bud initiation and outgrowth in cultivated strawberry. Plant J. Cell Mol. Biol. 2022, 110, 1237–1254. [Google Scholar] [CrossRef] [PubMed]
  28. Li, X.; Wang, C.; Cheng, J.; Zhang, J.; da Silva, J.A.; Liu, X.; Duan, X.; Li, T.; Sun, H. Transcriptome analysis of carbohydrate metabolism during bulblet formation and development in Lilium davidii var. unicolor. BMC Plant Biol. 2014, 14, 358. [Google Scholar] [CrossRef] [PubMed]
  29. Duclercq, J.; Sangwan-Norreel, B.; Catterou, M.; Sangwan, R.S. De novo shoot organogenesis: From art to science. Trends Plant Sci. 2011, 16, 597–606. [Google Scholar] [CrossRef]
  30. Yang, P.; Xu, L.; Xu, H.; Tang, Y.; He, G.; Cao, Y.; Feng, Y.; Yuan, S.; Ming, J. Histological and Transcriptomic Analysis during Bulbil Formation in Lilium lancifolium. Front. Plant Sci. 2017, 8, 1508. [Google Scholar] [CrossRef]
  31. Yang, P.P.; Xu, L.F.; Xu, H.; He, G.R.; Feng, Y.Y.; Cao, Y.W.; Tang, Y.C.; Yuan, S.X.; Ming, J. Morphological and anatomical observation during the formation of bulbils in Lilium lancifolium. Caryologia G. Citol. Citosistematica Citogenet. 2018, 71, 146–149. [Google Scholar] [CrossRef]
  32. Wu, S.S.; Chen, L.N.; Zhang, Q.X.; Lv, Y.M. Source and sink changes of lily bulb and the transportation role of the basal plate during the development of oriental hybrid lily ‘Sorbonne’. J. Food Agric. Environ. 2012, 10, 1213–1219. [Google Scholar]
  33. Liu, Z.; Li, J.; Wang, L.; Li, Q.; Lu, Q.; Yu, Y.; Li, S.; Bai, M.Y.; Hu, Y.; Xiang, F. Repression of callus initiation by the miRNA-directed interaction of auxin-cytokinin in Arabidopsis thaliana. Plant J. Cell Mol. Biol. 2016, 87, 391–402. [Google Scholar] [CrossRef]
  34. Zeng, M.; Hu, B.; Li, J.; Zhang, G.; Ruan, Y.; Huang, H.; Wang, H.; Xu, L. Stem cell lineage in body layer specialization and vascular patterning of rice root and leaf. Sci. Bull. 2016, 61, 847–858. [Google Scholar] [CrossRef]
  35. Marinangeli, P.A.; Hernández, L.F.; Pellegrini, C.P.; Curvetto, N.R. Bulblet Differentiation after Scale Propagation of Lilium longiflorum. J. Am. Soc. Hortic. Sci. 2003, 128, 324–329. [Google Scholar] [CrossRef]
  36. Xin, Y.; Pan, W.; Chen, X.; Liu, Y.; Zhang, M.; Chen, X.; Yang, F.; Li, J.; Wu, J.; Du, Y.; et al. Transcriptome profiling reveals key genes in regulation of the tepal trichome development in Lilium pumilum D.C. Plant Cell Rep. 2021, 40, 1889–1906. [Google Scholar] [CrossRef] [PubMed]
  37. Li, W.; Wang, Y.; Ren, H.; Guo, Z.; Li, N.; Zhao, C.; Xie, Z. Transcriptomic and physiological analyses identifying Lanzhou lily (Lilium davidii var. unicolor) drought adaptation strategies. Hortic. Plant J. 2023, 9, 13. [Google Scholar] [CrossRef]
  38. Long, Y.P.; Xie, D.J.; Zhao, Y.Y.; Shi, D.Q.; Yang, W.C. BICELLULAR POLLEN 1 is a modulator of DNA replication and pollen development in Arabidopsis. New Phytol. 2019, 222, 588–603. [Google Scholar] [CrossRef] [PubMed]
  39. Cotterill, S.; Kearsey, S.E. DNAReplication: A database of information and resources for the eukaryotic DNA replication community. Nucleic Acids Res. 2009, 37, D837–D839. [Google Scholar] [CrossRef]
  40. Qian, J.; Chen, Y.; Hu, Y.; Deng, Y.; Liu, Y.; Li, G.; Zou, W.; Zhao, J. Arabidopsis replication factor C4 is critical for DNA replication during the mitotic cell cycle. Plant J. Cell Mol. Biol. 2018, 94, 288–303. [Google Scholar] [CrossRef]
  41. Pedroza-García, J.A.; Mazubert, C.; Del Olmo, I.; Bourge, M.; Domenichini, S.; Bounon, R.; Tariq, Z.; Delannoy, E.; Piñeiro, M.; Jarillo, J.A.; et al. Function of the Plant DNA Polymerase Epsilon in Replicative Stress Sensing, a Genetic Analysis. Plant Physiol. 2017, 173, 1735–1749. [Google Scholar] [CrossRef] [PubMed]
  42. Jenik, P.D.; Jurkuta, R.E.; Barton, M.K. Interactions between the cell cycle and embryonic patterning in Arabidopsis uncovered by a mutation in DNA polymerase epsilon. Plant Cell 2005, 17, 3362–3377. [Google Scholar] [CrossRef] [PubMed]
  43. Springer, P.S.; Holding, D.R.; Groover, A.; Yordan, C.; Martienssen, R.A. The essential Mcm7 protein PROLIFERA is localized to the nucleus of dividing cells during the G(1) phase and is required maternally for early Arabidopsis development. Development 2000, 127, 1815–1822. [Google Scholar] [CrossRef]
  44. Wang, J.W.; Wang, L.J.; Mao, Y.B.; Cai, W.J.; Xue, H.W.; Chen, X.Y. Control of root cap formation by MicroRNA-targeted auxin response factors in Arabidopsis. Plant Cell 2005, 17, 2204–2216. [Google Scholar] [CrossRef] [PubMed]
  45. Mallory, A.C.; Bartel, D.P.; Bartel, B. MicroRNA-directed regulation of Arabidopsis AUXIN RESPONSE FACTOR17 is essential for proper development and modulates expression of early auxin response genes. Plant Cell 2005, 17, 1360–1375. [Google Scholar] [CrossRef]
  46. Schuetz, M.; Fidanza, M.; Mattsson, J. Identification of Auxin Response Factor-Encoding Genes Expressed in Distinct Phases of Leaf Vein Development and with Overlapping Functions in Leaf Formation. Plants 2019, 8, 242. [Google Scholar] [CrossRef]
  47. Ren, Z.; Liu, R.; Gu, W.; Dong, X. The Solanum lycopersicum auxin response factor SlARF2 participates in regulating lateral root formation and flower organ senescence. Plant Sci. Int. J. Exp. Plant Biol. 2017, 256, 103–111. [Google Scholar] [CrossRef]
  48. Wang, Y.; Li, H.L.; Zhou, Y.K.; Guo, D.; Zhu, J.H.; Peng, S.Q. Transcriptomes analysis reveals novel insight into the molecular mechanisms of somatic embryogenesis in Hevea brasiliensis. BMC Genom. 2021, 22, 183. [Google Scholar] [CrossRef]
  49. Okushima, Y.; Fukaki, H.; Onoda, M.; Theologis, A.; Tasaka, M. ARF7 and ARF19 Regulate Lateral Root Formation via Direct Activation of LBD/ASL Genes in Arabidopsis. Plant Cell 2007, 19, 118–130. [Google Scholar] [CrossRef]
  50. Li, J.; Jiang, Y.; Zhang, J.; Ni, Y.; Jiao, Z.; Li, H.; Wang, T.; Zhang, P.; Guo, W.; Li, L.; et al. Key auxin response factor (ARF) genes constraining wheat tillering of mutant dmc. PeerJ 2021, 9, e12221. [Google Scholar] [CrossRef] [PubMed]
  51. Shin, K.S.; Chakrabarty, D.; Paek, K.Y. Sprouting rate, change of carbohydrate contents and related enzymes during cold treatment of lily bulblets regenerated in vitro. Sci. Hortic. 2002, 96, 195–204. [Google Scholar] [CrossRef]
  52. Nguyen, Q.A.; Luan, S.; Wi, S.G.; Bae, H.; Lee, D.S.; Bae, H.J. Pronounced Phenotypic Changes in Transgenic Tobacco Plants Overexpressing Sucrose Synthase May Reveal a Novel Sugar Signaling Pathway. Front. Plant Sci. 2015, 6, 1216. [Google Scholar] [CrossRef]
  53. Gao, S.; Zhu, Y.; Zhou, L.; Fu, X.; Lei, T.; Chen, Q.; Yu, X.; Zhou, Y.; Li, W.; Hu, J.; et al. Sucrose signaling function on the formation and swelling of bulblets of Lilium sargentiae E.H. Wilson. Plant Cell Tissue Organ Cult. Int. J. Vitr. Cult. High. Plants 2018, 135, 11. [Google Scholar] [CrossRef]
  54. Ren, Z.; Xu, Y.; Lvy, X.; Zhang, D.; Gao, C.; Lin, Y.; Liu, Y.; Wu, Y.; Xia, Y. Early Sucrose Degradation and the Dominant Sucrose Cleavage Pattern Influence Lycoris sprengeri Bulblet Regeneration In Vitro. Int. J. Mol. Sci. 2021, 22, 11890. [Google Scholar] [CrossRef] [PubMed]
  55. Ruan, Y.L. Sucrose metabolism: Gateway to diverse carbon use and sugar signaling. Annu. Rev. Plant Biol. 2014, 65, 33–67. [Google Scholar] [CrossRef]
  56. Lemoine, R. Sucrose transporters in plants: Update on function and structure. Biochim. Et Biophys. Acta 2000, 1465, 246–262. [Google Scholar] [CrossRef] [PubMed]
  57. Bieniawska, Z.; Paul Barratt, D.H.; Garlick, A.P.; Thole, V.; Kruger, N.J.; Martin, C.; Zrenner, R.; Smith, A.M. Analysis of the sucrose synthase gene family in Arabidopsis. Plant J. Cell Mol. Biol. 2007, 49, 810–828. [Google Scholar] [CrossRef]
  58. Goren, S.; Lugassi, N.; Stein, O.; Yeselson, Y.; Schaffer, A.A.; David-Schwartz, R.; Granot, D. Suppression of sucrose synthase affects auxin signaling and leaf morphology in tomato. PLoS ONE 2017, 12, e0182334. [Google Scholar] [CrossRef]
  59. Barratt, D.H.; Derbyshire, P.; Findlay, K.; Pike, M.; Wellner, N.; Lunn, J.; Feil, R.; Simpson, C.; Maule, A.J.; Smith, A.M. Normal growth of Arabidopsis requires cytosolic invertase but not sucrose synthase. Proc. Natl. Acad. Sci. USA 2009, 106, 13124–13129. [Google Scholar] [CrossRef]
  60. Seng, S.; Wu, J.; Liang, J.; Zhang, F.; Yi, M. Silencing GhAGPL1 Reduces the Quality and Quantity of Corms and Cormels in Gladiolus. J. Am. Soc. Hortic. Sci. 2017, 142, 119–125. [Google Scholar] [CrossRef]
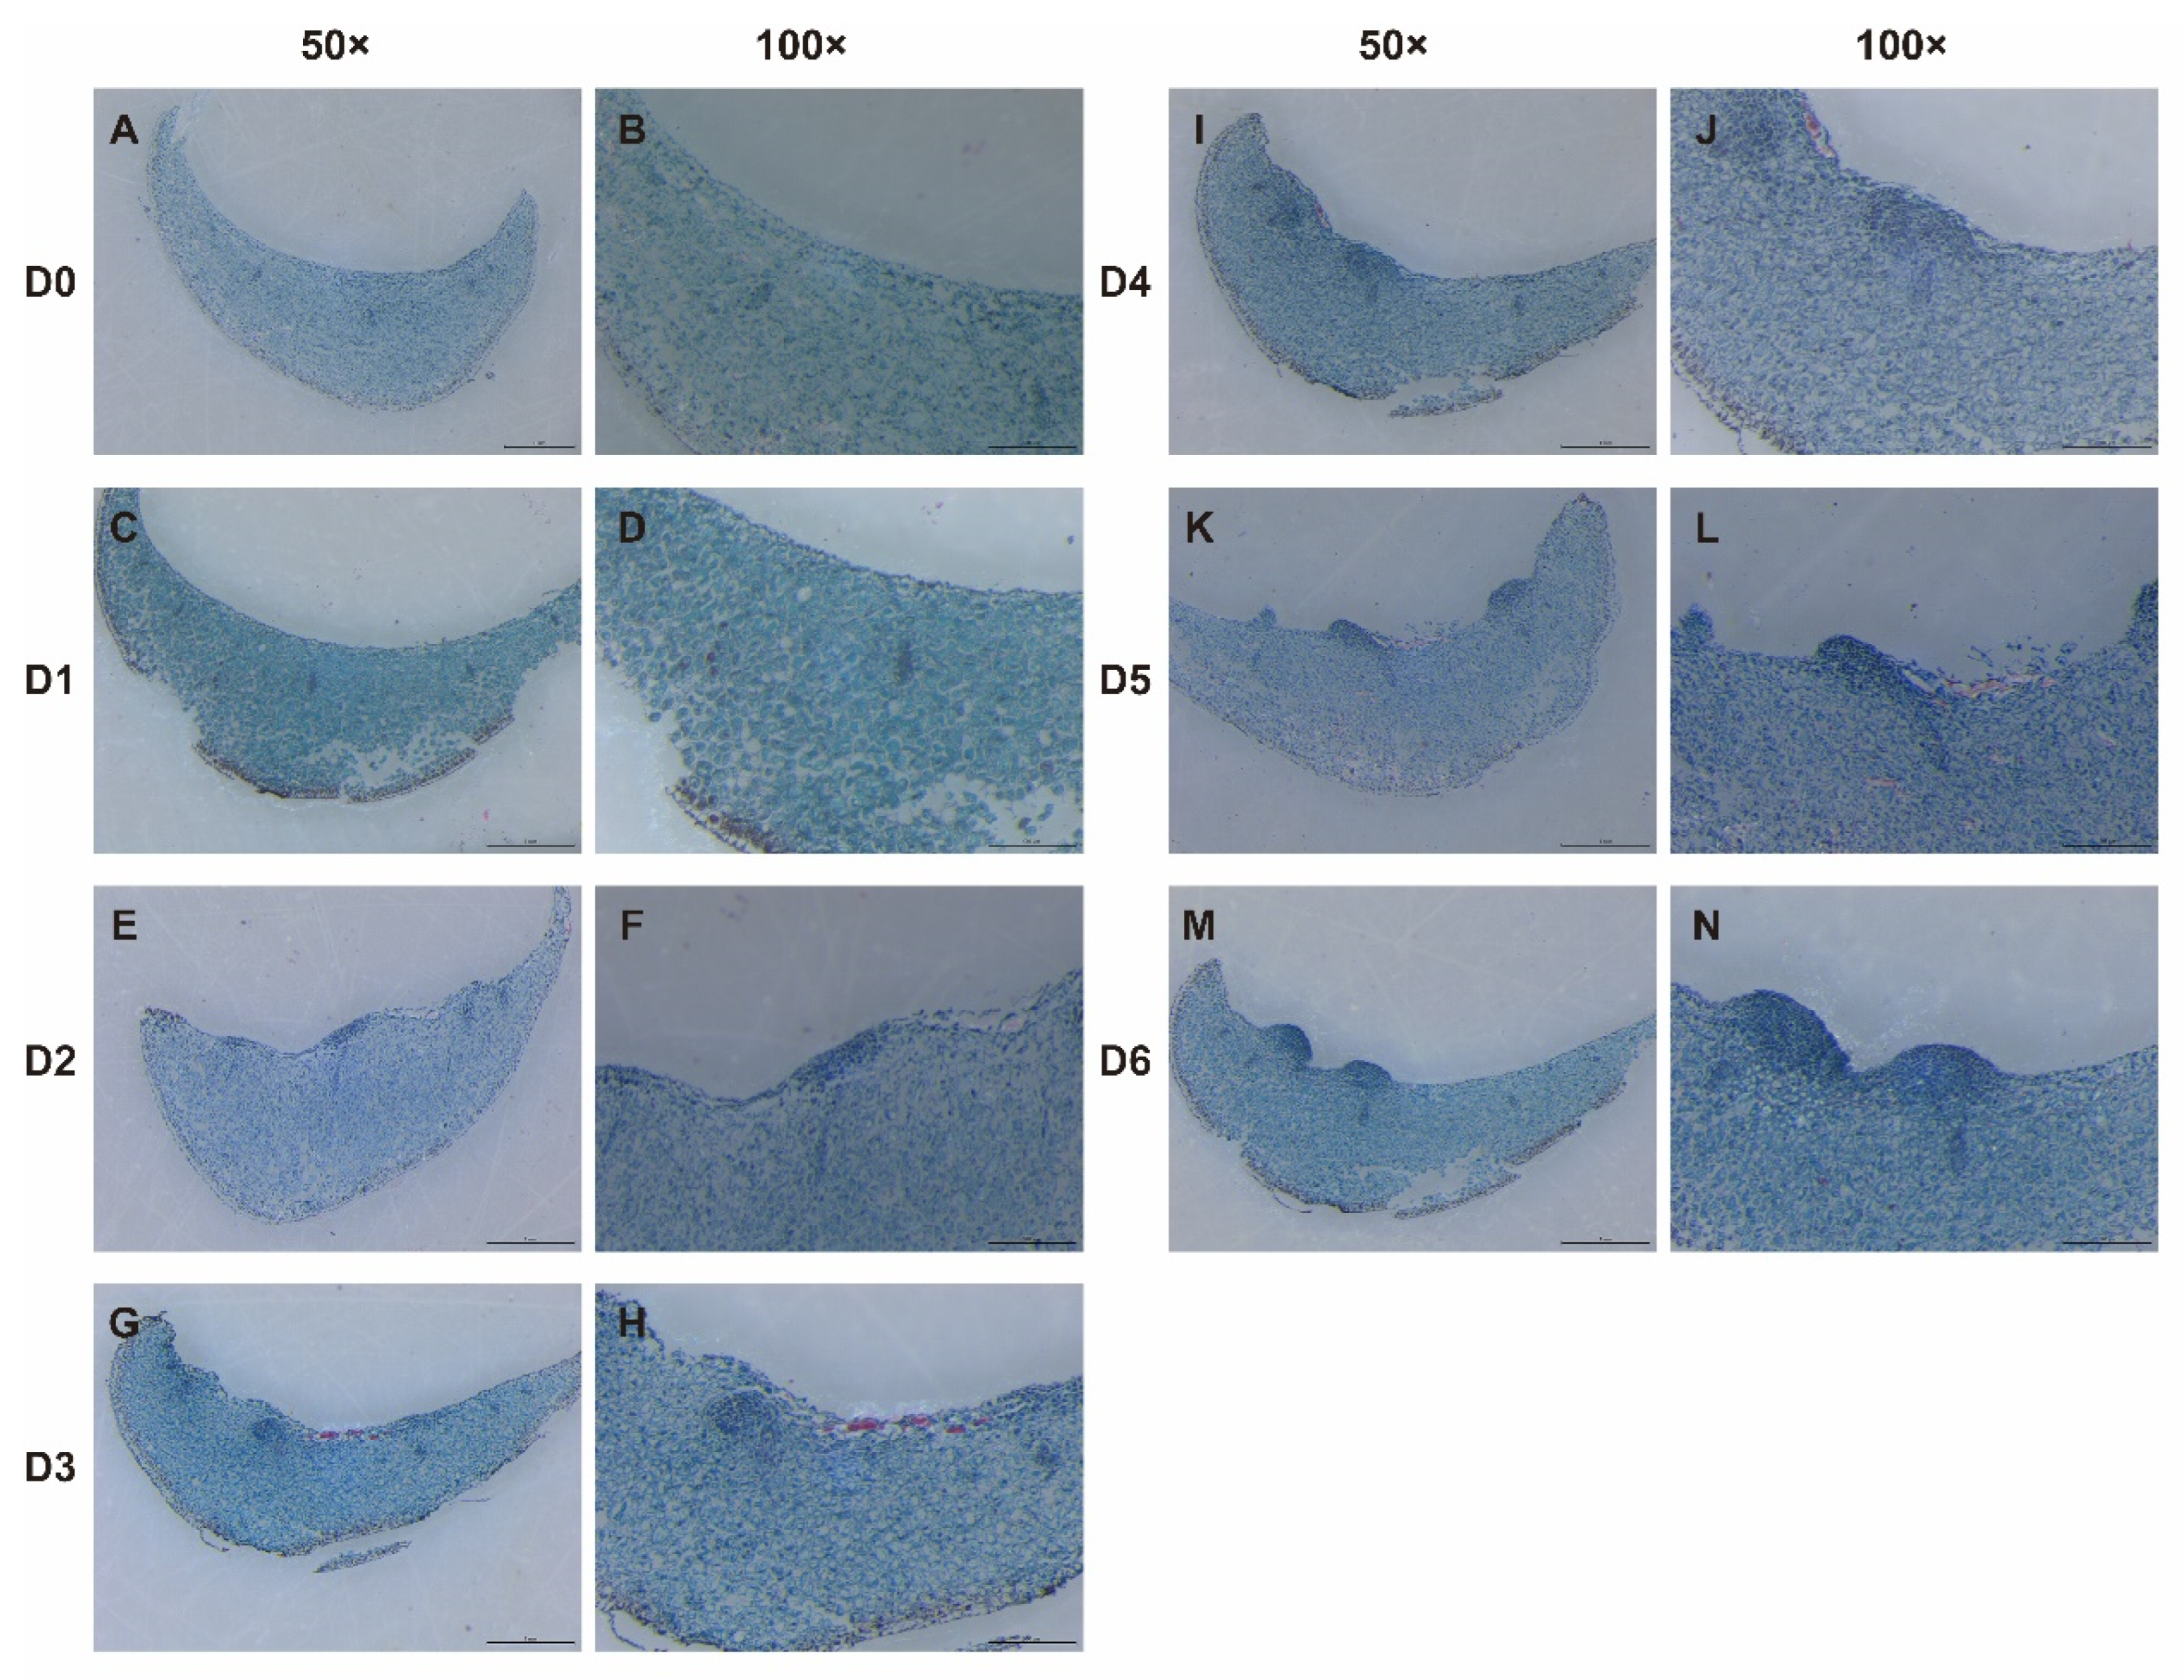
Figure 1. Paraffin sections of bulblet cultured in S1 for 0–6 days (D0: Scales cultured for 0 days, (A) Image under 50× microscope, (B) image under 100× microscope. D1: Scales cultured for 1 days, (C) Image under 50× microscope, (D) image under 100× microscope. D2: Scales cultured for 2 days, (E) Image under 50× microscope, (F) image under 100× microscope. D3: Scales cultured for 3 days, (G) Image under 50× microscope, (H) image under 100× microscope. D4: Scales cultured for 4 days, (I) Image under 50× microscope, (J) image under 100× microscope. D5: Scales cultured for 5 days, (K) Image under 50× microscope, (L) image under 100× microscope. and D6: Scales cultured for 6 days, (M) Image under 50× microscope, (N) image under 100× microscope.).
Horticulturae 11 01084 g001
Figure 2. Sucrose, glucose, and fructose content. (A) Sucrose. (B) Glucose. (C) Fructose. The scales form a layer of one millimeter from the base to the top. S1 represents the first layer, S2 represents the second layer, and so on until the 10th layer. The scales were cultured for 6 days, D0 represented the 0th day of culture, D1 represented the 1st day of culture, and the culture lasted until the 6th day.
Horticulturae 11 01084 g002
Figure 3. RNA-seq data analyzes. (AC) The DEG counts compared with S1, S4, and S6. (DF) The counts of DEG significantly enriched in KEGG pathway. (GJ) The DEG counts involved in plant hormone signal transduction, DNA replication, Cell cycle and starch and sucrose metabolism. The vertical axis represents DEG counts. ALL represents the sum of up-regulated and down-regulated genes, represented in black, UP represents the number of up-regulated genes, represented in white, and DOWN represents the number of down-regulated genes, represented in gray. KEGG pathway enrichment uses a padj value less than 0.05 as the threshold for significant enrichment.
Horticulturae 11 01084 g003
Figure 4. Correlation analysis and screening between S1 and S4, S6 during bulblet initiation. (A) Cell cycle. (B) DNA replication. (C) Starch and sucrose metabolism. (D) Plant hormone signal transduction. The color scale from blue to red represents the FPKM from low to high.
Horticulturae 11 01084 g004
Figure 5. VENN of DEGs in four different pathways. (A) Cell cycle; (B) DNA replication; (C) starch and sucrose metabolism; (D) plant hormone signal transduction.
Horticulturae 11 01084 g005
Figure 6. Number of DEGs in four different pathway correlations and VENN screening interactions. The color scale from blue to red represents the FPKM from low to high. (A) Cell cycle; (B) DNA replication; (C) starch and sucrose metabolism; (D) plant hormone signal transduction.
Horticulturae 11 01084 g006
Figure 7. The final DEGs obtained. (A) Cell cycle; (B) DNA replication; (C) starch and sucrose metabolism; (D) Plant hormone signal transduction. The color scale from blue to red represents the FPKM from low to high.
Horticulturae 11 01084 g007
Figure 8. qRT-PCR of DEGs in cell cycle pathways. All data were means (±SE) of three independent biological replicates. (A) Cluster-43660.54905 DNA replication licensing factor MCM4; (B) Cluster-54906 DNA replication licensing factor MCM4; (C) Cluster-18027 cell division control protein 45; (D) Cluster-65557 cell division control protein 6 homolog; (E) Cluster-93375 cell division cycle 20.2; (F) Cluster-89419 origin of replication complex subunit 2; (G) Cluster-43660.18414 origin of replication complex subunit 6; (H) Cluster-43660.18442 cyclin-A3-1; (I) Cluster-43660.45903 putative cyclin-B3-1; (J) Cluster-43660.66705 G2/mitotic-specific cyclin S13-7; (K) Cluster-43660.24215 mitotic checkpoint serine/threonine-protein kinase BUB1; (L) Cluster-43660.13180 transcription factor E2FB-like; (M) Cluster-43660.24436 probable serine/threonine-protein kinase cdc7; (N) Cluster-43660.69759 DNA replication licensing factor MCM7.
Horticulturae 11 01084 g008
Figure 9. qRT-PCR of DEGs participated in DNA replication. All data were means (±SE) of three independent biological replicates. (A) Cluster-43660.49578 proliferating cell nuclear antigen; (B) Cluster-43660.38106 DNA replication licensing factor MCM6; (C) Cluster-43660.38236 DNA polymerase epsilon subunit B; (D) Cluster-43660.44786 DNA primase small subunit; (E) Cluster-43660.17936 DNA primase large subunit; (F) Cluster-43660.68172 replication factor C subunit 3; (G) Cluster-43660.41257 ribonuclease H2 subunit A.
Horticulturae 11 01084 g009
Figure 10. qRT-PCR of DEGs involved in starch and sucrose metabolism. All data were means (±SE) of three independent biological replicates. (A) Cluster-43660.51809 Sucrose synthase A; (B) Cluster-43660.53429 Sucrose synthase; (C) Cluster-43660.51810 Sucrose synthase 2; (D) Cluster-43660.67325 beta-glucosidase 18-like; (E) Cluster-43660.36951 beta-glucosidase 16; (F) Cluster-43660.61248 beta-amylase 3; (G) Cluster-43660.28237 Beta-amylase 1; (H) Cluster-43660.52738 4-alpha-glucanotransferase; (I) Cluster-43660.54337 AGPase1.
Horticulturae 11 01084 g010
Figure 11. qRT-PCR of DEGs in plant hormone signal transduction pathway. All data were means (±SE) of three independent biological replicates.(A) Cluster-43660.63901 LISAUR22; (B) Cluster-43660.26635 LISAUR32-like; (C) Cluster-43660.60702 LIARF7; (D) Cluster-43660.67890 LIARF11; (E) Cluster-43660.71283 LIPIF4; (F) Cluster-43660.79274 transcription factor MYC2; (G) Cluster-43660.61737 LIGID2; (H) Cluster-43660.42535 pseudo histidine-containing phosphotransfer protein 2-like.
Horticulturae 11 01084 g011
Disclaimer/Publisher’s Note: The statements, opinions and data contained in all publications are solely those of the individual author(s) and contributor(s) and not of MDPI and/or the editor(s). MDPI and/or the editor(s) disclaim responsibility for any injury to people or property resulting from any ideas, methods, instructions or products referred to in the content.