Article

BSA-Seq-Based Discovery of Functional InDel Markers for Seed Size Selection in Litchi (Litchi chinensis Sonn.)

1
Institute of Tropical Fruit Trees, Hainan Academy of Agricultural Sciences/Key Laboratory of Genetic Resources Evaluation and Utilization of Tropical Fruits and Vegetables (Co-Construction by Ministry and Province), Ministry of Agriculture and Rural Affairs/Key Laboratory of Tropical Fruit Tree Biology of Hainan Province, Haikou 571100, China
2
Sanya Institute of China Agricultural University, China Agricultural University, Sanya 572025, China
3
Sanya Research Institute, Hainan Academy of Agricultural Sciences, Sanya 572025, China
4
College of Horticulture, China Agricultural University, Beijing 100193, China
5
Guangdong Provincial Key Laboratory of Ornamental Plant Germplasm Innovation and Utilization, Environmental Horticulture Research Institute, Guangdong Academy of Agricultural Sciences, Guangzhou 510640, China
*
Authors to whom correspondence should be addressed.
Horticulturae 2025, 11(9), 1079; https://doi.org/10.3390/horticulturae11091079
Submission received: 6 August 2025 / Revised: 25 August 2025 / Accepted: 2 September 2025 / Published: 7 September 2025
(This article belongs to the Special Issue Latest Advances and Prospects in Germplasm of Tropical Fruits)

Abstract

As a globally significant fruit crop, litchi (Litchi chinensis Sonn.) exhibits substantial variation in seed size, which is a key determinant of fruit quality. However, the lack of molecular markers closely associated with seed-related traits has hindered targeted breeding efforts. In this study, we systematically evaluated six critical traits—single fruit weight, seed weight, seed length, seed width, edible rate, and seed-to-fruit weight ratio—across 131 early-maturing litchi accessions. Hierarchical clustering analysis (HCA) and principal component analysis (PCA) revealed a clear bifurcation of these accessions into two distinct groups based on seed size-related traits. Using bulked segregant analysis sequencing (BSA-seq), we identified a candidate genomic region (24.93–25.69 Mb) on chromosome 5, potentially regulating litchi seed size. Within this region, 1600 single-nucleotide polymorphisms (SNPs) and 314 insertion/deletion mutations (InDels) exhibited significant divergences between the extreme pools. To validate these findings, we performed PCR-based screening on 87 litchi accessions. Two InDel markers demonstrated strong phenotypic associations: Chr5_25610680_InDel showed highly significant correlations with seed weight, edible rate, seed length, seed width, and seed-to-fruit weight ratio, explaining 22.60–35.54% of phenotypic variation. Meanwhile, Chr5_25585686_InDel was significantly associated with seed weight and edible rate, accounting for 18.66% and 18.94% of the phenotypic variation, respectively. These findings provide valuable molecular markers for marker-assisted breeding of litchi seed size, offering a promising avenue to advance precision breeding in this economically important crop.

1. Introduction

Litchi chinensis Sonn., a member of the Sapindaceae family, is an important evergreen fruit crop widely cultivated in tropical and subtropical regions worldwide. With over 3500 years of cultivation history, China remains the largest producer of litchi, with major production areas concentrated in Guangdong, Guangxi, Fujian, Hainan, and Yunnan provinces [1]. China currently has a litchi cultivation area exceeding 550,000 hectares, with annual production surpassing 3 million tons [1]. Extensive research has been conducted on various litchi traits, including fruit size [2], seed development [3,4], fruit abscission [5], pericarp coloration [6,7,8], and flowering [9]. Among these, seed development and size significantly influence fruit quality. While studies have identified multiple factors affecting seed size formation, including hormone levels [10], cell wall acid invertase activity [11], and temperature [12]—the lack of molecular markers for marker-assisted selection targeting seed size has severely hindered breeding progress.
Various molecular markers, including SNPs [13], SSRs [14,15], AFLPs [16], ISSRs [17], and RAPDs [18], have been employed in litchi genetic diversity and mapping studies. With advances in sequencing technologies, next-generation sequencing-based SNP marker development has become the preferred approach for trait-associated marker identification in litchi and other fruit trees. For instance, Hu et al. constructed a high-density genetic map using GBS-derived SNP markers, identifying 37 QTLs associated with eight dwarf-related traits [19]. Zhang et al. developed a liquid SNP array and detected 79 dwarfing-related QTLs [20]. Through genome-wide association analysis, Hu et al. identified a significant locus associated with fruit maturity, characterized by a 3.7 kb deletion downstream of COL307 gene [21]. Yan et al. identified eight SNP markers significantly associated with litchi seed transverse diameter through GWAS [22]. While SNP markers often require conversion to platform-specific formats (such as KASP assays) for practical use in marker-assisted breeding, InDel markers offer greater convenience due to their compatibility with standard PCR amplification. Nevertheless, studies on InDel markers remain relatively scarce in litchi research. These findings collectively demonstrate the efficacy of high-throughput sequencing and association analysis in identifying trait-linked molecular markers in litchi.
Bulked segregant analysis (BSA) coupled with high-throughput sequencing offers a rapid approach for identifying genetic markers linked to target traits [23]. This method has been successfully applied for seed size QTL mapping in various crops. For example, by using BSA-seq in an F1 apple population, five dwarf and four tall QTLs were identified across six chromosomes, with the top three non-linked QTLs (d4, d5, and t1) and their epistatic interactions explaining up to 34.9% of phenotypic variation [24]. In peaches, BSA-seq localized the weeping trait to a 159 kb region on chromosome 3, identifying a 35 bp deletion in standard types, which serves as a key marker for marker-assisted breeding [25]. In tree peony, BSA-seq and BSR-seq pinpointed PsHMGR as a pivotal gene for terpene synthesis, revealing its direct association with terpenoid accumulation [26].
Early-maturing litchi cultivars generally achieve higher market prices. The development of early-maturing varieties exhibiting seed abortion presents significant potential for capturing early market opportunities, enhancing fruit quality, and substantially increasing economic returns per unit area. Furthermore, molecular markers associated with seed size in early litchi cultivars can facilitate the accelerated breeding of such desirable varieties. To develop molecular markers significantly associated with seed size in early-maturing litchi varieties, this study utilized 131 early-maturing litchi accessions. We first evaluated their fruit quality trait diversity and selected large- and small-seeded accessions to construct extreme-trait DNA pools for BSA-seq analysis. This approach aims to develop seed size-associated molecular markers, thereby establishing a foundation for marker-assisted breeding in litchi.

2. Materials and Methods

2.1. Plant Materials

The study utilized 131 early-maturing litchi accessions, comprising 125 lines derived from four generations of self-pollination of ‘Zao Guo Li’ and six additional extra-early cultivars (‘D13’, ‘B14’, ‘Nanxizaosheng’, ‘Qionghaitezaoshou’, ‘Sanyuehong’, and ‘Zaoli No.1’). All materials were cultivated at the Litchi Germplasm Repository of the Tropical Fruit Research Institute, Hainan Academy of Agricultural Sciences (Chengmai, China) (Table S1). Following comprehensive phenotypic evaluation, 15 accessions each representing extreme normal seeds (NS pool) and aborted seeds (AS pool) phenotypes were selected for BSA-seq analysis through multivariate statistical approaches (Figure 1). The NS pool consisted of accessions with seed weight > 3.5 g, seed width > 17 mm, edible rate < 60%, and a seed-to-fruit weight ratio > 23%, whereas the AS pool included accessions with seed weight < 2.0 g, seed width < 14 mm, edible rate > 65%, and a seed-to-fruit weight ratio < 12%.

2.2. Phenotypic Trait Evaluation and Analysis

Six key phenotypic traits of litchi fruits were systematically evaluated, including single fruit weight, seed weight, seed length, seed width, edible rate, and seed-to-fruit weight ratio. Single fruit weight was determined using an electronic balance (accuracy: 0.01 g) by weighing individual mature fruits. Seed weight was measured after removing the pericarp and pulp, with measurements recorded to 0.01 g precision. Seed dimensions (length and width) were assessed using digital calipers (accuracy: 0.01 mm), recording the maximum longitudinal and transverse distances, respectively. The edible rate was calculated as the percentage of pulp weight relative to single fruit weight Formula (1). The ratio of seed weight to fruit weight represented the proportion of seed weight to single fruit weight Formula (2). A minimum of 10 biological replicates were analyzed for each measurement.
Edible rate (%) = Pulp weight/Single fruit weight × 100%
Ratio of seed weight to fruit weight (%) = Seed weight/Single fruit weight × 100%

2.3. BSA-Seq Analysis

2.3.1. DNA Extraction and Sequencing

Young leaves from the AS and NS pools were collected for DNA extraction using the CTAB method. DNA concentration and purity were assessed using NanoDrop 2000 (Thermo Fisher Scientific, Waltham, MA, USA), with all samples exhibiting A260/A280 ratios between 1.8 and 2.0 and minimum concentrations of 50 ng/μL. Sequencing libraries (350 bp insert size) were prepared and sequenced on the BGI DNBSEQ-T7 platform (BGI Group, Shenzhen, Guangdong, China) to generate 150 bp paired-end reads.

2.3.2. Data Processing, Alignment, Variant Calling, and Linkage Analysis

Raw sequencing data in FASTQ format were initially processed using fastp to obtain high-quality clean data. This preprocessing step involved the removal of adapter-containing sequences, poly-N reads, and low-quality sequences, while simultaneously calculating quality metrics including Q20, Q30 scores, GC content, and duplication levels. This preprocessing step involved the following: (1) removal of adapter-containing sequences (using BGI’s optimized adapter database); (2) filtering of reads with >10% poly-N base; (3) exclusion of reads where >50% of bases had a quality score < Q10 (Phred + 33 scale). All subsequent analyses were performed using these filtered clean reads. The clean data were then aligned to the reference genome sequence (GeneBank: GCA_019925255.1) using BWA-mem2 software (v2.2.1) [27], with parameters optimized for BGI short-read data (-k 19, -W 20, and -r 10).
The alignment results were processed using SAMtools [28] for sorting and duplicate removal, followed by variant calling with GATK software (v4.4.8.1) [29], using a minimum confidence threshold of 30.0 for variant emission (-stand-call-conf) and 10.0 for variant calling (-stand-emit-conf). The resulting variant calls were stringently filtered using the following criteria: QD < 2.0 || MQ < 40.0 || FS > 60.0 || QUAL < 30.0 || MQrankSum < −12.5 || ReadPosRankSum < −8.0 -clusterSize 2 -clusterWindowSize 5. High-quality SNPs and InDels passing these filters were annotated using snpEff software (v5.0) [30], with classifications including intergenic regions, upstream/downstream regions, and exonic/intronic regions, as well as further categorization of coding variants into synonymous/non-synonymous SNPs and frameshift-inducing InDels.
Linkage analysis between phenotypic traits and genetic variants was performed using the Euclidean distance (ED) algorithm [31], along with the ΔSNP index and ΔInDel index approaches [32]. Prior to linkage analysis, SNP and InDel markers were subjected to stringent filtering using the following criteria: (1) only biallelic sites were retained, while loci exhibiting more than two genotypes were removed; (2) sites with read support fewer than 4 in either pool were excluded; (3) markers that were homozygous and identical across both pools were filtered out. This process resulted in a high-quality set of SNP and InDel markers for subsequent analysis.

2.3.3. Gene Functional Annotation

Candidate genes within the BSA-seq-identified genomic regions were systematically characterized through comprehensive functional annotation using multiple databases: NCBI non-redundant protein sequences (Nr) [33], Protein family (Pfam) [34], Clusters of Orthologous Groups of proteins (KOG/COG) [35], Swiss-Prot (a manually annotated protein sequence database) [36], KEGG Ortholog database (KO) [37], and Gene Ontology (GO) [38].

2.4. InDel-PCR Analysis

Eighty-seven accessions were selected for InDel-PCR validation (Table S1). Primer sequences for Chr5_25585686_InDel and Chr5_25610680_InDel are listed in Table S2. The 15 μL PCR reaction mixture contained 7.5 μL 2 × Taq PCR Master Mix, 0.2 μL forward primer (1 μM, TP-M13 primer), 1.2 μL reverse primer, 1.2 μL M13 fluorescent tag (1 μM), 2.5 μL DNA template (20 ng/μL), and 2.4 μL ddH2O. The PCR protocol included initial denaturation at 94 °C for 5 min, followed by 30 cycles of denaturation (94 °C, 30 s), annealing (58 °C, 30 s), and extension (72 °C, 60 s), then 13 additional cycles with annealing at 53 °C for 30 s, and a final extension at 72 °C for 10 min.

2.5. Statistical Analysis

The phenotypic data were subsequently analyzed using R software (v4.5.0) for descriptive statistics (including the minimum, maximum, mean, standard deviation, skewness, kurtosis, and coefficient of variation), Pearson correlation analysis, hierarchical clustering analysis (HCA), and principal component analysis (PCA) [39]. TASSEL 4.0 [40] was used for InDel–trait association analysis under the general linear model (GLM). Significance thresholds (permutation p-value < 0.01) were established through 1000 permutation tests to control false discovery rates.

3. Results

3.1. Variation Analysis of Six Fruit Quality Traits

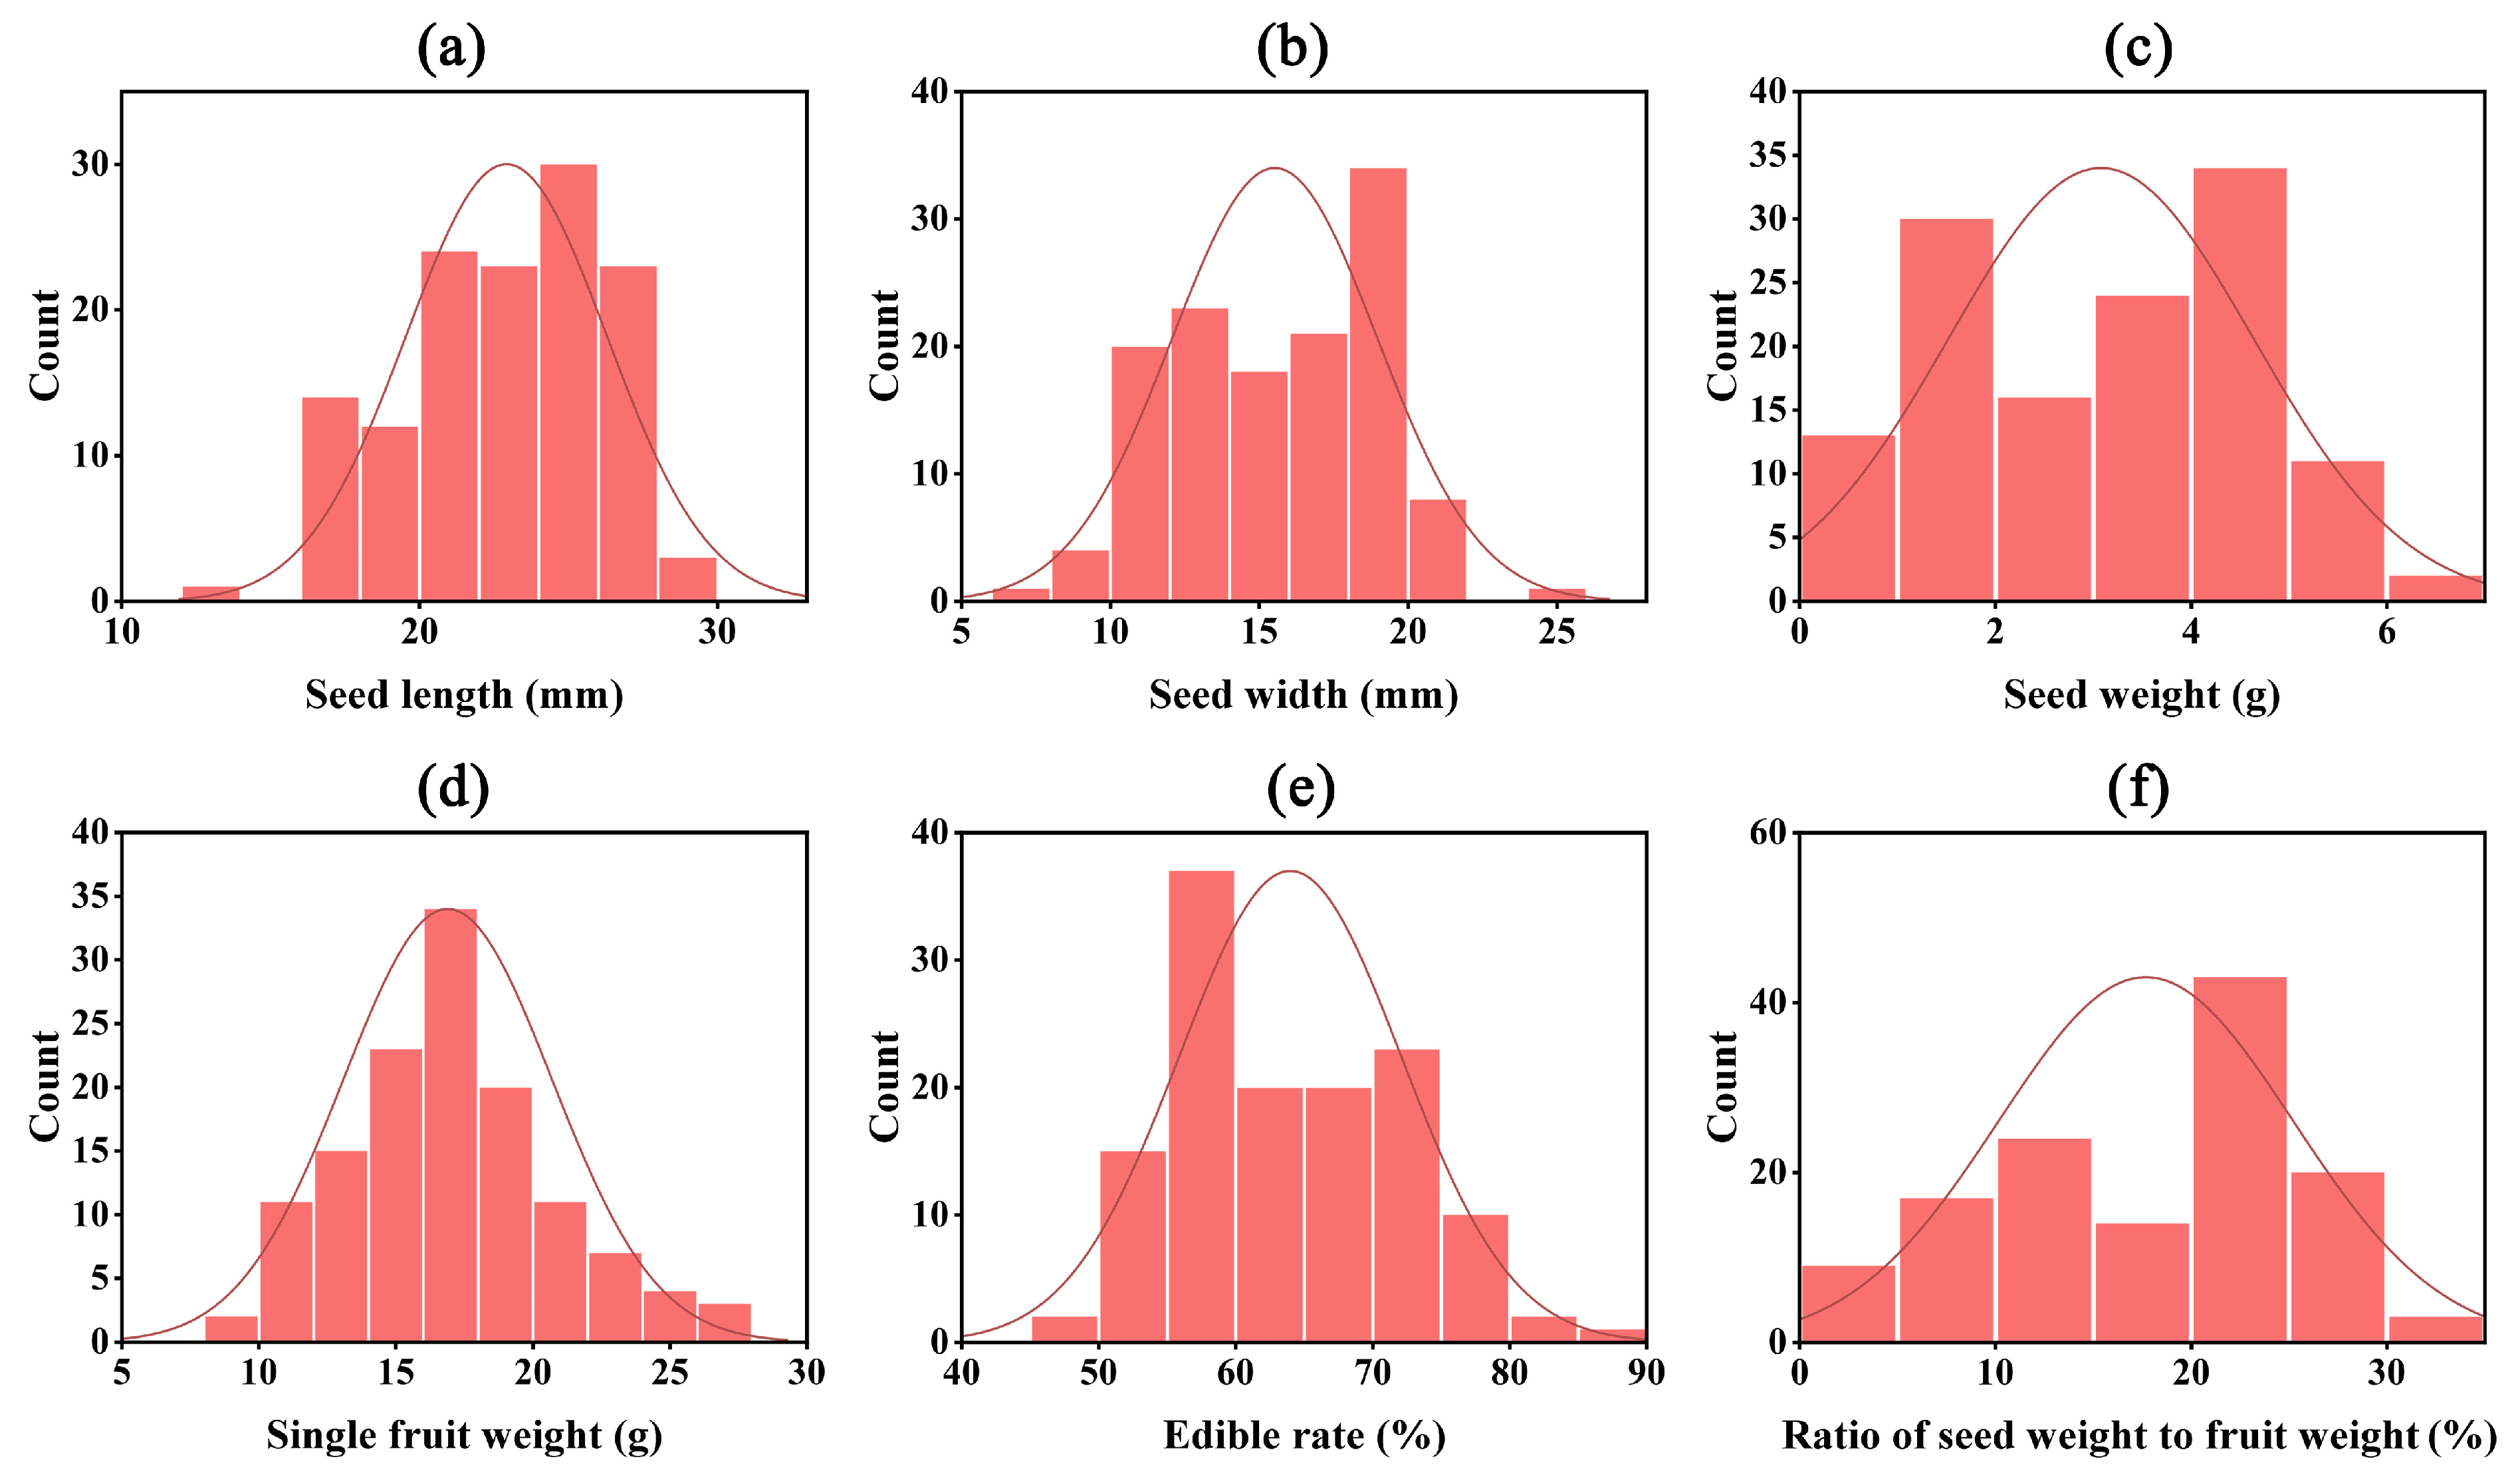
Six key traits were evaluated across 131 early-maturing litchi accessions: single fruit weight, seed weight, seed length, seed width, edible rate, and seed-to-fruit weight ratio. All traits exhibited normal distribution characteristics (skewness: −0.35–0.38; kurtosis: −1.22–−0.01) (Table 1 and Figure 2). The coefficient of variation (CV) ranged from 0.13 to 0.50, reflecting substantial phenotypic diversity among accessions. Seed weight exhibited the highest variability (CV = 0.50), while seed length was the most stable (CV = 0.13). Notably, two traits, seed weight and seed-to-fruit weight ratio, showed CV values > 0.4, suggesting potential for genetic dissection of these traits in future studies.

3.2. Correlation, Cluster, and PCA Analyses of Phenotypic Traits

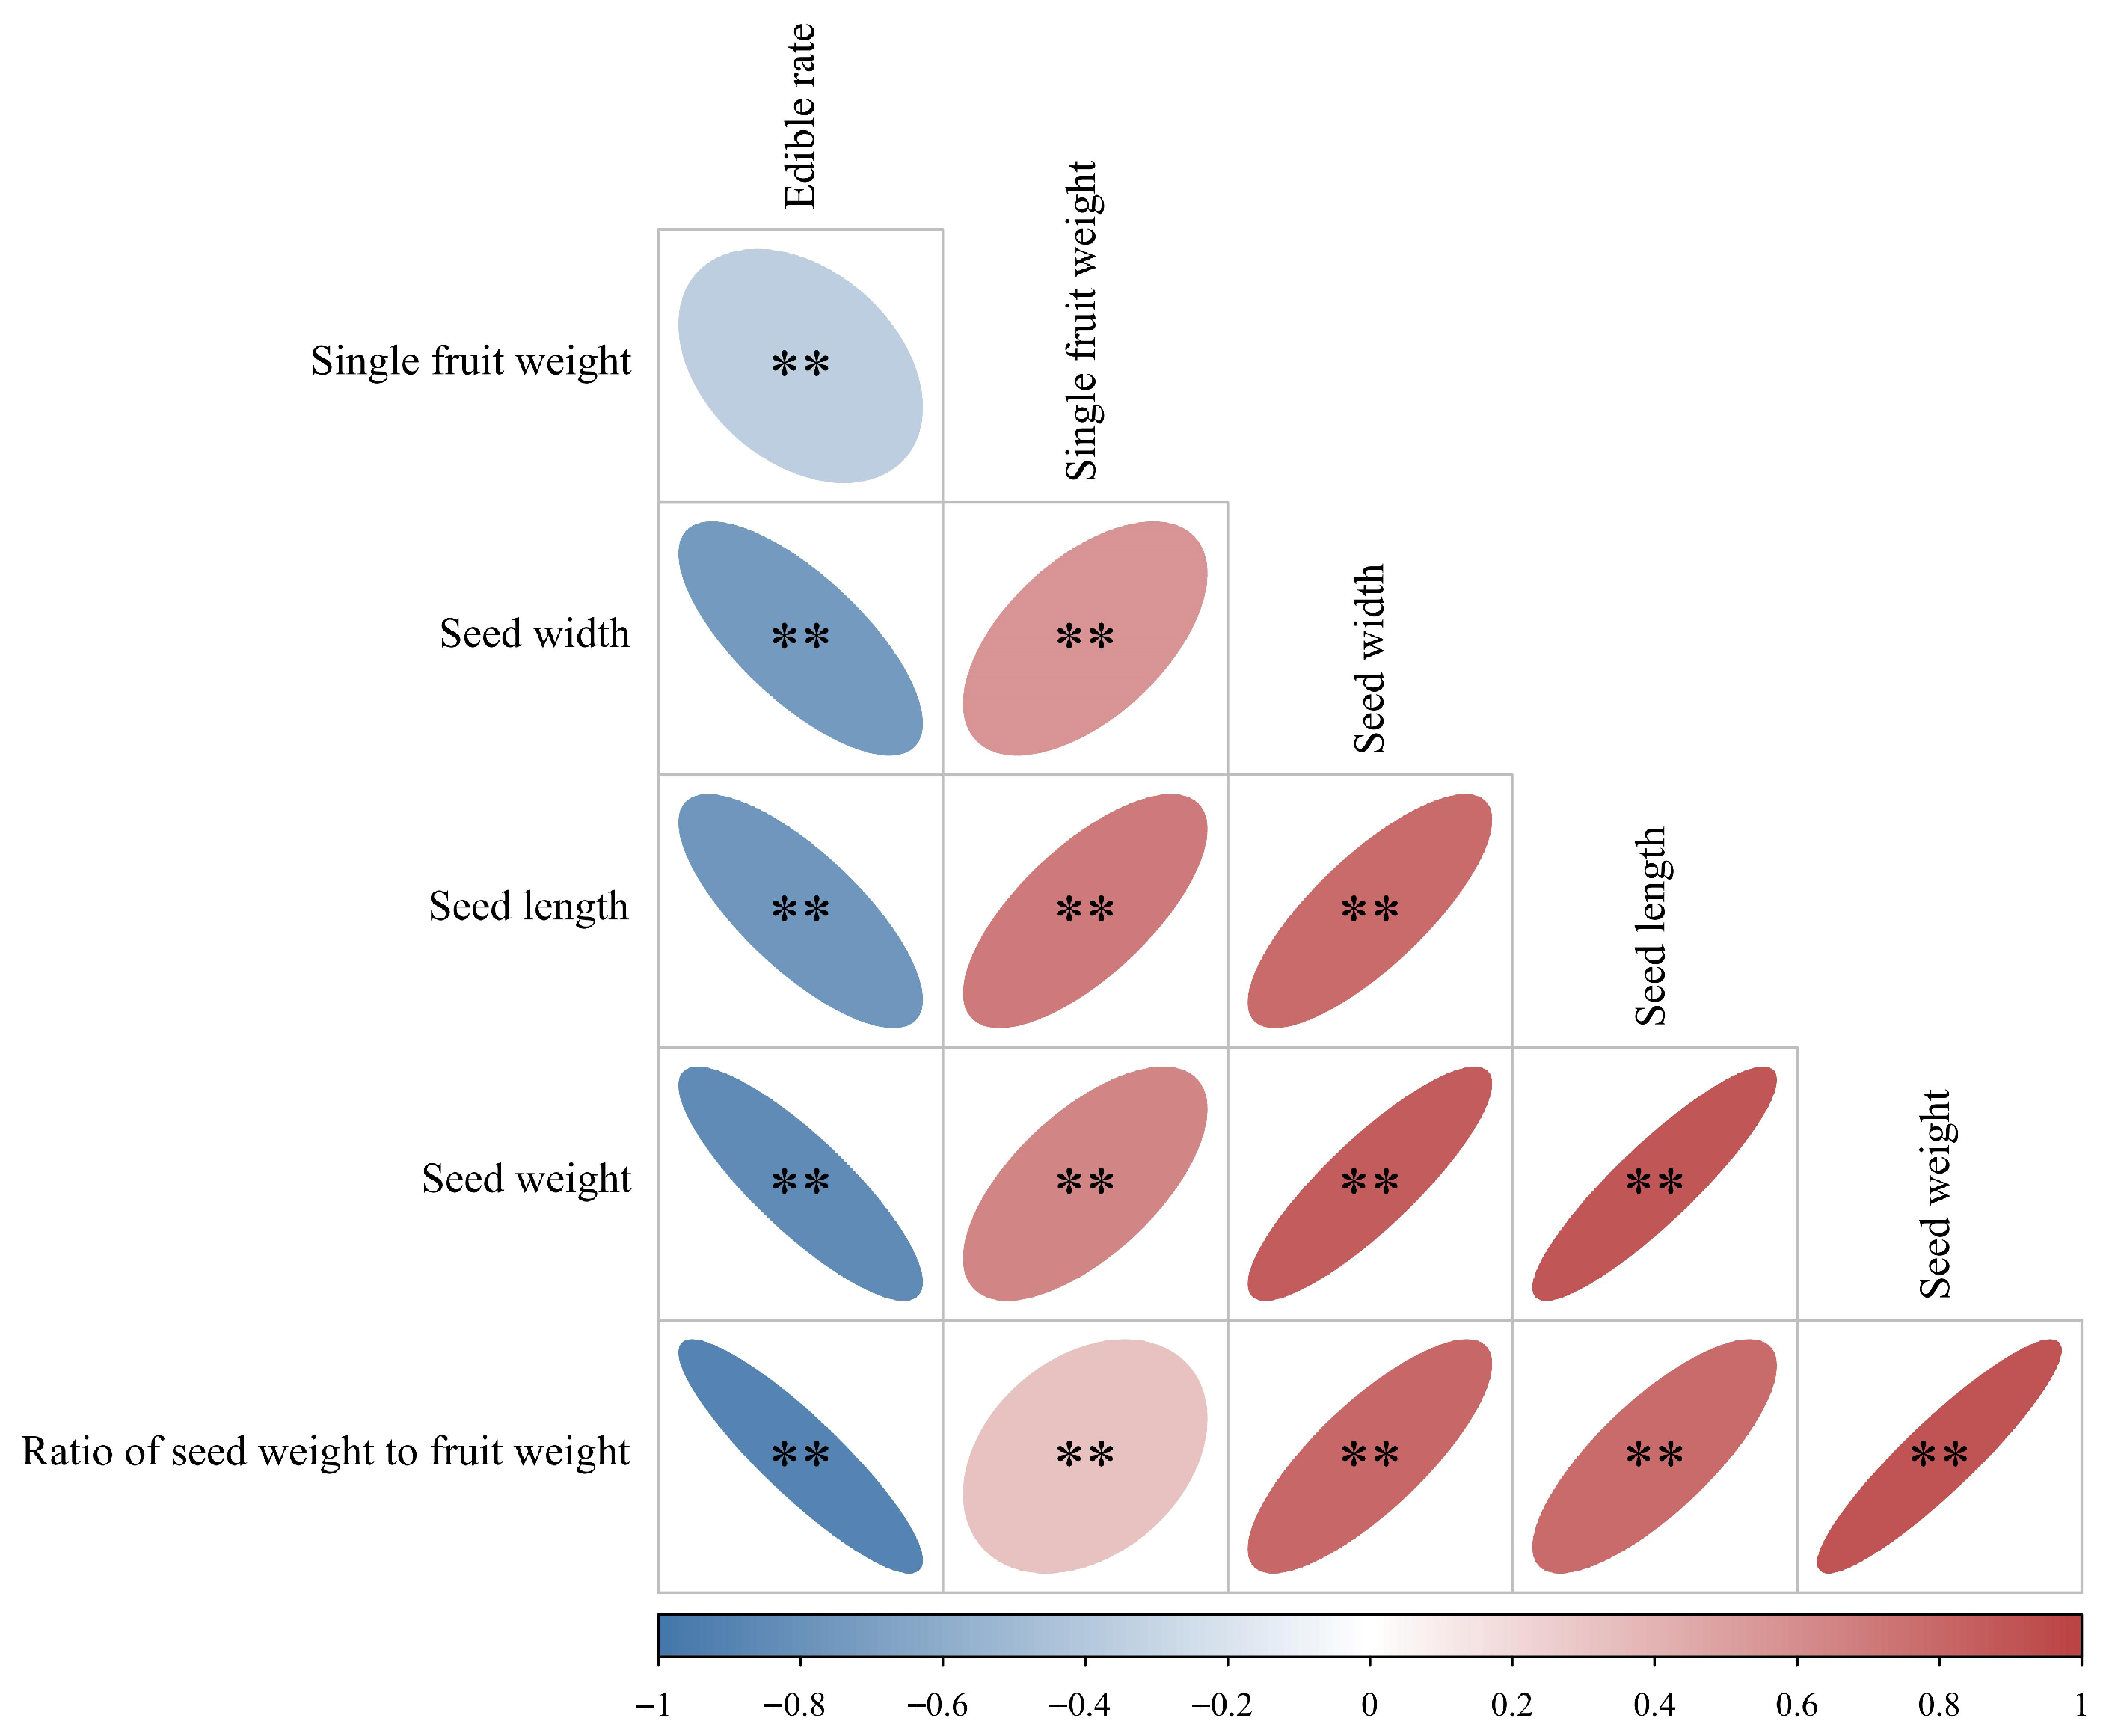
Pearson correlation analysis revealed highly significant associations among all six traits (Figure 3 and Table S3). Five traits (single fruit weight, seed weight, seed length, seed width, and seed-to-fruit weight ratio) showed strong positive correlations, while edible rate exhibited significant negative correlations with these traits.
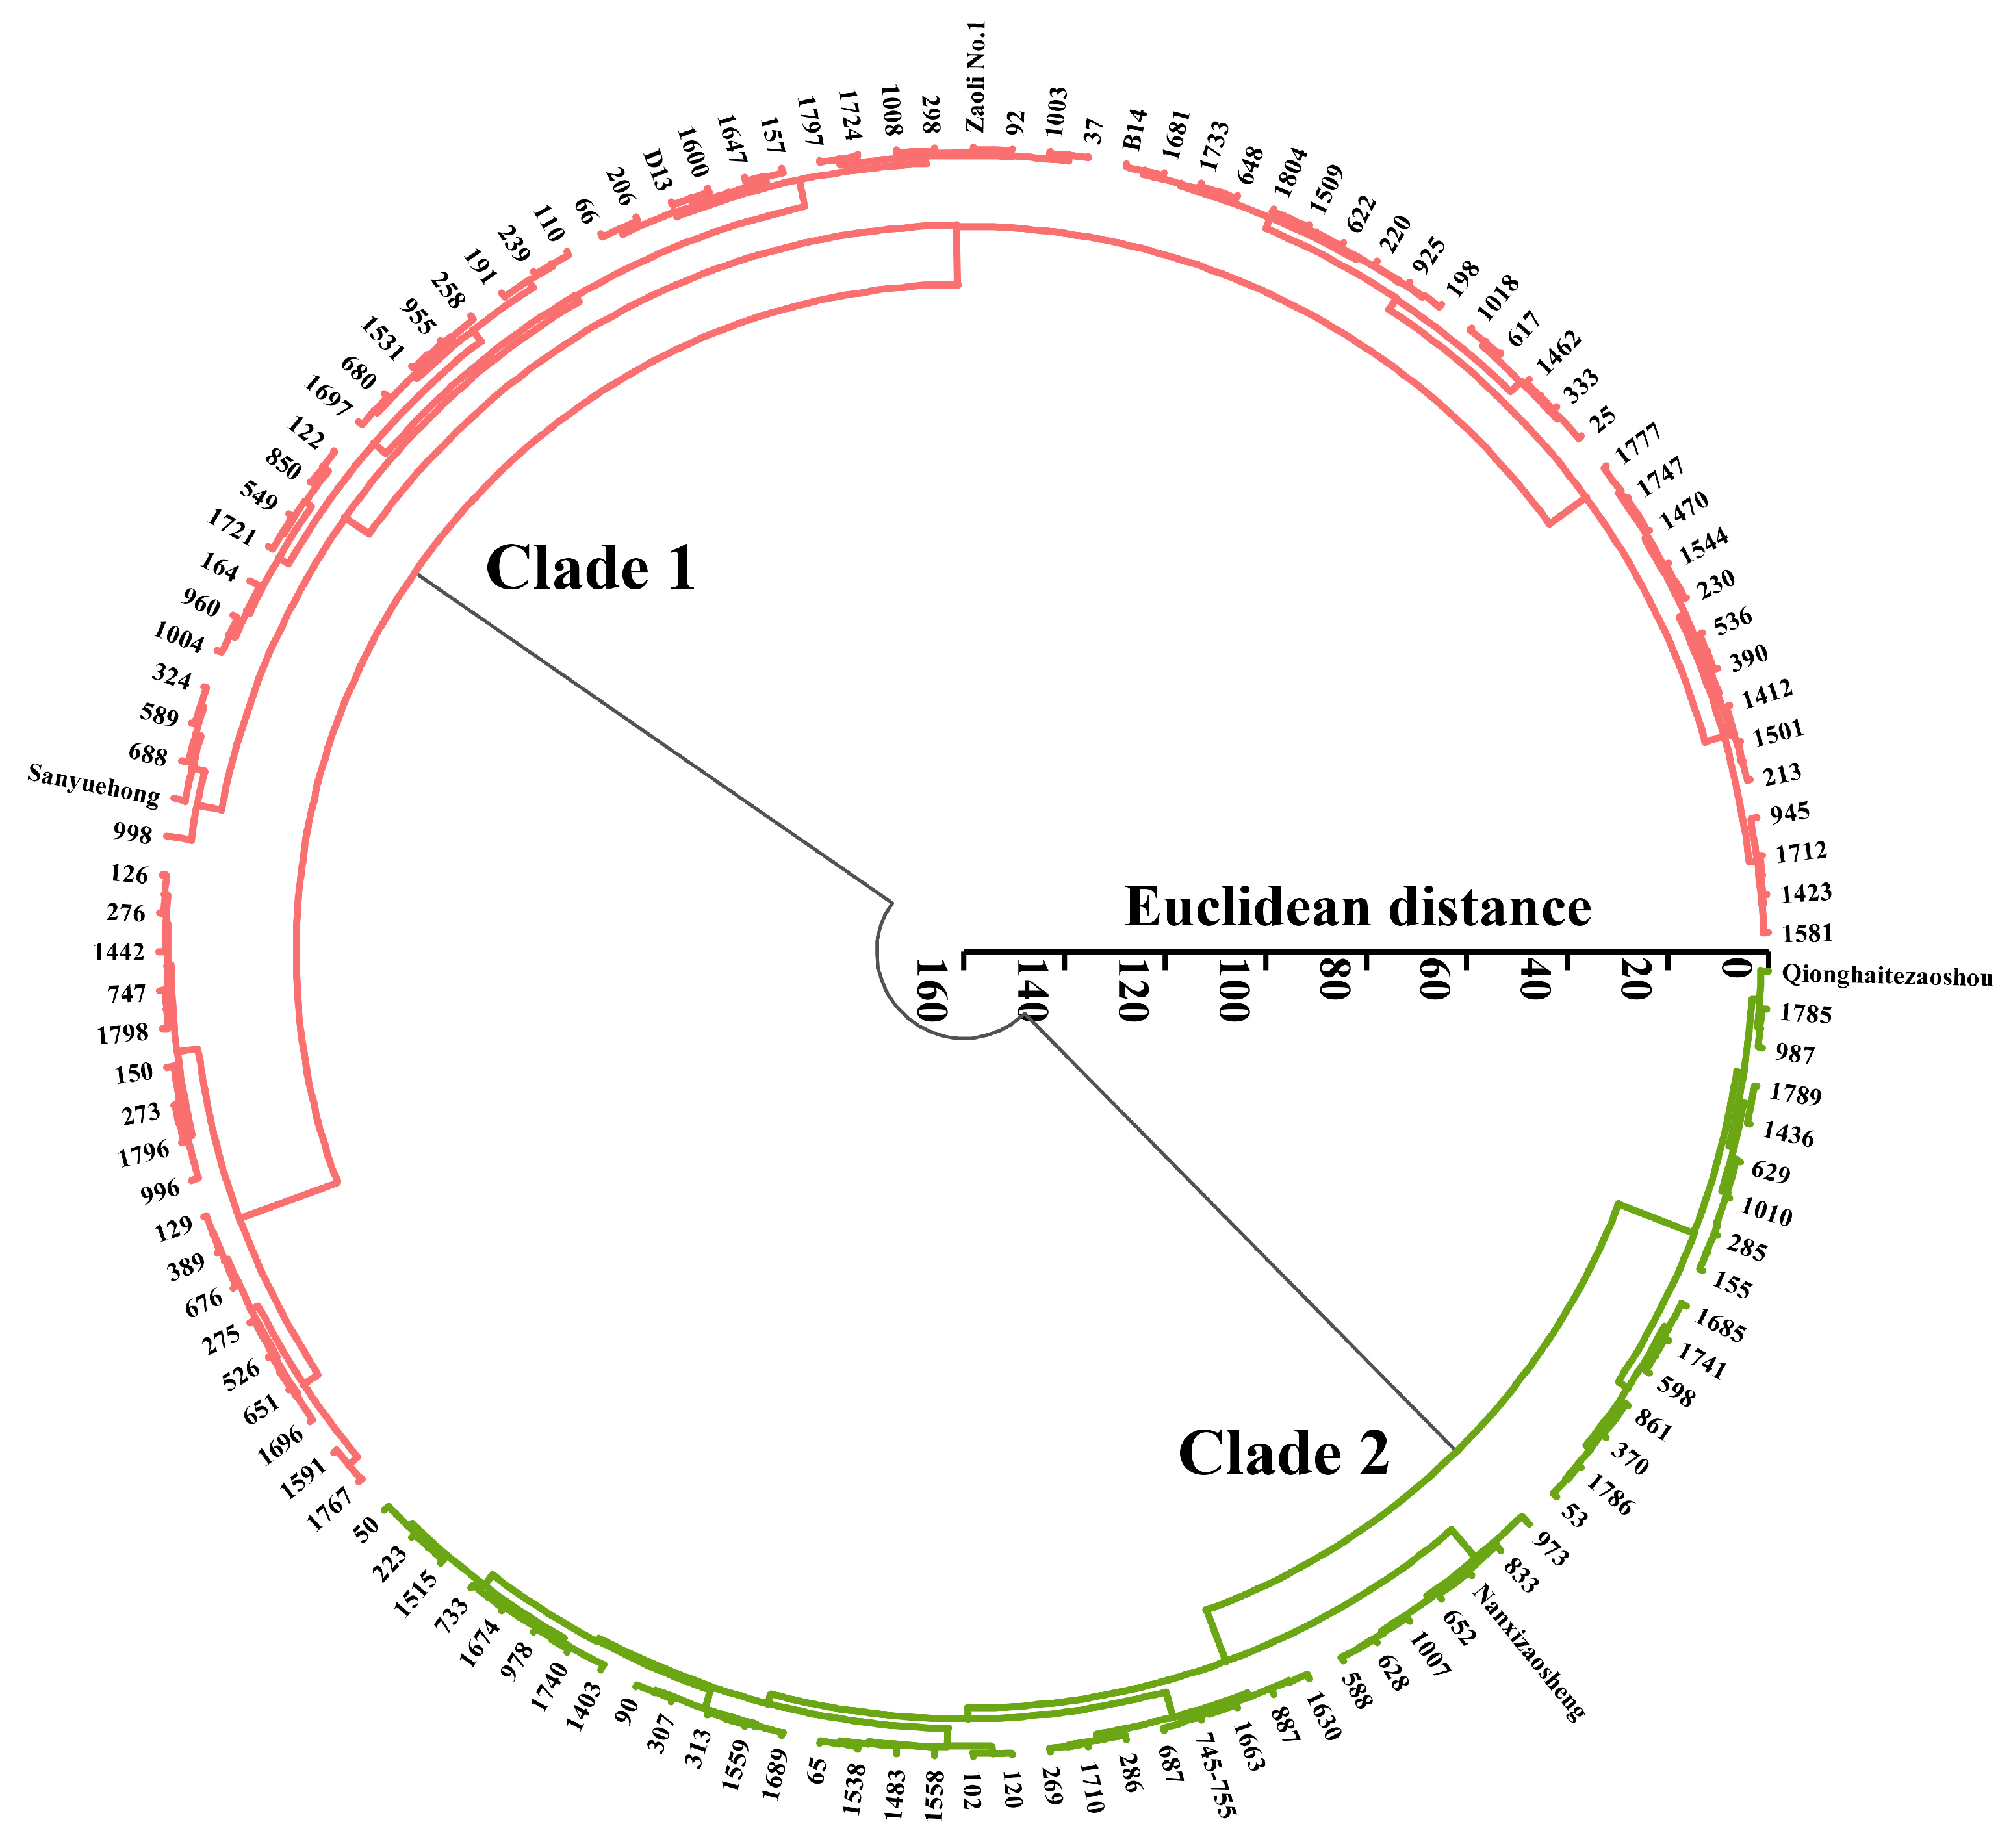
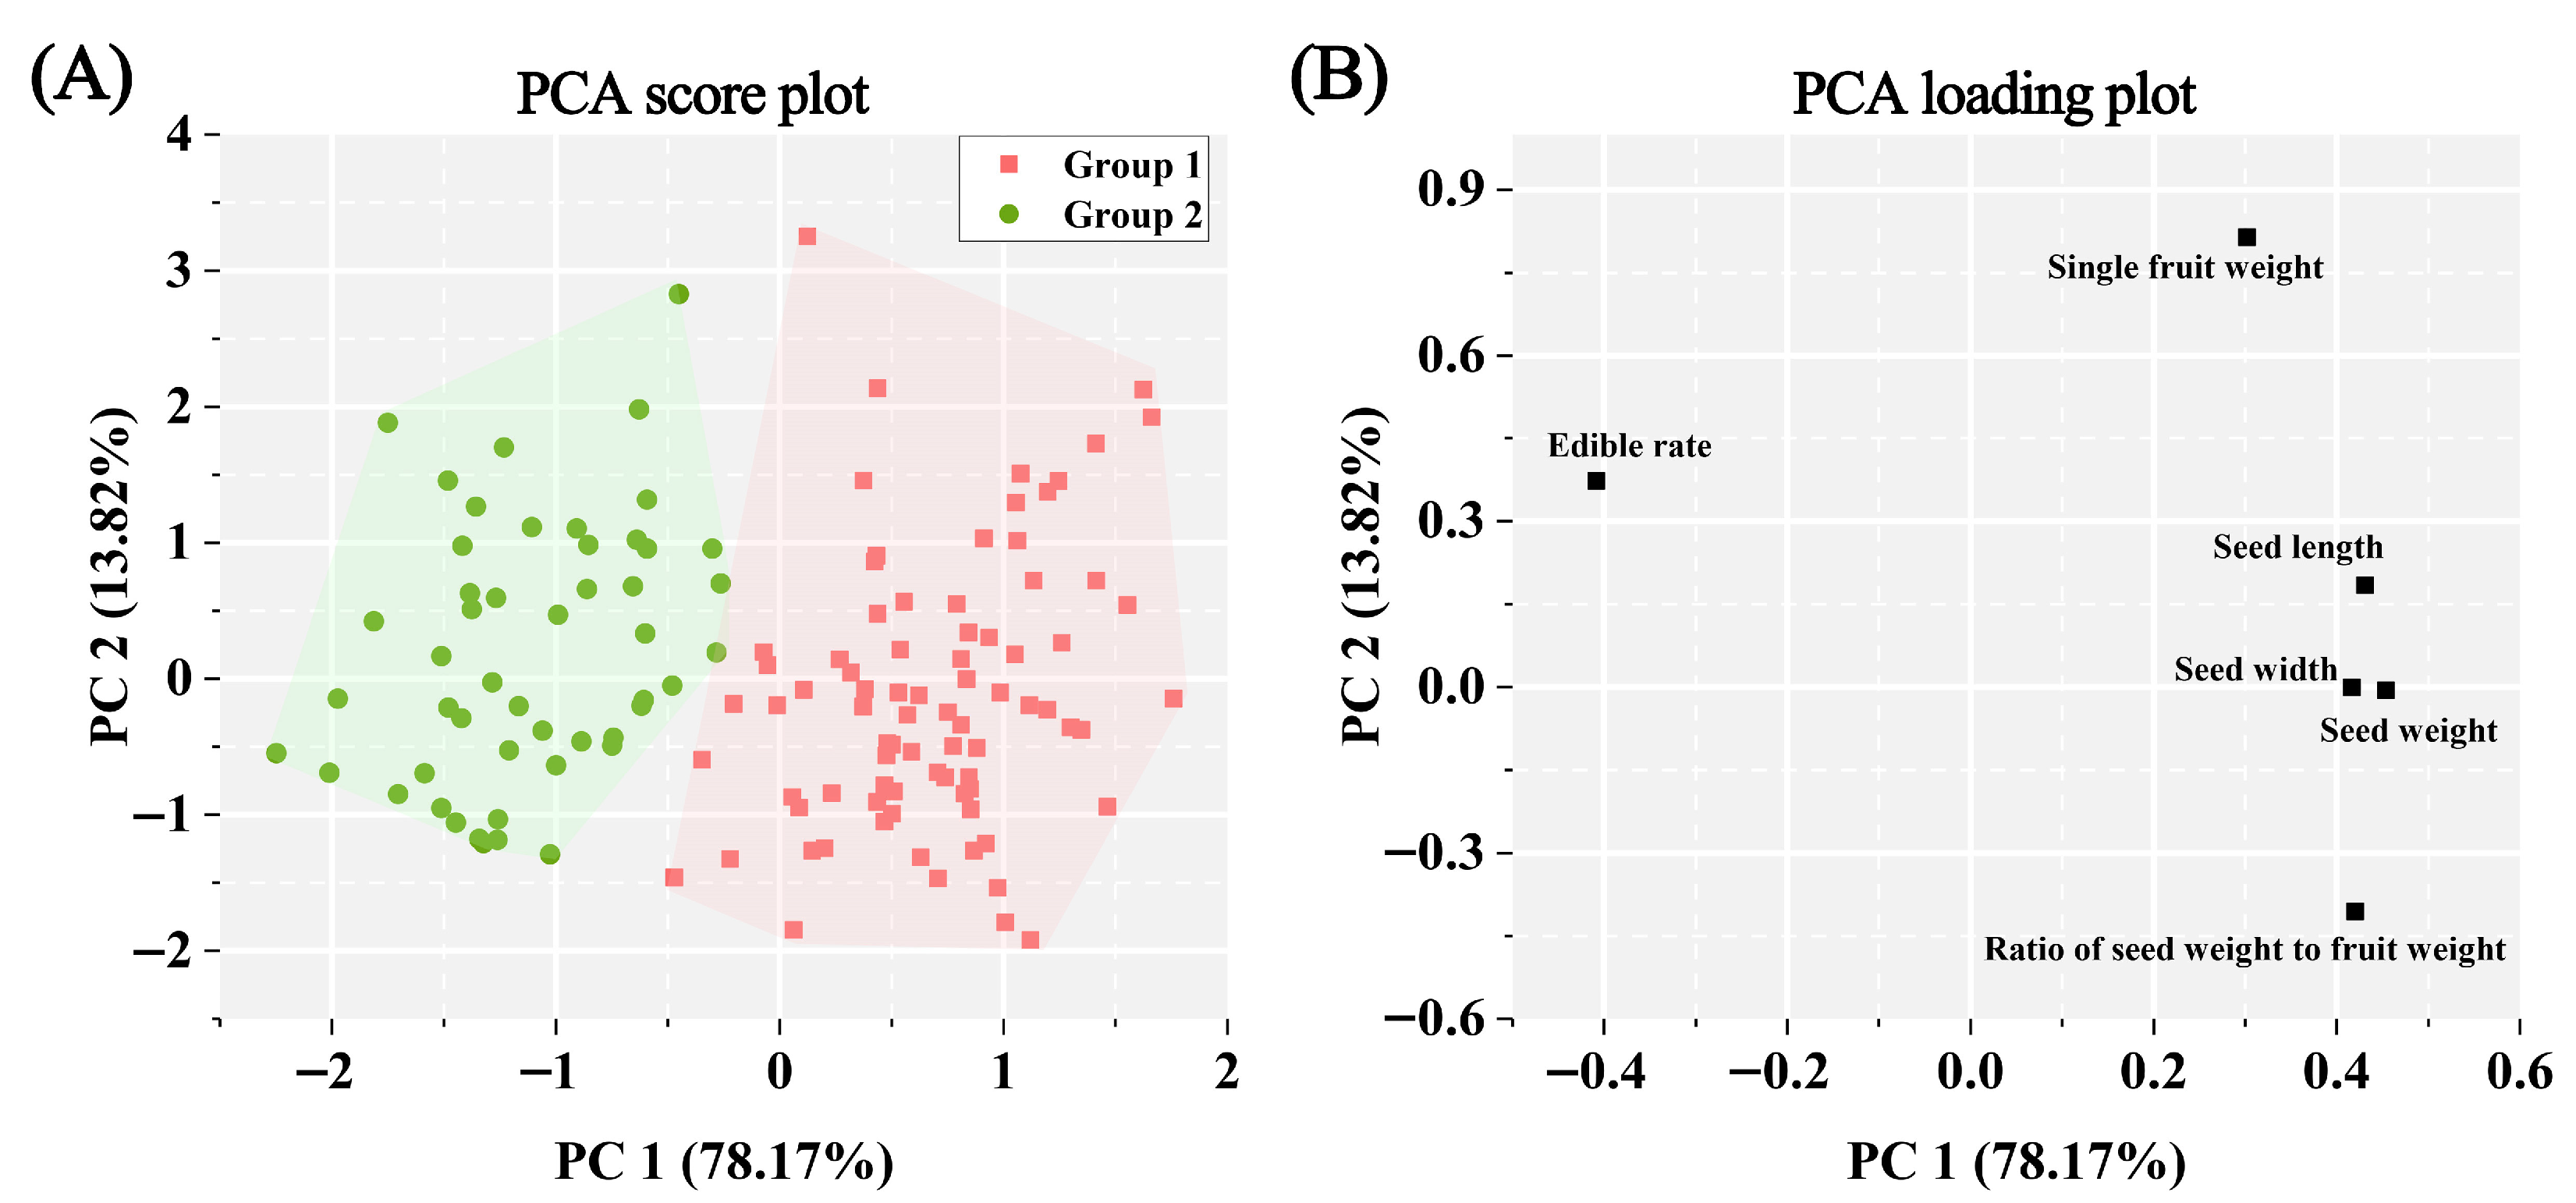
HCA analysis based on Euclidean distance divided the 131 accessions into two groups at a cutoff of 40 (Figure 4). Group 1 comprised 81 accessions, while Group 2 contained 50. PCA results showed that the first two principal components explained 91.99% of the total variation (PC1 = 78.17%; PC2 = 13.82%). The PCA score plot revealed a distinct separation between groups, with Group 1 accessions (right side) characterized by larger fruits, heavier seeds, higher seed-to-fruit weight ratios, and lower edible rates, while Group 2 accessions (left side) displayed contrasting trait profiles (Figure 5).

3.3. BSA-Seq Analysis of the AS and NS Phenotypic Pools

BSA-seq generated high-quality data from extreme pools (AS and NS), with 101,665,578 and 107,502,788 clean reads (15.19 and 16.06 Gbp), achieving 29× and 30× genome coverage, respectively (Table S4). Quality metrics included Q20 > 99% and Q30 > 97%, with proper mapping rates of 85.01% (AS) and 84.44% (NS) (Tables S4 and S5).
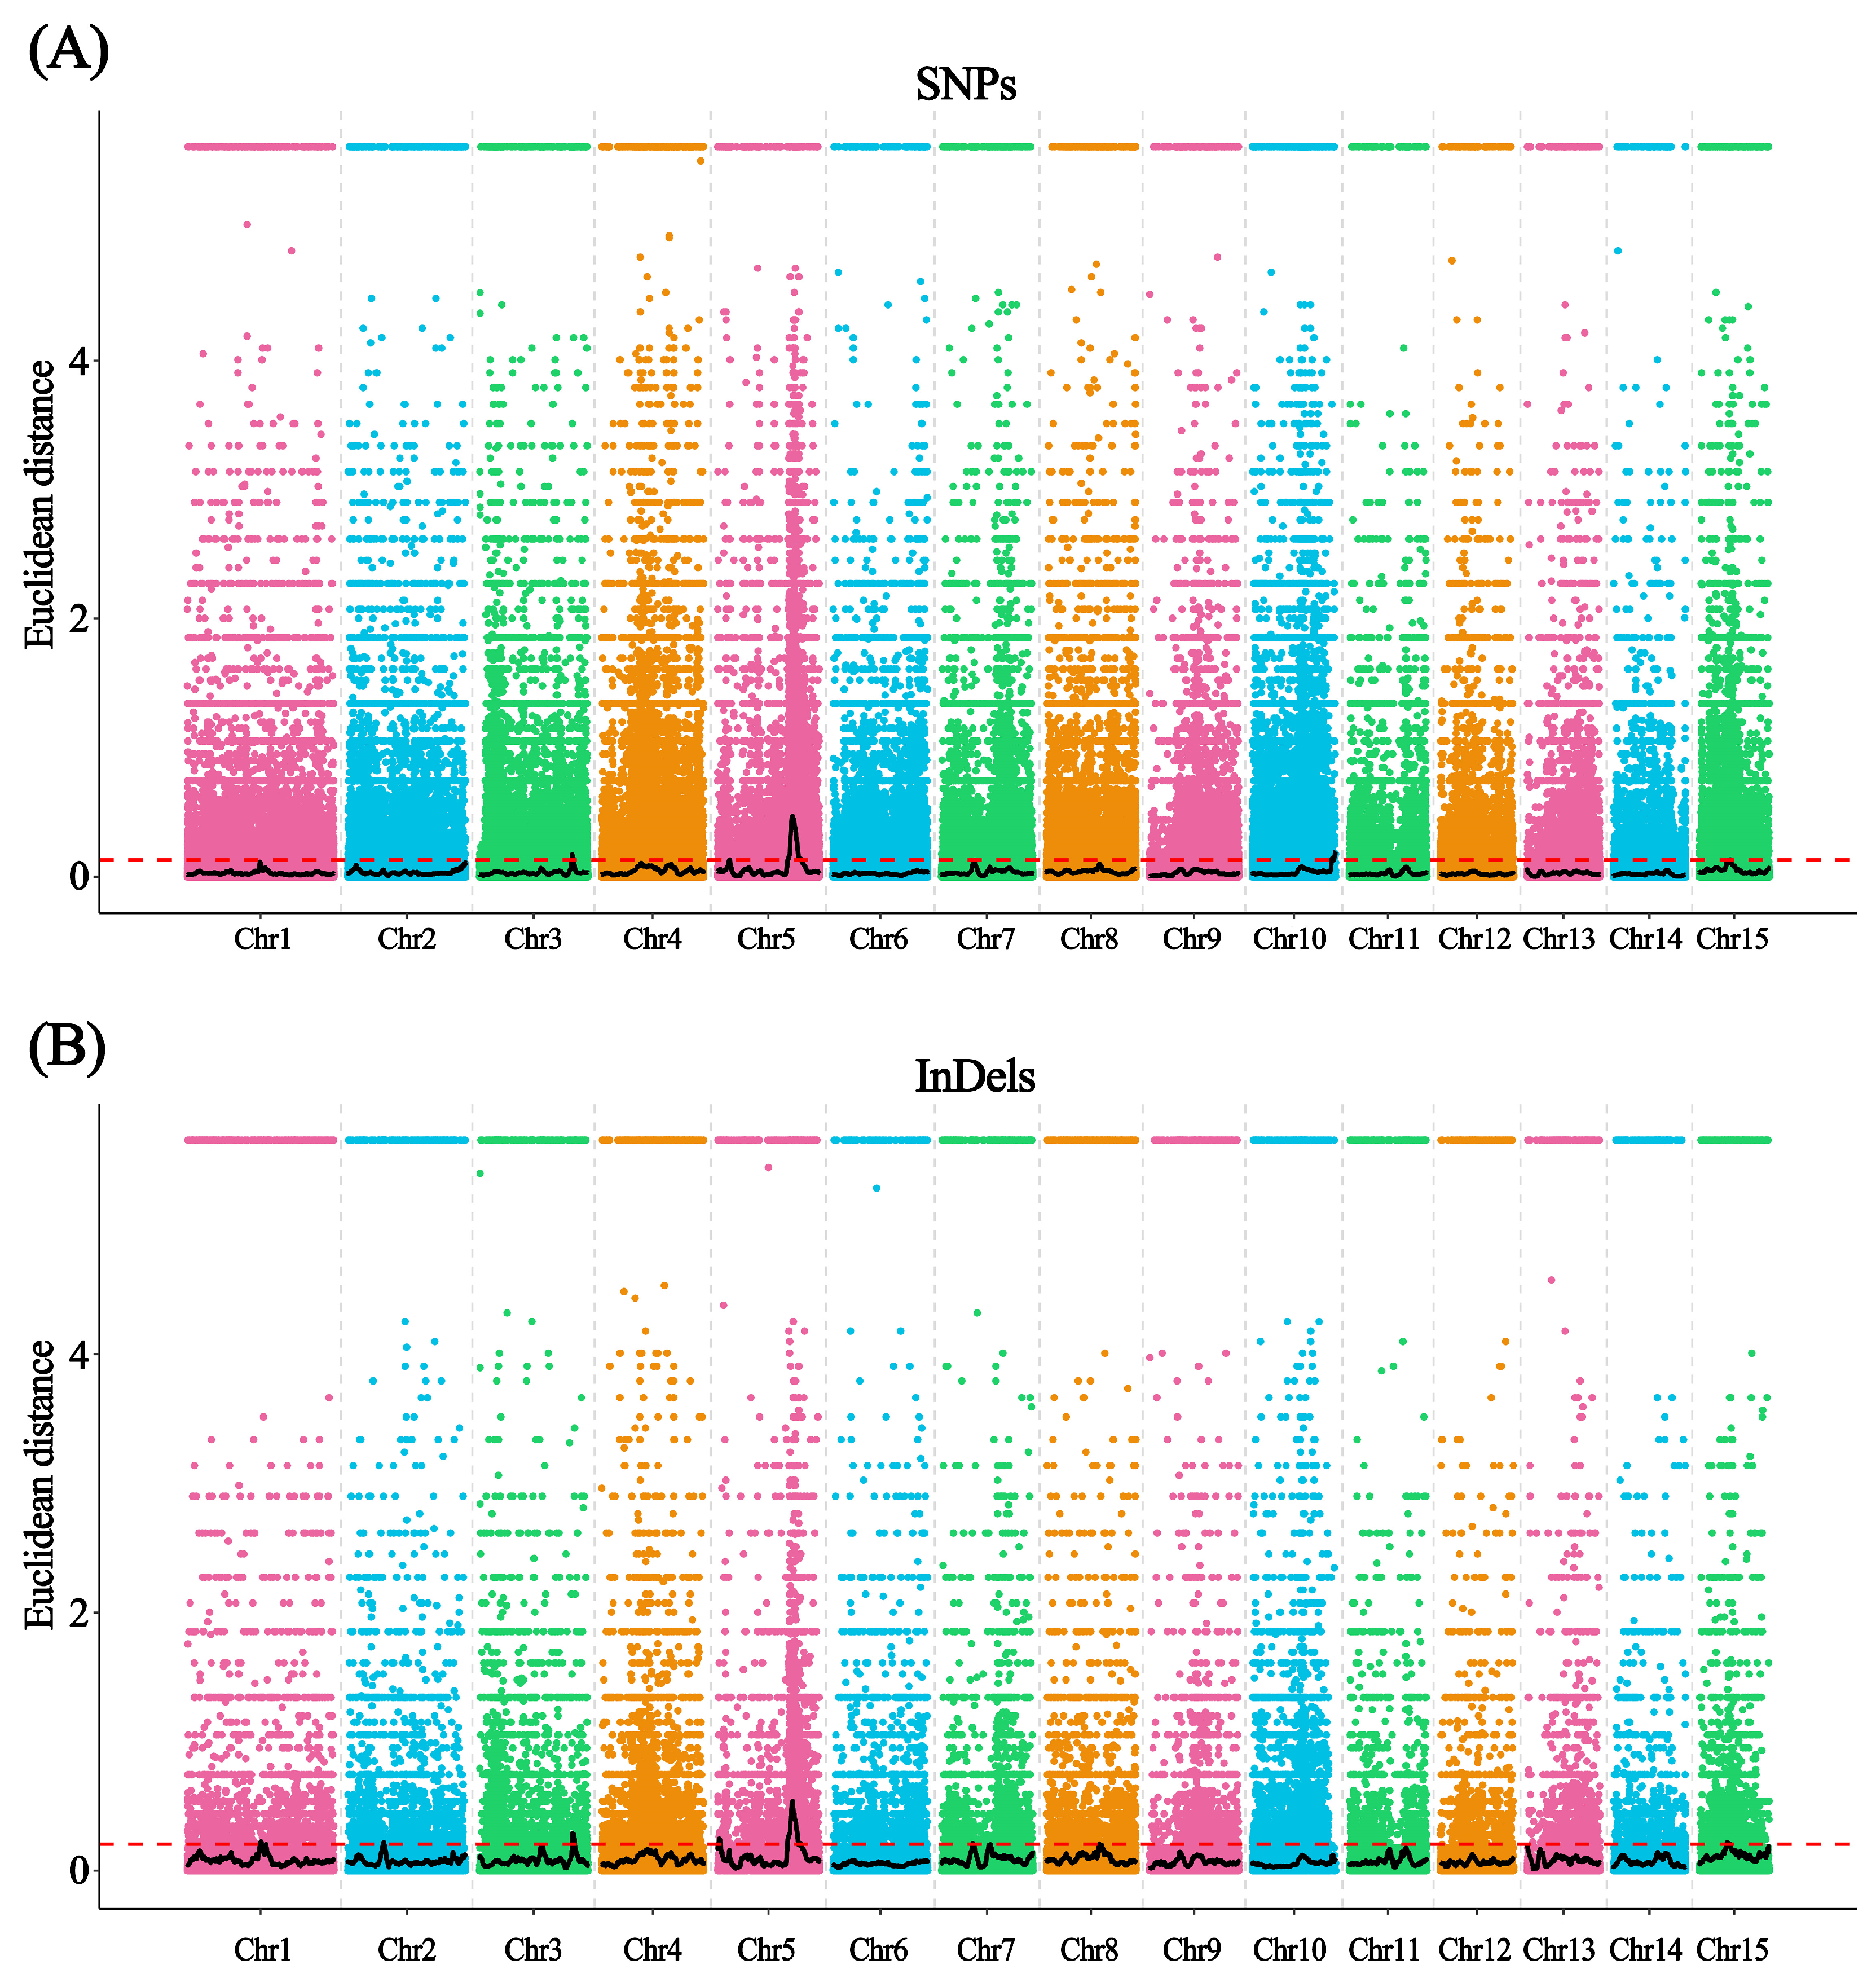
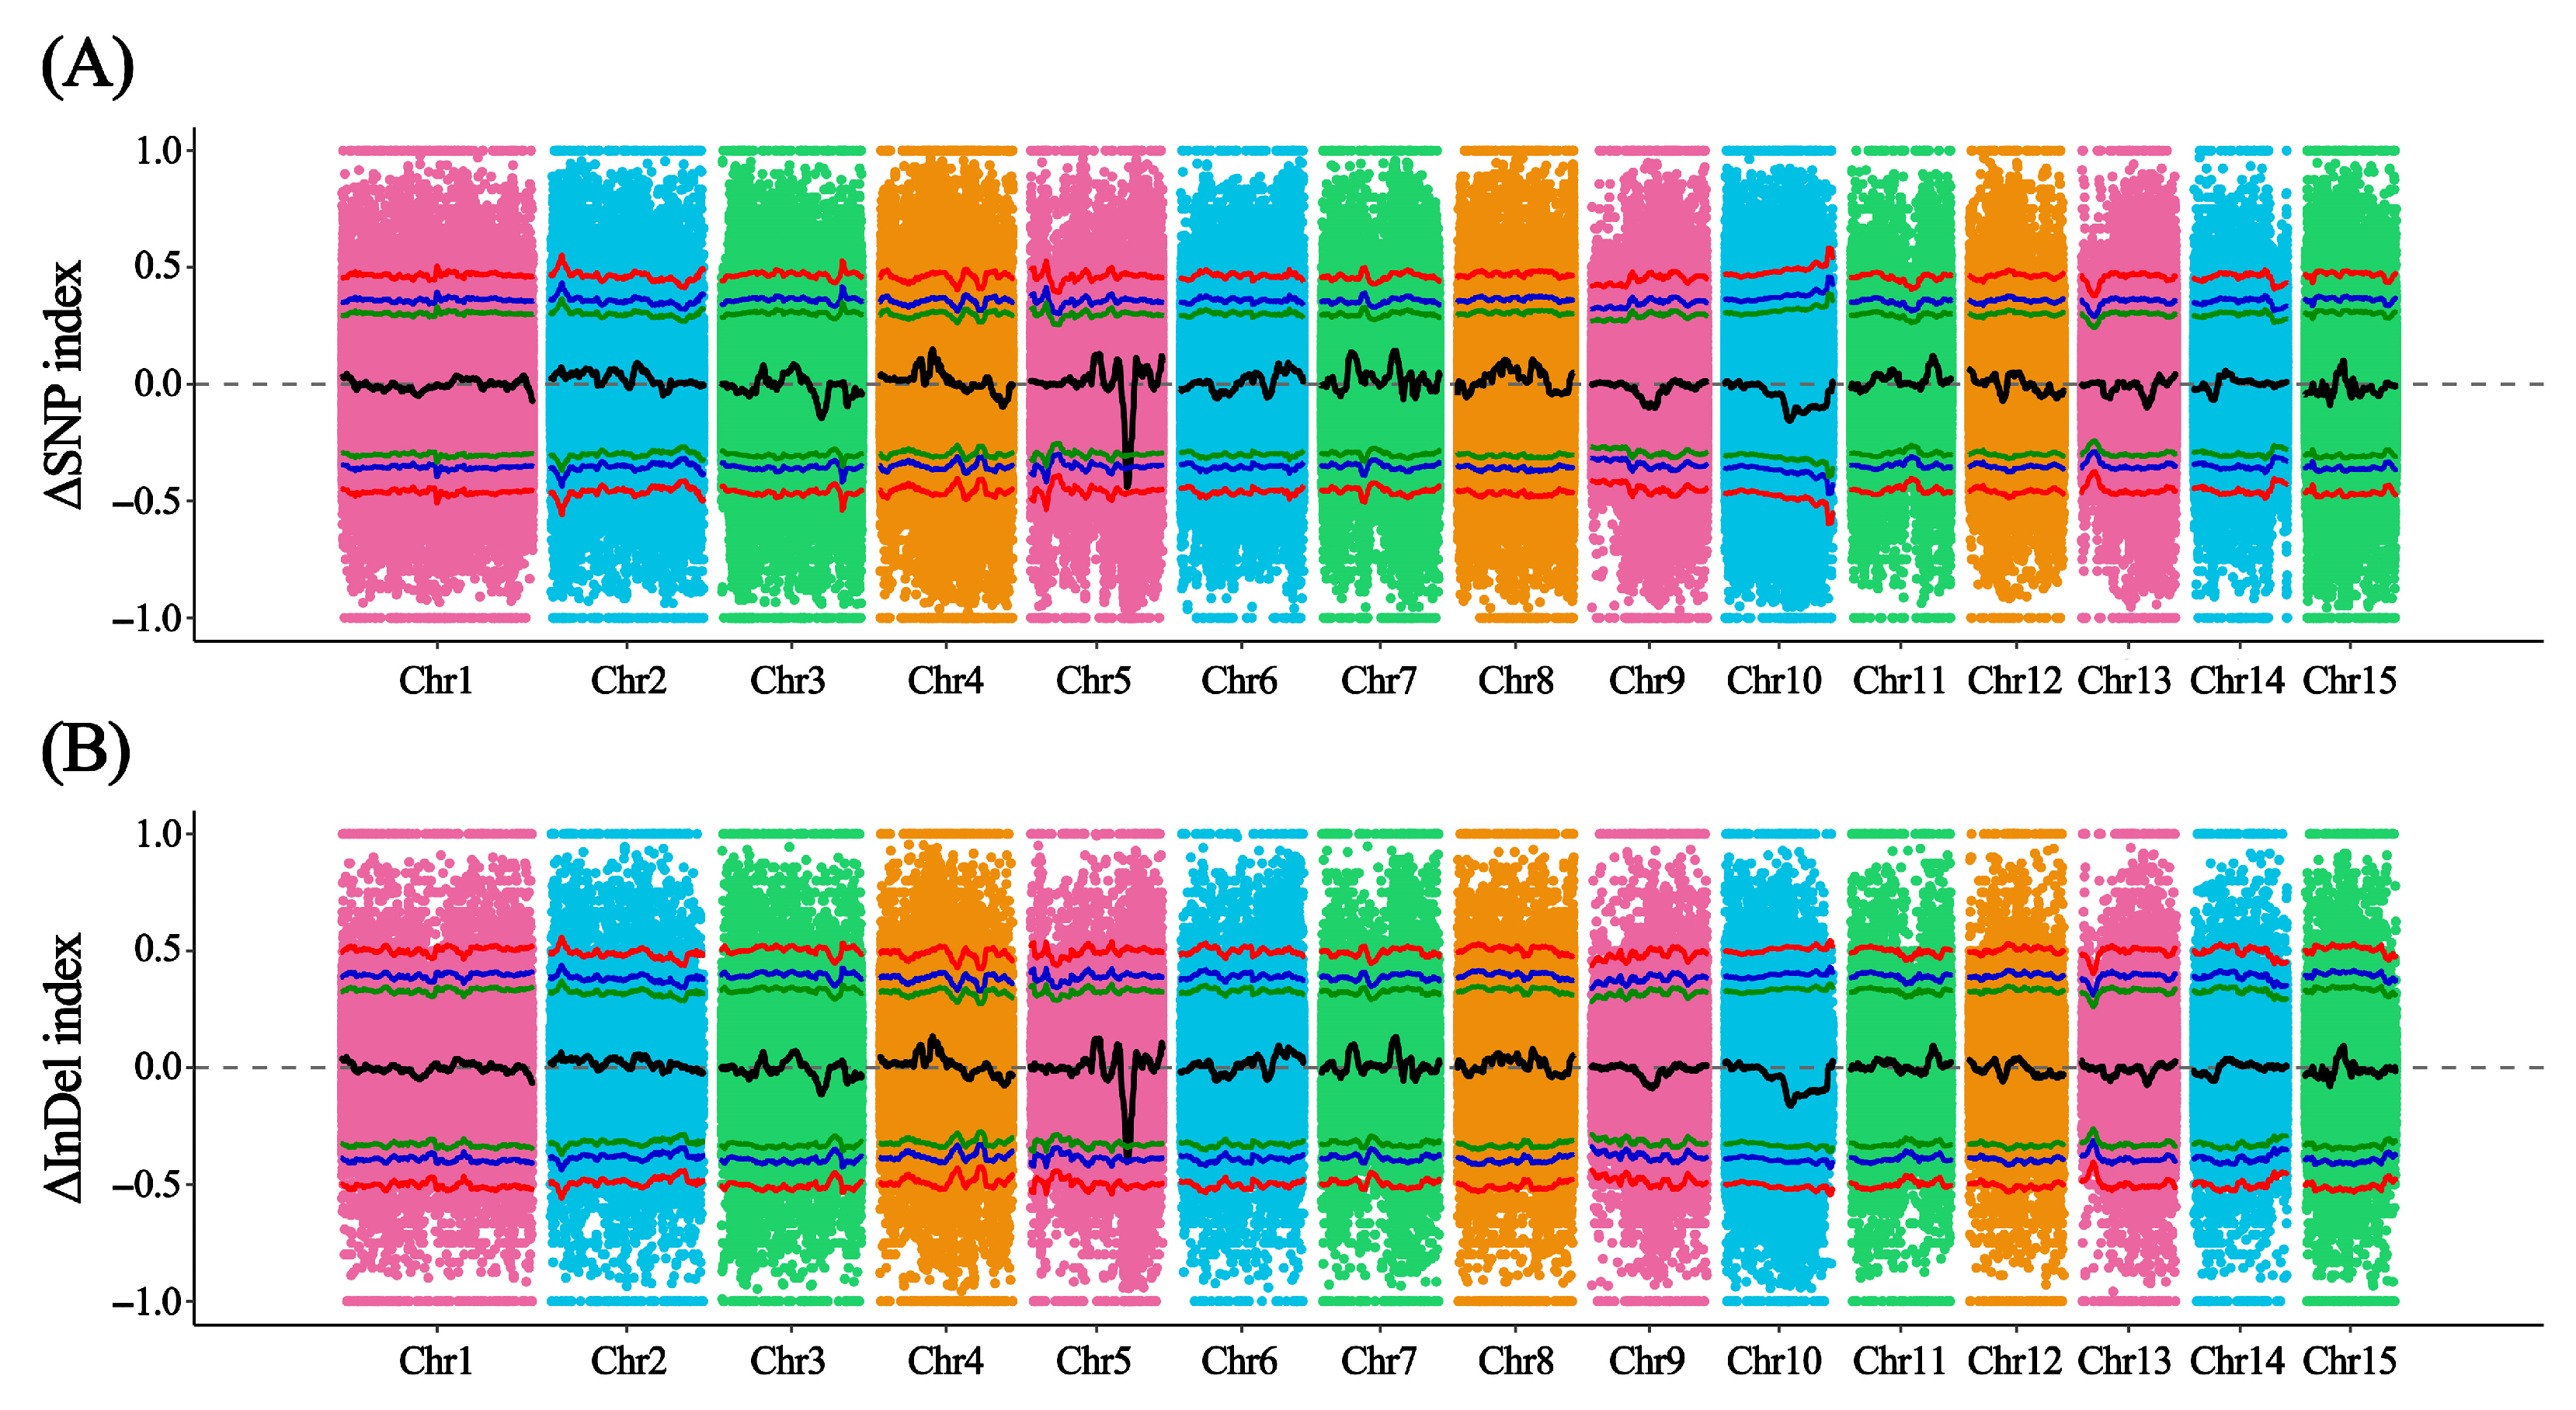
Variant analysis identified 4,601,070 SNPs and 900,110 InDels, including 2,492,276 high-quality differential SNPs and 437,547 differential InDels between pools (Tables S6 and S7). Combined ED and index analyses revealed two candidate regions on chromosome 5 (24.91–25.75 Mb and 25.86–25.88 Mb) from SNP data and one region (24.93–25.69 Mb) from InDel data (Figure 6 and Figure 7). The overlapping 24.93–25.69 Mb region contained 1600 differential SNPs and 314 differential InDels (Table S8), strongly suggesting its importance in seed size regulation.

3.4. Gene Annotation in the BSA Target Region

The 24.93–25.69 Mb region harbored 75 genes, with 67 functionally annotated across multiple databases (Table S9). KEGG enrichment identified six significantly enriched pathways (glyoxylate/dicarboxylate metabolism, MAPK signaling, plant hormone transduction, RNA polymerase, beta-alanine metabolism, and plant–pathogen interaction), implicating their potential roles in seed size regulation.

3.5. Development and Validation of InDel Markers

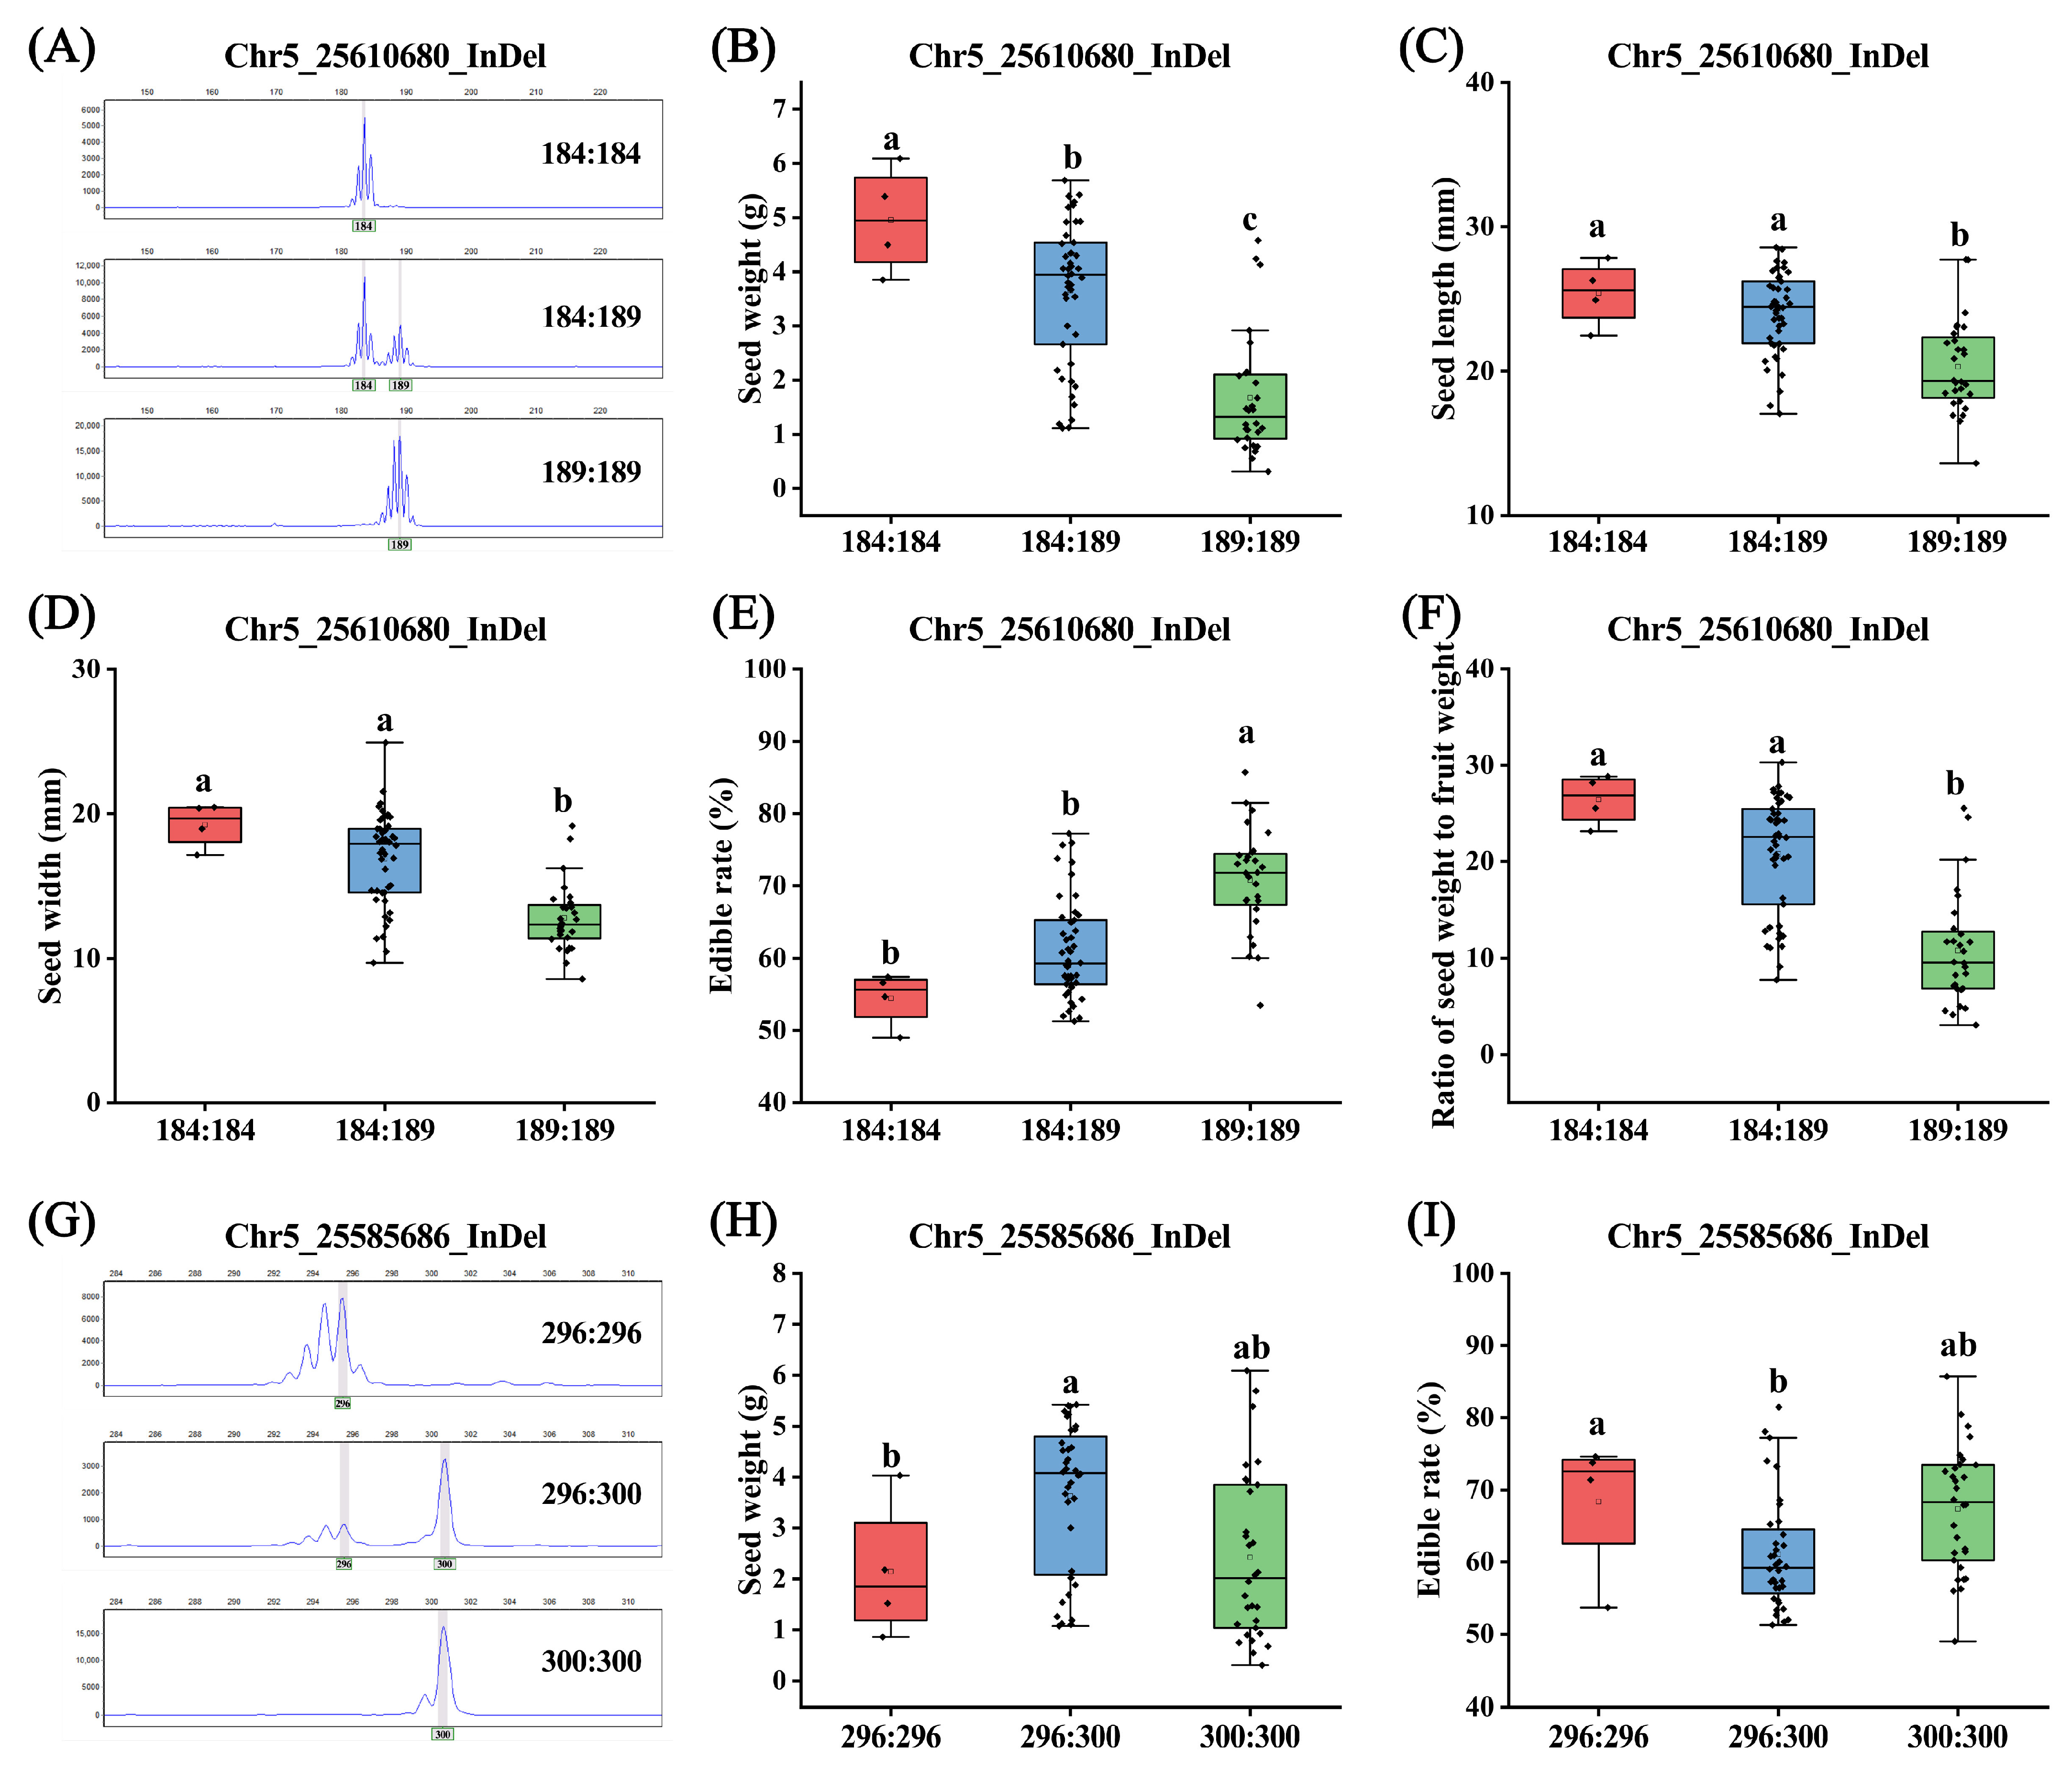
To validate BSA-seq results and develop molecular markers for breeding applications, 10 candidate InDel markers were screened across 87 accessions (Table S1). Fluorescent capillary electrophoresis analysis identified two reliable markers (Chr5_25610680_InDel and Chr5_25585686_InDel) with clear, reproducible peak patterns (Figure 8). General linear model analysis revealed significant associations between these markers and key traits: Chr5_25610680_InDel showed highly significant correlations with seed weight (32.22% phenotypic variation explained), edible rate (23.29%), seed length (22.60%), seed width (26.79%), and seed-to-fruit weight ratio (35.54%), while Chr5_25585686_InDel was significantly associated with seed weight (18.66%) and edible rate (18.94%) (Table 2).
Genotypic analysis of Chr5_25610680_InDel (genotypes: 184:184, 184:189, and 189:189) revealed significant associations with phenotypic variation: all genotypes differed significantly in seed weight. Both the 184:184 and 184:189 genotypes were associated with significantly greater seed length, width, and seed-to-fruit ratio compared to 189:189, as well as lower edible rates (Figure 8). For Chr5_25585686_InDel (genotypes: 296:296, 296:300, and 300:300), the heterozygous genotype 296:300 was associated with significantly higher seed weight than 296:296, whereas the opposite trend was observed for edible rate (Figure 8). These results suggest that the variations in this genomic region are associated with key seed traits and provide practical molecular markers for assisting seed size selection in litchi breeding.

4. Discussion

This study investigated six fruit traits across 131 early-maturing litchi accessions and identified distinct groups based on seed size, providing a valuable dataset to support the selection and breeding of high-quality, small-seeded early-maturing varieties. Significant correlations were observed among single fruit weight, seed weight, seed length, seed width, edible rate, and seed-to-fruit weight ratio, confirming their utility as reliable indicators of seed size and overall fruit quality. Phenotypic diversity analysis is fundamental to germplasm-based breeding efforts. Previous studies in litchi have extensively documented various phenotypic variation. For instance, Lal et al. evaluated 83 traits across 39 litchi genotypes, reporting broad-sense heritability exceeding 80% for most traits except trunk circumference, leaflet width, panicle length, and titratable acidity, with female flower percentage, phenolics, and flavonoid content showing the highest heritability and genetic advance [41]. Another study of 146 Chinese germplasm accessions, focusing on 18 leaf and branch traits, demonstrated that these traits could classify cultivars by fruit maturity period [42]. Furthermore, a recent study of 276 litchi accessions examining 21 fruit traits found that fruit weight, seed weight, seed longitudinal and transverse diameters, and edible rate all followed a normal distribution, which aligns with the results presented here [22].
Various methods exist for analyzing phenotype–genotype associations. While QTL mapping [19,20] and genome-wide association studies [21] have been applied in litchi, BSA-seq remains widely used in other crops due to its cost-effectiveness and simplified sample processing [43,44,45]. In this study, BSA-seq analysis of extreme seed size pools identified a 0.76 Mb candidate region (Chr5: 24.93–25.69 Mb) containing 75 genes enriched in six pathways: glyoxylate/dicarboxylate metabolism, MAPK signaling, plant hormone signal transduction, RNA polymerase, beta-alanine metabolism, and plant–pathogen interaction. These pathways are biologically relevant to seed development—glyoxylate metabolism facilitates lipid conversion during germination [46], MAPK signaling regulates cell division/differentiation in response to environmental cues [47], and hormone signaling (previously shown to affect litchi seed size [10]) controls germination-related gene expression [48]. These findings strongly suggest the candidate genes’ involvement in litchi seed size regulation, though molecular validation remains necessary. A recent genome-wide association study (GWAS) identified markers associated with seed transverse diameter and proposed several candidate genes, including wall-associated receptor kinase gene 22 (LcWAK22), UDP-glucosyltransferase 76E1 (LcUGT76E1), and a NAC transcription factor (LITCHI021007) [22]. Functional validation of these genes is required to confirm their roles in regulating seed size traits in litchi.
Within the BSA-seq target region in this study, we identified 1600 differential SNPs and 314 InDels between extreme pools. Subsequent PCR validation confirmed two highly significant InDel markers, demonstrating their potential for marker-assisted selection of seed size in litchi. While next-generation sequencing has enabled efficient SNP/InDel development for trait mapping [49,50,51,52], InDel markers offer practical advantages despite lower genomic frequency and precision than SNPs, including detection ease, high polymorphism, and versatility [53]. Additionally, InDel markers can be directly integrated into existing marker-assisted selection (MAS) systems via conventional PCR, whereas SNP markers usually require conversion into platform-specific formats, such as KASP assays, for high-throughput application. The seed abortion trait in litchi is typically assessed at fruit maturity. By contrast, the InDel markers identified in this study enable early selection at the seedling or flowering stage using leaf DNA samples, thereby reducing the breeding cycle by 3–5 years compared to conventional approaches, which often require 6–8 years. For example, in hybrid progeny, only individuals carrying the desired InDel alleles are retained, while those with non-target genotypes are eliminated, significantly improving selection efficiency.

5. Conclusions

This study evaluated six fruit traits across 131 early-maturing litchi accessions, with HCA and PCA revealing distinct grouping by seed size characteristics. BSA-seq analysis identified a candidate region (Chr5: 24.93–25.69 Mb) potentially regulating seed size, containing 1600 differential SNPs and 314 InDels between extreme pools. PCR validation across 87 accessions confirmed two significant InDel markers: Chr5_25610680_InDel showed highly significant associations with seed weight (32.22%), edible rate (23.29%), seed length (22.60%), seed width (26.79%), and seed-to-fruit ratio (35.54%), while Chr5_25585686_InDel associated with seed weight (18.66%) and edible rate (18.94%). These markers provide valuable tools for marker-assisted selection of seed size in litchi breeding programs. Future work should focus on functional validation of candidate genes within the identified region. Additionally, expanding this research to mid/late-maturing cultivars—such as by applying these InDel markers to assess their predictive accuracy across diverse germplasm—would strengthen the markers’ utility in breeding programs.

Supplementary Materials

The following supporting information can be downloaded at https://www.mdpi.com/article/10.3390/horticulturae11091079/s1, Table S1: Phenotypic data of 131 materials used in the study and sample information for BSA-seq and InDel-PCR; Table S2: Primer sequences for PCR amplification of two InDel loci; Table S3: Correlation coefficient matrix among six phenotypic traits; Table S4: Sequencing quality assessment of BSA-seq; Table S5: Statistical results of alignment between BSA-seq data and the reference genome; Table S6: SNP markers identified through BSA-seq analysis; Table S7: InDel markers identified through BSA-seq analysis; Table S8: Statistical summary of merged final regions based on BSA-seq analysis. Table S9: Candidate gene list and functional annotation from BSA-seq mapping.

Author Contributions

Conceptualization, T.Y. and Y.Z.; methodology, F.H. and Y.Z.; software, Y.Z.; validation, T.Y.; formal analysis, X.W.; investigation, Y.J., Z.C., and M.Y.; resources, X.W.; data curation, Y.Z.; writing—original draft preparation, T.Y. and Y.Z.; writing—review and editing, L.W. and F.H.; visualization, Y.Z. and T.Y.; supervision, F.H.; project administration, F.H.; funding acquisition, F.H. All authors have read and agreed to the published version of the manuscript.

Funding

This research was funded by Hainan Province’s Key Research and Development Project, grant number ZDYF2023XDNY052; Hainan Provincial Science and Technology Talent Innovation Program, grant number KJRC2023C17; China Litchi and Longan Industry Technology Research System Project, grant number CARS-32-21; and Hainan Academy of Agricultural Sciences Research Startup Fund for Introduced Talents, grant number HAAS2023RCQD23.

Data Availability Statement

The original contributions presented in this study are included in the supplementary material. Further inquiries can be directed to the corresponding author(s).

Conflicts of Interest

The authors declare no conflicts of interest.

References

  1. Guo, D.; Huang, S.; Xiang, X. Analysis of guangdong litchi production situation in 2022. Guangdong Agric. Sci. 2022, 49, 130–137. [Google Scholar]
  2. Rui, X.; Caiqin, L.; Wangjin, L.; Juan, D.; Zehuai, W.; Jianguo, L. 3-hydroxy-3-methylglutaryl coenzyme a reductase 1 (hmg1) is highly associated with the cell division during the early stage of fruit development which determines the final fruit size in litchi chinensis. Gene 2012, 498, 28–35. [Google Scholar] [CrossRef]
  3. Chen, J.; Yan, Q.; Li, J.; Feng, L.; Zhang, Y.; Xu, J.; Xia, R.; Zeng, Z.; Liu, Y. The gras gene family and its roles in seed development in litchi (Litchi chinensis Sonn). BMC Plant Biol. 2021, 21, 423. [Google Scholar] [CrossRef] [PubMed]
  4. Xie, H.; Yin, W.; Zheng, Y.; Zhang, Y.; Qin, H.; Huang, Z.; Zhao, M.; Li, J. Increased DNA methylation of the splicing regulator sr45 suppresses seed abortion in litchi. J. Exp. Bot. 2024, 75, 868–882. [Google Scholar] [CrossRef]
  5. Zhao, M.; Li, C.; Ma, X.; Xia, R.; Chen, J.; Liu, X.; Ying, P.; Peng, M.; Wang, J.; Shi, C.; et al. Knox protein knat1 regulates fruitlet abscission in litchi by repressing ethylene biosynthetic genes. J. Exp. Bot. 2020, 71, 4069–4082. [Google Scholar] [CrossRef]
  6. Xu, Z.; Wu, J.; Jing, X.; Khan, F.S.; Chen, Y.; Chen, Z.; Zhang, H.; Wei, Y. Genome-wide identification of litchi spl gene family and expression analysis in pericarp anthocyanin biosynthesis. Horticulturae 2024, 10, 762. [Google Scholar] [CrossRef]
  7. Yang, Y.; Zhang, B.; Wang, D.; Chen, L.; Zhao, M.; Huang, Q.; Wang, M.; Zhang, Z.; Qin, Y.; Zhao, J.; et al. Molecular characterization and functional roles of nac transcription factors in regulating chlorophyll degradation during litchi fruit ripening. Sci. Hortic. 2025, 341, 113975. [Google Scholar] [CrossRef]
  8. Jiang, G.; Li, Z.; Song, Y.; Zhu, H.; Lin, S.; Huang, R.; Jiang, Y.; Duan, X. Lcnac13 physically interacts with LcR1MYB1 to coregulate anthocyanin biosynthesis-related genes during litchi fruit ripening. Biomolecules 2019, 9, 135. [Google Scholar] [CrossRef] [PubMed]
  9. Ding, F.; Li, H.; Wang, J.; Peng, H.; Chen, H.; Hu, F.; Lai, B.; Wei, Y.; Ma, W.; Li, H.; et al. Development of molecular markers based on the promoter difference of lcft1 to discriminate easy- and difficult-flowering litchi germplasm resources and its application in crossbreeding. BMC Plant Biol. 2021, 21, 539. [Google Scholar] [CrossRef] [PubMed]
  10. Pathak, A.K.; Singh, S.P.; Gupta, Y.; Gurjar, A.K.S.; Mantri, S.S.; Tuli, R. Transcriptional changes during ovule development in two genotypes of litchi (Litchi chinensis Sonn.) With contrast in seed size. Sci. Rep. 2016, 6, 36304. [Google Scholar] [CrossRef]
  11. Zhang, J.; Wu, Z.; Hu, F.; Liu, L.; Huang, X.; Zhao, J.; Wang, H. Aberrant seed development in Litchi chinensis is associated with the impaired expression of cell wall invertase genes. Hortic. Res. 2018, 5, 13–39. [Google Scholar] [CrossRef] [PubMed]
  12. Xie, D.; Ma, X.; Rahman, M.Z.; Yang, M.; Huang, X.; Li, J.; Wang, H. Thermo-sensitive sterility and self-sterility underlie the partial seed abortion phenotype of litchi chinensis. Sci. Hortic. 2019, 247, 156–164. [Google Scholar] [CrossRef]
  13. Liu, W.; Xiao, Z.; Bao, X.; Yang, X.; Fang, J.; Xiang, X. Identifying litchi (Litchi chinensis sonn.) Cultivars and their genetic relationships using single nucleotide polymorphism (snp) markers. PLoS ONE 2015, 10, e135390. [Google Scholar] [CrossRef]
  14. Madhou, M.; Normand, F.; Bahorun, T.; Hormaza, J.I. Fingerprinting and analysis of genetic diversity of litchi (Litchi chinensis Sonn.) Accessions from different germplasm collections using microsatellite markers. Tree Genet. Genomes 2013, 9, 387–396. [Google Scholar] [CrossRef]
  15. Tran, H.; Kanzaki, S.; Triest, L.; Hormaza, I.; Kuk, N.J.; Ming, R.; Bousquet, J.; Khasa, D.; Van Damme, P. Analysis of genetic diversity of lychee (Litchi chinensis Sonn.) And wild forest relatives in the sapindaceae from vietnam using microsatellites. Genet. Resour. Crop Ev. 2019, 66, 1653–1669. [Google Scholar] [CrossRef]
  16. Pathak, A.K.; Singh, S.P.; Tuli, R. Amplified fragment length polymorphism fingerprinting to identify genetic relatedness among lychee cultivars and markers associated with small-seeded cultivars. J. Am. Soc. Hortic. Sci. 2014, 139, 657–668. [Google Scholar] [CrossRef]
  17. Long, Y.; Cheng, J.; Mei, Z.; Zhao, L.; Wei, C.; Fu, S.; Khan, M.A.; Fu, J. Genetic analysis of litchi (Litchi chinensis Sonn.) In southern China by improved random amplified polymorphic dna (RAPD) and inter-simple sequence repeat (ISSR). Mol. Biol. Rep. 2015, 42, 159–166. [Google Scholar] [CrossRef]
  18. Cheng, J.; Long, Y.; Khan, M.A.; Wei, C.; Fu, S.; Fu, J. Development and significance of rapd-scar markers for the identification of Litchi chinensis Sonn. By improved RAPD amplification and molecular cloning. Electron. J. Biotechnol. 2015, 18, 35–39. [Google Scholar] [CrossRef]
  19. Hu, F.; Chen, Z.; Wang, X.; Wang, J.; Fan, H.; Qin, Y.; Zhao, J.; Hu, G. Construction of high-density SNP genetic maps and QTL mapping for dwarf-related traits in litchi chinensis sonn. J. Integr. Agr. 2021, 20, 2900–2913. [Google Scholar] [CrossRef]
  20. Zhang, L.; Wang, P.; Li, F.; Xu, L.; Zhao, J.; Fu, J.; Wang, J.; Zhang, H.; Li, S.; Hong, J.; et al. Litchi40k v1.0: A cost-effective, flexible, and versatile liquid SNP chip for genetic analysis and digitalization of germplasm resources in litchi. Hortic. Res. 2025, 12, uhaf38. [Google Scholar] [CrossRef]
  21. Hu, G.; Feng, J.; Xiang, X.; Wang, J.; Salojarvi, J.; Liu, C.; Wu, Z.; Zhang, J.; Liang, X.; Jiang, Z.; et al. Two divergent haplotypes from a highly heterozygous lychee genome suggest independent domestication events for early and late-maturing cultivars. Nat. Genet. 2022, 54, 73–83. [Google Scholar] [CrossRef] [PubMed]
  22. Yan, Q.; Feng, J.; Chen, J.; Wen, Y.; Jiang, Y.; Mai, Y.; Huang, K.; Liu, H.; Liu, H.; Shi, F.; et al. Comprehensive genomic and phenotypic analyses reveal the genetic basis of fruit quality in litchi. Genome Biol. 2025, 26, 222. [Google Scholar] [CrossRef]
  23. Sonsungsan, P.; Nganga, M.L.; Lieberman, M.C.; Amundson, K.R.; Stewart, V.; Plaimas, K.; Comai, L.; Henry, I.M. A k-mer-based bulked segregant analysis approach to map seed traits in unphased heterozygous potato genomes. G3 Genes Genomes Genet. 2024, 14, jkae035. [Google Scholar] [CrossRef]
  24. Dougherty, L.; Brown, S.; Xu, K. Dwarf tree habit is a recessive phenotype independent of the dominant columnar growth in scion apples and controlled by multiple genomic loci and their epistatic interactions. J. Exp. Bot. 2025, 14, eraf372. [Google Scholar] [CrossRef]
  25. Wang, L.; Pan, L.; Niu, L.; Cui, G.; Wei, B.; Zeng, W.; Wang, Z.; Lu, Z. Fine mapping of the gene controlling the weeping trait of Prunus persica and its uses for mas in progenies. BMC Plant Biol. 2022, 22, 459. [Google Scholar] [CrossRef] [PubMed]
  26. Niu, T.; Chen, L.; Wang, E.; Wei, D.; Li, Y.; Li, R.; Wang, D.; Guo, L.; Hou, X. Hmgr regulates floral fragrance through terpene synthesis pathway in Paeonia suffruticosa. Ind. Crop. Prod. 2025, 224, 120418. [Google Scholar] [CrossRef]
  27. Vasimuddin, M.; Misra, S.; Li, H.; Aluru, S. Efficient Architecture-Aware Acceleration of Bwa-Mem for Multicore Systems, 2019; IEEE: New York, NY, USA, 2019. [Google Scholar]
  28. Li, H.; Handsaker, B.; Wysoker, A.; Fennell, T.; Ruan, J.; Homer, N.; Marth, G.; Abecasis, G.; Durbin, R. The sequence alignment/map format and samtools. Bioinformatics 2009, 25, 2078–2079. [Google Scholar] [CrossRef]
  29. Mckenna, A.; Hanna, M.; Banks, E.; Sivachenko, A.; Cibulskis, K.; Kernytsky, A.; Garimella, K.; Altshuler, D.; Gabriel, S.; Daly, M.; et al. The genome analysis toolkit: A mapreduce framework for analyzing next-generation DNA sequencing data. Genome Res. 2010, 20, 1297–1303. [Google Scholar] [CrossRef]
  30. Cingolani, P.; Platts, A.; Wang, L.L.; Coon, M.; Nguyen, T.; Wang, L.; Land, S.J.; Lu, X.; Ruden, D.M. A program for annotating and predicting the effects of single nucleotide polymorphisms, snpeff: SNPs in the genome of Drosophila melanogaster strain w1118; Iso-2; Iso-3. Fly 2012, 6, 80–92. [Google Scholar] [CrossRef]
  31. Hill, J.T.; Demarest, B.L.; Bisgrove, B.W.; Gorsi, B.; Su, Y.; Yost, H.J. Mmappr: Mutation mapping analysis pipeline for pooled RNA-seq. Genome Res. 2013, 23, 687–697. [Google Scholar] [CrossRef] [PubMed]
  32. Takagi, H.; Abe, A.; Yoshida, K.; Kosugi, S.; Natsume, S.; Mitsuoka, C.; Uemura, A.; Utsushi, H.; Tamiru, M.; Takuno, S.; et al. Qtl-seq: Rapid mapping of quantitative trait loci in rice by whole genome resequencing of dna from two bulked populations. Plant J. 2013, 74, 174–183. [Google Scholar] [CrossRef]
  33. Pruitt, K.D.; Tatusova, T.; Maglott, D.R. Ncbi reference sequences (refseq): A curated non-redundant sequence database of genomes, transcripts and proteins. Nucleic Acids Res. 2007, 35, D61. [Google Scholar] [CrossRef]
  34. Finn, R.D.; Coggill, P.; Eberhardt, R.Y.; Eddy, S.R.; Mistry, J.; Mitchell, A.L.; Potter, S.C.; Punta, M.; Qureshi, M.; Sangrador-Vegas, A.; et al. The pfam protein families database: Towards a more sustainable future. Nucleic Acids Res. 2016, 44, D279–D285. [Google Scholar] [CrossRef] [PubMed]
  35. Tatusov, R.L.; Galperin, M.Y.; Natale, D.A.; Koonin, E.V. The cog database: A tool for genome-scale analysis of protein functions and evolution. Nucleic Acids Res. 2000, 28, 33. [Google Scholar] [CrossRef]
  36. Bairoch, A.; Apweiler, R. Swiss-prot protein sequence database and its supplement trembl in 2000. Nucleic Acids Res. 2000, 28, 45–48. [Google Scholar] [CrossRef]
  37. Ogata, H.; Goto, S.; Sato, K.; Fujibuchi, W.; Bono, H.; Kanehisa, M. Kegg: Kyoto encyclopedia of genes and genomes. Nucleic Acids Res. 1999, 27, 29–34. [Google Scholar] [CrossRef] [PubMed]
  38. Ashburner, M.; Ball, C.A.; Blake, J.A.; Botstein, D.; Butler, H.; Cherry, J.M.; Davis, A.P.; Dolinski, K.; Dwight, S.S.; Eppig, J.T.; et al. Gene ontology: Tool for the unification of biology. The gene ontology consortium. Nat. Genet. 2000, 25, 25. [Google Scholar] [CrossRef]
  39. R Core Team. R: A Language and Environment for Statistical Computing; R Foundation for Statistical Computing: Vienna, Austria, 2023; Available online: https://www.R-project.org/ (accessed on 11 June 2025).
  40. Bradbury, P.J.; Zhang, Z.; Kroon, D.E.; Casstevens, T.M.; Ramdoss, Y.; Buckler, E.S. Tassel: Software for association mapping of complex traits in diverse samples. Bioinformatics 2007, 23, 2633–2635. [Google Scholar] [CrossRef]
  41. Lal, N.; Pandey, S.K.; Pandey, S.D.; Nath, V. Genetic diversity and grouping of litchi genotypes based on 83 qualitative and quantitative traits. Erwerbsobstbau 2023, 65, 1003–1012. [Google Scholar] [CrossRef]
  42. Wu, J.; Zhang, C.; Chen, J.; Cai, C.; Wang, L.; Fu, D.; Ou, L. Morphological diversity within litchi (Litchi chinensis Sonn.) Based on leaf and branch traits. Sci. Hortic. 2016, 207, 21–27. [Google Scholar] [CrossRef]
  43. Chen, L.; Meng, H.; Chen, B.; Xie, S.; Liu, W.; Wang, M.; Yan, J.; Cai, J.; Yang, S.; Jiang, B.; et al. Identification of candidate genes controlling cucumber hypocotyl elongation under low light stress based on BSA-seq and RNA-seq. Sci. Hortic. 2024, 337, 113488. [Google Scholar] [CrossRef]
  44. Sun, H.; Ren, L.; Qi, F.; Wang, H.; Yu, S.; Sun, Z.; Huang, B.; Han, S.; Shi, P.; Wang, Y.; et al. Bsa-seq approach identified candidate region and diagnostic marker for chilling tolerance of high oleic acid peanut at germination stage. Agronomy 2023, 13, 18. [Google Scholar] [CrossRef]
  45. Wang, L.; Zhang, S.; Jiao, C.; Li, Z.; Liu, C.; Wang, X. Qtl-seq analysis of the seed size trait in grape provides new molecular insights on seedlessness. J. Integr. Agr. 2022, 21, 2910–2925. [Google Scholar] [CrossRef]
  46. Graham, I.A. Seed storage oil mobilization. Annu. Rev. Plant Biol. 2008, 59, 115–142. [Google Scholar] [CrossRef]
  47. Xu, J.; Zhang, S. Mitogen-activated protein kinase cascades in signaling plant growth and development. Trends Plant Sci. 2015, 20, 56–64. [Google Scholar] [CrossRef]
  48. Santner, A.; Calderon-Villalobos, L.I.A.; Estelle, M. Plant hormones are versatile chemical regulators of plant growth. Nat. Chem. Biol. 2009, 5, 301–307. [Google Scholar] [CrossRef] [PubMed]
  49. Liu, X.; Geng, X.; Zhang, H.; Shen, H.; Yang, W. Association and genetic identification of loci for four fruit traits in tomato using indel markers. Front. Plant Sci. 2017, 8, 1269. [Google Scholar] [CrossRef] [PubMed]
  50. Pan, R.; Zhu, Q.; Jia, X.; Li, B.; Li, Z.; Xiao, Y.; Luo, S.; Wang, S.; Shan, N.; Sun, J.; et al. Genome-wide development of indel-ssrs and association analysis of important agronomic traits of taro (Colocasia esculenta) in China. Curr. Issues Mol. Biol. 2024, 46, 13347–13363. [Google Scholar] [CrossRef] [PubMed]
  51. Yang, H.; Song, J.; Qiao, C.; Duan, K.; Feng, P.; Kong, W.; Bai, T.; Zhu, C.; Ma, S.; Zhang, Y.; et al. Genome-wide association studies of salt-tolerance-related traits in rice at the seedling stage using indel markers developed by the genome re-sequencing of japonica rice accessions. Agriculture 2023, 13, 1573. [Google Scholar] [CrossRef]
  52. Seal, A.; Gupta, A.; Mahalaxmi, M.; Aykkal, R.; Singh, T.R.; Arunachalam, V. Tools, resources and databases for snps and indels in sequences: A review. Int. J. Bioinform. Res. Appl. 2014, 10, 264. [Google Scholar] [CrossRef]
  53. Pan, G.; Li, Z.; Huang, S.; Tao, J.; Shi, Y.; Chen, A.; Li, J.; Tang, H.; Chang, L.; Deng, Y.; et al. Genome-wide development of insertion-deletion (Indel) markers for cannabis and its uses in genetic structure analysis of Chinese germplasm and sex-linked marker identification. BMC Genom. 2021, 22, 595. [Google Scholar] [CrossRef] [PubMed]
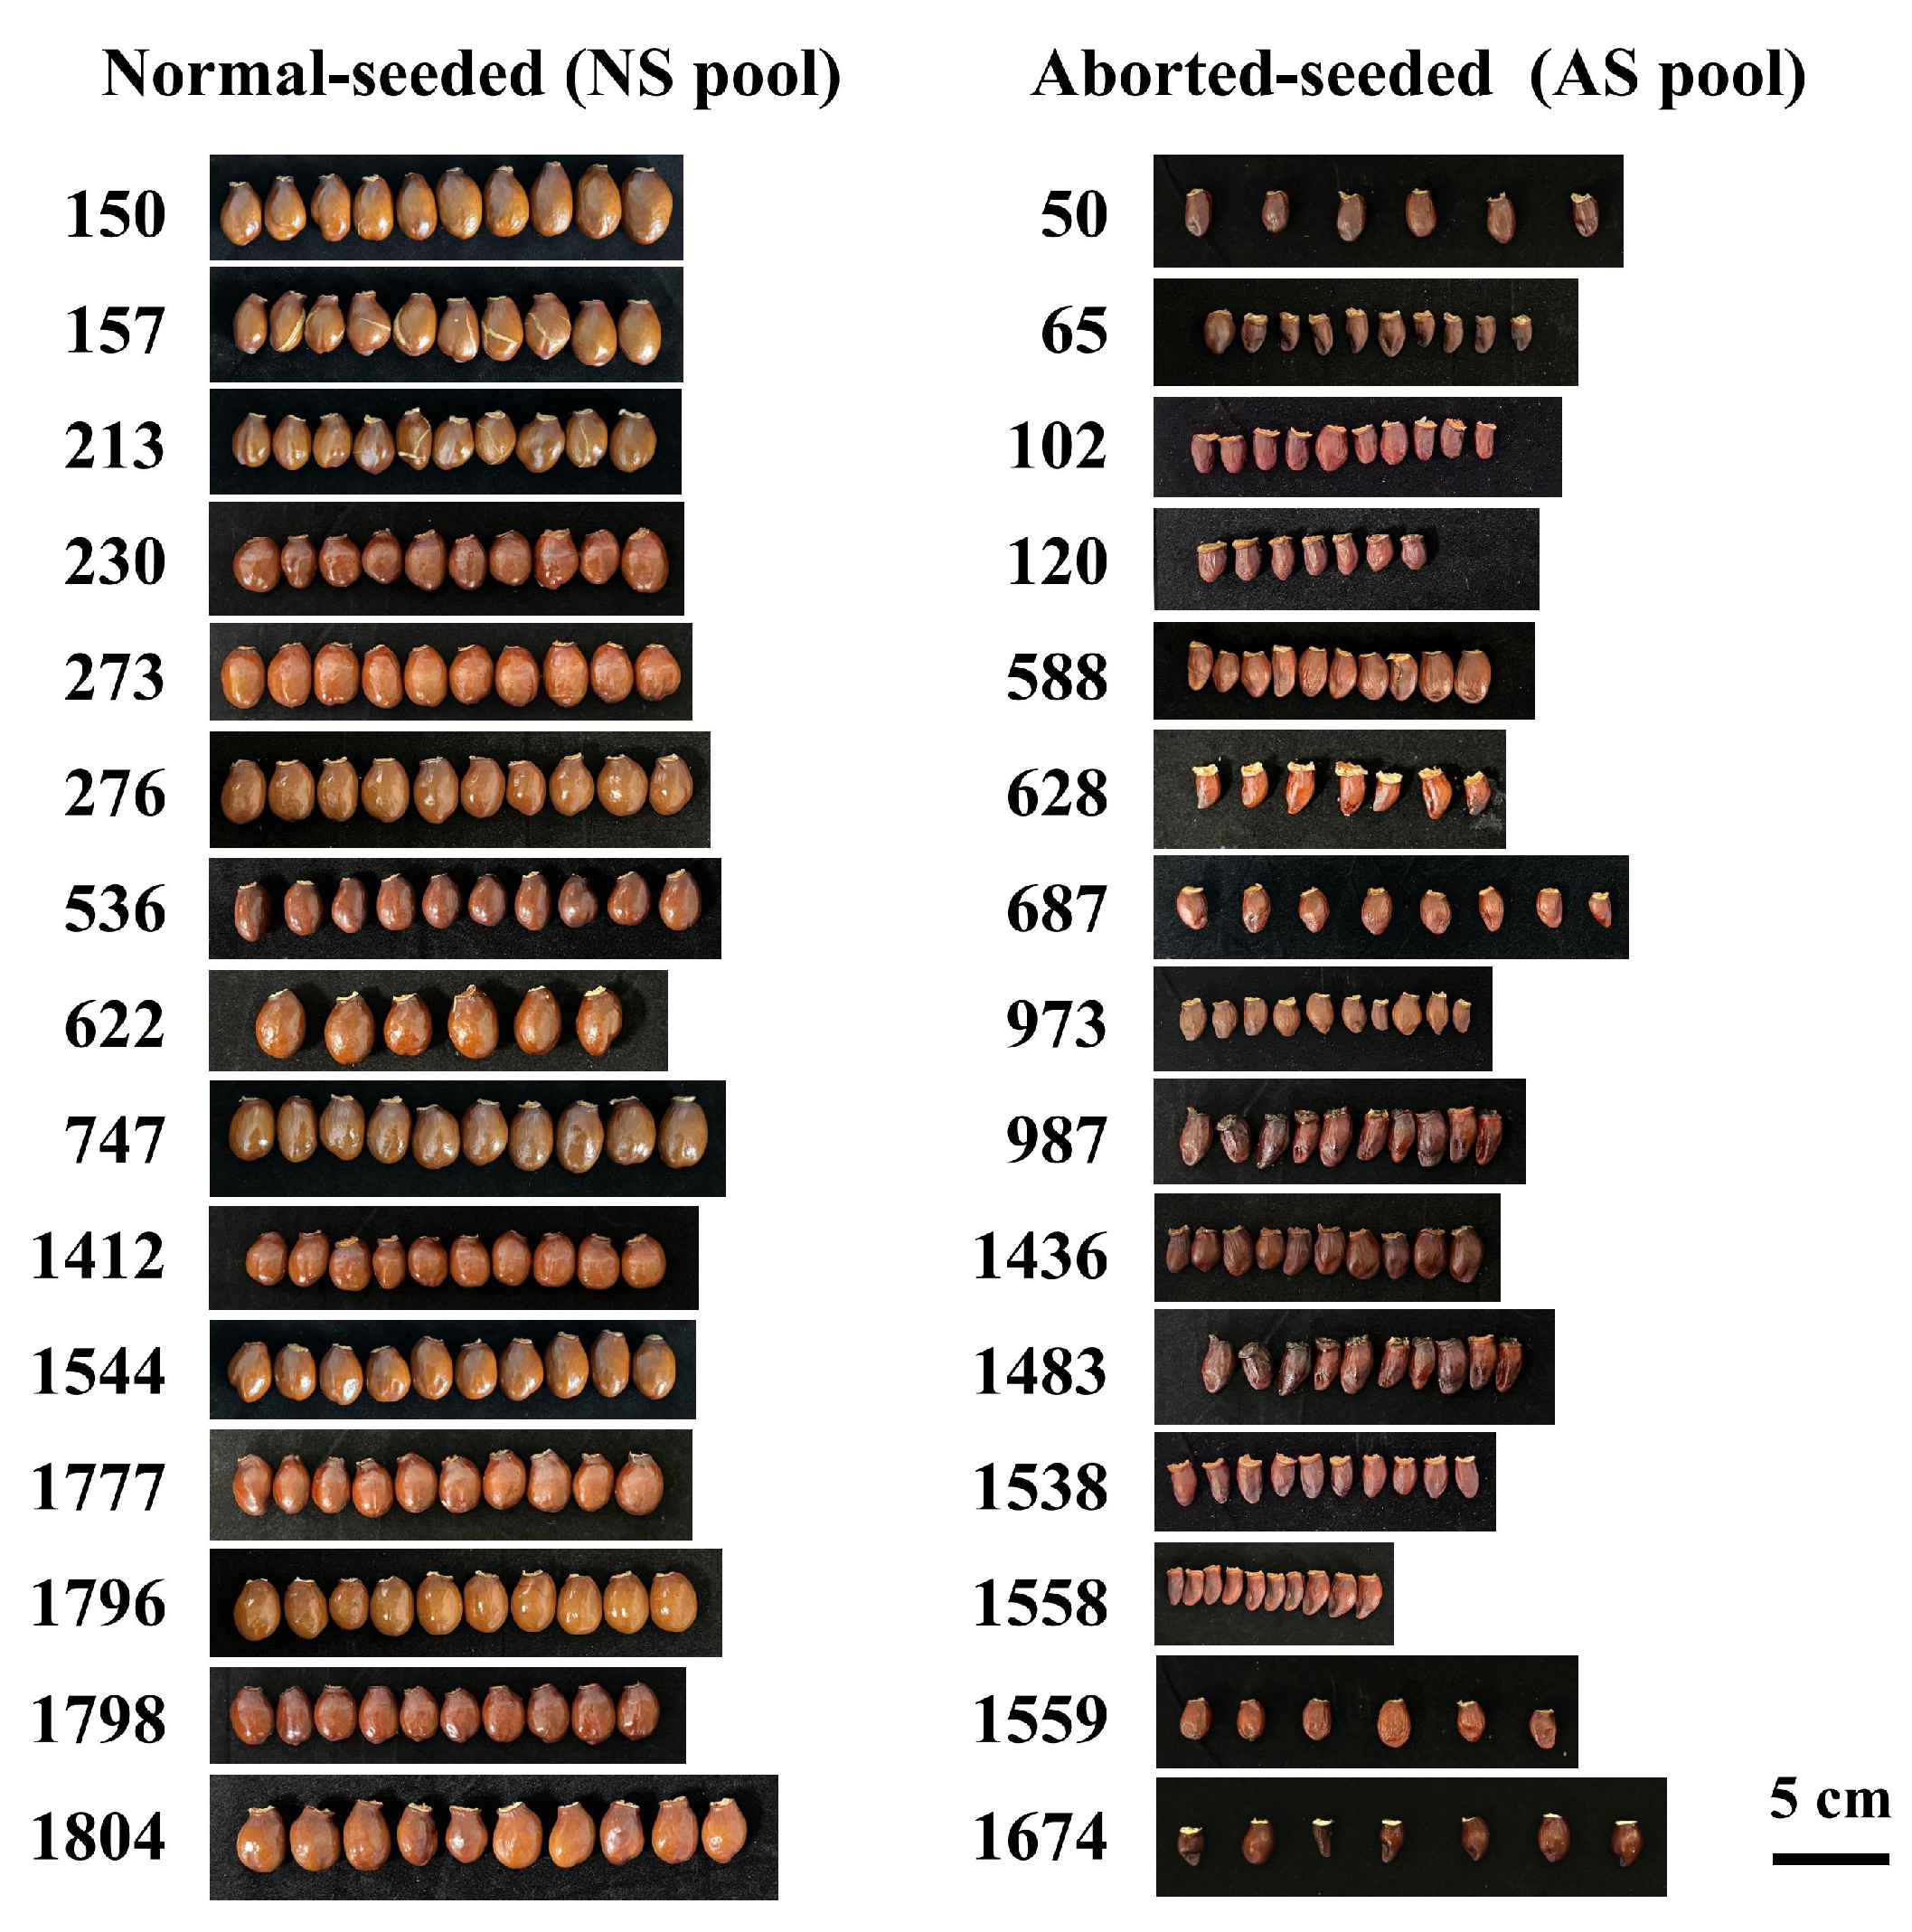
Figure 1. Photographs of seeds from 30 accessions used for BSA-seq. The numbers on the left of each seed indicate the corresponding accession codes.
Horticulturae 11 01079 g001
Figure 2. Frequency distribution histograms of six fruit-related traits. The curve (solid line) represents the fitted normal distribution.
Horticulturae 11 01079 g002
Figure 3. Heatmap of Pearson correlation analysis among six fruit-related traits. ** indicates significance at p < 0.01.
Horticulturae 11 01079 g003
Figure 4. Hierarchical cluster analysis of 131 early-maturing litchi accessions based on six fruit-related traits.
Horticulturae 11 01079 g004
Figure 5. Principal component analysis of six fruit traits. (A) PCA score plot with Group 1 and Group 2 representing HCA-derived clusters. (B) PCA loading plot.
Horticulturae 11 01079 g005
Figure 6. BSA-seq linkage analysis using the Euclidean distance (ED) algorithm. (A) SNPs; (B) InDels. Colored dots represent the ED value for each SNP or InDel locus. The black line indicates the fitted ED values, with higher ED values suggesting stronger associations at the locus. The red dashed line denotes the significance threshold (defined as the median plus three standard deviations of all fitted ED values, calculated as 0.21).
Horticulturae 11 01079 g006
Figure 7. BSA-seq linkage analysis based on the ΔSNP index and ΔInDel index. (A) SNPs; (B) InDels. Colored dots represent the calculated ΔSNP index (or ΔInDel index) values, while the black line denotes the fitted ΔSNP index (or ΔInDel index) curve. The red, blue, and green lines indicate the threshold curves at confidence levels of 0.99, 0.95, and 0.90, respectively.
Horticulturae 11 01079 g007
Figure 8. Comparative analysis of fruit traits among different genotypes at significant InDel loci. (A) Representative genotype peak pattern of Chr5_25610680_InDel; (BF) comparisons of seed weight (B), seed length (C), seed width (D), edible rate (E), and seed-to-fruit weight ratio (F) among different genotypes of Chr5_25610680_InDel; (G) representative genotype peak pattern of Chr5_25585686_InDel; (H,I) comparisons of seed width (H) and edible rate (I) among different genotypes of Chr5_25585686_InDel. Significant differences among groups (p < 0.05) were determined by the least significant difference (LSD) test, as indicated by different lowercase letters.
Horticulturae 11 01079 g008
Table 1. Variation analysis of six fruit-related traits in 131 early-maturing litchi accessions.
TraitMinMaxMeanSDSkewnessKurtosisCV
Single fruit weight (g)9.0726.5316.913.800.26−0.010.22
Seed weight (g)0.316.393.091.56−0.08−1.220.50
Seed length (mm)13.6129.5522.943.37−0.35−0.700.15
Seed width (mm)7.6124.9215.523.44−0.06−0.840.22
Edible rate (%)49.0085.7263.978.070.38−0.740.13
Ratio of seed weight to fruit weight (%)3.0431.7017.727.50−0.26−1.180.42
Table 2. Association analysis results between two InDel markers and major fruit traits.
TraitLocip-ValuePermutation p-ValueR2
Ratio of seed weight to fruit weightChr5_25610680_InDel5.42 × 10−80.00135.54%
Seed weightChr5_25610680_InDel4.17 × 10−70.00132.22%
Seed widthChr5_25610680_InDel9.36 × 10−60.00126.79%
Edible rateChr5_25610680_InDel6.11 × 10−50.00123.29%
Seed lengthChr5_25610680_InDel8.77 × 10−50.00122.60%
Edible rateChr5_25585686_InDel5.49 × 10−40.00118.94%
Seed weightChr5_25585686_InDel6.30 × 10−40.00118.66%
Disclaimer/Publisher’s Note: The statements, opinions and data contained in all publications are solely those of the individual author(s) and contributor(s) and not of MDPI and/or the editor(s). MDPI and/or the editor(s) disclaim responsibility for any injury to people or property resulting from any ideas, methods, instructions or products referred to in the content.