Article

Mapping of Leaf Pigments in Lettuce via Hyperspectral Imaging and Machine Learning

by
João Vitor Ferreira Gonçalves
1,2,
Renan Falcioni
2,3,*,
Thiago Rutz
1,
Andre Luiz Biscaia Ribeiro da Silva
1,*,
Renato Herrig Furlanetto
4,
Luís Guilherme Teixeira Crusiol
5,
Karym Mayara de Oliveira
2,
Caio Almeida de Oliveira
2,
Nicole Ghinzelli Vedana
2,
José Alexandre Melo Demattê
6 and
Marcos Rafael Nanni
2
1
Department of Horticulture, Auburn University, Auburn, AL 36849, USA
2
Graduate Program of Agronomy, State University of Maringá, Maringá 87020-900, PR, Brazil
3
Department of Biology, State University of Maringá, Av. Colombo, 5790, Maringá 87020-900, PR, Brazil
4
Gulf Coast Research and Education Center, University of Florida, Wimauma, FL 33598, USA
5
Embrapa Soja (National Soybean Research Center—Brazilian Agricultural Research Corporation), Londrina 86001-970, PR, Brazil
6
Department of Soil Science, Luiz de Queiroz College of Agriculture, University of São Paulo, Av. Pádua Dias, 11, Piracicaba 13418-260, SP, Brazil
*
Authors to whom correspondence should be addressed.
Horticulturae 2025, 11(9), 1077; https://doi.org/10.3390/horticulturae11091077
Submission received: 10 August 2025 / Revised: 3 September 2025 / Accepted: 3 September 2025 / Published: 5 September 2025
(This article belongs to the Section Vegetable Production Systems)

Abstract

The nutritional and commercial value of lettuce (Lactuca sativa L.) is determined by its foliar pigment and phenolic composition, which varies among cultivars. This study aimed to assess the capacity of hyperspectral and applied multispectral imaging, combined with machine learning algorithms, to predict and map key biochemical traits, such as chloroplastidic pigments (chlorophylls and carotenoids) and extrachloroplastidic pigments (anthocyanins, flavonoids, and phenolic compounds). Eleven cultivars exhibiting contrasting pigmentation profiles were grown under controlled greenhouse conditions, and their chlorophyll a and b, carotenoid, anthocyanin, flavonoid, and total phenolic contents were evaluated. Spectral reflectance data were acquired via a Headwall hyperspectral sensor and a MicaSense multispectral sensor, and the pigment contents were quantified via solvent extraction and a UV microplate reader. We developed predictive models via seven machine learning approaches, with partial least squares regression (PLSR) and random forest (RF) emerging as the most robust algorithms for pigment estimation. Chlorophyll a and b are highly and positively correlated (r > 0.9), which is consistent with their hyperspectral reflectance imaging results. The hyperspectral data consistently outperformed the multispectral data in terms of predictive accuracy (e.g., R2 = 0.91 and 0.76 for anthocyanins and flavonoids via RF) and phenolic compounds with R2 = 0.79, capturing subtle spectral features linked to biochemical variation. Spatial maps revealed strong genotype-dependent heterogeneity in pigment and phenolic distributions, supporting the potential of this approach for cultivar discrimination and pigment phenotyping. These findings demonstrate that hyperspectral imaging integrated with data-driven modelling offers a powerful, nondestructive framework for the biochemical monitoring of leafy vegetables, supporting breeding, precision agriculture, and food quality assessment.

1. Introduction

Lettuce (Lactuca sativa L.) is one of the most widely cultivated leafy vegetables worldwide and is valued not only for its nutritional benefits but also for its commercial importance in both the fresh market and processed food industries [1,2,3,4]. It is a rich source of essential nutrients, including vitamins, minerals, and bioactive compounds such as chlorophylls, carotenoids, anthocyanins, flavonoids, and other phenolic compounds. These bioactive components are known for their potential health benefits, particularly their antioxidant, anti-inflammatory, and anticancer properties [3]. The concentration and composition of these phytochemicals can vary significantly among different lettuce cultivars, driven by both genetic factors and environmental conditions.
The variability in phytochemical content across lettuce varieties affects not only their health-promoting properties but also their sensory attributes, such as taste, color, and texture [5,6]. Given the growing interest in functional foods, there is an increasing demand for varieties that are rich in bioactive compounds, particularly those that contain high levels of antioxidants such as flavonoids and anthocyanins [7,8]. Consequently, accurate and efficient methods for assessing the biochemical composition of lettuce are necessary for identifying superior cultivars with increased nutritional value [9]. Although accurate, traditional methods of biochemical analysis, such as liquid chromatography and spectrophotometric assays, are often labour intensive, destructive, and limited in spatial resolution [10].
Compared with these traditional methods, hyperspectral and multispectral imaging technologies have emerged as powerful, nondestructive alternatives, offering the ability to capture high-resolution spectral data across a broad range of wavelengths [11,12]. Systems such as Headwall and MicaSense enable the collection of detailed spectral information that can be linked to the chemical composition of plant tissues. In particular, hyperspectral imaging provides continuous spectral coverage with high spectral resolution, allowing the identification of subtle differences in plant biochemical composition [13,14,15]. Several studies have employed the MicaSense multispectral sensor to assess pigments and biochemical variation in various horticultural crops, such as tomato, pepper, strawberry, and grapevine. For example, Vigneault et al. (2024) [16] demonstrated the utility of MicaSense in estimating biochemical and biophysical parameters and maturity in Romaine lettuce, whereas Zsebő et al. (2024) [17] applied the sensor to map the spatial variability of chlorophyll and carotenoids in winter wheat canopies under greenhouse conditions. Despite the practical advantages of MicaSense (cost, ease of operation), these studies reported moderate predictive accuracy (typically R2 values between 0.55 and 0.75), especially for secondary metabolites, due to the limited number and width of spectral bands. Our study corroborates these findings, showing that although MicaSense can effectively predict some pigment traits in lettuce, hyperspectral imaging yields superior results, particularly for anthocyanins and flavonoids. These imaging technologies, when combined with advanced machine learning algorithms, can facilitate the development of predictive models that can accurately quantify the concentrations of key phytochemicals, including chlorophylls, carotenoids, flavonoids, anthocyanins, and phenolic compounds, in lettuce leaves [18,19]. However, MicaSense sensors contain only a limited number of broad spectral bands, which aggregate information from wider wavelength ranges. As a result, their efficiency in capturing fine spectral details is often lower than that of hyperspectral sensors, despite being more cost-effective and simpler to operate. This spectral coarseness may limit their ability to resolve subtle biochemical differences, particularly in complex plant phenotyping tasks.
Machine learning models such as partial least squares (PLS) regression, random forest (RF), and neural networks (NNs) have proven to be highly effective in the analysis of hyperspectral and multispectral data [20,21]. These algorithms can learn complex relationships between spectral data and biochemical traits, enabling the accurate prediction of pigment and phenolic compound concentrations. The ability to develop robust models that can predict biochemical composition on the basis of spectral features opens up the possibility of creating detailed spatial maps of plant traits, such as pigment distributions and variety-specific imaging biochemical profiles [22,23].
Furthermore, hyperspectral and multispectral imaging provide a unique opportunity to monitor the spatial variability of biochemical traits within the plant canopy, which is essential for precision agriculture applications. The use of spatially explicit maps allows for the identification of areas within a crop field that exhibit different biochemical compositions, which may be indicative of the variability of biochemical traits within the plant canopy, which is essential for precision agriculture applications (e.g., nitrogen, phosphorus, potassium, and micronutrients such as iron and magnesium; water stress; or disease resistance) [24,25,26,27,28]. By linking these spectral data to crop management practices, it is possible to implement more targeted interventions that can optimize yield, improve crop quality, and enhance the overall nutritional profile of the crop.
Although several studies have explored hyperspectral and multispectral imaging for pigment and phenolic compound assessment in horticultural crops, few have systematically compared these two sensor types in lettuce via a wide panel of machine learning algorithms [29,30,31]. Our study uniquely integrates a comprehensive cultivar set, parallel pigment/phenolic quantification, and side-by-side sensor/model comparison, thus providing new insights into the advantages and limitations of each approach for nutritional phenotyping in leafy vegetables.
Therefore, this study aims to evaluate the potential of hyperspectral and multispectral imaging, in combination with machine learning models, to predict and map the biochemical composition of lettuce leaves, with a particular focus on key compounds such as chlorophylls, carotenoids, anthocyanins, flavonoids, and phenolic compounds. The hypothesis of this research is that hyperspectral and multispectral imaging technologies, when coupled with advanced machine learning techniques, can provide a reliable and efficient approach for distinguishing lettuce varieties based on their biochemical composition. Additionally, this study seeks to develop high-resolution, spatially explicit maps of these traits, offering new insights into the biochemical diversity within lettuce crops and supporting the advancement of precision agriculture.

2. Materials and Methods

2.1. Plant Materials, Growth Conditions and Experimental Design

A greenhouse experiment was conducted at the State University of Maringá, Paraná, Brazil (23°23′47.6″ S, 51°57′05.3″ W), to evaluate eleven lettuce cultivars (Lactuca sativa L.) that were distinguished by leaf pigmentation ranging from pale green to deep purple. The cultivars used in this study were Rainha de Maio (V01), Vitória (V02), Maravilha de Inverno (V03), Grandes Lagos Americana (V04), Mimosa Prado (V05), Quatro Estações (V06), Batávia Joaquina (V07), Mimosa Vermelha (V08), Batávia Cacimba (V09), Pipa (V10), and Mimosa Rubi (V11).
The 100 seeds were germinated in Petri-dish glass (150 × 50 mm) on Germitest® filter paper (J. Prolab, Curitiba, PR, Brazil) moistened with 4 mL of Hoagland’s nutrient solution (pH 5.4). After a 15-day start germination period, uniform seedlings (growth in MecPlant commercial substrate) were transplanted at 4 cm height and three true leaf stage, into 10 L pots filled with a substrate composed of pine bark, vermiculite, and limestone (MecPlant®, Telêmaco Borba, PR, Brazil) and mixed with soil and sand at a 3:2:2 (v:v:v) ratio. The plants received a basal application of balanced NPK fertilizer (containing nitrogen, phosphorus, and potassium; 10–10–10 formulation) following the recommended rate for lettuce Falcioni et al. 2022 [9] and were irrigated daily with 25 mm of water throughout the growth period in pots [9]. The following environmental parameters were recorded continuously during the trial: photosynthetically active radiation (PAR) peaked at 1500 µmol m−2 s−1 via an LI-190R quantum sensor (LI-COR Inc., Lincoln, NE, USA) under a natural 12 h photoperiod, the air temperature varied approximately 30 ± 5 °C, and the relative humidity ranged between 50% and 80%. Humidity and temperature were monitored continuously via a digital hygrometer 7663 (Incoterm, Cotronic Technology Ltd., Inc., Shenzhen, Guangdong, China). The greenhouse ventilation was natural, irrigation was applied at a fixed rate of 25 mm day−1 to meet plant water requirements, and irrigation was not used to manipulate the air temperature or relative humidity. To minimize microclimatic variation and shading effects, all the pots were rotated and repositioned weekly, ensuring uniform exposure to light throughout the greenhouse. The plants were also spaced at regular intervals to prevent overlap and ensure consistent light across the canopy. The analyses were conducted at 50 days post-transplantation, corresponding to the point of maximum vegetative growth and commercial maturity, when plants had reached the plateau phase of the linear growth curve.

2.2. Extraction and Quantification of the Pigment Profile

Fifty days post-transplantation, 0.5 cm2 leaf segments were excised from each experimental unit and subsequently converted to m2. These segments were immediately homogenized in 1.5 mL microcentrifuge tubes containing a chloroform–methanol (2:1 v/v) mixture, along with a small amount of CaCO3 to stabilize the pH, following the protocols outlined by Gitelson & Solovchenko (2018) [32] and Falcioni et al. (2022) [9]. After complete extraction, 20% (v/v) distilled water was added to each tube to promote phase separation. The samples were subsequently centrifuged at approximately 21,130× g (corresponding to 15,000 rpm (Model 5424, Rotor FA-45-24-11, Eppendorf SE, Barkhausenweg Hamburg, Germany)) with an 8.4 cm radius for 5 min to yield a lower organic phase and an upper polar phase. Each analysis was performed via six biological replicates per cultivar, and each measurement was conducted in triplicate.
The organic (chloroform) phase was used for the analysis of chlorophyll and carotenoid contents. Aliquots (200 µL) of this phase were transferred into quartz 96-well microplates, and the absorbance was measured at 665, 652, and 470 nm via a Biochrom Asys UVM-340 UV microplate reader (Biochrome Ltd., Milton Road, Cambridge, UK). The concentrations of chlorophylls (Chla and Chlb) and carotenoids were calculated per unit leaf area (mg m−2) according to the equations provided by (Gitelson & Solovchenko, 2018) [32]:
Chla = 16.72 × A665 − 9.16 × A652
Chlb = 34.09 × A652 − 15.28 × A665
Carotenoids = (1000 × A470 − 1.63 × Chla − 104.96 × Chlb)/221
The upper polar phase was acidified to 0.1% HCl (v/v) for the determination of anthocyanins, which were quantified by measuring the absorbance at 530 nm (ε530 = 30 mM−1 cm−1). Flavonoids were quantified from the same polar extract at 358 nm (ε358 = 25 mM−1 cm−1) before acidification (Gitelson & Solovchenko, 2018) [32]. The anthocyanin and flavonoid contents were expressed on an area basis (nmol m−2).

2.3. Quantification of Total Soluble Phenolic Compounds

The total soluble phenolic content was quantified via a modified Folin–Ciocalteu method [33]. In 2 mL tubes, 150 µL of the polar extract was mixed with 70 µL of Folin–Ciocalteu reagent (1 M), 140 µL of Na2CO3 (3.56 M), and 850 µL of deionized water. After the samples were incubated for 50 min in the dark, they were centrifuged at 15,000 rpm for 2 min. The absorbance of the supernatant was determined at 725 nm, and the phenolic content was quantified as gallic acid equivalents via a calibration curve (Ŷ = 87.651 × + 1.6515; R2 = 0.993). The total water-soluble phenolic content was expressed as mg gallic acid equivalents per m−2 of leaf (mg GAE m−2).

2.4. Spectral Collection of Leaf Reflectance Data

Leaf reflectance spectra were obtained via a Headwall Photonics A-Series push-broom hyperspectral imaging system (Headwall Photonics Inc., Bolton, MA, USA). This system features a cooled, back-illuminated charge-coupled device (CCD) detector coupled with a diffraction grating, generating 825 contiguous spectral bands across the 380–1000 nm range, with an average spectral resolution of 0.74 nm. The sensor was installed on a precision-controlled linear stage located 60 cm above the leaf surface, resulting in a ground sampling distance of approximately 0.25 mm per pixel. Twelve 20 W halogen lamps were evenly placed around the scan window to provide uniform illumination across the field of view.
Prior to imaging, the system was warmed for 15 min to stabilize the CCD temperature and reduce electronic noise. Dark-current reference images were captured with the lamps switched off to characterize the sensor noise and fixed-pattern artefacts. White-reference images were then captured via a certified Spectralon™ panel (SRT-99-120; Labsphere, North Sutton, NH, USA) with 99% diffuse reflectance. The frame acquisition parameters were set in Hyperspec III® (Headwall Photonics, Bolton, MA, USA) as follows: integration time of 39 ms, frame period of 40 ms, and translation speed of 50 mm min−1. This setup ensured minimal spatial data gaps due to slight overlap between successive line scans.
After the calibration references were collected, each replicate for each cultivar (comprising six leaves per variety) was scanned once. The raw radiance data were processed by performing pixelwise subtraction of the dark reference, followed by normalization against the white reference, resulting in relative reflectance values. The resulting hypercubes, comprising two spatial dimensions (x, y) and one spectral dimension (λ), were exported in ENVI 5.4® (Exelis Visual Information Solutions, Boulder, CO, USA) format for subsequent spectral preprocessing, including noise-band removal, Savitzky–Golay smoothing (second-order, 15-point window), and continuum removal around key pigment absorption features. This rigorous preprocessing workflow ensured high fidelity of the reflectance data for downstream multivariate and machine learning analyses.

2.5. Vegetation Indices

Vegetation indices were calculated to assess their effectiveness in detecting changes in lettuce leaf pigmentation, photochemical efficiency, water status, pigment levels, and structural-physiological traits. The indices analysed were, in order, NDVI (Normalized Difference Vegetation Index), GNDVI, EVI (Enhanced Vegetation Index), SAVI (Soil-Adjusted Vegetation Index), OSAVI (Optimized Soil-Adjusted Vegetation Index), MSAVI2, SIPI (Structure Insensitive Pigment Index), PSSRc (Plant Senescence Reflectance Index—carotenoids), RARS (Red-Edge Anthocyanin Reflectance Signal), Water Band Index), ARI1 and ARI2 (Anthocyanin Reflectance Index 1 and 2), CRI1 and CRI2 (Carotenoid Reflectance Index 1 and 2), VOG1 and VOG2 (Vogelmann Red Edge Index 1 and 2), NPQI (Normalized Phaeophytinization Index), and PRI (Photochemical Reflectance Index).
Average index values were compared between treatment groups, and correlations with physiological parameters were assessed via Pearson’s coefficient. This integrated approach enabled robust discrimination of plant responses to pigments in leaves and supported the identification of informative spectral markers for physiological and structural changes in the leaves via two sensor analyses.

2.6. Correlation and Heatmap Analyses

For each trait, a correlation matrix was generated with all individual wavelengths, and the results were visualized as heatmaps, with color scales representing the strength and direction of the correlation (from −1 to +1). Additionally, a second heatmap was produced to visualize the correlation matrix among all measured variables, allowing for an integrated assessment of relationships between biochemical, physiological, and structural traits. All calculations and graphical representations were performed via custom Python version 3.12. scripts (Python Software Foundation, Wilmington, DE, USA).

2.7. Preprocessing of Hyperspectral Data and Dataset Division

The hyperspectral image cubes were imported into ENVI 5.4® (Exelis Visual Information Solutions, Boulder, CO, USA) for spatial–spectral sampling. Two regions of interest (ROIs) were delineated per replicate (six replicates per cultivar), resulting in 12 ROIs for each of the eleven varieties. Each ROI encompassed approximately 1000 contiguous pixels from a homogeneous leaf area, and the mean reflectance spectrum of these pixels was calculated to reduce within-leaf spectral variability. The resulting 132 averaged reflectance spectra were exported as ASCII files for downstream analysis.
Spectral preprocessing and machine learning workflows were implemented in Orange Data Mining 3.33 (Bioinformatics Lab, Ljubljana, Slovenia) and RStudio® (Posit, Boston, MA, USA). Before modelling, noisy bands at the extremes of the sensor range (380–400 nm and 980–1000 nm) were removed, and spectral smoothing was performed via a Savitzky–Golay filter (second-order, 15-point window). For comparisons with lower-cost multispectral sensors, five bands matching the MicaSense Altum AL05 configuration were extracted from each spectrum: blue (475 ± 32 nm), green (560 ± 27 nm), red (668 ± 14 nm), red-edge (717 ± 12 nm), and near-infrared (842 ± 57 nm). This process generated a multispectral dataset with 132 five-band spectra.
The hyperspectral and derived multispectral datasets were split into calibration (training) and independent validation (test) subsets via a stratified random partition (80% calibration, 20% validation). The optimal models for each biochemical attribute, identified via the hyperspectral calibration set, were then applied to the spatial image cubes. Spatial prediction maps for both sensor types were generated in QGIS 3.10 (QGIS Development Team, Hannover, Germany) via the AVHYAS plugin version 1.0 (Hyperspectral Techniques Development Division, Advanced Microwave and Hyperspectral Techniques Development Group, Space Applications Centre, ISRO, Ahmedabad, Gujarat, India), enabling direct visual comparison of the predicted pigment distributions.

2.8. Machine Learning Algorithms

Seven regression methods were implemented in Orange Data Mining 3.33 (University of Ljubljana, Ljubljana, Slovenia) to predict leaf biochemical parameters: cubist rule-based regression, extreme gradient boosting (GBoost), linear regression (LR), neural networks (NNs), partial least squares regression (PLSR), random forest (RF), and support vector machines (SVMs). The models were trained on 80% of the spectral dataset and evaluated on the remaining 20% via a stratified random split. Model performance was assessed via the coefficient of determination (R2), root mean square error (RMSE), Akaike’s Information Criterion (AIC), and Bayesian Information Criterion (BIC). The R2 values were interpreted as follows: poor (<0.50), moderate (0.50–0.75), or excellent (>0.75). The optimal algorithm for each biochemical attribute was selected based on the highest R2 on the test set, the lowest RMSE, and the minimal AIC/BIC, ensuring both predictive accuracy and model parsimony.

2.9. Statistical Analyses

Statistical analyses were performed via RStudio® (Posit, Boston, MA, USA; version 2023.09.0) with base R and the AgroR (Experimental Statistics and Graphics for Agricultural Sciences), agricolae, factoextra, and FactoMineR packages. Descriptive statistics were calculated for each biochemical parameter in the complete dataset (n = 132), the calibration (training) subset (n = 106), and the independent validation (test) subset (n = 26). The reported metrics included sample size (n), arithmetic mean, standard deviation (SD), median, minimum, maximum, and coefficient of variation (CV, %).
Cultivar effects for each trait were assessed via one-way ANOVA in RStudio® (version 2023.09.0). Residual normality was checked via Shapiro–Wilk tests, and variance homogeneity was checked via Levene’s test before ANOVA. Differences between treatments were considered significant when p < 0.05. In cases where ANOVA indicated significant cultivar effects, pairwise means were compared via Tukey’s honestly significant difference test at the 5%, 1%, and 0.1% significance levels.
Multivariate patterns of hyperspectral and biochemical variation were explored via k-means clustering and principal component analysis (PCA). K-means clustering was applied to the complete set of average trait values to partition the eleven cultivars into homogeneous groups. The k-means clustering analysis was performed using the k-means (factoextra package) function in R (base package), applied to the matrix of average hyperspectral curves and biochemical trait values (chlorophyll a, chlorophyll b, carotenoids, anthocyanins, flavonoids, and phenolic compounds) across the eleven lettuce cultivars. To determine the optimal number of clusters (k), we used the fviz_nbclust function from the factoextra package which computes the average silhouette (factoextra package) width for different k values (typically ranging from 2 to 10). The silhouette width quantifies how similar each observation is to its own cluster compared to other clusters, thus providing a robust measure of cluster validity. The number of clusters that maximized the average silhouette width was selected as optimal (k = 4 in our study). The final cluster assignment was visualized using factoextra and cross-validated against PCA results. PCA was subsequently conducted on centred and scaled data with FactoMineR, retaining components with p < 0.01. Dimensionality reduction was performed via principal component analysis (PCA) and by selecting the most informative wavelengths based on PLS variable importance (VIP) scores. The number of retained features for each best-performing model is between 3 and 5 factors. PCA biplots were generated via facto extraction to visualize cultivar separation and to illustrate the contributions of individual biochemical traits to the principal axes. All the flowcharts are shown in Figure 1.

3. Results

3.1. Descriptive Analyses

Table 1 presents the full descriptive statistics and the full dataset (n = 132), along with the training (n = 106) and external testing (n = 26) subsets. The pigments in the leaves of the lettuce samples significantly varied. The mean concentration of chlorophyll a (Chla) was 128.89 mg m−2, with values ranging from 63.15 to 306.40 mg m−2. This indicates substantial variation in chlorophyll a content across the samples, reflecting distinct levels of photosynthetic activity among them. Chlorophyll b (Chlb) had a mean of 66.76 mg m−2, ranging from 39.41 to 147.27 mg m−2, which also demonstrated moderate variability in its concentration across the samples, as indicated by the coefficient of variation (CV%) of 35.09%. Carotenoids (Cars) exhibited a similar pattern, with a mean concentration of 45.70 mg m−2 and a range between 25.56 and 101.92 mg m−2.
In contrast, the mean anthocyanin (Anc) content was lower at 13.43 nmol m−2, with values ranging from 0 to 68.57 nmol m−2, reflecting a high level of variability within the dataset. This high variability is evident in the CV of 126.53%, indicating substantial differences in the anthocyanin concentration across the samples. Flavonoids (Flv) demonstrated even greater variation, with a CV of 60.66%, whereas total phenolic compounds (Phe) showed the least variation, with the lowest CV of 16.79%.
For the training and test datasets, we observe that most parameters have consistent distributions. For Chla, the means were 129.18 mg m−2 in the training set and 127.69 mg m−2 in the test set, with CVs of 40.94% and 31.43%, respectively. Chlorophyll b (Chlb) had similar mean values of 66.64 mg m−2 in the training set and 67.25 mg m−2 in the test set, with CVs of 36.74% and 28.11%, respectively. Carotenoids also showed consistent patterns, with means of 45.82 and 45.16 for the training and test sets, respectively, and CVs of 36.92% and 29.21%, respectively.
However, anthocyanins presented greater variation. The training set presented a mean value of 12.76 nmol m−2, with a coefficient of variation of 130.03%. In comparison, the test set displayed a mean of 16.15 nmol m−2 and a coefficient of variation of 114.22%. Flavonoids exhibited similar variabilities, with means of 57.59 nmol m−2 for the training set and 67.53 nmol m−2 for the test set, with CVs of 60.15% and 61.31%, respectively. The total phenolic compounds were the most stable, with means of 310.40 and 323.20 mg GAE m−2 for the training and test sets, respectively, and CVs of 17.05% and 15.65%, respectively (Table 1).
The overall consistency between the central tendencies (mean values) and the dispersion (standard deviation and CV) of the training and test sets suggests that the datasets cover a representative range of data variations.

3.2. Effects of Cultivars on Biochemical Composition

Table 2 summarizes the effects of cultivar on the biochemical composition of lettuce (Lactuca sativa L.). Eleven lettuce varieties (V01–V11) were compared for their contents of chlorophyll a (Chla), chlorophyll b (Chlb), carotenoids (Car), anthocyanins (AnC), flavonoids (Flv), and total phenolic compounds (Phe). Statistical analysis revealed significant differences between the varieties, with all parameters showing p values less than 0.001, indicating strong cultivar effects on the biochemical composition.
For example, Variety V04 presented the highest mean Chla content (243.96 mg m−2), which was significantly greater than that of all the other varieties. Similarly, variety V08 presented the highest Flv content (124.36 nmol m−2), which was significantly different from those of the other varieties. The anthocyanin content (Anc) was highest in the V08 and V09 varieties, whose values were markedly greater than those of the other varieties. These findings underscore the genetic variation that exists among lettuce varieties, with some varieties exhibiting high concentrations of extrachloroplastidic biochemical compounds.
The p values for all the parameters are less than 0.001, indicating that the differences observed among the varieties are statistically significant. These findings indicate that targeted breeding of particular lettuce cultivars may enhance their phytochemical profiles, thereby increasing both their nutritional value and antioxidant capacity.

3.3. Cluster, PCA, and Spectral Analysis

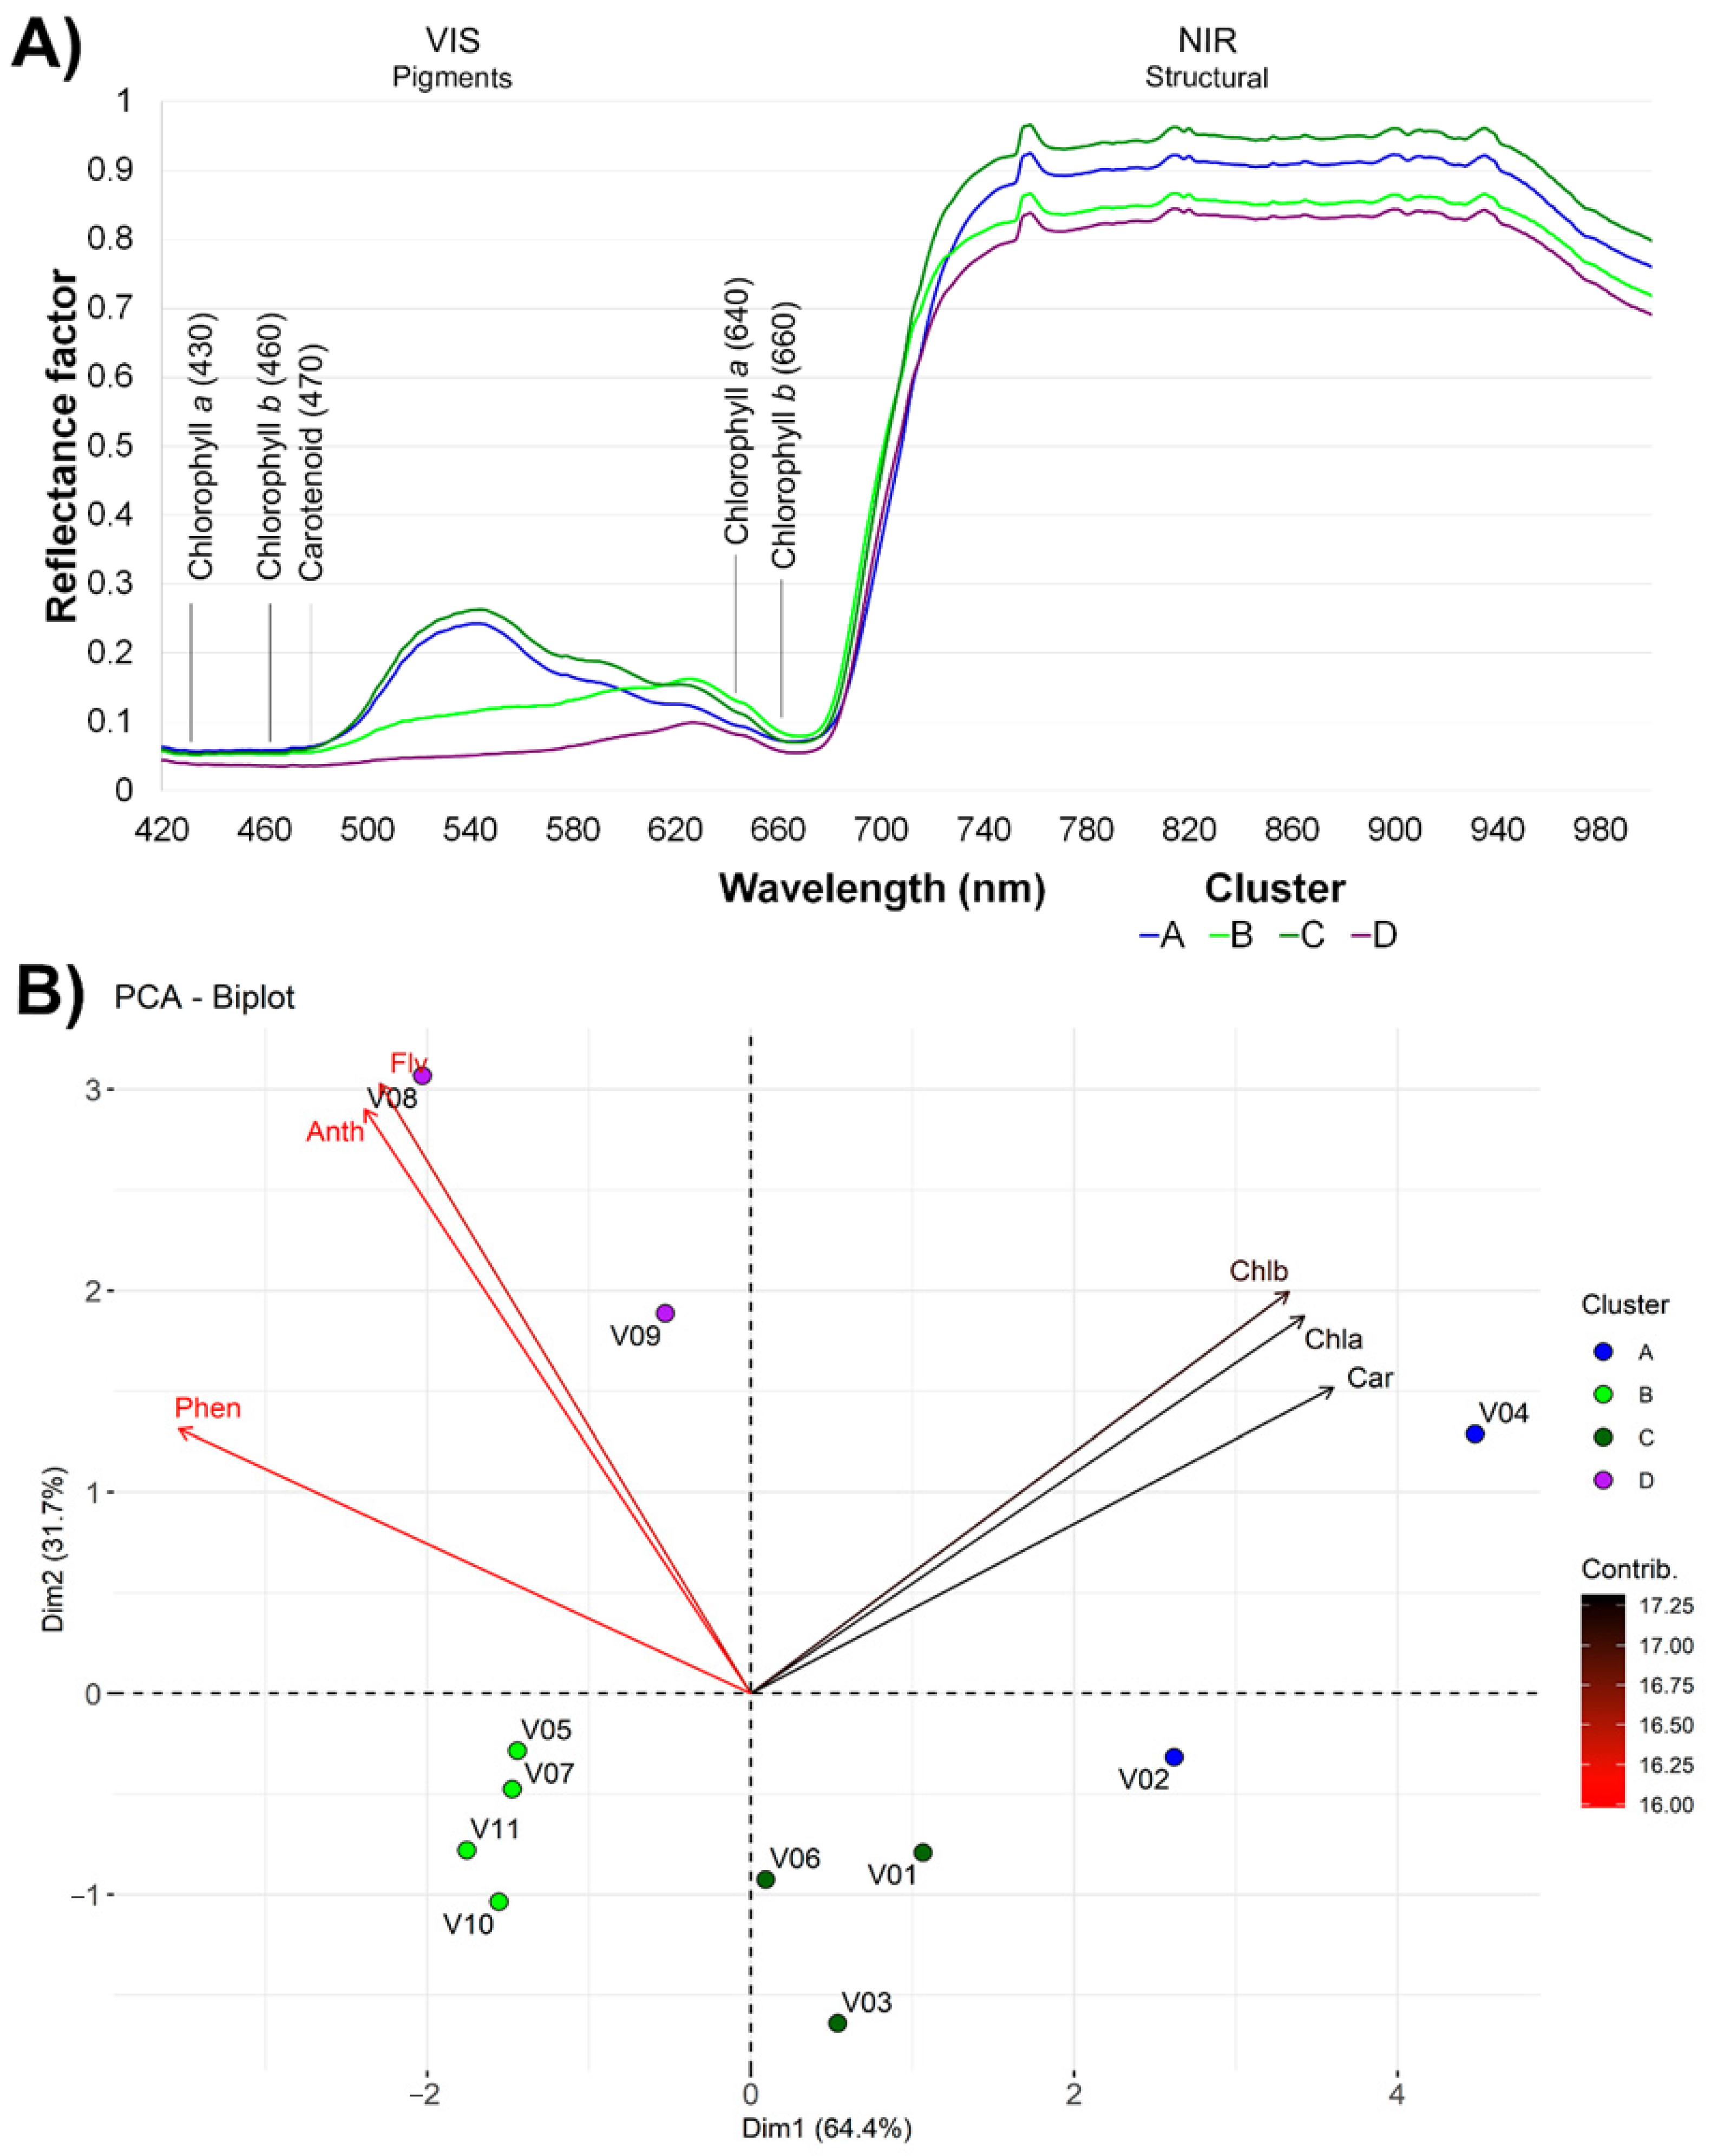
The k-means clustering algorithm was employed to determine the optimal number of clusters on the basis of the hyperspectral curves and biochemical compound values, with the silhouette method suggesting the formation of four distinct groups of lettuce varieties. The silhouette width quantifies how similar each observation is to its own cluster compared to other clusters, thus providing a robust measure of cluster validity. The number of clusters that maximized the average silhouette width was selected as optimal (k = 4 in our study). On the basis of the analysis, varieties 2 and 4 were assigned to Cluster A; varieties 5, 7, 10, and 11 were categorized within Cluster B; varieties 1, 3, and 6 were allocated to Cluster C; and varieties 8 and 9 were classified under Cluster D. Because of differences in the compound profiles of the lettuce cultivars, k-means analysis was used to assess the similarity of their spectral behavior.
Figure 2A shows the spectral reflectance profiles that distinguish the photonic signatures of the four lettuce clusters across the visible (VIS) and near-infrared (NIR) regions. In the VIS range (400–650 nm), cluster C, followed by cluster A, presented greater reflectance, particularly at the green wavelength (530 nm), suggesting greater potential for chlorophyll content in these groups than in the other groups. In contrast, clusters B and D demonstrated a more uniform increase in reflectance from the blue (400 nm) to red (650 nm) wavelengths, which may indicate variations in the composition or concentration of pigments. In the NIR region, the reflectance factors for clusters C, A, B, and D were stratified at approximately 95%, 90%, 85%, and 80%, respectively, indicating differences in leaf structure or moisture content. A consistent increase in reflectance of approximately 5% was observed near 760 nm, the “red edge” region, which is often associated with differences in vegetation health or maturity.
Figure 2B presents a biplot derived from principal component analysis (PCA), which reveals the multivariate relationships between the phytochemical constituents and the lettuce varieties within the four identified clusters. PCA was employed to analyse the contributions of various pigment classes between the clusters. The majority of the variability in the dataset can be attributed to the first two principal components (Dim1 and Dim2), which collectively account for more than 96% of the total variance. Specifically, Dim1 contributes 64.4%, whereas Dim2 explains an additional 31.7%. The biplot vectors revealed that the concentrations of flavonoids (Flv) and anthocyanins (Anc) play a key role in differentiating Dim2, particularly in Cluster D, which shows high positive loading on this axis. These findings indicate elevated levels of these phytochemicals in varieties 8 and 9, as shown by the comparison of the means (Table 2). In contrast, Cluster A, which is positioned negatively along Dim2, is inversely related to these components. Clusters B and C are located closely along the positive axis of Dim1, reflecting high concentrations of chlorophyll a (Chla), chlorophyll b (Chlb), and carotenoids (Car).

3.4. Vegetation and Cluster Heatmaps

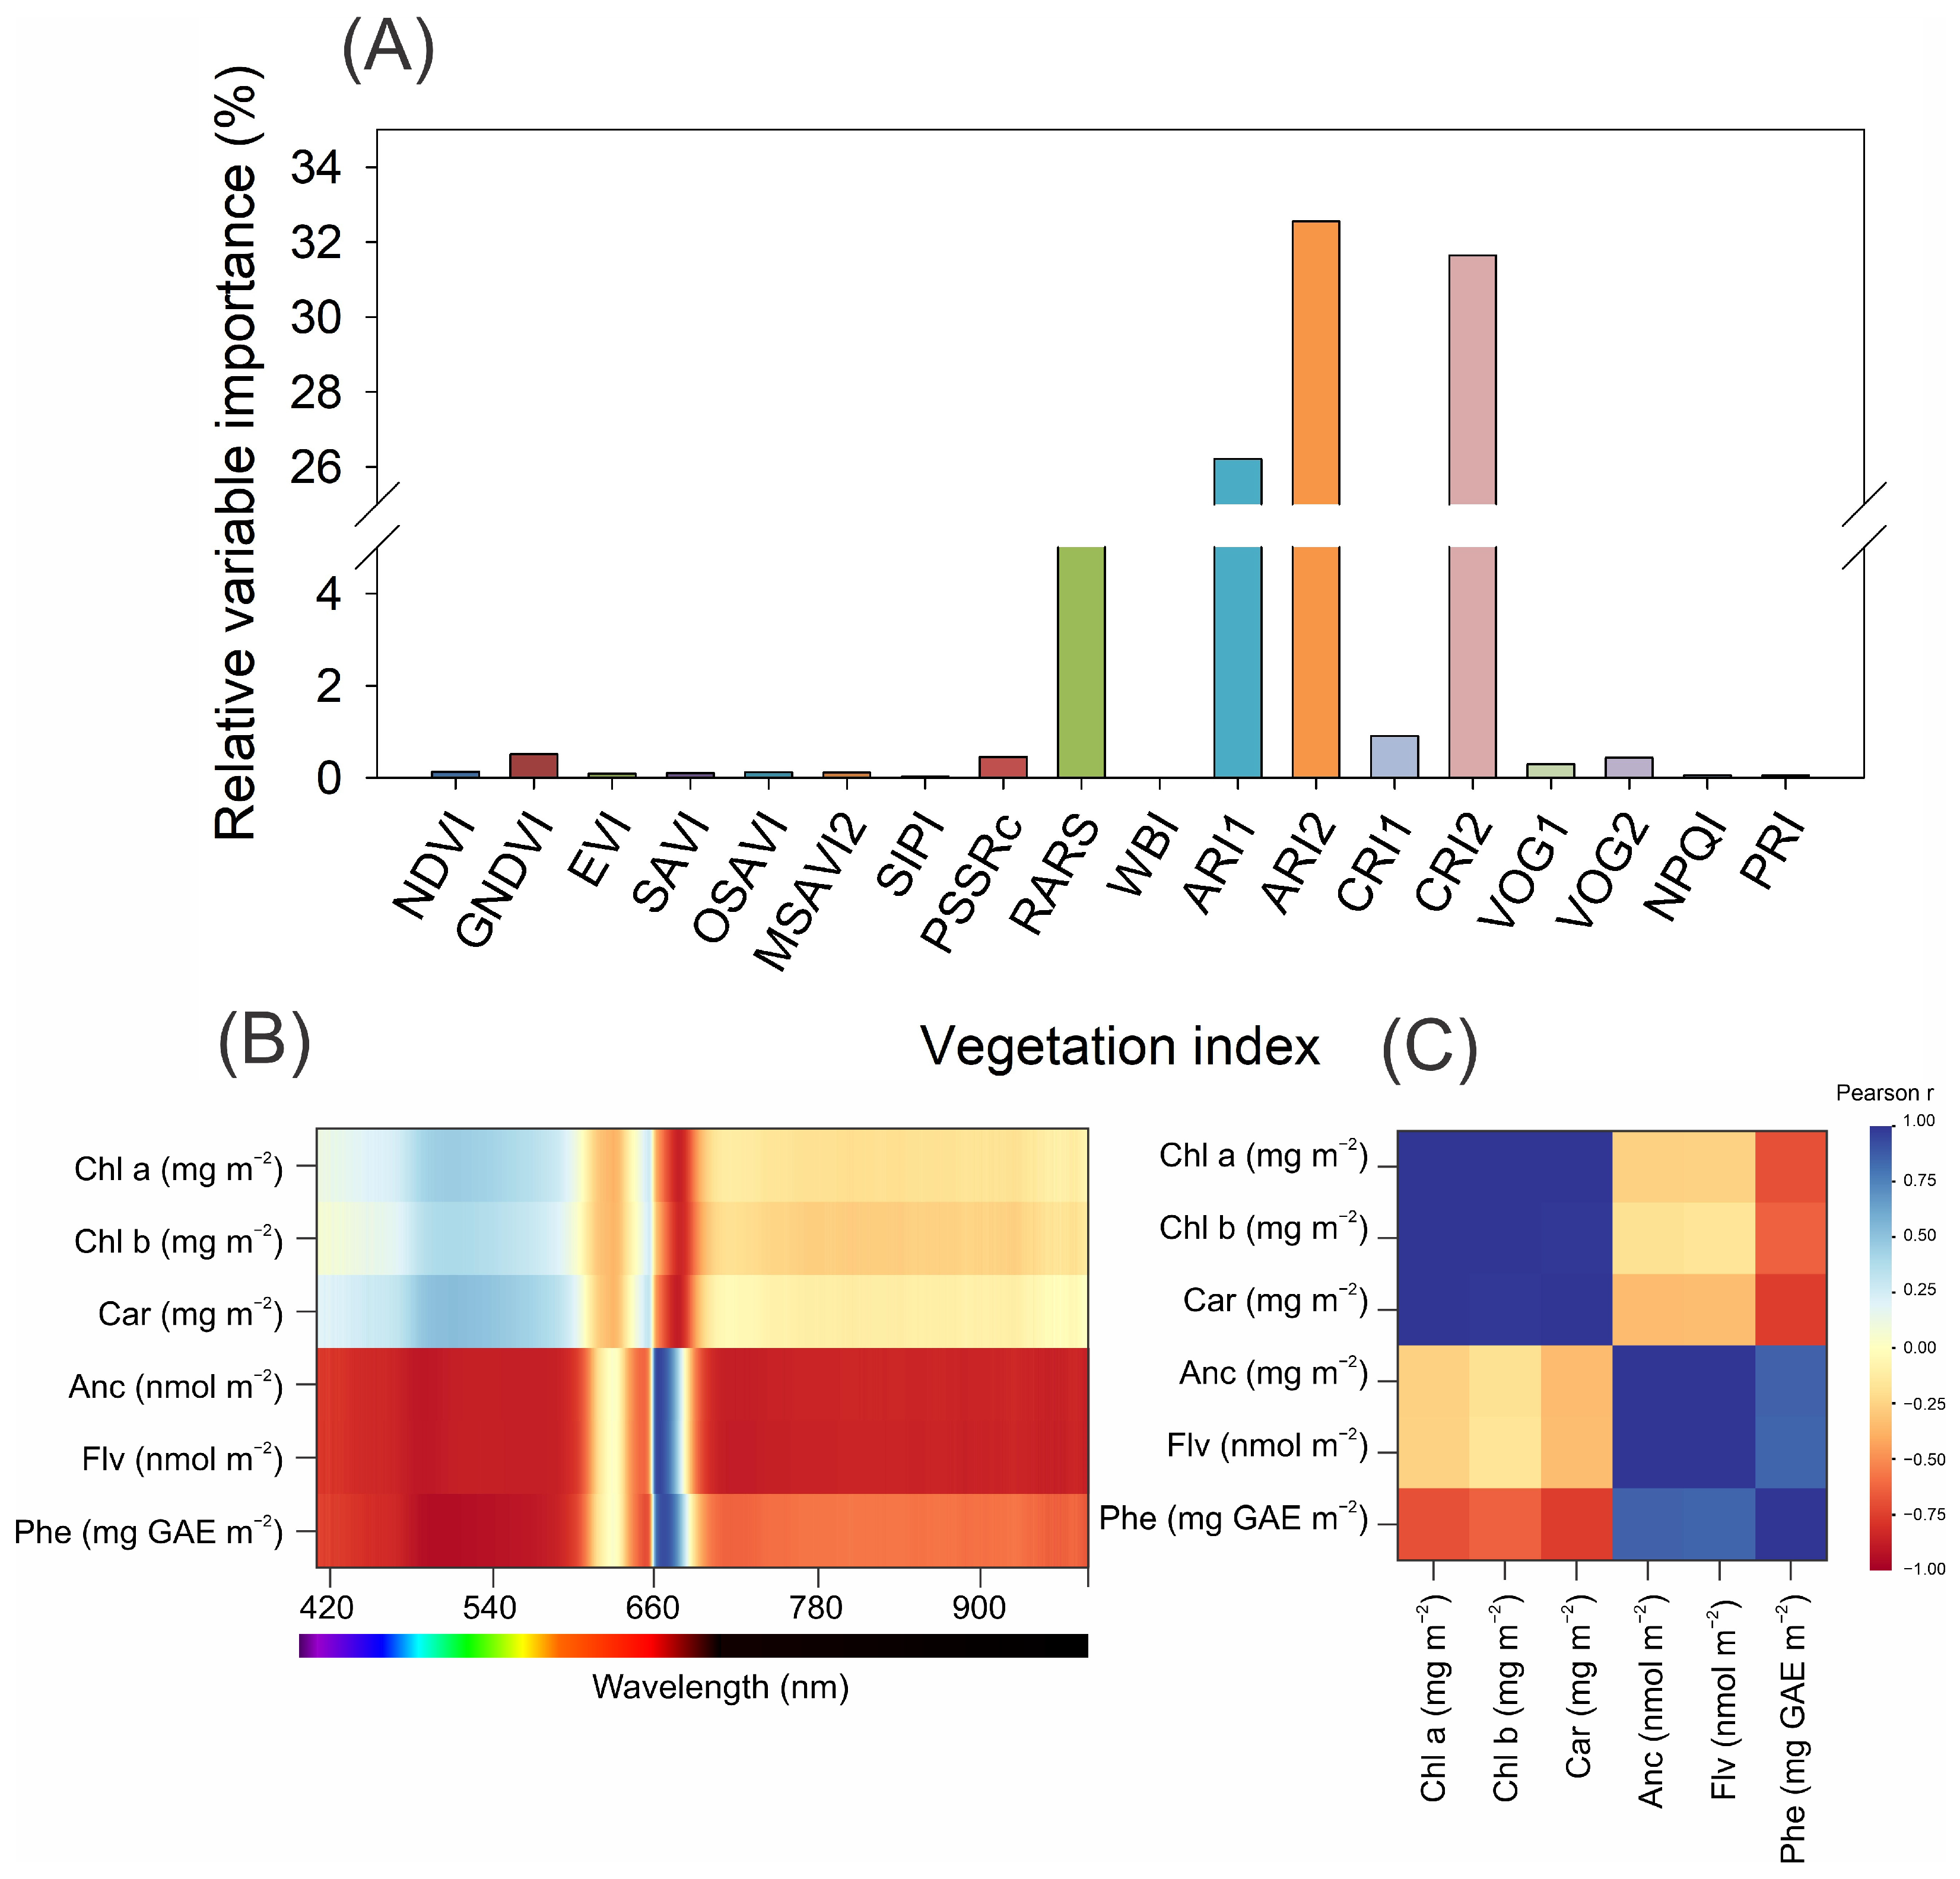
The relative importance of vegetation indices (VIs) in predicting foliar biochemical traits varied across the spectral indicators evaluated (Figure 3A). Among the 18 VIs tested, anthocyanin and carotenoid-related indices, specifically ARI2, CRI1, and CRI2, presented the highest predictive relevance, with ARI2 alone accounting for more than 30% of the explained variation. These indices, which are sensitive to pigments other than chlorophyll, outperform traditional greenness indices such as the NDVI, EVI, and SAVI, whose contributions remain below 2%. ARI1 and RARS also demonstrated moderate importance, underscoring the significance of red-edge and reflectance asymmetry metrics under the experimental conditions. These findings suggest that there is limited modulation of extrachloroplastidic pigment biosynthesis, as indicated by the indices related to the targeted physiological traits within this dataset.
Spectral analysis across the visible to near-infrared range (420–950 nm) revealed distinct patterns for each biochemical parameter (Figure 3B). Chlorophyll a and b exhibited strong associations with the reflectance around the red absorption peak (~660–680 nm) in both the red and far-red regions. Carotenoid and flavonoid compounds were distributed across the visible spectrum, with wavelength peak localization being less distinct (Figure 3B). In contrast, phenolics showed a unique reflectance pattern, with a maximum association observed in the green–blue region (~500–540 nm), indicating distinct optical behavior.
The correlation structure among the measured foliar traits (Figure 3C) supported these findings. Chlorophyll a and b were highly positively correlated (r > 0.9), which is consistent with their joint physiological functions in terms of light absorption. Carotenoids presented moderate positive correlations with chlorophyll, whereas flavonoids and phenolics presented contrasting trends. Notably, phenolics were strongly and negatively correlated with chlorophyll content (r < −0.75), suggesting potential antagonistic dynamics between primary and secondary metabolism under the environmental conditions studied.

3.5. Machine Learning Models

The predictive accuracy of seven machine learning algorithms (LR, PLS, Gboost, RF, NN, SVM, and Cubist) for six leaf biochemical attributes was evaluated via both the Headwall hyperspectral and the MicaSense multispectral datasets. The results for the RMSE and R2 in both the calibration and independent test sets are presented in Table 3 and Table 4.
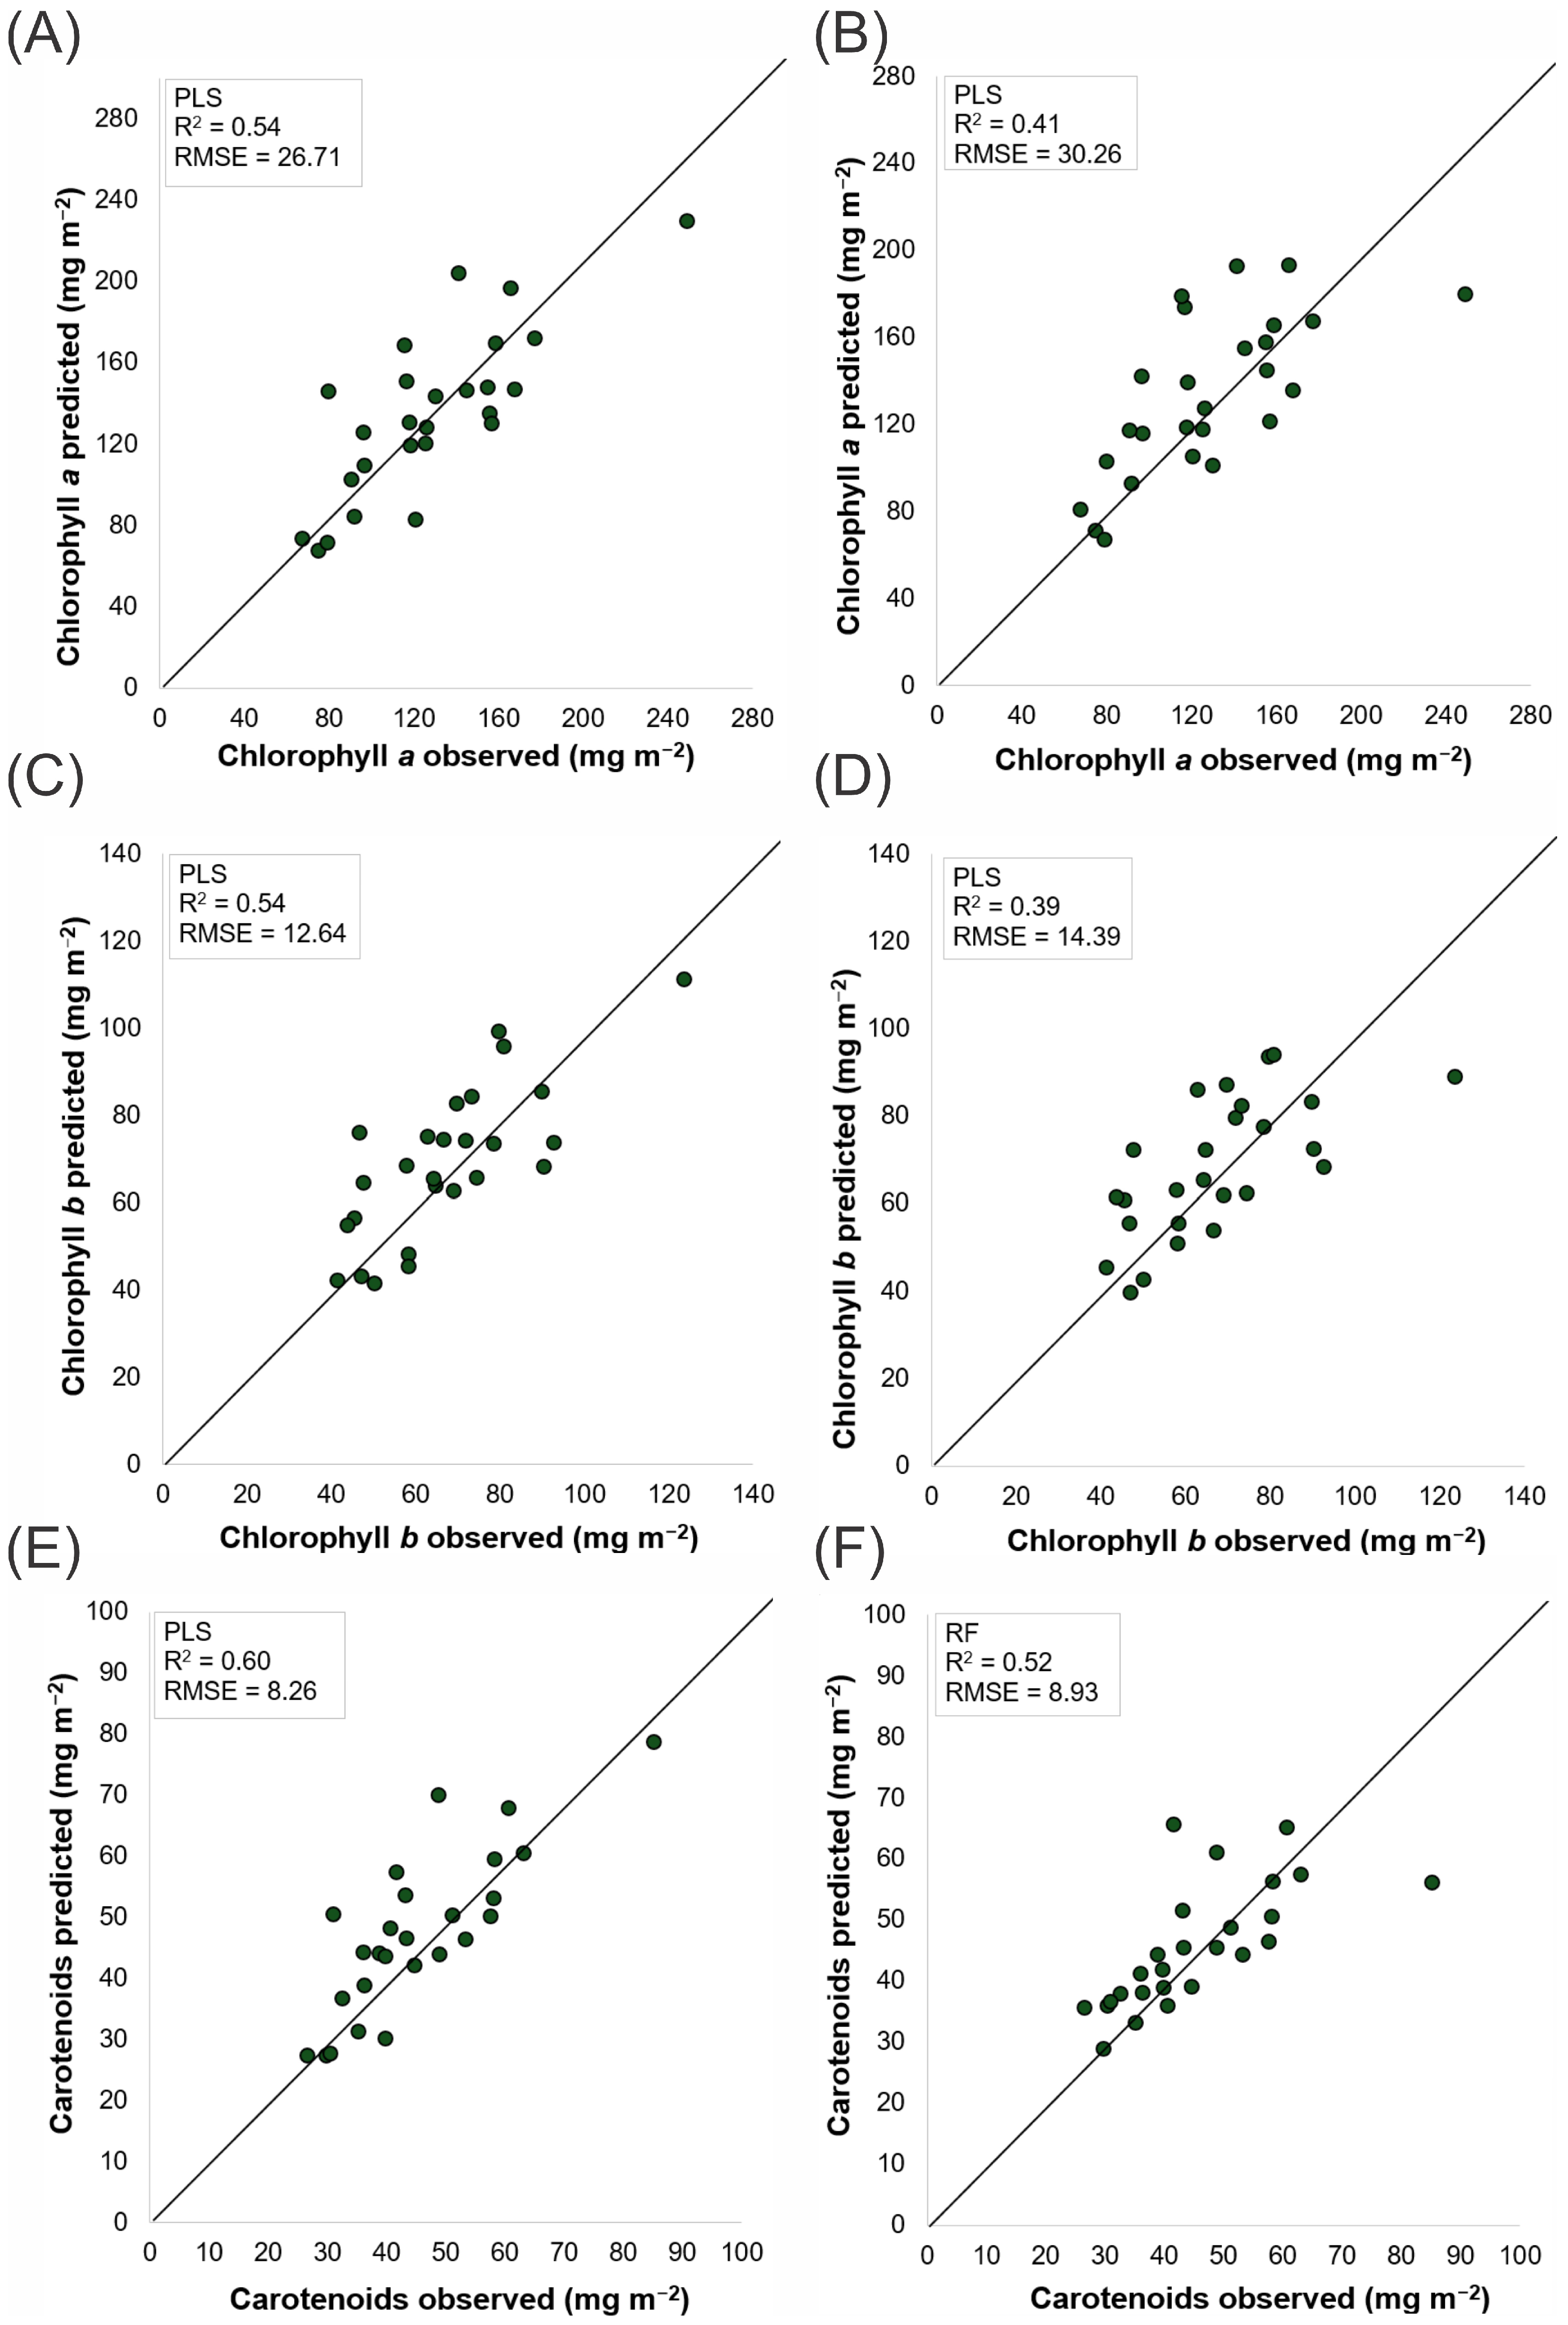
The chlorophyll a (Chla) and PLS methods achieved the lowest test RMSE and highest R2 in both datasets (Headwall: RMSE = 26.71 mg m−2, R2 = 0.54; MicaSense: RMSE = 30.26 mg m−2, R2 = 0.41). The LR and RF models produced comparable results, with test RMSEs of 27.22 and 27.65 mg m−2 (Headwall), 30.50 and 30.75 mg−2 (MicaSense), and test R2 values of 0.52 and 0.51 (Headwall), 0.40 and 0.39 (MicaSense), respectively. The Cubist model recorded the lowest calibration RMSE (Headwall: 18.50 mg m−2; MicaSense: 29.07 mg m−2) and the highest training R2, but its test performance decreased markedly, with test RMSEs of 46.44 mg m−2 (Headwall) and 35.13 mg m−2 (MicaSense) and test R2 values of 0.32 and 0.25, respectively. The NN, Gboost, and SVM models presented higher test RMSEs and lower R2 values in both datasets, with Gboost and SVM consistently yielding test R2 values less than 0.30.
Chlorophyll b (Chlb) by PLS achieved the lowest test RMSE and the highest R2 in both datasets (Headwall: RMSE = 12.64 mg m−2, R2 = 0.54; MicaSense: RMSE = 14.39 mg m−2, R2 = 0.39), closely followed by LR (Headwall: 13.04 mg −2, 0.51; MicaSense: 14.49 mg m−2, 0.39). The RF, Cubist, and NN models showed intermediate test performances, with RMSEs ranging from 13.46 to 16.31 mg m−2 (Headwall) and 14.48 to 15.99 mg m−2 (MicaSense), with R2 values between 0.31 and 0.47. Both the Gboost and SVM methods resulted in higher test RMSEs and lower R2 values for chlorophyll b across datasets.
Carotenoids (Car) and PLS presented the lowest test RMSE and highest R2 in the Headwall dataset (RMSE = 8.26 mg m−2, R2 = 0.60), whereas RF was superior to the MicaSense data (RMSE = 8.93 mg m−2, R2 = 0.52). LR, PLS, and RF showed similar performances in the MicaSense dataset (test RMSE = 9.29–9.71 mg m−2; R2 = 0.44–0.48). Cubist, NN, and SVM had moderate performance (test RMSE: 9.42–11.22 mg m−2; R2 = 0.31–0.44), whereas Gboost presented higher test RMSE (Headwall: 12.05 mg m−2; MicaSense: 10.12 mg m−2) and lower R2 (Headwall: 0.13; MicaSense: 0.39).
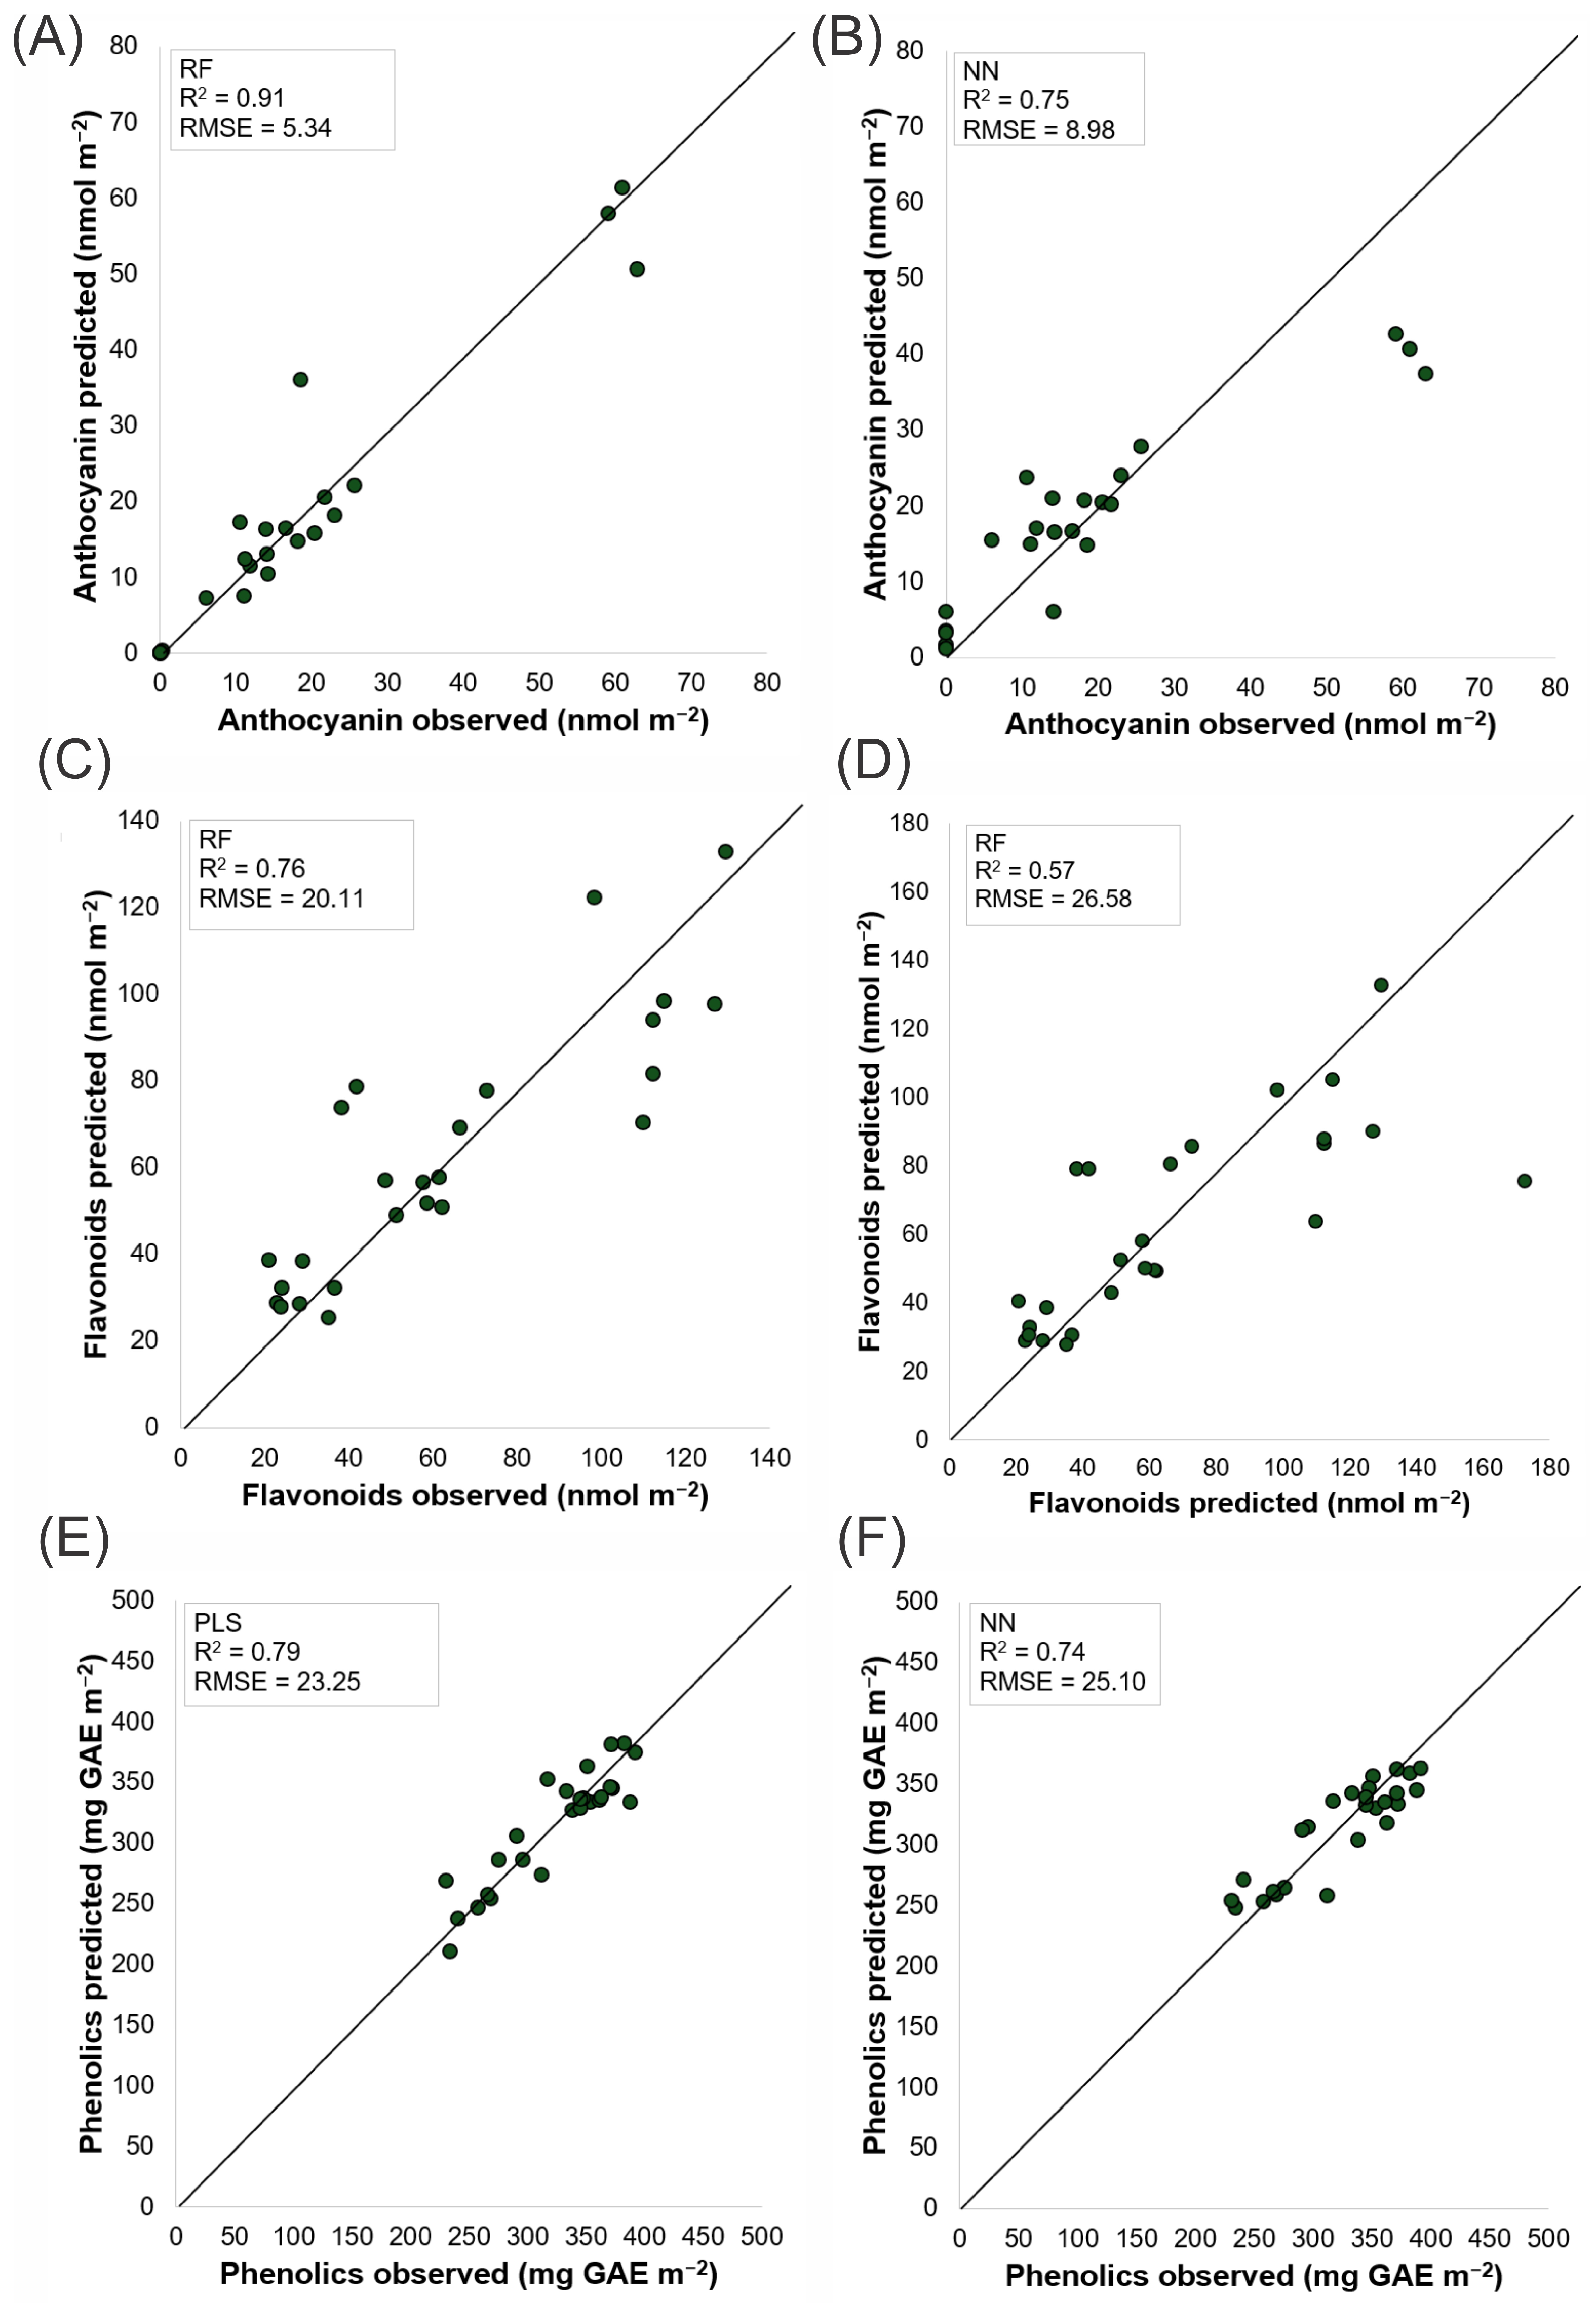
The anthocyanins (Anc) and RF presented the lowest test RMSE (5.34 nmol m−2) and the highest test R2 (0.91) in the Headwall dataset, whereas the NN presented the best results for MicaSense (test RMSE = 8.98 nmol m−2, R2 = 0.75). Gboost and PLS achieved competitive performance (Headwall: Gboost RMSE = 7.97 nmol m−2, R2 = 0.81; PLS RMSE = 9.35 nmol m−2, R2 = 0.73; MicaSense: PLS RMSE = 12.63 nmol m−2, R2 = 0.51), whereas Cubist, LR, and SVM had test RMSEs between 9.24 and 13.54 nmol m−2 and test R2 values ranging from 0.44 to 0.66.
Flavonoid (Flv)-based RF demonstrated the lowest test RMSE (20.11 nmol m−2) and the highest R2 (0.76) with the Headwall dataset. In the MicaSense dataset, RF, NN, and Gboost achieved similar test RMSE and R2 values (RF: 26.58 nmol m−2, 0.57; NN: 26.95 nmol m−2, 0.56; Gboost: 27.20 nmol m−2, 0.55). PLS and LR produced slightly higher test RMSEs (Headwall: 27.34–28.05 nmol m−2; MicaSense: 28.72–29.64 nmol m−2) and moderate R2 values (0.47–0.55). SVM and Cubist displayed the least favourable test performance for this trait in both datasets.
The phenolic compounds (Phe), LR and PLS achieved the lowest test RMSEs and highest R2 values in the Headwall dataset (LR: 22.05 mg GAE m−2, 0.80; PLS: 23.25 mg GAE m−2, 0.79), whereas the NN was superior in the MicaSense dataset (test RMSE = 25.10 mg GAE m−2, R2 = 0.74). Cubist, RF, and SVM showed comparable test performances in both datasets (Headwall: test RMSE = 28.90–29.85 mg GAE m−2, R2 = 0.64–0.76; MicaSense: test RMSE = 26.35–32.35 mg GAE m−2, R2 = 0.57–0.72), and Gboost had the least favourable results overall.
Overall, this analysis reveals a clear hierarchy: PLS and RF yield reliable, repeatable predictions; LR and NN serve as solid baselines; and complex learners such as Cubist, Gboost, and SVM require additional safeguards against overfitting to approach the performance of simpler, more robust algorithms.

3.6. Performance of Regression Models in Predicting Phytochemical Compounds

Figure 4 and Figure 5 display scatterplots of the predicted values for chlorophyll a, chlorophyll b, carotenoids, anthocyanins, flavonoids, and phenolic compounds, comparing the predictions from regression models with the observed values from laboratory leaf chemical analysis.
The pigment scatterplots (Figure 4) show significant performance differences between the Headwall and MicaSense sensors in terms of their ability to predict phytochemical content via the PLS and RF models. For chlorophyll a (Chla), the predictions derived from the Headwall sensor data (Figure 4A) yielded an R2 of 0.54 and an RMSE of 26.71 mg m−2, indicating better alignment with the observed values than the MicaSense sensor (Figure 4B), which had an R2 of 0.41 and an RMSE of 30.26 mg m−2. This trend is consistent across chlorophyll b (Chlb) and carotenoids (Car), with the Headwall sensor (Figure 4C,E) achieving higher R2 values and lower RMSEs than the MicaSense sensor (Figure 4D,F). The observed pattern suggests that the higher spectral resolution data captured by the Headwall sensor more accurately reflect the actual pigment concentrations, as evidenced by the proximity of the data points to the unity line. This close alignment supports the relevance of this analysis for assessing artificial intelligence model quality.
The scatterplots of secondary metabolites such as anthocyanins, flavonoids and phenolic compounds (Figure 5) further emphasize the superiority of the Headwall sensor. For anthocyanin content, the Headwall sensor using the RF model (Figure 5A) achieved an R2 of 0.91 and an RMSE of 5.34 nmol m−2, whereas the NN model (Figure 5B) recorded an R2 of 0.75 and an RMSE of 8.98 nmol m−2. These results suggest that the Headwall sensor, with its superior spectral resolution, is more capable of detecting anthocyanin content. In the estimation of flavonoids, the MicaSense sensor with the RF model (Figure 5D) had an R2 of 0.57, whereas the Headwall sensor using the same model (Figure 5C) achieved an R2 of 0.76. However, both datasets showed significant dispersion of points along the 0–1 line for values above 125 nmol m−2. For phenolic content (Figure 5E,F), the PLS model with Headwall sensor data, yielding an RMSE of 23.25 mg GAE m−2 and an R2 of 0.79, provided more accurate predictions than the NN model applied to the MicaSense sensor data.

3.7. Spatial Mapping of Lettuce Biochemical Traits

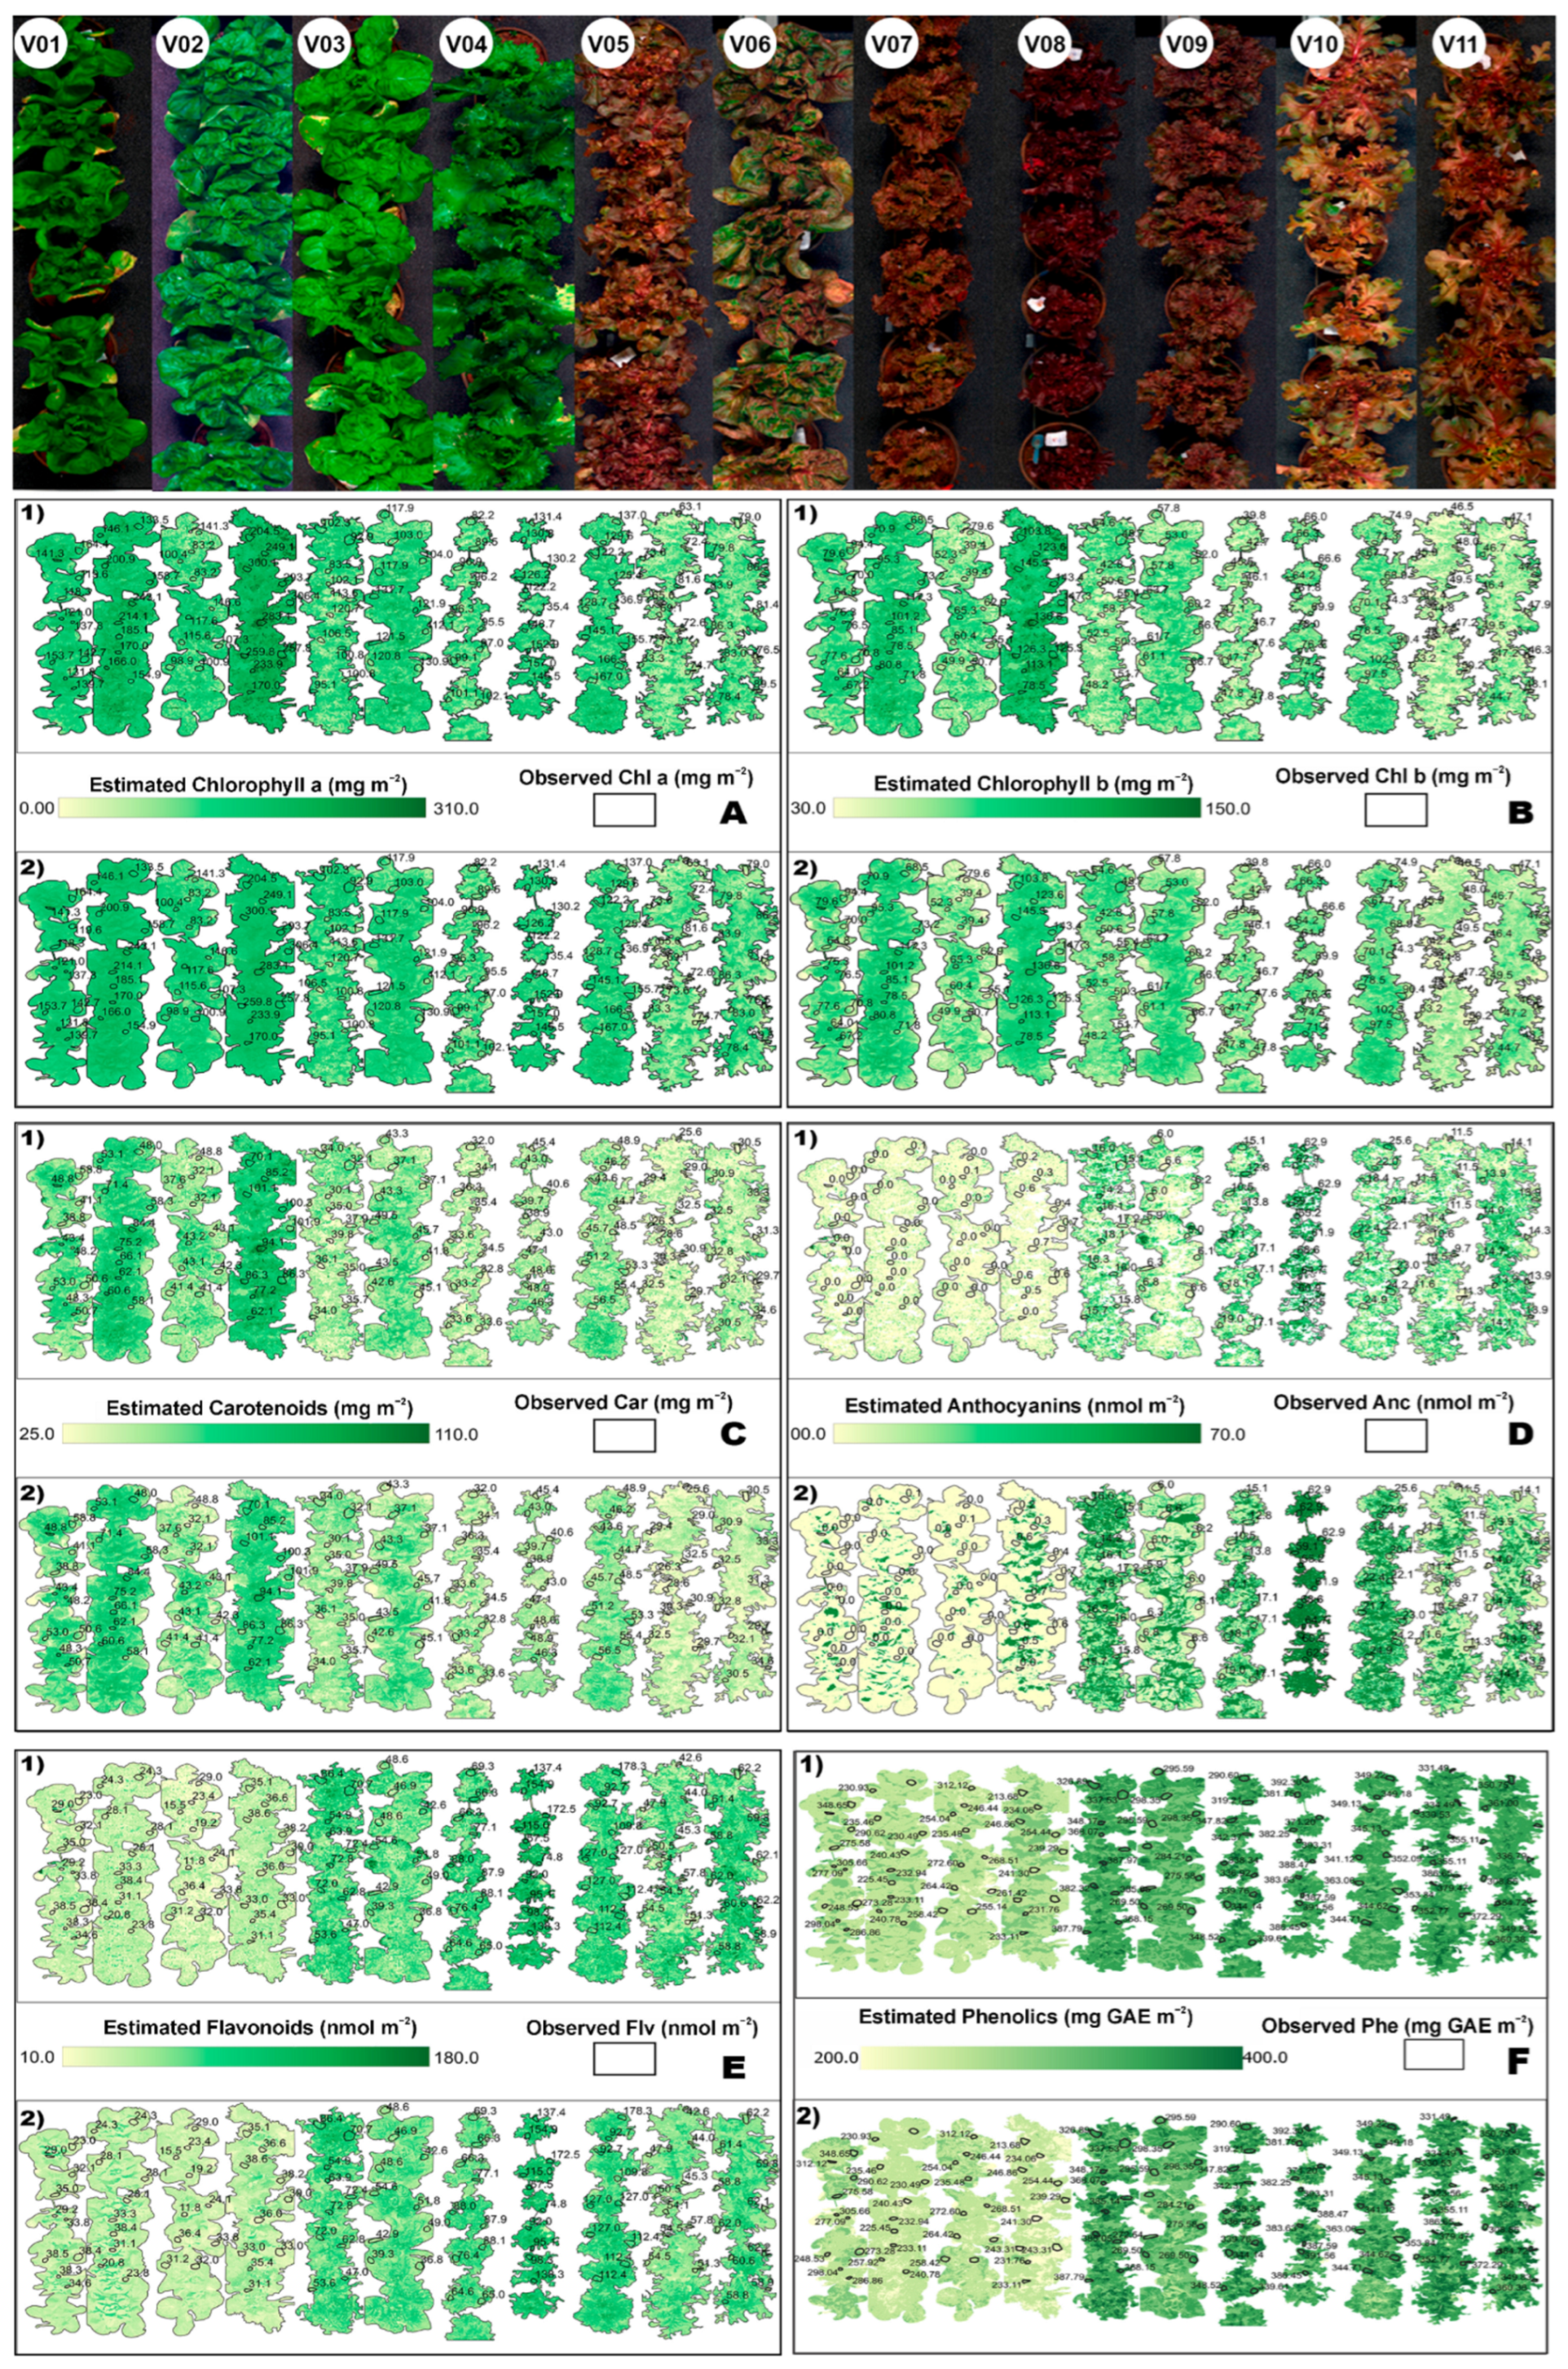
Figure 6 presents the spatial distribution maps of six key biochemical traits across eleven lettuce cultivars (V01–V11), which were predicted via both multispectral and hyperspectral imaging. The true-color RGB images (top row) clearly distinguish between green-leaf cultivars (V01–V04) and red-leaf cultivars (V05–V11), with the latter displaying a gradient from reddish-brown to deep purple pigmentation.
The trait maps revealed substantial genotypic differences in pigment and phenolic distribution. The green-leaf cultivars consistently presented high concentrations of chlorophyll a, chlorophyll b, and carotenoids, as highlighted by the intense green tones and elevated laboratory ROI values. Conversely, these pigments are significantly diminished in red-leaf cultivars, whereas anthocyanin concentrations are considerably elevated in this group, exhibiting extensive distribution across the leaf surface. The green-leaf types presented minimal anthocyanin contents, as indicated by the yellow map tones and low ROI values.
Flavonoids and total phenolics display broader distributions across cultivars. While red-leaf varieties contain higher concentrations—especially for total phenolics—significant intragroup variability is evident, suggesting complex regulation beyond simple colour grouping. Notably, both the MicaSense multispectral and Headwall hyperspectral models effectively capture spatial heterogeneity, with visible concentration gradients aligning with anatomical leaf regions. The hyperspectral predictions, however, offer slightly finer spatial detail than the multispectral approach does. Overall, these results highlight the strong agreement between imaging-based predictions and laboratory measurements, demonstrating the value of spatial mapping for identifying cultivar-specific biochemical patterns and supporting high-throughput phenotyping in leafy vegetables.

4. Discussion

4.1. Impact of Cultivars on Biochemical Composition

Under greenhouse conditions, the eleven lettuce cultivars (V01–V11) presented pronounced genotypic differences in terms of leaf pigment and phenolic composition. All the measured compounds (chlorophyll a, chlorophyll b, carotenoids, anthocyanins, flavonoids, and total phenolics) varied significantly among the cultivars, with coefficients of variation ranging from ~17% to ~126% (Figure 1, Figure 2, Figure 3, Figure 4, Figure 5 and Figure 6) [9]. For example, anthocyanins are absent in some green cultivars but are abundant in others, reflecting the broad genetic diversity in secondary metabolite accumulation within Lactuca sativa L. Hierarchical clustering of the chemometric data clearly separates the cultivars by their biochemical profiles.
In general, fully green-leaved varieties (V01, V02, V03, V04) clustered together, exhibiting the lowest levels of anthocyanins, flavonoids, and total phenolics; conversely, the deep red/purple cultivars (V08, V09) formed an opposing cluster with the highest concentrations of these compounds [34,35]. Intermediate “green-purplish” types (e.g., V05, V07, V10, and V11) fell between these extremes, and one cultivar (V06) remained centrally positioned with a more balanced pigment profile. This inverse relationship between pigment classes was a striking feature of our results. The varieties that accumulated the lowest levels of flavonoids, anthocyanins, and phenolics presented the highest concentrations of chlorophyll (a, b, and total) and carotenoids, and vice versa [36,37,38].
These findings indicate a trade-off or differential regulation between photosynthetic pigments and secondary phenolics across lettuce genotypes. Anthocyanins, the flavonoid pigments responsible for red colouration, are essentially absent in green cultivars, whereas red cultivars accumulate them in high amounts, indicating underlying genetic differences in anthocyanin biosynthesis [39]. Consistently, we observed that chlorophyll and carotenoid contents covaried positively (reflecting their joint role in the chloroplast), whereas anthocyanin levels were closely paralleled by flavonoid levels, since anthocyanins are a subclass of flavonoids that share the same biosynthetic pathway [40]. The PCA biplot of our data further illustrated this dichotomy: cultivars rich in chlorophyll/carotenoid loaded opposite to those high in anthocyanin/flavonoid, confirming that these pigment groups contribute in opposite ways to the principal variance among the cultivars.
Biochemical differences exist among lettuce cultivars. Compared with green varieties, red-leaf varieties are widely reported to accumulate significantly greater amounts of flavonoids, anthocyanins, and total phenolic compounds [40,41], making them richer sources of antioxidants. For example, one recent study revealed that red lettuce presented higher phenolic and flavonoid levels than did green lettuce grown under the same conditions. Similarly, comparative analyses have shown that total phenolic concentrations in red lettuce are 2–3 times greater than those in green lettuce [7]. The green cultivars, while higher in chlorophyll and carotenoids, contained markedly fewer phenolics (especially no anthocyanin), whereas the pigmented cultivars accumulated abundant phenolic phytochemicals. This genotypic contrast in secondary metabolism underscores the dominant impact of cultivar on the biochemical composition of lettuce [2,19].
Overall, the substantial biochemical variation observed among the 11 cultivars highlights the importance of genetic factors in determining the phytochemical profile of lettuce. Even under controlled environmental conditions, each cultivar manifests a unique spectrum of pigments and phenolics [40]. This diversity not only explains the distinct spectral signatures captured in our hyperspectral measurements but also has practical implications. These results indicate that breeding or cultivar selection may be adjusted to target nutritional or functional characteristics. For example, red-pigmented cultivars contain high levels of antioxidant phenolics, whereas green cultivars typically yield relatively high amounts of chlorophyll and carotenoids. Our study revealed that multivariate analysis (including cluster grouping and PCA) clearly differentiated cultivar profiles, demonstrating that hyperspectral imaging with machine learning reliably classified varieties based on biochemical differences.
In summary, the cultivar had a clear and profound effect on the biochemical composition of lettuce in our study, driving the observed clustering of pigment profiles and offering a deeper understanding of how genetic variation in L. sativa translates into divergent phytochemical outcomes under the same growing conditions [40]. These results concur with recent literature confirming that the secondary metabolite content of lettuce is highly cultivar dependent, with red/purple genotypes consistently enriched in anthocyanins and related phenolics relative to their green counterparts [39]. This genotype-driven biochemical heterogeneity provides a strong foundation for the predictive models and classification approaches employed, as discussed later, and emphasizes that cultivar selection is a key factor in the nutraceutical quality of lettuce.

4.2. Spectral Reflectance Pattern and Pigment Content

The leaf reflectance spectra from both sensors clearly mirrored the underlying pigment concentrations. In our results, leaves with relatively high chlorophyll (and related pigments) contents presented markedly lower reflectance in the visible range (400–700 nm) than did low-pigmentation leaves, which was consistent with strong absorption by chlorophyll a and b in the blue and red wavelengths [42]. A pronounced “green peak” at ~550 nm was evident, but even the reflectance tended to be inversely correlated with the chlorophyll content (darker, high-chlorophyll foliage reflected less green light) [42]. Importantly, a greater correlation in the red-edge region (~690–730 nm) emerged as a key spectral domain linked to pigment levels. The high-chlorophyll leaves presented a red-edge inflection point that shifted towards longer wavelengths and lower reflectance at ~710 nm, whereas the low-chlorophyll leaves presented an earlier, more abrupt increase in reflectance. Recent studies have confirmed that red-edge metrics are reliable indicators of leaf chlorophyll content. For example, Sonobe et al. (2017) [43] reported that reflectance in the red-edge (~710 nm) and green (~525–630 nm) bands was strongly negatively correlated with tea leaf chlorophyll (r down to −0.7). After appropriate preprocessing (e.g., continuum removal or scatter correction), these correlations became even stronger, underscoring that subtle spectral features carry significant chlorophyll signals.
The spectral signatures show that as the pigment content increases, the reflectance in the chlorophyll-absorptive bands decreases, and the red-edge feature shifts, whereas the NIR plateau (>750 nm) remains high across samples (dominated by the leaf structure, not the pigment). These characteristic spectral responses confirm that the sensors captured biochemical variations. Notably, the hyperspectral Headwall sensor, with its continuous narrow bands, resolved these features in detail (e.g., gradual slopes and inflection shape of approximately 705 nm), whereas the MicaSense multispectral sensor (with only broad discrete bands) captured the major trends but with less nuance. This difference is reflected in our model results, which are consistent with findings in the literature that hyperspectral indices detect pigment changes more sensitively than broadband indices do. For example, in a light experiment with a vegetation index (SIPI, SRI, CRI, or ARI1), chlorophyll decreased before comparable multispectral indices did [44]. Thus, the richer spectral detail from Headwall yielded stronger pigment–reflectance relationships, whereas MicaSense’s broader bands limited the detection of subtle pigment-induced spectral shifts.

4.3. Predictive Model Performance Across Sensors

All regression models successfully learned the relationships between spectral reflectance and leaf biochemical traits (primarily pigment content), but their performance varied in magnitude and generality. Partial least squares regression (PLSR) provided a strong baseline for both sensor datasets. Despite its simplicity, PLSR effectively leverages the high collinearity of spectral bands [45], distilling the reflectance data into latent factors linked to pigment variation. Indeed, the predictive accuracy of PLSR in our study was high (with cross-validated R2 values indicating that most pigment variability was explained), indicating a linear relationship between the reflectance and chlorophyll concentration.
The PLSR can be highly effective for leaf-level trait estimation [26]. For example, Wang et al. (2023) [46] reported that PLSR performed on par with nonlinear Gaussian process and random forest models for UAV-based chlorophyll estimation (R2~0.75–0.83) [26]. In our case, more complex machine learning models (Random Forest, Neural Network, Cubist) yielded comparable or, in some cases, slightly better accuracy, but not dramatically so. The random forest (RF) models effectively identified certain nonlinear interactions between reflectance and traits, which resulted in a slight reduction in prediction errors. This was particularly advantageous for multispectral data, where leveraging nonlinear relationships among broad spectral bands proved beneficial. This trend—RF outperforming PLSR—has been noted in some studies [1,21,47]. For example, Zhang et al. (2023) [48], Habibi et al., 2019 [21] and Falcioni et al. (2022) [9] reported that RF models are superior to PLSR for soybean and lettuce trait prediction from imagery. Nevertheless, the enhancement achieved with RF was limited, indicating that linear combinations of wavelengths had already explained the majority of the pigment concentration.
The Cubist regression model (a rule-based regression tree ensemble) performed robustly as well. Cubist is known to solve many regression problems by partitioning the feature space and fitting local linear models, and it indeed provides among the lowest prediction errors here. This aligns with broader evaluations showing that Cubist often achieves top accuracy across diverse datasets [49]. However, its comparatively poorer performance on the test set suggests overfitting, due to the model’s reliance on recursive partitioning combined with local linear fits, which can overadapt to spectral noise or redundancy in high-dimensional hyperspectral data. This highlights the importance of regularization and feature selection strategies to improve generalizability in such scenarios. In this sense, the neural network (NN) model likewise achieved high accuracy, particularly for the Headwall hyperspectral data, hinting at its ability to model complex spectral–biochemical relationships. Notably, recent research in grapevine has demonstrated that a genetic algorithm-optimized BP neural network outperforms both RF and SVR for leaf chlorophyll prediction (R2 ≈ 0.83) [50].
The NN models, albeit with simpler architectures, similarly showed excellent fit, although at the cost of requiring more calibration data to avoid overfitting. Overall, the relative ranking of the models in our analysis was subtle—no single approach was overwhelmingly superior across all the traits and sensors. This finding underscores the importance of data characteristics: with an adequate sample size and well-chosen spectral features, even straightforward methods such as PLSR can rival more “black-box” algorithms [26]. However, we observed that the more flexible models (Cubist, NN, and RF) maintained a slight edge in generalizability, especially when predicting an independent test set. This reflects their capacity to oversee any minor nonlinearities in the pigment–reflectance response (e.g., saturation at high pigment levels) that PLSR’s strictly linear framework might not fully capture. Notably, models incorporating feature selection or optimization tended to perform best.
In the literature, hybrid approaches such as GA-PLSR (genetic algorithm coupled with PLSR) have shown superior accuracy to either standalone PLSR or univariate machine learning methods [22]. In our study, reducing hyperspectral data dimensionality (using PLS loadings or variable selection) yielded the best results, by eliminating noisy or redundant bands and improving model robustness. In summary, all techniques have proven effective for pigment prediction from spectra, and our comparative analysis echoes recent consensus: no single algorithm uniformly dominates, and performance differences often result from data volume, noise, and the degree of nonlinearity in the trait–spectra relationship [45].
One clear outcome was the greater predictive power of the models built on the Headwall hyperspectral data relative to the MicaSense multispectral data. Under identical regression methods, the hyperspectral-based models achieved higher R2 values and lower RMSEs for pigment traits. For example, PLSR on the Headwall spectra explained a greater fraction of the chlorophyll variance than PLSR on the MicaSense bands did. This is unsurprising—the hyperspectral sensor’s continuous narrow bands capture fine-grained spectral features (such as subtle shifts in the red edge or specific absorption band depths) that MicaSense’s five broad bands cannot resolve. These findings corroborate the general advantage of hyperspectral resolution for biochemical trait estimation. Katuwal et al. (2023) [44] similarly noted that a hyperspectral imaging system (447 bands) achieved ≈87% variance explained in turf pigment and water status, outperforming a multispectral camera when the same modelling approach was used. In our study, the multispectral models still performed with reasonable accuracy, indicating that the MicaSense bands (which include a red-edge channel) do capture the primary pigment signals associate with concentration in leaves.
Multispectral models, especially those utilizing machine learning with indices or band combinations, demonstrated accuracy comparable to certain hyperspectral models. This indicates that carefully selected broadband indices may act as effective proxies for estimating pigment content. Recent work has shown that in certain scenarios, UAV multispectral data, if combined with ancillary information or calibrated against a specific target, can predict chlorophyll nearly as well as hyperspectral data [26]. Nonetheless, a consistent gap remained: the hyperspectral models were more generalizable and sensitive to small pigment differences (e.g., they better distinguished intermediate chlorophyll levels), whereas the multispectral models tended to saturate or lose resolution at the extremes. Cross-sensor generalization presents significant challenges; models trained using Headwall spectra are not readily transferable to MicaSense reflectance data due to differences in band definitions and variations in scale. This reflects a known challenge: even when measuring the same target, different sensors yield nonidentical reflectance values or spectral responses [51]. As such, sensor-specific calibration was necessary. Indeed, any attempt to transfer models across sensor types must account for spectral response differences (e.g., via band harmonization or recalibration), as highlighted by significant reflectance discrepancies between the MicaSense RedEdge UAV sensor and Sentinel-2 satellite data [51]. In practice, the hyperspectral-derived model is designed for use with hyperspectral imagery, whereas the multispectral model is adjusted to match that sensor’s bands. This reflects a balance between the accuracy offered by hyperspectral approaches and the wider applicability or cost-related benefits of multispectral methods. In this sense, hyperspectral sensing integrated with AI enables high-precision plant identification, with trade-offs between hyperspectral accuracy and multispectral cost efficiency guiding sensor choice depending on the application scale and resource constraints. In this sense, from a new perspective, the selection of imaging technology should strategically balance performance needs with operational feasibility in agricultural contexts [52].

4.4. Spatial Mapping of Predicted Traits

The application of our calibrated models to full imagery enabled spatial mapping of leaf biochemical traits across the orchard. These maps provide a powerful visualization of pigment variability that would be impossible to obtain from sparse sampling alone. The predicted chlorophyll content maps (for example) revealed distinct spatial patterns. Notably, certain plots or sections consistently presented higher predicted chlorophyll levels, whereas others presented lower values—a pattern that corresponds to the known layout of our field trial.
Heterogeneity reflects underlying differences such as genotype (cultivar) blocks or microenvironmental variation, although we avoid reiterating cultivar-specific trends here. The key point is that the spectral models captured these spatial differences in pigment status. In this sense, the continuity of the high-chlorophyll a and b zones in the maps and their agreement with field observations of foliage greenness increase the confidence in the model’s generalizability. For example, areas predicted to have high pigment content indeed aligned with visibly lush canopies, whereas low-prediction areas often coincided with visibly paler or more senescent foliage. The validation plots quantitatively confirmed this agreement, demonstrating that the mapping process captures genuine biochemical variation rather than merely interpolating noise.
The fine-resolution trait maps are highly valuable in both research and practical contexts. For example, in our study, we were able to discern patterns of nutrient or pigment distribution that manual sampling might miss by akin to how Zhou et al. (2022) mapped multiple plant traits in alpine grasslands and discovered localized patterns undetectable by ground surveys [53]. Our pigment maps similarly highlight subtle gradients: some within-plot variability was apparent, suggesting microscale influences (soil fertility patches or shading effects) that merit further investigation. Moreover, by generating maps from both sensor types, we demonstrated the trade-offs in spatial prediction. The Headwall hyperspectral data produced very detailed trait maps with smooth gradients, whereas the MicaSense-based maps, while capturing the major patterns, were slightly blacker because of the lower spectral detail and slightly higher prediction error. Even so, both sensor maps were consistent in identifying the same high- and low-pigment zones, reinforcing the reliability of the predictions.
Visualizing leaf biochemical traits spatially has important applications. This confirms that our regression models do not overfit laboratory measurements but are truly capturing field variability in pigment content. This builds the trust that these models can be used for in situ monitoring [54,55]. For example, decision-making in precision agriculture can be effectively informed. If one observes a low-chlorophyll patch on the map, it could indicate nutrient deficiency or incipient stress, prompting targeted intervention. In a breeding or experimental trial, such maps help compare genotype performance: one can literally “see” which cultivar plots maintain higher chlorophyll (indicative of better vigour or nutrient uptake) [15,56]. Furthermore, the mapping highlights the generalizability of the models across space: despite possible confounding factors (soil background, canopy density, etc.), the predictions remained coherent across the entire image. This indicates the models’ robustness and the efficiency of our preprocessing (e.g., masking nonvegetation and using NDVI thresholds to focus on healthy canopy pixels) [31,57]. In summary, the spatial mapping exercise corroborated and extended our plot-level findings. This approach provides a tangible link between spectral predictions and field reality, reinforcing that spectral reflectance patterns can not only quantify leaf pigment content accurately but also do so continuously over space.
This synergy of spectroscopy and imaging enables high-resolution nutrient/pigment monitoring over large areas, an approach increasingly reported in recent literature [26]. These findings demonstrate that, with appropriate modelling, both hyperspectral and multispectral sensors can generate reliable chlorophyll/pigment maps, with the former offering higher fidelity and the latter offering a cost-effective alternative with acceptable accuracy. Such outcomes are particularly relevant for plant phenotyping and precision crop management, where understanding the spatial distribution of biochemical traits is key to informed decision-making.
The comparative analysis across sensors and algorithms underscores a central theme: spectral resolution and data-driven modelling both enhance our ability to assess plant health and traits, but even simpler spectra (from multispectral cameras) contain enough pigment signals to be useful. Finally, by translating predictions into spatial maps, we demonstrate the practical utility and scalability of our approach, moving from leaf-level chemistry to landscape-level insights in a rigorous, quantitative manner. The consistency of these findings with recent plant remote sensing studies [26,36,54] provides further confidence in the robustness of our interpretations. Each piece, spectral pattern, model performance, sensor comparison, and spatial mapping builds a cohesive understanding of how leaf pigment content influences reflectance and how, in turn, we can reliably infer biochemical traits from spectral data at scale.
This approach achieved a certain level of predictive accuracy and spatial resolution; however, the study was conducted with a moderate sample size under greenhouse-specific conditions, which may impact its applicability to open-field environments. Nevertheless, by highlighting the robust performance of both multispectral and hyperspectral models, our findings provide a foundation for the development of scalable, cost-effective sensing platforms and field protocols, supporting future efforts to validate and adapt these techniques under real-world agricultural conditions. Complex machine learning models, such as neural networks and Cubist regression, may particularly benefit from larger datasets to ensure robust and generalizable predictions. Future work should expand the dataset to include more cultivars and stress conditions and validate the models under diverse field settings. In addition, integrating other sensors and exploring transfer learning approaches could further enhance the generalizability and robustness of the models.

5. Conclusions

This study demonstrated that hyperspectral imaging coupled with machine learning can accurately predict key foliar biochemical traits (pigment and phenolic concentrations) in lettuce across multiple cultivars. Genotypic differences were found in pigment and phenolic contents across the cultivars, as shown by their unique spectral signatures. Crucially, the hyperspectral sensor’s finer spectral resolution captured subtle wavelength features associated with chlorophylls, anthocyanins, and other phenolic compounds that a multispectral sensor’s broader bands could not resolve. As a result, models built on full hyperspectral data achieved markedly higher predictive performance (e.g., greater accuracy and R2 = 0.91 for anthocyanins using RF) than those using limited multispectral bands. Although the models demonstrated robust performance, several constraints emerged during the processes of spectral data acquisition and ground-truth validation. Variations in leaf surface texture, lighting conditions, and biochemical heterogeneity within cultivars may have introduced additional noise. Future studies will focus on expanding the spectral database across more species, cultivars, and environmental conditions to improve model generalizability and resilience under field conditions. The outcomes of this research will contribute to the development of novel, nondestructive methods for assessing the nutritional quality of lettuce, facilitating the selection of superior cultivars for breeding programs and improving the nutritional and functional quality of lettuce.

Author Contributions

Conceptualization, J.V.F.G., R.F. and M.R.N.; Data curation, R.F.; Formal analysis, J.V.F.G., R.F., T.R., R.H.F., L.G.T.C. and C.A.d.O.; Funding acquisition, R.F., T.R., A.L.B.R.d.S., R.H.F., L.G.T.C. and M.R.N.; Investigation, J.V.F.G., R.F., T.R., A.L.B.R.d.S. and M.R.N.; Methodology, J.V.F.G., R.F., T.R., A.L.B.R.d.S., R.H.F., L.G.T.C., K.M.d.O., C.A.d.O., N.G.V. and M.R.N.; Project administration, R.F., A.L.B.R.d.S., R.H.F. and M.R.N.; Resources, J.A.M.D. and M.R.N.; Software, J.V.F.G., R.F., T.R., A.L.B.R.d.S., R.H.F., K.M.d.O., C.A.d.O., N.G.V., J.A.M.D. and M.R.N.; Supervision, R.F., T.R. and R.H.F.; Validation, R.F., L.G.T.C., K.M.d.O., C.A.d.O., N.G.V., J.A.M.D. and M.R.N.; Visualization, T.R. and L.G.T.C.; Writing—original draft, J.V.F.G., R.F., T.R., R.H.F., L.G.T.C., K.M.d.O., C.A.d.O., N.G.V., J.A.M.D. and M.R.N.; Writing—review and editing, J.V.F.G., R.F., A.L.B.R.d.S., L.G.T.C., C.A.d.O., J.A.M.D. and M.R.N. All authors have read and agreed to the published version of the manuscript.

Funding

Coordenação de Aperfeiçoamento de Pessoal de Nível Superior: 001; National Council for Scientific and Technological Development: Programa de Apoio à Fixação de Jovens Doutores no Brasil 168180/2022-7; Fundação Araucária: CP 19/2022—Jovens Doutores.

Institutional Review Board Statement

Not applicable.

Informed Consent Statement

Not applicable.

Data Availability Statement

The original contributions presented in this study are included in the article. Further inquiries can be directed to the corresponding authors.

Conflicts of Interest

Author Luís Guilherme Teixeira Crusiol was employed by the company Embrapa Soja (National Soybean Research Center—Brazilian Agricultural Research Corporation). The remaining authors declare that the research was conducted in the absence of any commercial or financial relationships that could be construed as a potential conflict of interest.

References

  1. Moura, L.d.O.; Lopes, D.d.C.; Neto, A.J.S.; Ferraz, L.d.C.L.; Carlos, L.d.A.; Martins, L.M. Evaluation of Techniques for Automatic Classification of Lettuce Based on Spectral Reflectance. Food Anal. Methods 2016, 9, 1799–1806. [Google Scholar] [CrossRef]
  2. Lopes, D.d.C.; Moura, L.d.O.; Neto, A.J.S.; Ferraz, L.d.C.L.; Carlos, L.d.A.; Martins, L.M. Spectral Indices for Non-Destructive Determination of Lettuce Pigments. Food Anal. Methods 2017, 10, 2807–2814. [Google Scholar] [CrossRef]
  3. Steidle Neto, A.J.; Moura, L.O.; Lopes, D.C.; Carlos, L.A.; Martins, L.M.; Ferraz, L.C. Non-Destructive Prediction of Pigment Content in Lettuce Based on Visible-NIR Spectroscopy. J. Sci. Food Agric. 2017, 97, 2015–2022. [Google Scholar] [CrossRef]
  4. Falcioni, R.; Gonçalves, J.V.F.; de Oliveira, K.M.; de Oliveira, C.A.; Demattê, J.A.M.; Antunes, W.C.; Nanni, M.R. Enhancing Pigment Phenotyping and Classification in Lettuce through the Integration of Reflectance Spectroscopy and AI Algorithms. Plants 2023, 12, 1333. [Google Scholar] [CrossRef]
  5. Agnolucci, M.; Avio, L.; Palla, M.; Sbrana, C.; Turrini, A.; Giovannetti, M. Health-Promoting Properties of Plant Products: The Role of Mycorrhizal Fungi and Associated Bacteria. Agronomy 2020, 10, 1864. [Google Scholar] [CrossRef]
  6. Matysiak, B.; Ropelewska, E.; Wrzodak, A.; Kowalski, A.; Kaniszewski, S. Yield and Quality of Romaine Lettuce at Different Daily Light Integral in an Indoor Controlled Environment. Agronomy 2022, 12, 1026. [Google Scholar] [CrossRef]
  7. Llorach, R.; Martínez-Sánchez, A.; Tomás-Barberán, F.A.; Gil, M.I.; Ferreres, F. Characterisation of Polyphenols and Antioxidant Properties of Five Lettuce Varieties and Escarole. Food Chem. 2008, 108, 1028–1038. [Google Scholar] [CrossRef]
  8. Clemente, A.A.; Maciel, G.M.; Siquieroli, A.C.S.; Gallis, R.B.d.A.; Pereira, L.M.; Duarte, J.G. High-Throughput Phenotyping to Detect Anthocyanins, Chlorophylls, and Carotenoids in Red Lettuce Germplasm. Int. J. Appl. Earth Obs. Geoinf. 2021, 103, 102533. [Google Scholar] [CrossRef]
  9. Falcioni, R.; Moriwaki, T.; Gibin, M.S.; Vollmann, A.; Pattaro, M.C.; Giacomelli, M.E.; Sato, F.; Nanni, M.R.; Antunes, W.C. Classification and Prediction by Pigment Content in Lettuce (Lactuca sativa L.) Varieties Using Machine Learning and ATR-FTIR Spectroscopy. Plants 2022, 11, 3413. [Google Scholar] [CrossRef] [PubMed]
  10. Carvalho, J.K.; Moura-Bueno, J.M.; Ramon, R.; Almeida, T.F.; Naibo, G.; Martins, A.P.; Santos, L.S.; Gianello, C.; Tiecher, T. Combining Different Pre-Processing and Multivariate Methods for Prediction of Soil Organic Matter by near Infrared Spectroscopy (NIRS) in Southern Brazil. Geoderma Reg. 2022, 29, e00530. [Google Scholar] [CrossRef]
  11. Crusiol, L.G.T.; Sun, L.; Sibaldelli, R.N.R.; Felipe, V., Jr.; Furlaneti, W.X.; Chen, R.; Sun, Z.; Wuyun, D.; Chen, Z.; Nanni, M.R.; et al. Strategies for Monitoring Within-Field Soybean Yield Using Sentinel-2 Vis-NIR-SWIR Spectral Bands and Machine Learning Regression Methods. Precis. Agric. 2022, 23, 1093–1123. [Google Scholar] [CrossRef]
  12. Wang, D.; Cao, W.; Zhang, F.; Li, Z.; Xu, S.; Wu, X. A Review of Deep Learning in Multiscale Agricultural Sensing. Remote Sens. 2022, 14, 559. [Google Scholar] [CrossRef]
  13. Huang, C.Y.; Asner, G.P. Applications of Remote Sensing to Alien Invasive Plant Studies. Sensors 2009, 9, 4869–4889. [Google Scholar] [CrossRef] [PubMed]
  14. Falcioni, R.; de Oliveira, R.B.; Chicati, M.L.; Antunes, W.C.; Demattê, J.A.M.; Nanni, M.R. Estimation of Biochemical Compounds in Tradescantia Leaves Using VIS-NIR-SWIR Hyperspectral and Chlorophyll a Fluorescence Sensors. Remote Sens. 2024, 16, 1910. [Google Scholar] [CrossRef]
  15. Chicati, M.S.; Nanni, M.R.; Chicati, M.L.; Furlanetto, R.H.; Cezar, E.; De Oliveira, R.B. Hyperspectral Remote Detection as an Alternative to Correlate Data of Soil Constituent. Remote Sens. Appl. Soc. Environ. 2019, 16, 100270. [Google Scholar] [CrossRef]
  16. Vigneault, P.; Lafond-Lapalme, J.; Deshaies, A.; Khun, K.; de la Sablonnière, S.; Filion, M.; Longchamps, L.; Mimee, B. An Integrated Data-Driven Approach to Monitor and Estimate Plant-Scale Growth Using UAV. ISPRS Open J. Photogramm. Remote Sens. 2024, 11, 100052. [Google Scholar] [CrossRef]
  17. Zsebő, S.; Bede, L.; Kukorelli, G.; Kulmány, I.M.; Milics, G.; Stencinger, D.; Teschner, G.; Varga, Z.; Vona, V.; Kovács, A.J. Yield Prediction Using NDVI Values from GreenSeeker and MicaSense Cameras at Different Stages of Winter Wheat Phenology. Drones 2024, 8, 88. [Google Scholar] [CrossRef]
  18. Furlanetto, R.H.; Moriwaki, T.; Falcioni, R.; Pattaro, M.; Vollmann, A.; Sturion, A.C., Jr.; Antunes, W.C.; Nanni, M.R. Hyperspectral Reflectance Imaging to Classify Lettuce Varieties by Optimum Selected Wavelengths and Linear Discriminant Analysis. Remote Sens. Appl. Soc. Environ. 2020, 20, 100400. [Google Scholar] [CrossRef]
  19. Shurygin, B.; Chivkunova, O.; Solovchenko, O.; Solovchenko, A.; Dorokhov, A.; Smirnov, I.; Astashev, M.E.; Khort, D. Comparison of the Non-Invasive Monitoring of Fresh-Cut Lettuce Condition with Imaging Reflectance Hyperspectrometer and Imaging PAM-Fluorimeter. Photonics 2021, 8, 425. [Google Scholar] [CrossRef]
  20. Zhang, N.; Zhou, X.; Kang, M.; Hu, B.-G.; Heuvelink, E.; Marcelis, L.F.M. Machine Learning versus Crop Growth Models: An Ally, Not a Rival. AoB PLANTS 2022, 15, plac061. [Google Scholar] [CrossRef]
  21. Habibi, L.N.; Watanabe, T.; Matsui, T.; Tanaka, T.S.T. Machine Learning Techniques to Predict Soybean Plant Density Using UAV and Satellite-Based Remote Sensing. Remote Sens. 2021, 13, 2548. [Google Scholar] [CrossRef]
  22. Ropelewska, E. Application of Imaging and Artificial Intelligence for Quality Monitoring of Stored Black Currant (Ribes nigrum L.). Foods 2022, 11, 3589. [Google Scholar] [CrossRef]
  23. Xu, Y.; Zhang, X.; Li, H.; Zheng, H.; Zhang, J.; Olsen, M.S.; Varshney, R.K.; Prasanna, B.M.; Qian, Q. Smart Breeding Driven by Big Data, Artificial Intelligence, and Integrated Genomic-Enviromic Prediction. Mol. Plant 2022, 15, 1664–1695. [Google Scholar] [CrossRef]
  24. Iqbal, I.M.; Balzter, H.; Firdaus-e-Bareen; Shabbir, A. Identifying the Spectral Signatures of Invasive and Native Plant Species in Two Protected Areas of Pakistan through Field Spectroscopy. Remote Sens. 2021, 13, 4009. [Google Scholar] [CrossRef]
  25. Hoeppner, J.M.; Skidmore, A.K.; Darvishzadeh, R.; Heurich, M.; Chang, H.-C.; Gara, T.W. Mapping Canopy Chlorophyll Content in a Temperate Forest Using Airborne Hyperspectral Data. Remote Sens. 2020, 12, 3573. [Google Scholar] [CrossRef]
  26. Wang, L.; Gao, R.; Li, C.; Wang, J.; Liu, Y.; Hu, J.; Li, B.; Qiao, H.; Feng, H.; Yue, J. Mapping Soybean Maturity and Biochemical Traits Using UAV-Based Hyperspectral Images. Remote Sens. 2023, 15, 4807. [Google Scholar] [CrossRef]
  27. dos Santos, G.L.A.A.; Reis, A.S.; Besen, M.R.; Furlanetto, R.H.; Rodrigues, M.; Crusiol, L.G.T.; de Oliveira, K.M.; Falcioni, R.; de Oliveira, R.B.; Batista, M.A.; et al. Spectral Method for Macro and Micronutrient Prediction in Soybean Leaves Using Interval Partial Least Squares Regression. Eur. J. Agron. 2023, 143, 126717. [Google Scholar] [CrossRef]
  28. Falcioni, R.; Moriwaki, T.; Rodrigues, M.; de Oliveira, K.M.; Furlanetto, R.H.; dos Reis, A.S.; dos Santos, G.L.A.A.; Mendonça, W.A.; Crusiol, L.G.T.; Gonçalves, J.V.F.; et al. Nutrient Deficiency Lowers Photochemical and Carboxylation Efficiency in Tobacco. Theor. Exp. Plant Physiol. 2023, 35, 81–97. [Google Scholar] [CrossRef]
  29. Braga, P.; Crusiol, L.G.T.; Nanni, M.R.; Caranhato, A.L.H.; Fuhrmann, M.B.; Nepomuceno, A.L.; Neumaier, N.; Farias, J.R.B.; Koltun, A.; Gonçalves, L.S.A.; et al. Vegetation Indices and NIR-SWIR Spectral Bands as a Phenotyping Tool for Water Status Determination in Soybean. Precis. Agric. 2021, 22, 249–266. [Google Scholar] [CrossRef]
  30. Li, X.; Zhou, R.; Xu, K.; Xu, J.; Jin, J.; Fang, H.; He, Y. Rapid Determination of Chlorophyll and Pheophytin in Green Tea Using Fourier Transform Infrared Spectroscopy. Molecules 2018, 23, 1010. [Google Scholar] [CrossRef]
  31. Overbeck, V.; Schmitz, M.; Blanke, M. Non-Destructive Sensor-Based Prediction of Maturity and Optimum Harvest Date of Sweet Cherry Fruit. Sensors 2017, 17, 277. [Google Scholar] [CrossRef] [PubMed]
  32. Gitelson, A.; Solovchenko, A.; Viña, A. Foliar Absorption Coefficient Derived from Reflectance Spectra: A Gauge of the Efficiency of in situ Light-Capture by Different Pigment Groups. J. Plant Physiol. 2020, 254, 153277. [Google Scholar] [CrossRef]
  33. Ragaee, S. Antioxidant Activity and Nutrient Composition of Selected Cereals for Food Use. Food Chem. 2006, 98, 32–38. [Google Scholar] [CrossRef]
  34. Luz, R.B. Attenuated Total Reflectance Spectroscopy of Plant Leaves: A Tool for Ecological and Botanical Studies. New Phytol. 2006, 172, 305–318. [Google Scholar] [CrossRef] [PubMed]
  35. Falcioni, R.; Gonçalves, J.V.F.; de Oliveira, K.M.; Antunes, W.C.; Nanni, M.R. VIS-NIR-SWIR Hyperspectroscopy Combined with Data Mining and Machine Learning for Classification of Predicted Chemometrics of Green Lettuce. Remote Sens. 2022, 14, 6330. [Google Scholar] [CrossRef]
  36. Asner, G.P.; Jones, M.O.; Martin, R.E.; Knapp, D.E.; Hughes, R.F. Remote Sensing of Native and Invasive Species in Hawaiian Forests. Remote Sens. Environ. 2008, 112, 1912–1926. [Google Scholar] [CrossRef]
  37. Ling, B.; Goodin, D.G.; Raynor, E.J.; Joern, A. Hyperspectral Analysis of Leaf Pigments and Nutritional Elements in Tallgrass Prairie Vegetation. Front. Plant Sci. 2019, 10, 142. [Google Scholar] [CrossRef]
  38. Blackburn, G.A. Hyperspectral Remote Sensing of Plant Pigments. J. Exp. Bot. 2007, 58, 855–867. [Google Scholar] [CrossRef]
  39. Shi, M.; Gu, J.; Wu, H.; Rauf, A.; Emran, T.B.; Khan, Z.; Mitra, S.; Aljohani, A.S.M.; Alhumaydhi, F.A.; Al-Awthan, Y.S.; et al. Phytochemicals, Nutrition, Metabolism, Bioavailability, and Health Benefits in Lettuce: A Comprehensive Review. Antioxidants 2022, 11, 1158. [Google Scholar] [CrossRef]
  40. Sumi, M.J.; Jahan, N.; Thamid, S.S.; Tarik, M.E.I.; Hassannejad, S.; Rahimi, M.; Imran, S. LED Light Effect on Growth, Pigments, and Antioxidants of Lettuce (Lactuca sativa L.) Baby Greens. BMC Plant Biol. 2025, 25, 582. [Google Scholar] [CrossRef]
  41. Lee, M.; Kim, J.; Oh, M.-M.; Lee, J.-H.; Rajashekar, C.B. Effects of Supplemental UV-A LEDs on the Nutritional Quality of Lettuce: Accumulation of Protein and Other Essential Nutrients. Horticulturae 2022, 8, 680. [Google Scholar] [CrossRef]
  42. Sonobe, R.; Hirono, Y. Applying Variable Selection Methods and Preprocessing Techniques to Hyperspectral Reflectance Data to Estimate Tea Cultivar Chlorophyll Content. Remote Sens. 2023, 15, 19. [Google Scholar] [CrossRef]
  43. Sonobe, R.; Wang, Q. Hyperspectral Indices for Quantifying Leaf Chlorophyll Concentrations Performed Differently with Different Leaf Types in Deciduous Forests. Ecol. Inform. 2017, 37, 1–9. [Google Scholar] [CrossRef]
  44. Katuwal, K.B.; Yang, H.; Huang, B. Evaluation of Phenotypic and Photosynthetic Indices to Detect Water Stress in Perennial Grass Species Using Hyperspectral, Multispectral and Chlorophyll Fluorescence Imaging. Grass Res. 2023, 3, 16. [Google Scholar] [CrossRef]
  45. Zhang, Y.-W.; Wang, T.; Guo, Y.; Skidmore, A.; Zhang, Z.; Tang, R.; Song, S.; Tang, Z. Estimating Community-Level Plant Functional Traits in a Species-Rich Alpine Meadow Using UAV Image Spectroscopy. Remote Sens. 2022, 14, 3399. [Google Scholar] [CrossRef]
  46. Wang, S.; Guan, K.; Zhang, C.; Jiang, C.; Zhou, Q.; Li, K.; Qin, Z.; Ainsworth, E.A.; He, J.; Wu, J.; et al. Airborne Hyperspectral Imaging of Cover Crops through Radiative Transfer Process-Guided Machine Learning. Remote Sens. Environ. 2023, 285, 113386. [Google Scholar] [CrossRef]
  47. Coast, O.; Shah, S.; Ivakov, A.; Gaju, O.; Wilson, P.B.; Posch, B.C.; Bryant, C.J.; Negrini, A.C.A.; Evans, J.R.; Condon, A.G.; et al. Predicting Dark Respiration Rates of Wheat Leaves from Hyperspectral Reflectance. Plant Cell Environ. 2019, 42, 2133–2150. [Google Scholar] [CrossRef]
  48. Zhang, Y.; Kong, X.; Deng, L.; Liu, Y. Monitor Water Quality through Retrieving Water Quality Parameters from Hyperspectral Images Using Graph Convolution Network with Superposition of Multi-Point Effect: A Case Study in Maozhou River. J. Environ. Manag. 2023, 342, 118283. [Google Scholar] [CrossRef]
  49. Bartsch, B.d.A.; Rosin, N.A.; dos Santos, U.J.; Coblinski, J.A.; Pelegrino, M.H.P.; Rosas, J.T.F.; Poppiel, R.R.; Ortiz, E.B.; Kochinki, V.C.V.; Gallo, P.; et al. A Step Forward in Hybrid Soil Laboratory Analysis: Merging Chemometric Corrections, Protocols and Data-Driven Methods. Remote Sens. 2024, 16, 4543. [Google Scholar] [CrossRef]
  50. Li, Y.; Xu, X.; Wu, W.; Zhu, Y.; Gao, L.; Jiang, X.; Meng, Y.; Yang, G.; Xue, H. Hyperspectral Estimation of Chlorophyll Content in Grapevine Based on Feature Selection and GA-BP. Sci. Rep. 2025, 15, 8029. [Google Scholar] [CrossRef]
  51. Isgró, M.A.; Basallote, M.D.; Caballero, I.; Barbero, L. Comparison of UAS and Sentinel-2 Multispectral Imagery for Water Quality Monitoring: A Case Study for Acid Mine Drainage Affected Areas (SW Spain). Remote Sens. 2022, 14, 4053. [Google Scholar] [CrossRef]
  52. Neri, I.; Caponi, S.; Bonacci, F.; Clementi, G.; Cottone, F.; Gammaitoni, L.; Figorilli, S.; Ortenzi, L.; Aisa, S.; Pallottino, F.; et al. Real-Time AI-Assisted Push-Broom Hyperspectral System for Precision Agriculture. Sensors 2024, 24, 344. [Google Scholar] [CrossRef] [PubMed]
  53. Zhou, Q.; Yu, L.; Zhang, X.; Liu, Y.; Zhan, Z.; Ren, L.; Luo, Y. Fusion of UAV Hyperspectral Imaging and LiDAR for the Early Detection of EAB Stress in Ash and a New EAB Detection Index NDVI(776,678). Remote Sens. 2022, 14, 2428. [Google Scholar] [CrossRef]
  54. Jin, J.; Wang, Q. Selection of Informative Spectral Bands for PLS Models to Estimate Foliar Chlorophyll Content Using Hyperspectral Reflectance. IEEE Trans. Geosci. Remote Sens. 2019, 57, 3064–3072. [Google Scholar] [CrossRef]
  55. Calviño-Cancela, M.; Martín-Herrero, J. Spectral Discrimination of Vegetation Classes in Ice-Free Areas of Antarctica. Remote Sens. 2016, 8, 856. [Google Scholar] [CrossRef]
  56. Gierlinger, N.; Keplinger, T.; Harrington, M. Imaging of Plant Cell Walls by Confocal Raman Microscopy. Nat. Protoc. 2012, 7, 1694–1708. [Google Scholar] [CrossRef]
  57. Gitelson, A.; Merzlyak, M.N. Spectral Reflectance Changes Associated with Autumn Senescence of Aesculus hippocastanum L. and Acer platanoides L. Leaves. Spectral Features and Relation to Chlorophyll Estimation. J. Plant Physiol. 1994, 143, 286–292. [Google Scholar] [CrossRef]
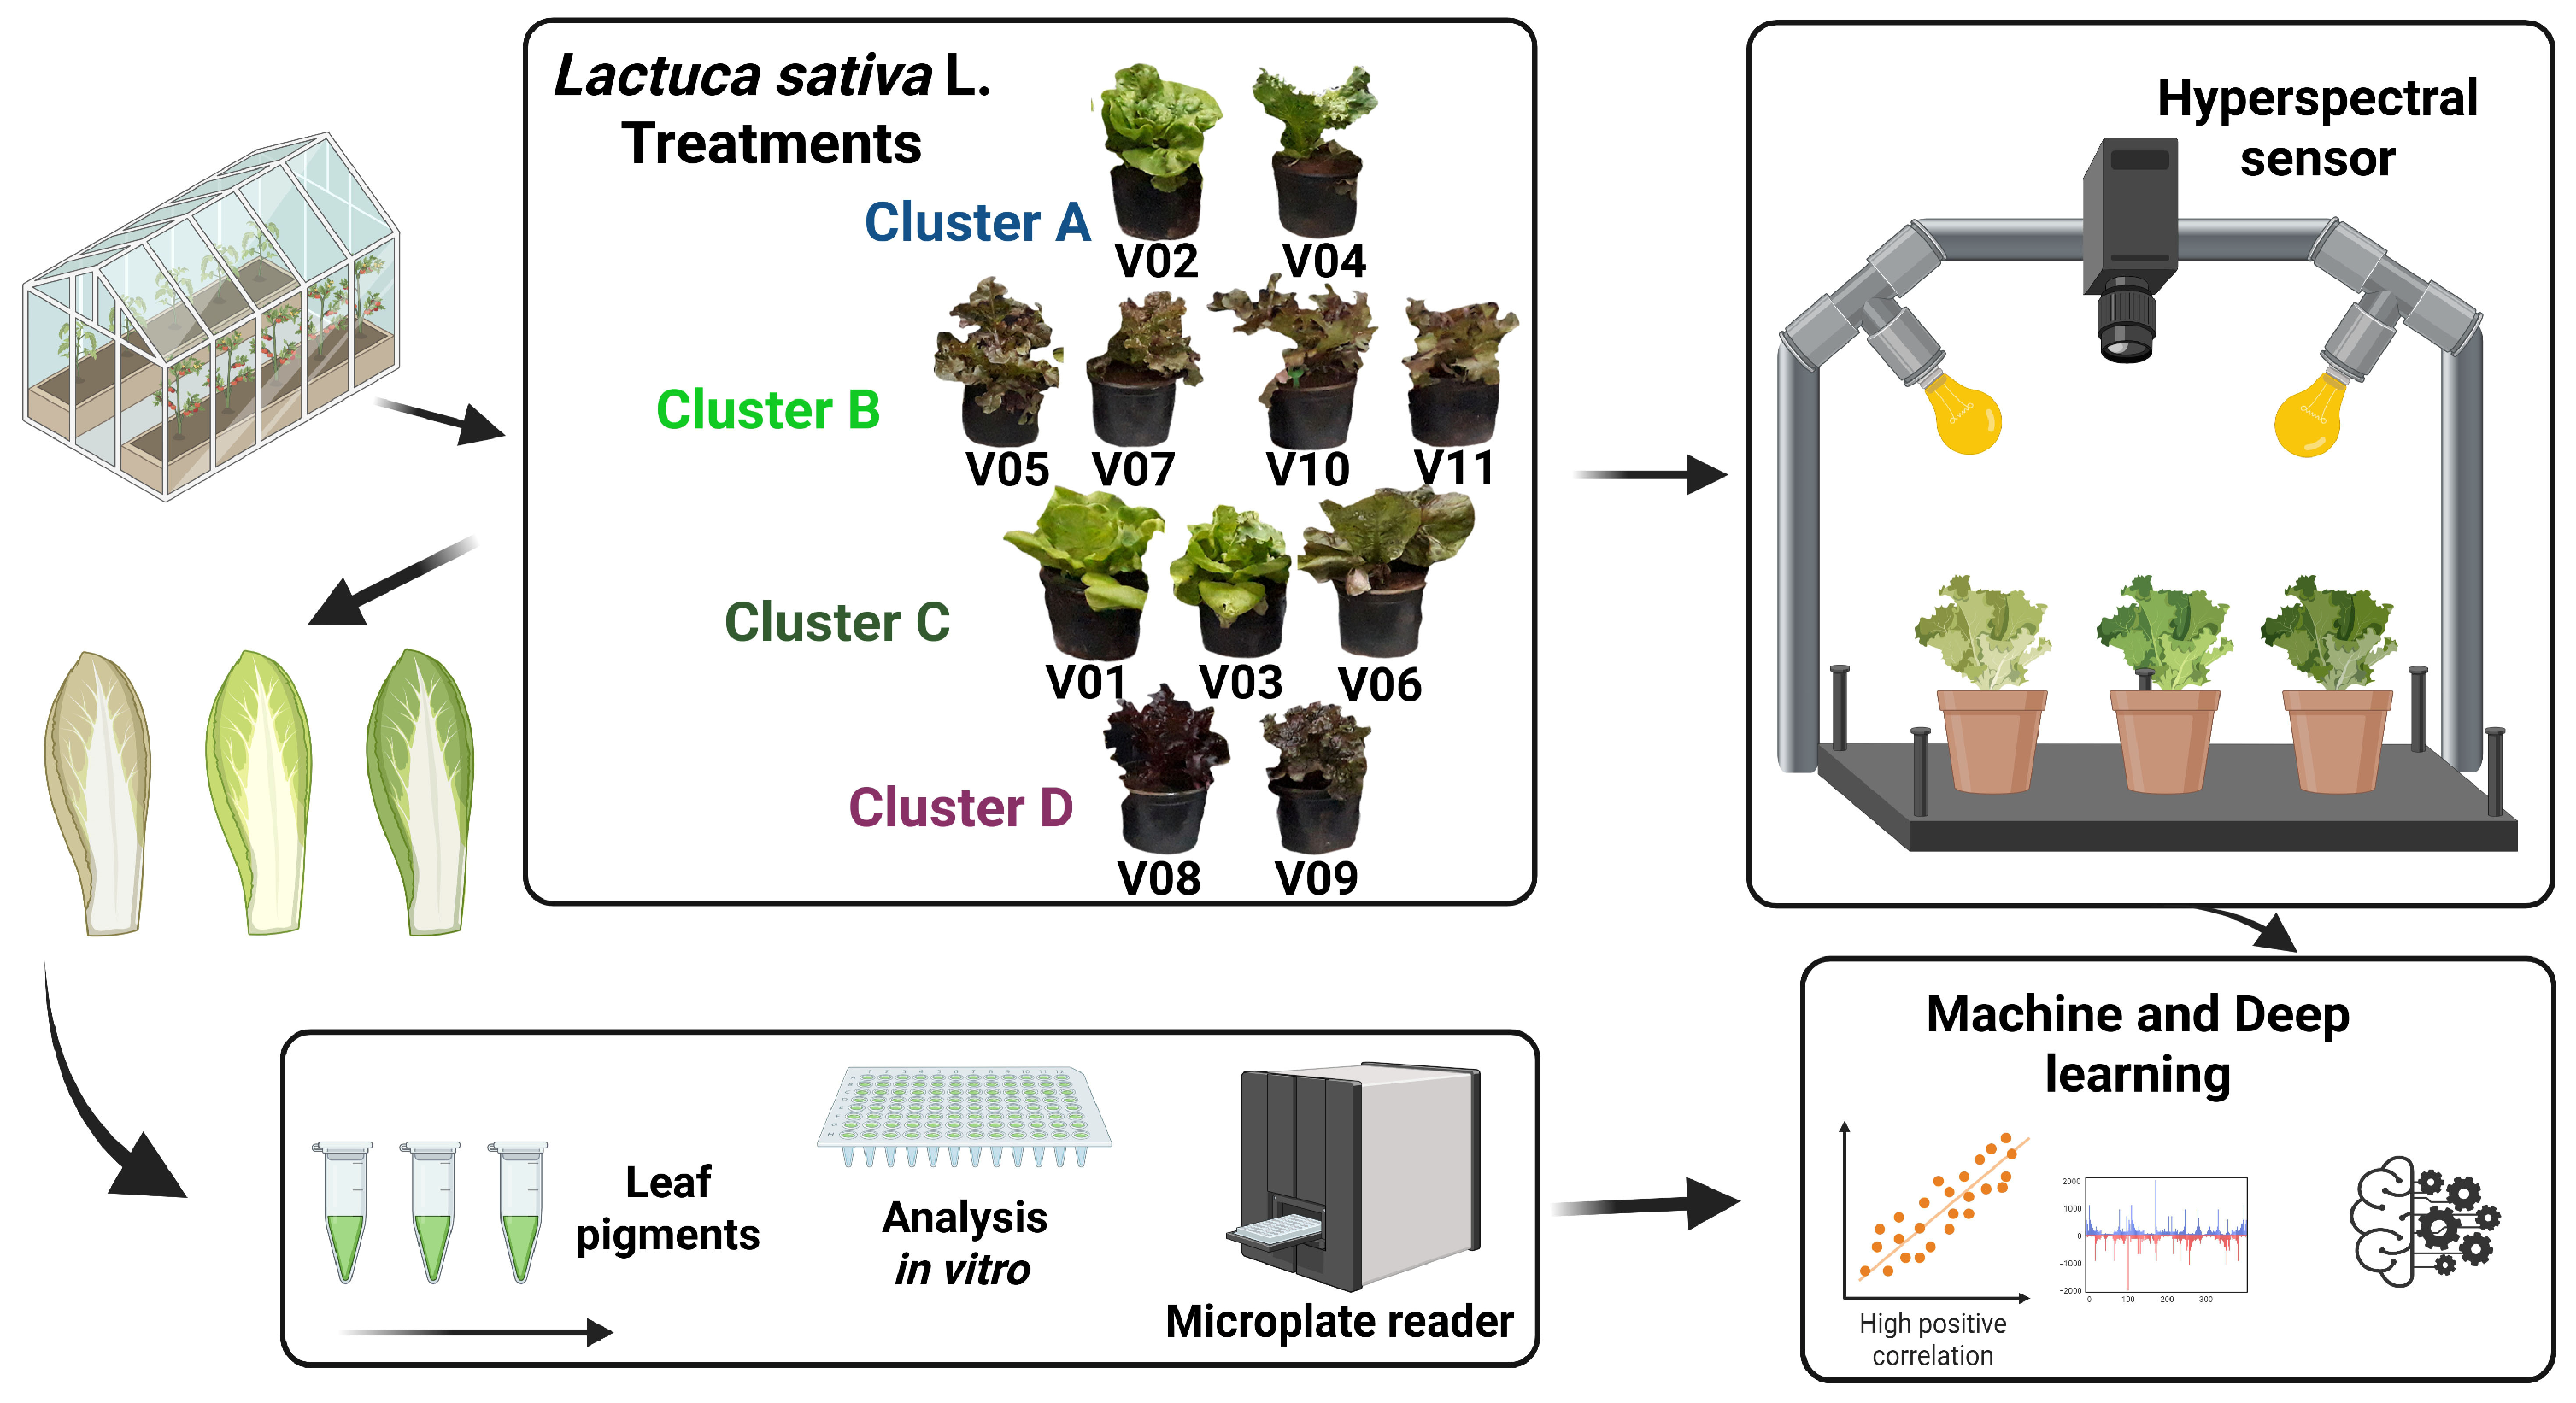
Figure 1. Schematic workflow for the prediction of biochemical parameters in lettuce (Lactuca sativa L.) via hyperspectral imaging and machine learning modelling. Eleven cultivars (V01–V11) exhibiting a range of leaf colouration were grown in a controlled greenhouse environment and categorized into four color clusters (A–D). The intact leaves were then scanned via a hyperspectral sensor array under standardized illumination to capture full reflectance spectra. Following spectral acquisition, the leaf tissues were subjected to solvent extraction and pigment quantification in vitro via a microplate reader. Finally, the paired spectral and biochemical datasets were analysed through multivariate statistical methods and deep learning algorithms to generate predictive models of leaf pigment content and related physiological traits.
Horticulturae 11 01077 g001
Figure 2. Spectral reflectance profiles and principal component analysis (PCA) of lettuce cultivar clusters. (A) Mean leaf reflectance spectra for the four-color clusters—A (blue), B (green), C (olive), and D (purple)—measured from 420–980 nm under uniform illumination. The vertical gray lines mark characteristic pigment absorption bands: chlorophyll a at 430 and 640 nm, chlorophyll b at 460 and 660 nm, and carotenoids at 470 nm. The distinct reflectance peaks in the visible range indicate cluster-specific pigment concentrations, whereas the plateau in the 700–900 nm range reflects leaf structural scattering. (B) Two-dimensional PCA biplot of the same cultivars (V01–V11), coloured by cluster, showing scores on PC1 (64.4% of variance) and PC2 (31.7%). The black vectors denote loadings for chlorophyll a (Chla), chlorophyll b (Chlb), and carotenoids (Car), which primarily contribute to separation along PC1. The red vectors indicate anthocyanins (AnC), flavonoids (Flv), and total phenolic compounds (Phe), which influence PC2. Vector length and orientation reflect each variable’s contribution to the principal components, demonstrating that Cluster A cultivars (e.g., V04) are rich in photosynthetic pigments, whereas Cluster D cultivars (e.g., V08) have elevated levels of flavonoids and anthocyanins. The analyses were carried out on plants 50 days after transplanting.
Horticulturae 11 01077 g002
Figure 3. (A) Relative importance of spectral vegetation indices for predicting physiological and biochemical responses in lettuce leaves under different pigments. The bar chart displays the relative variable importance (%) of 18 vegetation indices derived from hyperspectral data. The inset illustrates the principle of light interaction with leaves and the vegetation index calculation. Index abbreviations: NDVI, Normalised Difference Vegetation Index; GNDVI, Green Normalised Difference Vegetation Index; EVI, Enhanced Vegetation Index; SAVI, Soil-Adjusted Vegetation Index; OSAVI, Optimised Soil-Adjusted Vegetation Index; MSAVI2, Modified Soil-Adjusted Vegetation Index 2; SIPI, Structure Insensitive Pigment Index; PSSRc, Pigment Specific Simple Ratio for chlorophyll c; RARS, Ratio Analysis of Reflectance Spectra; WBI, Water Band Index; ARI1, Anthocyanin Reflectance Index 1; ARI2, Anthocyanin Reflectance Index 2; CRI1, Carotenoid Reflectance Index 1; CRI2, Carotenoid Reflectance Index 2; VOG1, Vogelmann Index 1; VOG2, Vogelmann Index 2; NPQI, Normalised Photochemical Quenching Index; PRI, Photochemical Reflectance Index. Indices with higher values indicate a greater contribution to the predictive modelling of leaf responses. (B) Spectral sensitivity heatmap showing the association Higher values indicate a greater contribution to the predictive modelling. Higher values indicate a greater contribution to the predictive modelling of leaf responses. (B) Spectral sensitivity heatmap showing the associations. Higher values indicate a greater contribution to the predictive modelling of leaf responses. (B) Spectral sensitivity heatmap showing the associations between wavelength (420–950 nm) and biochemical traits: chlorophyll a (Chla), chlorophyll b (Chlb), carotenoids (Car), flavonoids (Flv), and phenolics (Phe). (C) Pearson correlation matrix among foliar biochemical traits, indicating the strength and direction of linear relationships. Positive correlations are shown in red, and negative correlations are shown in blue, with the intensity representing the correlation coefficient. The analyses were carried out on plants 50 days after transplanting.
Horticulturae 11 01077 g003
Figure 4. Scatter plots of observed versus predicted chlorophyll and carotenoid concentrations (mg m−2). Predictions for chlorophyll a (A,D) and chlorophyll b (B,E) were obtained via partial least squares regression on headwall hyperspectral (A,B) and MicaSense multispectral (D,E) data. Carotenoid predictions were performed via PLS for Headwall (C) and random forest for MicaSense (F). The 1:1 diagonal line indicates perfect agreement; the inset boxes report each model’s coefficient of determination (R2) and RMSE. The analyses were carried out on plants 50 days after transplanting.
Horticulturae 11 01077 g004
Figure 5. Scatter plots of observed versus predicted anthocyanin, flavonoid and phenolic concentrations. Panels A, C and E use Headwall hyperspectral data—random forest for anthocyanins (A) and flavonoids (C) and PLS for phenolics (E). Panels B, D and F use MicaSense multispectral data—a neural network for anthocyanins (B) and phenolics (F) and a random forest for flavonoids (D). The 1:1 diagonal line denotes perfect prediction; the inset annotations show each model’s R2 and RMSE. The analyses were carried out on plants 50 days after transplanting.
Horticulturae 11 01077 g005
Figure 6. True color and predicted trait maps for eleven lettuce cultivars (V01–V11, left to right). The top row shows RGB composites of each whole leaf. The rows then show spatial estimates of six biochemical attributes: (A), chlorophyll a; (B), chlorophyll b; (C), carotenoids; (D), anthocyanins; (E), flavonoids; and (F), total phenolics. For each attribute, row 1 shows predictions from the MicaSense multispectral bands, and row 2 shows predictions from the Headwall hyperspectral data. A yellow-to-green color gradient indicates increasing concentration; overlaid numbers are the laboratory-measured ROI values for each leaf segment. Units are mg m−2 for chlorophylls and carotenoids, nmol m−2 for anthocyanins and flavonoids, and mg GAE m−2 for phenolics. The analyses were carried out on plants 50 days after transplanting.
Horticulturae 11 01077 g006
Table 1. Descriptive statistics of leaf biochemical parameters in lettuce (Lactuca sativa L.) for the complete sample set (n = 132), the calibration (training) subset (n = 106) and the validation (test) subset (n = 26). The parameters included chlorophyll a (Chla; mg m−2), chlorophyll b (Chlb; mg m−2), carotenoids (Car; mg m−2), anthocyanins (AnC; nmol m−2), flavonoids (Flv; nmol m−2) and total phenolic compounds (Phe; mg GAE m−2). For each parameter, the mean, standard deviation (SD), median, minimum, maximum and coefficient of variation (CV, %) are reported. The similarity of central-tendency measures across the calibration and test subsets confirms that both cover comparable biochemical ranges, thereby ensuring robust spectral–biochemical model development and evaluation. The analyses were carried out on plants 50 days after transplanting.
Parameters of Dataset(n)MeanSDMedianMinimumMaximumCV (%)
Chla132128.8950.49118.9563.15306.4039.18
Chlb13266.7623.4261.7539.41147.2735.09
Car13245.7016.2142.4125.56101.9235.47
Anc13213.4316.9811.460.0068.57126.53
Flv13259.5536.1249.7511.77178.2860.66
Phe132312.9552.55331.01213.70393.3016.79
Parameters
Training
(n)MeanSDMedianMinimumMaximumCV (%)
Chla106129.1852.89117.7663.14306.4040.94
Chlb10666.6424.4860.3239.40147.2636.74
Car10645.8216.9242.4125.55101.9136.92
Anc10612.7616.6311.010.0068.57130.03
Flv10657.5934.6448.2611.76178.2860.15
Phe106310.4052.90325.20213.65393.3017.05
Parameters
Test
(n)MeanSDMedianMinimumMaximumCV (%)
Chla26127.6940.14123.0867.38249.1031.43
Chlb2667.2518.9165.6541.33123.6028.11
Car2645.1613.1942.3726.5185.1829.21
Anc2616.1518.4512.890.0062.90114.22
Flv2667.5341.4058.1320.83172.5061.31
Phe26323.2050.60341.45230.45391.5515.65
Table 2. Effects of cultivar on leaf biochemical composition in Lactuca sativa L. Eleven lettuce varieties (V01–V11; n = 6 per variety) were compared for chlorophyll a (Chla; mg m−2), chlorophyll b (Chlb; mg m−2), carotenoids (Car; mg m−2), anthocyanins (AnC; nmol m−2), flavonoids (Flv; nmol m−2) and total phenolic compounds (mg GAE m−2). The analyses were carried out on plants 50 days after transplanting.
EffectsChlaChlbCarAncFlvPhe
Varietiesmg m−2mg m−2mg m−2nmol m−2nmol m−2mg GAE m−2
V01138.16±5.19c †73.35±3.16b48.81±2.10c0.00±0.00f31.73±2.30ef287.10±10.20c
V02177.29±12.01a85.10±5.56b63.62±3.89b0.00±0.00f26.75±2.22f241.65±6.50d
V03110.15±5.25d57.00±3.07cde41.84±1.81cd0.03±0.01f26.92±3.18f259.40±5.90cd
V04243.96±19.31a118.80±9.24a82.21±6.42a0.45±0.07f35.88±0.94def238.60±3.80d
V05102.39±3.47d51.82±1.43de35.29±0.97de16.01±0.35c61.71±5.65bc365.30±8.65ab
V06115.75±3.76cd57.82±1.91cd42.08±1.39cd6.71±0.47e45.38±2.11cde284.30±4.75c
V0795.15±2.19de45.64±1.02e33.78±0.44e15.86±0.94c71.06±5.25bc333.20±6.35b
V08137.46±4.38c69.55±1.94bc44.23±1.30c60.88±1.67a124.36±16.46a383.75±2.90ab
V09141.41±6.237bc79.85±4.70b49.42±1.71c22.39±0.72b119.46±4.82a347.90±2.35b
V1076.12±3.72f49.22±1.91de30.42±1.18e11.22±0.25d51.49±2.27bcd347.50±8.50b
V1179.90±2.68ef46.18±1.02e30.94±0.96e14.10±0.09cd60.32±0.65bc353.30±6.60b
p value******************
<0.001<0.001<0.001<0.001<0.001<0.001
*** significant at p ≤ 0.001. † According to Tukey’s mean test, values followed by different letters indicate a significant difference (≤0.001) among treatments.
Table 3. Performance comparison of seven machine learning models for predicting leaf biochemical parameters from Headwall hyperspectral data. For each attribute—chlorophyll a (Chla; mg m−2), chlorophyll b (Chlb; mg m−2), carotenoids (Car; mg m−2), anthocyanins (AnC; nmol m−2), flavonoids (Flv; nmol m−2) and phenolic compounds (Phe; mg GAE m−2)—the root mean square error (RMSE) and coefficient of determination (R2) are reported for both the training (calibration) and independent test sets. Akaike’s information criterion (AIC) and the Bayesian information criterion (BIC) are also used to assess model parsimony. The model with the lowest test-set RMSE and highest test-set R2 for each attribute is highlighted in blue; blue-highlighted cells indicate optimal test-set performance. Abbreviations: LR, multiple linear regression; PLS, partial least squares; Gboost, gradient boosting; RF, random forest; NN, neural network; SVM, support vector machine; Cubist, rule-based regression. The analyses were carried out on plants 50 days after transplanting.
RMSER2
AttributeModelTrainTestTrainTestAICBIC
Chla (mg m−2)LR34.5827.220.570.52975.361263.64
PLS32.9826.710.610.54774.75789.16
Gboost39.3041.280.440.001002.181031.00
RF37.6627.650.490.51792.22806.63
NN34.4628.090.570.49801.66816.08
SVM50.9337.500.060.09954.37968.79
Cubist18.5046.440.850.32972.36986.78
Chlb (mg m−2)LR17.3613.040.490.51783.791072.07
PLS16.6312.640.530.54593.79608.21
Gboost19.0216.870.390.17731.35745.76
RF18.7013.460.410.47612.52626.94
NN17.1115.360.510.31682.21696.62
SVM22.9516.930.110.16733.86748.27
Cubist12.9116.310.660.33694.16708.58
Car (mg m−2)LR10.678.400.600.58547.34691.48
PLS10.258.260.630.60446.46460.88
Gboost12.6812.050.430.13648.73663.14
RF12.038.330.490.59451.95466.37
NN10.539.660.610.44532.21546.63
SVM14.7311.130.230.26606.40620.82
Cubist7.219.420.770.43527.90542.32
Anc (nmol m−2)LR12.4413.010.430.48691.03835.17
PLS11.079.350.550.73427.31441.72
Gboost6.937.970.820.81338.76353.17
RF4.445.340.930.91134.41148.82
NN10.8610.100.570.69465.91480.33
SVM11.6912.930.500.49596.83611.25
Cubist3.1411.270.960.63518.20532.61
Flv (nmol m−2)LR24.2828.050.500.52883.291027.43
PLS24.8227.340.480.55778.01792.41
Gboost28.2726.100.330.59753.46767.87
RF24.3420.110.500.76613.94628.35
NN27.0527.940.380.53789.47803.88
SVM29.6335.690.260.23919.26933.68
Cubist14.8724.720.800.49767.92782.34
Phe (mg GAE m−2)LR26.2022.050.750.80279.29423.43
PLS25.3023.250.770.79209.72224.14
Gboost28.7032.400.700.57391.93406.35
RF25.4028.900.770.66330.76345.17
NN28.9529.800.700.64346.40360.81
SVM35.6529.850.540.64346.84361.25
Cubist24.3529.100.820.76286.60301.01
Table 4. Performance comparison of seven machine learning models for predicting leaf biochemical parameters from MicaSense multispectral data. Each attribute is reported for both the training (calibration) and independent test sets. Akaike’s information criterion (AIC) and the Bayesian information criterion (BIC) are also shown. The best-performing model for each attribute—identified by the lowest test-set RMSE and highest test-set R2—is highlighted in blue; blue-highlighted cells denote optimum test-set performance. Abbreviations as in Table 3. The analyses were carried out on plants 50 days after transplanting.
RMSER2
AttributesModelTrainTestTrainTestAICBIC
Chla (mg m−2)LR37.5830.500.490.40844.85859.26
PLS37.5530.260.490.41836.54845.19
Gboost40.2533.140.410.29884.98893.63
RF39.3930.750.440.39845.18853.83
NN37.8031.360.480.37854.63863.28
SVM48.6837.420.140.09949.81958.46
Cubist29.0735.130.550.25911.61926.03
Chlb (mg m−2)LR18.5514.490.420.39646.54655.19
PLS18.5614.390.420.39644.71653.36
Gboost22.0718.280.180.03773.11787.52
RF19.6714.480.350.39650.36664.77
NN18.6614.990.410.35667.88682.29
SVM22.5816.760.140.18728.01742.43
Cubist14.4115.920.430.31666.44680.85
Car (mg m−2)LR11.649.360.520.48514.10528.51
PLS11.659.290.520.48508.12516.77
Gboost13.7310.120.330.39551.78560.43
RF12.448.930.450.52487.12495.77
NN11.689.710.520.44529.57538.22
SVM13.7410.700.330.31582.76591.41
Cubist8.6111.220.600.42576.36590.78
Anc (nmol m−2)LR11.4711.380.520.60531.06545.47
PLS12.4012.630.440.51581.36590.01
Gboost9.0114.510.700.36653.24661.89
RF8.4413.690.740.43622.60631.24
NN10.268.980.620.75402.49411.13
SVM11.7113.540.500.44617.35626.00
Cubist2.879.240.970.66454.61469.02
Flv (nmol m−2)LR24.8628.720.480.50804.90819.32
PLS25.6729.640.450.47816.92825.57
Gboost31.2127.200.180.55772.64781.29
RF26.6926.580.400.57760.55769.20
NN23.9726.950.520.56767.24775.89
SVM27.8534.190.350.29893.22901.87
Cubist19.5729.550.640.41769.06783.48
Phe (mg GAE m−2)LR28.2525.400.710.74261.26275.68
PLS28.5025.600.710.73264.32272.96
Gboost30.8531.250.660.60368.85377.49
RF29.8032.350.680.57387.53396.17
NN28.1025.100.720.74254.13262.78
SVM31.8026.350.630.72276.74285.39
Cubist24.1031.000.820.62363.95378.37
Disclaimer/Publisher’s Note: The statements, opinions and data contained in all publications are solely those of the individual author(s) and contributor(s) and not of MDPI and/or the editor(s). MDPI and/or the editor(s) disclaim responsibility for any injury to people or property resulting from any ideas, methods, instructions or products referred to in the content.