Article

Organ-Specific Physiological and Metabolic Differentiation in Celery (Apium graveolens L.) to Supplemental Blue Light in Controlled Environment Agriculture

1
College of Intelligent Science and Engineering, Beijing University of Agriculture, Beijing 102206, China
2
College of Horticulture, Qingdao Agricultural University, Qingdao 266109, China
3
College of Agricultural Engineering, Jiangsu University, Zhenjiang 212013, China
4
Key Laboratory of Agricultural Engineering in Structure and Environment of MARA, College of Water Resources & Civil Engineering, China Agricultural University, Beijing 100083, China
5
Center for Environment, Health and Field Sciences, Chiba University, Kashiwa 277-0882, Japan
6
Qingdao Macaco Ecological Agriculture Co., Ltd., Qingdao 266700, China
*
Author to whom correspondence should be addressed.
These authors contributed equally to this work.
Horticulturae 2025, 11(9), 1074; https://doi.org/10.3390/horticulturae11091074
Submission received: 2 August 2025 / Revised: 3 September 2025 / Accepted: 4 September 2025 / Published: 5 September 2025
(This article belongs to the Section Protected Culture)

Abstract

Optimizing spectral quality is a key strategy in controlled environment agriculture (CEA) to enhance both productivity and nutritional quality in horticultural crops. In this study, we investigated the organ-specific physiological and metabolic responses of celery (Apium graveolens L. cv. Dayehuang) to supplemental blue light at three intensities (10, 20, and 30 μmol·m−2·s−1 with red/blue light ratios of 0.76, 0.68, and 0.60, respectively) in a plant factory with artificial lighting. Results showed that a moderate red/blue light ratio of 0.68 significantly enhanced chlorophyll accumulation, PSII quantum efficiency, and net photosynthetic rate, resulting in the highest shoot biomass without inducing photoinhibition. Leaf tissues showed marked increases in flavonoids and total phenolics, while petioles exhibited elevated soluble sugar levels and favorable modulation of volatile compound profiles. Antioxidant enzyme activities, particularly superoxide dismutase and peroxidase, were also enhanced with a moderate red/blue light ratio of 0.68, contributing to improved oxidative stress defense. Composite indices, including functional yield index and antioxidant performance index, confirmed that a moderate red/blue light ratio of 0.68 achieved the optimal trade-off between biomass production and nutritional enhancement. These findings reveal distinct organ-specific responses to supplemental blue light and underscore the value of spectral fine-tuning to simultaneously promote both source (leaf) and sink (petiole) performance in celery grown under CEA systems.

1. Introduction

The spectral optimization of light environments using light-emitting diodes (LEDs) has emerged as a pivotal strategy in controlled environment agriculture (CEA), particularly in plant factory with artificial lighting (PFAL) [1,2,3,4]. Beyond providing the energy source for photosynthesis, light functions as a vital environmental signal that regulates plant morphogenesis, metabolic pathways, and source-sink allocation [5,6,7,8]. Compared with conventional broad-spectrum lighting, precise LED spectral tuning can reduce energy consumption by 15–30% [2], while simultaneously enhancing crop-specific quality attributes such as phytochemical accumulation, pigmentation, and visual appeal. Among spectral regions within the photosynthetically active radiation (PAR, 400–700 nm), blue light (400–500 nm) has drawn special attention due to its dual role in controlling photomorphogenesis via cryptochrome (CRY) and phototropin (PHOT) signaling pathways, and in promoting the accumulation of phytochemicals such as total phenolics, flavonoids, vitamin C, and anthocyanins [9,10,11,12].
In recent years, studies in leafy vegetables such as lettuce (Lactuca sativa), spinach (Spinacia oleracea), and kale (Brassica oleracea) have shown that blue light supplementation can enhance biomass, nutritional quality, and pigmentation when appropriately timed and dosed [13,14,15]. For instance, end-of-production blue light at moderate intensities (67.5 µmol·m−2·s−1 for 16 h or 135 µmol·m−2·s−1 for 8 h) significantly increased anthocyanin accumulation in red leaf lettuce, boosting pigment indices by up to 180% compared to controls [15]. Furthermore, the application of short-wavelength blue LEDs (400–420 nm) led to increased soluble sucrose and dry matter percentage in kale microgreens, despite a reduction in fresh weight, suggesting potential benefits for flavor and texture [13]. In addition to its influence on pigment and biomass accumulation, blue light has been shown to regulate phenylpropanoid metabolism in a tissue-specific manner. Kim et al. (2015) demonstrated that blue light significantly increased the accumulation of total phenolics and flavonoids in the leaves and flowers of Chinese cabbage (Brassica rapa ssp. pekinensis) grown under controlled conditions, whereas roots and stems exhibited only minor responses [16].
In most horticultural crops, organs vary substantially in function and developmental fate, photosynthetic leaves acting as sources, and storage organs (e.g., petioles, roots) as sinks. These organs can exhibit distinct metabolic and physiological responses to light, reflecting differences in photoreceptor distribution, gene expression, and metabolic demand. Yet, little attention has been paid to organ-specific regulation under varying light spectra, a gap that is particularly critical in crops like celery (Apium graveolens L.), where both leaves and petioles contribute to overall nutritional and commercial value. Celery is a globally cultivated functional vegetable, valued for its crisp petioles, rich in flavonoids, vitamin C, and apigenin [17,18,19]. While several studies have evaluated the effects of light intensity and spectrum on celery growth and quality traits [18,20], the specific role of blue light intensity and its impact on tissue-level differentiation—especially between leaves and petioles—remains unclear. Given that blue light can influence both source (e.g., photosynthesis in leaves) and sink (e.g., assimilate partitioning in petioles) processes [16], understanding the tissue-specific dynamics is essential for developing precise spectral strategies that optimize both yield and quality of celery in PFAL systems.
Based on previous evidence that supplemental blue light regulates both photomorphogenesis and secondary metabolism in a tissue-dependent manner, we hypothesized that supplemental blue light would differentially modulate physiological performance and metabolite allocation between source (leaves) and sink (petioles) organs of celery. Specifically, we expected that moderate intensities of blue light would enhance photosynthetic efficiency and antioxidant metabolism in leaves, while simultaneously promoting assimilate accumulation in petioles. In addition to conventional assessments of biomass and phytochemical contents, the evaluation of volatile organic compounds (VOCs) is particularly important in celery, as aroma significantly contributes to consumer preference and market value. However, VOC profiling using gas chromatography–mass spectrometry is often time-consuming, labor-intensive, and requires complex sample preparation [21]. As a complementary approach, electronic nose (E-nose) technology provides a rapid, non-destructive, and sensor-based tool for detecting overall VOC patterns, which has been successfully applied in leafy vegetables and other horticultural crops to differentiate flavor profiles and assess quality changes under varying cultivation conditions [21,22,23]. Therefore, E-nose was used in this study to allow us to capture spectral regulation of celery aroma traits in a high-throughput manner, providing additional insight into organ-specific quality differentiation beyond primary and secondary metabolites. Overall, the objective of this study was to systematically investigate the organ-specific physiological, biochemical, and volatile responses of celery to three levels of supplemental blue light in PFAL, and to identify an optimal spectral strategy that balances biomass production with nutritional and sensory quality.

2. Materials and Methods

2.1. Plant Materials and Experimental Design

The experiment was conducted in a walk-in PFAL with multi-layer vertical cultivation systems. Celery (Apium graveolens L. cv. Dayehuang) seedlings with five fully expanded true leaves were uniformly selected and transplanted into 1.1 L plastic pots (13.5 cm in diameter, 11 cm in depth). The pots were filled with mixed peat (The Pindstrup Group, Kongersle, Denmark), vermiculite (Shandong Lige Technology Co., Ltd., Jinan, China), and perlite (Shandong Lige Technology Co., Ltd., Jinan, China) (3:1:1, v/v/v). After transplanting, celery plants were implemented with four lighting treatments for 40 days before harvest. During the experiment, the air temperature in the PFAL was maintained at 25 ± 1 °C/18 ± 1 °C (day/night), with a relative humidity of 60–70%. Plants were irrigated with Hoagland nutrient solution every two days.
The control treatment consisted of white plus red LEDs (Zhongshan Aier Lighting Technology Co., Ltd., Zhongshan, China), providing a photosynthetic photon flux density (PPFD) of 200 μmol·m−2·s−1 and a photoperiod of 12 h·d−1. Supplementary blue LEDs (peak at 455 nm) were added to the control treatment at intensities of 10, 20, and 30 μmol·m−2·s−1, designated as B10, B20, and B30, respectively. The spectral properties and spectral distribution of each treatment (Figure 1) was measured with a spectrometer (PG100N, United Power Research Technology Corporation, Miaoli, China) at the plant canopy. Each treatment was arranged in three blocks, with 40 celery plants per block. At harvest, three uniform plants were randomly selected from each block for measurements.

2.2. Measurements and Methods

2.2.1. Plant Morphology and Biomass Measurements

Plant height, maximum petiole length and maximum petiole width were measured with a ruler and micrometer caliper, the shoot and root fresh weights of celery plants were measured at harvest by an electronic analytical balance (JY20002, Shanghai Hengping Instrument Co., Ltd., Shanghai, China). The samples were dried in an oven at 105 °C for 3 h to inactivate enzymes, followed by drying at 80 °C for another 72 h, and then the shoot and root dry weight was recorded.

2.2.2. Chlorophyll Content, Photosynthetic Characteristics, and Chlorophyll Fluorescence

The chlorophyll a, chlorophyll b, and carotenoids contents of celery were determined spectrophotometrically according to the method reported by Lichtenthaler & Wellburn (1983) [24], and results were expressed as mg·g−1 fresh weight. Total chlorophyll content was also calculated.
The photosynthetic characteristics and light response curve of celery leaves were measured using a portable photosynthesis system (Li-6800, LI-COR Co., Lincoln, NE, USA). For photosynthetic characteristics measurement, the PPFD inside the leaf chamber was set at 200 μmol·m−2·s−1, with leaf temperature, gas flow rate, and CO2 concentration maintained at 25 °C, 500 μmol·s−1, and 400 μmol·mol−1, respectively. For light response curve measurement, the PPFD inside the leaf chamber was set in eight steps: 2000, 1500, 1000, 500, 200, 100, 50, and 0 μmol·m−2·s−1. Leaf temperature, gas flow rate, and CO2 concentration in the chamber were maintained at 25 °C, 500 μmol·s−1, and 400 μmol·mol−1, respectively. The maximum net photosynthetic rate (Pn max) was calculated using a mechanistic model developed by Ye et al. (2013) [25].
Chlorophyll fluorescence is commonly used as a probe to provide precise and objective information for plant photosynthesis [26,27]. Chlorophyll fluorescence of celery leaves was measured using a Dual-PAM-100 system (Walz, Effeltrich, Germany). Prior to measurement, fully expanded leaves were dark-adapted for 30 min using a leaf clip to ensure reliable baseline fluorescence values. A weak modulated measuring light (620 nm LED) and actinic blue light at 250 μmol·m−2·s−1 (460 nm) were directed onto the adaxial leaf surface via the DUAL-DR measuring head. Saturating pulses (300 ms, 10,000 μmol·m−2·s−1) of 620 nm light were applied simultaneously to both sides of the leaf using the DUAL-DR and DUAL-E emitter units. The redox state of PSI was monitored by changes in absorbance at 830 nm, using sample (830 nm) and reference (875 nm) beams from the DUAL-E emitter, transmitted through the leaf and detected by a photodiode in the DUAL-DR head. A DUAL-B leaf holder was employed to align the DUAL-DR and DUAL-E units, with Perspex light guides ensuring accurate illumination and detection. To visualize the effects of supplementary blue light on fluorescence transients, the value of relative variable fluorescence, Vt = (Ft − F0)/(Fm − F0), was calculated. In addition, the changes in relative variable fluorescence (ΔVt) were obtained by subtracting the values recorded under blue-light treatments from those measured in the control plants.

2.2.3. Biochemical Quality Parameters

The vitamin C (ascorbic acid) content of celery was determined using the 2,6-dichlorophenolindophenol (DCPIP) titration method [28], while soluble sugar content was measured by the anthronesulfuric acid colorimetry method [29].
Total phenolic and flavonoid contents were analyzed following standard colorimetric procedures with slight modifications [30,31]. Approximately 0.5 g of fresh sample was homogenized in 5 mL of pre-chilled 1% HCl-methanol solution and extracted thoroughly. The homogenate was centrifuged at 6000× g for 20 min at 4 °C and then stored at 4 °C for 24 h. The supernatant was used for subsequent spectrophotometric analysis. The absorbance for total phenolics was measured at 280 nm, and values were calculated based on a standard curve constructed using gallic acid. Total phenolic content was expressed as micrograms of gallic acid equivalents per gram of fresh weight (μg GAE·g−1 FW). Flavonoid content was determined by measuring the absorbance at 325 nm and expressed as absorbance per gram of fresh weight.
To evaluate the overall nutritional value per unit of biomass, an index of functional yield index (FYI) was used and calculated as below: For each plant, the absolute amount of vitamin C, soluble sugar content (SSC), and total phenolics was estimated by multiplying the measured concentration (mg·g−1 FW for VC and phenolics; % for SSC) by the petiole FW. The resulting total values (in mg) were then standardized using Z-score transformation across all samples. The normalized functional yield index (FYInorm) was calculated as function (1).
FYInorm = (ZVC_total + ZSSC_total + ZPhenolics_total)/PetioleDW

2.2.4. Antioxidant Enzyme Activities

The activities of three antioxidant enzymes, including superoxide dismutase (SOD), peroxidase (POD), and catalase (CAT), were determined using commercial assay kits (Solarbio Life Sciences, Beijing, China) [32,33].
To evaluate the overall antioxidant enzyme capacity of petioles and leaves, respectively, the antioxidant performance index (API) was calculated as the sum of standardized Z-scores of SOD, POD, and CAT activities [34]. As a dimensionless index, API enables the integrated comparison of antioxidant enzyme activity across treatments and organs, which was calculated as function (2).
APInorm = ZSOD + ZPOD + ZCAT

2.2.5. Volatile Compound Profiling via Electronic Nose

Volatile compounds of celery were analyzed using a portable electronic nose (E-Nose PEN 3, Airsense Analytics GmbH, Schwerin, Germany), which is equipped with an array of 10 metal oxide sensors, each targeting specific classes of volatile compounds, including aromatics, amines, alkanes, sulfides, and alcohols (Table 1). For sampling, approximately 2 g of fresh celery tissue was placed in a 100 mL sealed headspace vial covered with plastic wrap. To enhance reproducibility and comparability, all samples were equilibrated at room temperature (23 ± 3 °C) for 30 min before measurement. The headspace gas was detected by E-nose [21,22,23]. Flush time of 60 s to eliminate residual gas interference, a pre-sampling time of 5 s, and a measurement time of 60 s were used. The chamber flow and initial injection flow were both set to 300 mL·min−1. Ambient air filtered by activated carbon was used as the carrier gas. Sensor responses were expressed as the ratio G/G0, where G is the conductivity of the sensor in the presence of sample gas and G0 is the conductivity in clean air. These data were subsequently analyzed by comparing sensor responses across treatments and organs, highlighting the contribution of supplemental blue light to volatile differentiation [23].

2.3. Statistical Analysis

Each treatment included three independent blocks with 40 plants per block, and three uniform plants from each block were used for physiological and biochemical analyses. All data were subjected to one-way analysis of variance (ANOVA) using SPSS software (v.26.0, IBM, Armonk, NY, USA). Differences among treatments were assessed using Tukey’s honestly significant difference (HSD) test at p < 0.05. Data are presented as means ± standard deviation. The data were standardized, and the principal component analysis were performed using SPSS 26.0 followed the method described by Wang et al. (2023) [35]. Graphs were plotted using Excel and OriginPro 2024 (OriginLab, Northampton, MA, USA).

3. Results

3.1. Morphological Traits and Biomass Accumulation Under Supplemental Blue Light

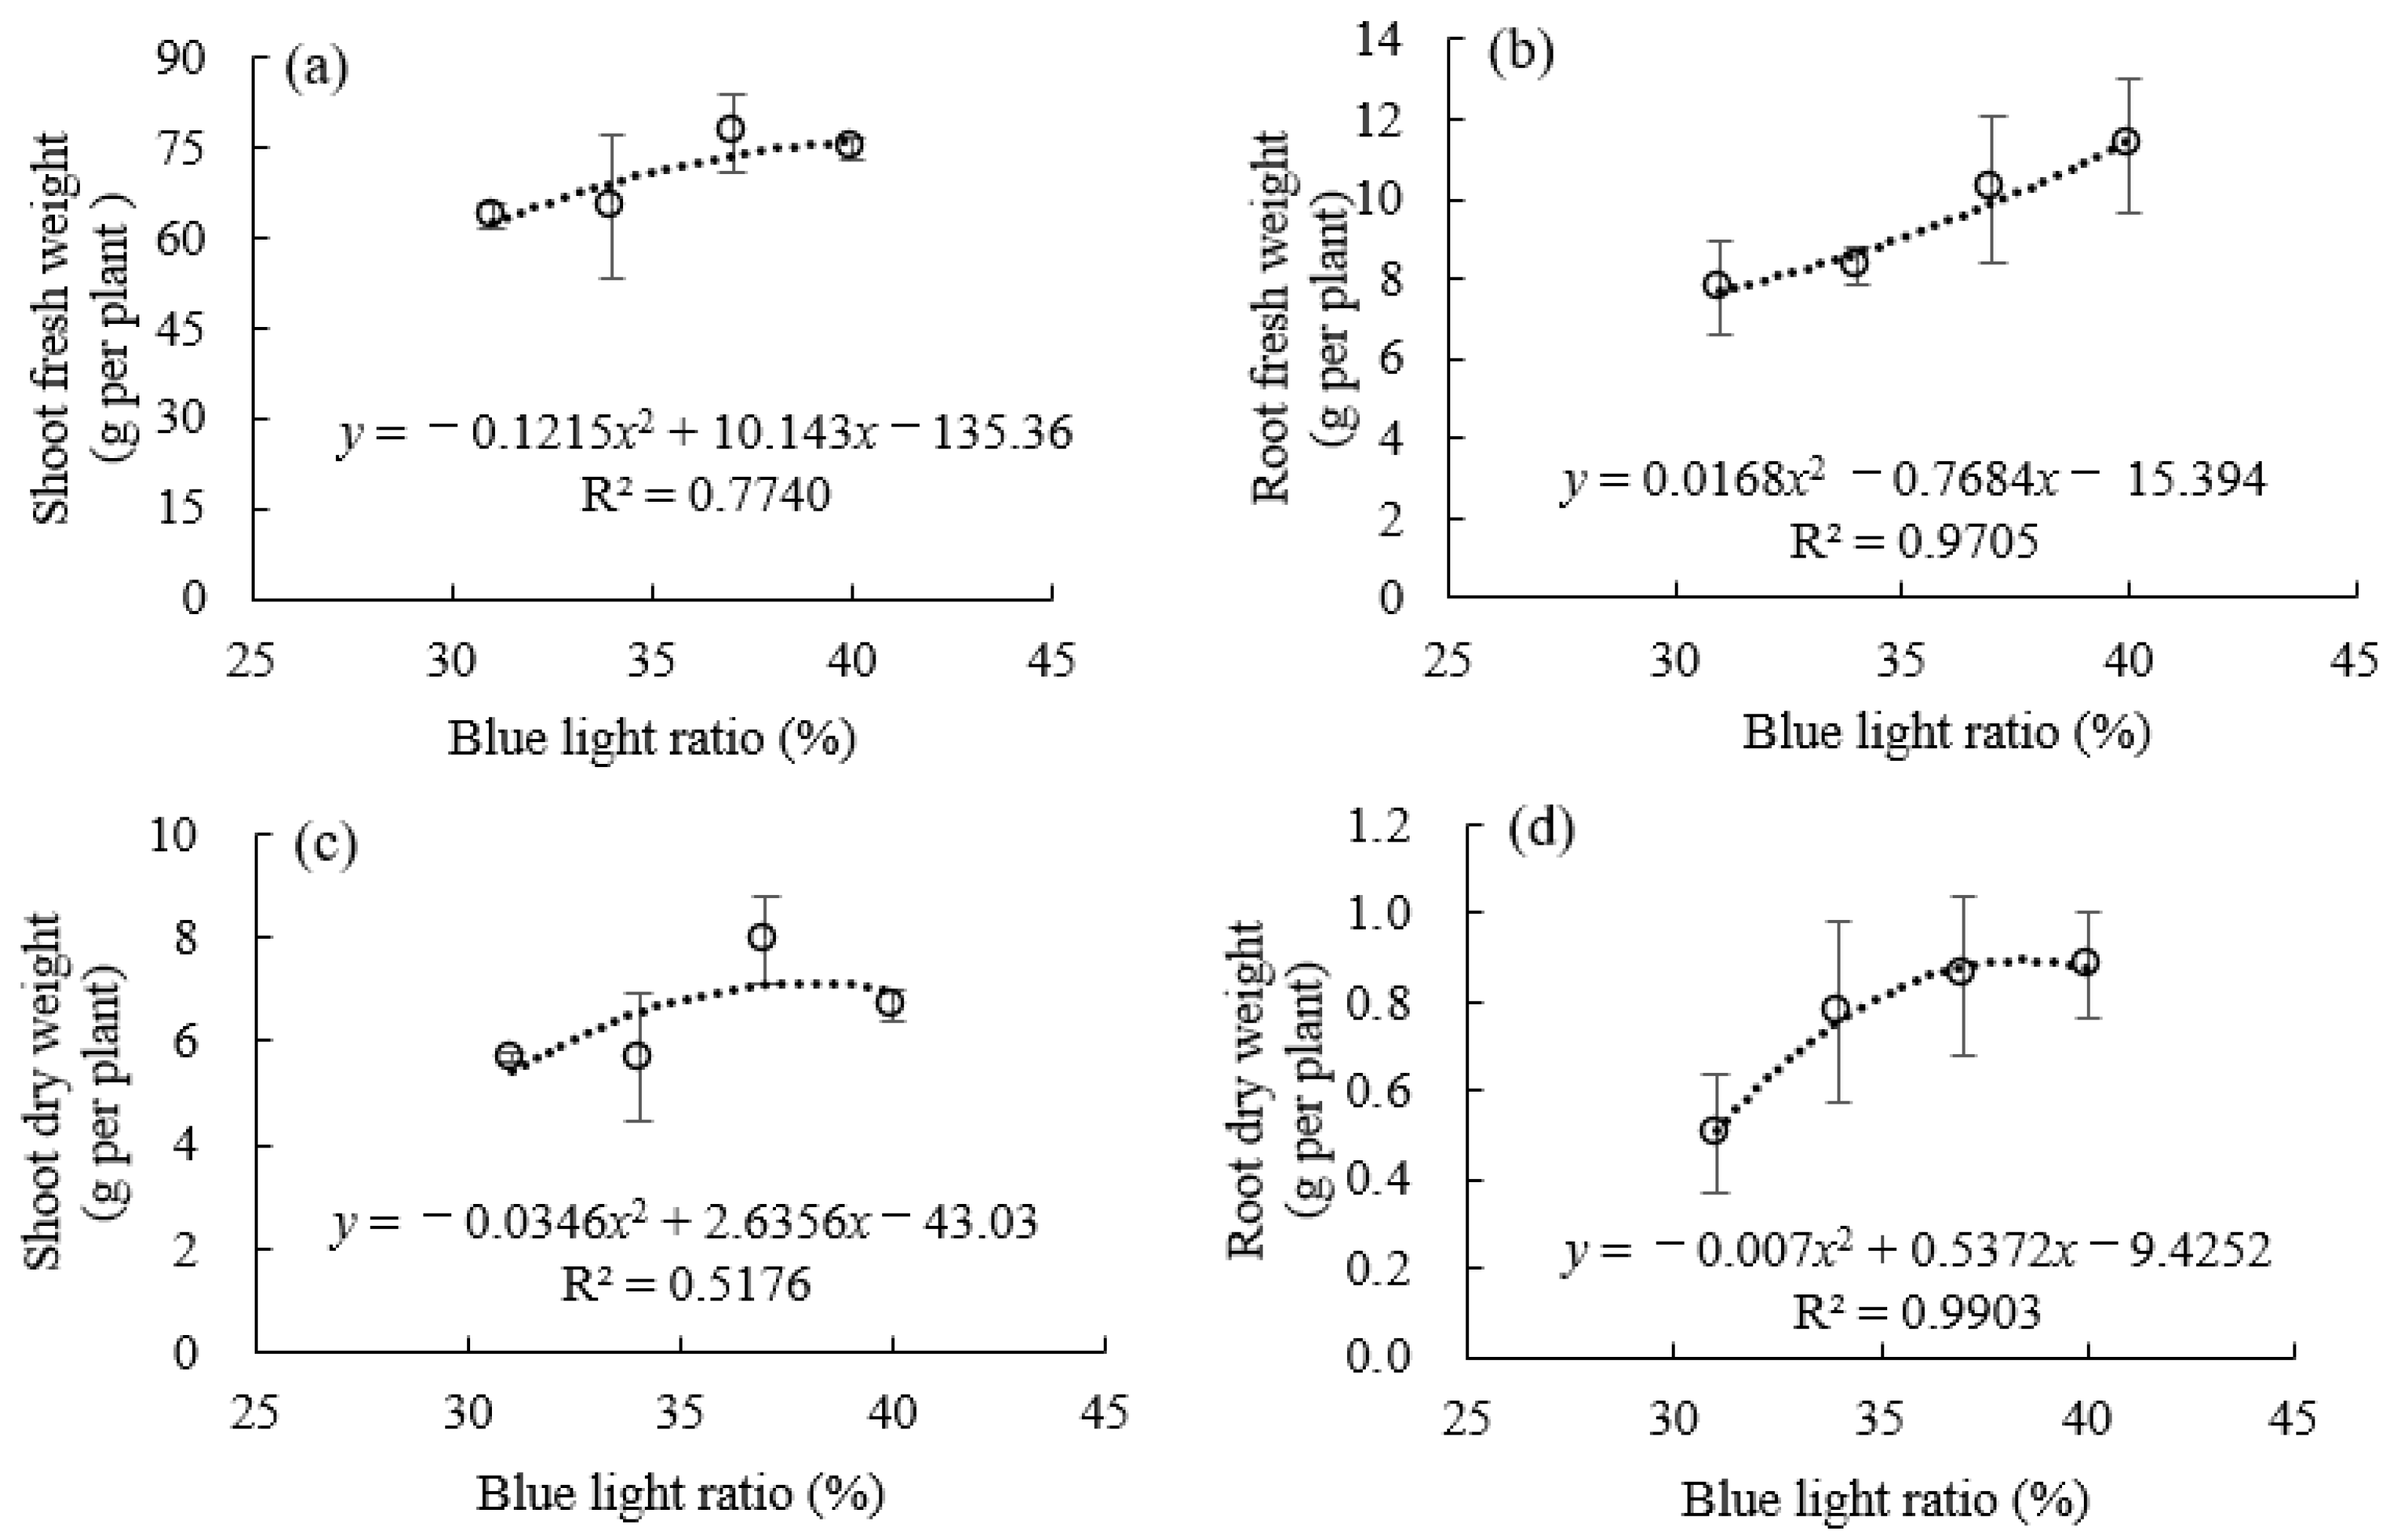
Blue light supplementation significantly influenced the growth and biomass accumulation of celery plants. The maximum petiole width showed a strong quadratic response to increasing blue light ratios with R2 = 0.9804. In contrast, the quadratic relationships between the blue light ratio and both plant height and maximum petiole length were less pronounced (the R2 value was 0.3628 and 0.2226, respectively) (Figure 2). Shoot and root biomass exhibited distinct quadratic responses to increasing blue light ratios. Shoot and root biomass increased initially and reached the highest value at approximately 37% blue light, after which it slightly declined, except for root fresh weight (Figure 3).

3.2. Photosynthetic Characteristics, Chlorophyll Content, and Chlorophyll Fluorescence Under Supplemental Blue Light

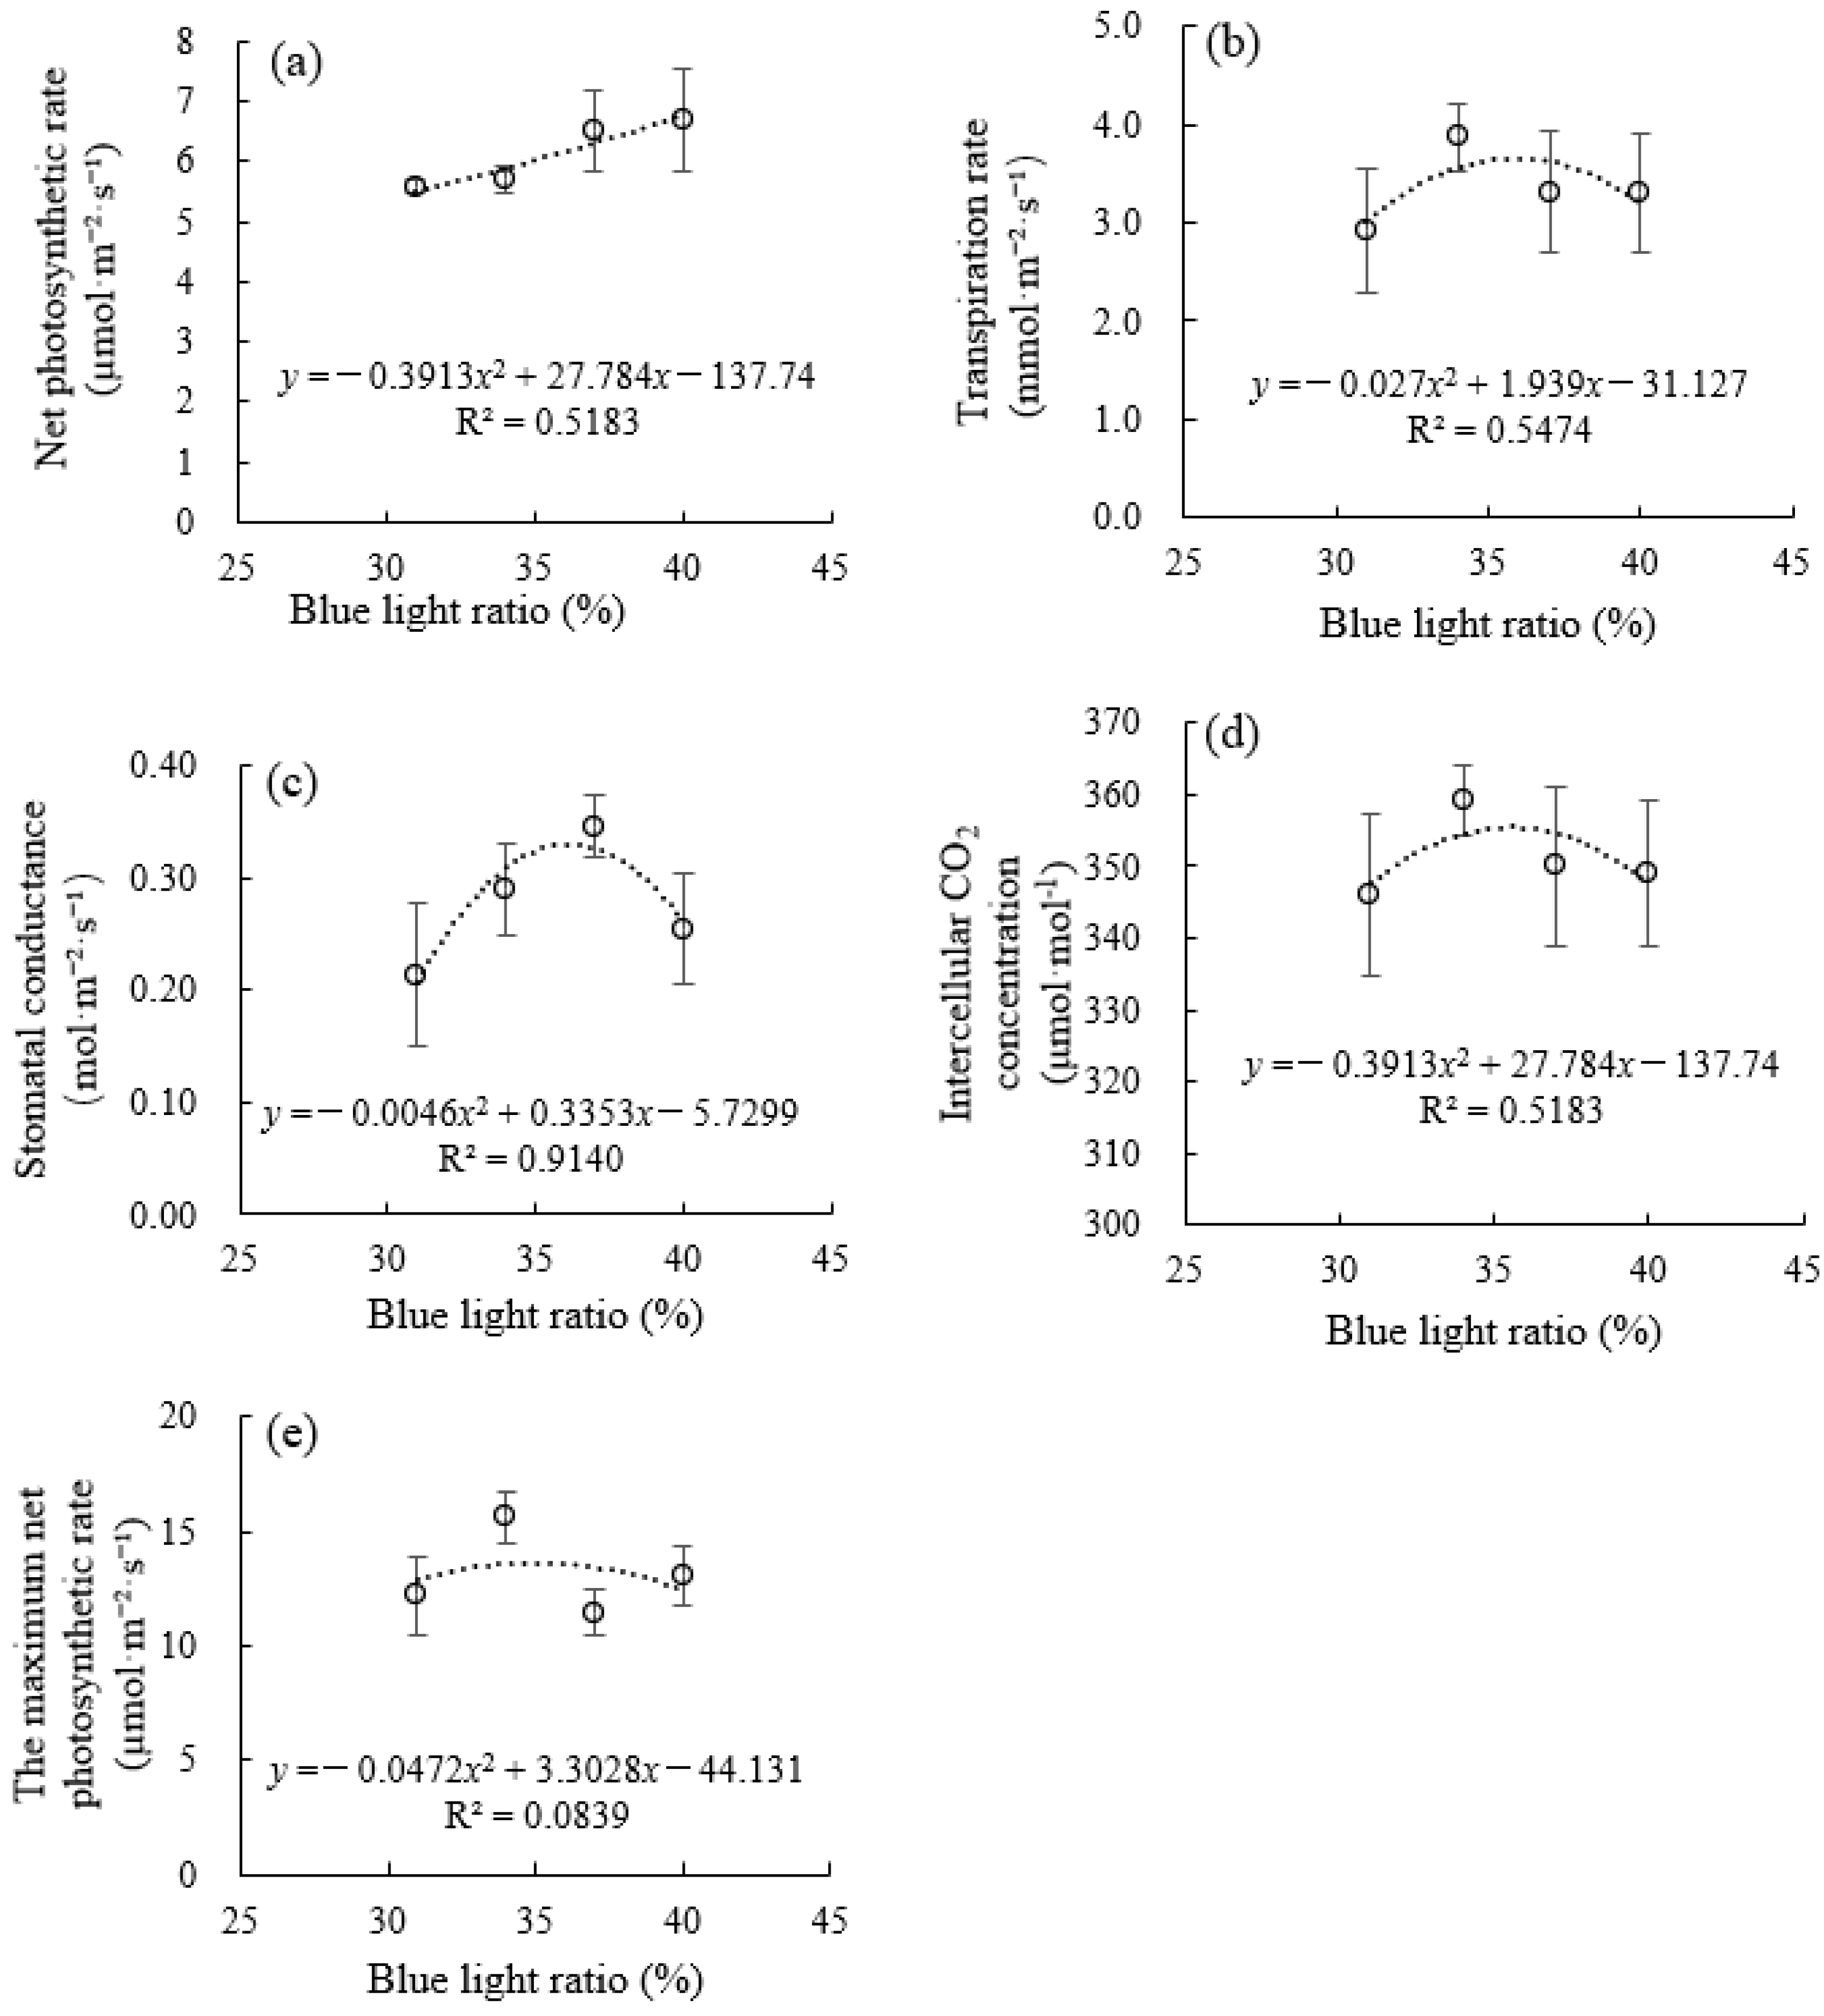
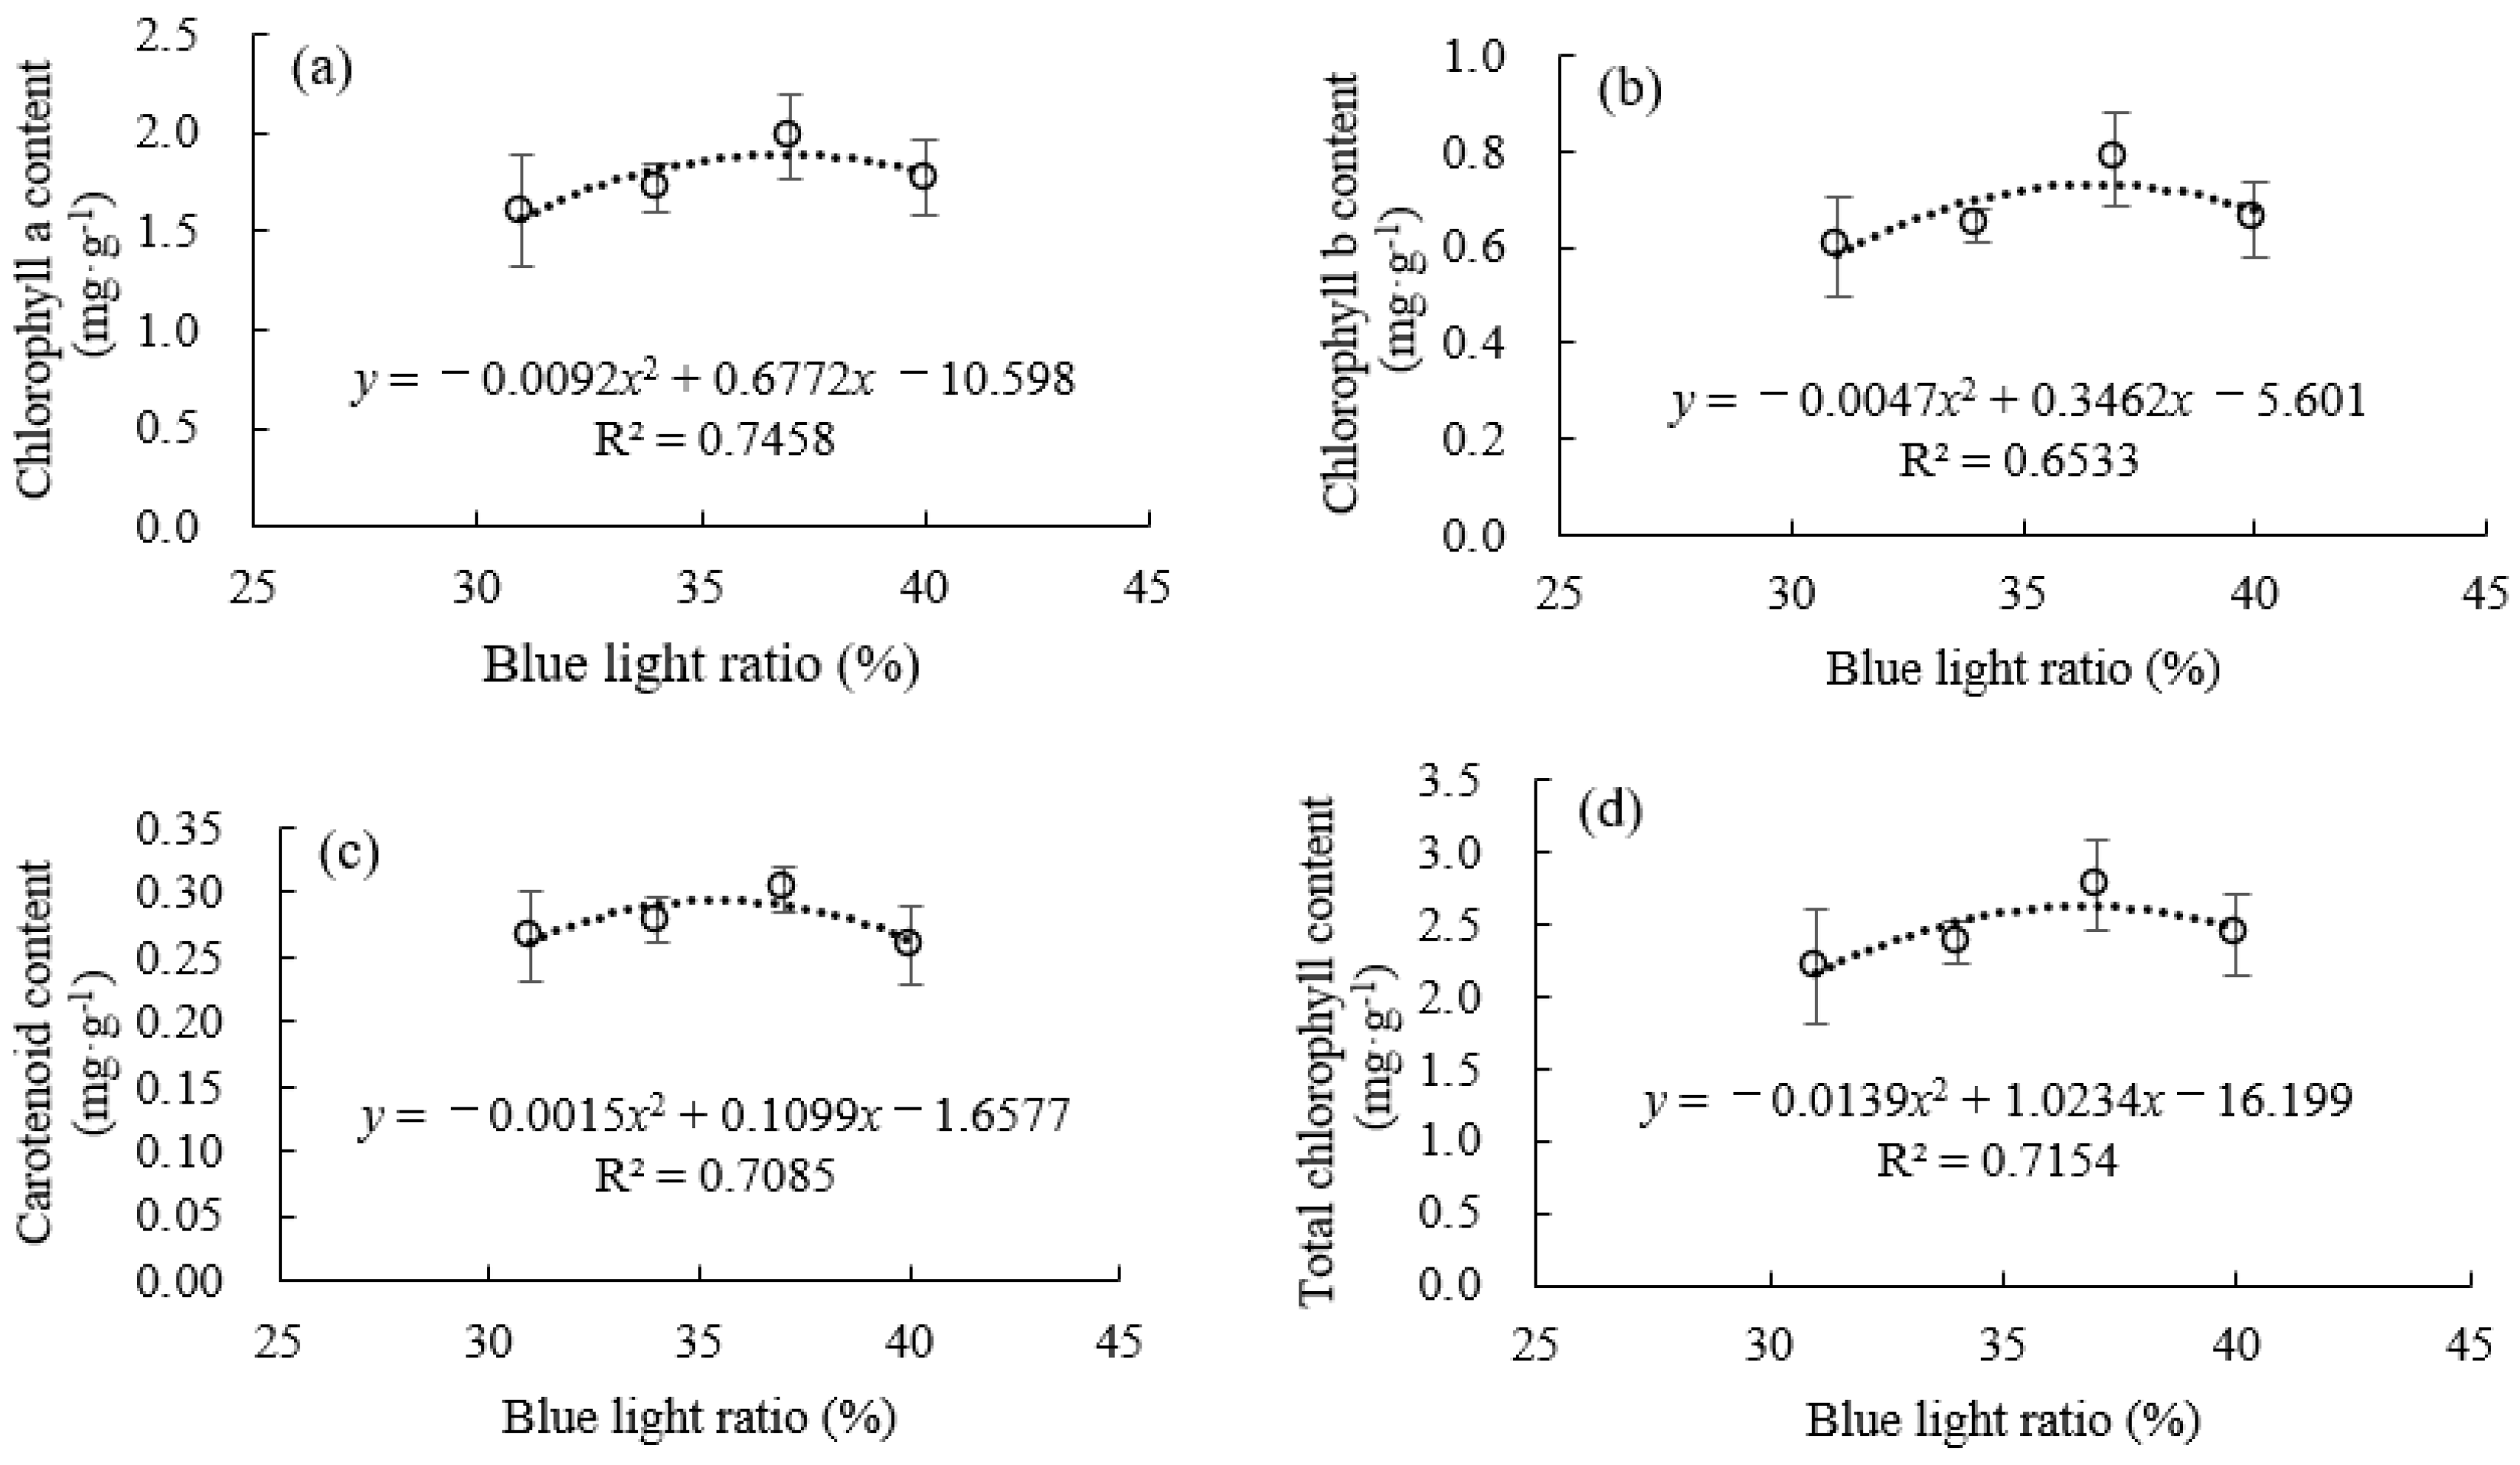
Supplementary blue light treatments significantly influenced photosynthetic performance and gas exchange parameters in celery leaves (Figure 4). The Pn of celery leaves increased with increasing blue light ratios from 31% to 40%, while the Pn max was significantly elevated only in B10 treatment. The transpiration rate, intercellular CO2 concentration (Ci), and stomatal conductance (Gs) of celery leaves was quadratically related to the blue light ratios, which was the highest around ~35% blue light ratio, and decreased at higher blue light ratio. Photosynthetic pigment contents, including chlorophyll a, chlorophyll b, carotenoids, and total chlorophyll content all increased as the blue light ratio rose to ~37% (B20), and declined at higher levels (40%, B30). The quadratic regression models explained 65–75% of the variation (Figure 5).
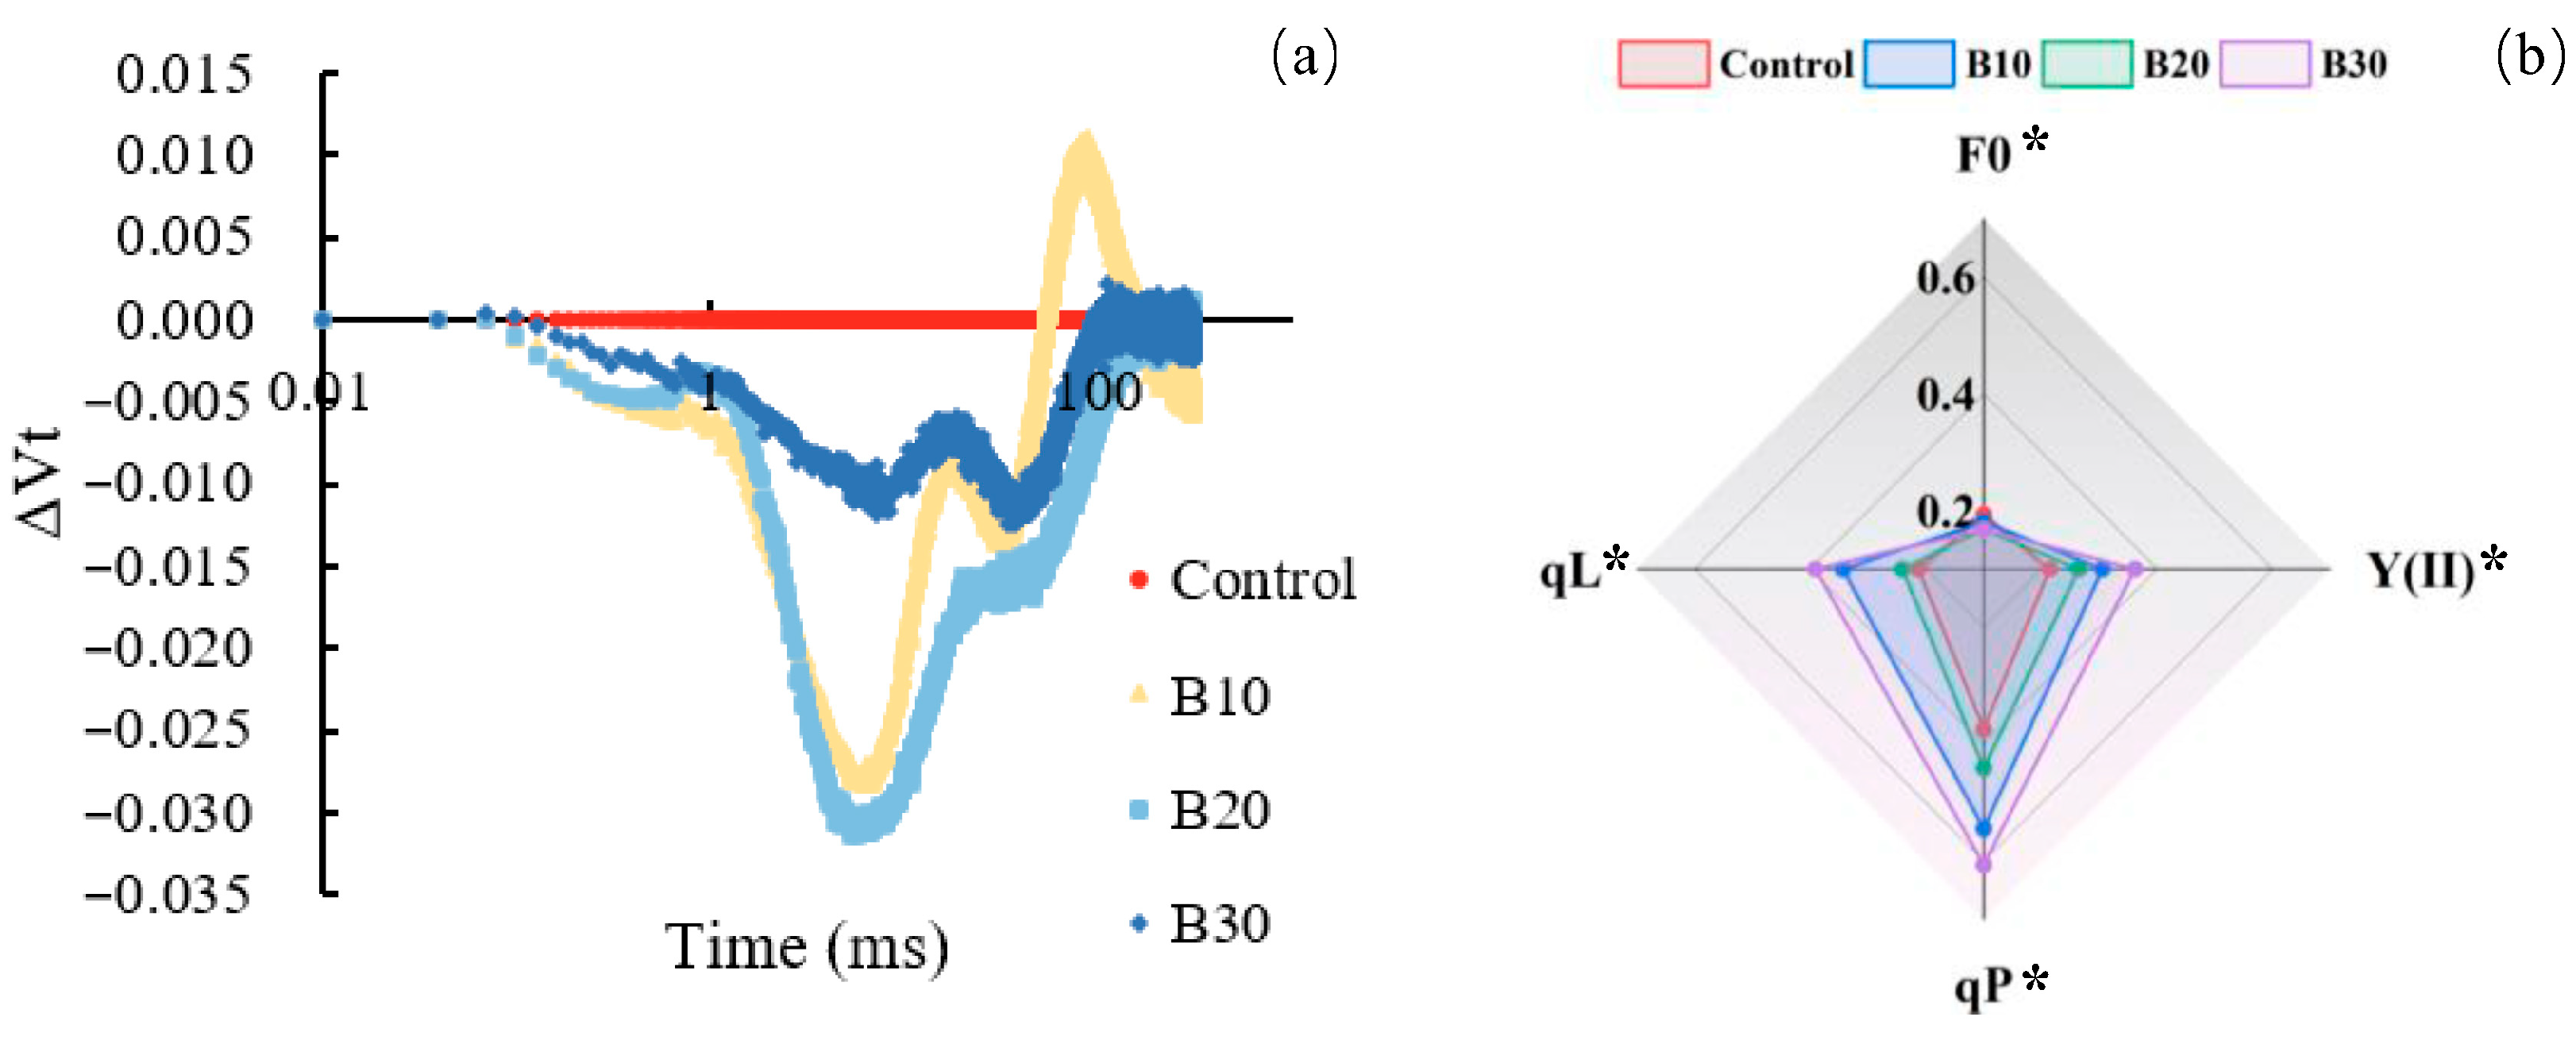
Supplementary blue light markedly enhanced the amplitude of relative variable fluorescence (ΔVt) in celery leaves compared to the Control group, particularly at the J and I steps (Figure 6a). Among all treatments, B20 exhibited the most pronounced ΔVt decline at both the J and I steps. At the J step, B10 and B20 displayed similar increases in ΔVt amplitude, whereas B30 showed an intermediate response between the Control and the B10/B20 treatments. During the I-P phase, B10 induced a notable increase in ΔVt, while B20 and B30 showed relatively flat recovery trends, suggesting differences in the reoxidation kinetics of photosystem II (PSII) acceptors under varying blue light intensities.
Treatment B30 exhibited the lowest F0 value, significantly lower than the Control, indicating reduced basal fluorescence. Treatments B10 and B20 showed intermediate values with no significant difference from either Control or B30 (Figure 6b). The actual quantum yield of PSII [Y(II)] increased markedly under blue light treatments, with the highest value observed in the B30 group, approximately 68.4% higher than the Control. This enhancement was accompanied by increased photochemical quenching (qP) and quantum yield of open PSII reaction centers (qL). Other chlorophyll fluorescence parameters showed no significant differences among treatments (Table S1).

3.3. Organ-Specific Nutritional Traits Under Supplemental Blue Light

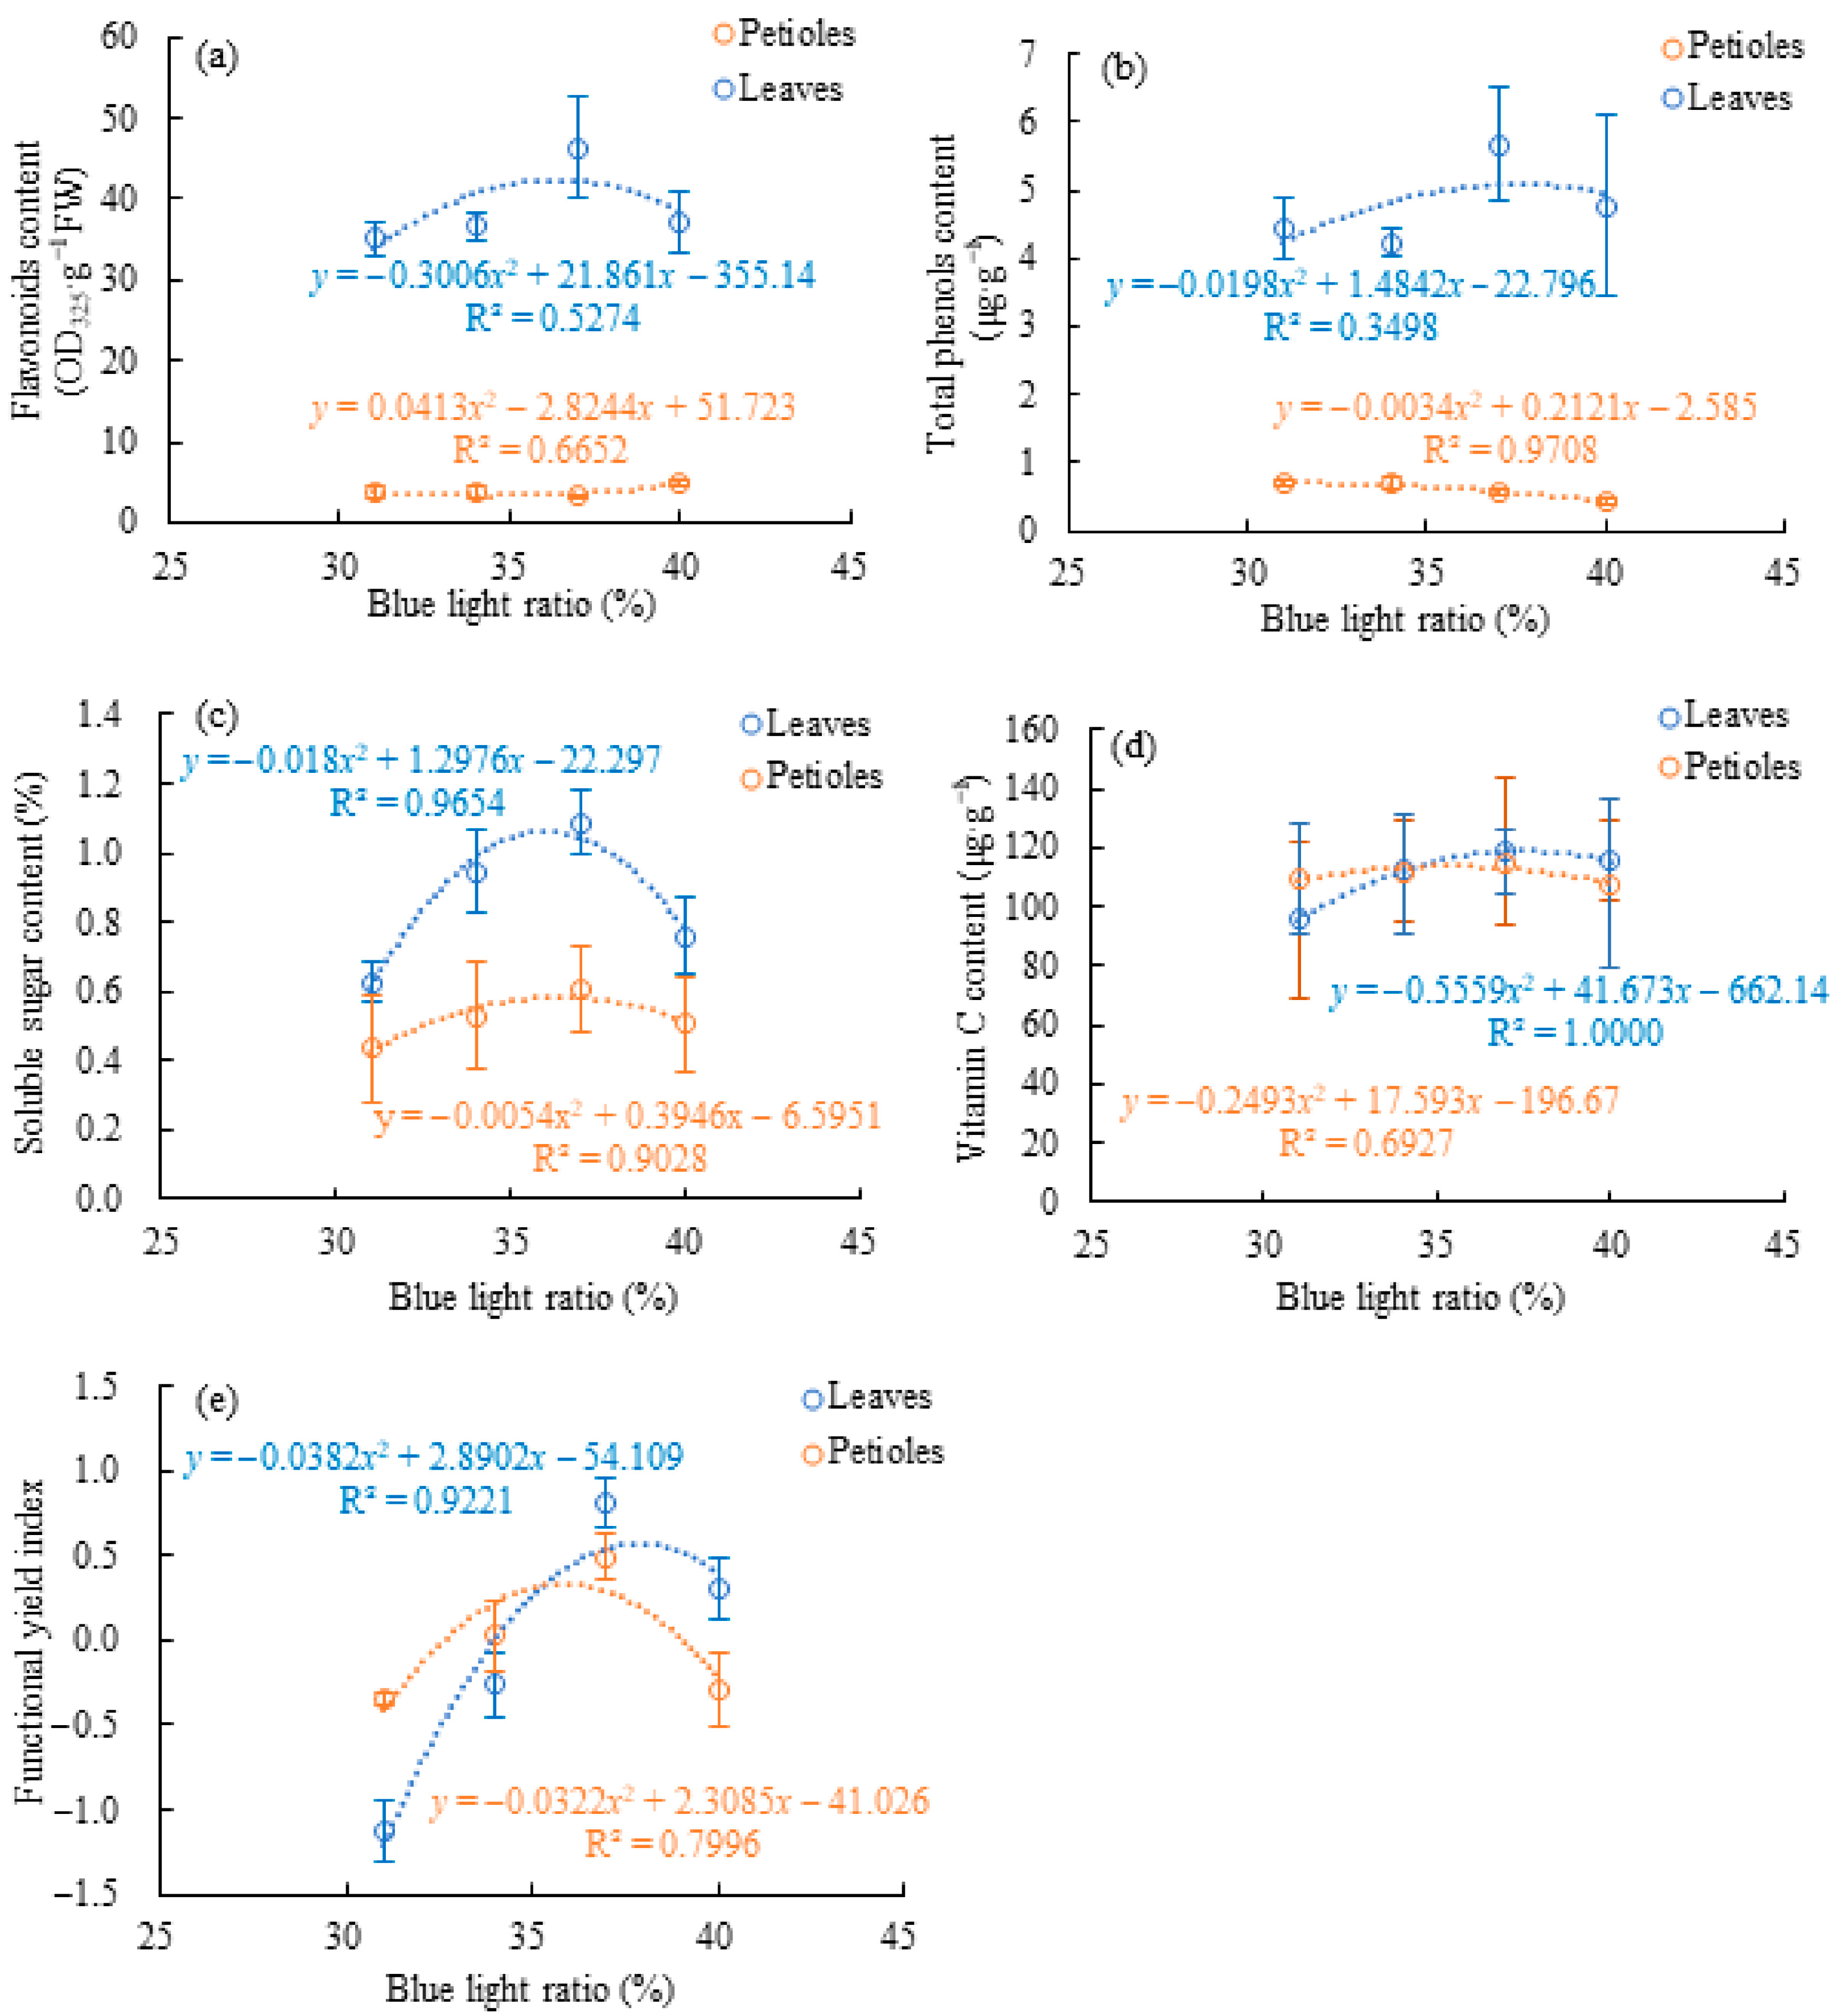
Quality-related traits in celery exhibited distinct organ-specific responses to increasing blue light ratios (Figure 7). To evaluate the integrated response of celery to different light treatments, a composite FYI was calculated for both leaves and petioles. Higher FYI values indicate better overall performance in terms of both physiological activity and nutritional quality. In leaves, flavonoid, soluble sugar, vitamin C, and FYI all showed quadratic trends, with maximum values at approximately 37% blue light (B20) before declining at higher levels. Total phenol content in leaves, however, responded less strongly, showing only a weak quadratic relationship (R2 = 0.3498). In petioles, soluble sugar and FYI also increased significantly up to 37% blue light, while flavonoids, phenols, and vitamin C remained relatively stable. These results indicate that moderate supplemental blue light (B20) enhances nutritional quality, particularly in leaves, whereas petiole quality traits were less responsive.

3.4. Organ-Specific Antioxidant Enzyme Activity Under Supplemental Blue Light

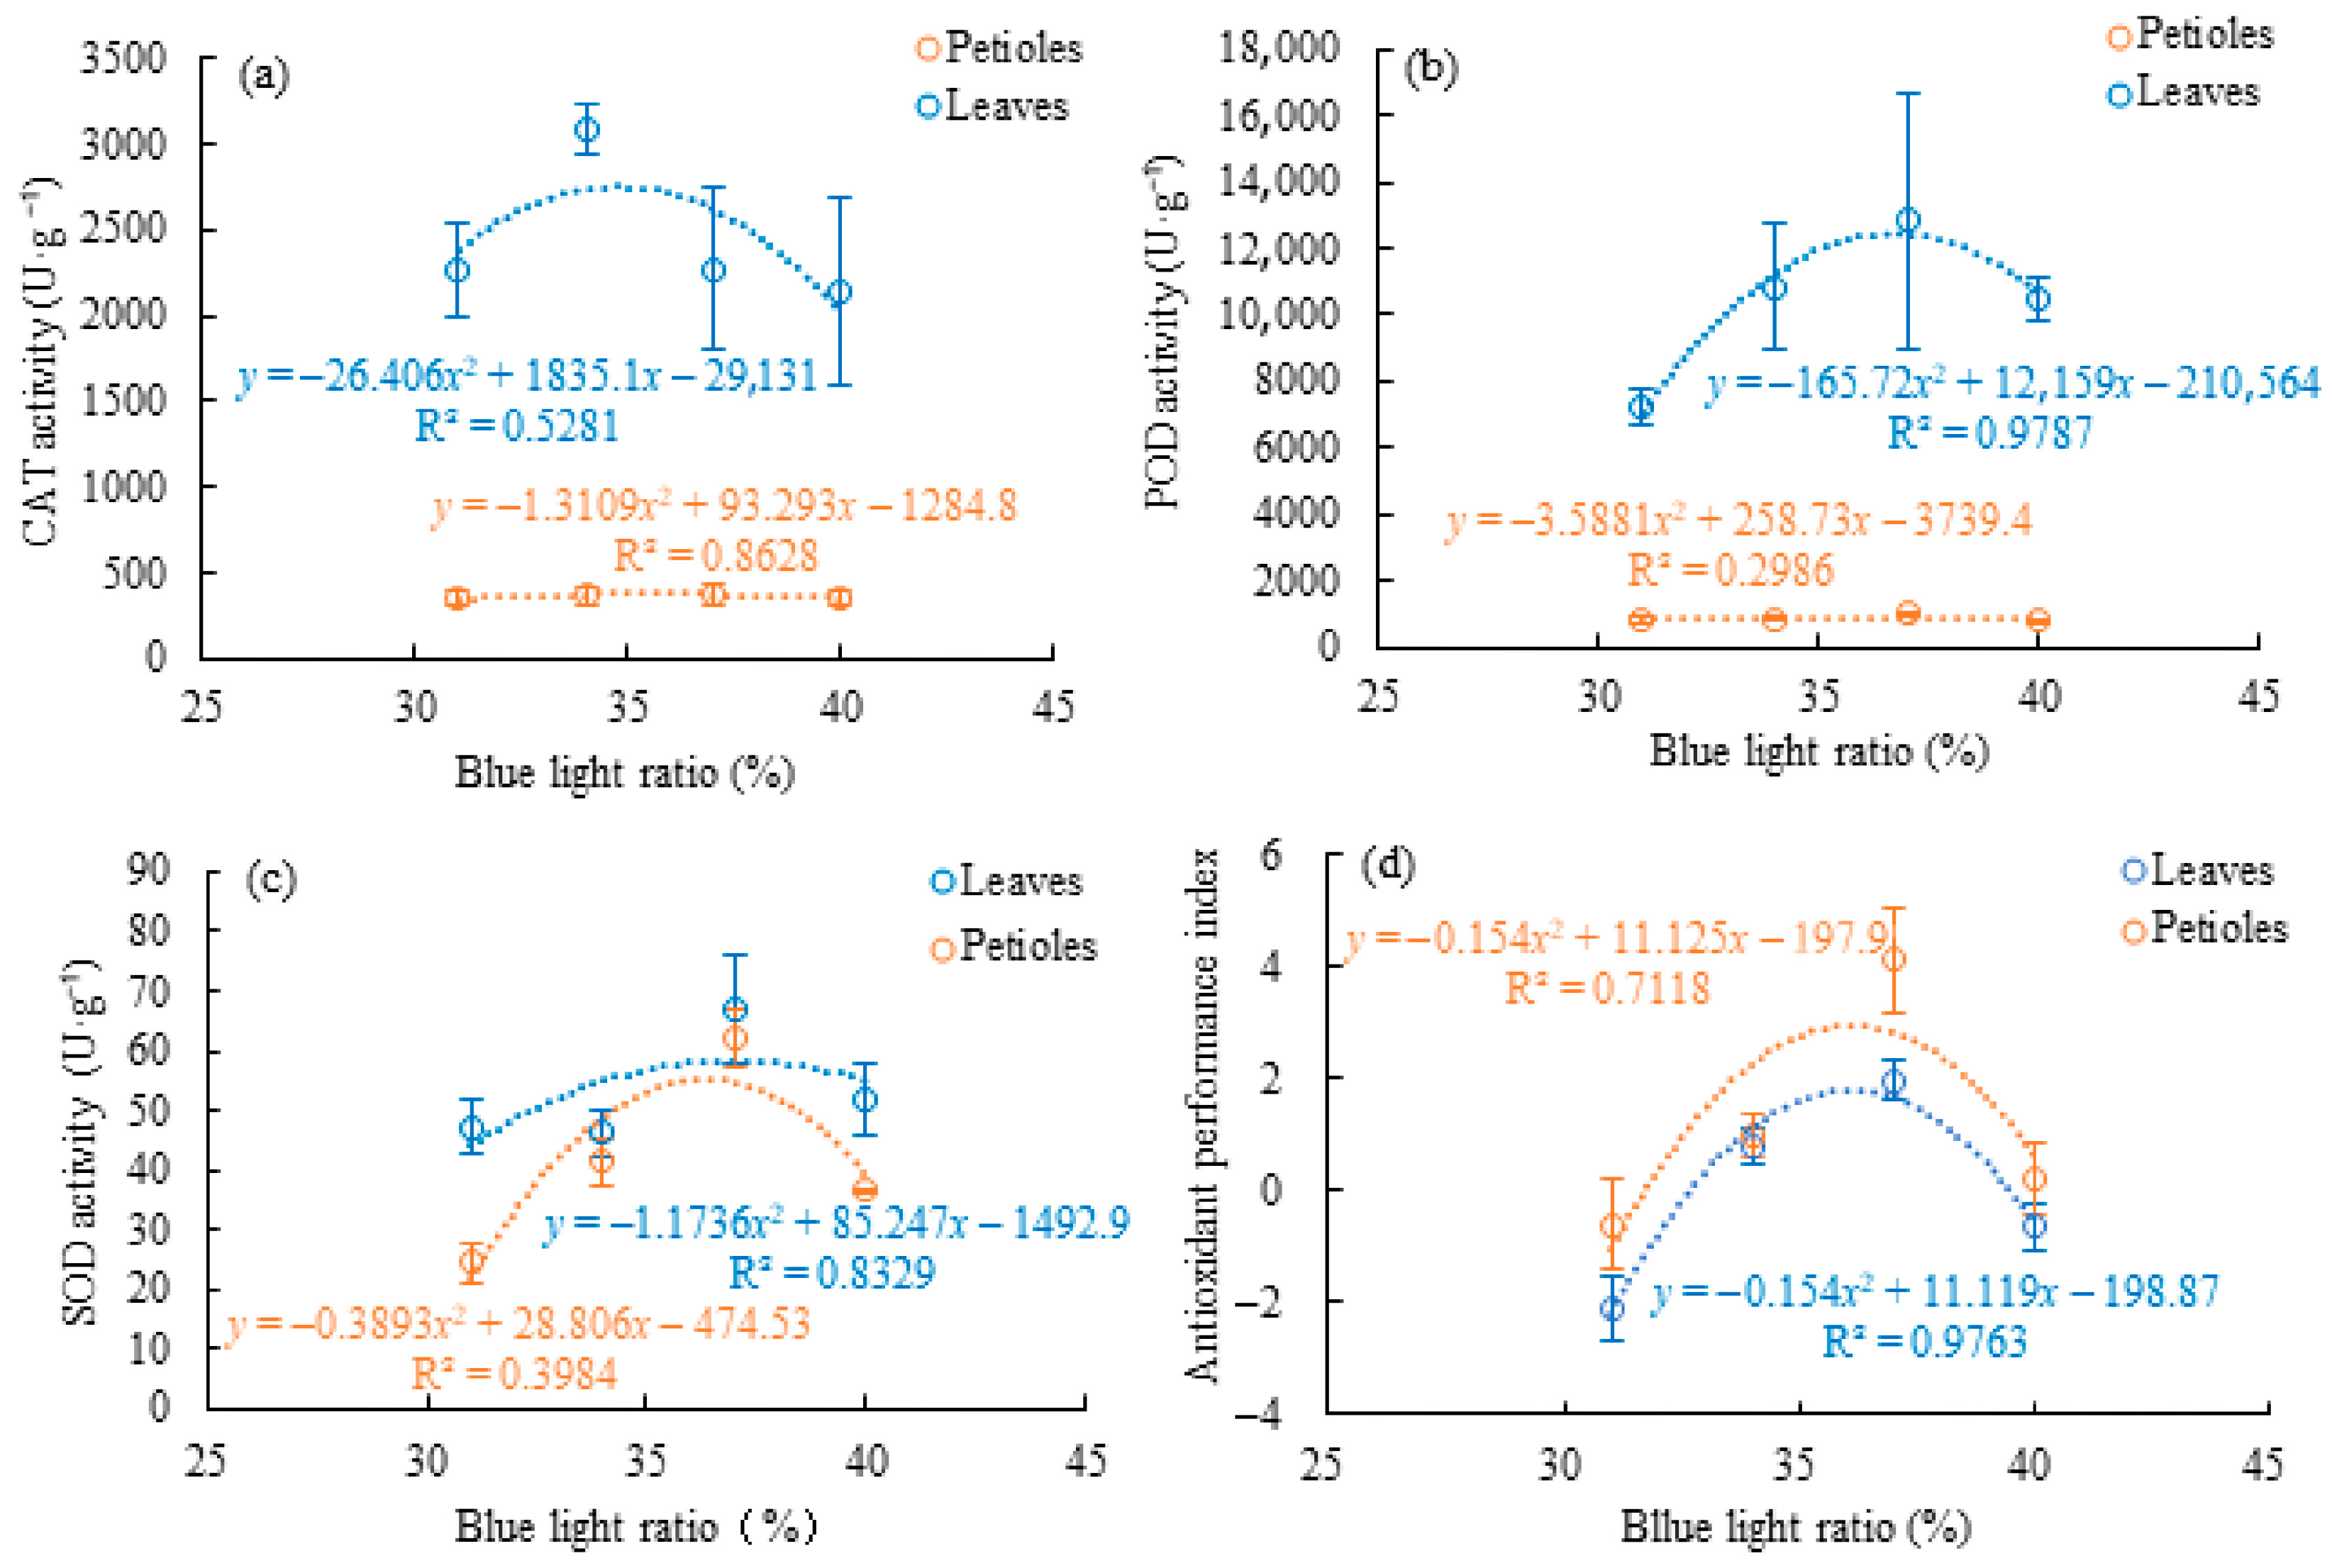
Moderate supplemental blue light enhances antioxidant defense capacity predominantly in leaves, with petiole responses being less pronounced. In leaves, CAT, POD, and SOD activities all increased with rising blue light ratio, reaching maximum at ~37% (B20) before declining at higher levels (Figure 8a–c). To further assess the integrated antioxidant response under different light conditions, API was calculated based on the activities of CAT, POD, and SOD, and positive API values indicate a stronger overall antioxidant capacity. Correspondingly, the API in leaves also peaked around 37%, indicating improved antioxidant capacity under moderate blue light (Figure 8d). In petioles, although enzyme activities were much lower overall, both SOD and CAT showed modest quadratic trends, while POD remained relatively unchanged (R2 = 0.2986). Petiole API also increased up to 37% blue light (B20) but declined thereafter.

3.5. Volatile Compound Differentiation Under Supplemental Blue Light

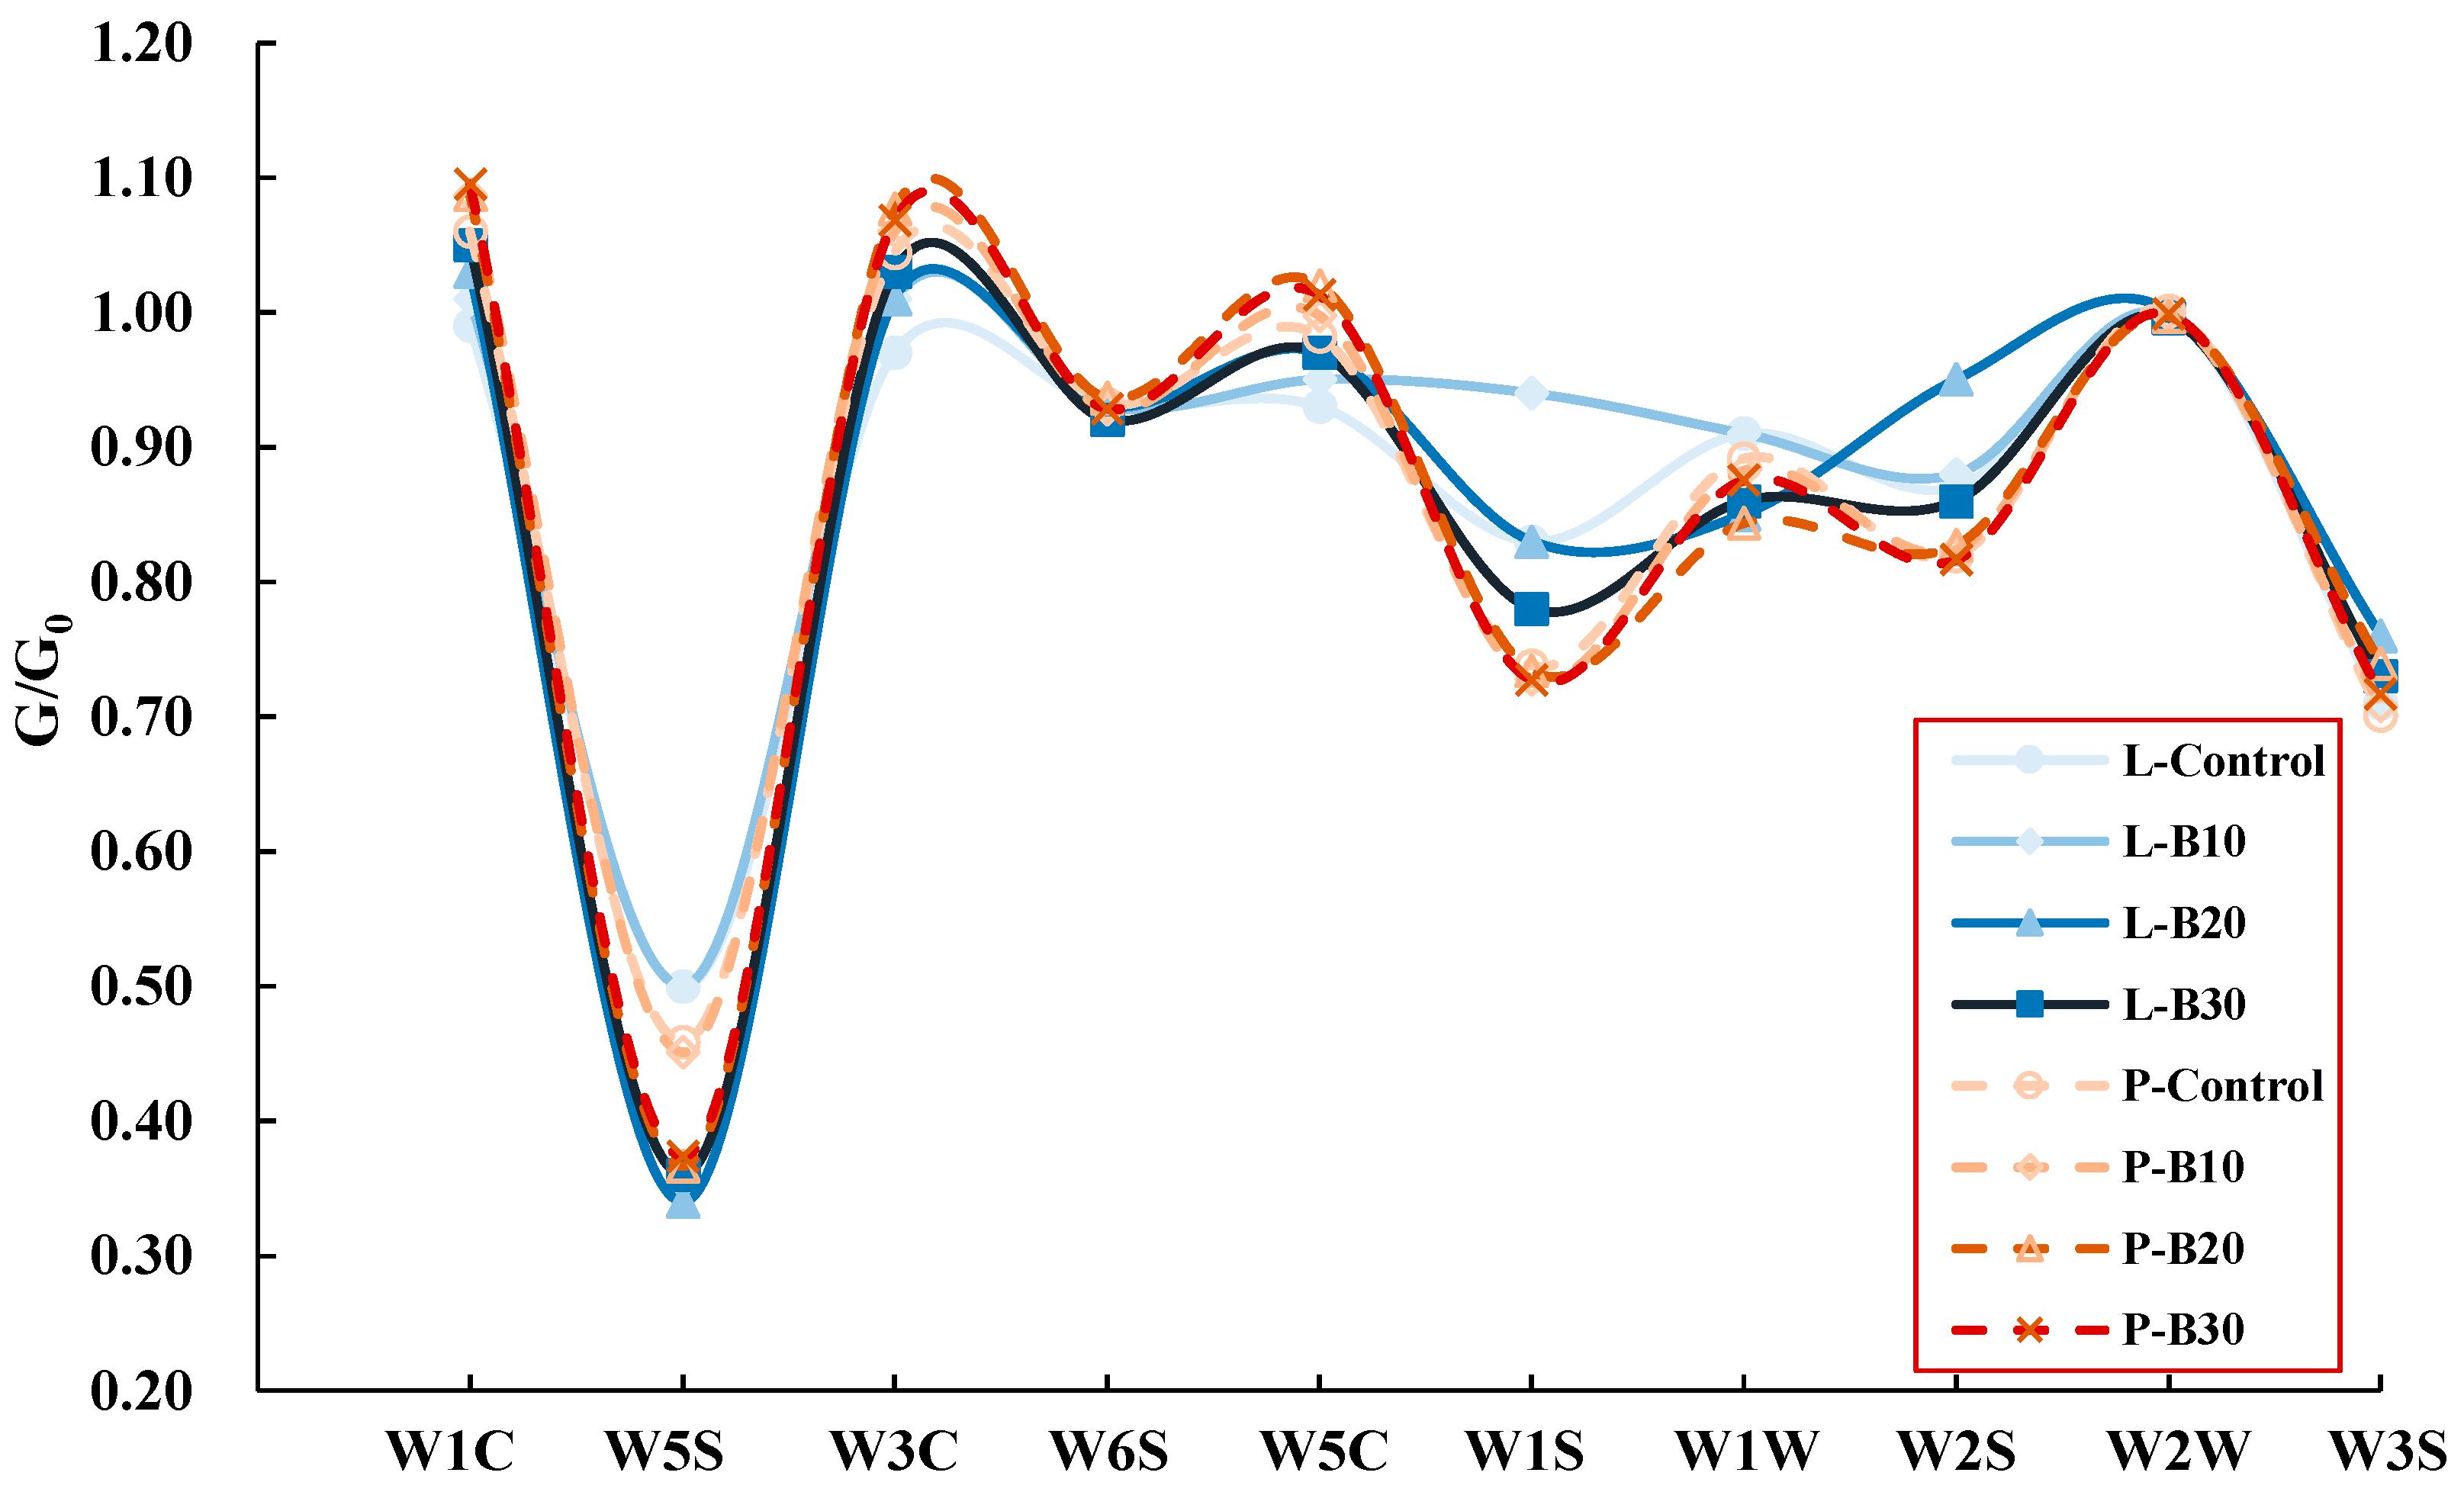
The E-Nose analysis revealed significant differences in volatile compound responses in petioles among treatments (Figure 9). For aromatic components (W1C), amines and aromatic molecules (W3C), and alkane aromatic components (W5C), all blue light-supplemented treatments exhibited significantly higher response values compared to Control, while different blue light treatments showed no significant difference. For alkanes components (W3S), B20 and B30 treatments showed significantly higher responses than treatments B10 and Control. In contrast, nitrogen oxides (W5S) and sulfides (W1W) responses were slightly lower in B20, significantly different from Control. For other channels, no significant differences were observed among treatments.
Supplementary blue light similarly increased the contents of aromatic components (W1C), amines and aromatic molecules (W3C), and alkane aromatic components (W5C), while reducing the responses of nitrogen oxides (W5S) and sulfides (W1W). Meanwhile, these effects were more pronounced in leaves than in petioles (Figure 9). Specifically, the W1C response in leaves increased by 6.1%, while in petioles it increased by 3.8%, with significant differences observed among different intensities of blue light treatments. Conversely, blue light supplementation reduced nitrogen oxides (W5S) and sulfides (W1W), with W5S decreasing by 28% and 19.6% in leaves and petioles, respectively. Alcohols, aldehydes and ketones (W2S) reached the highest level under B20, significantly greater than other treatments, while hydrogen (W6S) and organic sulfides (W2W) showed no significant differences among treatments.
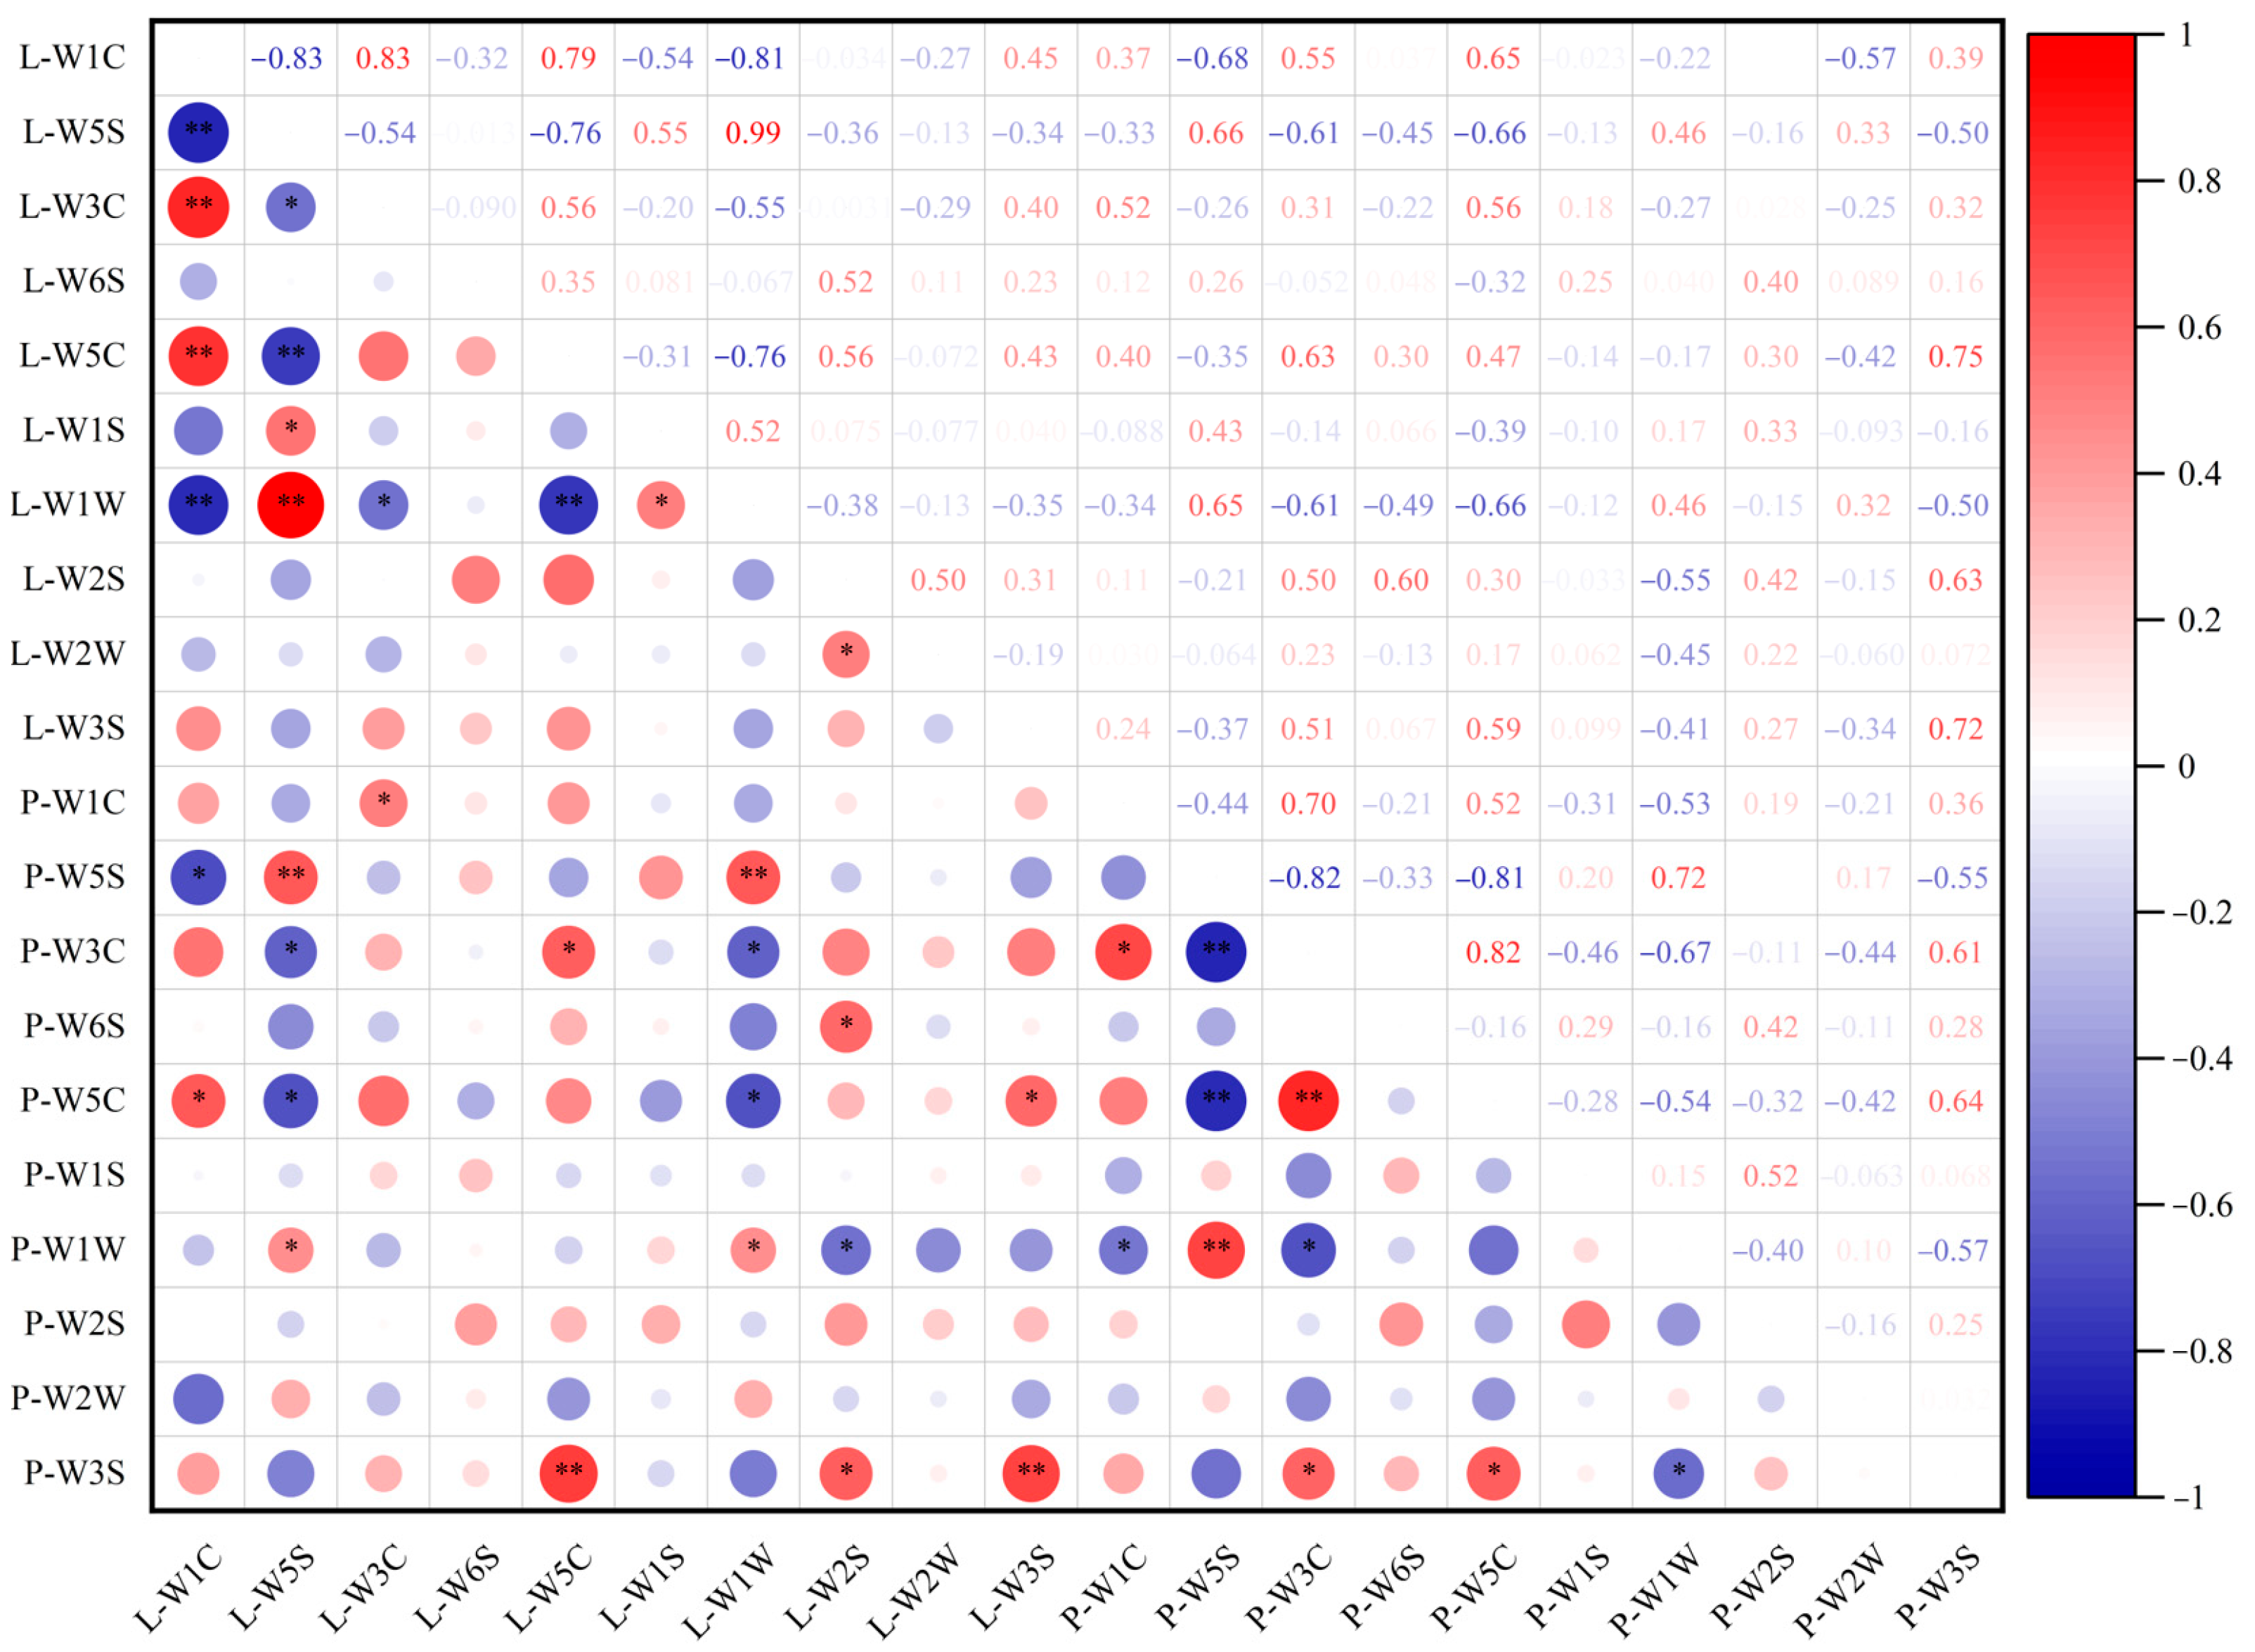
The correlation analysis of E-nose sensor responses in celery leaves and petioles revealed distinct patterns among volatile-related channels (Figure 10). In leaves, strong positive correlations were observed among the aromatic-related sensors W1C, W3C, and W5C (r > 0.79, p < 0.01), while these channels showed significant negative correlations with sulfide- and nitrogen oxide-related sensors, particularly W1W and W5S (r = −0.83 and −0.81, p < 0.01). In petioles, W1C was positively correlated with W3C and W5C (r > 0.64, p < 0.05), whereas W1C and W5C were negatively correlated with W5S (r = −0.72, p < 0.05). Cross-organ comparisons showed that leaf W1C was negatively correlated with petiole W5S (r = −0.82, p < 0.01), while petiole W3C and W5C exhibited moderate positive associations with their respective leaf counterparts (r = 0.52–0.64). Overall, the correlation matrix indicated clusters of strong interrelationships within aromatic sensor groups in both leaves and petioles, along with significant negative associations between aromatic-related and sulfur/NOx-related sensors.

3.6. Principal Component Analysis

Principal component analysis (PCA) was conducted to integrate growth, photosynthetic, biochemical, and volatile parameters across treatments (Table 2). The first three principal components (PC1, PC2, and PC3) explained 59.48%, 24.49%, and 16.03% of the total variance, respectively, with a cumulative contribution of 100%, while PC1 and PC2 together accounted for 83.97% of the variation. Composite scores calculated from the weighted principal components ranked the treatments as B20 (5.14) > B10 (−0.41) ≈ B30 (−1.35) > Control (−3.38).

4. Discussion

4.1. Moderate Red/Blue Light Ratio Balancing Photochemical Efficiency and Biomass Accumulation in Celery

It has been widely reported that lower red to blue light ratios result in improved photosynthetic performance and electron transport across a wide range of crops grown under CEA conditions [11,36,37], in accordance with the results of our study. The Y(II), qP, and qL in celery leaves were all significantly elevated with decreasing red to blue light ratios (Figure 6b), indicating enhanced photochemical efficiency and improved openness of PSII reaction centers. Furthermore, the significant reduction in minimum fluorescence (F0) under the lowest red/blue light ratio of 0.60 suggests either structural optimization of the PSII antenna complex or a decrease in basal non-photochemical energy dissipation, reflecting more effective utilization of absorbed excitation energy under blue light [9,10]. Noticeably, the relative variable fluorescence at J and I steps (ΔVJ and ΔVI) decreased progressively under lower blue light ratio of 34~37%, while showed a rebound at higher blue light ratio of 40% (Figure 6a). This indicated facilitated electron transport beyond QA- and enhanced reoxidation of PSII acceptors with moderate supplemental blue light intensity (10–20 μmol·m−2·s−1) [38,39], while higher supplemental blue light intensity (30 μmol·m−2·s−1) over-reduced the electron transport chain, potentially leading to acceptor-side limitations within the photosynthetic pathway [40,41]. The gas exchange parameters, photosynthetic pigments contents, morphological traits, and shoot fresh and dry weights also peaked with moderate red/blue light ratio of 0.68, further supporting the notion that moderate red/blue light ratio of 0.68 optimize both physiological and agronomic performance in celery, highlighting the existence of an optimum blue light fraction, in contrast to a linear dose-dependent response. These findings demonstrate that moderate supplemental blue light improved both photochemical efficiency and carbon assimilation, whereas excessive blue light supplementation led to mild photoinhibition and suboptimal shoot biomass accumulation [13,42,43].
The findings of this study indicate a beneficial impact of blue light on root biomass accumulation, aligning with previous findings in saffron (Crocus sativus L.) [10]. A high blue-to-red light ratio favored biomass allocation to underground organs, particularly newly formed corms, whereas red light promoted aerial growth, especially in leaves [10]. This differential partitioning is linked to the upregulation of CRY1 and PHOT genes under blue light, where cytoplasmic CRY1 facilitates root elongation by regulating auxin efflux, while PHOT suppresses lateral bud growth, reinforcing a root-biased growth pattern [44]. Conversely, red light hinders carbohydrate translocation from leaves to sink organs, leading to photosynthetic suppression due to excessive leaf starch buildup [36]. Similar trends have been reported in other leafy vegetables, including lettuce and kale, where moderate blue light levels promoted expansion of leaves and petioles through the upregulation of cell expansion-related genes and improved turgor-driven growth [13,15,45]. Taken together, moderate red/blue light ratio of 0.68 not only improves photosynthetic efficiency but also supports desirable biomass allocation, with practical implications for LED spectral design in CEA that prioritize shoot yield over root growth.

4.2. Organ-Specific Metabolic Responses to Supplemental Blue Light in Celery Leaves and Petioles

Flavonoids are important secondary metabolites in plants with pharmacological effects such as anticancer, antioxidant and hypoglycemic [46,47]. In this study, the contents of phenolics, flavonoids, soluble sugars, and vitamin C showed quadratic response to the blue light ratio, with an optimum at ~37%. In leaves, flavonoid and phenolic contents increased markedly under moderate blue light and declined at higher levels, whereas petioles exhibited weaker flavonoid responses while exhibiting a significant rise in soluble sugar content with a moderate red/blue light ratio of 0.68 (Figure 7). Such organ-specific trends are consistent with Kim et al. (2015), who showed that blue light preferentially promoted the accumulation of phenylpropanoids in leaves and floral tissues of Chinese cabbage, while roots and stems were less responsive [16]. Previous studies have attributed this enhancement to the upregulation of key genes in the phenylpropanoid biosynthetic pathway, including phenylalanine ammonia-lyase (PAL), cinnamate 4-hydroxylase (C4H), flavanone 3-hydroxylase (F3H), dihydroflavonol 4-reductase (DFR), and chalcone synthase (CHS) under blue light exposure [48,49,50]. The slight reduction or plateauing of phenolic accumulation under the lowest red/blue light ratio of 0.60 suggests a threshold beyond which excess excitation energy may trigger photoinhibition or redox-mediated repression of secondary metabolism [50].
Complementing the organ-specific trends in phenolic metabolism, antioxidant enzyme activities further highlighted tissue-specific physiological responses. SOD and POD activities, as well as the antioxidant performance index (API), peaked at ~37% blue light ratio in both leaves and petioles, while CAT activity remained relatively stable across treatments, particularly in petioles. These enzymes help mitigate oxidative damage caused by blue light-induced reactive oxygen species (ROS), with SOD converting O2 into H2O2 and POD facilitating subsequent detoxification [51]. The relatively stable CAT activity, especially in petioles, may reflect its compartmentalized role in peroxisomal H2O2 scavenging or lower sensitivity to transient ROS fluctuations [51,52]. Taken together, these results demonstrate that moderate red/blue light ratio of 0.68 orchestrates organ-specific metabolic adjustments: enhancing phenolic and antioxidant metabolism in leaves while promoting soluble sugar accumulation in petioles. This pattern also implies a more efficient allocation of photoassimilates from leaves to petioles, likely mediated by enhanced phloem loading and sucrose transport, as blue light has been reported to upregulate SPS, SUC2, and SWEET11 expression [53,54,55,56].

4.3. Organ-Specific Modulation of VOCs Under Supplemental Blue Light

In addition to carbon and antioxidant metabolism, supplemental blue light exerted a strong influence on the biosynthesis of VOCs in an organ-specific manner. Specifically, petioles displayed the most pronounced shifts in VOC composition, especially under higher blue light ratios from 37% to 40%. These changes included increased levels of aromatic compounds such as amines and alkane aromatics (W1C, W3C, W5C), alongside reductions in undesirable sulfur-containing volatiles (W1W, W5S), which are often linked to off-flavors. Leaves, in contrast, showed comparatively minor VOC alterations but a stronger enhancement of phenolic metabolism, suggesting a functional divergence whereby leaves prioritize photoprotection while petioles adjust flavor-related traits in response to spectral cues. The correlation analysis of E-nose responses provided additional insight into the organ-specific regulation of volatile compounds under supplemental blue light. Aromatic-related sensors (W1C, W3C, W5C) were negatively correlated with sulfide- and NOx-related sensors (W1W, W5S), suggesting that improvements in aroma quality were accompanied by reductions in undesirable components. Cross-organ correlations, such as the negative association between leaf W1C and petiole W5S, further suggest coordination of volatile metabolism between source and sink organs. These findings are consistent with previous reports that blue light can enhance the accumulation of aroma-related volatiles in leafy vegetables [21,22]. The observed organ-specific VOC responses are likely mediated by light-regulated expression of terpene synthases, methyltransferases, and sulfur-metabolism enzymes, which differ across tissues [23,57,58]. It should be noted that the E-nose does not provide absolute quantification of individual VOCs, but instead generates sensor-based fingerprints that reflect the overall volatile profile. This method has been increasingly used for high-throughput quality screening in horticultural crops [21,22]. In the context of this study, E-nose analysis allowed us to rapidly compare the effects of supplemental blue light on volatile patterns between leaves and petioles.

4.4. Practical Implications for Controlled Environment Agriculture and Future Research

This study provides actionable insights for optimizing spectral strategies in CEA, particularly in PFAL, where energy and space efficiency are critical. Among the tested intensities, supplemental blue light at 20 μmol·m−2·s−1 consistently produced the most favorable outcomes, enhancing photosynthetic capacity, shoot biomass, and nutritional quality without inducing photoinhibition. This physiological “sweet spot” aligns with prior evidence that moderate light stress can act as a non-chemical elicitor of beneficial metabolites and antioxidant defenses [2,7,59]. The composite indices used in this study, including the FYI and API, as well as the PCA results, offered an integrated overview of how supplemental blue light affected organ-specific traits in celery. This integrative outcome is consistent with single-trait analyses, reinforcing that moderate red/blue light ratio of 0.68 provided the best trade-off between productivity and quality.
Despite the promising results, this study also highlights directions for future research. As the current work focused on a single celery cultivar under fixed environmental conditions, future studies should investigate genotype × spectrum interactions and validate these findings across diverse growing environments. Furthermore, deeper mechanistic insights are needed into how blue light orchestrates organ-specific gene expression, particularly in pathways related to photoreceptor signaling, photoassimilates allocation, and secondary metabolism. Integrating transcriptomic and metabolomic analyses will help elucidate the regulatory networks underlying these spatial responses [20,40]. Finally, evaluating the downstream effects of spectral modulation on postharvest quality, consumer flavor perception, and shelf-life stability will be essential for translating laboratory findings into economically viable CEA applications. Collectively, these insights support the development of precision lighting strategies that are physiologically effective, resource-efficient, and tailored to crop-specific market demands in next-generation agriculture systems.

5. Conclusions

Our study demonstrated that supplemental blue light exerts organ-specific and intensity-dependent effects on the physiological performance and quality attributes of celery grown under controlled environment conditions. A moderate red/blue light ratio around 0.68 effectively enhanced photosynthetic efficiency, shoot biomass accumulation, and the biosynthesis of flavonoids, phenolics, soluble sugars, and aromatic volatiles, without inducing photoinhibition or metabolic imbalances. Regression-based analyses further confirmed that this intermediate intensity represents an optimal “sweet spot”, providing the best trade-off between productivity and quality. Notably, leaves showed greater enhancement in photosynthetic and antioxidant traits, while petioles responded more strongly in terms of assimilate storage and flavor-related metabolites. These findings underscore the importance of tissue-specific responses in spectral management and support the use of moderate blue light as a practical, non-chemical strategy for improving both yield and functional quality in leafy vegetables.

Supplementary Materials

The following supporting information can be downloaded at: https://www.mdpi.com/article/10.3390/horticulturae11091074/s1. Table S1: Chlorophyll fluorescence parameters of celery leaves grown under white-red light-emitting diodes (LEDs) and white-red plus blue LEDs (B10, B20, B30, respectively). Celery grown under white-red LEDs only was set as Control.

Author Contributions

Conceptualization, Z.Y. and H.D.; methodology, H.D. and Z.L.; validation, J.S., F.J. and N.L.; formal analysis, Q.L. and P.J.; resources, L.X.; writing—original draft preparation, H.D. and Z.L.; writing—review and editing, H.D., Z.L. and Z.Y.; visualization, Q.L. and P.J.; supervision, J.S., F.J., N.L. and Z.Y.; project administration, Z.Y.; funding acquisition, Z.Y. All authors have read and agreed to the published version of the manuscript.

Funding

This research was funded by the Modern Agricultural Industrial Technology System of Shandong Province (SDAIT−05), the Key Research and Development Program of Shandong Province (2021TZXD007 & 2024TZXD019), University Enterprise Cooperation Project (6602423221), the Foundation for High-level Talents of Qingdao Agricultural University (6631120098), the Postgraduate Innovation Program of Qingdao Agricultural University (QNYCX24031), Innovation & Entrepreneurship Training Program for College Students of Qingdao Agricultural University (QNDC20250148 & QNDC20250164).

Data Availability Statement

The original contributions presented in this study are included in the article and Supplementary Material. Further inquiries can be directed to the corresponding author.

Conflicts of Interest

Author Ligang Xu was employed by the company Qingdao Macaco Ecological Agriculture Co., Ltd. The remaining authors declare that the research was conducted in the absence of any commercial or financial relationships that could be construed as a potential conflict of interest.

References

  1. Mao, H.; Hang, T.; Zhang, X.; Lu, N. Both multi-segment light intensity and extended photoperiod lighting strategies, with the same daily light integral, promoted Lactuca sativa L. growth and photosynthesis. Agron. J. 2019, 9, 857. [Google Scholar] [CrossRef]
  2. Kusuma, P.; Pattison, P.M.; Bugbee, B. From physics to fixtures to food: Current and potential LED efficacy. Hortic. Res. 2020, 7, 56. [Google Scholar] [CrossRef]
  3. Si, C.; Lin, Y.; Luo, S.; Yu, Y.; Liu, R.; Naz, M.; Dai, Z. Effects of LED light quality combinations on growth and leaf color of tissue culture-generated plantlets in Sedum rubrotinctum. Hortic. Sci. Technol. 2024, 42, 53–67. [Google Scholar] [CrossRef]
  4. Xu, X.; Yang, F.; Song, J.; Zhang, R.; Cai, W. Does the daily light integral influence the sowing density of tomato plug seedlings in a controlled environment. Horticulturae 2024, 10, 730. [Google Scholar] [CrossRef]
  5. Zhou, J.; Li, P.; Wang, J.; Fu, W. Growth, photosynthesis, and nutrient uptake at different light intensities and temperatures in lettuce. HortScience 2019, 54, 1925–1933. [Google Scholar] [CrossRef]
  6. Zhou, J.; Li, P.; Wang, J. Effects of light intensity and temperature on the photosynthesis characteristics and yield of lettuce. Horticulturae 2022, 8, 178. [Google Scholar] [CrossRef]
  7. Bhattarai, T.; Ebong, A.; Raja, M.Y.A. A review of light-emitting diodes and ultraviolet light-emitting diodes and their applications. Photonics 2024, 11, 491. [Google Scholar] [CrossRef]
  8. Liu, K.; Tang, L.; Chu, Q.; Lu, Y.; Su, L.; Cheng, S.; He, Z.; Zhou, X. Effects of different LED light quality combinations on nutritional quality and physiological characteristics of celery. Horticulturae 2025, 11, 524. [Google Scholar] [CrossRef]
  9. Hasan, M.M.; Bashir, T.; Ghosh, R.; Lee, S.K.; Bae, H. An overview of LEDs’ effects on the production of bioactive compounds and crop quality. Molecules 2017, 22, 1420. [Google Scholar] [CrossRef]
  10. Moradi, S.; Kafi, M.; Aliniaeifard, S.; Salami, S.A.; Shokrpour, M.; Pedersen, C.; Moosavi-Nezhad, M.; Wróbel, J.; Kalaji, H.M. Blue light improves photosynthetic performance and biomass partitioning toward harvestable organs in saffron (Crocus sativus L.). Cells 2021, 10, 1994. [Google Scholar] [CrossRef]
  11. Chan, A.M.H.; Pay, M.L.; Christensen, J.; He, F.; Roden, L.C.; Ahmed, H.; Foo, M. Red, blue or mix: Choice of optimal light qualities for enhanced plant growth and development through in silico analysis. Silico Plants 2024, 6, diae008. [Google Scholar] [CrossRef]
  12. Sun, J.; Tan, X.; Liu, B.; Battino, M.; Meng, X.; Zhang, F. Blue light inhibits gray mold infection by inducing disease resistance in cherry tomato. Postharvest Biol. Technol. 2024, 215, 113006. [Google Scholar] [CrossRef]
  13. Kopsell, D.A.; Sams, C.E.; Metallo, R.M.; Waterland, N.L.; Kopsell, D.E. Biomass, carbohydrates, pigments, and mineral elements in kale (Brassica oleracea var acephala) microgreens respond to LED blue-light wavelength. Sci. Hortic. 2024, 328, 112929. [Google Scholar] [CrossRef]
  14. Martínez-Moreno, A.; Frutos-Tortosa, A.; Diaz-Mula, H.; Mestre, T.C.; Martínez, V. Effect of the intensity and spectral quality of LED light on growth and quality of spinach indoors. Horticulturae 2024, 10, 411. [Google Scholar] [CrossRef]
  15. Zhu, Y.; Singh, J.; Patil, B.S.; Zhen, S. End-of-production supplemental blue light intensity and duration co-regulate growth, anthocyanin, and ascorbic acid production in red leaf lettuce. Sci. Hortic. 2024, 335, 113333. [Google Scholar] [CrossRef]
  16. Kim, Y.J.; Kim, Y.B.; Li, X.; Choi, S.R.; Park, S.; Park, J.S.; Lim, Y.P.; Park, S.U. Accumulation of phenylpropanoids by white, blue, and red light irradiation and their organ-specific distribution in Chinese cabbage (Brassica rapa ssp. pekinensis). J. Agric. Food Chem. 2015, 63, 6772–6778. [Google Scholar] [CrossRef]
  17. Khairullah, A.R.; Solikhah, T.I.; Ansori, A.N.M.; Hidayatullah, A.R.; Hartadi, E.B.; Ramandinianto, S.C.; Fadholly, A. Review on the pharmacological and health aspects of Apium Graveolens or celery: An update. Sys. Rev. Pharm. 2021, 12, 606–612. [Google Scholar]
  18. Liu, P.Z.; Wang, Y.H.; Wang, L.X.; Li, M.Y.; Liu, H.; Shu, S.; Tan, G.F.; Xiong, A.S. Current situation and future outlook of production, processing and marketing in the celery industry. Technol. Horticul. 2024, 4, e013. [Google Scholar] [CrossRef]
  19. Zhang, B.; Li, S.; Zhang, W.; Cheng, Y.; Liu, Z.; Zhang, N.; Xu, J.; Wu, X.; Dong, F.; Zheng, Y.; et al. Sensitive and portable intelligent detection platform construction and dietary risk assessment of procymidone in Chinese leek, cowpea and celery. Food Chem. 2025, 465, 142081. [Google Scholar] [CrossRef]
  20. Qin, Y.; Liu, X.; Li, C.; Chu, Q.; Cheng, S.; Su, L.; Shao, D.; Guo, X.; He, Z.; Zhou, X. Effect of light intensity on celery growth and flavonoid synthesis. Front. Plant Sci. 2024, 14, 1326218. [Google Scholar] [CrossRef] [PubMed]
  21. Yu, S.; Huang, X.; Wang, L.; Ren, Y.; Zhang, X.; Wang, Y. Characterization of selected Chinese soybean paste based on flavor profiles using HS-SPME-GC/MS, E-nose and E-tongue combined with chemometrics. Food Chem. 2022, 375, 131840. [Google Scholar] [CrossRef]
  22. Dai, C.; Huang, X.; Lv, R.; Zhang, Z.; Sun, J.; Aheto, J.H. Analysis of volatile compounds of Tremella aurantialba fermentation via electronic nose and HS-SPME-GC-MS. J. Food Saf. 2018, 38, e12555. [Google Scholar] [CrossRef]
  23. Wang, Y.; Yan, X.; Wang, S.; Gao, S.; Yang, K.; Zhang, R.; Zhang, M.; Wang, M.; Ren, L.; Yu, J. Electronic nose application for detecting different odorants in source water: Possibility and scenario. Environ. Res. 2023, 227, 115677. [Google Scholar] [CrossRef]
  24. Lichtenthaler, H.; Wellburn, A. Determinations of total carotenoids and chlorophylls a and b of leaf extracts in different solvents. Biochem. Soc. Trans. 1983, 603, 591–592. [Google Scholar] [CrossRef]
  25. Ye, Z.; Suggett, D.; Robakowski, P.; Kang, H. A mechanistic model for the photosynthesis light response based on the photosynthetic electron transport of photosystem II in C3 and C4 species. New Phytol. 2013, 199, 110–120. [Google Scholar] [CrossRef]
  26. Ullah, I.; Hanping, M.; Javed, Q.; Rasool, G.; Ali, M.; Ullah, A.A.M.S. Nitrogen fertilization effects on growth, leaf gas exchange and chlorophyll fluorescence of Brassica juncea. Int. J. Agric. Biol. 2020, 24, 1070–1076. [Google Scholar] [CrossRef]
  27. Zhang, C.; Akhlaq, M.; Yan, H.; Ni, Y.; Liang, S.; Zhou, J.; Xue, R.; Li, M.; Adnan, R.M.; Li, J. Chlorophyll fluorescence parameter as a predictor of tomato growth and yield under CO2 enrichment in protective cultivation. Agric. Water Manag. 2023, 284, 108333. [Google Scholar] [CrossRef]
  28. Popescu, S.; Chiș, T.Ș.; Chiricuţță, M.G.; Vârlan, A.C.; Pîrvulescu, L.; Velciov, A. Vitamin C determination in foods. Titrimetric methods—A review. J. Agroaliment. Process. Technol. 2024, 30, 471–476. [Google Scholar] [CrossRef]
  29. Song, J.; Huang, H.; Hao, Y.; Song, S.; Zhang, Y.; Su, W.; Liu, H. Nutritional quality, mineral and antioxidant content in lettuce affected by interaction of light intensity and nutrient solution concentration. Sci. Rep. 2020, 10, 2796. [Google Scholar] [CrossRef] [PubMed]
  30. Aleixandre-Tudo, J.L.; Buica, A.; Nieuwoudt, H.; Aleixandre, J.L.; du Toit, W. Spectrophotometric analysis of phenolic compounds in grapes and wines. J. Agric. Food Chem. 2017, 65, 4009–4026. [Google Scholar] [CrossRef] [PubMed]
  31. Mare, R.; Pujia, R.; Maurotti, S.; Greco, S.; Cardamone, A.; Coppoletta, A.R.; Bonacci, S.; Procopio, A.; Pujia, A. Assessment of Mediterranean citrus peel flavonoids and their antioxidant capacity using an innovative UV-Vis spectrophotometric approach. Plants 2023, 12, 4046. [Google Scholar] [CrossRef]
  32. Chi, X.; Li, X.; Hou, X.; Guo, S.; Hu, X. Facile bioself-assembled crystals in plants promote photosynthesis and salt stress resistance. Amer. Chem. Soc. Nano 2021, 15, 5165–5177. [Google Scholar] [CrossRef]
  33. Yang, J.; Liu, K.; Chen, Y.; Ye, H.; Hao, G.; Du, F.; Wang, P. A supramolecular bactericidal material for preventing and treating plant-associated biofilms. Nat. Commun. 2025, 16, 2627. [Google Scholar] [CrossRef]
  34. Chang, C.H.; Liu, Y.C. Evaluation of antioxidative performance of tomato extracts obtained by different methods. J. Sci. Food Agric. 2008, 88, 612–618. [Google Scholar] [CrossRef]
  35. Wang, G.; Xu, H.; Zhao, H.; Wu, Y.; Gao, X.; Chai, Z.; Liang, Y.; Zhang, X.; Zheng, R.; Yang, Q.; et al. Screening optimal oat varieties for cultivation in arid areas in China: A comprehensive evaluation of agronomic traits. Agronomy 2023, 13, 2266. [Google Scholar] [CrossRef]
  36. Dou, H.; Niu, G.; Gu, M.; Masabni, J. Effects of light quality on growth and phytonutrient accumulation of herbs under controlled environments. Horticulturae 2017, 3, 36. [Google Scholar] [CrossRef]
  37. Hang, T.; Lu, N.; Takagaki, M.; Mao, H. Leaf area model based on thermal effectiveness and photosynthetically active radiation in lettuce grown in mini-plant factories under different light cycles. Sci. Hortic. 2019, 252, 113–120. [Google Scholar] [CrossRef]
  38. Misra, A.N.; Misra, M.; Singh, R. Chlorophyll fluorescence in plant biology. Biophys. J. 2012, 7, 171–192. [Google Scholar]
  39. Yuan, J.; Ma, C.; Feng, Y.; Zhang, J.; Yang, F.; Li, Y. Response of chlorophyll fluorescence transient in leaves of wheats with different drought resistances to drought stresses and rehydration. J. Plant Physiol. 2018, 54, 1119–1129. [Google Scholar]
  40. Chen, X.; Li, Y.; Wang, L.; Yang, Q.; Guo, W. Responses of butter leaf lettuce to mixed red and blue light with extended light/dark cycle period. Sci. Rep. 2022, 12, 6924. [Google Scholar] [CrossRef]
  41. Shamsabad, M.R.M.; Esmaeilizadeh, M.; Roosta, H.R.; Dehghani, M.R.; Dąbrowski, P.; Kalaji, H.M. The effect of supplementary light on the photosynthetic apparatus of strawberry plants under salinity and alkalinity stress. Sci. Rep. 2022, 12, 13257. [Google Scholar] [CrossRef]
  42. Singh, S.K.; Reddy, V.R. Response of carbon assimilation and chlorophyll fluorescence to soybean leaf phosphorus across CO2: Alternative electron sink, nutrient efficiency and critical concentration. J. Photochem. Photobiol. B Biol. 2015, 151, 276–284. [Google Scholar] [CrossRef]
  43. Padmasree, K.; Padmavathi, L.; Raghavendra, A.S. Essentiality of mitochondrial oxidative metabolism for photosynthesis: Optimization of carbon assimilation and protection against photoinhibition. Crit. Rev. Biochem. Mol. Biol. 2002, 37, 71–119. [Google Scholar] [CrossRef]
  44. Dierck, R.; Dhooghe, E.; Van Huylenbroeck, J.; Van Der Straeten, D.; De Keyser, E. Light quality regulates plant architecture indifferent genotypes of Chrysanthemum morifolium Ramat. Sci. Hortic. 2017, 218, 177–186. [Google Scholar] [CrossRef]
  45. Wang, Y.; Sun, J.; Ali, S.S.; Gao, L.; Ni, X.; Li, X.; Wu, Y.; Jiang, J. Identification and expression analysis of Sorghum bicolor gibberellin oxidase genes with varied gibberellin levels involved in regulation of stem biomass. Ind. Crops Prod. 2020, 145, 111951. [Google Scholar] [CrossRef]
  46. Tahir, H.E.; Xiaobo, Z.; Mariod, A.A.; Mahunu, G.K.; Abdualrahman, M.A.; Tchabo, W. Assessment of antioxidant properties, instrumental and sensory aroma profile of red and white Karkade/Roselle (Hibiscus sabdariffa L.). J. Food Meas. Charact. 2017, 11, 1559–1568. [Google Scholar] [CrossRef]
  47. Zhou, Q.; Cheng, K.W.; Xiao, J.; Wang, M. The multifunctional roles of flavonoids against the formation of advanced glycation end products (AGEs) and AGEs-induced harmful effects. Trends Food Sci. Technol. 2020, 103, 333–347. [Google Scholar] [CrossRef]
  48. Agati, G.; Azzarello, E.; Pollastri, S.; Tattini, M. Flavonoids as antioxidants in plants: Location and functional significance. Plant Sci. 2012, 196, 67–76. [Google Scholar] [CrossRef]
  49. Gangappa, S.N.; Botto, J.F. The multifaceted roles of HY5 in plant growth and development. Mol. Plant 2016, 9, 1353–1365. [Google Scholar] [CrossRef]
  50. Zhang, T.; Zhang, Y.H.; Yang, J.X.; Wang, X.Z.; Yang, Q.Q.; Zhu, X.J.; Cao, X.Y. Transcriptome and targeted metabolome analysis revealed the effects of combined red and blue light on the growth and secondary metabolism of Scutellaria baicalensis Georgi. Ind. Crops Prod. 2022, 188, 115598. [Google Scholar] [CrossRef]
  51. Wang, B.; Zhang, Y.; Venkitasamy, C.; Wu, B.; Pan, Z.; Ma, H. Effect of pulsed light on activity and structural changes of horseradish peroxidase. Food Chem. 2017, 234, 20–25. [Google Scholar] [CrossRef]
  52. Apel, K.; Hirt, H. Reactive oxygen species: Metabolism, oxidative stress, and signal transduction. Annu. Rev. Plant Biol. 2004, 55, 373–399. [Google Scholar] [CrossRef] [PubMed]
  53. Wu, W.; Chen, L.; Liang, R.; Huang, S.; Li, X.; Huang, B.; Luo, H.; Zhang, M.; Wang, X.; Zhu, H. The role of light in regulating plant growth, development and sugar metabolism: A review. Front. Plant Sci. 2025, 15, 1507628. [Google Scholar] [CrossRef]
  54. Zhan, X.; Yang, Q.; Wang, S.; Wang, Y.; Fan, X.; Bian, Z. The responses of sucrose metabolism and carbon translocation in tomato seedlings under different light spectra. Int. J. Mol. Sci. 2023, 24, 15054. [Google Scholar] [CrossRef]
  55. Koch, K. Sucrose metabolism: Regulatory mechanisms and pivotal roles in sugar sensing and plant development. Curr. Opin. Plant Biol. 2004, 7, 235–246. [Google Scholar] [CrossRef]
  56. Varshney, V.; Singh, J.; Salvi, P. Sugar signaling and their interplay in mitigating abiotic stresses in plant: A molecular perspective. In Smart Plant Breeding for Field Crops in Post-Genomics Era; Springer Nature: Singapore, 2023; pp. 369–393. [Google Scholar] [CrossRef]
  57. Wang, H.; Wang, Y.; Xu, S.; Zhu, W. Light quality-controlled phytochemicals biosynthesis in vegetables and fruits. Agric. Sci. Technol. 2015, 16, 2029. [Google Scholar]
  58. Khalighi, S.; Mehrjerdi, M.Z.; Aliniaeifard, S. Light quality affects phytochemicals content and antioxidant capacity of Satureja hortensis. South West. J. Hortic. Biol. Environ. 2021, 12, 99–117. [Google Scholar]
  59. Zhang, X.; Zhang, M.; Xu, B.; Mujumdar, A.S.; Guo, Z. Light-emitting diodes (below 700 nm): Improving the preservation of fresh foods during postharvest handling, storage, and transportation. Compr. Rev. Food Sci. Food Saf. 2021, 21, 106–126. [Google Scholar] [CrossRef]
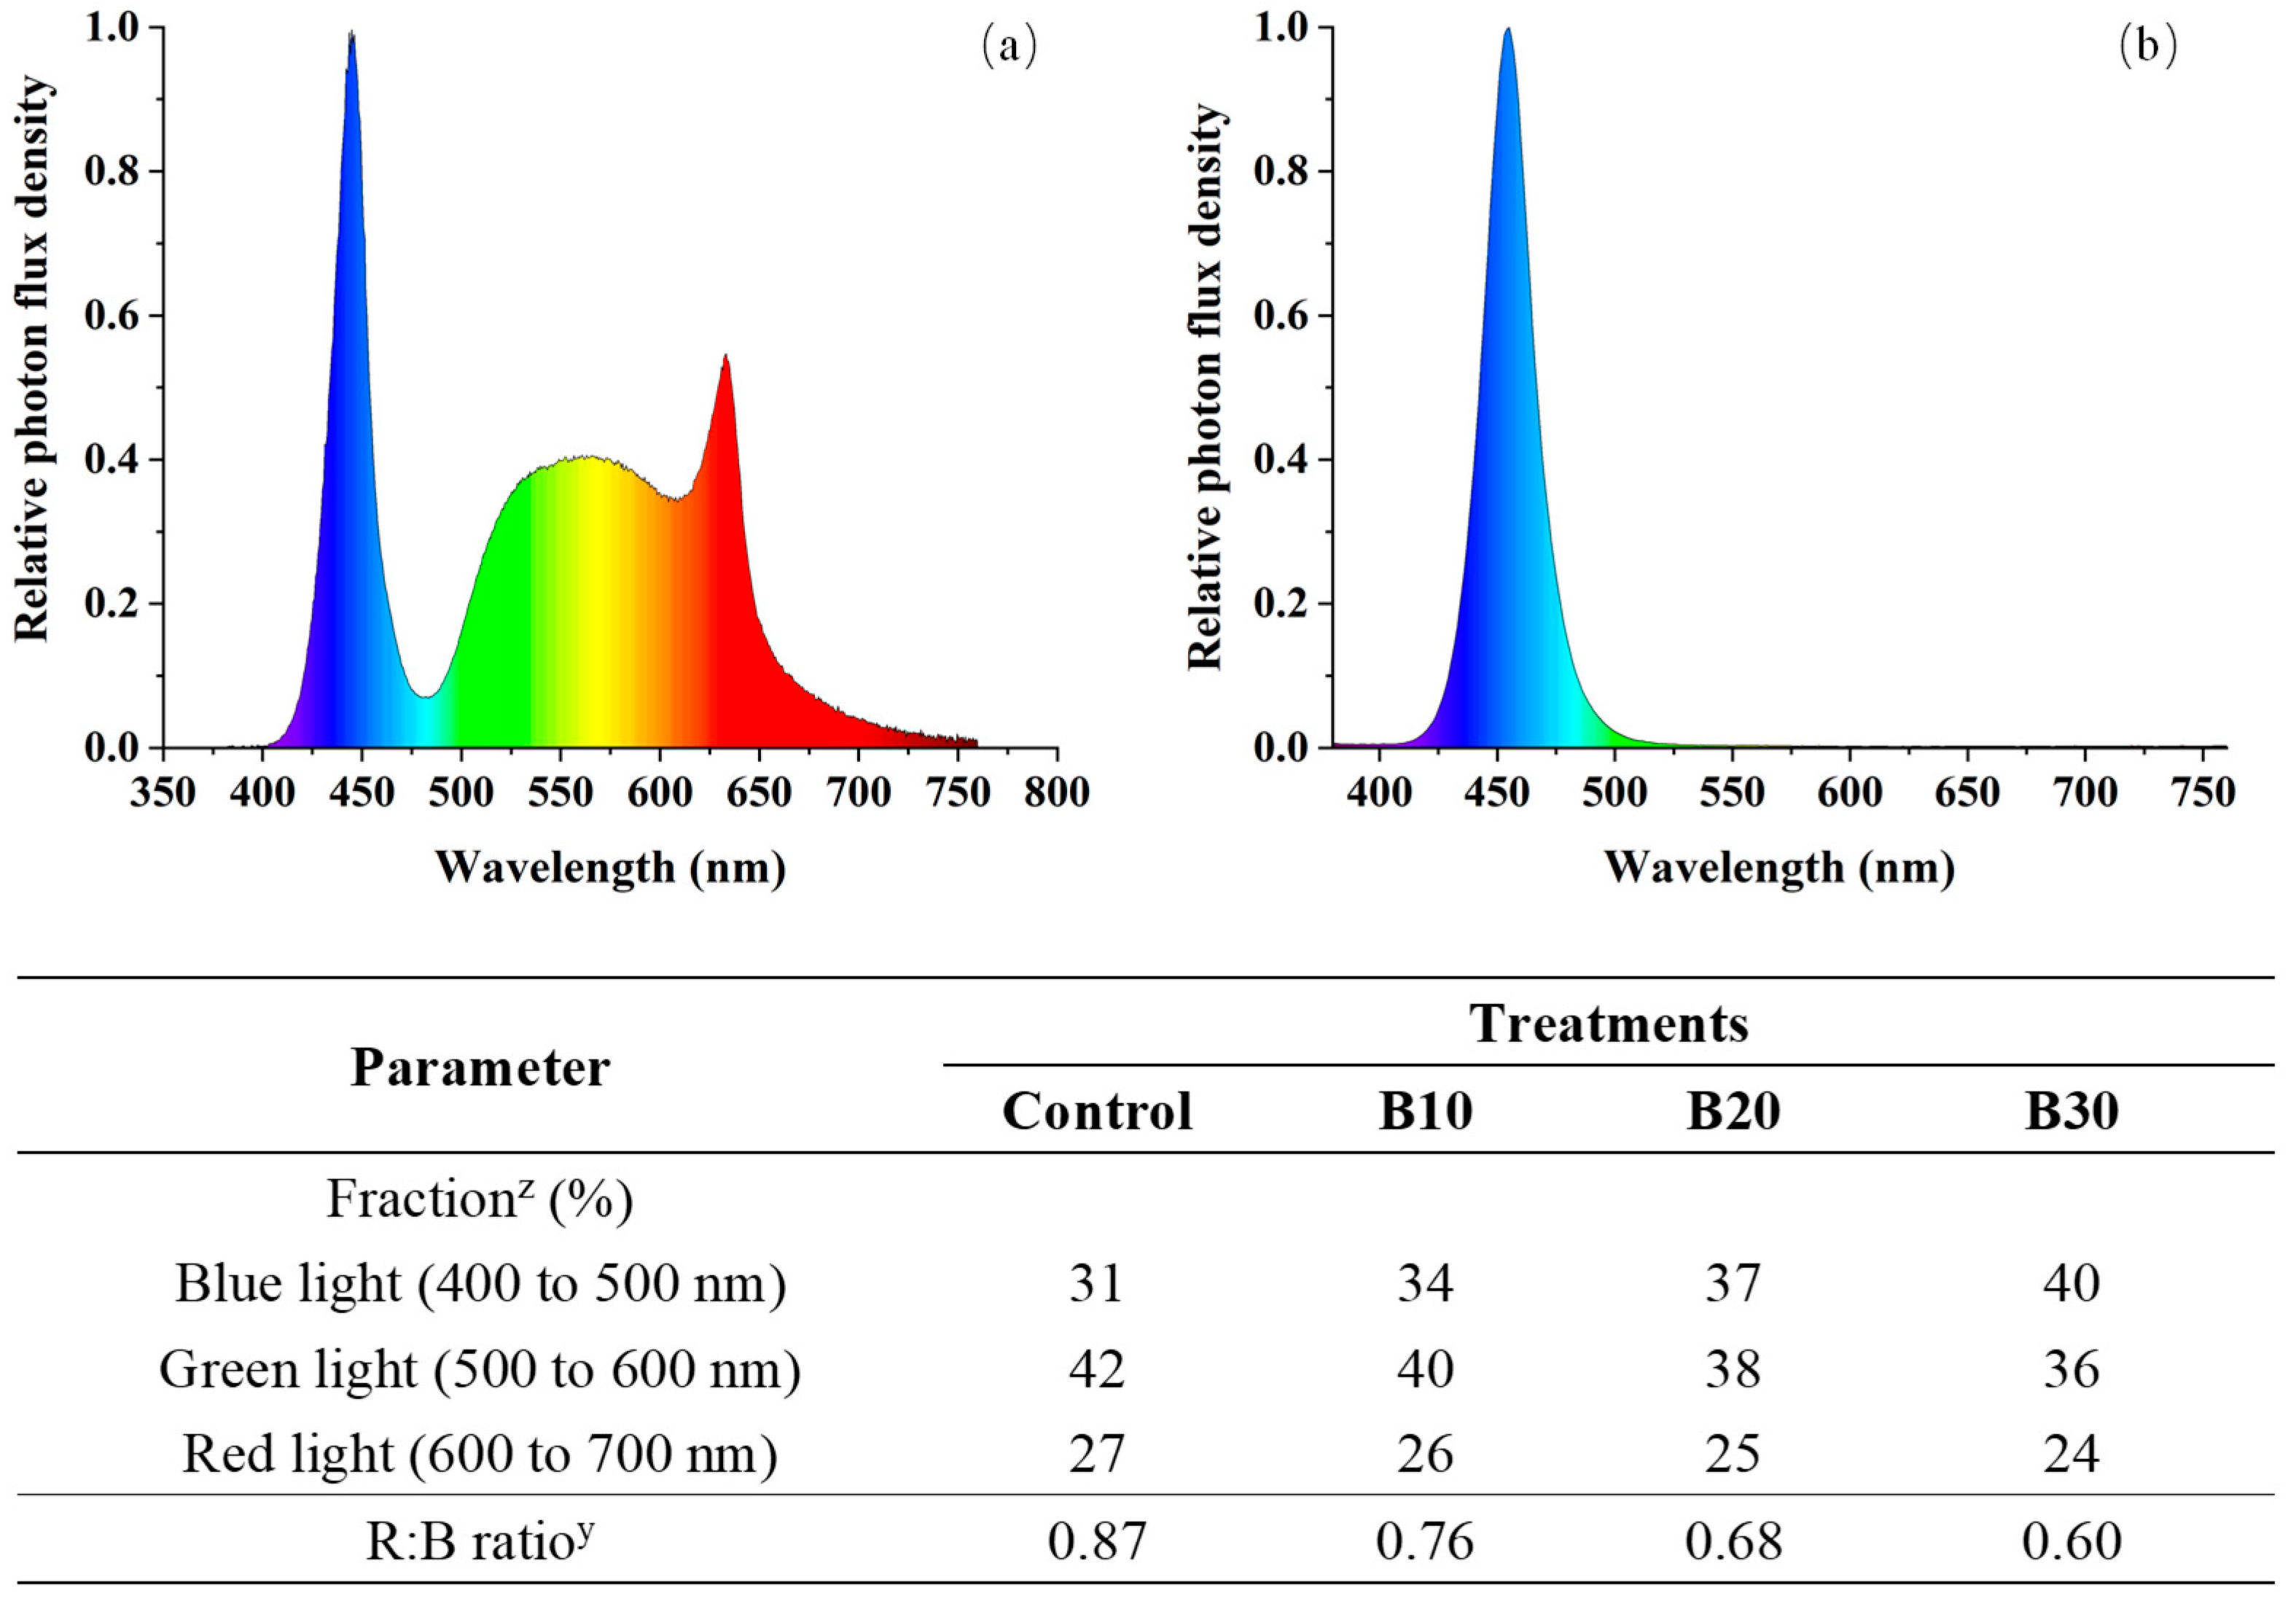
Figure 1. The relative spectral photon flux density and spectral properties of (a) white plus red LEDs (Control) and (b) supplementary blue light treatments (B10, B20, and B30). z The data represent photon flux-based proportions of blue, green, and red light relative to total light intensity (photosynthetic photon flux density, 400–700 nm). y R:B ratio, red to blue light ratio.
Horticulturae 11 01074 g001
Figure 2. Quadratic regression relationships between blue light ratio (%) and morphological traits in celery, including (a) plant height, (b) maximum petiole length, and (c) maximum petiole width. Each data point represents the mean ± standard deviation. Dotted lines indicate fitted quadratic regression models, and equations with R2 values are shown within each panel.
Horticulturae 11 01074 g002
Figure 3. Quadratic regression relationships between blue light ratio (%) and biomass accumulation in celery, including (a) shoot fresh weight, (b) root fresh weight, (c) shoot dry weight, and (d) root dry weight. Each data point represents the mean ± standard deviation. Dotted lines indicate fitted quadratic regression models, and equations with R2 values are shown within each panel.
Horticulturae 11 01074 g003
Figure 4. Quadratic regression relationships between blue light ratio (%) and photosynthetic characteristics in celery, including (a) net photosynthetic rate, (b) transpiration rate, (c) stomatal conductance, (d) intercellular CO2 concentration, and (e) the maximum net photosynthetic rate. Each data point represents the mean ± standard deviation. Dotted lines indicate fitted quadratic regression models, and equations with R2 values are shown within each panel.
Horticulturae 11 01074 g004
Figure 5. Quadratic regression relationships between blue light ratio (%) and photosynthetic pigment contents in celery leaves, including (a) chlorophyll a, (b) chlorophyll b, (c) carotenoids, and (d) total chlorophyll content. Each data point represents the mean ± standard deviation. Dotted lines indicate fitted quadratic regression models, and equations with R2 values are shown within each panel.
Horticulturae 11 01074 g005
Figure 6. Curve of ΔVt of chlorophyll a fluorescence (a), and chlorophyll fluorescence parameters (b) of celery leaves grown under white-red light-emitting diodes (LEDs) and white-red plus blue LEDs (B10, B20, B30, respectively). Celery grown under white-red LEDs only was set as Control. * denoted significant difference at the level of p < 0.05 by Tukey’s honestly significant difference test.
Horticulturae 11 01074 g006
Figure 7. Quadratic regression relationships between blue light ratio (%) and quality-related traits in celery leaves (blue symbols) and petioles (orange symbols), including (a) flavonoids content, (b) total phenols content, (c) soluble sugar content, (d) vitamin C content, and (e) functional yield index. Each data point represents the mean ± standard deviation. Dotted lines indicate fitted quadratic regression models, with equations and R2 values shown in each panel.
Horticulturae 11 01074 g007
Figure 8. Quadratic regression relationships between blue light ratio (%) and antioxidant enzyme activities or antioxidant performance index in celery leaves (blue symbols) and petioles (orange symbols), including (a) catalase (CAT) activity, (b) peroxidase (POD) activity, (c) superoxide dismutase (SOD) activity, and (d) antioxidant performance index. Each data point represents the mean ± standard deviation. Dotted lines indicate fitted quadratic regression models, with equations and R2 values shown in each panel.
Horticulturae 11 01074 g008
Figure 9. Relative response values (G/G0, dimensionless) of electronic nose (E-nose) sensors to volatile organic compounds in leaves (L) and petioles (P) of celery under different supplemental blue light treatments (Control, B10, B20, and B30). The x-axis represents the ten PEN3 sensors (W1C, W5S, W3C, W6S, W5C, W1S, W1W, W2S, W2W, W3S), each sensitive to specific volatile categories such as aromatics, nitrogen oxides, sulfides, and alcohols. Data are shown as means of replicate measurements.
Horticulturae 11 01074 g009
Figure 10. Correlation matrix of volatile organic compound (VOC) sensor responses obtained by electronic nose (E-nose) in celery leaves (L-) and petioles (P-) under different supplemental blue light treatments. Positive correlations are shown in red and negative correlations in blue, with color intensity and circle size proportional to correlation coefficients (r). Sensor codes indicate different VOC categories: W1C (aromatic compounds), W5S (nitrogen oxides), W3C (ammonia and aromatic molecules), W6S (hydrogen), W5C (aromatic and aliphatic molecules), W1S (methane-aliphatic compounds), W1W (sulfides), W2S (alcohols, ketones, aldehydes), W2W (organic sulfur compounds), and W3S (alkanes). Significant correlations are indicated by * p < 0.05 and ** p < 0.01.
Horticulturae 11 01074 g010
Table 1. PEN3 electronic nose sensor and its performance description.
NumberName of SensorDescription of Performance
1W1CAromatic components
2W5SHighly sensitive to nitrogen oxides
3W3CAmmonia, sensitive to aromatic components
4W6SSelective mainly for hydrogen
5W5CAlkane aromatic components
6W1SSensitive to methyl groups
7W1WSensitive to sulfides
8W2SSensitive to alcohols, aldehydes and ketones
9W2WAromatic components, sensitive to organic sulfides
10W3SSensitive to alkanes
Table 2. Principal component analysis of celery under supplemental blue light treatments. Eigenvalues, contribution rates, and cumulative contribution rates are shown for the first three principal components. Treatment scores (PC1–3) and composite scores were calculated from the PCA model.
Principal ComponentEigenvalueContribution Rate (%)Cumulative Contribution Rate (%)ControlB10B20B30
PC134.5059.4859.48−6.40−1.687.720.35
PC 214.2024.4983.973.03−0.532.63−5.12
PC 39.3016.03100.00−1.974.47−0.57−1.92
Composite Score---−3.38−0.415.14−1.35
Disclaimer/Publisher’s Note: The statements, opinions and data contained in all publications are solely those of the individual author(s) and contributor(s) and not of MDPI and/or the editor(s). MDPI and/or the editor(s) disclaim responsibility for any injury to people or property resulting from any ideas, methods, instructions or products referred to in the content.