Abstract
The rhizosphere microbiome, a critical determinant of plant health and productivity, exhibits structure–activity relationships influenced by plant genotype. This study investigated how three tea varieties with distinct phenotypes—Zhongcha 108 (ZC, green leaves), Huangjinya (HJY, chlorophyll-deficient yellow leaves), and Zijuan (ZJ, anthocyanin-rich purple leaves)—modulate the rhizosphere microbiome by integrated metagenomic, transcriptomic, and metabolomic analysis. Results revealed significant differences in rhizosphere bacterial diversity and composition among varieties, driven by differential abundances of Actinobacteria and Proteobacteria. HJY and ZJ exhibited higher bacterial richness and diversity compared to ZC. Root transcriptome profiling identified phenylpropanoid biosynthesis as a central pathway, with differentially expressed genes involved in flavonoid and lignin biosynthesis. Metabolite profiling highlighted varietal differences in root and rhizosphere organic acids and phenylpropanoid derivatives (e.g., hydroxycinnamyl aldehydes, sinapic acid), strongly correlating with microbial community structure. Functional metagenomics indicated that the carbohydrate and amino acid metabolism pathways in rhizosphere bacteria were influenced by root metabolites, further establishing phenylpropanoid partitioning as a keystone driver for microbial niche differentiation. These findings demonstrate that tea varieties shape rhizosphere microbiomes via genotype-specific phenylpropanoid metabolism, offering insights into targeted manipulation of plant–microbe interactions for enhancing tea plant development and tea quality.
1. Introduction
The rhizosphere serves as a crucial reservoir of microbiota, harboring an estimated 1011 microbial cells per gram of soil [1]. Recognized as the plant’s “second genome” and an extended phenotypic manifestation, the rhizosphere microbiome is a major determinant of plant growth and productivity [2]. Extensive research has demonstrated that beneficial microbiota in the rhizosphere contributed to nutrient acquisition, water retention, and the synthesis of growth-promoting hormones [3,4,5]. Additionally, the rhizosphere microbiota regulates the synthesis of secondary metabolites in plants, enhancing the accumulation of bioactive compounds [6,7]. The different compounds produced by various pathways in roots including phenolic compounds, organic acids, sugars, and flavonoids, could selectively stimulate specific groups of beneficial bacteria, fostering their growth and creating distinct microenvironments within the rhizosphere [8].
Plant phenotype-related traits, including nutrient metabolism and hormone synthesis, are closely linked to the recruitment of specific rhizosphere microorganisms [9]. Studies of plant–microbe interactions have shown that plant varieties are able to shape their rhizosphere microbiome, as evidenced by the fact that different plant species host specific microbial communities when grown on the same soil. Biology is indeed undergoing a paradigm shift, where phenotypes are seen as a result of complex interactions resulting from the combined expression of the host and associated microbial genomes. Numerous recent studies have indicated that the microbiome composition and its functional performance are affected by plant species and genotypes within species [10,11,12]. Recent studies, such as those on Populus trichocarpa, have shown that rhizosphere microbiomes diverge among different genotypes, primarily influenced by root-derived metabolites [13]. Pérez-Jaramillo et al. [14] revealed that different rice genotypes could lead to a depletion of bacterial diversity in the rhizosphere. Similarly, studies on barley [15], bean [16], and the common sunflower [17] have revealed that plant genotypes influence microbial diversity in the rhizosphere. While these studies demonstrate that microbial communities in soil changed in response to different plant genotypes or varieties, it is largely unknown how or which drivers among the interactions contributed to these differentiations. The variation in rhizosphere bacterial communities is also affected by root exudates from different exquisite root metabolisms.
The phenylpropanoid biosynthesis pathway is the boundary between the primary and specialized metabolism, producing more than 8000 metabolites contributing to plant development and plant–environment interactions [18]. Plants regulate homeostasis among different branches of phenylpropanoids and related pathways via the regulation of metabolic flux redirection to effectively respond to environmental stimuli and fluctuations [19]. Phenylpropanoid metabolites have been implicated in plant development [20], resistance to both biotic and abiotic stresses [21], microbial attraction [22] and nodulation [23]. Nonetheless, despite considerable insights into plant phenylpropanoid metabolism and its multifaceted roles, its implications for shaping the structure and functions of the rhizosphere microbiome remain unclear.
Tea [Camellia sinensis (L.) O. Kuntze] is the most popular and economic beverage, due to its distinctive fragrance and flavor generated by the leaves of commercially farmed tea plants. As a perennial evergreen with exceptional metabolic diversity (polyphenols, flavonoids, theanine, and organic acids) [24], tea varieties exhibit striking phenotypic variation—from chlorophyll-deficient “Huangjinya” (HJY) to anthocyanin-rich “Zijuan” (ZJ) and the standard green-leaf “Zhongcha108” (ZC) [25]. Notably, while varietal selection drives premium tea production, current research predominantly attributes quality differences to plant genetics, overlooking potential microbiome-mediated effects. Growing evidence suggests that root-associated microbiota can modulate host plant traits through nutrient cycling and metabolite conversion. To address these uncertain issues, this study explores how the phenotypic characteristics of three distinct tea varieties (HJY, ZJ, and ZC) influence their rhizosphere microbiomes. Microbial community profiling, metabolite profiling, and transcription profiling of tea roots were performed. We tried to integrate the chemical basis and molecular mechanism into the plant–microbiome relationship to create specific selective effects on the plant microbiome and regulate plant performance. We hypothesized that (1) the rhizosphere community structure and function differ significantly among tea varieties; (2) phenylpropanoid metabolism serves as a key driver of microbial selection; and (3) key contributors should exist in the interaction between tea plants and the rhizosphere microbiome. The goal is to provide a deeper understanding of plant–microbe interactions in tea and offer insights into how these interactions can be harnessed to improve tea plant development and tea quality.
2. Materials and Methods
2.1. Tea Plant Materials and Experimental Design
The experiment was conducted at the tea plantation of Rizhao ZhongRun Eco-Agricultural Development Company Limited, located in Rizhao City, Shandong Province, China (35°04′ N, 118°25′ E). It belongs to continental monsoon climate zone, with an average annual precipitation of 1048 mm and an average temperature of 12.7 °C. The soil properties were described in our previous study [26]. Three tea plant varieties with distinct phenotypes including “Zhongcha 108” (ZC), “Huangjinya” (HJY), and “Zijuan” (ZJ) were selected for this study (Figure 1A). The cultivation of each variety was designed as three randomly replicated blocks at a density of 75,000 trees per hectare with a 160 cm row spacing and 20 cm interrow spacing. Each block was 90 m2 under the same agricultural management practices. At the time of sampling, the tea plants had been growing for three years, and the average height of tea plants was 0.42 m.
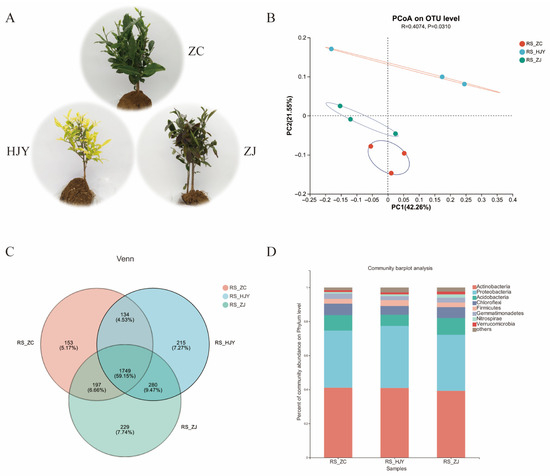
Figure 1.
Phenotypic characteristics of three tea tree varieties: ZC, HJY, and ZJ (A); differences in microbial community composition in the rhizosphere soil among ZC, HJY, and ZJ using principal coordinate analysis (PCoA) at the OTU level (B); Venn diagram of microbial communities in the rhizosphere soil of ZC, HJY, and ZJ at the OTU level (C); and histogram of bacterial composition in the rhizosphere soil of ZC, HJY, and ZJ at the phylum level (D).
2.2. Sample Collection and Processing
Eighteen tea plants from each variety were dug out randomly, ensuring intact root systems on the same day (10 June 2023). The plants were immediately transferred to the laboratory. The rhizosphere soil was collected as described by our previous study [27]. Briefly, the soil tightly attached to the root surface (0~5 mm) was collected after vigorous shaking. Each soil sample was pooled from six randomly selected plants. The rhizosphere soil was homogenized by mixing through a 2 mm sieve to discard plant residue. The roots were rinsed with sterile distilled water. The samples were snap-frozen in liquid nitrogen and stored at −80 °C for subsequent RNA extraction, DNA purification, and metabolite analysis. Six biological replicates were used for root and soil metabolic analyses, and three biological replicates were used for other analyses.
2.3. RNA Extraction, cDNA Library Construction, and RNA-Seq
Root RNA was extracted using TRIzol Reagent (Plant RNA Purification Reagent, Invitrogen, Waltham, MA, USA) according to the manufacturer’s guidelines, and genomic DNA was removed using DNase (TaKaRa, Beijing, China). Then, RNA quality was determined by 5300 Bioanalyser (Agilent, Technologies, Santa Clara, CA, USA) and quantified using the ND-2000 (NanoDrop Technologies, Wilmington, DE, USA). High-quality RNA samples (OD260/280 = 1.8~2.2, OD260/230 ≥ 2.0, RIN ≥ 6.5, 28S:18S ≥ 1.0, and >1 μg) were used for sequencing library construction. RNA purification, reverse transcription, library construction, and sequencing were performed using the Illumina HiSeq™ platform (Illumina, San Diego, CA, USA) according to the manufacturer’s instructions at Shanghai Majorbio Bio-pharm Biotechnology Co., Ltd. (Shanghai, China). The cDNA library construction, RNA-seq, and read mapping were described in our previous study [28]. FC ≥ 2 or FC ≤ 0.5, p value < 0.05, were used to obtain the differentially expressed genes (DEGs) for further analyses. The DEGs were analyzed by Kyoto Encyclopedia of Genes and Genomes (KEGG) pathway enrichment analysis (KOBAS, http://bioinfo.org/kobas, accessed on 16 August 2023). The raw reads were deposited in the NCBI Sequence Read Archive (SRA) under accession number PRJNA1037259.
2.4. DNA Extraction, PCR Amplification, Metagenomic Sequencing, and Related Data Processing
Briefly, DNA from each soil sample was extracted with the E.Z.N.A.® soil DNA Isolation Kit (Omega Bio-tek, Norcross, GA, USA) according to the manufacturer’s instructions. The final DNA concentration and purification were determined by NanoDrop 2000 UV-vis spectrophotometer (Thermo Scientific, Wilmington, DE, USA), and DNA quality was confirmed by 1% agarose gel electrophoresis. PCR amplification of the V5–V7 hypervariable regions of the bacterial 16S rRNA gene were amplified with primers 799F (5′-AACMGGATTAGATACCCKG-3′) and 1392R (5′-ACGGGCGGTGTGTRC-3′) and 799F (5′-AACMGGATTAGATACCCKG-3′) and 1193R (5′-ACGTCATCCCCACCTTCC-3′) by thermocycler PCR system (GeneAmp 9700, ABI, Los Angeles, CA, USA). Amplified products were detected by 2% agarose gel electrophoresis and recovered from the gel using the AxyPrep DNA gel extraction kit (Axygen Biosciences, Union City, CA, USA) and quantified using QuantiFluor™-ST (Promega, Madison, WI, USA), according to the manufacturer’s protocol. Purified amplicons were pooled in equimolar and paired-end sequenced on an Illumina MiSeq platform (Illumina, San Diego, CA, USA) according to the standard protocols by Majorbio Bio-Pharm Technology Co., Ltd. (Shanghai, China). Raw FASTQ files were demultiplexed with a perl script, followed by quality filtering with fastp (version 0.19.6) and merging with FLASH (version 1.2.7). High quality sequences were clustered into operational taxonomic units (OTUs) at 97% sequence similarity using UPARSE (version 11.0.667). The most abundant sequence was selected as a representative sequence for each OTU. The OTU table was manually filtered, i.e., chloroplast sequences in all samples were removed. To minimize the effects of sequencing depth on alpha and beta diversity measures, the number of 16S rRNA gene sequences from each sample were rarefied by the minimum number of sample gene sequences. Taxonomic assignment of OTU representative sequences was performed using the RDP Classifier (version 11.5) against the SILVA (version 138.2) database, with a confidence threshold of 0.7. The raw reads were deposited into the NCBI Sequence Read Archive (SRA) under accession number PRJNA1037027.
For metagenomic sequencing DNA extract was fragmented to an average size of about 350 bp using Covaris M220 (Gene Company Limited, Shanghai, China) for paired-end library construction. Paired-end library was constructed using TruSeqTM DNA Sample Prep Kit (Illumina, San Diego, CA, USA). Adapters containing the full complement of sequencing primer hybridization sites were ligated to the blunt end of fragments. Paired-end sequencing was performed on Illumina HiSeq4000 platform (Illumina Inc., San Diego, CA, USA) at Majorbio Bio-Pharm Technology Co., Ltd. (Shanghai, China) using HiSeq 3000/4000 PE Cluster Kit and HiSeq 3000/4000 SBS Kit according to the manufacturer’s instructions (www.illumina.com, accessed on 26 August 2023). Adapter sequence was stripped from the 3′ and 5′ end of paired-end Illumina reads using SeqPrep (https://github.com/jstjohn/SeqPrep, accessed on 26 August 2023). Low-quality reads (length < 50 bp or with a quality value < 20 or having N bases) were removed by Sickle (https://github.com/najoshi/sickle, accessed on 26 August 2023). Metagenomics data were assembled using MEGAHIT (https://github.com/voutcn/megahit, version 1.1.2, accessed on 26 August 2023), which makes use of succinct de Bruijn graphs. Contigs with a length ≥ 300 bp were selected as the final assembling result, and then the contigs were used for further gene prediction and annotation. Open reading frames (ORFs) were predicted from the assembled contigs using MetaGene (https://metagene.nig.ac.jp/metagene/metagene.html, accessed on 27 August 2023). Predicted ORFs longer than 100 bp were subsequently translated into amino acid sequences using EMBOSS (version 6.6.0) with the standard NCBI genetic code translation table (http://www.ncbi.nlm.nih.gov/Taxonomy/taxonomyhome.html/index.cgi?chapter=tgencodes#SG1, accessed on 27 August 2023). A non-redundant gene catalog was then generated from the resulting amino acid sequences with CD-HIT [4] (v4.6.1), using thresholds of 90% sequence identity and 90% coverage. Regarding taxonomic annotation, representative sequences from the non-redundant gene catalog were aligned against the NR database using Diamond (https://github.com/bbuchfink/diamond, version 0.8.35, accessed on 27 August 2023) under an e-value cutoff of 1 × 10⁻⁵. Functional annotation was performed by aligning the same sequences against the eggNOG database for Clusters of Orthologous Groups (COG) assignment and against the Kyoto Encyclopedia of Genes and Genomes (KEGG) database (http://www.genome.jp/kegg/, accessed on 27 August 2023) for pathway annotation, both employing Diamond (https://github.com/bbuchfink/diamond, version 0.8.35, accessed on 27 August 2023) with the same e-value threshold of 1 × 10⁻⁵. Sequence data associated with this project were deposited in the NCBI Sequence Read Archive (SRA) under accession number PRJNA1204460.
2.5. GC-MS Analysis
Tea roots (22 mg) were ground after adding 0.5 mL of pre-cooled (at −20 °C) acetonitrile: isopropanol: water (3:3:2, v/v/v) mixed solution. After 5 min of sonication (40 Hz), samples were subsequently centrifuged at 20,000× g at 4 °C for 2 min. Then, 400 μL of dried-frozen supernatant solution was dissolved in 80 μL of 20 mg/mL MEOX solution and incubated at 60 °C for 60 min. Finally, 100 μL BSTFA-TMCS (99:1) reagent was added and centrifuged at 20,000× g for 3 min after reacting at 70 °C for 90 min. The resulting 100 μL supernatant was injected into an Agilent 7890A/5975C GC–MS system (Agilent, Santa Clara, CA, USA). Gas chromatography was performed on a DB-5MS capillary column (30 m × 250 μm i.d., 0.25 μm film thickness, Agilent J &W Scientific, Folsom, CA, USA). Purified helium (99.999%) was utilized as the carrier gas at a constant flow rate of 1 mL/min. One microliter of sample was injected in split mode in a 1:10 split ratio by the autosampler. The injection temperature was 280 °C. The ion source temperature and transfer line temperature were 320 °C and 230 °C, respectively. The column temperature was 50 °C for 0.5 min, increased to 320 °C at a rate of 15 °C/min, and stayed at 320 °C for 9 min. The spectra were acquired in a range from 35 to 500 atomic mass units (amu) under the electron impact (EI) mode at 70 eV.
A total of 5 g of freeze-dried rhizosphere soils was dissolved in 50 mL methanol (80%, pre-cooled at −20 °C) for metabolite extraction. After centrifugation (20,000× g, 4 °C, and 10 min), 100 μL of methoxyamine pyridine solution (15 mg·mL−1) was added to the supernatant. The mixture was vortexed (30 Hz) vigorously for 30 s and derivatized at 37 °C for 120 min. Subsequently, 60 μL of N,O-bis-(trimethylsilyl) trifluoroacetamide (BSTFA) containing 1% trimethylchlorosilane (TMCS) was introduced, followed by a 90 min incubation at 37 °C. The derivatized samples were re-centrifuged (20,000× g, 4 °C, and 10 min) prior to GC-MS analysis. Analysis was performed on an Agilent 7890A/5975C GC-MS system equipped with a HP-5MS capillary column (30 m × 250 μm I.D., 0.25 μm film thickness; 5% phenyl/95% methylpolysiloxane). Samples were injected in randomized order with quality control (QC) samples interspersed to monitor system stability and analytical reproducibility. Chromatographic separation employed helium carrier gas at a 1.0 mL·min−1 flow rate. Six biological replicates were analyzed in duplicates as technical repeats.
2.6. LC-MS Analysis
Tea roots (200 mg) and rhizosphere soil (5 g) were ground after the addition of 0.6 mL of MeOH (containing 2-chloro-phenyl-propionic acid, 4 ppm) (precooled at −20 °C), respectively. Samples were subsequently centrifuged at 20,000× g at 4 °C for 10 min after 15 min sonication (40 Hz) extraction at room temperature. The supernatant was filtered through a 0.22 µm membrane and detected by a Vanquish UHPLC System and Thermo Orbitrap Exploris 120 (Thermo Fisher Scientific, Waltham, MA, USA). Chromatography was performed on an ACQUITY UPLC® HSS T3 (150 × 2.1 mm, 1.8 µm) (Waters, Milford, MA, USA) with the column maintained at 40 °C. The outputs obtained a flow rate of 0.25 mL/min and an injection volume of 2 μL. The mobile phases consisted of (C) 0.1% formic acid in acetonitrile (v/v) and (D) 0.1% formic acid in water (v/v). More information was described in detail by Zelena et al. [29] and Want et al. [30].
2.7. Statistical Analysis
The microbial community and function were analyzed using the free online platform of the Majorbio Cloud Platform (www.majorbio.com, accessed on 16 August 2023). Based on the OTUs information, Rarefaction curves and alpha-diversity indices (observed OTUs, Chao1, Shannon, and Heip’s evenness) were generated with Mothur (version 1.30.1). Similarities and differences among samples were visualized using Venn diagrams constructed with jvenn (http://jvenn.toulouse.inra.fr/app/index.html, accessed on 16 August 2023). The relative abundances of bacterial communities at the phylum and OTU levels were illustrated using stacked bar plots generated in R (version 3.3.1), wherein taxa with less than 1% abundance across all samples were grouped as “Others.” Principal coordinate analysis (PCoA) based on the Bray–Curtis distance was employed to estimate the beta diversity using Vegan v2.5-3 package in R (version 3.3.1). The PERMANOVA test was used to assess the percentage of variation explained by the treatment along with its statistical significance using Vegan v2.5-3 package in R (version 3.3.1). Analysis of similarities (ANOSIM) and Bray–Curtis metrics corroborated the distinct differentiation of microbial communities using Vegan package in R (version 3.3.1). One-way ANOVA was used to assess the significant differences among the different groups, with p < 0.05 being considered statistically significant using SPSS (version 19.0; SPSS, Chicago, IL, USA). The metabolomic analyses included a pie chart, partial least squares discriminant analysis (PLS-DA), Kyoto Encyclopedia of Genes and Genomes (KEGG), and metabolic pathway identification. According to pathway analysis on Metaboanalyst 5.0 (https://www.metaboanalyst.ca/, accessed on 30 October 2021) and the KEGG metabolic database (https://www.genome.jp/kegg/, accessed on 28 August 2023), the metabolic pathway was analyzed. The correlation of the microbiota–metabolite was calculated by cor () function in R (version 3.3.1), and the statistical test was adjusted by p values. The corresponding p values were also calculated using the cor.test function. Transcriptome sequencing and data processing were carried out by the methods described by Tian et al. [31].
3. Results
3.1. Tea Varieties Influence the Diversity and Composition of Rhizosphere Microbiota
Regarding the rhizosphere samples, 587,211 × 2 reads were recovered after quality filtering, with an average length of 377 bp. A total of 2957 bacterial operational taxonomic units (OTUs) were constructed using an identity threshold of 97% sequence similarity. The Good’s coverage index of the observed OTUs (98.17%) and the rarefaction curves with distinct asymptotes indicated that sequencing depth was sufficient for the samples analyzed (Figure S1). Alpha diversity within each sample was estimated based on the richness index (Sobs), diversity index (Shannon), and evenness index (Heip). (Figure S2). The α-diversity of rhizosphere bacterial communities revealed differentiated characteristics among different tea varieties. According to the results of the Sobs index at the OTU level, the bacterial community richness of HJY and ZJ was higher than that of the counterparts of ZC, while no statistically significant differences were observed between HJY and ZJ. Additionally, the bacterial community diversity, represented by the Shannon index, was significantly higher in ZJ compared to ZC and HJY, whereas no significant statistical differences were observed between ZC and HJY. Regarding bacterial community evenness, as indicated by Heip’s metric, HJY exhibited the lowest evenness compared to its counterparts of ZC and ZJ. The results suggested that tea varieties influence the diversity and evenness of rhizosphere bacterial communities. ZJ exhibited a more significant effect on bacterial diversity and evenness. These findings provide important insights into the characteristics of rhizosphere microbial communities associated with different tea plant varieties.
A principal coordinate analysis (PCoA) was employed using the Bray–Curtis distance to assess the beta diversity of the rhizosphere bacterial communities (Figure 1B). A more heterogeneous structure of bacterial communities was observed among HJY than that in ZJ and ZC. The rhizosphere bacterial communities of these different varieties were significantly separated with the first and the second principal coordinate axes, explaining 42.26% and 21.55% of the variation, respectively. Moreover, the analysis of similarities and Bray–Curtis metrics corroborated the distinct differentiation of bacterial communities associated with different tea varieties (R = 0.4074, p = 0.0310). These results provide robust evidence for the significant alteration in bacterial community composition and structure among the rhizospheres of different tea varieties, highlighting the importance of plant varieties in shaping the rhizosphere microbiome.
A Venn diagram illustrated an extensive taxonomic overlap between the microbiota in these three tea varieties (Figure 1C). A total of 1749 similar OTUs (59.15%) were observed in ZC, HJY, and ZJ, which represented 72.99% similar phyla. There were 16.74% and 17.21% exclusive OTUs in HJY and ZJ, respectively, among HJY vs. ZC and ZJ vs. ZC. The bacterial community bar plot analysis showed that the most abundant bacterial phyla were Actinobacteria, Proteobacteria, Acidobacteria, Chloroflexi, and Firmicutes, regardless of the tea variety (Figure 1D). However, differences were observed among them to some extent. A total of 97 OTUs (31.96% Proteobacteria, 26.09% Actinobacteria, 20.65% Acidobacteria, and 10.31% Chloroflexi) and 82 OTUs (37.81% Proteobacteria, 20.73% Actinobacteria, 14.63% Acidobacteria, and 9.76% Chloroflexi) showed significantly differential OTUs in ZC vs. HJY and ZC vs. ZJ, respectively (Table S1). The top ten OTUs were selected in each group including ZC vs. HJY and ZC vs. ZJ (Figure 2). Generally, most of the differentially abundant bacterial taxa were assigned to the Actinobacteria and Proteobacteria. In ZC vs. HJY, seven differential OTUs were taxonomically assigned to Actinobacteria, comprising the genera Acidothermus, Gendermatophilus, Oryzihumus, Microtrichales, and norank_f_67_14; two OTUs were assigned to the Proteobacteria, comprising the genera Methylophilaceae and MND1; and one OTU was assigned to Gemmatimonadetes sp. Among them, OTU 3737 (Actinobacteria, Geodermatophilus sp.) and OUT 295 (Proteobacteria, Methylophilaceae sp.) were more abundant in HJY compared with ZC, whereas other OTUs were more abundant in ZC. In ZC vs. ZJ, eight differential OTUs were taxonomically assigned to Actinobacteria, comprising the genera Acidothermus, Jatrophihabitans, Gaiellales, Actinobacteria, Conexibacter, and norank_f_67_14; two OTUs were assigned to Proteobacteria, comprising Pseudolabrys sp. and Rhodanobacter sp. Among them, OTU 2719 (Actinobacteria, Actinobacteria sp.) was more abundant in ZJ than that in ZC, whereas other OTUs were more abundant in ZC. Notably, most of the differential OTUs had more abundant ZC than that in HJY and ZJ. The results of the ANOSIM and Bray–Curtis metrics supported significant differences in bacterial community composition between different tea varieties. Furthermore, analysis at the phylum level revealed significant differences in the abundance of Actinobacteria and Proteobacteria, with some specific taxa showing significant variation in abundance among different tea varieties. These findings provide valuable insights into the diversity and compositional differences in rhizosphere bacterial communities among different tea varieties.
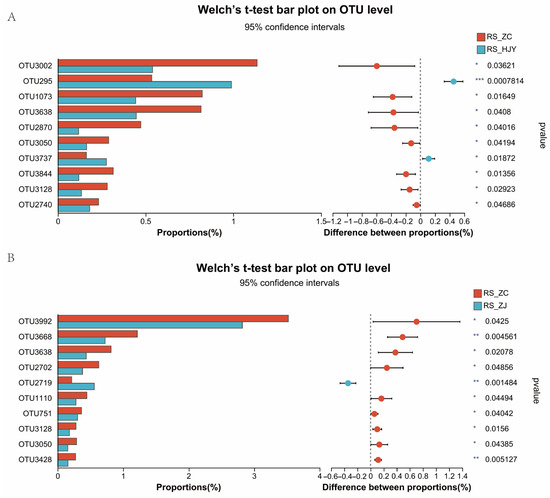
Figure 2.
Comparison of the top ten OTUs among different tea varieties. (A) The comparison of OTUs in RS_ZC vs. RS_HJY; (B) The comparison of OTUs in RS_ZC vs. RS_ZJ. Extended error bar plot showing the top ten differentially abundant OTUs that had significant differences between RS_ZC and RS_HJY and between RS_ZC and RZ_ZJ. Positive differences in mean relative abundance indicate OTUs overrepresented in the RS_ZC sample, while negative differences indicate greater abundance in the RS_HJY or RS_ZJ samples. Asterisks represent significant differences (* 0.01 < p ≤ 0.05, ** 0.001 < p ≤ 0.01, *** p ≤ 0.001).
3.2. Comparative Analyses of the Root Transcriptomes of Three Tea Varieties Using RNA-Seq
The root transcriptomes of the three tea varieties were compared to uncover their molecular regulation in shaping the surrounding microenvironment. A total of ~786 million raw reads were obtained from three samples, and each sample had 71.65~101.14 million raw reads (Table S2). After filtering out low-quality reads, a total of ~776 million clean reads were obtained, an average of 89.17% of which could be mapped to the Camellia sinensis reference genome (http://tpia.teaplant.org/download.html, accessed on 26 August 2023). The percentage of clean reads from each sample that could be mapped ranged from 86.39% to 91.19%. Transcriptome sequencing data were analyzed to obtain the differentially expressed genes (DEGs) (FC ≥ 2 or FC ≤ 0.5, p value < 0.05) for further analyses by pairwise comparisons. A total of 2896 DEGs, with 1206 being up-regulated and 1690 being down-regulated, were identified in the ZC vs. HJY comparison. A total of 4593 DEGs, with 1917 being up-regulated and 2676 being down-regulated, were identified in the ZC vs. ZJ comparison. Then, the enriched DEGs were subjected to a KEGG analysis for identification of the metabolic pathway (Figure 3A,B). The results of the KEGG analysis showed that “plant-pathogen interaction (including 75 enriched genes)”, “phenylpropanoid biosynthesis (including 47 enriched genes)”, “monoterpenoid biosynthesis (including 30 enriched genes)”, and “cyanoamino acid metabolism (including 15 enriched genes)” were the enriched pathways in the ZC and HJY comparison. “Plant-pathogen interaction (including 129 enriched genes)”, “phenylpropanoid biosynthesis (including 74 enriched genes)”, and “monoterpenoid biosynthesis (including 41 enriched genes)” were the enriched pathways in the ZC and ZJ comparison. “Plant-pathogen interaction (including 110 enriched genes)”, “phenylpropanoid biosynthesis (including 63 enriched genes)”, and “indole alkaloid biosynthesis (including 8 enriched genes)” were the significantly enriched pathways in the HJY and ZJ comparison. Notably, “phenylpropanoid biosynthesis” in ZC vs. HJY and ZC vs. ZJ was a distinctly common pathway, which was speculated to be the dominate contributor to the differential rhizosphere bacterial communities, except for the differential hereditary characteristics among these three varieties. By comparing the root transcriptomes of three tea varieties, DEGs were significantly enriched in the pathways of phenylpropanoid biosynthesis, suggesting that these pathways may play crucial roles in modulating the rhizosphere microenvironment of tea plants.
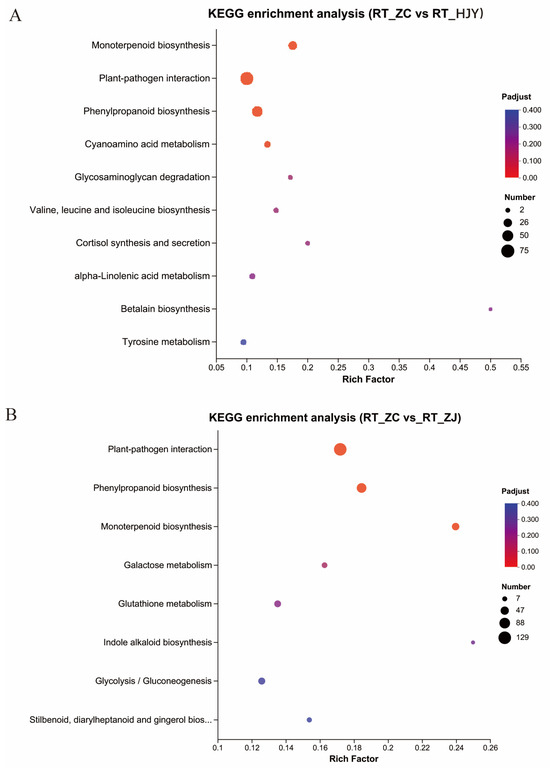
Figure 3.
The enriched metabolomic pathways in the roots by analyzing DEGs in RS_ZC vs. RS_HJY (A) and RS_ZC vs. RS_ZJ (B).
3.3. An Integrated Analysis of Enriched KEGG Pathways in the Roots and Rhizosphere Soil of Three Tea Varieties
The differential gene expression in roots altered the microbial and metabolic properties in rhizosphere soil. A GC-MS analysis was conducted to explore the potential associations between altered microbial communities in the rhizosphere and metabolite production in tea plants. A total of 369 and 514 metabolites were detected in the root and rhizosphere soils, respectively (Table S3). These compounds were composed of organic acids, amino acids, fatty acids, polyols, sugars, phosphoric acids, amines, nucleotides, and others (Figure 4A1,A2). Among these metabolites, organic acids were the most abundant substance constituting 26% and 30% in roots and rhizosphere soils, respectively, followed by amino acids (17% in roots and 6% in rhizosphere soil) and fatty acids (6% in roots and 3% in rhizosphere soil). Partial least squares discriminant analysis (PLS-DA) score plots demonstrated that the metabolites in the roots and the rhizosphere soil were statistically separated by different tea varieties (Figure 4B1,B2). The results showed pronounced alterations of metabolites in HJY and ZJ compared with that in the control sample (ZC). In the roots, 57% (55 to 97) of organic acids, 57% (35 to 61) of amino acids, and 38% (9 to 24) of fatty acids showed significant variation among different tea varieties in at least one comparison between the two root groups. In the rhizosphere soil, 35% (54 to 154) of organic acids, 28% (8 to 29) of amino acids, and 31% (5 to 16) of fatty acids showed significant variation among different tea varieties in at least one comparison between two rhizosphere groups (Table S3). Among these metabolites, eight organic acids (4-pyridoxic acid, glutaric acid, 1,2-dicapryl-Sn-glycero-3-phosphocholine, oxoglutaric acid, nicotinic acid, 5-methylbarbiturate, pyruvic acid, 3-hydroxyphenylacetic acid, 4-hydroxybenzoic acid, 2-ketobutyric acid, 5-hydroxyindoleacetic acid, and taurine), one fatty acid (heptanoic acid), and no amino acids were observed to be distinctly different among these tea varieties.
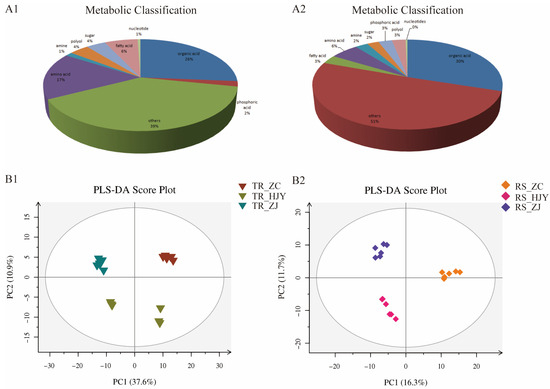
Figure 4.
Pie chart of metabolite classification in roots (A1) and in rhizosphere soil (A2), and PLS-DA score plots for metabolic profiling analysis in roots (B1) and rhizosphere soil (B2). The score of variation explained by each principal component is indicated on the axes. Each point corresponds to a plant sample, and different colors indicate the different tea varieties.
Subsequently, these differentially abundant metabolites in roots and rhizosphere soil were subjected to a KEGG analysis for identification of the metabolic pathway (Figure 5). Flavonoids and other phenylpropanoids are synthesized from phenylalanine. Erythose-4-phosphate, produced from the oxidative pentose phosphate pathway (OPPP) and phosphoenolpyruvate from glycolysis, are precursors for the shikimate pathway, which provides phenylalanine for phenylpropanoid metabolism. General phenylpropanoid metabolism begins with phenylalanine and involves the activity of 4-coumaroyl CoA ligase (4CL) to form p-coumaroyl CoA, which is the intermediate for the various branches of phenylpropanoid metabolism. Consistent with the result of enriched DEGs in roots, there were a series of metabolites involved in the branches of phenylpropanoid biosynthesis-related pathways, including phenylalanine metabolism and flavonoid biosynthesis. In the rhizosphere soils, more differential compounds were largely enriched in carbon and nitrogen metabolism-related pathways, including C5-branched dibasic acid metabolism, 2-oxocarboxylic acid metabolism, and tryptophan metabolism (Table S3 and Figure S3). It was speculated that the variation in root metabolites caused by phenylpropanoid biosynthesis and its related pathway provided various compounds. The different availabilities of these compounds served as carbon, nitrogen, or signal resources for microbial activities, which eventually drove the variation in the tea plant–microbiota interactions.
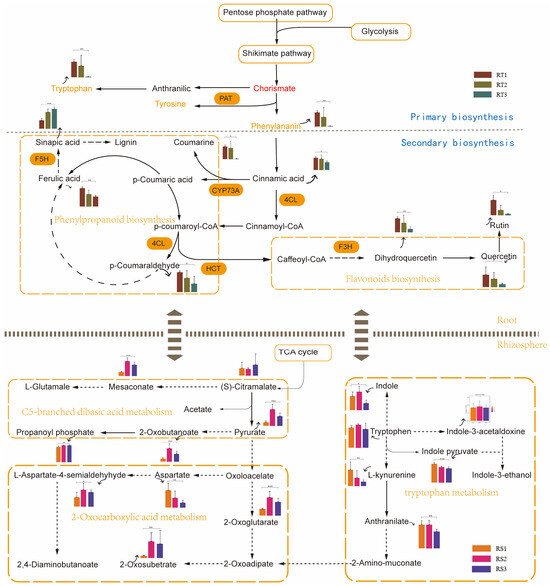
Figure 5.
Comprehensive KEGG analysis based on differentially abundant metabolites in roots and rhizosphere soil and the enriched DEGs in roots. The bar graph shows the relative content of differentially abundant metabolites in roots and rhizosphere soils. Asterisks represent significant differences (* represents p < 0.05, ** represents p < 0.01, *** p ≤ 0.001).
3.4. The Relationship Between Differential Bacterial Genera and Differential Root Metabolites Among Three Tea Varieties
To decipher the above speculation, the relationship between the top 20 differential bacterial genera and the differential root metabolites in the most significantly enriched pathways was studied. As shown in the heatmaps, the differential bacteria among ZC vs. HJY and ZC vs. ZJ had different degrees of correlation with the metabolites (Figure 6A,B). All differentially abundant metabolites, including hydroxycinnamyl aldehyde, ferulic acid, p-coumaraldehyde, and sinapic acid, produced in the phenylpropanoid biosynthesis pathway, and dihydroquercetin and rutin, produced in the flavonoid biosynthesis pathway, had strong correlations with differential bacteria genera among ZC vs. HJY and ZC vs. ZJ. Sinapic acid tended to play negative roles in the recruitment of differential bacteria compared with the other compounds. Methylophilaceae in ZC vs. HJY and Pla4 lineage, ADurb.Bin063-1, Desulfarculaceae, and Actinobacteria in ZC vs. ZJ tended to be negatively correlated with the differentially abundant metabolites. Notably, no significant roles of quercetin were found in ZC vs. HJY, but significant roles of quercetin were found in ZC vs. ZJ
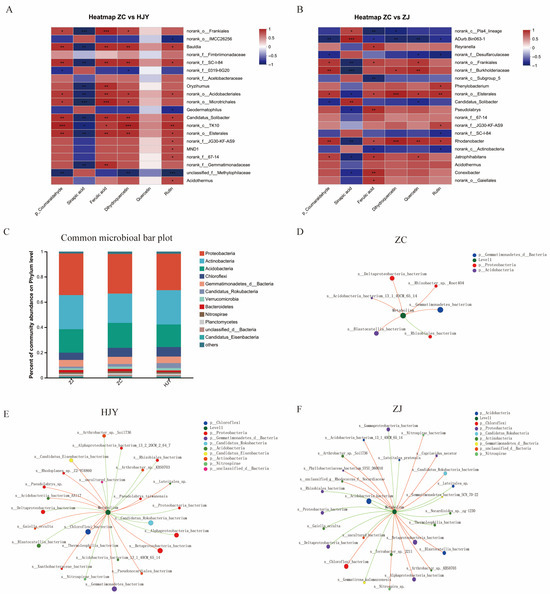
Figure 6.
Heatmap between the top 20 differential bacterial genera and the differential root metabolites in the most significant enriched pathways among RS_ZC vs. RS_HJY (A) and RS_ZC vs. RS_ZJ (B); the microbial composition in the rhizosphere soil of ZC, HJY, and ZJ with an abundance of OTUs greater than 1 in each sample (C); and correlation network analysis between microbial communities and differentially abundant metabolites in phenylpropanoid biosynthesis and flavonoid biosynthesis ZC (D), HJY (E), and ZJ (F). Asterisks represent significant differences (* 0.01 < p ≤ 0.05, ** 0.001 < p ≤ 0.01, *** p ≤ 0.001).
3.5. Comparison of Functional Attributes of Root-Associated Bacterial Communities Among Three Tea Varieties
The functional attributes of the rhizosphere bacteria among the three tea varieties were analyzed by soil metagenomes. Metagenomic analysis showed significant differences were observed in rhizosphere microbial functions among these rhizosphere soils. The analysis of metagenomes showed that the top three functional capacities of the rhizosphere bacteria were related to carbohydrate metabolism, amino acid metabolism, and energy metabolism. Then we focused on the function of the common bacterial communities in the rhizosphere soil. The abundance of OTU greater than one in each sample was defined as communities, including 14,688 species belonging to bacteria (Figure 6C). A correlation network analysis was constructed to obtain interrelationships between microbial communities and functions, and microbial communities and differentially abundant metabolites in phenylpropanoid biosynthesis and flavonoid biosynthesis. Based on the results above, C5-branched dibasic acid metabolism, 2-oxocarboxylic acid metabolism (TCA cycle, arginine biosynthesis, glycine, and serine and threonine metabolism), and tryptophan metabolism in rhizosphere soil were selected as the potential channel in the plant–microbiome interaction. We found that the functional attributes of common bacterial communities among the three tea varieties on these metabolisms in soil were changed, which showed different degrees of correlation (Figure 6D–F). In ZC, the degrees in the correlation network for C5-branched dibasic acid metabolism, the TCA cycle, arginine biosynthesis, glycine, serine and threonine metabolism, and tryptophan metabolism were 8, 6, 6, 35, and 35, respectively. In HJY, the degrees in the correlation network for C5-branched dibasic acid metabolism, the TCA cycle, arginine biosynthesis, glycine, serine and threonine metabolism, and tryptophan metabolism were 14, 25, 25, 25, and 14, respectively. In ZJ, the degrees in the correlation network for C5-branched dibasic acid metabolism, the TCA cycle, arginine biosynthesis, glycine, serine and threonine metabolism, and tryptophan metabolism were 16, 6, 27, 27, and 27, respectively. Compared with ZC, common bacteria in HJY and ZJ had a stronger correlation with carbon-related metabolisms (C5-branched dibasic acid metabolism, the TCA cycle, and arginine biosynthesis) in the rhizosphere soil. We can conclude that the different responses of common bacterial communities to the metabolites of phenylpropanoid biosynthesis-related pathways caused functional variation in carbohydrate metabolism and tryptophan metabolism.
4. Discussion
In nature, plants are exposed to a broad array of microbes in the soil [32]. The rhizosphere microbiome has been reported to be closely linked to the major functions of the host plant, such as nutrition acquisition, plant-growth promotion, abiotic and biotic stress tolerance, and disease suppression [3,4,5,6]. Therefore, the rhizosphere microbiome not only enhances the plant’s fitness but also provides microorganisms with sustainable carbon and energy sources. Advanced scientific knowledge of the rhizosphere microbiome could be applied to develop effective plant microbiome tools, prebiotics, and integration of the two to improve targeted benefits. Although most research has focused more on ideal model organisms such as Arabidopsis thaliana and Echinacea purpurea, the outputs obtained can help us to further understand the communications between the interacting partners of agriculturally important plants in the future and facilitate the development of the potential approaches to manipulate plant–microbiome interactions with predictive outcomes.
The tea varieties studied in this research displayed different leaf colors, which were associated with significant diversity and compositional differences in their rhizosphere bacterial communities. Numerous studies have demonstrated that recruitment of microbiota to the rhizosphere varieties among plant varieties [2,13,14]. The rhizosphere microbiome, considered as an extended phenotype of the plant genome, is closely linked to plant varieties. Different plant varieties have different abilities to recruit and sustain a complex bacterial community network in the rhizosphere, with evidence that the secretion of metabolites including sugars, amino acids, organic acids, and phenol from plant roots is a direct trigger [33]. Regardless of the tea variety, the most abundant bacterial phyla were Actinobacteria, Proteobacteria, Acidobacteria, Chloroflexi, and Firmicutes; the most differential bacteria also occurred in these bacterial communities. Consistent with our findings, Kavamura et al. [34] found that the abundances of Actinobacteria, Bacteroidetes, and Proteobacteria were changed among eight wheat cultivar soils by analysis of 16S rRNA gene sequences. Correspondingly, the predicted microbial functions were also changed between the tall cultivars and semidwarf cultivars. Metagenomic analysis of the Fusarium oxysporum (Fox)-resistant variety of the common bean revealed a more complex rhizosphere bacterial community compared to susceptible varieties [35].
Compared with the normal green leaf tea variety ZC, the yellow leaf variety HJY and purple leaf variety ZJ changed the microbial composition, especially for Acidobacteria, Actinobacteria, and Proteobacteria. Acidobacteria is one of the most widespread and abundant bacterial phyla on the planet, accounting for approximately 5–70% of the soil microbial populace [36]. The pangenomic profiles of Acidobacteria indicate that they play a role in various metabolic pathways [37]. Belova et al. [38] showed that Acidobacteria could degrade various carbohydrate polymers with the capacity to encode related enzymes including alcohols, starches, and other metabolic intermediates. Actinobacteria have a potential role in promoting tea crop health. Research showed that forty-six Actinobacteria from thirteen genera and eleven families were identified from tea cultivars. These strains have a high metabolic ability to produce various secondary metabolites involved in plant-growth promoting activities, including IAA production, ACC deaminase activity, and antifungal and antibacterial activities [39]. Furthermore, the chemical diversity and bioactive significance of actinobacterial metabolites, such as antibiotics, siderophores, volatile organic compounds, and phytohormones, are very valuable in plant growth, which further proposes a commercial application in tea cultivation. Proteobacteria were proven to be critical in maintaining the structure and functionality of bacterial communities in the rhizosphere. Li et al. [40] reported that Proteobacteria were enriched with genes associated with lipopolysaccharide biosynthesis and carbohydrate metabolism. Moreover, the ratio between Proteobacteria and Acidobacteria in rhizosphere bacterial communities has previously been shown to be an indicator of soil nutrient content where Proteobacteria were linked to nutrient-rich soils and Acidobacteria to nutrient-poor soils [41,42]. In our study, Actinobacteria and Proteobacteria were observed to be the most differentially dominated phyla among ZC, HJY, and ZJ. The range of tea leaf colors depends mainly on the composition and proportion of pigments contained in the tea leaves. Chlorophyll and anthocyanins are the main pigments in tea leaves. The normal green leaf variety ZC has more abundant Actinobacteria and Proteobacteria compared with HJY (chlorophyll-deficient tea plant variety with yellow tea leaves) and ZJ (an anthocyanin-rich tea variety with purple leaves). This result suggested that the sources of chlorophyll in the normal green leaf variety could be speculated to be more abundant than those of ZJ and HJY, according to their correlation with Proteobacteria and Actinobacteria. Supported by the difference in biomass, it was speculated that the green leaves of ZC, with a higher abundance of Proteobacteria, enabled sufficient photosynthate for the accumulation of the biomass, which provided adequate nutrients for the rhizosphere microbial activities. In return, the high abundance of Actinobacteria in ZC influences soil fertility through the involvement of many components and serves as a nutrient [43]. Thus, sufficient nutrients from the root of ZC supply substrates for tea growth and photosynthesis, resulting in a normal green leaf phenotype.
When the functions of root metabolites are revealed, looking towards upstream genes in plants that regulate root metabolite biosynthesis and secretion should be addressed. Zhai et al. [44] found that Trichoderma sperellum ATCC30536 up-regulated the expression of key enzyme-encoding genes for artemisinin biosynthesis, such as HMGR1, FPS, ADS, CYP71AV1, and CPR, and increased the concentration of artemisinin in Artemisia annua leaves. Rhizosphere microorganisms affect functional genes to promote plant growth by inducing the upregulating or downregulating of genes related to carbon/nitrogen metabolism and antioxidant defense [45]. Therefore, multiomics, including metabolomics, metagenomics, and transcriptomics, were integrated to comprehensively reveal the mechanisms of root exudates on microbiome assembly. Our study demonstrated that DEGs in the root transcriptome of three tea varieties were mainly enriched in phenylpropanoid biosynthesis pathways. Consistently, the differentially abundant metabolites were mainly enriched in the branches of phenylpropanoid biosynthesis-related pathways, including phenylalanine metabolism and flavonoid biosynthesis by metabolomic detection and KEGG analysis.
The taxonomically diverse root-associated microbiome contributes to the gene expression of plant yield and a handful of agronomically important traits. Hou et al. [46] revealed that bidirectional root-shoot signaling may be a key mechanism linking root bacterial communities and the aboveground part of Arabidopsis thaliana. The phenylpropanoid biosynthesis pathway is the boundary of the primary metabolism and specialized metabolism [18]. To adapt to the environmental stimuli and changes, plants regulated the homeostasis among different branches of phenylpropanoids and related pathways via the regulation of metabolic flux redirection, exhibiting marked complexity and variation during successive developmental periods [19]. Branches of phenylpropanoid metabolisms including flavonoid biosynthesis and lignin biosynthesis have been shown to be involved in the interplay between plants and microorganisms. The liverwort and the model angiosperm Nicotiana benthamiana shared a set of orthologous microbe-responsive genes that were responsible for flavonoid biosynthesis during oomycete infection [47]. In Lotus japonicus, nod factor receptor 5 probably regulated flavonoid biosynthesis by interacting with the DFR-like protein LjDFL1 during symbiotic interaction with rhizobia [48]. Driven by phenylpropanoid biosynthesis, more than 8000 metabolites contributed to plant growth, quality formation, and plant–environment interactions [49]. As the main secondary metabolites, flavan-3-ols (catechins), along with other phenylpropanoids including flavanols, proanthocyanins (PAs), anthocyanins, and lignins, are derived from multiple branches of the phenylpropanoid biosynthetic pathways, one of the most characterized secondary metabolic pathways in plant systems. The variation in these metabolites in quantity and quality depended on plant species or variety, developmental stage, and plant-growth conditions [50]. This mechanistic link between root exudate chemistry and microbial recruitment underscores the role of phenylpropanoids as ecological mediators.
Plant-specialized metabolites have ecological functions, mediating interactions between plants and their environments [51]. The rhizosphere is a hot spot where secretions from roots interact with microorganisms and their metabolites [2]. Hence, profiles of rhizosphere soil were analyzed to elucidate the contributor or “prebiotics” that directly regulate the microbial structure and functions. Based on the functional analysis of microbiota, no significant differences were found in rhizosphere microbial functions among the three tea varieties, but the functional attributes of the common bacterial community on “phenylpropanoid biosynthesis” in roots were significantly changed. The dominant common bacterial communities in ZC showed more correlation with “Phenylpropanoid biosynthesis”, followed by ZJ and HJY. Naturally, carbon flux through glycolysis, the pentose phosphate pathway, and the TCA cycle in tea plants would reduce power and carbon from the primary metabolism to supply additional ATP and precursors to drive the biosynthesis of aromatic amino acids and secondary metabolic pathways, including phenylpropanoid biosynthesis, C5-branched dibasic acid metabolism, tryptophan metabolism, and 2-oxocarboxylic acid metabolism. The most differential reactions of the rhizosphere of three varieties enriched in carbon and nitrogen metabolism-related pathways, including C5-branched dibasic acid metabolism, 2-oxocarboxylic acid metabolism, and tryptophan metabolism, were observed in our research. The common plant–microbe interplay was mediated by the supply of C compounds for heterotrophic microbial growth by plants, apart from the mobilization of nutrients by microorganisms [52]. Thus, the root phenylpropanoid metabolism serves as a keystone driver of rhizosphere microbiome differentiation across tea varieties.
5. Conclusions
Herein, we provide a predictive understanding of the response of multiple soil taxonomic and functional attributes to three tea varieties with distinct phenotypes. During the process of plant microbiome assembly, different tea plant varieties could regulate distinct pathways to derive their own benefits. This study integrates metagenomic, transcriptomic, and metabolomic analyses to reveal how tea plant varieties (Zhongcha 108, Huangjinya, and Zijuan) regulate rhizosphere microbiome structures and functions through genotype-specific phenylpropanoid metabolism. Divergent metabolic flux partitioning—such as flavonoid versus lignin biosynthesis—drives rhizobacterial community differentiation with green-leaf ZC-enriching Actinobacteria correlated with lignin precursors, while JX and JMD varieties shape higher microbial diversity via organic acids and phenolic derivatives. While our findings highlight genotype-dependent microbiome modulation, field-scale variability in soil properties may confound metabolic effects. Future studies under controlled conditions could isolate phenylpropanoid-specific impacts. This study provides a theoretical foundation for optimizing microbial communities through metabolic engineering and advancing molecular ecology-based strategies for tea breeding and sustainable plantation management.
Supplementary Materials
The following supporting information can be downloaded at: https://www.mdpi.com/article/10.3390/horticulturae11091072/s1, Figure S1: Good’s coverage index (A) and rarefaction curves represented by the Shannon index (B); Figure S2: Alpha diversity estimates of the rhizosphere bacterial communities. (A) OTU richness estimated by the Sobs index; (B) OTU diversity estimated by the Shannon index (number of observed OTUs). (C) OTU evenness estimated by Heip’s metric. Error bars and p values are from a two-tailed Student’s t test. Asterisks represent significant differences (* 0.01 < p ≤ 0.05, ** 0.001 < p ≤ 0.01); Figure S3: The enriched pathways in the rhizosphere soil of ZC, HJY and ZJ; Table S1: Significantly differential OTUs in RS_ZC vs. RS_HJY and RS_ZC vs. RS_ZJ; Table S2: Summary of Illumina transcriptome reads mapped to the reference genes; Table S3: Nontargeted metabolomics profiling of the rhizosphere soil of ZC, HJY, and ZJ and the tea roots of ZC, HJY, and ZJ.
Author Contributions
Conceptualization, L.S. and Z.D.; methodology, L.S., J.S., S.Z. and K.F.; software, W.Q., Y.W. (Yu Wang), Y.W. (Yi Wang) and W.L.; validation, Y.W. (Yu Wang), Y.W. (Yi Wang), W.L. and Z.D.; formal analysis, L.S.; investigation, L.S., J.S., S.Z. and K.F.; resources, W.Q., Y.W. (Yu Wang) and Y.W. (Yi Wang); data curation, Y.W. (Yu Wang); writing—original draft preparation, L.S.; writing—review and editing, J.S., S.Z., K.F., W.Q., Y.W. (Yu Wang) and Z.D.; supervision, Z.D.; project administration, Z.D.; funding acquisition, L.S. and Z.D. All authors have read and agreed to the published version of the manuscript.
Funding
This research was funded by Innovation Project of Shandong Academy of Agricultural Sciences, grant number CXGC2024F15 and Innovation Project of Shandong Academy of Agricultural Sciences, grant number CXGC2025F14.
Data Availability Statement
The raw data supporting the conclusions of this article will be made available by the authors on request.
Conflicts of Interest
Wei Li was employed by the company (D. CO International Food Co., Ltd.). The remaining authors declare that the research was conducted in the absence of any commercial or financial relationships that could be construed as a potential conflict of interest.
Abbreviations
The following abbreviations are used in this manuscript:
| OTU | Operational Taxonomic Unit |
| PCoA | Principal Coordinate Analysis |
| ANOSIM | Analysis of Similarities |
| DEG | Differentially Expressed Gene |
| KEGG | Kyoto Encyclopedia of Genes and Genomes |
| PLS-DA | Partial Least Squares-Discriminant Analysis |
| TCA cycle | Tricarboxylic Acid cycle |
References
- Berendsen, R.L.; Pieterse, C.M.J.; Bakker, P.A.H.M. The rhizosphere microbiome and plant health. Trends Plant Sci. 2012, 17, 478–486. [Google Scholar] [CrossRef]
- Favela, A.; Bohn, M.O.; Kent, A.D. Maize germplasm chronosequence shows crop breeding history impacts recruitment of the rhizosphere microbiome. ISME J. 2021, 15, 2454–2464. [Google Scholar] [CrossRef]
- Bais, H.P.; Park, S.W.; Weir, T.L.; Callaway, R.M.; Vivanco, J.M. How plants communicate using the underground information superhighway. Trends Plant Sci. 2004, 9, 26–32. [Google Scholar] [CrossRef]
- Berg, G.; Grube, M.; Schloter, M.; Smalla, K. Unraveling the plant microbiome: Looking back and future perspectives. Front. Microbiol. 2014, 5, 148. [Google Scholar] [CrossRef] [PubMed]
- Kaya, C. Microbial modulation of hormone signaling, proteomic dynamics, and metabolomics in plant drought adaptation. Food Energy Secur. 2024, 13, e513. [Google Scholar]
- Banchio, E.; Bogino, P.C.; Santoro, M.; Torres, L.; Zygadlo, J.; Giordano, W. Systemic Induction of Monoterpene Biosynthesis in Origanum × majoricum by Soil Bacteria. J. Agric. Food Chem. 2010, 13, 650–654. [Google Scholar] [CrossRef]
- Lu, Y.; Gao, D.; Gao, X.; Huo, H.; Yang, Z.; Wang, J.; Hou, M.; Wu, Y.; Zhang, H.; Xie, H.; et al. Light quality modulates yields and secondary metabolite accumulation in Fritillaria cirrhosa: Insights from rhizosphere metabolomics and microbiomics. Ind. Crops Prod. 2025, 229, 120967. [Google Scholar]
- Liu, Y.; Xu, Z.; Chen, L.; Xun, W.; Shu, X.; Chen, Y.; Sun, X.; Wang, Z.; Ren, Y.; Shen, Q.; et al. Root colonization by beneficial rhizobacteria. FEMS Microbiol. Rev. 2023, 48, fuad066. [Google Scholar] [CrossRef]
- Hou, S.; Thiergart, T.; Vannier, N.; Mesny, F.; Ziegler, J.; Pickel, B.; Hacquard, S. Microbiota-root-shoot axis modulation by MYC2 favours Arabidopsis growth over defence under suboptimal light. bioRxiv 2020, 8, 2020-11. [Google Scholar]
- Bulgarelli, D.; Rott, M.; Schlaeppi, K.; van Themaat, E.V.L.; Ahmadinejad, N.; Assenza, F.; Rauf, P.; Huettel, B.; Reinhardt, R.; Schmelzer, E.; et al. Revealing structure and assembly cues for Arabidopsis root-inhabiting bacterial microbiota. Nature 2012, 488, 91–95. [Google Scholar] [CrossRef] [PubMed]
- Lundberg, D.S.; Lebeis, S.L.; Paredes, S.H.; Yourstone, S.; Gehring, J.; Malfatti, S.; Tremblay, J.; Engelbrektson, A.; Kunin, V.; Del Rio, T.G.; et al. Defining the core Arabidopsis thaliana root microbiome. Nature 2012, 4488, 86–90. [Google Scholar] [CrossRef]
- Wu, C.; Liu, H.; Lai, L.; Mei, Z.; Cai, P.; Zhang, H.; Yang, J.; Chen, J.; Ge, T. Host genotype-specific plant microbiome correlates with wheat disease resistance. Biol. Fertil. Soils 2025, 61, 277–291. [Google Scholar] [CrossRef]
- Veach, A.M.; Morris, R.; Yip, D.Z.; Yang, Z.K.; Engle, N.L.; Cregger, M.A.; Tschaplinski, T.J.; Schadt, C.W. Rhizosphere microbiomes diverge among Populus trichocarpa plant-host genotypes and chemotypes, but it depends on soil origin. Microbiome 2019, 7, 76. [Google Scholar] [CrossRef] [PubMed]
- Pérez-Jaramillo, J.E.; de Hollander, M.; Ramírez, C.A.; Mendes, R.; Raaijmakers, J.M.; Carrión, V.J. Deciphering rhizosphere microbiome assembly of wild and modern common bean (Phaseolus vulgaris) in native and agricultural soils from Colombia. Microbiome 2019, 7, 114. [Google Scholar] [CrossRef]
- Bulgarelli, D.; Garrido-Oter, R.; Münch, P.C.; Weiman, A.; Dröge, J.; Pan, Y.; McHardy, A.C.; Schulze-Lefert, P. Structure and function of the bacterial root microbiota in wild and domesticated barley. Cell Host Microbe 2015, 17, 392–403. [Google Scholar] [CrossRef]
- Pérez-Jaramillo, J.E.; Carrión, V.J.; Bosse, M.; Ferrão, L.F.V.; de Hollander, M.; Garcia, A.A.F.; Ramírez, C.A.; Mendes, R.; Raaijmakers, J.M. Linking rhizosphere microbiome composition of wild and domesticated Phaseolus vulgaris to genotypic and root phenotypic traits. ISME J. 2017, 11, 2244–2257. [Google Scholar] [CrossRef]
- Leff, J.W.; Lynch, R.C.; Kane, N.C.; Fierer, N. Plant domestication and the assembly of bacterial and fungal communities associated with strains of the common sunflower, Helianthus annuus. New Phytol. 2017, 214, 412–423. [Google Scholar] [CrossRef]
- Fraser, C.M.; Chapple, C. The Phenylpropanoid Pathway in Arabidopsis. Arab. Book 2011, 9, e0152. [Google Scholar] [CrossRef]
- Lanot, A.; Hodge, D.; Lim, E.-K.; Vaistij, F.E.; Bowles, D.J. Redirection of flux through the phenylpropanoid pathway by increased glucosylation of soluble intermediates. Planta 2008, 228, 609–616. [Google Scholar] [CrossRef] [PubMed]
- Zhang, F.; Guo, H.; Huang, J.; Yang, C.; Li, Y.; Wang, X.; Qu, L.; Liu, X.; Luo, J. A UV-B-responsive glycosyltransferase, OsUGT706C2, modulates flavonoid metabolism in rice. Sci. China Life Sci. 2020, 63, 1037–1052. [Google Scholar] [CrossRef] [PubMed]
- Sun, Y.; Wang, X.; Huang, Z.; Zhao, X.; Qiao, L.; Wu, C.; Xue, Z.; Kou, X. Phenylpropanoids for the control of fungal diseases of postharvest fruit. Plant Mol. Biol. 2025, 115, 39. [Google Scholar] [CrossRef] [PubMed]
- Zhou, K.; Hu, L.; Li, Y.; Chen, X.; Zhang, Z.; Liu, B.; Li, P.; Gong, X.; Ma, F. MdUGT88F1-mediated phloridzin biosynthesis regulates apple development and Valsa canker resistance. Plant Physiol. 2019, 180, 2290–2305. [Google Scholar] [CrossRef]
- Zhang, J.; Subramanian, S.; Zhang, Y.; Yu, O. Flavone synthases from Medicago truncatula are flavanone-2-hydroxylases and are important for nodulation. Plant Physiol. 2007, 144, 741–751. [Google Scholar] [CrossRef] [PubMed]
- Yu, X.; Xiao, J.; Chen, S.; Yu, Y.; Ma, J.; Lin, Y.; Li, R.; Lin, J.; Fu, Z.; Zhou, Q.; et al. Metabolite signatures of diverse Camellia sinensis tea populations. Nat. Commun. 2020, 11, 5586. [Google Scholar] [CrossRef]
- Yue, H.; Yue, W.; Jiao, S.; Kim, H.; Lee, Y.-H.; Wei, G.; Song, W.; Shu, D. Plant domestication shapes rhizosphere microbiome assembly and metabolic functions. Microbiome 2023, 11, 70. [Google Scholar] [CrossRef] [PubMed]
- Zhang, S.; Wang, Y.; Sun, L.; Qiu, C.; Ding, Y.; Gu, H.; Wang, L.; Wang, Z.; Ding, Z. Organic mulching positively regulates the soil microbial communities and ecosystem functions in tea plantation. BMC Microbiol. 2020, 20, 103. [Google Scholar] [CrossRef]
- Sun, L.; Wang, Y.; Ma, D.; Wang, L.; Zhang, X.; Ding, Y.; Fan, K.; Xu, Z.; Yuan, C.; Jia, H.; et al. Differential responses of the rhizosphere microbiome structure and soil metabolites in tea (Camellia sinensis) upon application of cow manure. BMC Microbiol. 2022, 22, 55. [Google Scholar] [CrossRef]
- Liu, F.; Wang, Y.; Ding, Z.; Zhao, L.; Xiao, J.; Wang, L.; Ding, S. Transcriptomic analysis of flower development in tea (Camellia sinensis (L.)). Gene 2017, 631, 39–51. [Google Scholar] [CrossRef]
- Zelena, E.; Dunn, W.B.; Broadhurst, D.; Francis-McIntyre, S.; Carroll, K.M.; Begley, P.; O’Hagan, S.; Knowles, J.D.; Halsall, A.; Wilson, I.D.; et al. Development of a Robust and Repeatable UPLC-MS Method for the Long-Term Metabolomic Study of Human Serum. Anal. Chem. 2009, 81, 1357–1364. [Google Scholar] [CrossRef]
- Want, E.J.; Masson, P.; Michopoulos, F.; Wilson, I.D.; Theodoridis, G.; Plumb, R.S.; Shockcor, J.; Loftus, N.; Holmes, E.; Nicholson, J.K. Global metabolic profiling of animal and human tissues via UPLC-MS. Nat. Protoc. 2013, 8, 17–32. [Google Scholar] [CrossRef]
- Tian, L.; Shi, S.; Ma, L.; Nasir, F.; Li, X.; Tran, L.S.P.; Tian, C. Co-evolutionary associations between root-associated microbiomes and root transcriptomes in wild and cultivated rice varieties. Plant Physiol. Biochem. 2018, 128, 134–141. [Google Scholar] [CrossRef] [PubMed]
- Banerjee, S.; Van Der Heijden, M.G. Soil microbiomes and one health. Nat. Rev. Microbiol. 2023, 21, 6–20. [Google Scholar] [CrossRef]
- Vives-Peris, V.; de Ollas, C.; Gómez-Cadenas, A.; Pérez-Clemente, R.M. Root exudates: From plant to rhizosphere and beyond. Plant Cell Rep. 2020, 39, 3–17. [Google Scholar] [CrossRef]
- Kavamura, V.N.; Robinson, R.J.; Hughes, D.; Clark, I.; Rossmann, M.; de Melo, I.S.; Hirsch, P.R.; Mendes, R.; Mauchline, T.H. Wheat dwarfing influences selection of the rhizosphere microbiome. Sci. Rep. 2020, 10, 1452. [Google Scholar] [CrossRef]
- Mendes, L.W.; Raaijmakers, J.M.; de Hollander, M.; Mendes, R.; Tsai, S.M. Influence of resistance breeding in common bean on rhizosphere microbiome composition and function. ISME J. 2018, 12, 212–224. [Google Scholar] [CrossRef]
- Huber, K.J.; Geppert, A.M.; Wanner, G.; Fösel, B.U.; Wüst, P.K.; Overmann, J. The first representative of the globally widespread subdivision 6 Acidobacteria, Vicinamibacter silvestris gen. nov., sp. nov., isolated from subtropical savannah soil. Int. J. Syst. Evol. Microbiol. 2016, 66, 2971–2979. [Google Scholar] [CrossRef] [PubMed]
- Kalam, S.; Basu, A.; Ahmad, I.; Sayyed, R.Z.; El-Enshasy, H.A.; Dailin, D.J.; Suriani, N.L. Recent Understanding of Soil Acidobacteria and Their Ecological Significance: A Critical Review. Front. Microbiol. 2020, 11, 580024. [Google Scholar] [CrossRef]
- Belova, S.E.; Ravin, N.V.; Pankratov, T.A.; Rakitin, A.L.; Ivanova, A.A.; Beletsky, A.V.; Mardanov, A.V.; Damsté, J.S.S.; Dedysh, S.N. Hydrolytic Capabilities as a Key to Environmental Success: Chitinolytic and Cellulolytic Acidobacteria from Acidic Sub-arctic Soils and Boreal Peatlands. Front. Microbiol. 2018, 9, 2775. [Google Scholar] [CrossRef] [PubMed]
- Shan, W.; Zhou, Y.; Liu, H.; Yu, X. Endophytic Actinomycetes from Tea Plants (Camellia sinensis): Isolation, Abundance, Antimicrobial, and Plant-Growth-Promoting Activities. BioMed Res. Int. 2018, 2018, 1470305. [Google Scholar] [CrossRef]
- Li, W.; Zhang, Y.; Mao, W.; Wang, C.; Yin, S. Functional potential differences betweenFirmicutesandProteobacteriain response to manure amendment in a reclaimed soil. Can. J. Microbiol. 2020, 66, 689–697. [Google Scholar] [CrossRef]
- Beckers, B.; Op De Beeck, M.; Weyens, N.; Boerjan, W.; Vangronsveld, J. Structural variability and niche differentiation in the rhizosphere and endosphere bacterial microbiome of field-grown poplar trees. Microbiome 2017, 5, 25. [Google Scholar] [CrossRef] [PubMed]
- Gottel, N.R.; Castro, H.F.; Kerley, M.; Yang, Z.; Pelletier, D.A.; Podar, M.; Karpinets, T.; Uberbacher, E.; Tuskan, G.A.; Vilgalys, R.; et al. Distinct microbial communities within the endosphere and rhizosphere of Populus deltoides roots across contrasting soil types. Appl. Environ. Microbiol. 2011, 77, 5934–5944. [Google Scholar] [CrossRef]
- Mitra, D.; Mondal, R.; Khoshru, B.; Senapati, A.; Radha, T.; Mahakur, B.; Uniyal, N.; Myo, E.M.; Boutaj, H.; Sierra, B.E.G.; et al. Actinobacteria-enhanced plant growth, nutrient acquisition, and crop protection: Advances in soil, plant, and microbial multifactorial interactions. Pedosphere 2022, 32, 22. [Google Scholar] [CrossRef]
- Zhai, T.; Wang, Y.; Liu, C.; Liu, Z.; Zhao, M.; Chang, Y.; Zhang, R. Trichoderma asperellum ACCC30536 inoculation improves soil nutrition and leaf artemisinin production in Artemisia annua. Acta Physiol. Plant. 2019, 41, 46. [Google Scholar] [CrossRef]
- Liu, Q.; Cheng, L.; Nian, H.; Jin, J.; Lian, T. Linking plant functional genes to rhizosphere microbes: A review. Plant Biotechnol. J. 2023, 21, 902–917. [Google Scholar] [CrossRef] [PubMed]
- Hou, S.; Thiergart, T.; Vannier, N.; Mesny, F.; Ziegler, J.; Pickel, B.; Hacquard, S. A microbiota–root–shoot circuit favours Arabidopsis growth over defence under suboptimal light. Nat. Plants 2021, 7, 1078–1092. [Google Scholar] [CrossRef]
- Carella, P.; Gogleva, A.; Hoey, D.J.; Bridgen, A.J.; Stolze, S.C.; Nakagami, H.; Schornack, S. Conserved Biochemical Defenses Underpin Host Responses to Oomycete Infection in an Early- Divergent Land Plant Lineage. Curr. Biol. 2019, 29, 2282–2294.e5. [Google Scholar] [CrossRef]
- Duan, L.; Pei, J.; Ren, Y.; Li, H.; Zhou, X.; Zhu, H.; Duanmu, D.; Wen, J.; Mysore, K.S.; Cao, Y.; et al. A Dihydroflavonol-4-Reductase-Like Protein Interacts with NFR5 and Regulates Rhizobial Infection in Lotus japonicus. Mol. Plant-Microbe Interact. 2019, 32, 401–412. [Google Scholar] [CrossRef]
- Dong, N.Q.; Lin, H.X. Contribution of phenylpropanoid metabolism to plant development and plant-environment interactions. J. Integr. Plant. Biol. 2021, 63, 180–209. [Google Scholar] [CrossRef]
- Badri, D.V.; Vivanco, J.M. Regulation and function of root exudates. Plant Cell Environ. 2010, 32, 666–681. [Google Scholar] [CrossRef]
- Xu, S.; Gaquerel, E. Evolution of plant specialized metabolites: Beyond ecological drivers. Trends Plant Sci. 2025, 30, 826–836. [Google Scholar] [CrossRef] [PubMed]
- Maurer, D.; Malique, F.; Alfarraj, S.; Albasher, G.; Horn, M.A.; Butterbach-Bahl, K.; Dannenmann, M.; Rennenberg, H. Interactive regulation of root exudation and rhizosphere denitrification by plant metabolite content and soil properties. Plant Soil 2021, 467, 107–127. [Google Scholar] [CrossRef]
Disclaimer/Publisher’s Note: The statements, opinions and data contained in all publications are solely those of the individual author(s) and contributor(s) and not of MDPI and/or the editor(s). MDPI and/or the editor(s) disclaim responsibility for any injury to people or property resulting from any ideas, methods, instructions or products referred to in the content. |
© 2025 by the authors. Licensee MDPI, Basel, Switzerland. This article is an open access article distributed under the terms and conditions of the Creative Commons Attribution (CC BY) license (https://creativecommons.org/licenses/by/4.0/).