Article

Revealing the Power of Deep Learning in Quality Assessment of Mango and Mangosteen Purée Using NIR Spectral Data

by
Pimpen Pornchaloempong
1,
Sneha Sharma
2,3,
Thitima Phanomsophon
4,
Panmanas Sirisomboon
2 and
Ravipat Lapcharoensuk
2,*
1
Department of Food Engineering, School of Engineering, King Mongkut’s Institute of Technology Ladkrabang, Bangkok 10520, Thailand
2
Department of Agricultural Engineering, School of Engineering, King Mongkut’s Institute of Technology Ladkrabang, Bangkok 10520, Thailand
3
Department of Primary Industries and Regional Development (DPIRD), Perth 6000, Australia
4
Office of Administrative Interdisciplinary Program on Agricultural Technology, School of Agricultural Technology, King Mongkut’s Institute of Technology Ladkrabang, Bangkok 10520, Thailand
*
Author to whom correspondence should be addressed.
Horticulturae 2025, 11(9), 1047; https://doi.org/10.3390/horticulturae11091047
Submission received: 11 July 2025 / Revised: 20 August 2025 / Accepted: 29 August 2025 / Published: 2 September 2025
(This article belongs to the Section Postharvest Biology, Quality, Safety, and Technology)

Abstract

The quality control of fruit purée products such as mango and mangosteen is crucial for maintaining consumer satisfaction and meeting industry standards. Traditional destructive techniques for assessing key quality parameters like the soluble solid content (SSC) and titratable acidity (TA) are labor-intensive and time-consuming; prompting the need for rapid, nondestructive alternatives. This study investigated the use of deep learning (DL) models including Simple-CNN, AlexNet, EfficientNetB0, MobileNetV2, and ResNeXt for predicting SSC and TA in mango and mangosteen purée and compared their performance with the conventional chemometric method partial least squares regression (PLSR). Spectral data were preprocessed and evaluated using 10-fold cross-validation. For mango purée, the Simple-CNN model achieved the highest predictive accuracy for both SSC (coefficient of determination of cross-validation ( R CV 2 ) = 0.914, root mean square error of cross-validation (RMSECV) = 0.688, the ratio of prediction to deviation of cross-validation (RPDCV) = 3.367) and TA ( R CV 2 = 0.762, RMSECV = 0.037, RPDCV = 2.864), demonstrating a statistically significant improvement over PLSR. For the mangosteen purée, AlexNet exhibited the best SSC prediction performance ( R CV 2 = 0.702, RMSECV = 0.471, RPDCV = 1.666), though the RPDCV values (<2.0) indicated limited applicability for precise quantification. TA prediction in mangosteen purée showed low variance in the reference values (standard deviation (SD) = 0.048), which may have restricted model performance. These results highlight the potential of DL for improving NIR-based quality evaluation of fruit purée, while also pointing to the need for further refinement to ensure interpretability, robustness, and practical deployment in industrial quality control.

1. Introduction

Mango (Mangifera indica) and mangosteen (Garcinia mangostana) are two highly regarded tropical fruits which are not only celebrated for their unique flavors and nutritional benefits but also play a significant role in global agriculture and commerce, particularly in Southeast Asia. The Mahachanok mango is an important variety from Thailand, known for its vibrant skin color, large size, sweet flavor, smooth, fibreless flesh, firm texture, and high levels of vitamins A, C, and phenolic compounds [1,2]. Meanwhile, mangosteen is another important fruit in Thailand, being prized for its delicate, tangy-sweet flavor and distinctive deep purple rind that encases juicy, segmented white flesh [3]. Both fruits are widely consumed around the world in their fresh form and as processed products. Several food processing techniques, such as juice processing, concentration, and drying, can be utilized to increase profit and extend the shelf life of these products. Purées are products obtained by grinding or blending fruit into a smooth, uniform consistency and are commonly utilized as a base ingredient for various processed products, including beverages, sauces, ice creams, fruit jams, and dried fruits. The quality of a purée can be informed by the SSC and TA, which represent measurements of sweetness and sourness, respectively. The SSC and TA are standard values for testing mango purée to ensure that products have the desired flavor. Reflectometers have been used to evaluate SSC, while TA measurement requires using the titratable analysis method. These methods for measuring the SSC and TA of a product require chemicals, time, and skilled personnel, and the quality assessment of purées in the production process must be performed efficiently, accurately, and cost-effectively.
Near-infrared (NIR) spectroscopy is natural nondestructive technique which can be applied to rapidly evaluate a product without the need for chemicals [4]. The relationship between NIR absorption by molecular bonds and reference data was utilized to develop a prediction model based on chemometric techniques. This technique has long been employed in evaluating the quality of agricultural products and food, demonstrating success in numerous previous studies. The application of NIR spectroscopy for predicting SSC and TA has been studied in various fruit purées, including apple [5,6,7,8], mango [3], mangosteen [3], and tomato [9]. Although Pornchaloempong et al. [3] reported the application of NIR spectroscopy for assessing SSC and TA in mango and mangosteen, this study found that TA prediction in both fruits and SSC prediction in mangosteen did not achieve the expected accuracy. The researchers employed the partial least squares regression (PLSR) technique to develop prediction models for SSC and TA. While PLSR is a widely used chemometric method due to its ability to handle multicollinearity and reduce data dimensionality, this technique fundamentally assumes a linear relationship between the input spectral data and the target variables, which can limit its capacity to capture nonlinear and complex interactions that may exist in real-world spectral datasets. In contrast, DL techniques are designed to handle nonlinear relationships and often outperform traditional methods when using complex high-dimensional data. The integration of deep learning with NIR spectroscopy could enhance the accuracy and robustness of SSC and TA prediction, especially when linear models fail to capture underlying patterns.
DL is a subfield of artificial intelligence (AI) that enables computational systems to learn automatically from large volumes of data without explicit programming. DL using convolutional neural networks (CNN) offers a robust approach for analyzing NIR spectral data by effectively capturing complex nonlinear relationships and handling large-scale datasets without the need for manual feature extraction, thus providing advantages over traditional methods such as PLSR [10]. This capability renders the integration of NIR spectroscopy with CNN particularly effective for high-precision applications, such as the assessment of agricultural product quality. Several research efforts have developed custom CNN models to predict the SSC of citrus [11] and apple [12] products and have demonstrated high accuracy and robust performance in NIR spectral data analysis, with R2 values exceeding 0.95 and low root mean square errors. Shi et al. [13] demonstrated the effectiveness of NIR spectroscopy combined with a CNN model for evaluating the TA of pears, achieving an R2 of 0.97 and an RPD of 5.057. Although these studies demonstrate the effectiveness of the custom CNN models in predicting SSC and TA, their development requires considerable expertise in architectural design and optimization, which often results in increased time and computational resource requirements, as well as limited generalizability to new datasets.
In contrast, CNN architectures such as AlexNet, VGGNet, ResNet, GoogLeNet, MobileNet, DenseNet, and EfficientNet reduce the need for extensive customization while enhancing generalizability and training efficiency [14,15,16]. Although these architectures were originally developed for image classification tasks, they can also be effectively adapted for regression tasks in applications involving NIR spectroscopy. Yu et al. [17] applied Inception-ResNet and AlexNet to predict the SSC of multiple fruits (pear and apple) using NIR spectral data, achieving high performance with R2 values greater than 0.88. Meanwhile, three CNN architectures, including MobileNetV3, EfficientNetV1, and EfficientNetV2, demonstrated the ability to predict the polyphenol content in tobacco leaves using NIR spectral data [18]. All of the aforementioned CNN architectures can be effectively adapted for SSC and TA prediction using NIR spectral data by modifying their output layers accordingly. However, given the diverse architectural structures and computational demands of different CNN models, a comparative evaluation is essential to determine the most effective approach for NIR spectral regression in terms of both predictive accuracy and computational efficiency. Therefore, selecting an optimal CNN architecture tailored to the specific characteristics of NIR spectral data is crucial for maximizing model performance and practical applicability in real-world agricultural quality assessment.
Therefore, this study focuses on the application of deep learning (DL) in the quality assessment of the soluble solid content (SSC) and titratable acidity (TA) of mango and mangosteen purée using NIR spectral data. Five CNN architectures, including Simple-CNN, AlexNet, EfficientNetB0, MobileNetV2, and ResNeXt, were employed to develop predictive models for SSC and TA. These models were built on preprocessed spectral data to compare their performance. In addition, the performance of DL-based models was benchmarked against the conventional method (PLSR). This study demonstrates the potential of DL to enhance NIR spectroscopy models for evaluating SSC and TA in mango and mangosteen purée, providing crucial insights for quality control within the production process. Meanwhile, the SHAP value was employed to interpret the model’s decision-making process and to reveal the relationships between the NIR absorbance band and predicted outcomes (SSC and TA). The integration of SHAP with DL enhances model interpretability and uncovers key spectral features associated with SSC and TA, thereby supporting more informed and reliable quality control in fruit purée processing.

2. Materials and Methods

2.1. Samples Preparation

The Mahachanok mangoes used in this study were sourced from Chiangmai Fresh Co., Ltd., Mae Ai District, Chiangmai, Thailand. A total of 100 kg of mangoes were harvested 115–120 days after flowering. For the mangosteen fruits, 100 kg was harvested at ripe maturity (90 days after flowering) by the Ta Ma Pla Mangosteen Community Enterprise in Lung Suan District, Chumphon Province, Thailand. Both fruits were then transported in a fully covered truck from the orchards to the Faculty of Engineering, King Mongkut’s Institute of Technology Ladkrabang. Once they arrived, the fruits were stored in a well-ventilated area, protected from sunlight and rain.
Mango and mangosteen purées were produced following the method of Pornchaloempong et al. [3]. The purées were stored in 100-milliliter light-brown glass bottles, with each sample being placed into two bottles, which were sealed with a rubber stopper and screw cap. The bottles were stored at −20 °C for 7 days before quality inspection, and prior to NIR scanning, the bottles were thawed at room temperature (25 °C) for 3 to 4 h. In total, 88 sample bottles of mangosteen purée and 96 sample bottles of mango purée were used for this experiment.

2.2. Spectra Acquisition

The spectra of the purée samples were acquired using a Fourier Transform (FT) NIR spectrometer (MPA, Bruker Optics GmbH, Ettlingen, Germany), utilizing a scanning range of 12,500–4000 cm−1 (800–2500 nm) with a resolution of 16 cm−1. Spectral data for each sample was collected by averaging 32 scans per measurement. To ensure measurement reliability, background scanning was carried out before each acquisition using a gold reference standard. The purée was placed in a glass vial (22 mm in diameter and 48 mm in height), which served as the measurement cell, and a stainless-steel plate was placed over the purée to set a 2 mm optical path length during scanning.

2.3. SSC and TA Measurement

The SSC of the mango and mangosteen purée was measured directly using a digital refractometer (Pocket Pal-1, Atago, Tokyo, Japan), which was calibrated with distilled water prior to measurement. SSC was measured in triplicate for each sample, and the average was taken for further analysis. TA was determined by titrating 5 g of purée with 0.1 M sodium hydroxide solution to a predefined pH endpoint of 8.2, using an auto-titrator (Titrator T50, Mettler Toledo, Greifensee, Switzerland). SSC was expressed in % Brix, while TA was quantified as the percentage of malic acid.

2.4. Spectra Preparation

As the raw NIR spectral data of purée samples may be influenced by various factors (e.g., noise, light scattering, sample temperature, and sample inhomogeneity), preprocessing was applied before model training. The raw spectra were sequentially preprocessed using second-order polynomial Savitzky–Golay smoothing with a smoothing window of 3 points, followed by mean normalization, multiplicative scatter correction (MSC), and baseline correction to enhance signal quality and improve model performance.

2.5. Convolutional Neural Networks (CNN)

2.5.1. Data Augmentation and Cross-Validation

CNN often require large and diverse datasets to achieve robust performance; therefore, data augmentation techniques are commonly employed to simulate spectral variability and expand the dataset size. For this study, data augmentation was performed using three primary methods: additive Gaussian noise, spectral shifting, and Savitzky–Golay smoothing. Such approaches have been widely employed in previous research, particularly in the context of spectral data analysis and CNN-based modeling [11,19,20,21]. However, the augmentation process must be carried out with caution; for example, it should be applied only to the training set to prevent data leakage, generating unrealistic spectra that do not reflect the true characteristics of the samples should be avoided, and it is important to ensure that the model’s performance is validated using an external validation set or appropriate cross-validation methods to confirm its generalization ability. Due to its limitation of a relatively small dataset, this study employed 10-fold cross-validation to systematically evaluate the performance of the model. The dataset was divided into ten subsets (folds), and training and testing were iteratively conducted across all folds. In each iteration, only the training set was subjected to data augmentation prior to model construction, while predictions were made on the original testing set. This approach reduces the bias of a single train–test split and enhances the reliability of the results. Each spectrum in the training set was augmented 10 times using Gaussian noise, spectral shifting, and Savitzky–Golay smoothing, providing 30 additional spectra per sample. The parameters of these techniques were randomly chosen within predefined ranges to mimic realistic variability in NIR spectral measurements: noise level: 0.01–0.05; shift range: ±1–4 positions; Savitzky–Golay window length: 5, 7, 9, or 11; and polynomial order: 2–4. The augmentation preserved the original target values and sample IDs while applying each method independently, resulting in an expanded dataset comprising noise-augmented, shifted, and smoothed spectral profiles for each round.

2.5.2. Modeling

In this study, five CNN architectures, including the Simple-CNN, AlexNet, EfficientNetB0, MobileNetV2, and ResNeXt, were applied to develop predictive models for SSC and TA using NIR spectral data. AlexNet, EfficientNetB0, MobileNetV2, and ResNeXt did not apply transfer learning or layer freezing. Instead, these architectures were adopted and reimplemented from scratch for NIR spectral data. All layers were set as trainable, and the networks were initialized with random weights rather than pre-trained parameters. Consequently, the entire models were optimized during training without any frozen layers. An overview of the five CNN architectures is briefly described as follows.
Simple-CNN was adapted for one-dimensional NIR spectra (Figure 1) to balance effectiveness and computational efficiency based on a relatively small dataset. This model, inspired by AlexNet’s first three layers (a convolutional, batch normalization, and pooling layer) and a dense block, uses a linear activation at the end for regression tasks. The architecture comprises eight layers: an input layer, a 1D convolutional layer with 96 filters (kernel size = 11, stride = 4) and ReLU activation, batch normalization to stabilize feature distributions, and a max-pooling layer (pool size = 3, stride = 2). The pooled features are flattened and passed into a fully connected layer (512 units, ReLU), followed by dropout (rate = 0.5) for regularization. The output layer is a single linear neuron for continuous value prediction.
AlexNet is a CNN architecture introduced by Krizhevsky et al. [22], which gained widespread recognition after winning the ImageNet Large Scale Visual Recognition Challenge (ILSVRC), demonstrating a significant improvement in performance over previous models. AlexNet consists of several convolutional layers followed by max pooling and fully connected layers, enabling the model to efficiently learn complex features from image data. It utilizes ReLU activation functions and regularization techniques such as dropout to mitigate overfitting. In recent studies, AlexNet has been adapted for tasks beyond image classification, such as regression problems involving one-dimensional data like NIR spectral information. This adaptation typically involves modifying only the final layers to suit continuous value prediction instead of class output.
EfficientNet-B0 is a CNN architecture proposed by Tan and Le [14] that is designed to achieve high accuracy with significantly fewer parameters and lower computational cost compared to previous models. The key innovation lies in its compound scaling method, which uniformly scales the depth, width, and resolution of the network in a balanced way. EfficientNet-B0 serves as the baseline model in the EfficientNet family and was obtained through a neural architecture search (NAS).
MobileNetV2 is a lightweight convolutional neural network architecture introduced by Sandler et al. [23], designed specifically for mobile and embedded vision applications. It builds upon the original MobileNet by introducing two key innovations, namely inverted residual blocks and linear bottlenecks, which improve both computational efficiency and model performance. These architectural changes enable MobileNetV2 to achieve high accuracy while maintaining a small model size and low latency.
ResNeXt is a convolutional neural network architecture proposed by Xie et al. [24] as an extension of the ResNet framework. It introduces the concept of “cardinality,” which refers to the number of parallel paths (or transformations) in a residual block. By increasing cardinality, ResNeXt enhances model capacity while maintaining computational efficiency. This architecture employs grouped convolutions within residual blocks, enabling better performance with fewer parameters compared to traditional deep CNN.
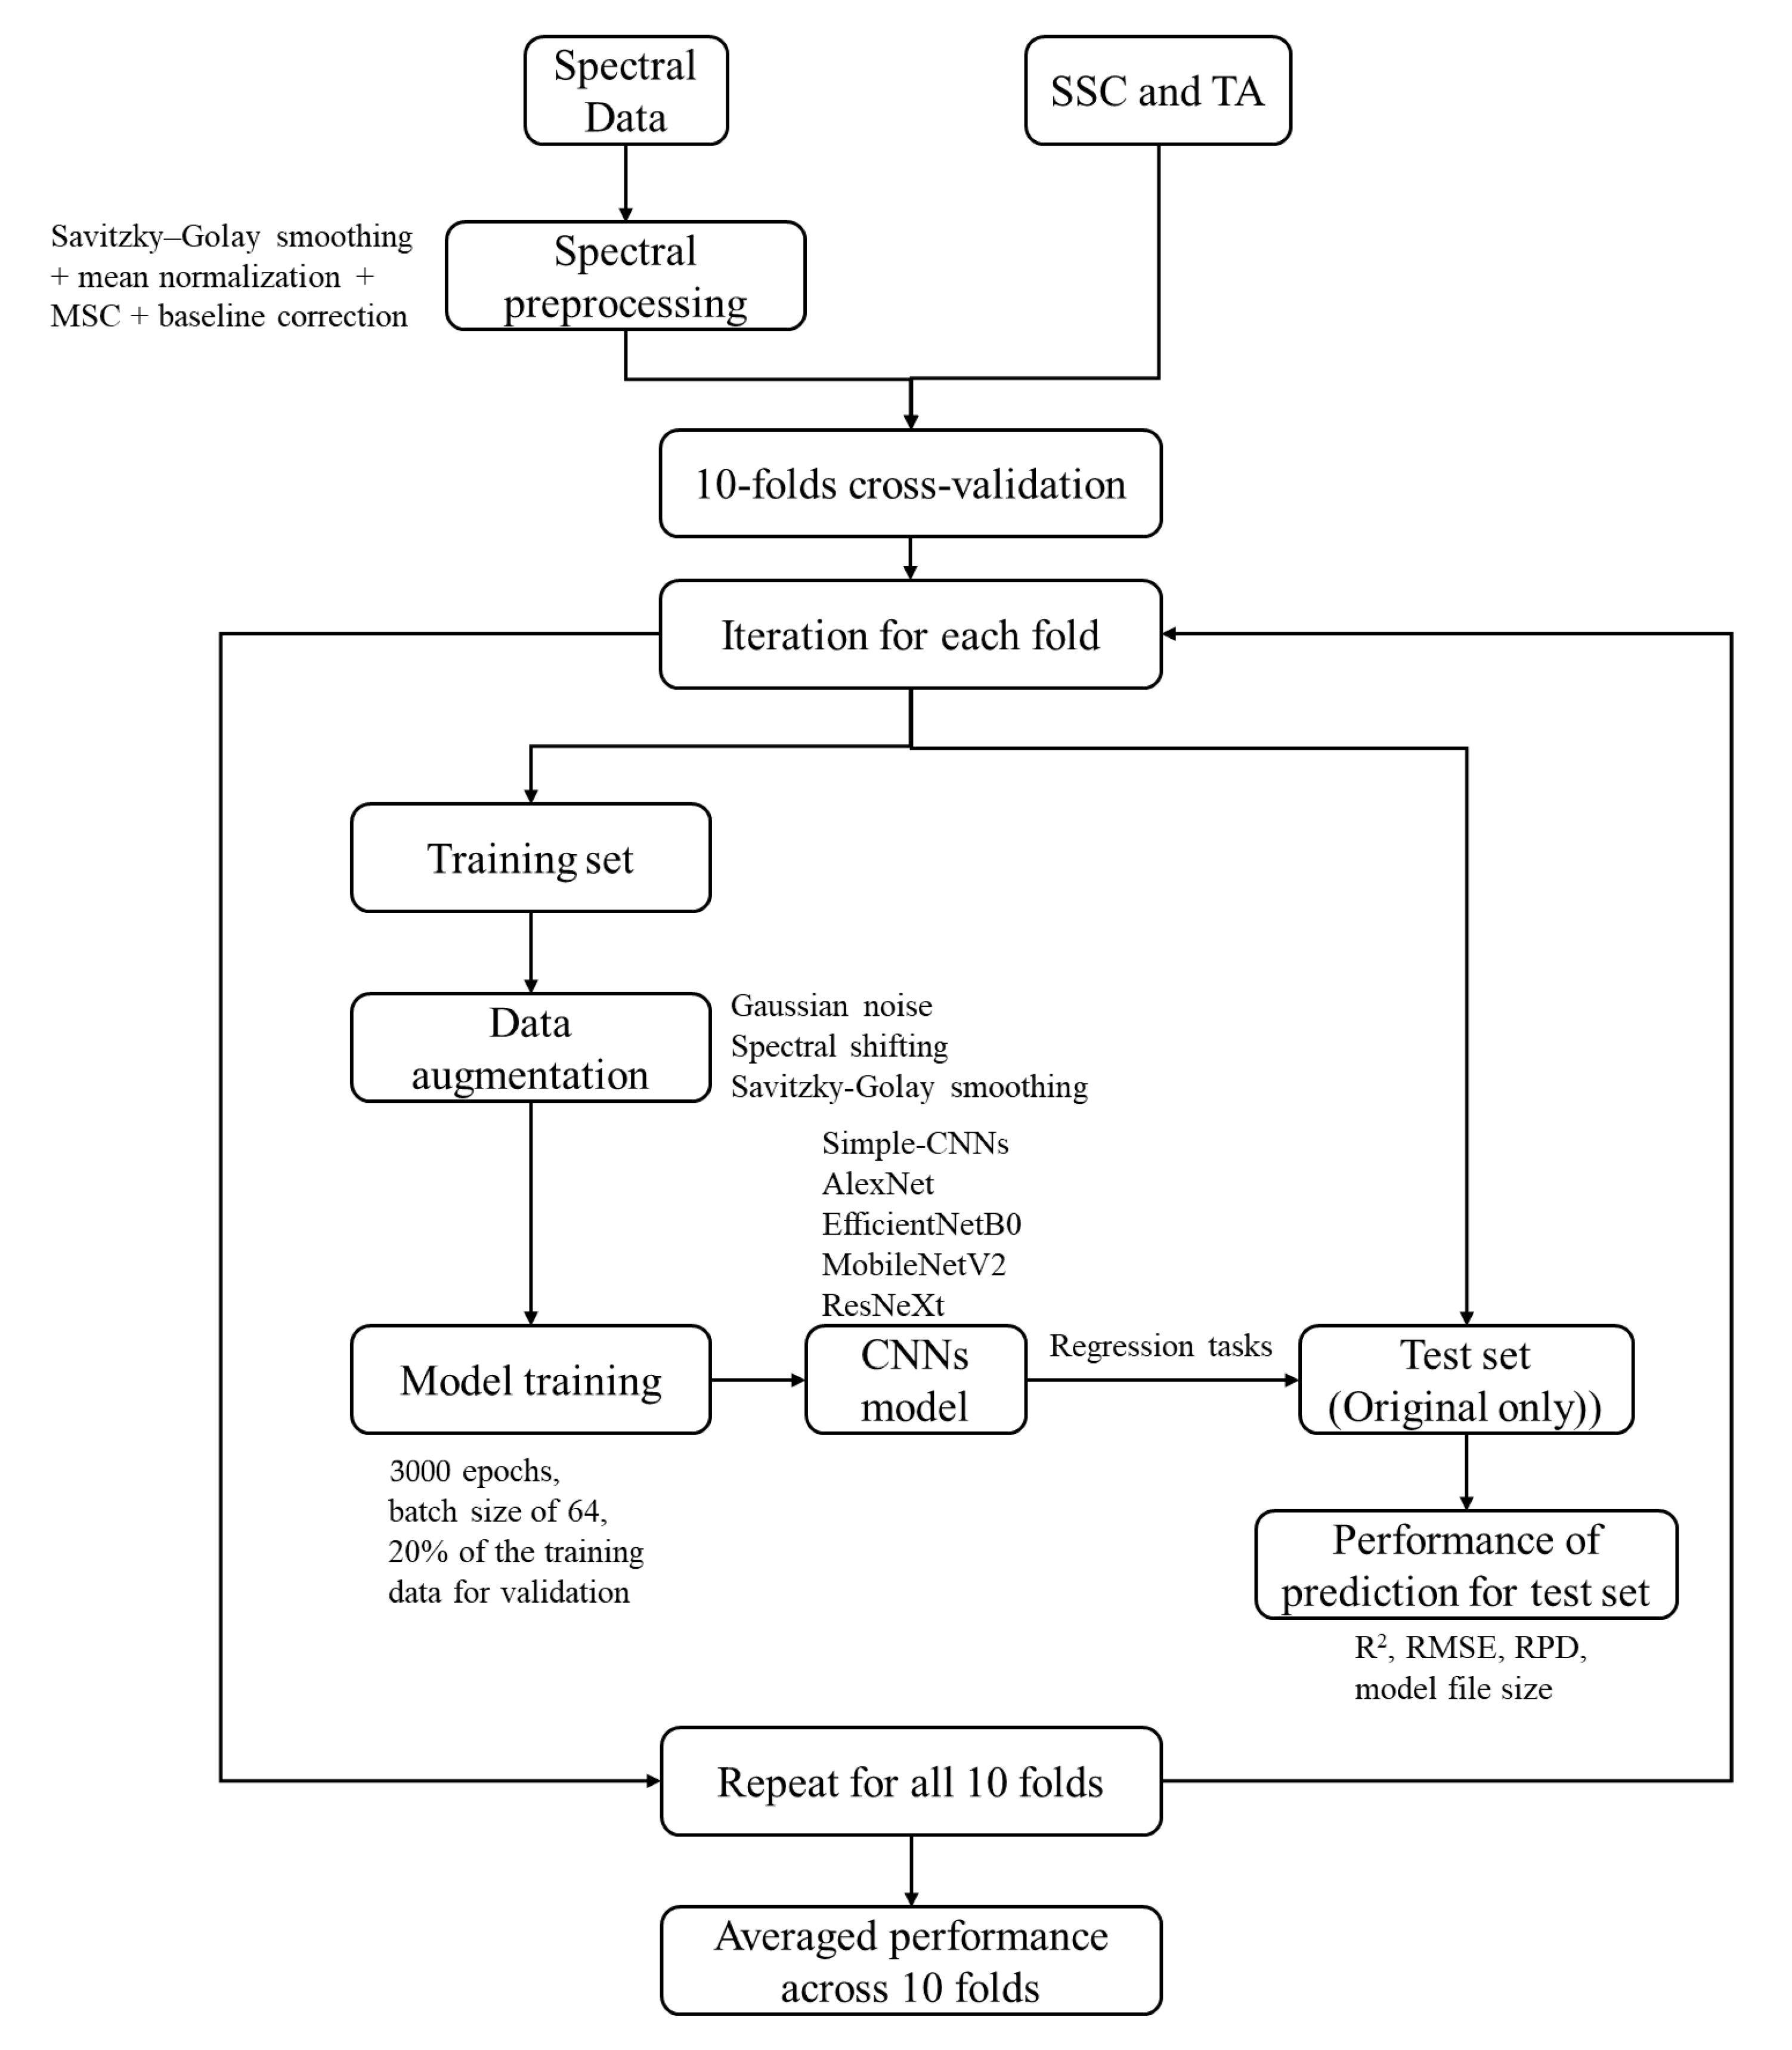
Although AlexNet, EfficientNet-B0, MobileNetV2, and ResNeXt were originally developed for image classification tasks, they can be adapted for regression problems using one-dimensional data. This adaptation is typically achieved by modifying the final fully connected layers of the pre-trained architecture, replacing the classification-specific output (e.g., softmax) with a linear activation function suitable for regression tasks. To train all CNN to predict the SSC and TA of mango and mangosteen purée, the mean squared error (MSE) loss function was employed in conjunction with the Adam optimizer. The training process was executed for 1000 epochs with a batch size of 64, using 20% of the training data for validation. To ensure that the best-performing model weights were saved during training, the ModelCheckpoint callback from the TensorFlow (version 2.18.0) package was employed. The optimal model, identified based on the lowest validation loss, was saved in the keras file format, which stores all essential information needed for future evaluation or deployment. After the training process, the optimal model was adopted to predict the SSC and TA of the testing set, and the performance of this model was evaluated using the coefficient of determination (R2), root mean square error (RMSE), and the ratio of prediction to deviation (RPD). The procedure was performed across all 10 folds, and after completing the 10 iterations, the performance parameters were averaged to obtain the results (i.e., R CV 2 , RMSECV, and RPDCV). Figure 2 presents the algorithmic flow diagram of the CNN modeling process.

2.6. Partial Least Squares Regression (PLSR)

PLSR is a classic chemometric method that converts correlated spectral variables into latent components to reveal linear patterns in NIR data. In this study, PLSR was used to predict TSS and TA in mango and mangosteen purée, serving as a benchmark for evaluating deep learning models. The original preprocessed spectra were used to create the PLSR models, which were evaluated using 10-fold cross-validation, with the optimal number of latent variables determined through GridSearchCV in Scikit-learn [25]. The performance of the models was also reported with R C V 2 , RMSECV, and RPDCV.

2.7. Statistical Analysis

The performance parameters ( R CV 2 , RMSECV, and RPDCV) of the PLSR and DL models were compared using one-way ANOVA and Duncan’s multiple range tests at the 95% confidence interval. The DL model with the lowest RMSE was compared to PLSR using a t-test at a p-value of 0.05 to assess whether their performance differences were statistically significant.

3. Results

3.1. Spectral Characteristics

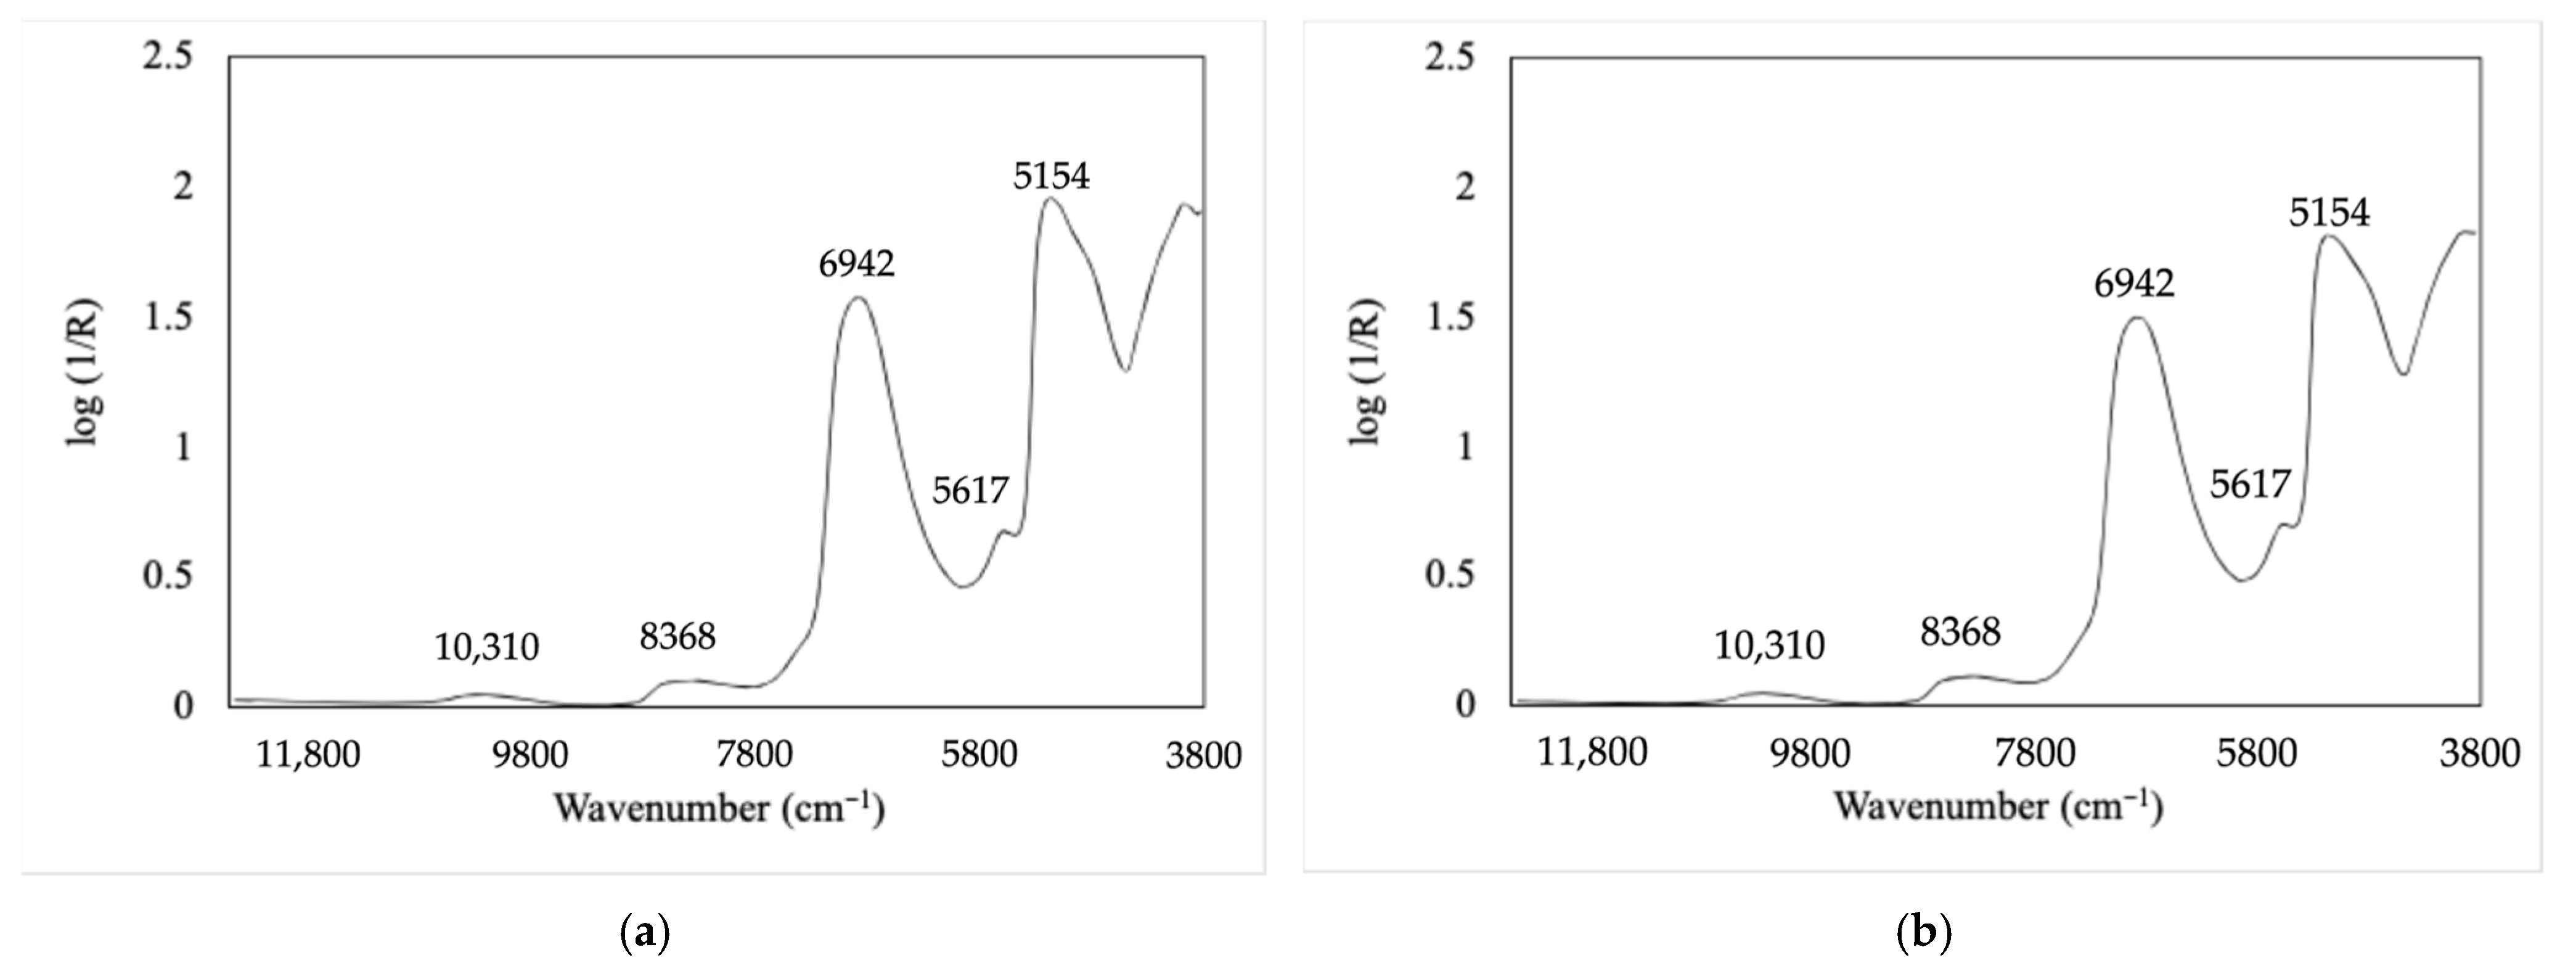
Figure 3 shows the average preprocessed spectra of mango and mangosteen purée, displaying the same obvious peaks at 10,310, 8368, 6942, 5617, and 5154 cm−1 (970, 1195, 1440, 1780, and 1940 nm). The absorption at 10,310 cm−1 (970 nm) and 5154 cm−1 (1940 nm) represents the second overtone and combination vibration of O-H stretching and deformation of the water molecules [26]. Similarly, the absorption at 5565 cm−1 (around 1780 nm) corresponds to the first overtone of C-H stretching of cellulose. In addition, the pronounced peaks observed at 8368 cm−1 (1195 nm) and 6942 cm−1 (1440 nm) are related to CH2 and starch [27], respectively. Mango and mangosteen purées contain key constituents such as water, organic acids, cellulose, and starch, which are indicative of their sweetness and sourness. Understanding these characteristic peaks is essential for accurately modeling SSC and TA, as they directly reflect the chemical composition associated with sweetness and sourness in purée samples.

3.2. Statistical Results of SSC and TA

Table 1 presents the statistical parameters of SSC and TA, which were used as reference values for developing the CNN models of mango and mangosteen purée. For mango purée, the SSC values (N = 96 samples) ranged from 14.2 to 23.2, with a mean of 18.5 and a standard deviation (SD) of 2.2. The TA values were between 0.023 and 0.668, with a mean of 0.190 and an SD of 0.104. For mangosteen purée, SSC values ranged from 13.3 to 16.4, with a mean of 14.8 and an SD of 0.8. TA values were observed in a narrower range (0.374–0.573), with a mean of approximately 0.492–0.493 and an SD of 0.048.

3.3. Performance of Model

Table 2 summarizes the comparative performance of PLSR and five CNN architectures, namely Simple-CNN, AlexNet, EfficientNetB0, MobileNetV2, and ResNeXt, in predicting the SSC (% Brix) and TA (% malic acid) of mango and mangosteen purée. For the SSC prediction of mango purée, Simple-CNN demonstrated the highest R CV 2 value (0.914 ± 0.046) relative to the other models. Inconsistent results were observed for EfficientNet-B0, which yielded the highest RPDCV value but did not achieve the highest R CV 2 or the lowest RMSECV compared with the other models. This may be attributed to the high variability in the prediction results, as reflected by the large SD of the RPDCV values. Nevertheless, the ANOVA analysis of all performance parameters ( R CV 2 , RMSECV, and RPDCV) indicated that the models could be statistically divided into two performance groups, with Group 1 including PLSR, Simple-CNN, and EfficientNet-B0, while Group 2 comprised AlexNet, MobileNetV2, and ResNeXt. The models classified in Group 1 demonstrated better predictive performance than those in Group 2, characterized by a significantly higher R CV 2 and RPDCV and a lower RMSECV. According to Table 3, the DL model (Simple-CNN) performed much better than PLSR, as indicated by its t-test result of p = 0.029. These results indicate that the Simple-CNN model achieved higher predictive performance for the TSS of mango purée compared with PLSR. In the prediction of TA for mango purée, the models showed no statistically significant differences in R CV 2 and RPDCV. In terms of RMSECV, the Simple-CNN model was significantly different from the other models, including PLSR. The prediction of TA in mango purée using the Simple-CNN model achieved an R CV 2 of 0.762 ± 0.196, an RMSECV of 0.037 ± 0.008% malic acid, and an RPDCV of 2.864 ± 1.869, indicating satisfactory predictive performance. Although the R CV 2 was not particularly high, the RPDCV value above 2.5 (2.864 ± 1.869), together with the low RMSECV (0.037 ± 0.008% malic acid), indicates acceptable performance. According to Williams et al. (2019) [28], models with an RPD greater than 2.5 are considered good for approximate quantitative predictions. The t-test comparison between Simple-CNN and PLSR produced a p-value of 0.001, which confirms that Simple-CNN exhibited a significantly lower prediction error compared with the conventional PLSR model (Table 3). For the prediction of the SSC for mangosteen purée, the DL models, especially the Simple-CNN and AlexNet models, demonstrated significantly superior performance over PLSR with respect to R CV 2 , RMSECV, and RPDCV. The AlexNet model yielded the highest R CV 2 (0.702 ± 0.258) and RPDCV (1.666 ± 0.527), together with the lowest RMSECV (0.471 ± 0.109% Brix), indicating its superior predictive performance compared with the other models. The RPDCV of this model was lower than 2 and based on the guidelines of Williams et al. (2019) [28], models with an RPD below this threshold are considered to provide only the possibility for rough screening rather than reliable quantitative predictions. The result of the t-test on the RMSECV values (Table 3) revealed that AlexNet achieved a statistically significant reduction in prediction error compared with the conventional PLSR model. In the case of TA prediction for mangosteen purée, the predictive performance was rather unsatisfactory, as reflected by the low R CV 2 values ranging between 0.188 ± 0.175 and 0.360 ± 0.260. The performance of the models showed no statistically significant differences in all parameters ( R CV 2 , RMSECV, and RPDCV). Although AlexNet yielded the lowest RMSECV among the DL models, the t-test comparison with PLSR revealed no statistically significant difference in predictive performance, with a p-value of 0.292 (Table 3). The narrow distribution of TSS and TA values in mangosteen purée, as reflected by a low SD of 0.8 and 0.048 (Table 1) for TSS and TA, respectively, is likely to have contributed to this unsatisfactory predictive performance.
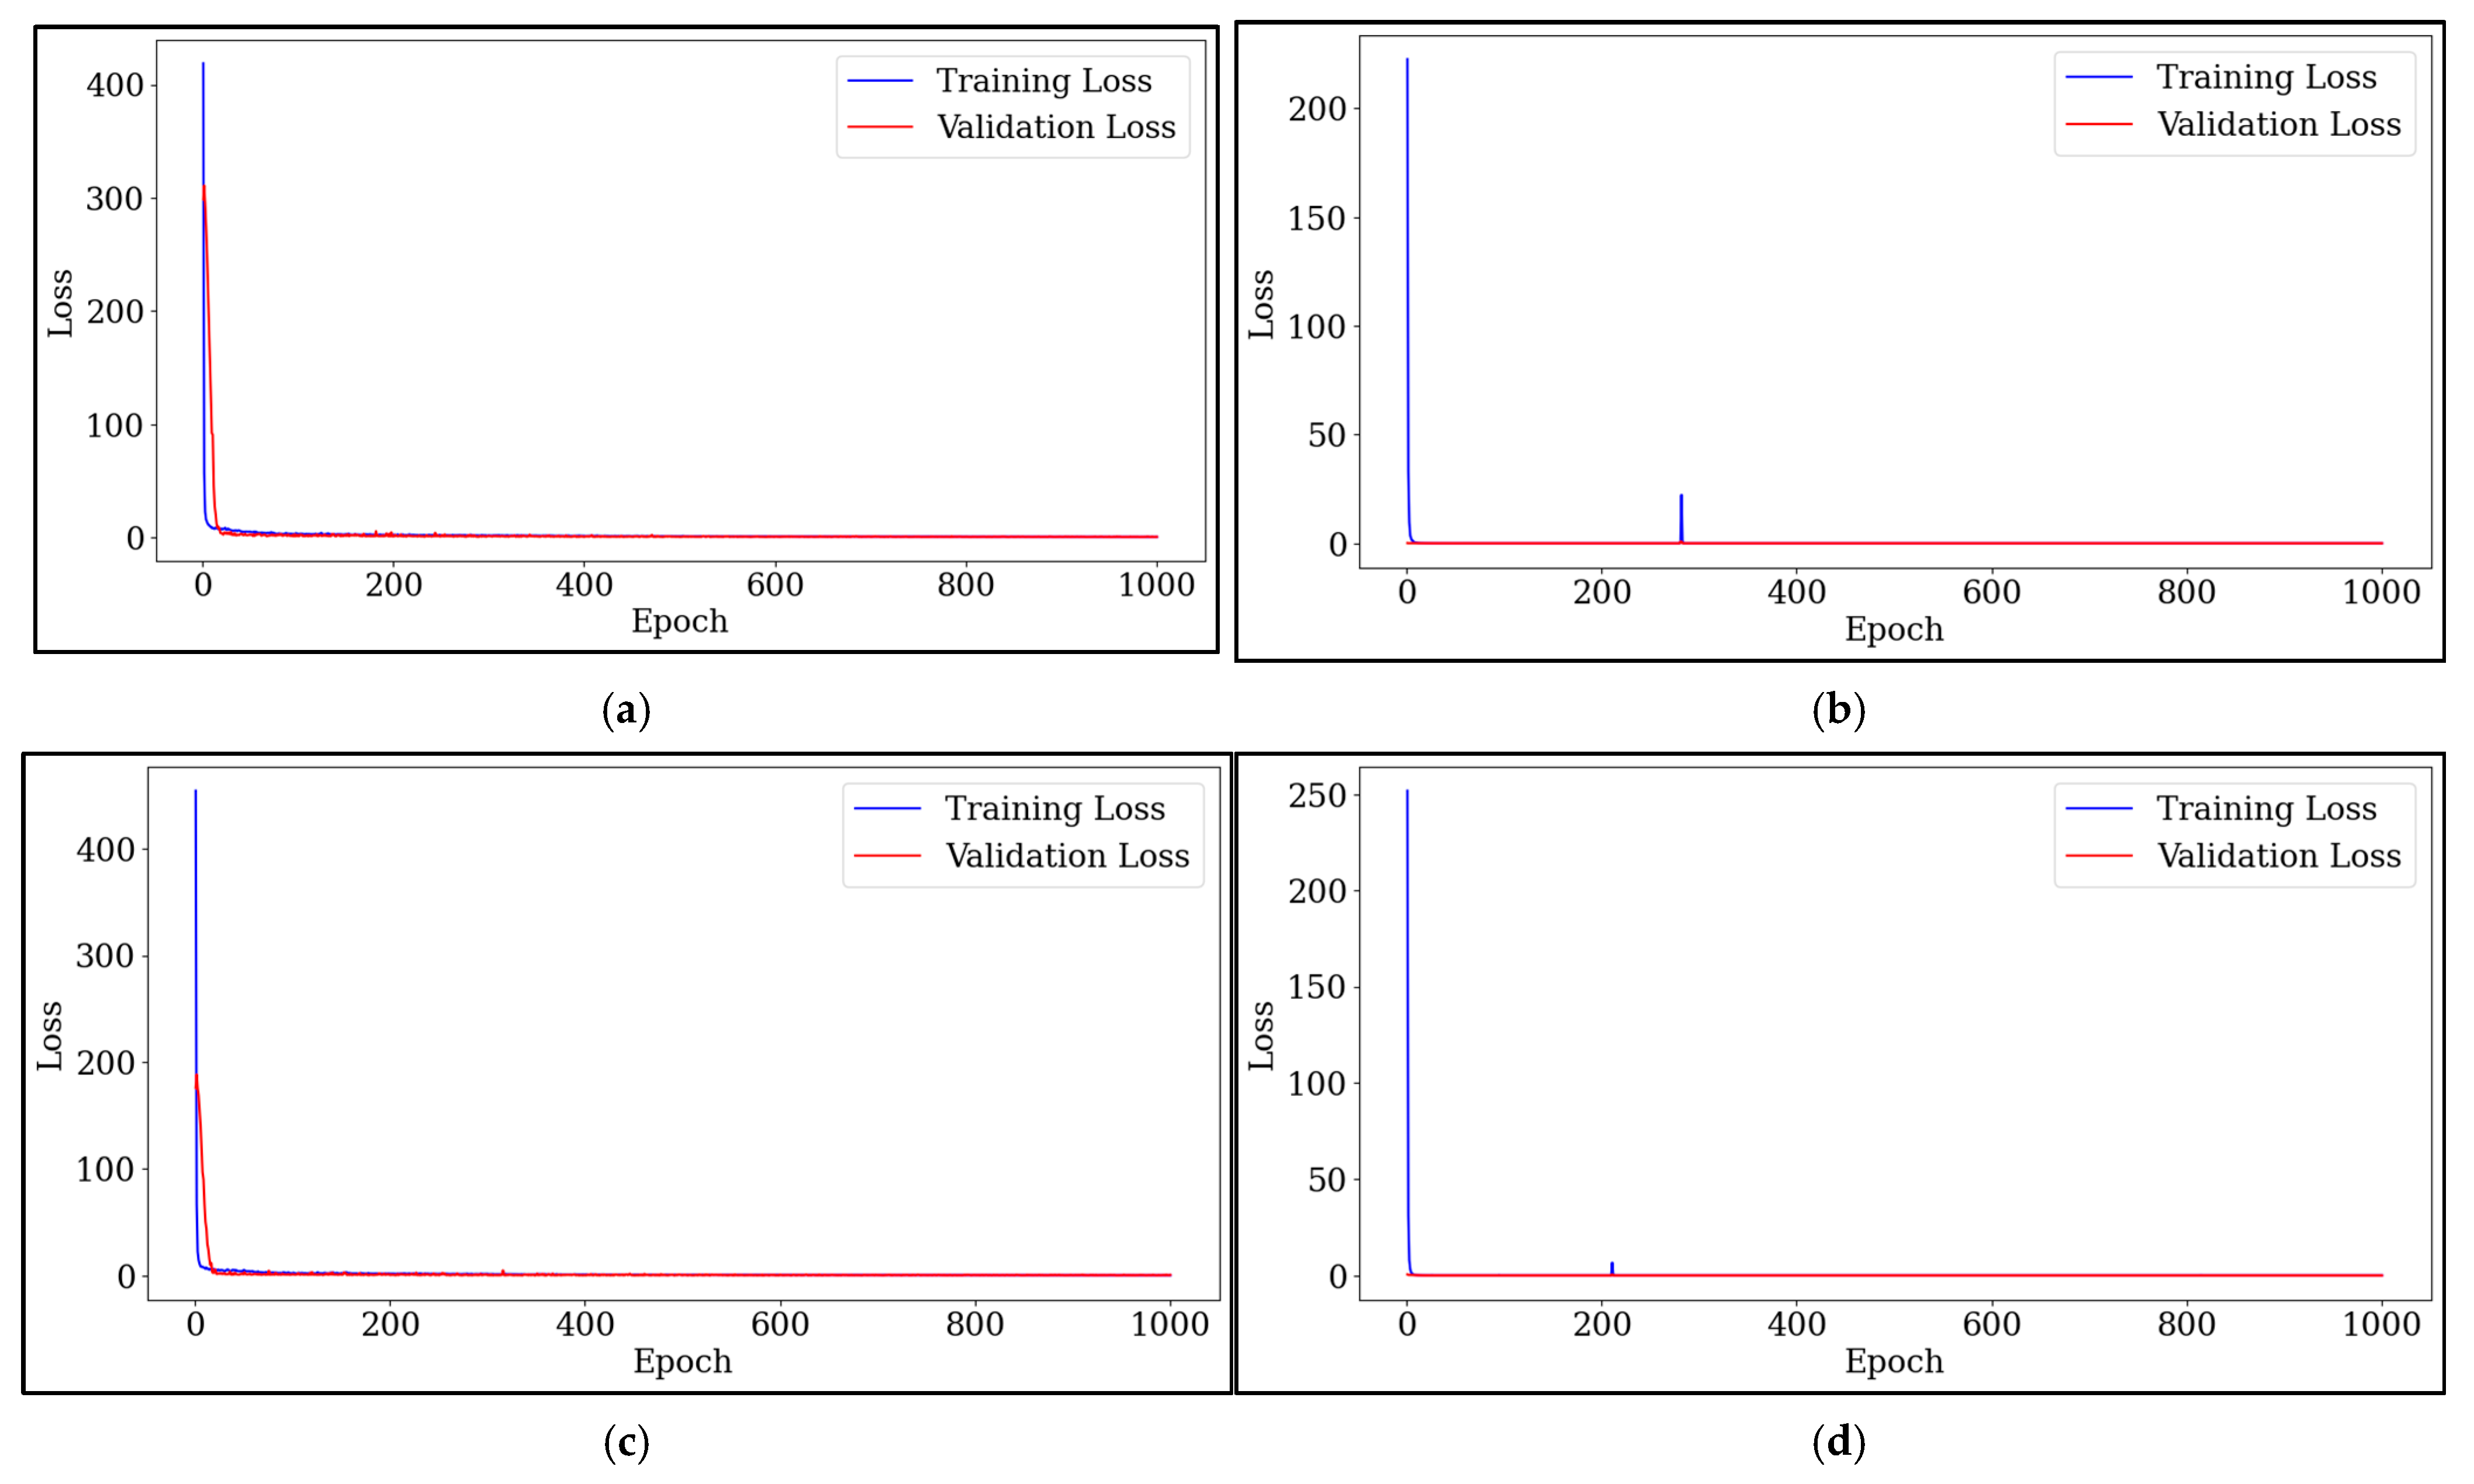
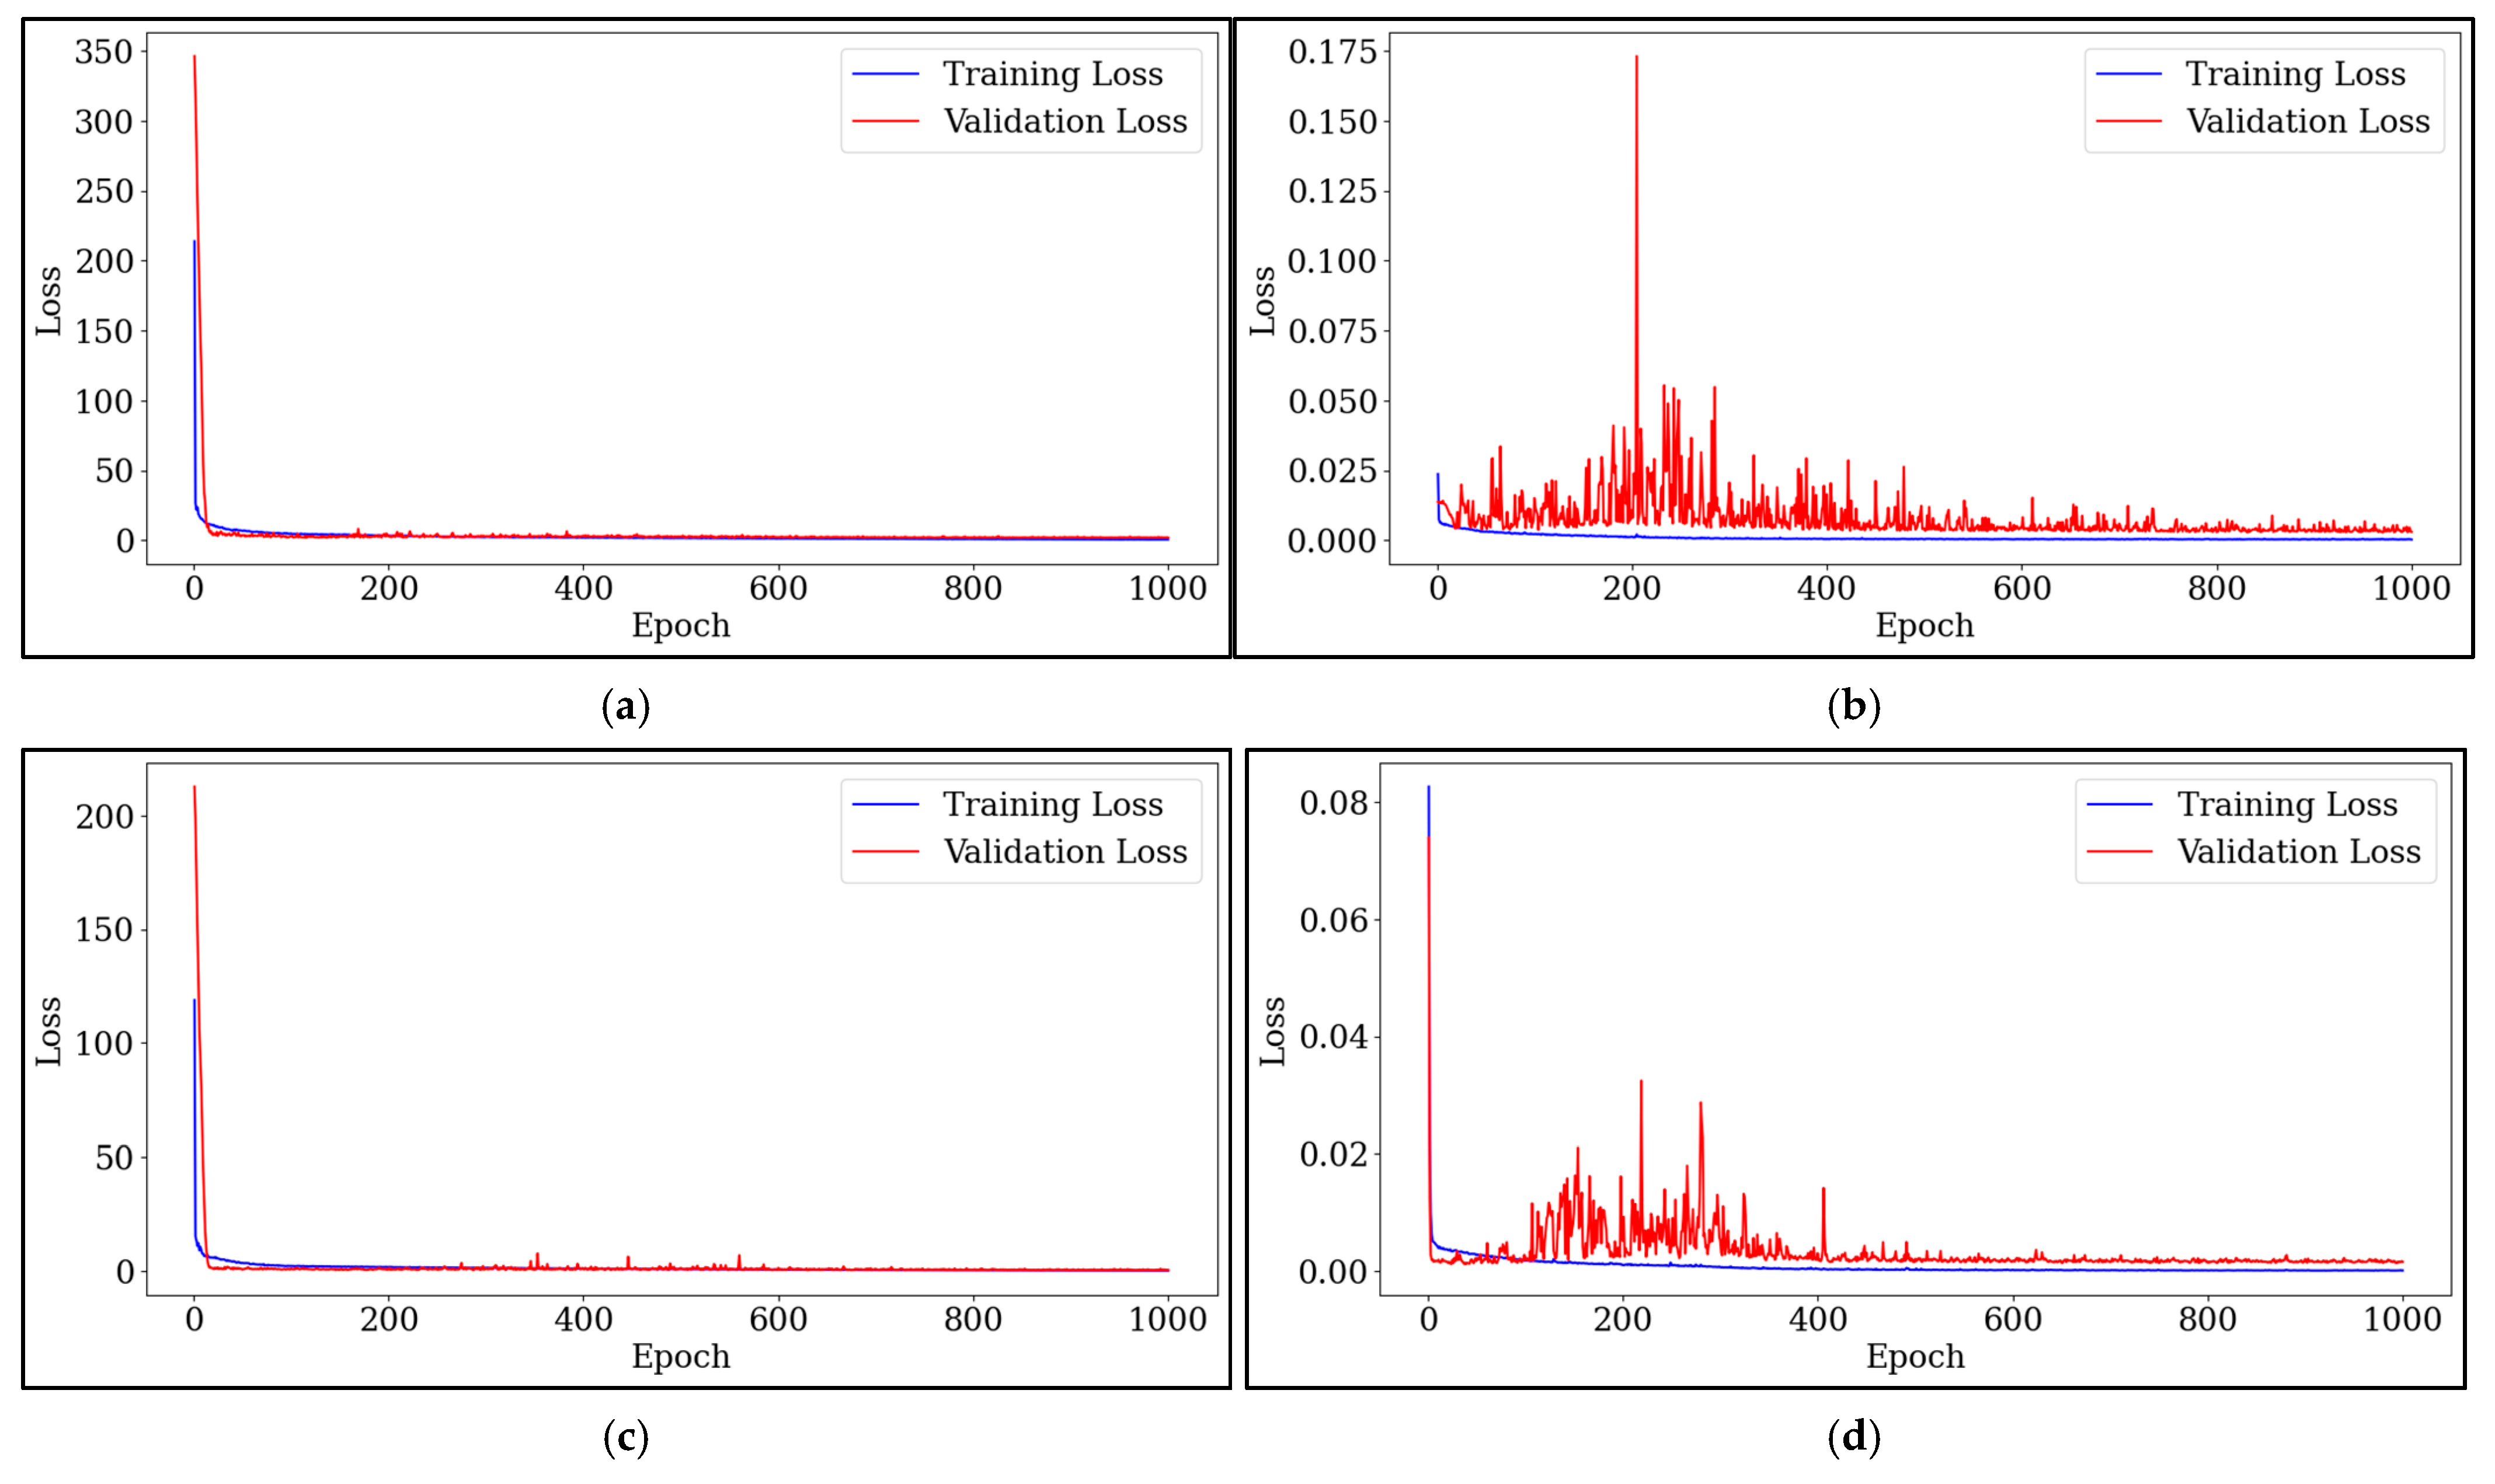
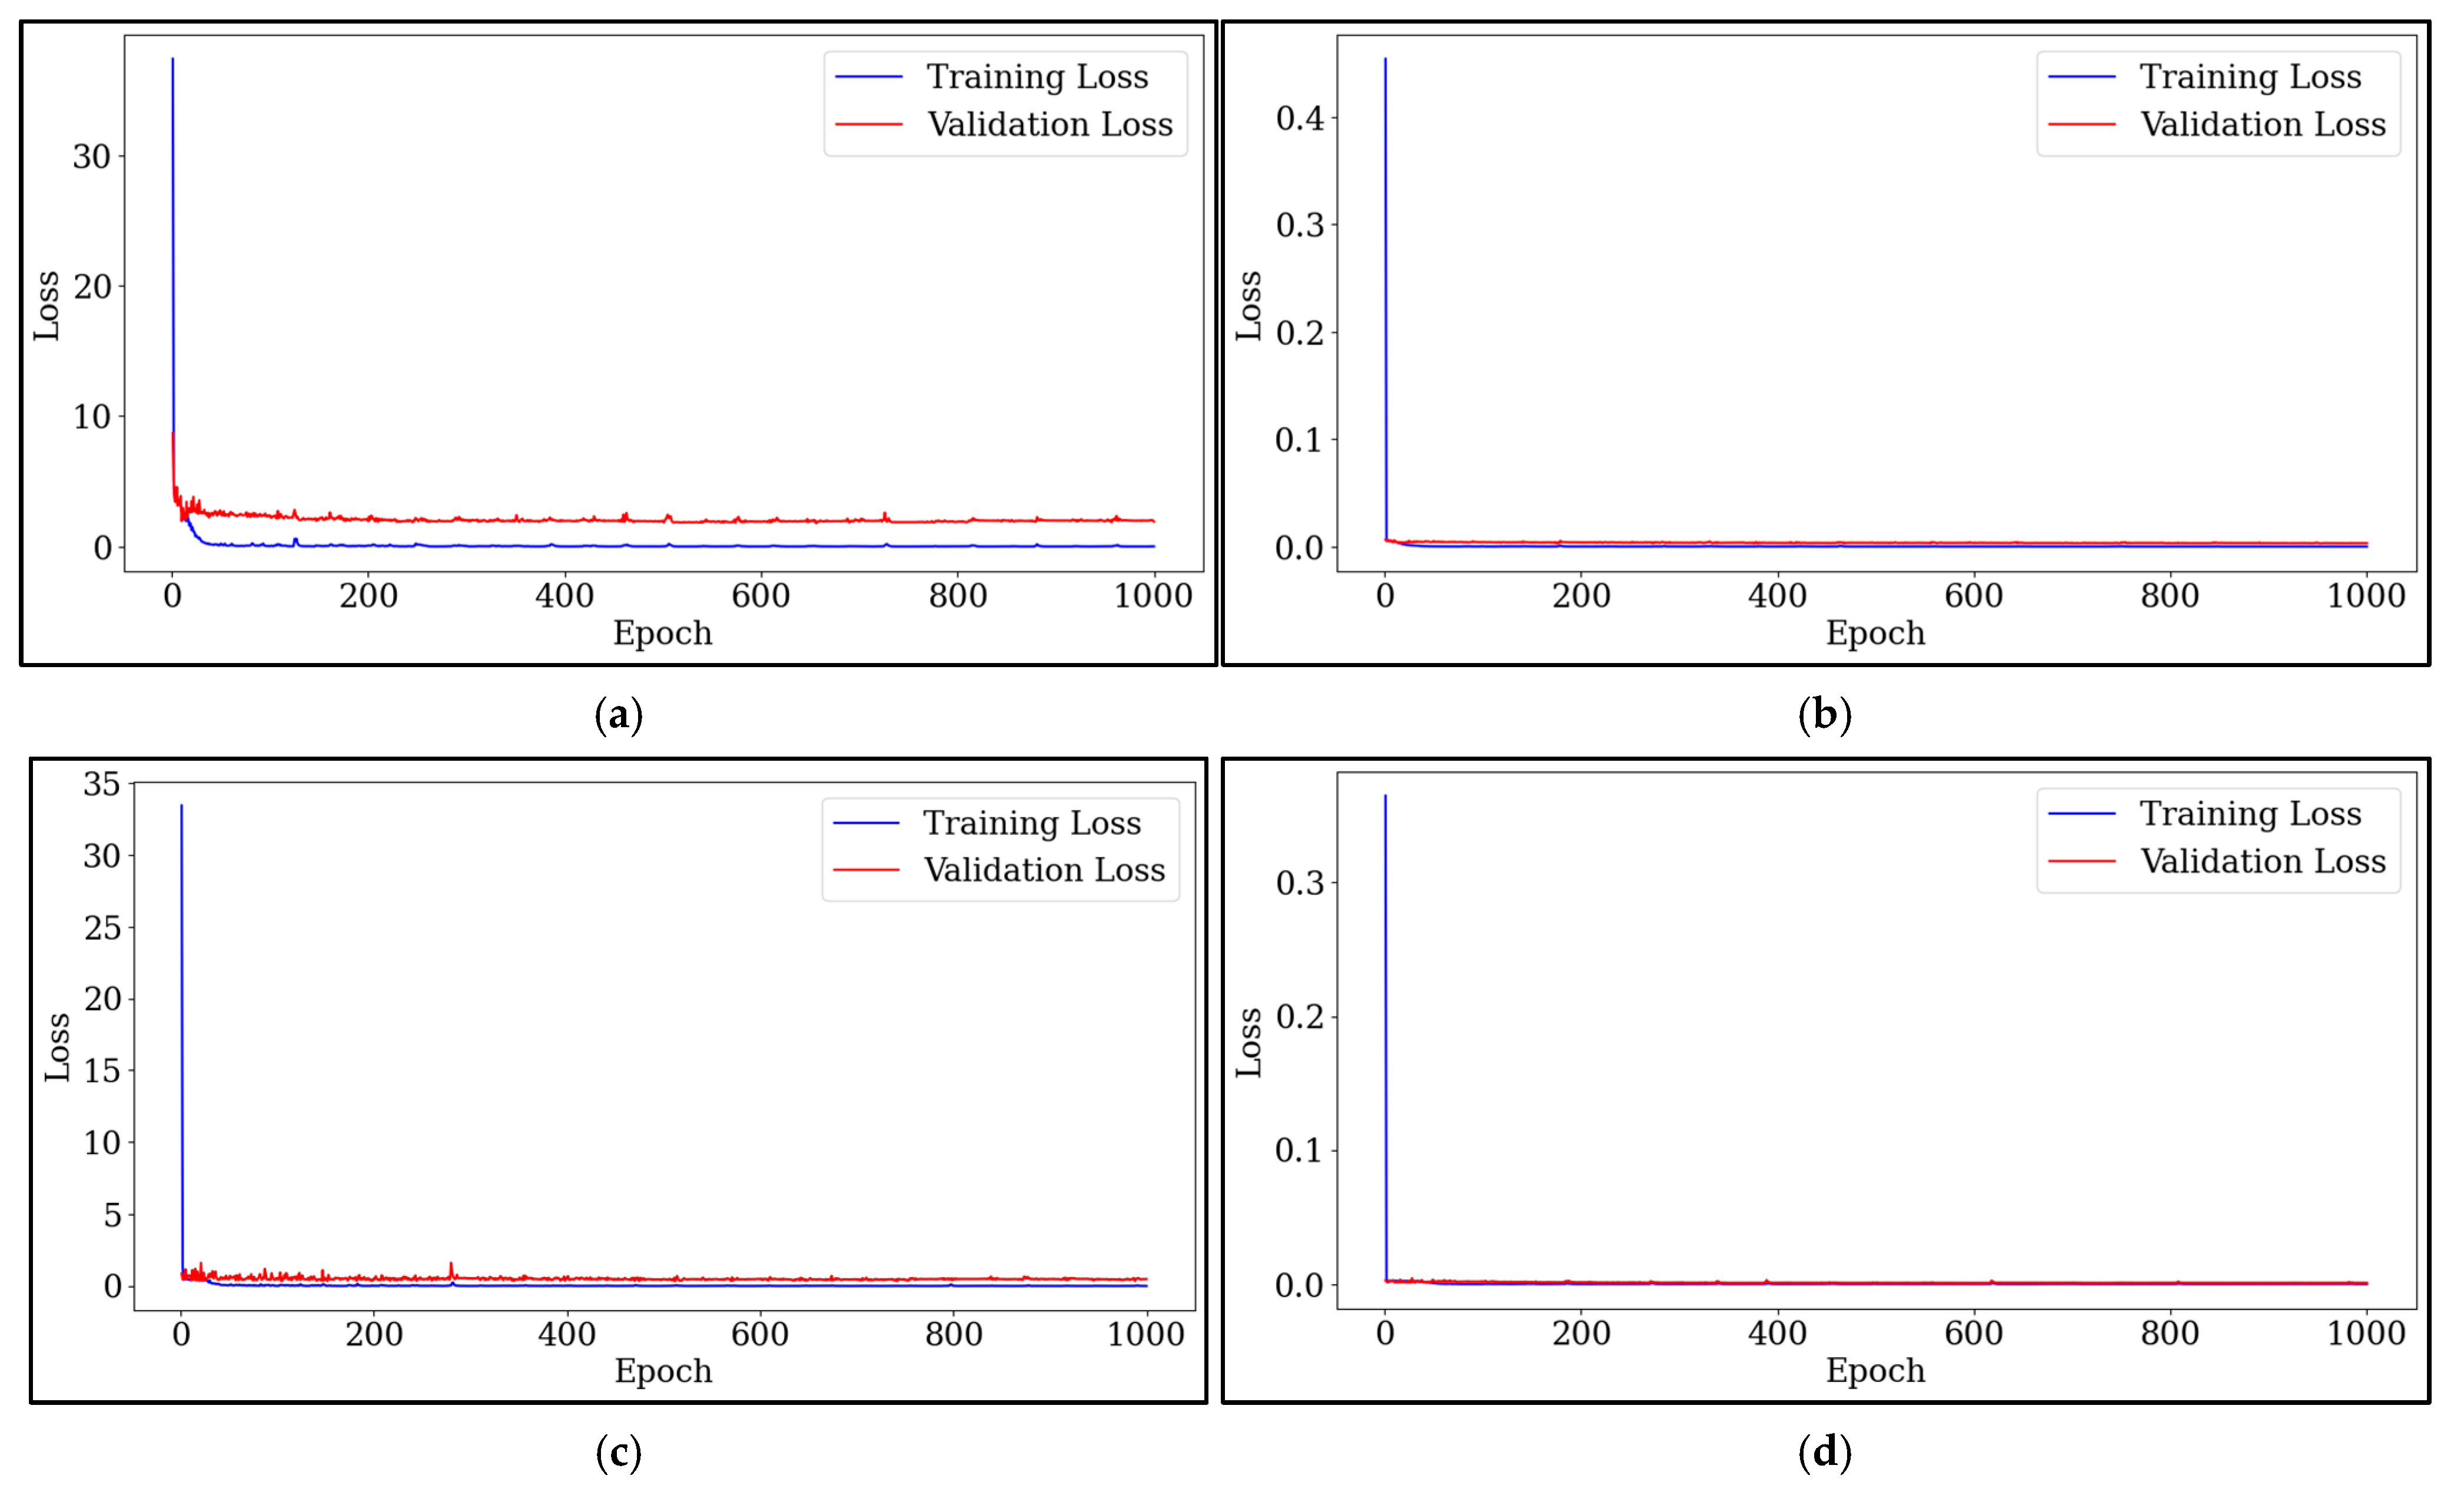
The training and validation losses of all DL models for SSC and TA in mango and mangosteen purée are shown in Appendix A. All models showed a rapid drop in training and validation losses within the first 100 epochs, and then gradually converged, except for EfficientNet-B0 predicting the TA of mango and mangosteen purée. As the training progresses, the loss values for both datasets gradually decrease and stabilize until the last epoch, which demonstrates the consistent learning behavior of these models. The training and validation loss curves converged to low values with a small gap, indicating that the model effectively learned from the training data. Conversely, when EfficientNet-B0 was applied to the TA of mango and mangosteen purée (Figure A3b,d), frequent fluctuations could be observed in validation loss during training, indicating potential issues with generalization stability and a risk of overfitting. This characteristic is commonly observed when models are still adjusting their parameters and attempting to generalize from the training data. This instability can also reflect variability in the validation dataset or slight overfitting occurring temporarily before the model stabilizes its learning process. However, both training and validation losses exhibited a decreasing trend and seemed to become relatively more stable after approximately 500 epochs, indicating that the learning rate and regularization settings of the EfficientNet-B0 model were well-tuned for training process.
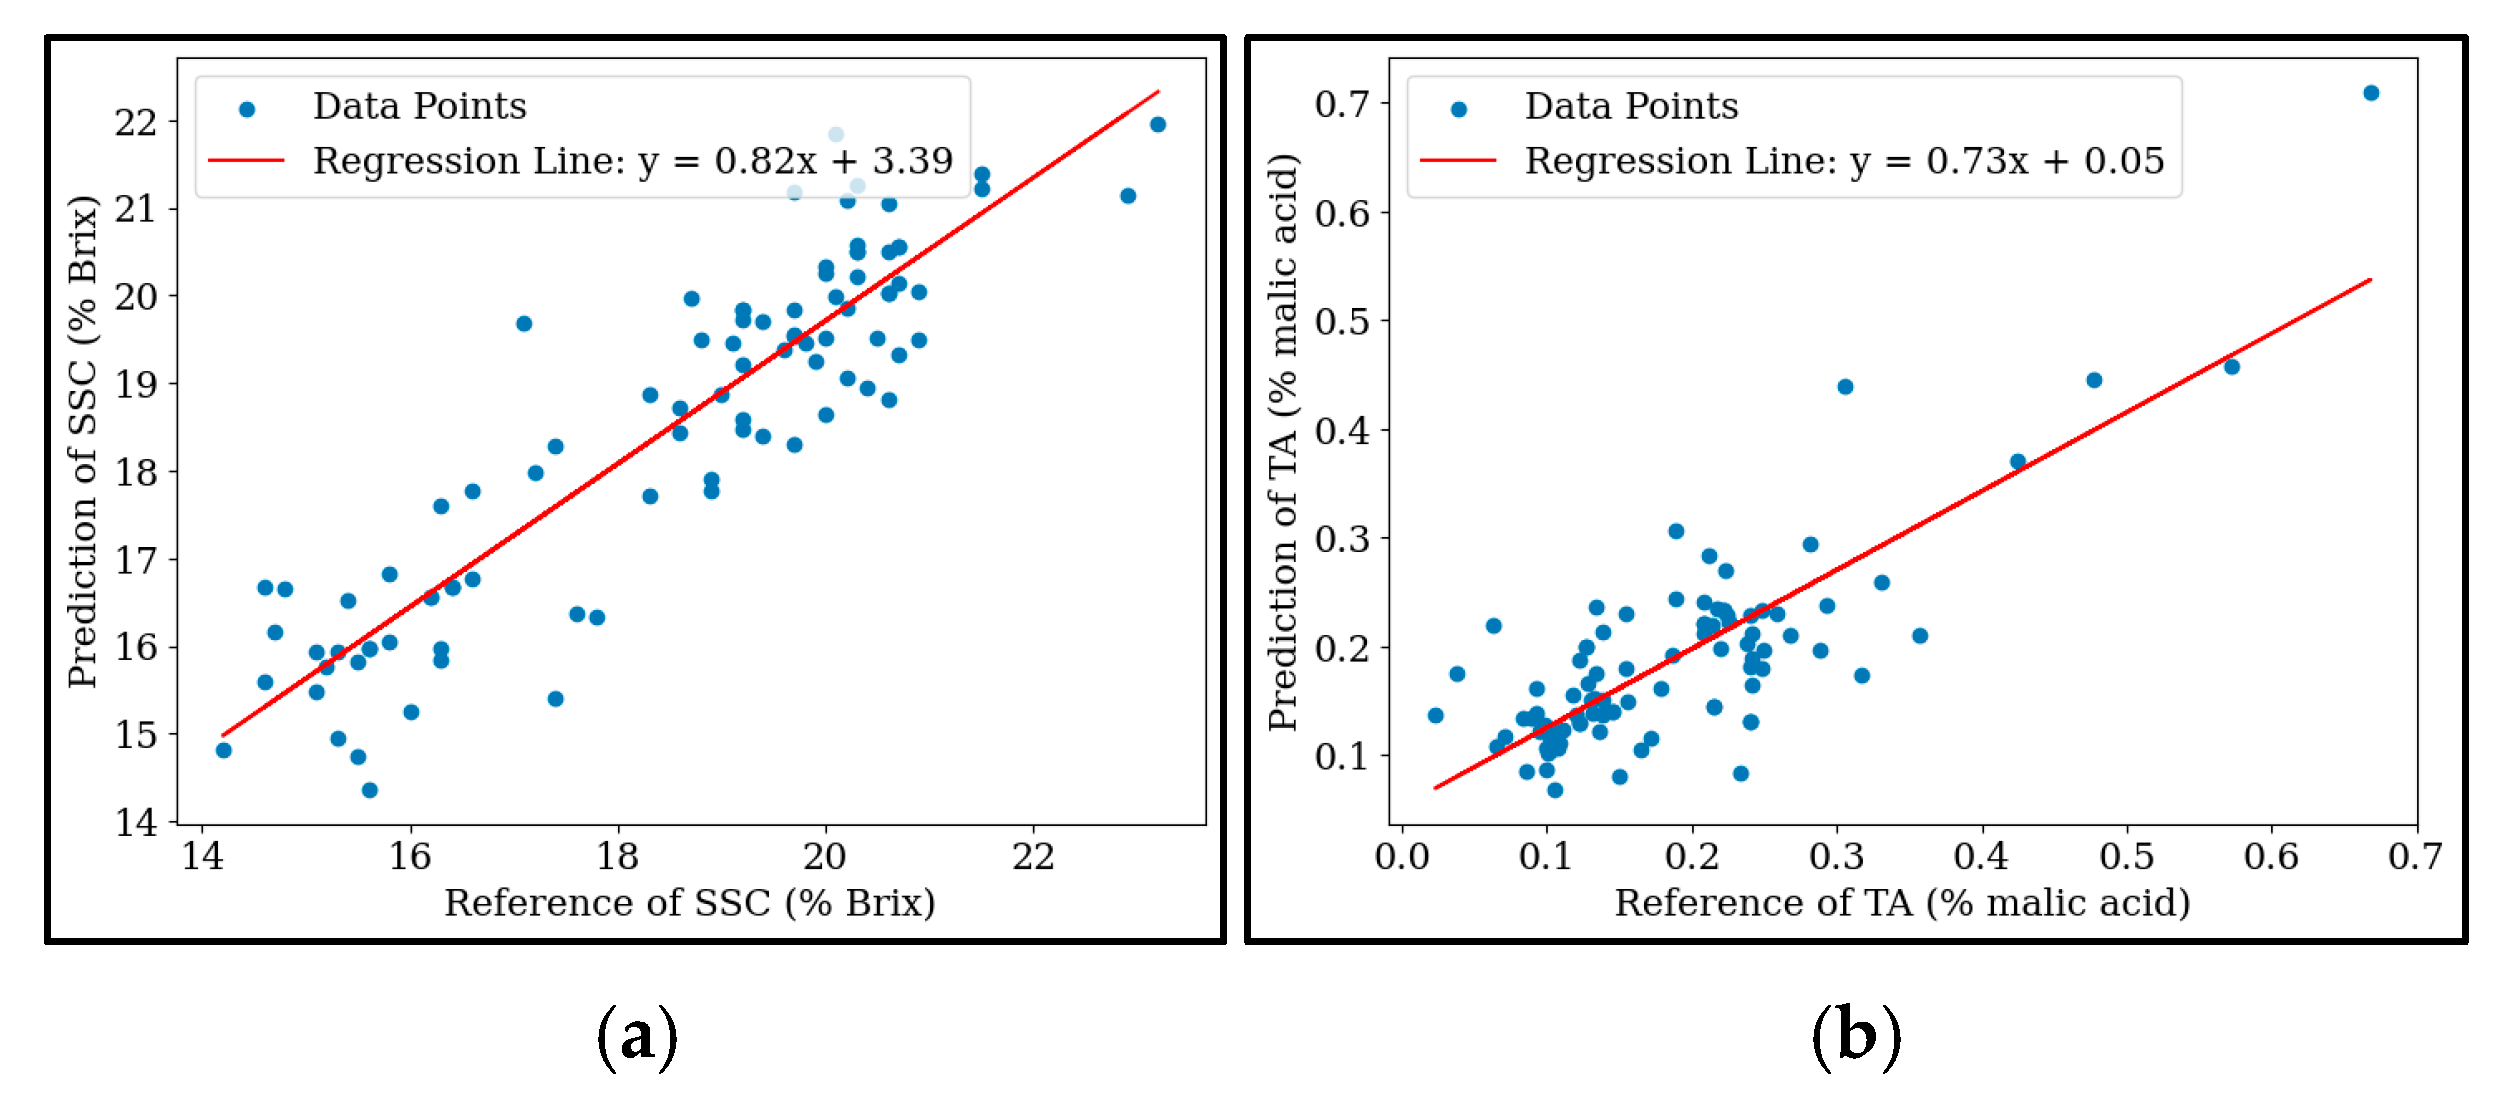
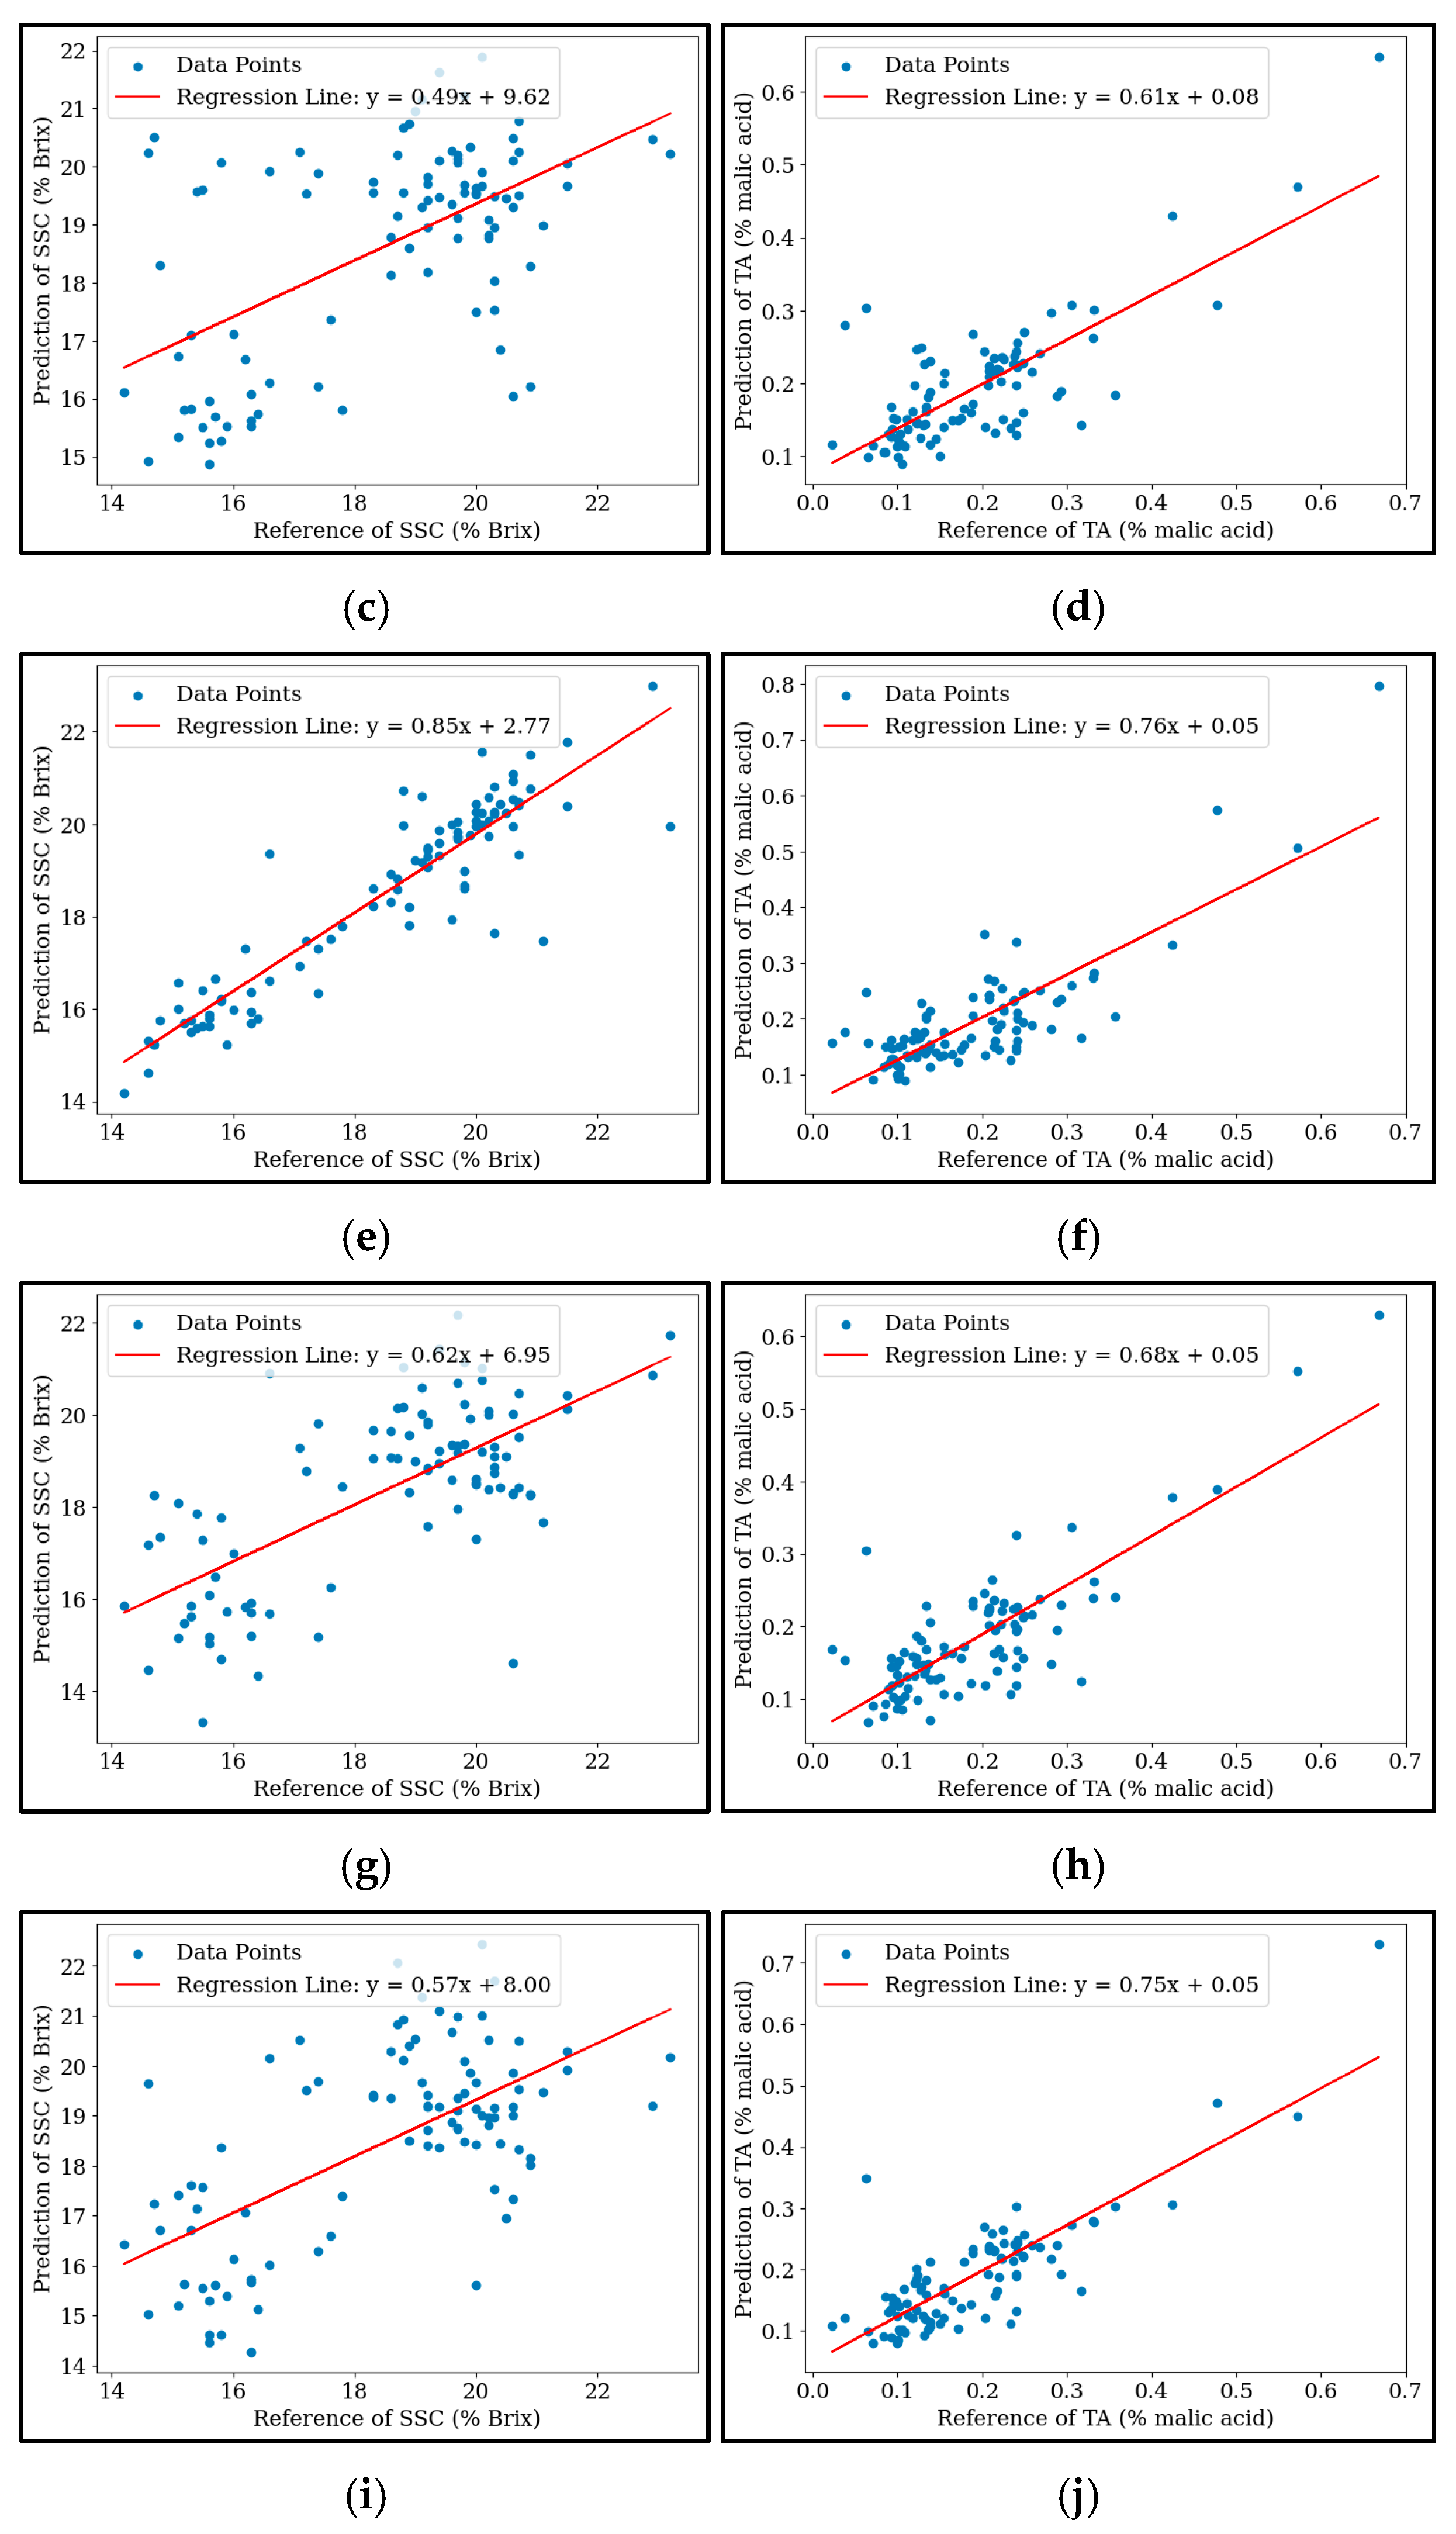
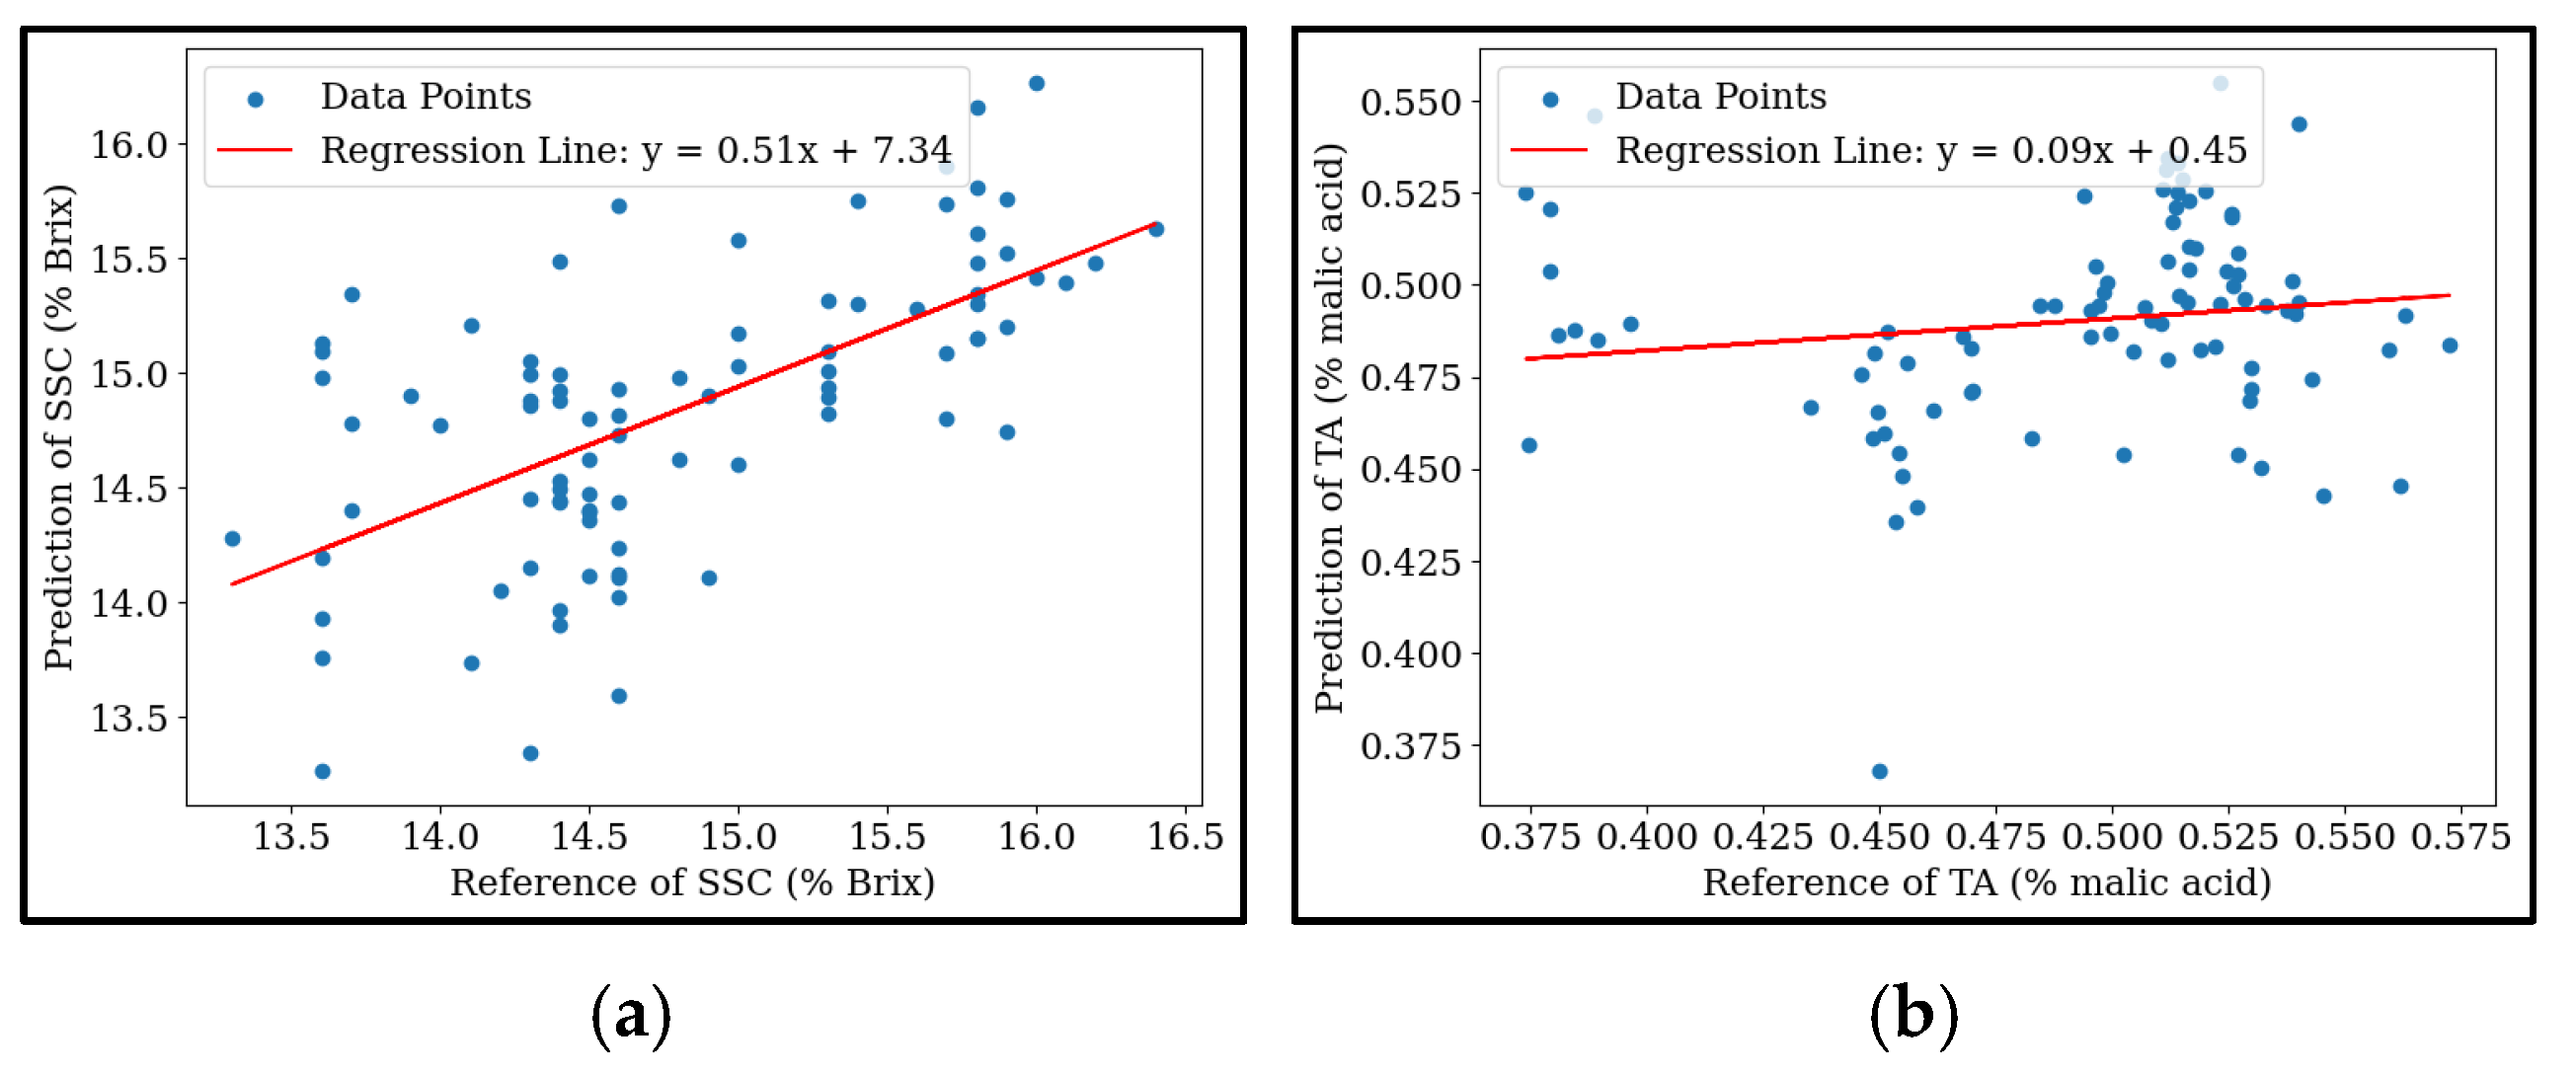
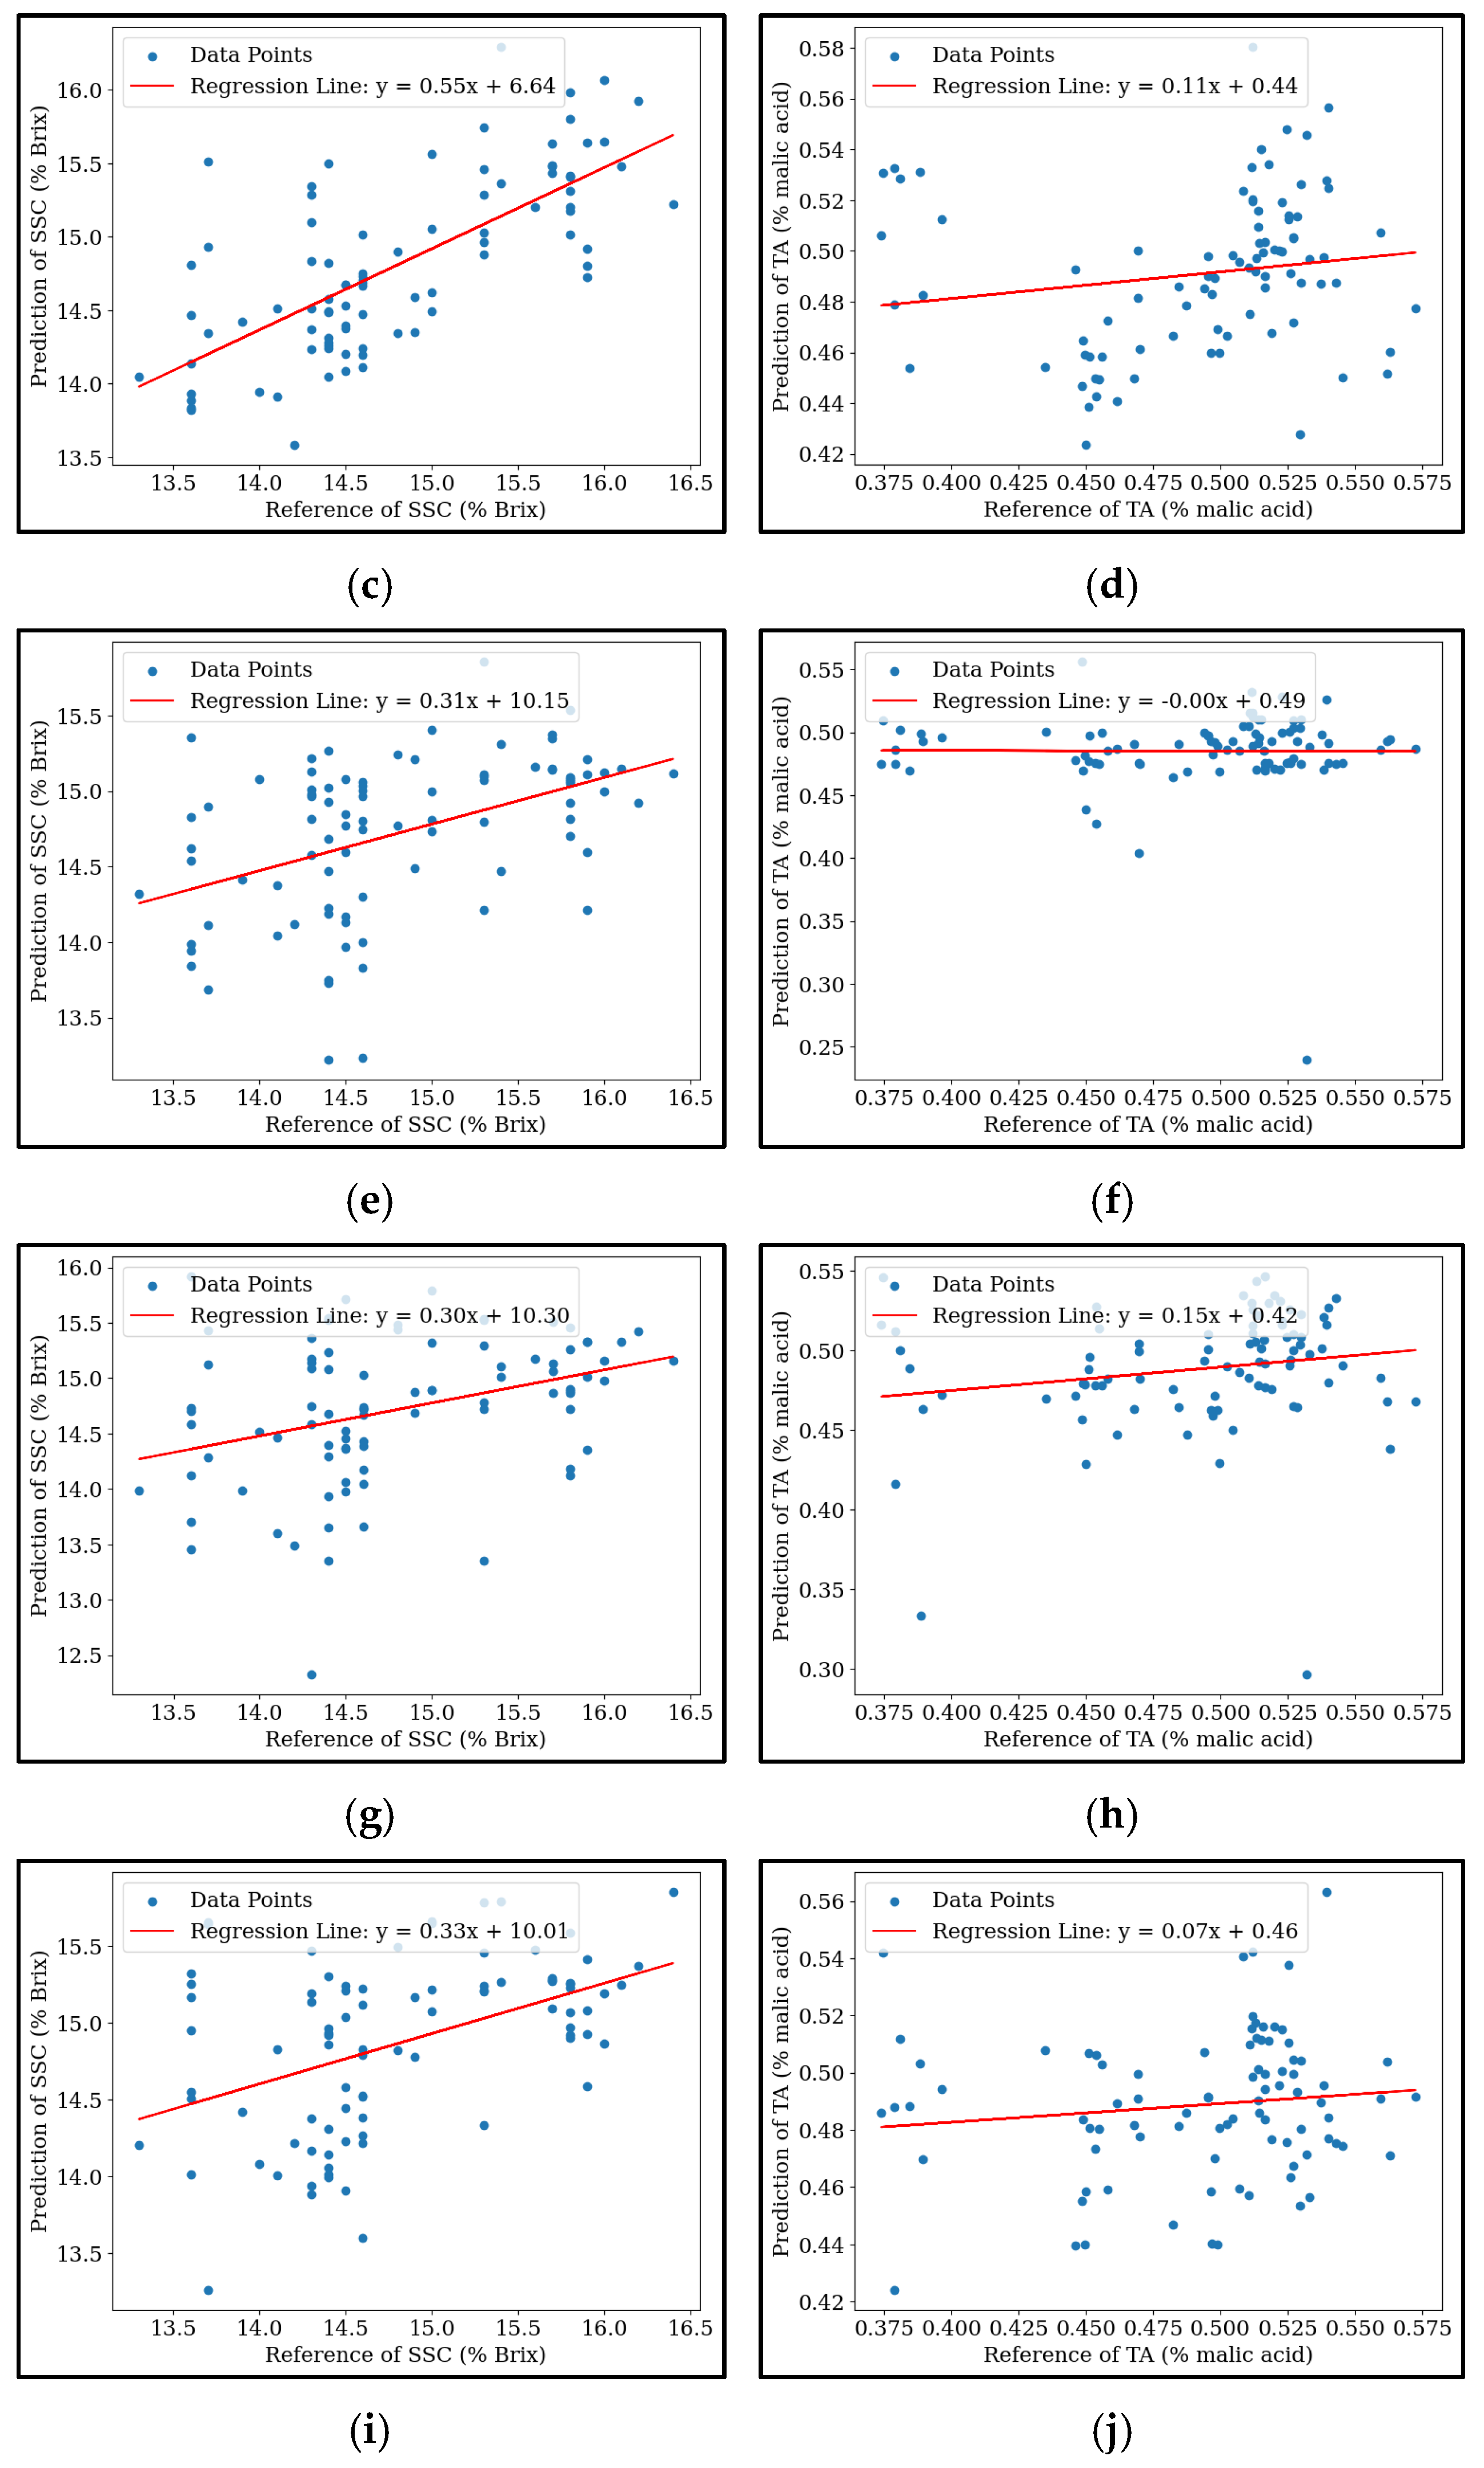
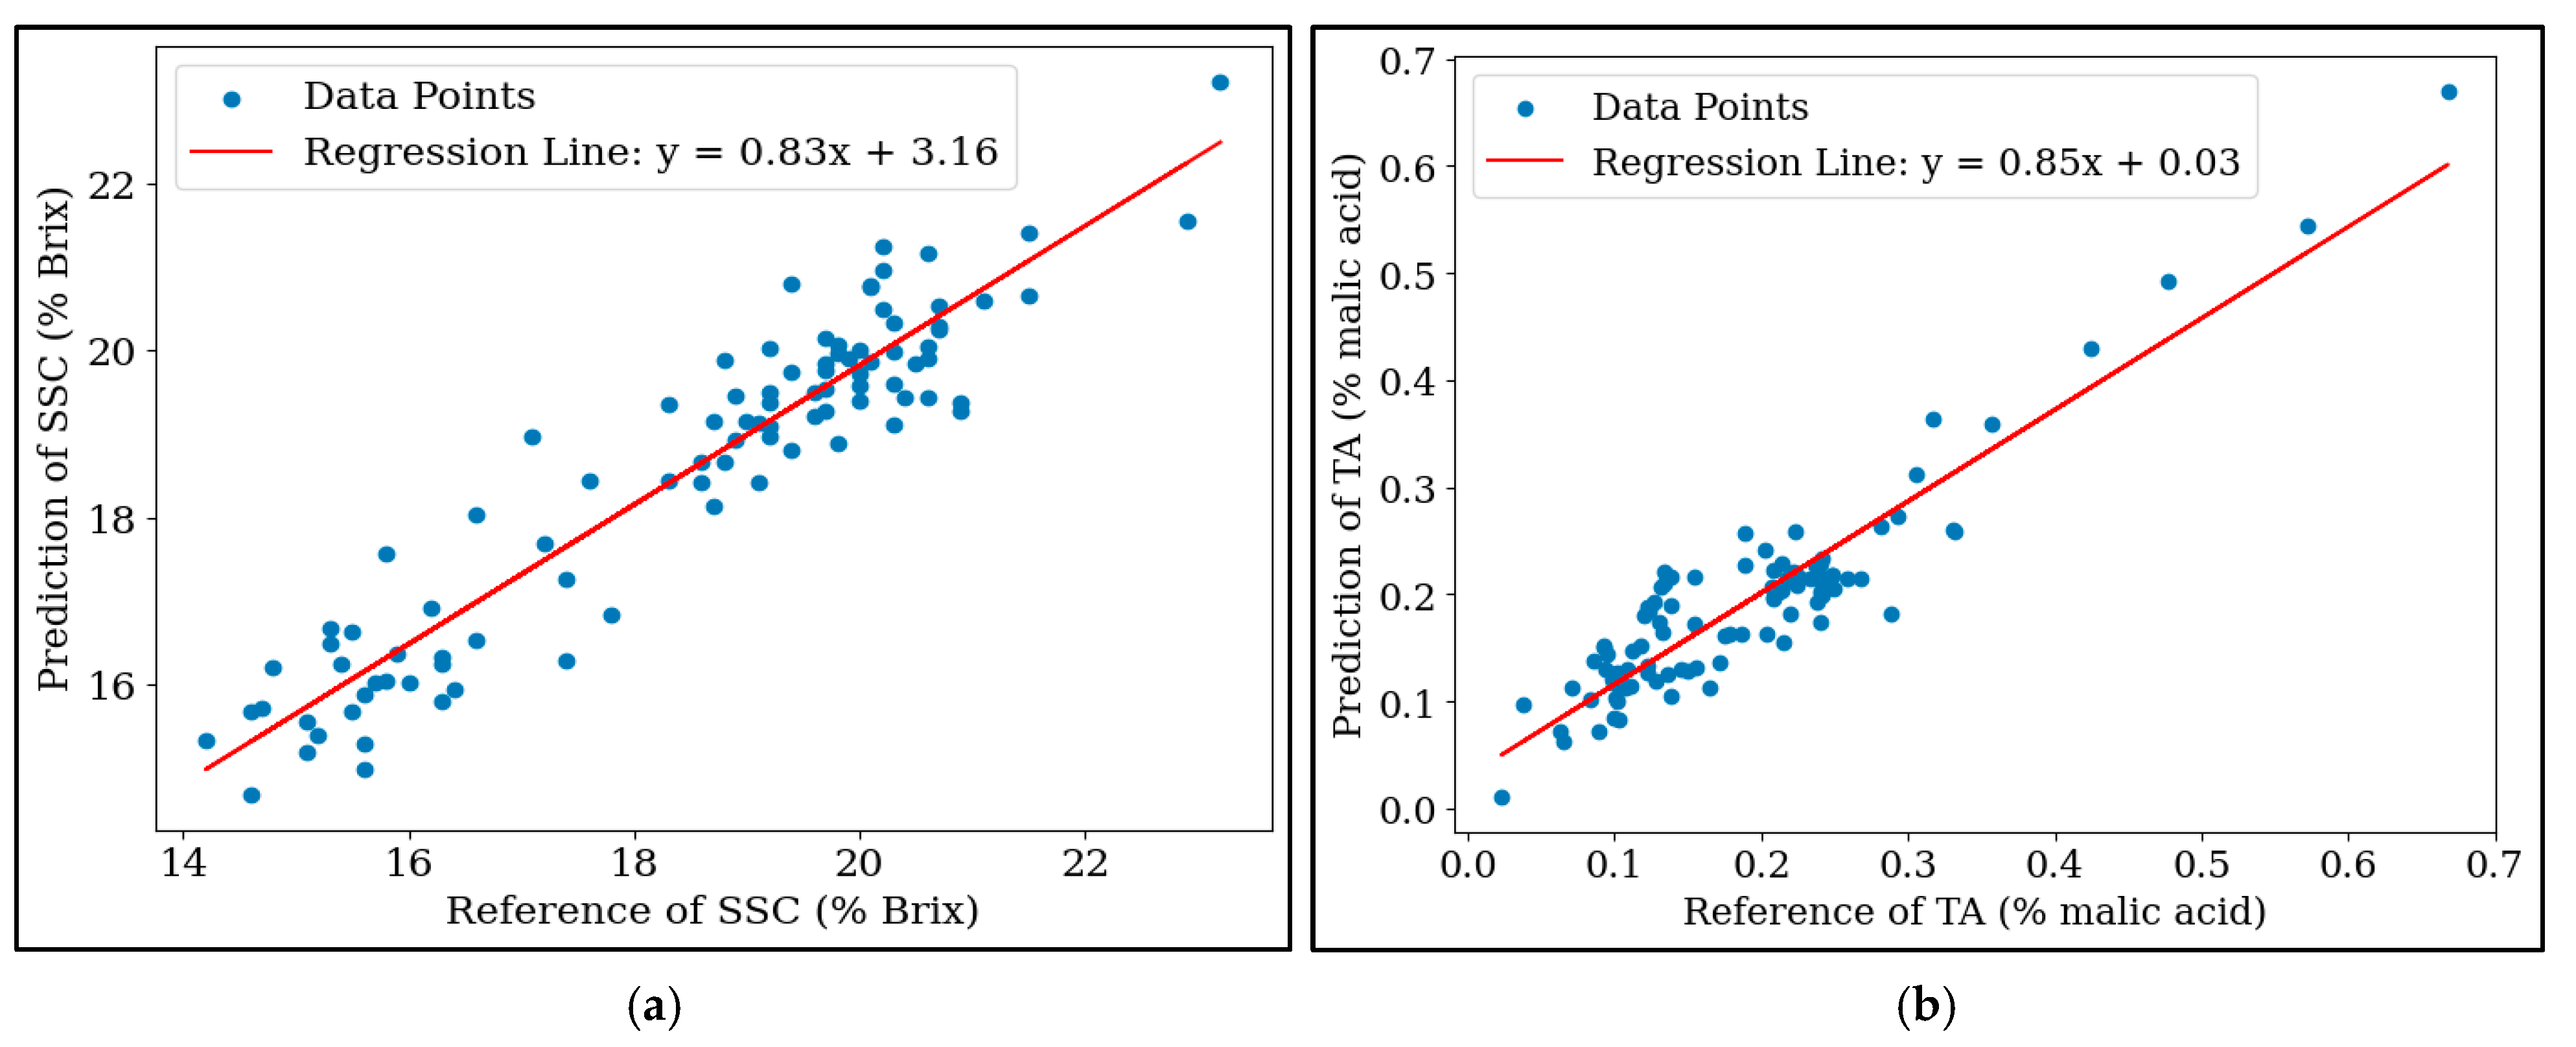
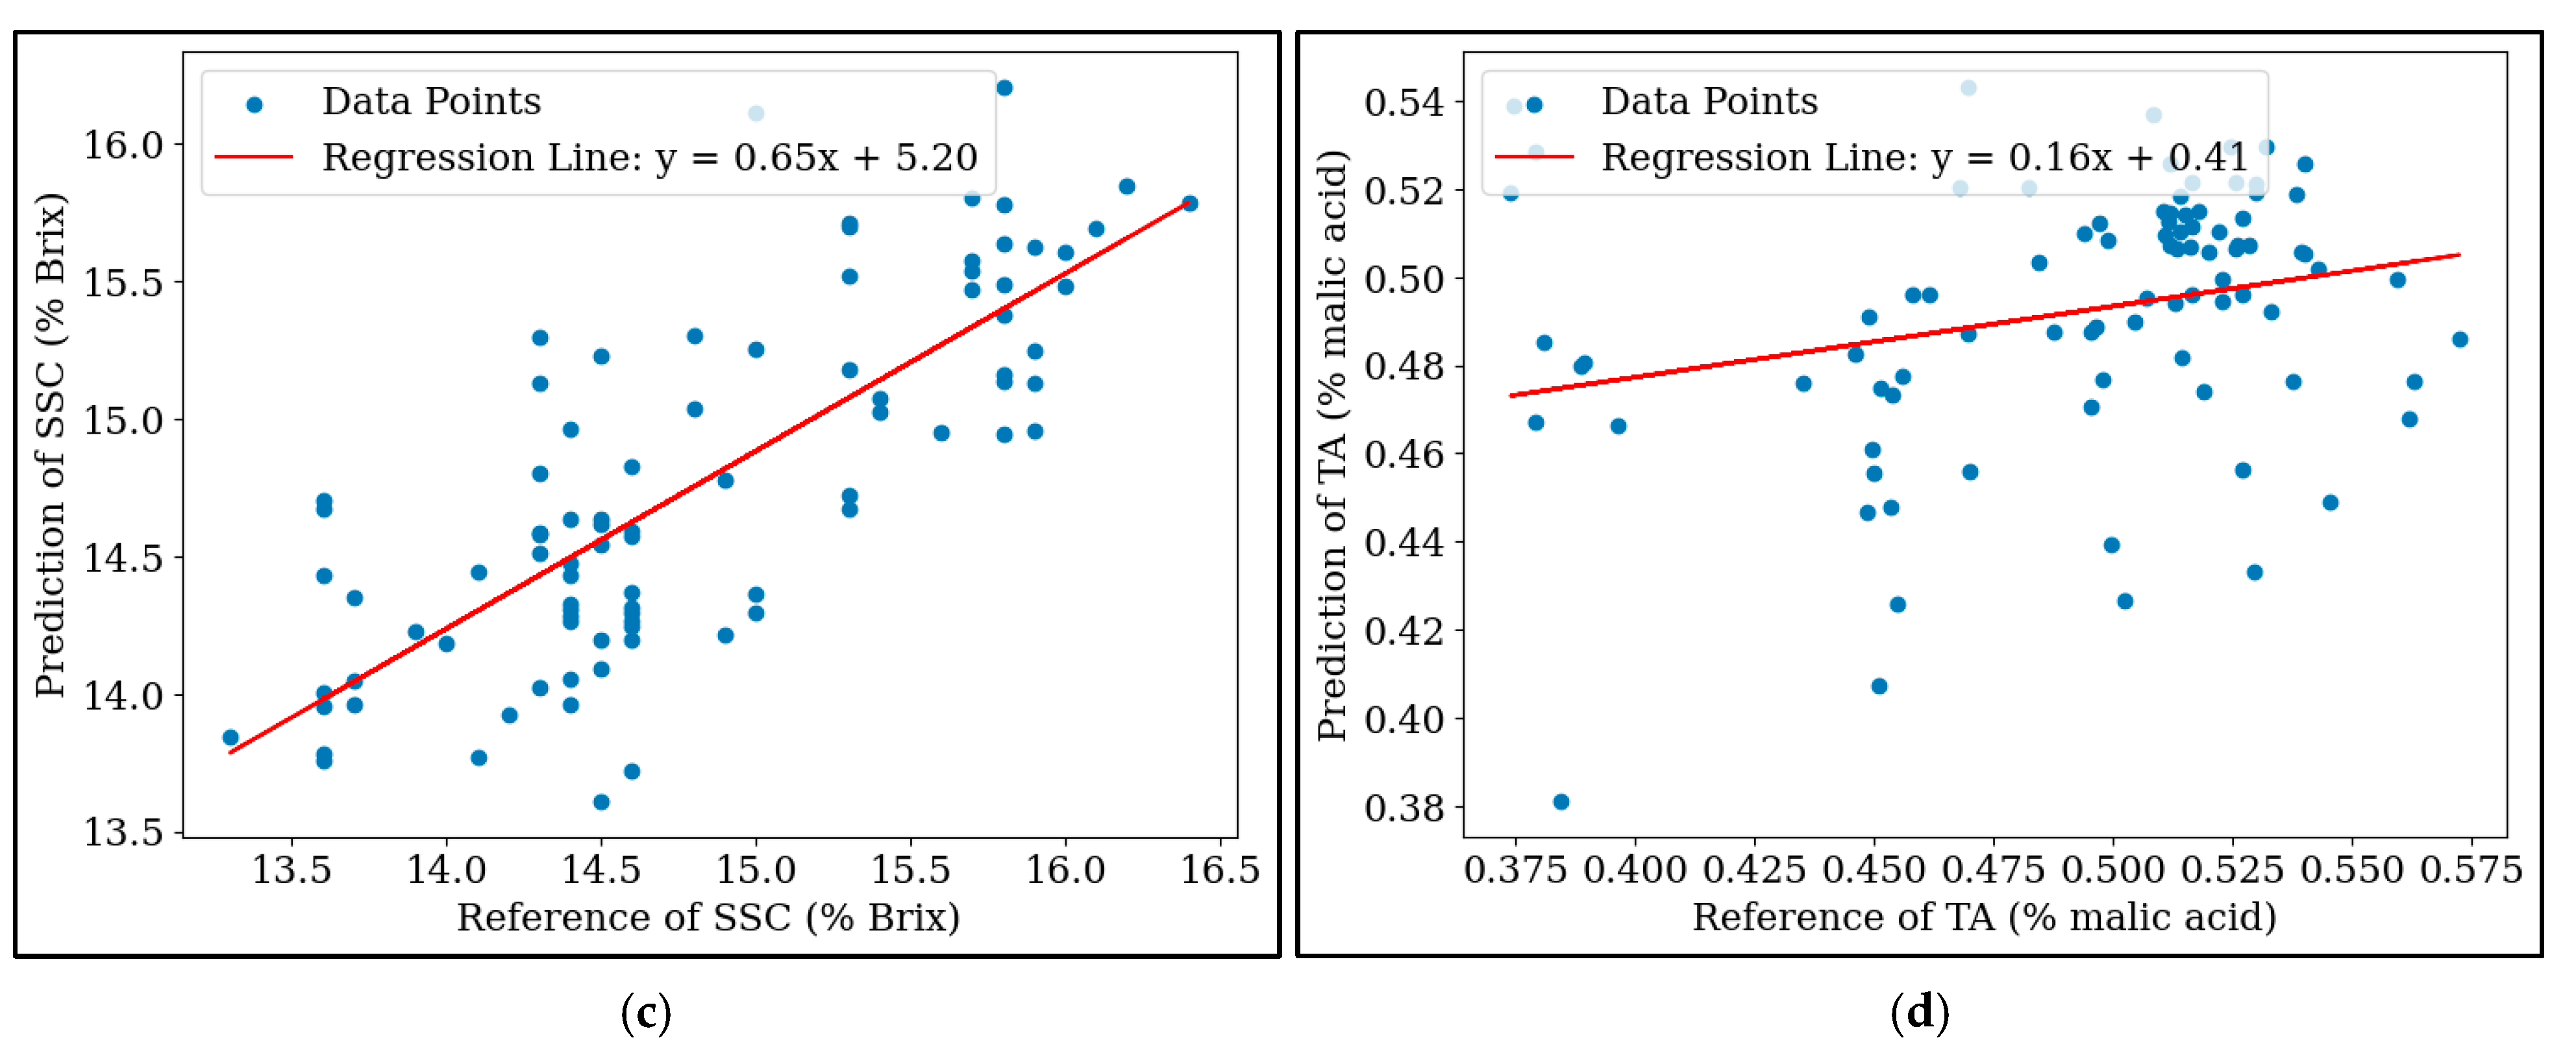
Figure 4 presents a scatter plot of the predicted vs. reference SSC and TA of mango purée obtained by Simple-CNN (a,b) and the corresponding values of mangosteen purée obtained using AlexNet (c,d). The slope values of Simple-CNN (a and b), ranging from 0.83 to 0.85, indicate an exceptionally strong calibration performance, which suggests that changes in the predicted values of SSC and TA of mango purée closely matched the changes in their corresponding measured values [28]. The intercept values were 3.16 and 0.03 for the prediction of the TSS and TA of mango purée, respectively, which indicate exceptionally high calibration effectiveness with minimal systematic error. The scatter plots obtained from the prediction of the SSC and TA of mangosteen purée revealed low slope values (0.65 and 0.16 for SSC and TA, respectively) and relatively high intercepts (5.20 and 0.41 for SSC and TA, respectively), which are consistent with the unsatisfactory predictive performance described earlier. The scatter plots for the other models are presented in Appendix B.

3.4. SHapley Additive exPlanations (SHAP)

In this study, Simple-CNN and AlexNet architecture exhibited high predictive capabilities for the SSC and TA in mango and mangosteen purée. Nonetheless, the model’s intricate internal structure may limit interpretability, thereby warranting further investigation into its transparency and reliability in practical deployment. One such method is SHAP, which is a game-theory-based approach that quantifies feature importance by attributing each input’s contribution to the model’s output [29]. The SHAP value has been widely adopted in the interpretation of the predictions provided by machine learning and DL models in NIR spectroscopy applications [30,31,32,33,34]. This interpretability approach enables the identification of key spectral regions that most influence the model’s predictions, offering deeper insights into the relationship between NIR wavenumbers and the chemical attributes of mango and mangosteen purée.
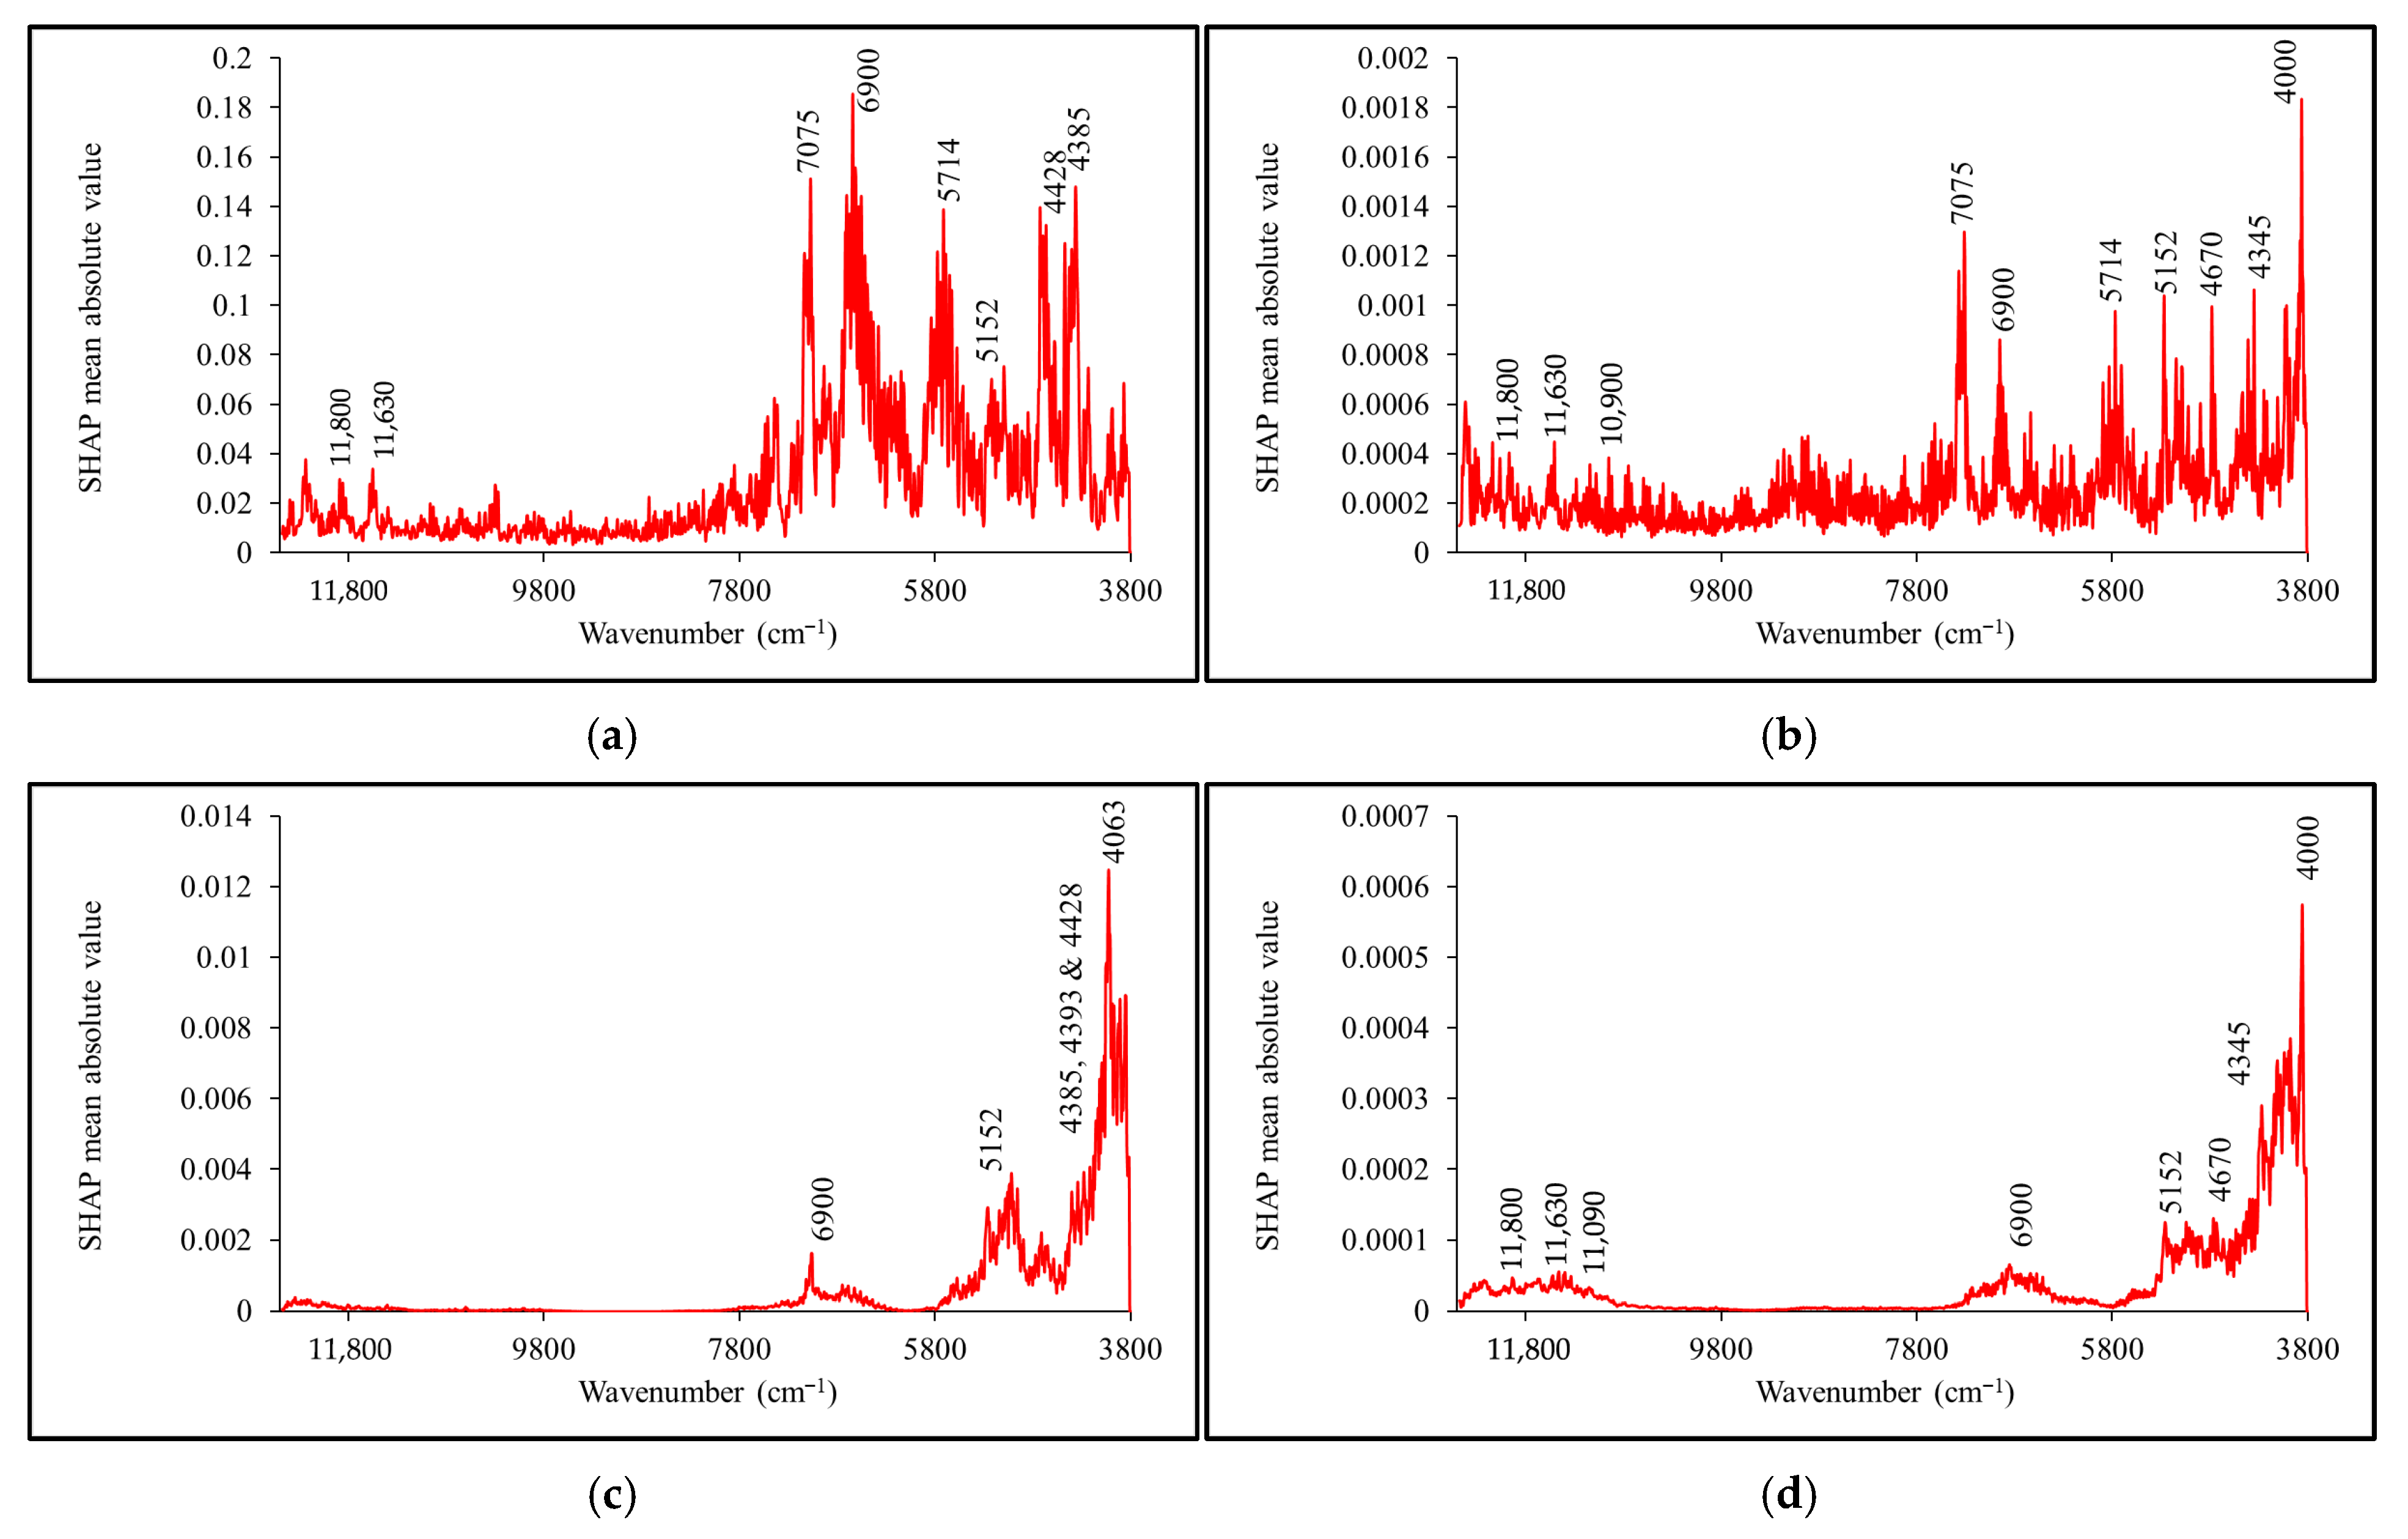
Figure 5 illustrates the relative contribution of each wavelength as determined by SHAP values in the Simple-CNN model for SSC and TA prediction in mango purée (a,b) and in AlexNet for SSC and TA prediction in mangosteen purée (c,d), respectively. The SHAP values for each wavenumber were analyzed, and the SHAP mean absolute value at each wavenumber was calculated to evaluate its overall contribution to the model’s predictions of SSC and TA in mango and mangosteen purée. Although the average spectra of preprocessed NIR data of mango and mangosteen purée appear visually similar in Figure 2, this representation does not reflect the relationship between specific spectral regions and the target parameters (SSC and TA). In contrast, SHAP analysis revealed the influence of each wavenumber on the model’s predictions, which is not apparent in the average spectra. The SHAP-based wavenumber importance plots for the SSC of mango and mangosteen purée (Figure 5a,c) reveal several common peak regions around 4600–3800 cm−1 (2175–2630 nm). Absorption in this range likely results from combinations of O—H stretching and deformation (4428 cm−1 or 2252 nm), O—H and C—C stretching (4393 cm−1 or 2276 nm), and C—H/C—C stretching and deformation (4385–4063 cm−1 or 2280–2460 nm) in sugar molecules [35,36]. In addition, the model for predicting the SSC in both mango and mangosteen purée exhibited additional prominent peaks at 6900 and 5152 cm−1 (1450 and 1940 nm, respectively). These vibration bands may correspond to the bond vibration of the first overtone of O—H stretching and the combination band of O—H stretching of water (H2O) [37,38,39]. Generally, sugars make up 80–90% of the SSC in most fruit purées, with the remainder comprising small quantities of organic acids, phenols, amino acids, proteins, fructans, minerals, and water-soluble vitamins [40,41]. The sugars in fruit may exist in the forms of fructose, glucose, and sucrose, all of which are rich in chemical bonds such as O–H, C–H, C–C, and C–O–C [37]. Although additional components of the mango and mangosteen purée could potentially affect SSC prediction, the SHAP value analysis demonstrated that the absorption bands related to sugars and water were the most influential in shaping the models’ predictive performances. These findings suggest that sugar and water absorption were influential in the prediction of the SSC in mango and mangosteen purée using DL architectures (Simple-CNN and AlexNet). Meanwhile, the SHAP plots of the AlexNet model for TA prediction in both mangosteen and mango purée revealed high peaks in similar wavenumber regions, notably around 11,800, 11,630, 11,090, 6900, 5152, 4670, 4345 and 4000 cm−1 (840, 860, 900, 1450, 1940, 2140, 2300 and 2500 nm).The absorbance peaks at 11,800, 11,630, 11,090, 4345, and 4185 cm−1 are associated with the vibration bands of C–H and C–C bonds found in malic acid [42,43,44,45,46]. The absorbance observed at 11,800, 4670 and 4000 cm−1 results from a combination of C–H and C–C stretching vibrations. The peaks at 11,630 and 11,090 cm−1 are attributed to the third overtone of C–H stretching [25]. Meanwhile, the absorption at 4345 cm−1 mainly arises from combination vibrations involving C–H bonds [26]. Vibration bonds of water at 6900 cm−1 (first overtone of O–H stretching) and 5152 cm−1 (combination of O–H stretching and deformation) were also detected in the TA prediction model for both mangosteen and mango purée [26].

4. Discussions

It is important to note that no frozen layers were applied in the AlexNet, Efficient-NetB0, MobileNetV2, and ResNeXt models. These architectures were trained from scratch, ensuring that every parameter was updated during training, which differs from typical transfer learning approaches that freeze certain layers. The results of this study indicated that, in certain instances, CNN architectures were able to capture the spectral complexity and quality (SSC and TA) of mango and mangosteen purée more effectively than PLSR techniques. In addition, one notable advantage of a CNN-based architecture is that CNN models exhibit robust feature extraction and self-representation capabilities, rendering them particularly suitable for the direct utilization of full-spectrum NIR data without the need for extensive preprocessing or manual feature engineering [47]. This approach eliminates the need for traditional feature selection, enhancing modeling efficiency and improving accuracy for high-dimensional spectral data [30,48]. Nevertheless, the developed models in this study still require further refinement, particularly by expanding the sample size and incorporating greater variability in the dataset. Such improvements are expected to enhance the generalization ability of the models and provide more robust predictive performance across different mango and mangosteen purée batches. It can be observed that the small dataset size and narrow range of target values employed in this study negatively influenced the predictive performance, as demonstrated in the case of the mangosteen purée. The limited variability of the TA values, for example, reduced the model’s ability to generalize, resulting in lower R CV 2   and RPDCV values compared to those obtained for mango purée, even though data augmentation techniques were applied. This suggests that augmentation alone may not sufficiently compensate for the lack of variability in the original dataset, reinforcing the need for larger and more diverse calibration samples to enhance model robustness. Another limitation of this study is that the complex architectures of DL models (e.g., AlexNet, EfficientNet-B0, MobileNetV2, and ResNeXt) are prone to overfitting when applied to relatively limited spectral datasets. This tendency arises because the large number of trainable parameters may capture noise and dataset-specific variations rather than generalizable spectral–chemical relationships. Although regularization techniques (e.g., dropout) and data augmentation were employed to alleviate this issue, overfitting was still observed in some models. In future research, several directions can be considered. To improve model robustness, samples of mango and mangosteen purée should be collected from diverse regions and varieties and at different ripening stages. It should be noted that all models in this study were constructed based on spectra that had undergone Savitzky–Golay smoothing, normalization, MSC, and baseline correction. Alternative approaches such as standard normal variate (SNV), first- or second-derivative transformations, or advanced filtering techniques may further enhance spectral feature extraction and improve model robustness. Future studies could therefore investigate the impact of different preprocessing pipelines on both PLSR and deep learning models to optimize predictive accuracy and generalization. Furthermore, external validation using independent datasets is essential to rigorously assess the predictive reliability and transferability of the developed models while further strategies such as feature/variable selection or dimensionality reduction may be required to enhance generalization performance in practical applications. Collectively, these efforts will contribute to building more reliable and scalable models for the nondestructive quality assessment of mango and mangosteen purées.
Although DL models (especially Simple-CNN and AlexNet) were applied for the prediction of the SSC and TA of mango and mangosteen purée, their complex architectures limit interpretability and transparency. To overcome the challenge of limited interpretability, SHAP analysis was applied to quantify the influence of each wavenumber on the model’s predictions, thus improving the transparency and understanding of the DL models. Although NIR spectra consists of overlapping overtone and combination bands, the SHAP analysis confirmed that the DL models relied on chemically meaningful regions. The SHAP analysis indicated that the vibrations of O–H, C–H, and C–C bonds, as well as their associated overtones and combination bands, serve as significant spectral markers for the prediction of SSC and TA. Specifically, SSC prediction was primarily associated with absorption bands of sugars and water, while TA prediction was linked to the vibrational bands of C–H and C–C bonds present in malic acid, the predominant organic acid in mango and mangosteen purée. Enhancing the interpretability of the model fosters greater trust and facilitates informed decision-making in quality control processes of mango and mangosteen purée.

5. Conclusions

This study demonstrated the potential of DL models, particularly Simple-CNN and AlexNet, for predicting the SSC and TA of mango and mangosteen purée using near-infrared (NIR) spectroscopy. Compared with the conventional PLSR model, DL approaches achieved superior predictive accuracy in several cases, with significantly lower RMSECV and higher R CV 2 and RPDCV values. For mango purée, the Simple-CNN model exhibited the best performance in predicting both SSC and TA, with statistically significant differences from PLSR. For mangosteen purée, AlexNet showed the lowest RMSECV and highest R CV 2 , although the RPDCV values (<2.0) suggested that the predictions were only suitable for rough screening. The limited variation in TA values of mangosteen purée likely constrained the predictive performance. Overall, these findings highlight the applicability of DL in enhancing the NIR-based quality assessment of mango and mangosteen purée products, though interpretability and robustness remain challenges to be addressed in future research.

Author Contributions

Conceptualization, P.P., P.S. and R.L.; methodology, S.S., T.P., P.S. and R.L.; software, R.L.; validation, P.S. and R.L.; formal analysis, R.L.; investigation, R.L.; resources, P.P. and P.S.; data curation, S.S., T.P. and R.L.; writing—original draft preparation, S.S., T.P. and R.L.; writing—review and editing, P.P. and P.S.; visualization, R.L.; supervision, P.P.; project administration, R.L.; funding acquisition, P.P., P.S. and R.L. All authors have read and agreed to the published version of the manuscript.

Funding

This research was funded by King Mongkut’s Institute of Technology Ladkrabang, grant number A118-01162-015. The APC was funded by the School of Engineering, King Mongkut’s Institute of Technology Ladkrabang.

Institutional Review Board Statement

Not applicable.

Informed Consent Statement

Not applicable.

Data Availability Statement

The raw data supporting the conclusions of this article will be made available by the authors on request.

Conflicts of Interest

The authors declare no conflicts of interest.

Abbreviations

The following abbreviations are used in this manuscript:
SSCSoluble solid content
TATitratable acidity
NIRNear-infrared
PLSRPartial least squares regression
DLDeep learning
AIArtificial intelligence
CNNConvolutional neural networks
FTFourier transform
MSCMultiplicative scatter correction
ILSVRCImageNet Large Scale Visual Recognition Challenge
NASNeural architecture search
MSEMean squared error
R2Coefficient of determination
RMSERoot mean square error
RPDRatio of prediction to deviation
R CV 2 Coefficient of determination of cross-validation
RMSECVRoot mean square error of cross-validation
RPDCVRatio of prediction to deviation of cross-validation
SHAPSHapley Additive exPlanations

Appendix A

Figure A1. Training and validation losses of Simple-CNN for the SSC and TA of mango purée (a,b) and mangosteen purée (c,d).
Horticulturae 11 01047 g0a1
Figure A2. Training and validation losses of AlexNet for the SSC and TA of mango purée (a,b) and mangosteen purée (c,d).
Horticulturae 11 01047 g0a2aHorticulturae 11 01047 g0a2b
Figure A3. Training and validation losses of EfficientNet-B0 for the SSC and TA of mango purée (a,b) and mangosteen purée (c,d).
Horticulturae 11 01047 g0a3
Figure A4. Training and validation losses of MobileNetV2 for the SSC and TA of mango purée (a,b) and mangosteen purée (c,d).
Horticulturae 11 01047 g0a4aHorticulturae 11 01047 g0a4b
Figure A5. Training and validation losses of ResNeXt for the SSC and TA of mango purée (a,b) and mangosteen purée (c,d).
Horticulturae 11 01047 g0a5

Appendix B

Figure A6. Scatter plot of the predicted vs. reference SSC of mango purée obtained by PLSR, AlexNet, EfficientNet-B0, and ResNeXt (a,c,e,g,i, respectively) and the predicted vs. reference TA of mango purée obtained by PLSR, AlexNet, EfficientNet-B0 and ResNeXt (b,d,f,h,j, respectively).
Horticulturae 11 01047 g0a6aHorticulturae 11 01047 g0a6b
Figure A7. Scatter plot of the predicted vs. reference SSC of mangosteen purée obtained by PLSR, Simple-CNN, Efficient-Net-B0 and ResNeXt (a,c,e,g,i, respectively) and the predicted vs. reference TA of mangosteen purée obtained by PLSR, Simple-CNN, EfficientNet-B0 and ResNeXt (b,d,f,h,j, respectively).
Horticulturae 11 01047 g0a7aHorticulturae 11 01047 g0a7b

References

  1. Laophongphit, A.; Wichiansri, S.; Siripornadulsil, S.; Siripornadulsil, W. Enhancing the nutritional value and functional properties of mango pulp via lactic acid bacteria fermentation. LWT 2024, 197, 115878. [Google Scholar] [CrossRef]
  2. Chinnasaen, T.; Jitjuk, U.; Khamkula, K.; Wetchakama, N. Production of “maha chanok” mangoes for export to the Japanese market: The case study of nong bua chum village, nong hin sub-district, nong kung Si district, kalasin Province. Thai J. East Asian Stud. 2020, 24, 36–52. [Google Scholar]
  3. Pornchaloempong, P.; Sharma, S.; Phanomsophon, T.; Srisawat, K.; Inta, W.; Sirisomboon, P.; Prinyawiwatkul, W.; Nakawajana, N.; Lapcharoensuk, R.; Teerachaichayut, S. Non-Destructive Quality Evaluation of Tropical Fruit (Mango and Mangosteen) Purée Using Near-Infrared Spectroscopy Combined with Partial Least Squares Regression. Agriculture 2022, 12, 2060. [Google Scholar] [CrossRef]
  4. Zhao, J.; Tian, G.; Qiu, Y.; Qu, H. Rapid quantification of active pharmaceutical ingredient for sugar-free Yangwei granules in commercial production using FT-NIR spectroscopy based on machine learning techniques. Spectrochim. Acta Part A Mol. Biomol. Spectrosc. 2021, 245, 118878. [Google Scholar] [CrossRef] [PubMed]
  5. Lan, W.; Jaillais, B.; Chen, S.; Renard, C.M.; Leca, A.; Bureau, S. Fruit variability impacts puree quality: Assessment on individually processed apples using the visible and near infrared spectroscopy. Food Chem. 2022, 390, 133088. [Google Scholar] [CrossRef]
  6. Lan, W.; Jaillais, B.; Leca, A.; Renard, C.M.; Bureau, S. A new application of NIR spectroscopy to describe and predict purees quality from the non-destructive apple measurements. Food Chem. 2020, 310, 125944. [Google Scholar] [CrossRef] [PubMed]
  7. Lan, W.; Baeten, V.; Jaillais, B.; Renard, C.M.; Arnould, Q.; Chen, S.; Leca, A.; Bureau, S. Comparison of near-infrared, mid-infrared, Raman spectroscopy and near-infrared hyperspectral imaging to determine chemical, structural and rheological properties of apple purees. J. Food Eng. 2022, 323, 111002. [Google Scholar] [CrossRef]
  8. Lan, W.; Bureau, S.; Chen, S.; Leca, A.; Renard, C.M.; Jaillais, B. Visible, near-and mid-infrared spectroscopy coupled with an innovative chemometric strategy to control apple puree quality. Food Control 2021, 120, 107546. [Google Scholar] [CrossRef]
  9. Sun, D.; Cruz, J.; Alcalà, M.; Romero del Castillo, R.; Sans, S.; Casals, J. Near infrared spectroscopy determination of chemical and sensory properties in tomato. J. Near Infrared Spectrosc. 2021, 29, 289–300. [Google Scholar] [CrossRef]
  10. Ren, J.; Xiong, Y.; Chen, X.; Hao, Y. Comparative analysis of machine learning and deep learning algorithms for assessing agricultural product quality using NIRS. Sensors 2024, 24, 5438. [Google Scholar] [CrossRef]
  11. Huang, Y.; Zheng, Y.; Liu, P.; Xie, L.; Ying, Y. Enhanced prediction of soluble solids content and vitamin C content in citrus using visible and near-infrared spectroscopy combined with one-dimensional convolutional neural network. J. Food Compos. Anal. 2025, 139, 107131. [Google Scholar] [CrossRef]
  12. Zeng, S.; Zhang, Z.; Cheng, X.; Cai, X.; Cao, M.; Guo, W. Prediction of soluble solids content using near-infrared spectra and optical properties of intact apple and pulp applying PLSR and CNN. Spectrochim. Acta Part A Mol. Biomol. Spectrosc. 2024, 304, 123402. [Google Scholar] [CrossRef] [PubMed]
  13. Shi, Q.; Li, Y.; Zhang, F.; Ma, Q.; Sun, J.; Liu, Y.; Mu, J.; Wang, W.; Tang, Y. Whale optimization algorithm-based multi-task convolutional neural network for predicting quality traits of multi-variety pears using near-infrared spectroscopy. Postharvest Biol. Technol. 2024, 215, 113018. [Google Scholar] [CrossRef]
  14. Tan, M.; Le, Q. Efficientnet: Rethinking model scaling for convolutional neural networks. In Proceedings of the International Conference on Machine Learning, Long Beach, CA, USA, 9–15 June 2019; pp. 6105–6114. [Google Scholar]
  15. Alzubaidi, L.; Zhang, J.; Humaidi, A.J.; Al-Dujaili, A.; Duan, Y.; Al-Shamma, O.; Santamaría, J.; Fadhel, M.A.; Al-Amidie, M.; Farhan, L. Review of deep learning: Concepts, CNN architectures, challenges, applications, future directions. J. Big Data 2021, 8, 1–74. [Google Scholar] [CrossRef]
  16. Zhang, X.; Han, N.; Zhang, J. Comparative analysis of VGG, ResNet, and GoogLeNet architectures evaluating performance, computational efficiency, and convergence rates. Appl. Comput. Eng. 2024, 44, 172–181. [Google Scholar] [CrossRef]
  17. Yu, Y.; Huang, J.; Wang, L.; Liang, S. A 1D-inception-ResNet based global detection model for thin-skinned multifruit spectral quantitative analysis. Food Control 2025, 167, 110823. [Google Scholar] [CrossRef]
  18. Liu, X.; Wang, D.; Wang, R.; Hu, B.; Wang, J.; Liu, Y.; Wang, C.; Guo, J.; Yang, S.; Nie, C. Integrating progressive screening strategy-based continuous wavelet transform with EfficientNetV2 for enhanced near-infrared spectroscopy. Talanta 2025, 284, 127188. [Google Scholar] [CrossRef]
  19. McHardy, R.G.; Antoniou, G.; Conn, J.J.; Baker, M.J.; Palmer, D.S. Augmentation of FTIR spectral datasets using Wasserstein generative adversarial networks for cancer liquid biopsies. Analyst 2023, 148, 3860–3869. [Google Scholar] [CrossRef]
  20. Shang, L.W.; Bao, Y.L.; Tang, J.L.; Ma, D.Y.; Fu, J.J.; Zhao, Y.; Wang, X.; Yin, J.H. A novel polynomial reconstruction algorithm-based 1D convolutional neural network used for transfer learning in Raman spectroscopy application. J. Raman Spectrosc. 2022, 53, 237–246. [Google Scholar] [CrossRef]
  21. Zhu, J.; Sharma, A.S.; Xu, J.; Xu, Y.; Jiao, T.; Ouyang, Q.; Li, H.; Chen, Q. Rapid on-site identification of pesticide residues in tea by one-dimensional convolutional neural network coupled with surface-enhanced Raman scattering. Spectrochim. Acta Part A Mol. Biomol. Spectrosc. 2021, 246, 118994. [Google Scholar] [CrossRef]
  22. Krizhevsky, A.; Sutskever, I.; Hinton, G.E. ImageNet Classification with Deep Convolutional Neural Networks. Commun. ACM 2017, 60, 84–90. [Google Scholar] [CrossRef]
  23. Sandler, M.; Howard, A.; Zhu, M.; Zhmoginov, A.; Chen, L.-C. Mobilenetv2: Inverted residuals and linear bottlenecks. In Proceedings of the IEEE Conference on Computer Vision and Pattern Recognition, Salt Lake City, UT, USA, 18–23 June 2018; pp. 4510–4520. [Google Scholar]
  24. Xie, S.; Girshick, R.; Dollár, P.; Tu, Z.; He, K. Aggregated residual transformations for deep neural networks. In Proceedings of the IEEE Conference on Computer Vision and Pattern Recognition, Honolulu, HI, USA, 21–26 July 2017; pp. 1492–1500. [Google Scholar]
  25. Pedregosa, F.; Varoquaux, G.; Gramfort, A.; Michel, V.; Thirion, B.; Grisel, O.; Blondel, M.; Prettenhofer, P.; Weiss, R.; Dubourg, V. Scikit-learn: Machine learning in Python. J. Mach. Learn. Res. 2011, 12, 2825–2830. [Google Scholar] [CrossRef]
  26. Osborne, B.G.; Fearn, T.; Hindle, P.H. Practical NIR Spectroscopy with Applications in Food and Beverage Analysis; Longman Scientific and Technical: Harlow, UK, 1993. [Google Scholar]
  27. Workman, J., Jr.; Weyer, L. Practical Guide to Interpretive Near-Infrared Spectroscopy; CRC Press: Boca Raton, FL, USA, 2007. [Google Scholar]
  28. Williams, P.; Antoniszyn, J.; Manley, M. Near Infrared Technology: Getting the Best out of Light, 1st ed.; African Sun Media: Stellenbosch, South Africa, 2019. [Google Scholar]
  29. Lundberg, S.M.; Lee, S.-I. A unified approach to interpreting model predictions. Adv. Neural Inf. Process. Syst. 2017, 30, 4766–4777. [Google Scholar]
  30. Zhong, L.; Guo, X.; Ding, M.; Ye, Y.; Jiang, Y.; Zhu, Q.; Li, J. SHAP values accurately explain the difference in modeling accuracy of convolution neural network between soil full-spectrum and feature-spectrum. Comput. Electron. Agric. 2024, 217, 108627. [Google Scholar] [CrossRef]
  31. Li, L.; Cao, R.; Zhao, L.; Liu, N.; Sun, H.; Zhang, Z.; Sun, Y. Near-Infrared Spectroscopy Combined with Explainable Machine Learning for Storage Time Prediction of Frozen Antarctic Krill. Foods 2025, 14, 1293. [Google Scholar] [CrossRef]
  32. Ahmed, M.W.; Alam, S.; Khaliduzzaman, A.; Emmert, J.L.; Kamruzzaman, M. Nondestructive Prediction of Eggshell Thickness Using NIR Spectroscopy and Machine Learning with Explainable AI. ACS Food Sci. Technol. 2025, 5, 822–832. [Google Scholar] [CrossRef]
  33. Haghi, R.; Pérez-Fernández, E.; Robertson, A. Prediction of various soil properties for a national spatial dataset of Scottish soils based on four different chemometric approaches: A comparison of near infrared and mid-infrared spectroscopy. Geoderma 2021, 396, 115071. [Google Scholar] [CrossRef]
  34. Passos, D. Deep tutti-frutti II: Explainability of CNN architectures for fruit dry matter predictions. Spectrochim. Acta Part A Mol. Biomol. Spectrosc. 2025, 337, 126068. [Google Scholar] [CrossRef]
  35. Simeone, M.L.F.; Parrella, R.A.; Schaffert, R.E.; Damasceno, C.M.; Leal, M.C.; Pasquini, C. Near infrared spectroscopy determination of sucrose, glucose and fructose in sweet sorghum juice. Microchem. J. 2017, 134, 125–130. [Google Scholar] [CrossRef]
  36. Osborne, B.G.; Douglas, S. Measurement of the degree of starch damage in flour by near infrared reflectance analysis. J. Sci. Food Agric. 1981, 32, 328–332. [Google Scholar] [CrossRef]
  37. Hao, Q.; Zhou, J.; Zhou, L.; Kang, L.; Nan, T.; Yu, Y.; Guo, L. Prediction the contents of fructose, glucose, sucrose, fructo-oligosaccharides and iridoid glycosides in Morinda officinalis radix using near-infrared spectroscopy. Spectrochim. Acta Part A Mol. Biomol. Spectrosc. 2020, 234, 118275. [Google Scholar] [CrossRef]
  38. Paradkar, M.; Sakhamuri, S.; Irudayaraj, J. Comparison of FTIR, FT-Raman, and NIR spectroscopy in a maple syrup adulteration study. J. Food Sci. 2002, 67, 2009–2015. [Google Scholar] [CrossRef]
  39. Xie, L.; Ye, X.; Liu, D.; Ying, Y. Quantification of glucose, fructose and sucrose in bayberry juice by NIR and PLS. Food Chem. 2009, 114, 1135–1140. [Google Scholar] [CrossRef]
  40. Zaccari, F.; Puerto, M.D.; Cabrera, M.C. Butia: Physical, nutritional and antioxidant properties of red, orange and yellow fruits. Agrociencia Urug. 2021, 25, NSPE2. [Google Scholar] [CrossRef]
  41. Kader, A.A. Flavor quality of fruits and vegetables. J. Sci. Food Agric. 2008, 88, 1863–1868. [Google Scholar] [CrossRef]
  42. Martelo-Vidal, M.J.; Vázquez, M. Application of artificial neural networks coupled to UV–VIS–NIR spectroscopy for the rapid quantification of wine compounds in aqueous mixtures. CyTA-J. Food 2015, 13, 32–39. [Google Scholar] [CrossRef]
  43. Theanjumpol, P.; Self, G.; Rittiron, R.; Pankasemsuk, T.; Sardsud, V. Selecting variables for near infrared spectroscopy (NIRS) evaluation of mango fruit quality. J. Agric. Sci. 2013, 5, 146–159. [Google Scholar] [CrossRef]
  44. Cozzolino, D.; Cynkar, W.; Shah, N.; Smith, P. Quantitative analysis of minerals and electric conductivity of red grape homogenates by near infrared reflectance spectroscopy. Comput. Electron. Agric. 2011, 77, 81–85. [Google Scholar] [CrossRef]
  45. Martelo-Vidal, M.J.; Vazquez, M. Evaluation of Ultraviolet, Visible, and Near Infrared Spectroscopy for the Analysis of Wine Compounds. Czech J. Food Sci. 2014, 32, 37–47. [Google Scholar] [CrossRef]
  46. Shen, F.; Yang, D.; Ying, Y.; Li, B.; Zheng, Y.; Jiang, T. Discrimination between Shaoxing wines and other Chinese rice wines by near-infrared spectroscopy and chemometrics. Food Bioprocess Technol. 2012, 5, 786–795. [Google Scholar] [CrossRef]
  47. Tian, G.; Zhao, J.; Qu, H. A Novel CNN-LSTM Model with Attention Mechanism for Online Monitoring of Moisture Content in Fluidized Bed Granulation Process Based on Near-Infrared Spectroscopy. Spectrochim. Acta Part A Mol. Biomol. Spectrosc. 2025, 340, 126361. [Google Scholar] [CrossRef]
  48. LeCun, Y.; Bengio, Y.; Hinton, G. Deep learning. Nature 2015, 521, 436–444. [Google Scholar] [CrossRef]
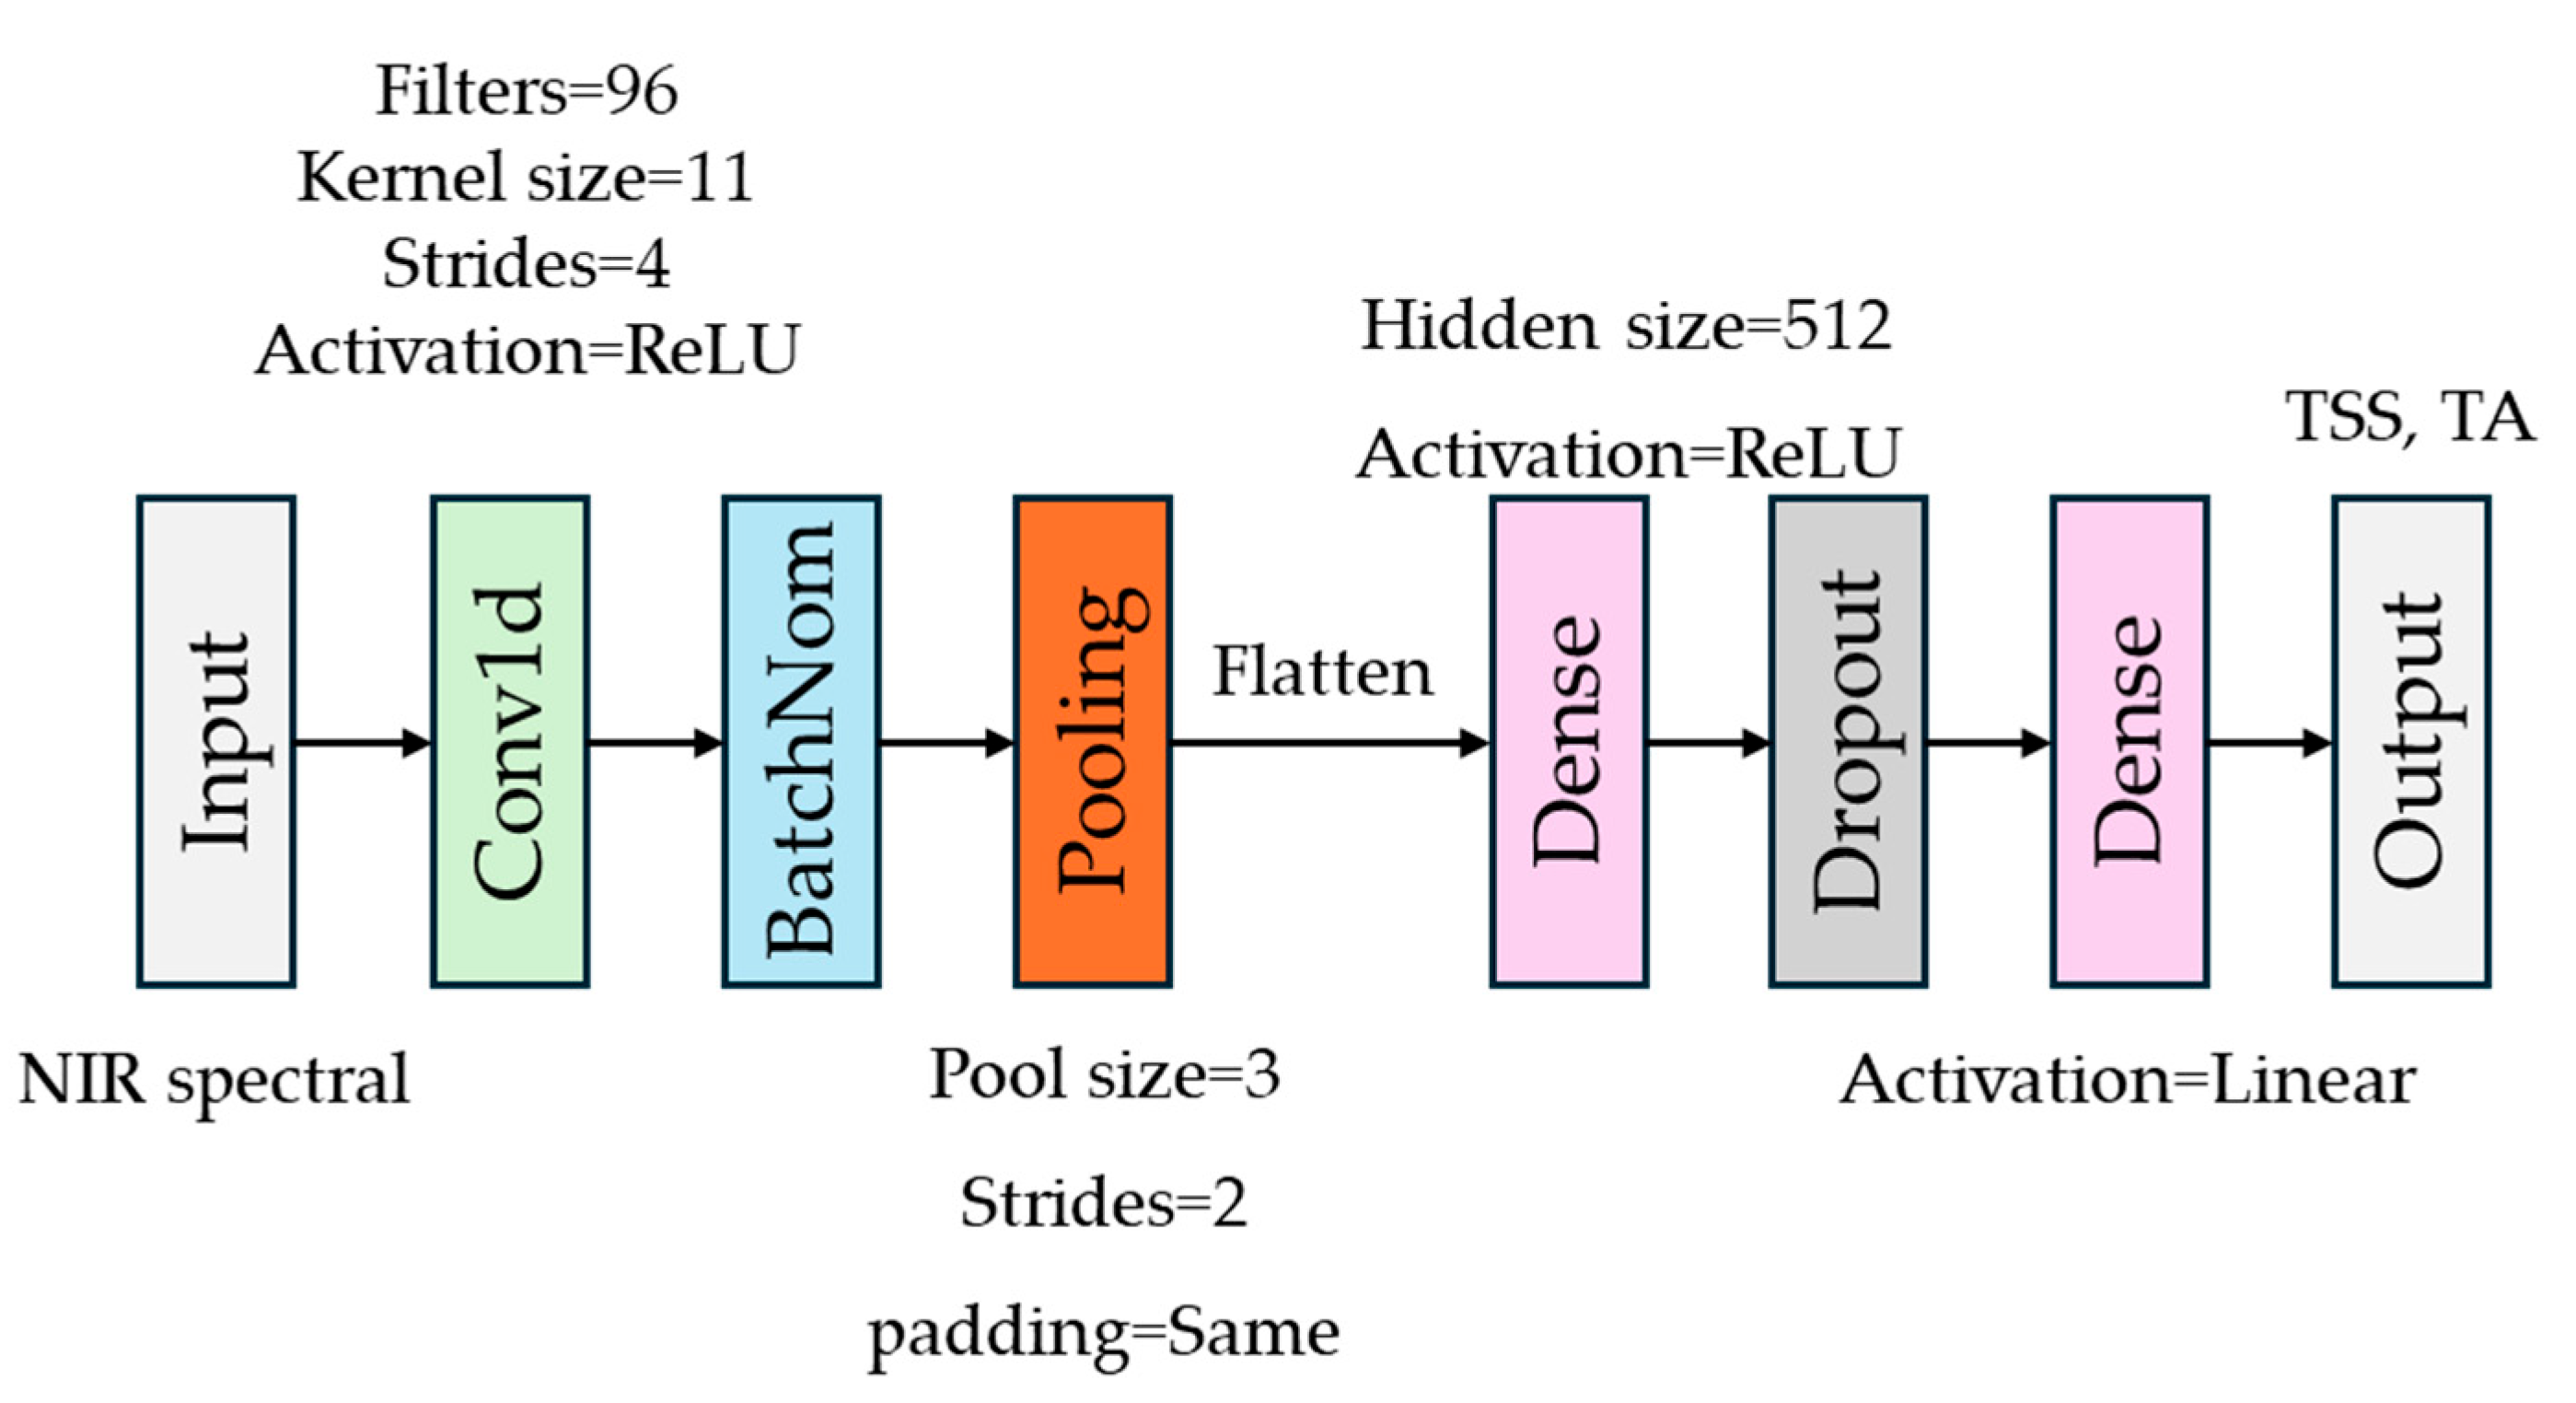
Figure 1. Simple-CNN.
Horticulturae 11 01047 g001
Figure 2. Algorithmic flow diagram of the proposed CNN.
Horticulturae 11 01047 g002
Figure 3. Average spectra of preprocessed NIR data for mango (a) and mangosteen (b) purée.
Horticulturae 11 01047 g003
Figure 4. Scatter plot of the predicted vs. reference SSC and TA of mango purée obtained by Simple-CNN (a,b) and mangosteen purée obtained by AlexNet (c,d).
Horticulturae 11 01047 g004aHorticulturae 11 01047 g004b
Figure 5. Relative contribution of wavelength according to SHAP value in the AlexNet model for SSC and TA prediction in mango purée (a,b) and in mangosteen purée (c,d).
Horticulturae 11 01047 g005
Table 1. Statistical parameters of the SSC and TA of mango and mangosteen purée.
SampleNMinMaxMeanSD
Mango
SSC (% Brix)9614.223.218.52.2
TA (% malic acid)0.0230.6680.1870.104
Mangosteen
SSC (% Brix)8813.316.414.80.8
TA (% malic acid)0.3740.5730.4930.048
Note: N = Number of samples; Min = minimum; Max = maximum; SD = standard deviation.
Table 2. Performance of five CNN architectures in predicting SSC and TA in the testing set of mango and mangosteen purée.
Model R CV 2 RMSECVRPDCVModel File Size (MB)
SSC of mango purée (% Brix)
PLSR0.844 ± 0.092 b0.845 ± 0.267 a2.923 ± 1.267 ab-
Simple-CNN0.914 ± 0.046 b0.688 ± 0.200 a3.367 ± 1.313 b80.708
AlexNet0.454 ± 0.296 a1.743 ± 0.595 b1.401 ± 0.735 a68.951
EfficientNet-B00.838 ± 0.225 b0.709 ± 0.589 a5.285 ± 3.460 c0.556
MobileNetV20.566 ± 0.173 a1.616 ± 0.271 b1.333 ± 0.219 a0.693
ResNeXt0.532 ± 0.282 a1.679 ± 0.464 b1.369 ± 0.466 a49.837
TA of mango purée (% malic acid)
PLSR0.528 ± 0.324 a0.055 ± 0.020 b2.036 ± 1.667 a-
Simple-CNN0.762 ± 0.196 a0.037 ± 0.008 a2.864 ± 1.869 a80.708
AlexNet0.585 ± 0.315 a0.056 ± 0.027 b2.023 ± 1.144 a68.951
EfficientNet-B00.512 ± 0.316 a0.061 ± 0.010 b1.649 ± 0.883 a0.556
MobileNetV20.498 ± 0.299 a0.060 ± 0.014 b1.801 ± 1.290 a0.693
ResNeXt0.628 ± 0.223 a0.053 ± 0.015 b1.892 ± 0.800 a49.837
SSC of mangosteen purée (% Brix)
PLSR0.416 ± 0.279 ab0.600 ± 0.153 ab1.290 ± 0.403 ab-
Simple-CNN0.564 ± 0.262 bc0.527 ± 0.187 a1.528 ± 0.554 b80.708
AlexNet0.702 ± 0.258 c0.471 ± 0.109 a1.666 ± 0.527 b68.951
EfficientNet-B00.300 ± 0.181 a0.696 ± 0.141 bc1.073 ± 0.219 a0.556
MobileNetV20.285 ± 0.258 a0.806 ± 0.242 c0.960 ± 0.263 a0.693
ResNeXt0.321 ± 0.219 a0.707 ± 0.194 bc1.091 ± 0.307 a49.837
TA of mango purée (% malic acid)
PLSR0.196 ± 0.207 a0.048 ± 0.017 a0.979 ± 0.184 a-
Simple-CNN0.332 ± 0.327 a0.048 ± 0.022 a1.083 ± 0.415 a80.708
AlexNet0.360 ± 0.260 a0.045 ± 0.021 a1.111 ± 0.396 a68.951
EfficientNet-B00.188 ± 0.175 a0.056 ± 0.027 a0.922 ± 0.302 a0.556
MobileNetV20.226 ± 0.190 a0.054 ± 0.021 a0.910 ± 0.271 a0.693
ResNeXt0.200 ± 0.193 a0.049 ± 0.015 a0.935 ± 0.183 a49.837
Mean values sharing the same letter in a row do not differ significantly at the 95% confidence interval.
Table 3. Paired t-test results: RMSECV for top DL versus PLSR.
ModelMean ± SD of RMSECVp-Value (One-Tailed Test)
SSC of mango purée (% Brix)
PLSR0.845 ± 0.2670.029
Simple-CNN0.688 ± 0.200
TA of mango purée (% malic acid)
PLSR0.055 ± 0.0200.001
Simple-CNN0.037 ± 0.008
SSC of mangosteen purée (% Brix)
PLSR0.600 ± 0.1530.006
AlexNet0.523 ± 0.168
TA of mango purée (% malic acid)
PLSR0.048 ± 0.0170.292
AlexNet0.045 ± 0.021
Disclaimer/Publisher’s Note: The statements, opinions and data contained in all publications are solely those of the individual author(s) and contributor(s) and not of MDPI and/or the editor(s). MDPI and/or the editor(s) disclaim responsibility for any injury to people or property resulting from any ideas, methods, instructions or products referred to in the content.