Article

Transcriptome Analysis Reveals Key Genes Involved in Fruit Length Trait Formation in Pepper (Capsicum annuum L.)

1
Engineering Research Center for Horticultural Crop Germplasm Creation and New Variety Breeding, Ministry of Education, Key Laboratory for Vegetable Biology of Hunan Province, College of Horticulture, Hunan Agricultural University, Changsha 410128, China
2
Yue Lu Shan Lab, Changsha 410128, China
*
Authors to whom correspondence should be addressed.
These authors contributed equally to this work.
Horticulturae 2025, 11(9), 1025; https://doi.org/10.3390/horticulturae11091025
Submission received: 6 August 2025 / Revised: 25 August 2025 / Accepted: 29 August 2025 / Published: 1 September 2025
(This article belongs to the Special Issue Genomics and Genetic Diversity in Vegetable Crops)

Abstract

Pepper is a major horticultural crop cultivated extensively worldwide. Among its various agronomic characteristics, fruit length is a key trait influencing both yield and visual quality. Despite its importance, the genetic mechanisms regulating fruit length in Capsicum remain insufficiently characterized, hindering the development of high-yielding and aesthetically desirable cultivars. In this study, fruits at three developmental stages (0, 15, and 30 days after flowering) were sampled from the long-fruit mutant fe1 and its wild-type progenitor LY0. Phenotypic characterization and transcriptomic sequencing were conducted to identify candidate genes associated with fruit length regulation. Morphological analysis revealed that the most pronounced difference in fruit length occurred at 30 days after flowering. RNA-seq analysis identified 41,194 genes, including 13,512 differentially expressed genes (DEGs). Enrichment analysis highlighted key pathways, such as plant–pathogen interaction, plant hormone signal transduction, and the MAPK signaling pathway. DEG classification suggested that several downregulated genes related to early auxin responses may contribute to the regulation of fruit elongation. Notably, the gibberellin signaling gene SCL13 (Caz12g26660), transcription factors MYB48 (Caz11g07190) and ERF3-like (Caz10g00810), and the cell-wall-modifying gene XTH15-like (Caz07g19100) showed significantly elevated expression in 30-day-old fruits of fe1. Weighted gene co-expression network analysis (WGCNA) further revealed a strong positive correlation among these genes. Quantitative RT-PCR analysis of eight selected DEGs confirmed the RNA-seq results. This study provides a foundational framework for dissecting the molecular regulatory network of fruit length in Capsicum, offering valuable insights for breeding programs.

1. Introduction

Pepper (Capsicum annuum L.), a species within the genus Capsicum (family Solanaceae), is an economically significant crop grown extensively around the globe [1,2]. As the primary edible organ, fruit characteristics directly impact yield and market value [3]. Among these traits, fruit shape is a major target during domestication and breeding, and deciphering its genetic and physiological basis is essential for developing improved cultivars [4].
Fruit length, in particular, has garnered focused attention, as it directly influences both yield potential and consumer appeal [5,6,7]. In various horticultural crops, substantial efforts have been made to uncover the genetic basis of this trait. For instance, in tomato, Wu et al. [8] identified SlOFP20, a key gene within the sov1 locus that modulates fruit elongation by regulating interactions among shape-related genes. In cucumber, Xin et al. [9] mapped the SF1 gene, encoding a RING-type E3 ubiquitin ligase, which regulates ethylene biosynthesis by inhibiting ACS2, ultimately reducing cell division and shortening fruit length. In pepper, progress has been made through the identification of fruit length quantitative trait loci (QTLs). Chaim et al. [10] reported a major locus, fs3.1, on chromosome 3 that accounted for 60% of fruit shape variation by elongating the fruit and narrowing its width. Han et al. [11] identified six fruit length QTLs using an ultra-dense genetic map, with fs3.2 localized to a 5 Mb region on chromosome 3 and contributing 14.4–26.7% of phenotypic variance. Additional QTLs have been detected by Lee et al. [12], who combined QTL mapping with genome-wide association studies and identified PD_FL2, PD_FL3.1, PD_FL3.2, PD_FL5, and PD_FL9 across four chromosomes. Similarly, Arjun et al. [13] employed a high-density interspecific hybrid map to detect two QTLs—paufl2.1 and paufl2.2—that explained 21.78% of fruit length variation. Ma et al. [14] identified QTLs, such as ftl2.1, ftd2.1, fts1.1, ftw2.1, and lcn1.1, which regulate fruit length, diameter, shape index, weight, and locule number in F2 and F2:3 populations. In another study, Borovsky et al. [15] used contrasting parental lines to detect fs10 on chromosome 10, explaining 68–70% of variation in fruit shape index and distal end angle.
Despite these advancements, most studies in Capsicum remain focused on QTL mapping, with few fruit length genes successfully cloned. Recently, Mao et al. [16] performed map-based cloning using a round-fruit parent (D39) and a long-fruit parent (D40), isolating a QTL on chromosome 10 that accounted for 26% of the observed phenotypic variation. The gene CaIQD1, identified within this region, was shown to positively regulate the fruit length-to-width ratio in Capsicum. Furthermore, reduced expression of CaOFP20 led to elongated, curved fruits, while lower CaTRM-like expression produced rounder fruit shapes.
Compared with other horticultural species, the molecular framework governing fruit length in Capsicum remains relatively uncharacterized, limiting progress in breeding programs aimed at enhancing yield and market traits [12]. To address this gap, we investigated fruit development in the long-fruit mutant fe1 and its wild-type counterpart LY0. Through phenotypic evaluation and transcriptomic profiling, we aimed to identify candidate genes influencing fruit length. The insights gained from this study will contribute to a deeper understanding of the molecular regulation of fruit morphology in Capsicum and facilitate the development of improved cultivars through targeted breeding.

2. Materials and Methods

2.1. Plant Materials

In a previous study, a stable long-fruit mutant, fe1, was generated through EMS mutagenesis of the highly homozygous C. annuum inbred line LY0. In this study, fe1 (hereafter referred to as L) and its wild-type counterpart LY0 (designated as S) were used as experimental materials. The plants of fe1 and LY0 were cultivated in a controlled growth chamber (Model: HP600GS-LD) under a 16 h light/8 h dark photoperiod, with temperatures maintained at 30 ± 2 °C during the light period and 20 ± 2 °C during the dark period. All plants received routine irrigation and fertilizer management. At the full-bloom stage, individual plants were labeled for subsequent observations. Fruit length and width were measured at 0, 15, and 30 days after flowering (DAF) (hereafter referred to as 0 d, 15 d, and 30 d, respectively). Pericarp tissues at each developmental stage (excluding seeds and placenta) were collected and immediately stored at –80 °C in an ultra-low-temperature freezer for subsequent RNA-seq analysis.

2.2. Morphological Trait Measurement

To assess the phenotypic differences between fe1 and LY0, fruit length and width were measured throughout fruit development using a digital vernier caliper. Measurements were conducted at 0 d, 15 d, and 30 DAF. Three independent replicates were conducted for each sample.

2.3. Cytological Observation of Fruits

Histological analysis of fruit longitudinal sections was performed using safranin and fast green staining, with three fruits at identical developmental stages selected per material for examination following the protocol below. A. Fruits from both genotypes were sampled at 30 DAF from equivalent nodal positions. Sections were taken from the same region of each fruit, fixed in 50% FAA solution, and embedded in paraffin. B. Paraffin-embedded samples were dewaxed and rehydrated through a sequential series of xylene (20 min), absolute ethanol (20 min), absolute ethanol (5 min), and 75% ethanol (5 min) and then rinsed with tap water. C. Sections were stained with plant safranin solution for 2 h and gently washed with tap water to remove excess staining. D. Decolorization was performed using graded ethanol concentrations (50%, 70%, and 80%) for 3–8 s each. E. Fast green staining was applied for 6–20 s, followed by dehydration with absolute ethanol. F. Samples were cleared in xylene for 5 min and mounted with neutral resin. G. Stained sections were examined and imaged using a light microscope (Micro-shot Technology Co., Ltd., Guangzhou, China).

2.4. RNA Extraction, Library Preparation, and Sequencing

Total RNA was extracted from tissue samples of fe1 and LY0 collected at three developmental stages (0 d, 15 d, and 30 d) using TRIzol reagent, (Invitrogen, Carlsbad, CA, USA) following the manufacturer’s protocol. RNA integrity was verified with purity and concentration determined using a NanoDrop 2000 (Thermo Fisher Scientific, Wilmington, DE, USA) spectrophotometer via 1% agarose gel electrophoresis using a GelView 1500Plus imaging system (BLT Photon Technology, Guangzhou, China) to ensure RNA quality and avoid degradation or contamination. Libraries were prepared using the NEBNext Ultra™ RNA Library Prep Kit (New England Biolabs, Ipswich, MA, USA). mRNA was enriched with mRNACapture Beads and subsequently fragmented. First-strand cDNA synthesis was performed using fragmented mRNA as the template, followed by purification with VAHTS™ DNA Clean Beads (Vazyme Biotech Co., Ltd, Nanjing, China). After end-repair and adapter ligation, cDNA libraries were amplified and evaluated for insert size using the Agilent 2100 Bioanalyzer (Agilent Technologies, Santa Clara, CA, USA). Libraries that passed quality checks were submitted for high-throughput sequencing and subsequent bioinformatics analysis [17]. Each sample was replicated three times, for a total of 18 DGE libraries (=2 materials × 3 time points × 3 replicate seedlings) constructed and sequenced. RNA-seq sequencing and assembly were performed by Biomarker Technologies Co., Ltd. (Qingdao, China) using an Illumina NovaSeq X Plus platform (Illumina, Inc., San Diego, CA, USA) with a paired-end 150 bp (PE150) strategy.

2.5. RNA-Seq and Differentially Expressed Gene (DEG) Analysis

Raw sequencing data were processed to remove low-quality reads and adapter sequences. Reads were filtered out if they contained more than 10% ambiguous bases (N) or if over 50% of their bases had a quality score ≤10. The Q20 and Q30 values were calculated to evaluate sequencing accuracy. High-quality clean reads were aligned to the C. annuum reference genome (Capsicum_annuum.Zhangshugang.genome.fa; accessed on 30 April 2025) obtained from http://ted.bti.cornell.edu/cgi-bin/pepper/index using HISAT2. Transcript assembly and quantification were performed with StringTie 1.3.3. Assembled transcripts were compared against genome annotations to identify unannotated regions, novel transcripts, and putative new genes. Differential gene expression analysis was conducted using the DESeq2 R package v.1.44.0. Genes with a fold change ≥2 and a false discovery rate (FDR) < 0.05 were classified as differentially expressed and selected for further investigation.

2.6. GO and KEGG Pathway Enrichment Pathway Analysis

Functional annotation of DEGs was carried out using publicly available databases. Gene Ontology (GO) classification was performed via the GO database (http://www.geneontology.org/; accessed on 30 April 2025), and the number of genes associated with each GO term was calculated. KEGG pathway enrichment analysis was conducted using the KEGG database (https://www.genome.jp/kegg/; accessed on 30 April 2025) to determine statistically significant pathway enrichment. An FDR ≤ 0.05 was considered the threshold for significance.

2.7. Co-Expression Network Analysis

To elucidate gene co-expression relationships across different samples, weighted gene co-expression network analysis (WGCNA) was conducted using the WGCNA R package. DEGs identified from both genotypes and all developmental stages were clustered into modules using the dynamic tree cut method, with each module assigned a unique color. Modules showing a strong correlation with fruit length traits and containing highly interconnected genes were further analyzed to identify potential hub genes. Gene network visualization and construction of correlation diagrams were performed using Cytoscape 3.7 [18].

2.8. Quantitative Real-Time PCR (qRT-PCR)

Quantitative real-time PCR (qRT-PCR) was employed to validate the relative expression levels of selected DEGs. Total RNA was extracted from tissue samples of fe1 and LY0 collected at three developmental stages (0 d, 15 d, and 30 d) using the SteadyPure RNA Extraction Kit (Accurate Biology, Changsha, China), and cDNA was synthesized from 1000 ng of total RNA per sample using the HiScript II 1st Strand cDNA Synthesis Kit (Vazyme Biotech Co., Ltd., Nanjing, China). Seven candidate genes were selected from the DEG dataset. The CaActin-7 gene (Caz04g16060) was selected as the internal reference for normalization in pepper. All primers were designed according to standard qPCR primer design principles using the NCBI Primer-BLAST tool (https://www.ncbi.nlm.nih.gov/tools/primer-blast/index.cgi?LINK_; accessed on 30 April 2025), and their detailed sequences are provided in Supplementary Table S1. Quantitative real-time PCR (qRT-PCR) was carried out using the ChamQ Universal SYBR qPCR Master Mix (Vazyme Biotech Co., Ltd., Nanjing, China). Three biological replicates and two technical replicates were included for each sample. Relative gene expression was calculated using the 2 C t method [19].

2.9. Data Analysis

Statistical analysis was performed using Microsoft Excel 2010, and the results were presented in three-line tables. All bar graphs were generated using GraphPad Prism software v8.0.2. Significant differences between two groups were determined using the two-tailed Student’s t-test. The significance levels were denoted as follows: “ns” for not significant, “*” for p < 0.05, “**” for p < 0.01, “***” for p < 0.001, and “****” for p < 0.0001.

3. Results

3.1. Phenotypic Observation

Phenotypic evaluation of Capsicum fruits revealed no significant difference in ovary length between the long-fruit mutant fe1 and its wild-type counterpart LY0 at anthesis. However, notable differences in fruit length emerged at 15 and 30 DAF, with the most substantial divergence observed at 30 DAF (Figure 1A,B). Histological analysis of paraffin-embedded fruit sections at 30 DAF showed that in fe1, epidermal cells were smaller and more densely packed, while cells in the mesocarp exhibited elongation and a more slender morphology (Figure 1C). These results suggest that the extended fruit length observed in fe1 is likely driven by cellular mechanisms involving enhanced cell division and/or directional cell expansion.

3.2. RNA-Seq and Annotation of DEGs

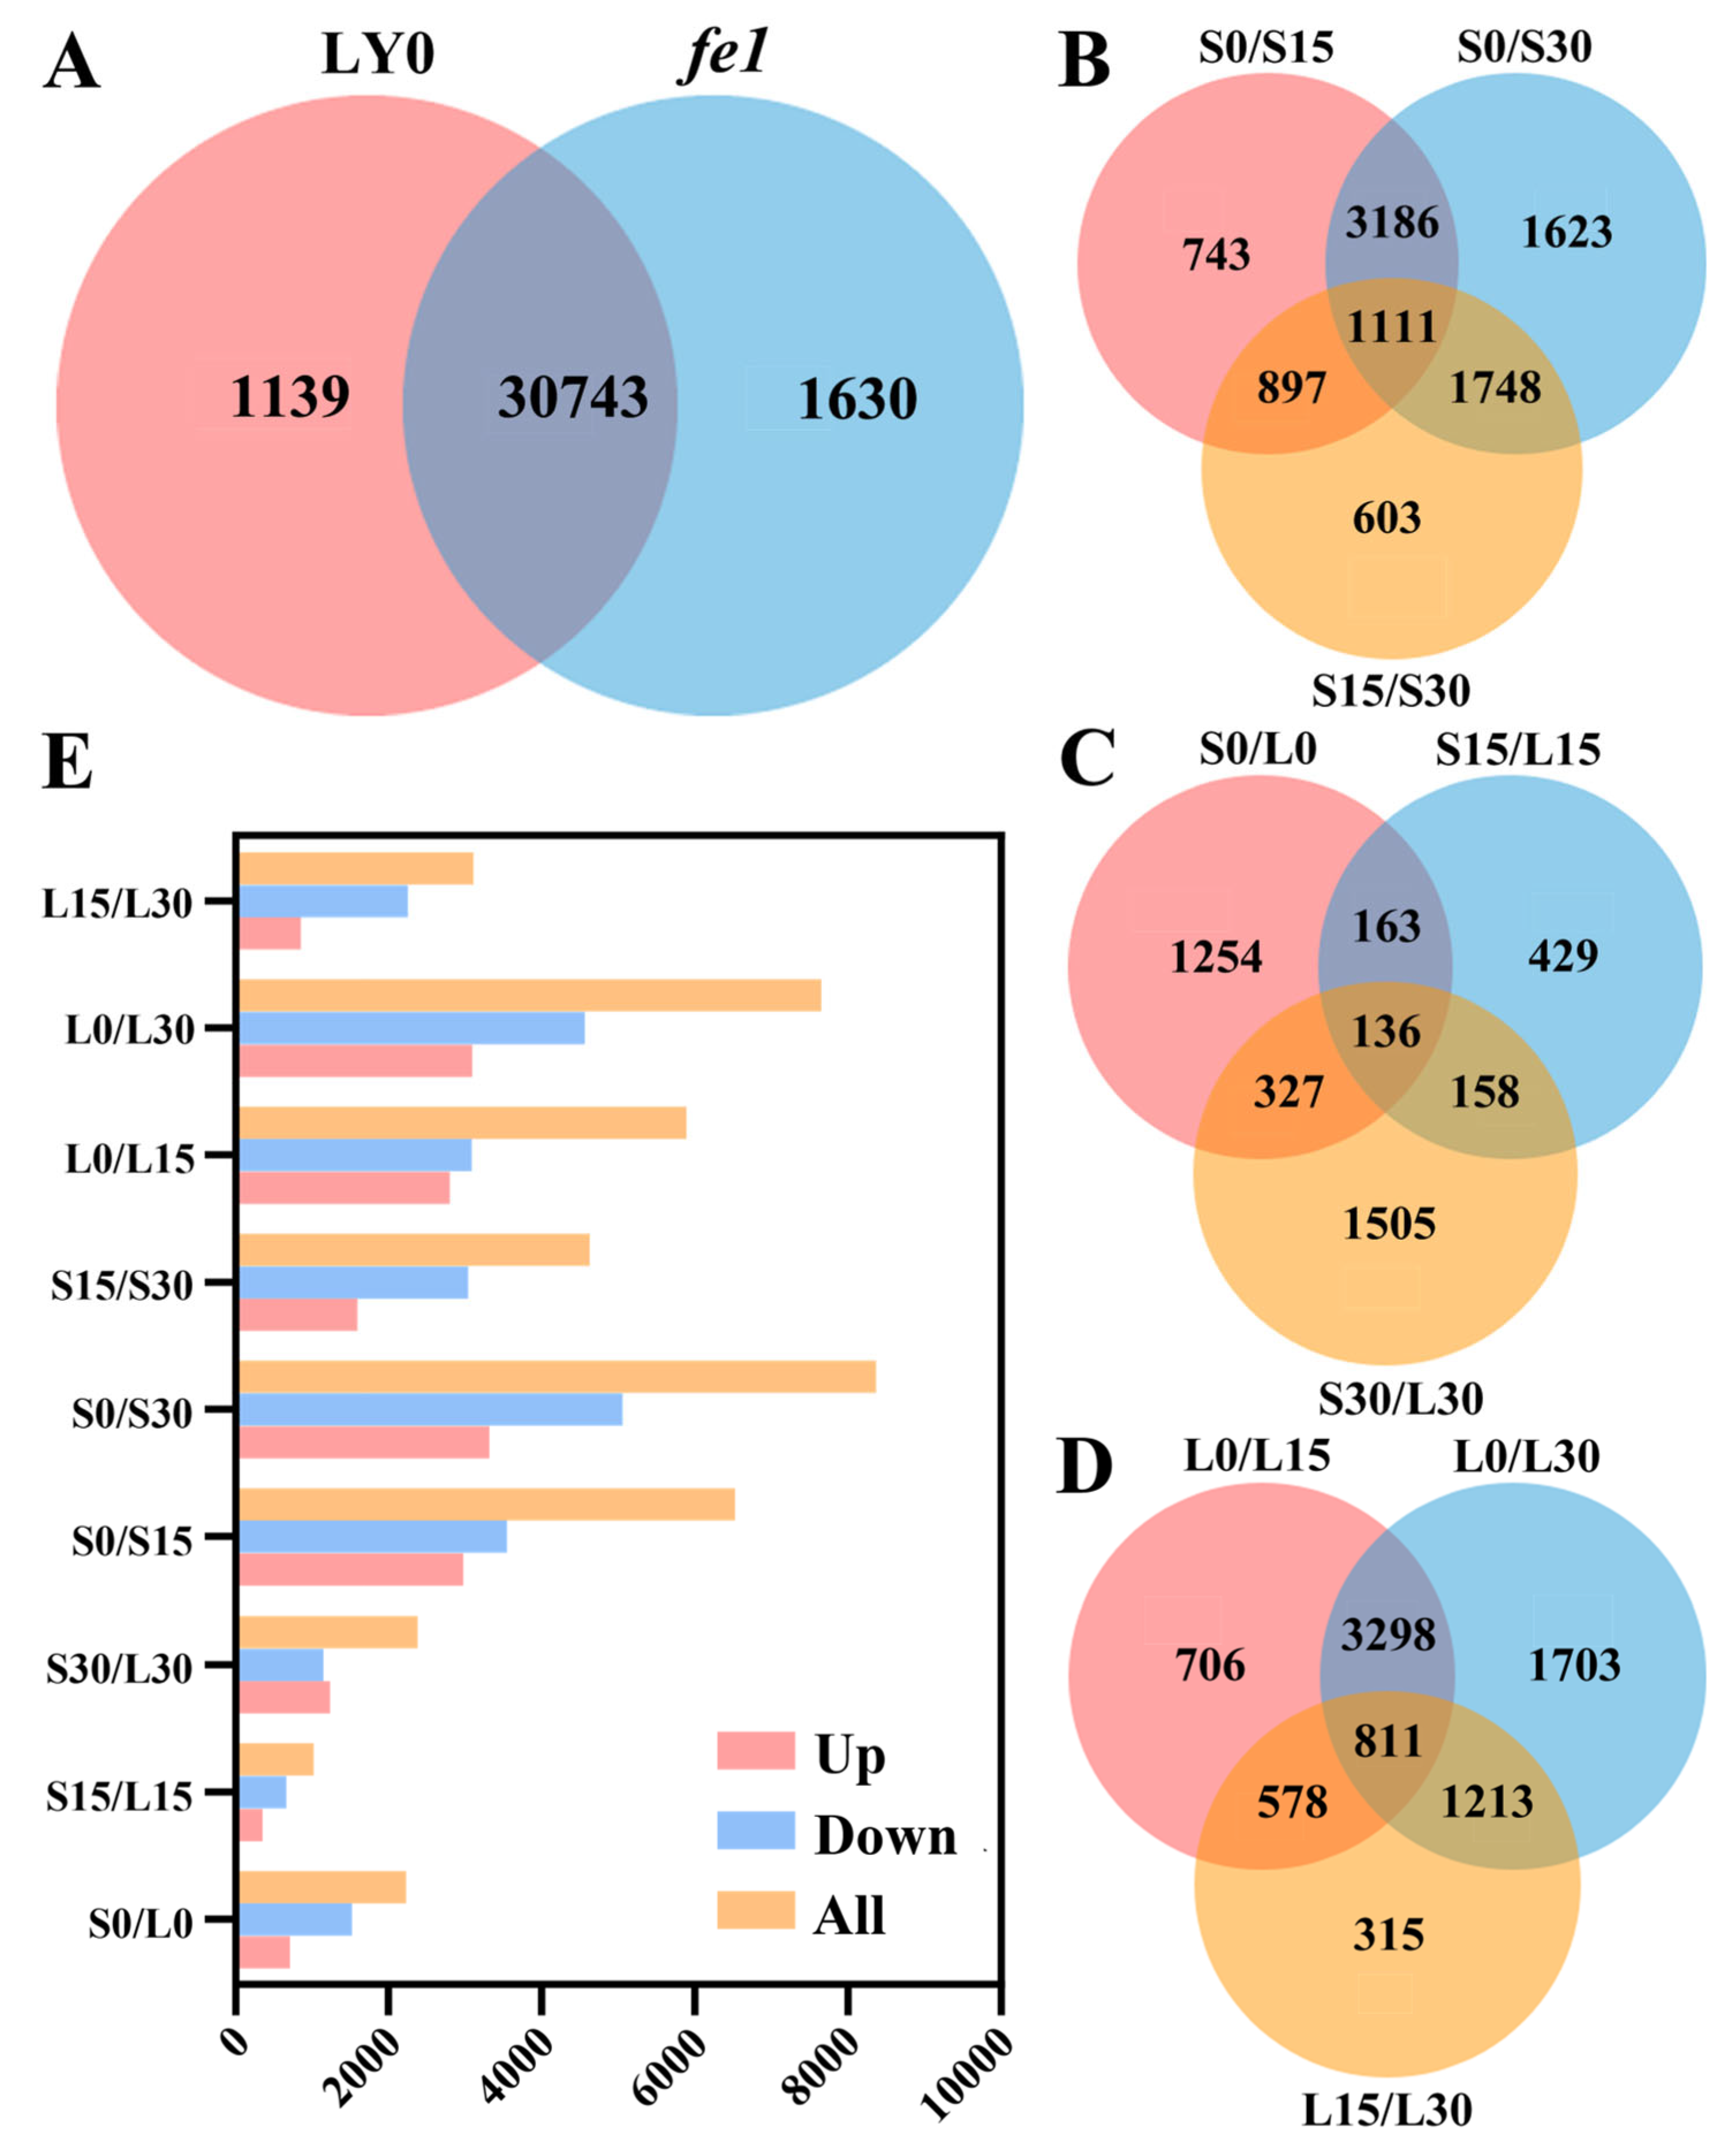
Illumina sequencing produced a total of 123.62 Gb of high-quality clean data, with each sample yielding no less than 5.70 Gb and a Q30 score exceeding 92.99%, indicating excellent sequencing quality. Clean reads from each sample were aligned to the designated reference genome, with alignment efficiencies ranging from 93.95% to 96.31%. Clean bases for each sample ranged between 5,701,311,412 and 8,934,537,568. Across 18 samples, 41,194 unigenes were identified, including 13,512 DEGs and 2641 novel genes (Table S1). A total of 31,882 and 32,373 genes were quantified in LY0 and fe1, respectively, with 30,743 genes commonly detected in both (Figure 2A). Gene quantification across developmental stages revealed 1111 genes in LY0 and 811 in fe1. Comparisons between LY0 and fe1 at equivalent stages identified 136 shared genes and 1254, 429, and 1505 stage-specific genes at 0 d, 15 d, and 30 d, respectively (Figure 2B–D). The high number of uniquely quantified genes suggests substantial transcriptional differences between the two genotypes across developmental time points.
When examining DEGs across developmental stages within the same genotype, the highest DEG count was observed in the 0 d/30 d comparison, while the lowest occurred in the 15 d/30 d group. Between genotypes, the largest number of DEGs was detected at 30 d, consistent with phenotypic observations showing the greatest fruit length difference at this stage. In all comparison groups except S30/L30, the number of downregulated genes exceeded that of upregulated genes (Figure 2E, Table S3).

3.3. GO Enrichment Analysis

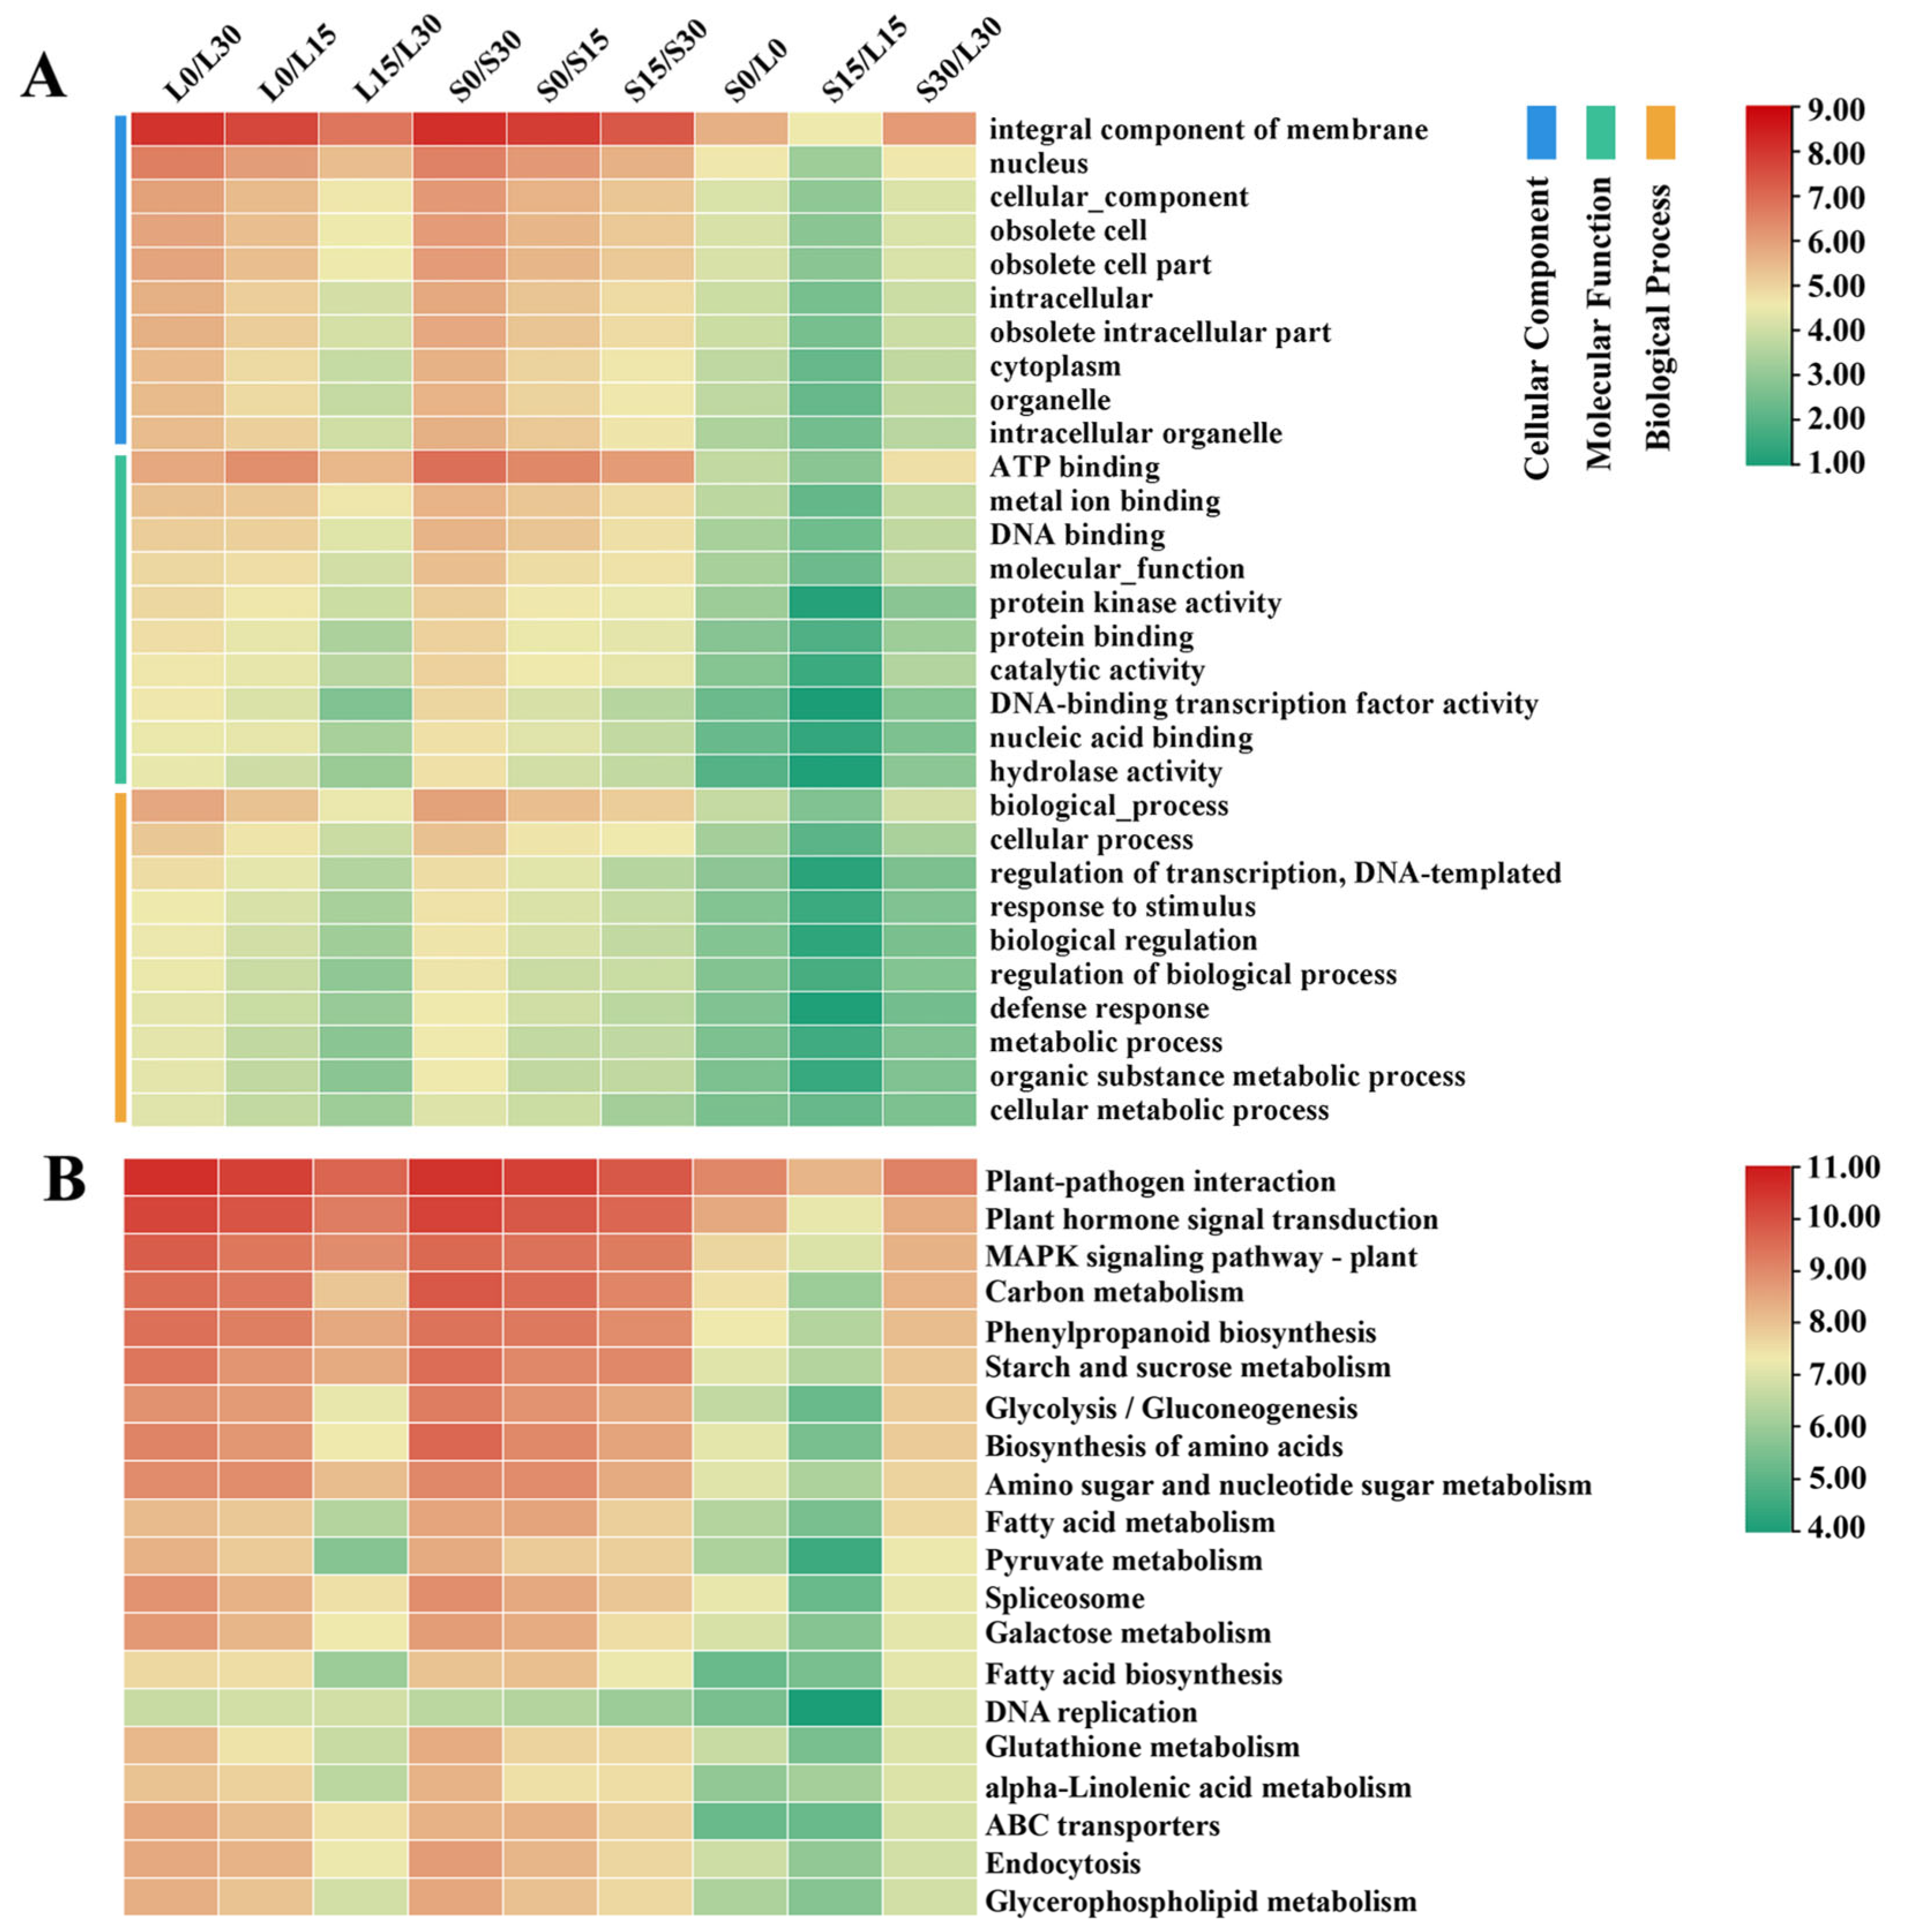
To investigate the biological relevance of DEGs related to fruit length regulation, GO enrichment analysis was performed. DEGs in each comparison group were classified into three primary GO categories: Cellular Component, Molecular Function, and Biological Process. The L0/L30 group, which yielded the highest number of DEGs, was selected for detailed enrichment profiling. Among Cellular Component terms, “integral component of membrane” and “nucleus” were the most significantly enriched across all nine comparison groups. In the Molecular Function category, terms like “ATP binding” and “metal ion binding” were predominant. Within Biological Process, “biological process” and “cellular process” were the most highly represented. Notably, “integral component of membrane” (GO:0016021) showed the highest gene enrichment across comparison groups, suggesting involvement in processes regulating fruit elongation (Figure 3A). Among genotype comparisons at the same developmental stage, the S30/L30 group displayed the most enriched GO terms, while S15/L15 showed the fewest, further confirming that transcriptomic divergence and key regulatory events are most pronounced at 30 DAF.

3.4. KEGG Pathway Analysis

To further elucidate the biological pathways associated with DEGs, KEGG pathway enrichment analysis was conducted. The top 20 enriched pathways were identified in the S30/L30 comparison group. Significant enrichment was observed in pathways including “plant–pathogen interaction,” “plant hormone signal transduction,” and “MAPK signaling pathway–plant.” These are likely central to fruit length regulation in Capsicum. Within-genotype comparisons (L0/L30 and S0/S30) showed the highest DEG enrichment, followed by L0/L15 and S0/S15. Between-genotype comparisons at the same developmental stage showed that S30/L30 had the highest DEG count, while S0/L0 had the lowest (Figure 3B). These results suggest that metabolic and signaling differences contributing to fruit length variation predominantly occur during later stages of fruit development. GO-enriched biological processes, such as “cellular metabolic process,” “organic substance metabolic process,” and “biological regulation,” aligned with KEGG pathways related to “carbon metabolism,” “fatty acid metabolism,” and “amino acid metabolism,” highlighting the importance of energy dynamics, biosynthesis, and hormone signaling in shaping fruit morphology.

3.5. Analysis of Transcription Factor (TF)-Related DEGs

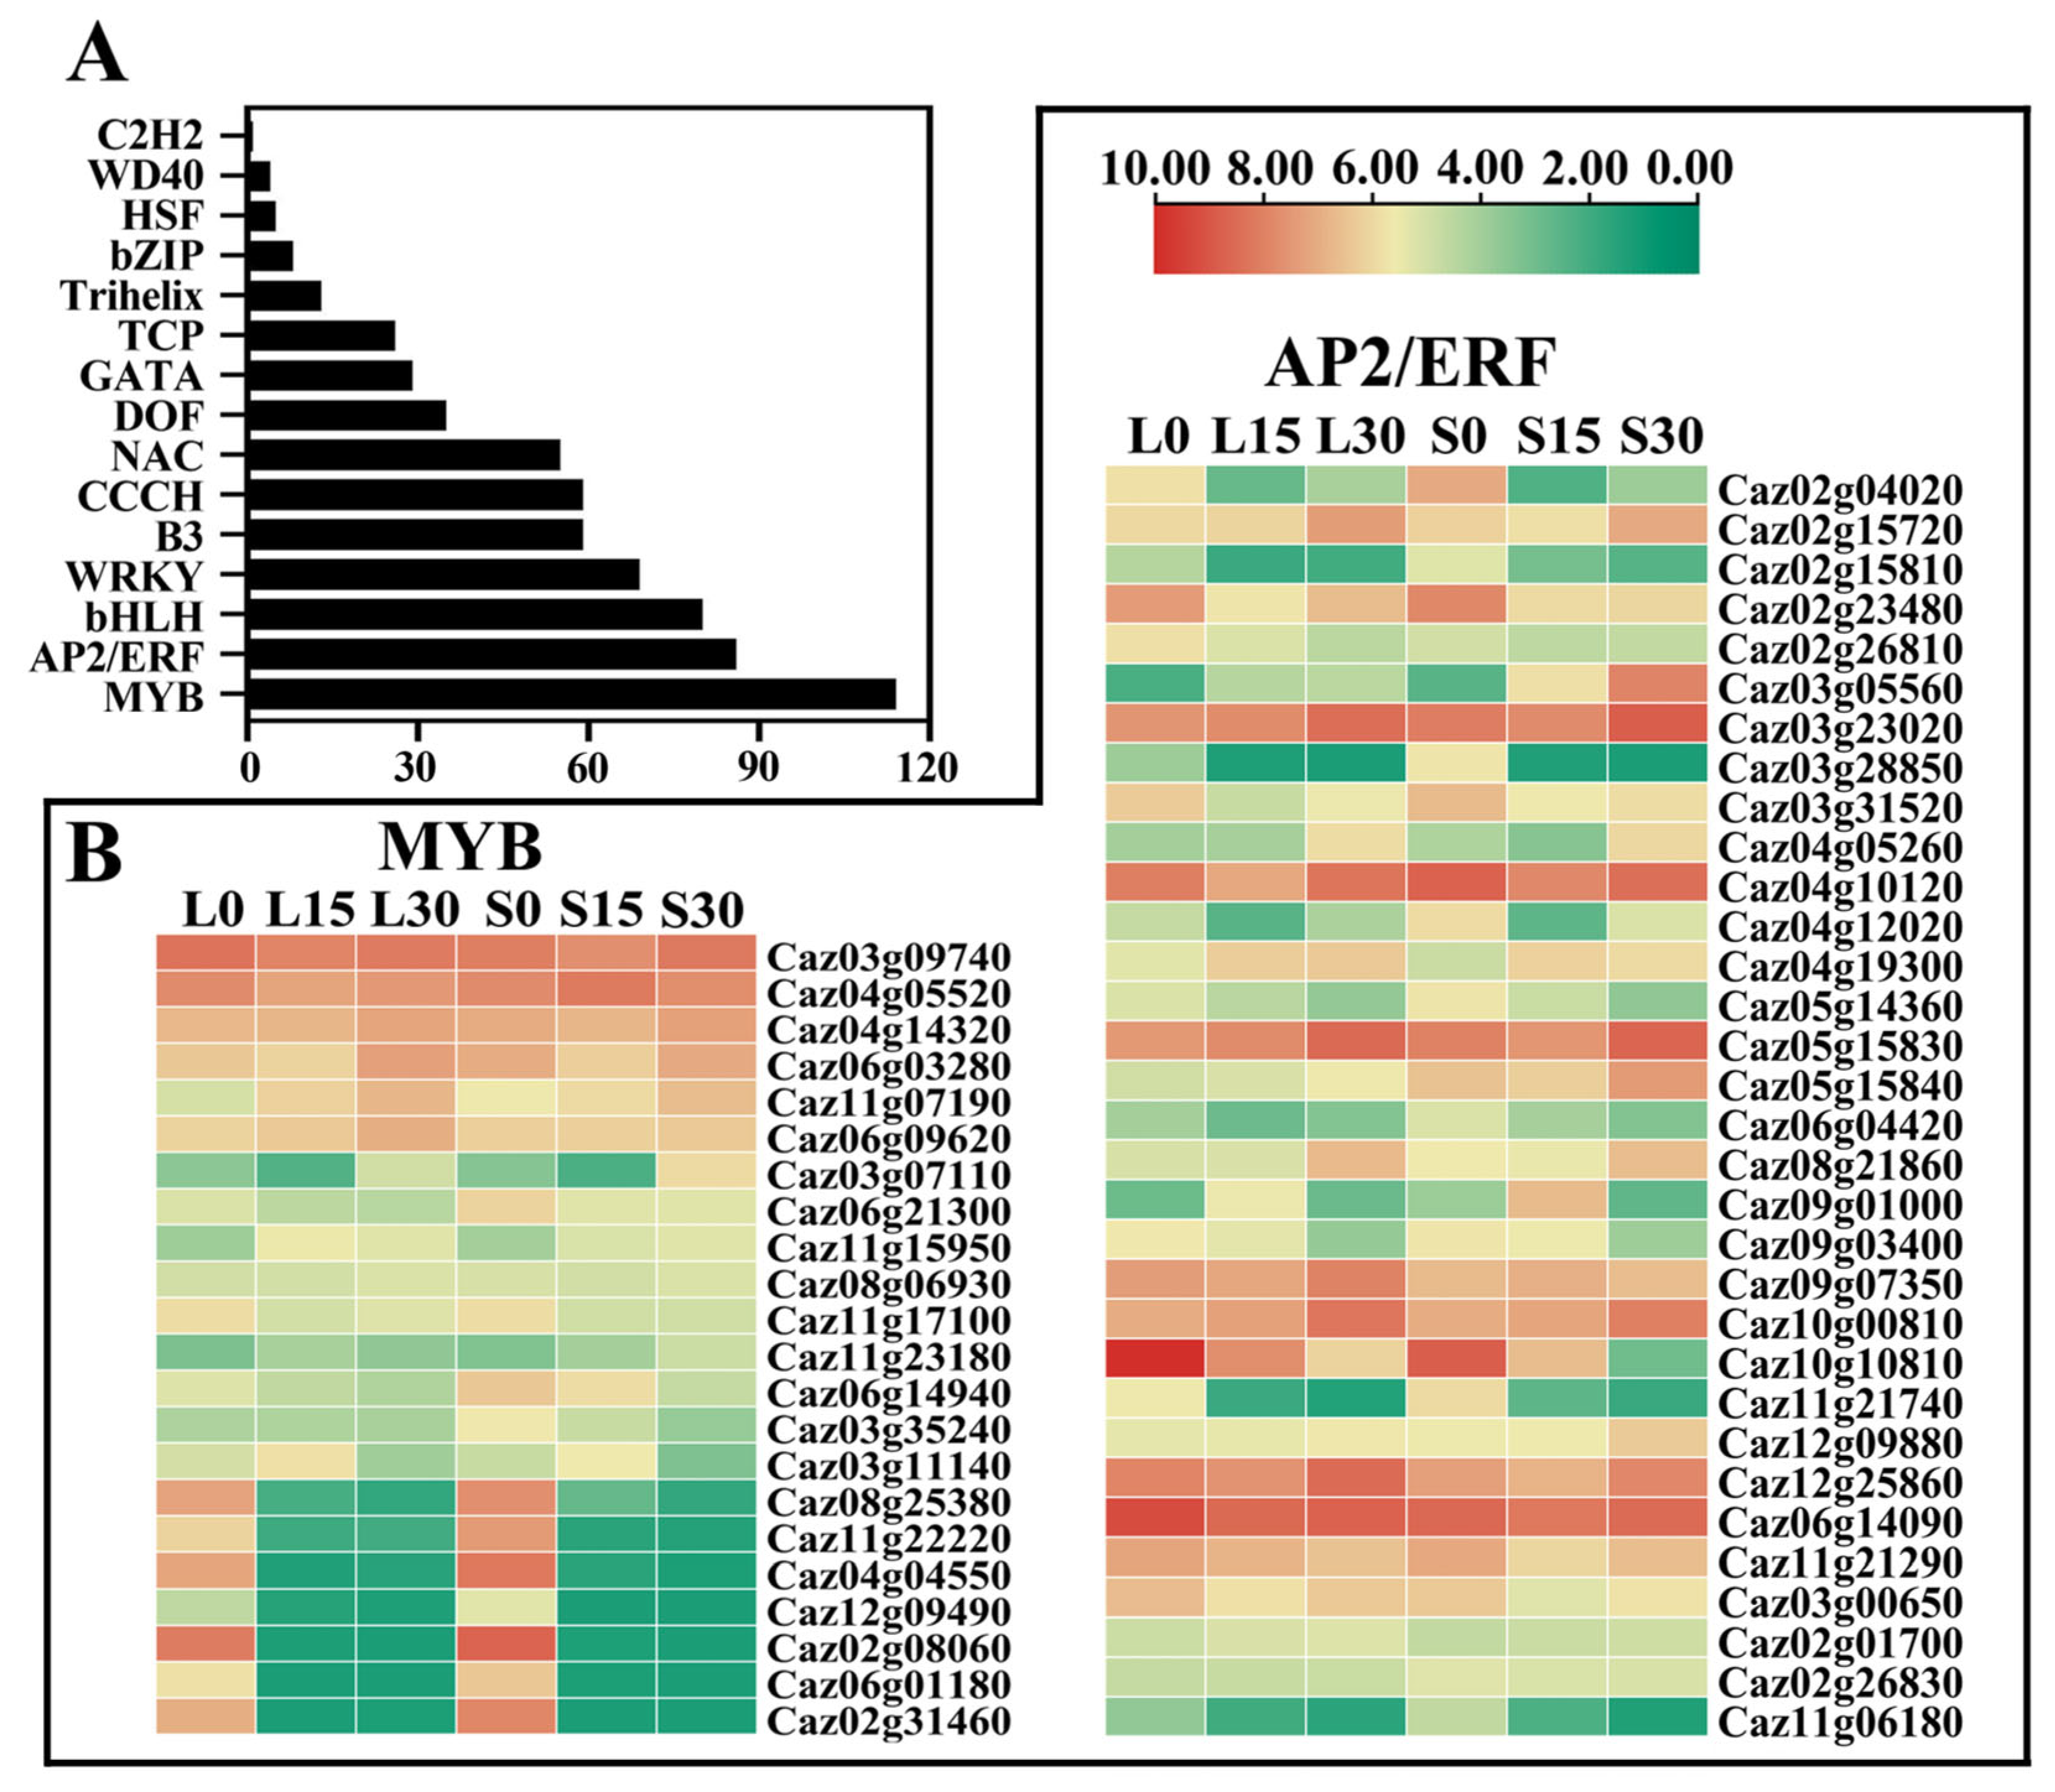
Transcription factors (TFs) are key regulators of plant growth, development, and morphogenesis. To investigate their involvement in fruit length determination in Capsicum, 15 TF families were identified among the DEGs (Figure 4A, Table S4). Ranked by the number of differentially expressed members, these families included MYB, AP2/ERF, bHLH, WARK, B3, CCCH, NAC, DOF, GATA, TCP, Trihelix, bZIP, HSP, WD40, and C2H2.
Applying a filtering threshold of FPKM > 20 in at least two biological replicates from one sample, the two most abundant families—MYB and AP2/ERF—were selected for in-depth expression analysis (Figure 4B). In the MYB family, MYB6-like (Caz03g11140) and MYB1R1 (Caz03g09740) displayed elevated expression in fe1 compared to LY0 at both 15 and 30 DAF. Most other MYB genes, including MYB305 (Caz02g08060), MYB40-like (Caz02g31460), MYB44-like (Caz04g04550), MYB308-like (Caz08g25380), MYB24 (Caz11g22220), and MYBZm1 (Caz06g01180), were significantly downregulated at 30 days compared to 0 days in both genotypes. This pattern suggests a developmental stage-specific regulatory function—these genes may be transcriptionally active during early fruit development and repressed at later stages. In the AP2/ERF family, ERFLP1 (Caz10g10810) exhibited the highest expression at 0 days and the lowest at 30 days, with expression consistently higher in fe1 than in LY0. ERFRAP2-12 (Caz02g23480) also showed higher expression in fe1 at 30 days, despite its lower expression in fe1 compared to LY0 at both 0 and 15 days, although its overall expression declined over time in both genotypes. Conversely, ERF5 (Caz05g15830), ERF5-like (Caz03g23020), and ERF4-like (Caz09g07350) reached their peak expression at 30 days, with a general upward trend during fruit development in both genotypes. Among these, ERF4-like was significantly more highly expressed in fe1 than in LY0. The distinct temporal expression patterns of MYB and AP2/ERF TFs during fruit development indicate that they likely function at specific stages to regulate cell proliferation and expansion processes underlying fruit elongation. These genotype-specific transcriptional differences between fe1 and LY0 suggest that both TF families play critical roles in the complex regulatory network controlling fruit length traits in Capsicum.

3.6. Analysis of DEGs Related to Auxin and Gibberellin (GA) Signal Transduction Pathways

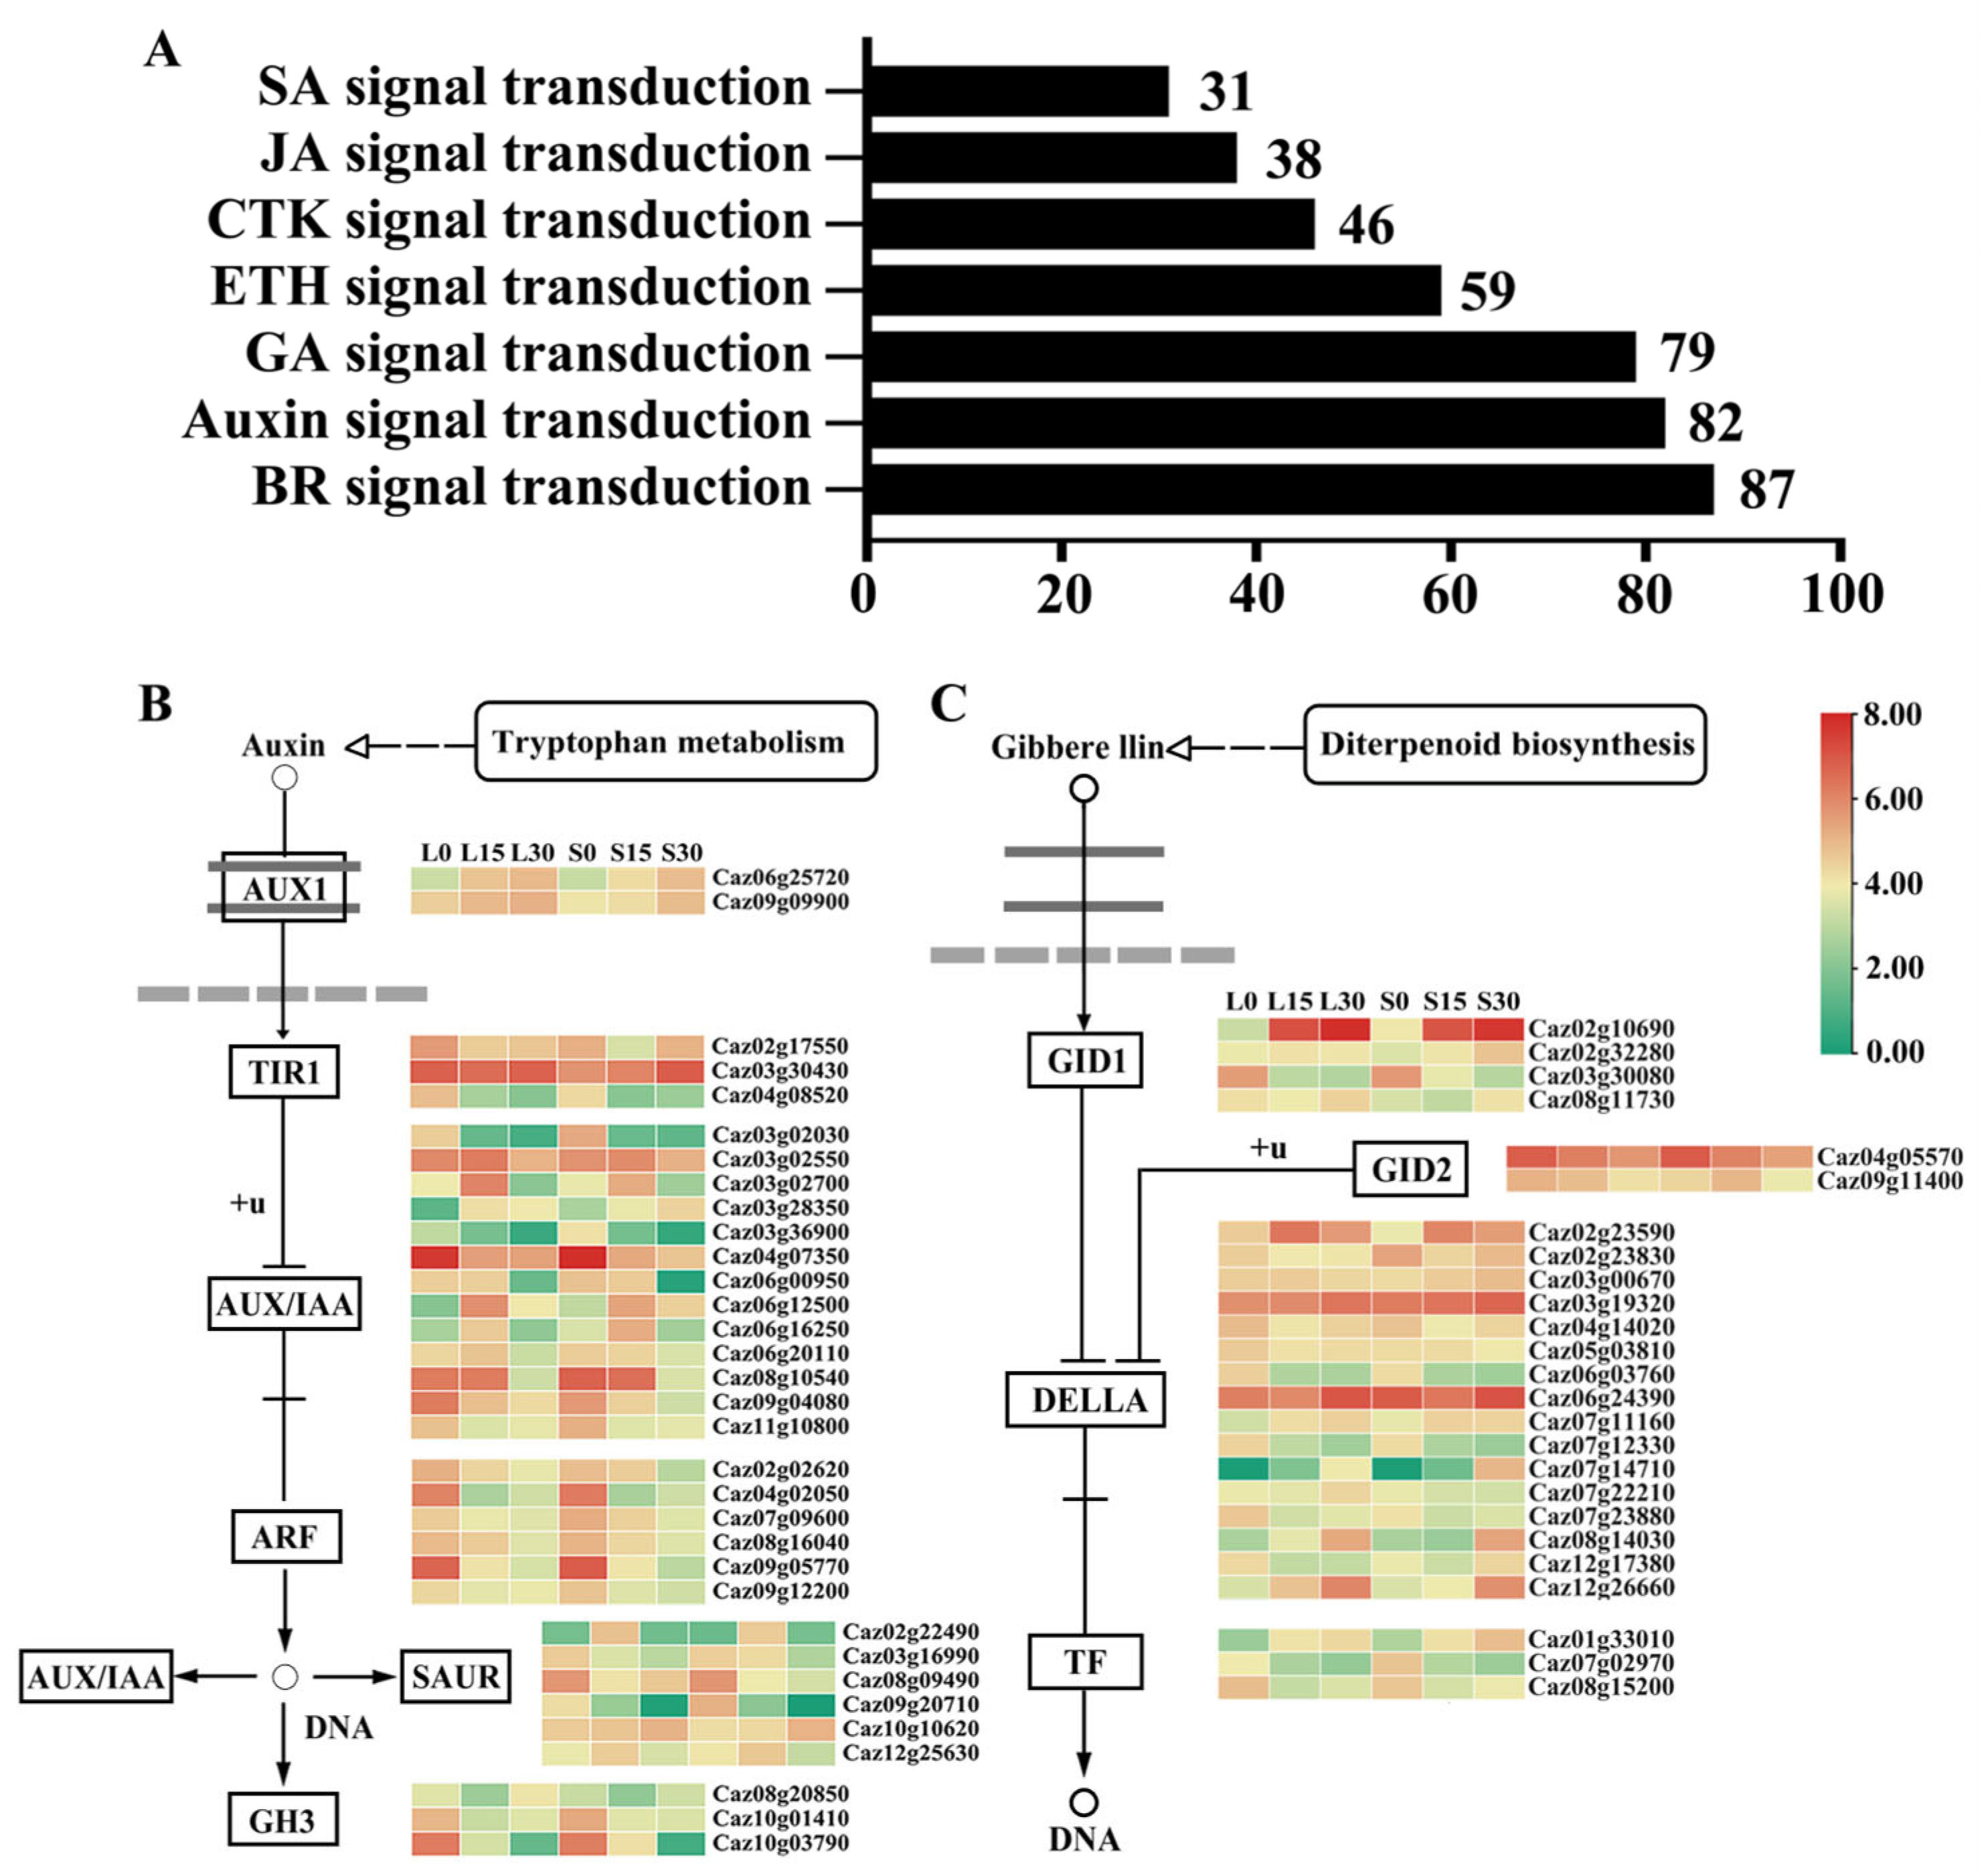
The KEGG enrichment analysis indicated that a substantial number of DEGs were significantly associated with the plant hormone signal transduction pathway across all nine comparison groups. Phytohormones play essential roles in fruit development, with auxin, abscisic acid, ethylene, jasmonic acid, and salicylic acid being key regulators of fruit morphology. Among the hormone pathways, genes were most enriched in the following order: brassinosteroid (BR) signaling, auxin signaling, gibberellin (GA) signaling, ethylene signaling, cytokinin signaling, jasmonic acid signaling, and salicylic acid signaling (Figure 5A, Table S5).
Based on the criterion of FPKM > 20 in at least two biological replicates, auxin and GA signaling pathways—the two with the highest number of DEGs—were selected for detailed analysis (Figure 5B,C). Given their central roles in fruit development, DEGs in these pathways were further examined to identify potential regulators of fruit length. Several ARF (auxin response factor) genes—ARF6-like (Caz09g05770), ARF8-like (Caz02g02620), ARF11 (Caz08g16040), and ARF19-like (Caz07g09600)—exhibited decreased expression at 30 days compared to 0 days in both genotypes, indicating developmental downregulation. The AUX/IAA family gene AUX22 (Caz03g02700), an early auxin-responsive regulator, showed a transient expression peak at 15 days, with higher expression in fe1 than LY0 at that stage but lower expression in fe1 at 30 days. Similarly, the auxin pathway suppressor IAA9 (Caz04g07350, Caz06g16250) displayed decreasing expression throughout development. SAUR32 (Caz08g09490), a rapid-response auxin gene, was more highly expressed in fe1 than LY0 at 30 days but still exhibited a downward trend relative to earlier stages. Auxin receptor genes TIR1 (Caz02g17550, Caz03g30430, Caz04g08520) showed consistently higher expression in fe1, suggesting elevated auxin sensitivity. TDC1 genes (Caz06g25720, Caz09g09900), involved in auxin biosynthesis, increased in expression during development and were more strongly expressed in fe1. In the GA signaling pathway, SCL family genes—positive regulators of GA response—were generally more highly expressed in fe1, particularly SCL21 (Caz07g22210) and SCL13 (Caz12g26660), with pronounced differences at 30 days. Conversely, SCL8 genes (Caz03g19320, Caz06g24390) were downregulated in fe1. The GA pathway repressor GAI1-like (Caz03g00670), a DELLA protein, showed reduced expression in fe1 at 30 days, potentially relieving growth inhibition. Additionally, CXE6 (Caz02g10690), involved in hormone signal metabolism, peaked at 30 days and was more highly expressed in fe1. The GA signal transduction gene GID2 (Caz04g05570) showed a decreasing trend during fruit development, with lower expression in fe1 early on but surpassing LY0 levels at later stages.

3.7. Expression Analysis of DEGs Related to Cell Division and Expansion

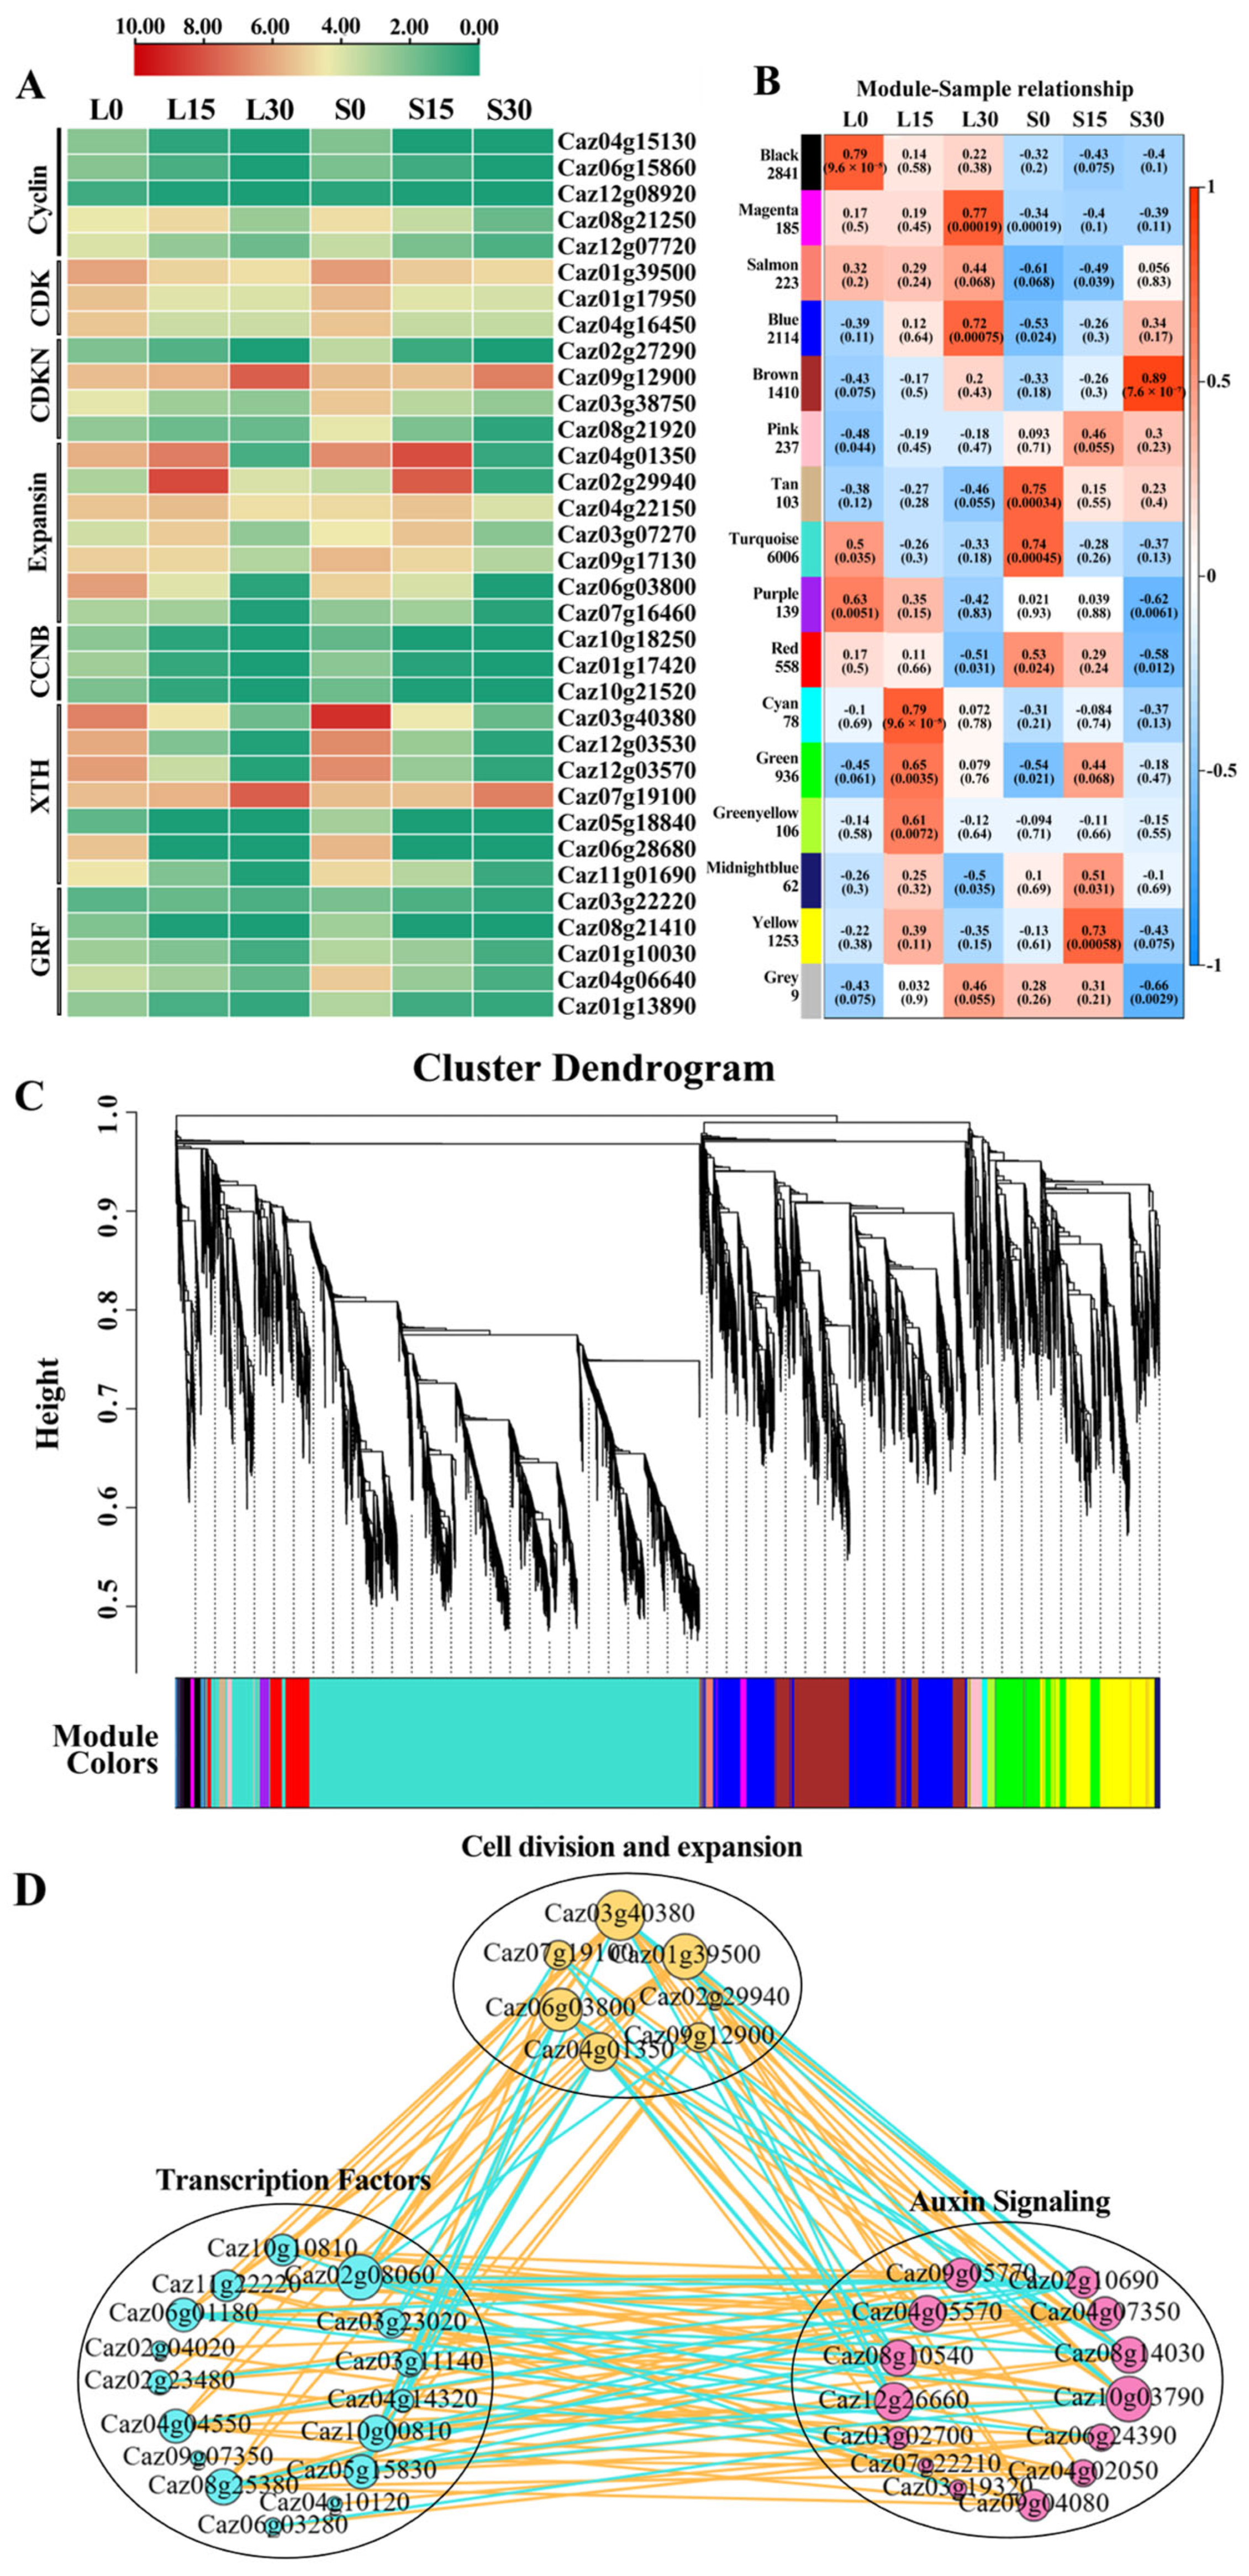
Histological examination of fruit longitudinal sections at 30 days revealed distinct differences between LY0 and fe1. Epidermal cells in LY0 were uniformly round, tightly packed, and similar in size, whereas fe1 displayed smaller and more numerous epidermal cells and a reduced number of elongated mesocarp cells. To determine whether these anatomical differences were associated with gene expression changes, DEGs related to cell division and expansion were analyzed (Figure 6A). Within the cell cycle regulation module, Cyclin-D3-1 (Caz08g21250) exhibited a rising expression trend in fe1 from 0 to 15 days, followed by a decline at 30 days. Members of the CDK family, including CDK F-4 (Caz01g39500) and CDK G-2 (Caz01g17950, Caz04g16450), showed progressive downregulation during fruit development. The CDKN family genes—CDKN1-like (Caz02g27290), CDKN3-like (Caz09g12900), CDKN4 (Caz03g38750), and CDKN1 (Caz08g21920)—which negatively regulate CDK activity, also displayed decreasing expression trends, with lower levels in fe1 than LY0. The XTH15-like gene (Caz07g19100), part of the XTH family that modifies cell walls to promote elongation, was significantly upregulated in fe1 at 30 days, with the most striking difference observed at this stage. Similarly, Expansin family genes involved in cell wall loosening—Expansin-A10 (Caz02g29940), Expansin-A13-like (Caz04g22150), and Expansin-A1-like (Caz03g07270)—were more highly expressed in fe1, especially at 30 days. Among these, Expansin-A10 showed the greatest differential expression. Overall, these results suggest that the regulation of fruit length in Capsicum involves coordinated control of cell cycle progression and cell wall remodeling, with XTH15-like and Expansin-A10 emerging as key candidate genes during the stage of maximal fruit elongation.

3.8. Co-Expression Network Analysis of DEGs Related to Pepper Fruit Length

To gain insights into the coordinated regulation of fruit-length-related genes, a weighted gene co-expression network WGCNA was conducted using 13,512 DEGs and fruit length data from different developmental stages. Sixteen co-expression modules were identified, each assigned a unique color. The Turquoise, Black, and Blue modules contained the largest numbers of genes—6006, 2841, and 2114, respectively. Among these, the Blue module exhibited a strong positive correlation with the L30 group (r = 0.72, p-value = 7.5 × 10⁻⁴) (Figure 6B,C), the developmental stage associated with the most significant fruit length differences. This suggests that genes within this module may play critical roles in regulating fruit elongation. To identify key regulators, genes in the Blue module were integrated with DEGs related to transcription factors, hormone signaling (auxin and GA), and cell division/expansion. A gene co-expression interaction network was constructed (Figure 6D). Notably, ERF4-like (Caz09g07350) and ERF1B-like (Caz12g25860)—members of the ERF/AP2 TF family—were positively correlated with GA signaling genes SCL21 (Caz07g22210) and GID1C (Caz08g11730), all of which had elevated expression in fe1 at 30 days. Further analysis showed that CXE6 (Caz02g10690), a gene involved in the GA signaling pathway, and TOE3 (Caz04g19300), an ERF/AP2 transcription factor, were directly and significantly positively correlated within the Blue module. Both genes also exhibited negative correlations with CDK F-4 (Caz01g39500) and XTH2 (Caz03g40380), suggesting opposing regulatory relationships. Additionally, although the cell division and expansion-related DEGs identified earlier were not located within the Blue module—which was found to be highly correlated with the L30 group through WGCNA analysis—the co-expression network showed that these genes were still closely linked to auxin and GA signaling pathway components, as well as transcription factors. It is therefore speculated that the expression of genes involved in cell division and expansion is primarily regulated by upstream transcription factors and plant hormone signaling pathways, which ultimately influence changes in pepper fruit length.

3.9. Validation of RNA-Seq Data Using qRT-PCR

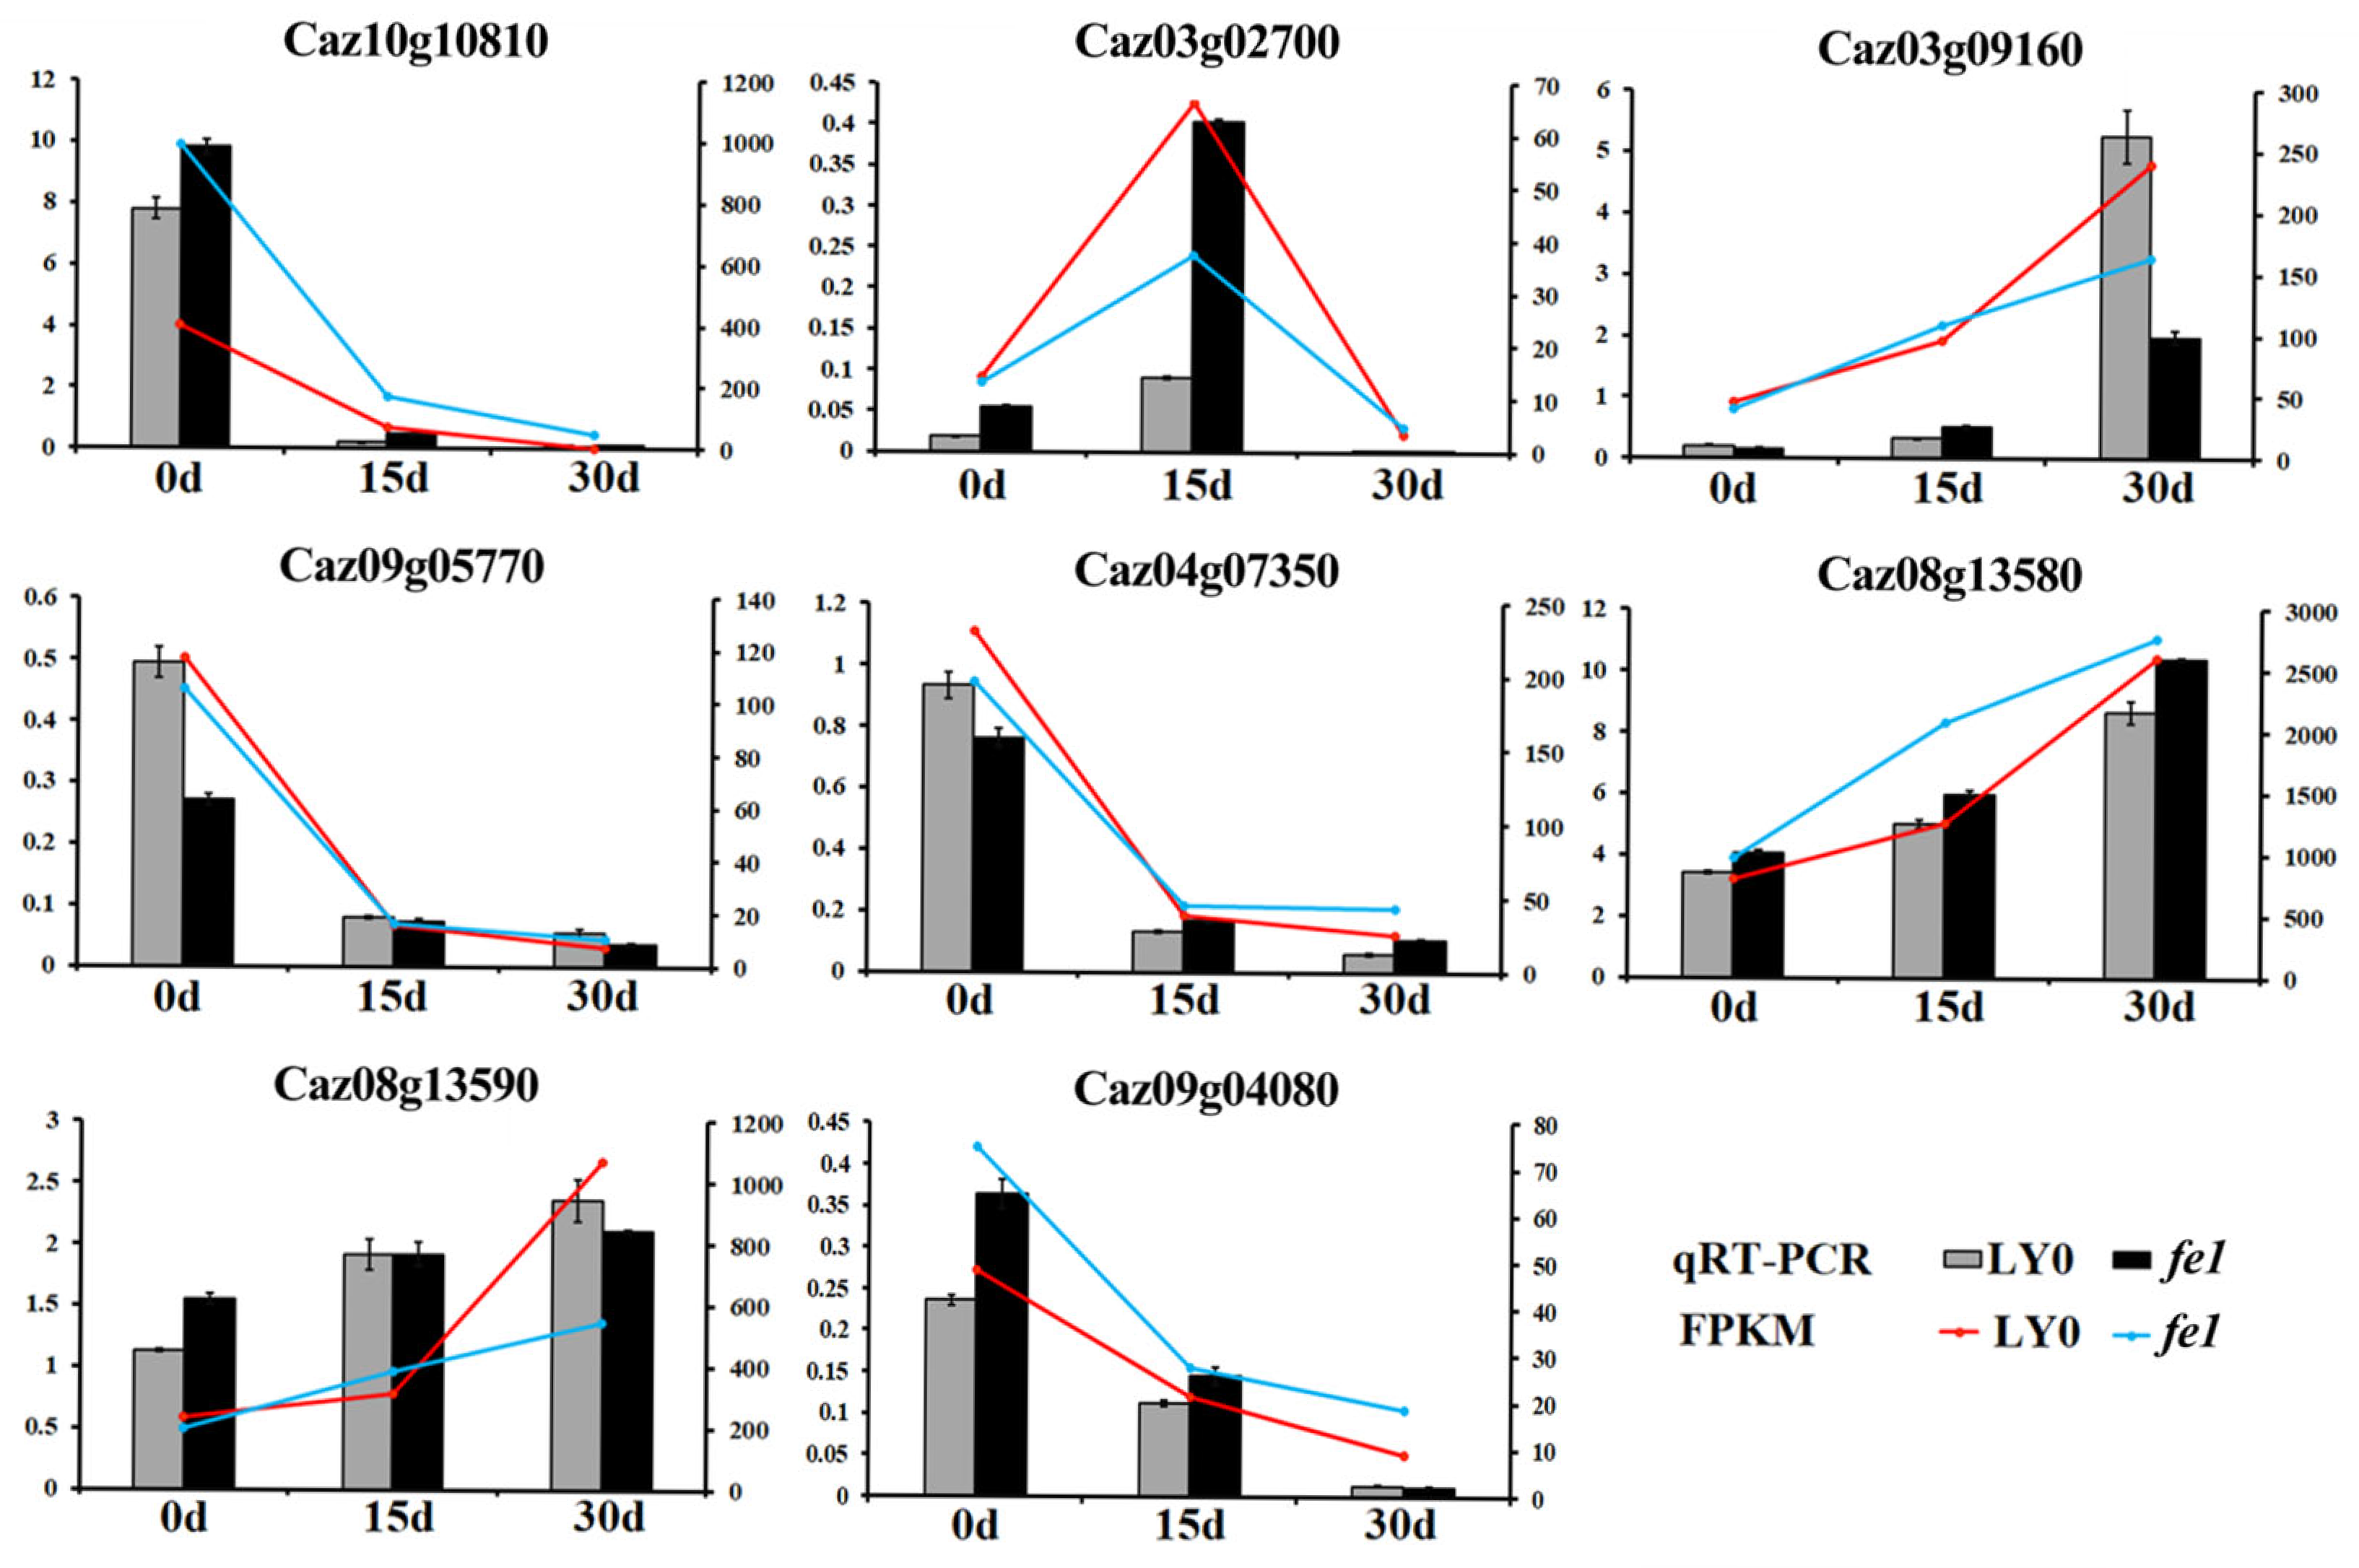
To verify the RNA-seq results obtained in this study, RT-qPCR analysis was performed on eight selected genes using gene-specific primers (Figure 7). The expression levels of these genes across three different developmental stages of fruit were assessed. The trends of FPKM values obtained from transcriptome sequencing were consistent with those observed through qRT-PCR, confirming the reliability of the obtained RNA-seq results.

4. Discussion

Pepper is one of the most widely cultivated vegetables and economically important crops worldwide. Among its key agronomic traits, fruit length plays a critical role in determining yield, quality, and marketability [11,20,21]. The formation and elongation of pepper fruits are governed by specific functional genes, with plant hormones and transcription factors recognized as major regulatory factors. In the present study, phenotypic analysis revealed a significant difference in fruit length between the long-fruit mutant fe1 and the wild-type LY0, particularly at 30 DAF. Paraffin-embedded sections further showed that the epidermal cells of fe1 fruits were smaller and more tightly packed, while mesocarp cells exhibited noticeable elongation.
Previous research has extensively demonstrated the involvement of plant hormones in regulating fruit shape, especially fruit length. In this study, KEGG pathway enrichment revealed a substantial number of DEGs enriched in the “plant hormone signal transduction” pathway. Among these, the auxin and GA signaling pathways have been repeatedly shown to exert strong influence over fruit development. Early auxin-responsive genes, including AUX/IAA, GH3, and SAUR, respond rapidly to auxin signals [22,23,24]. The AUX/IAA gene family modulates downstream auxin responses by regulating the activity of ARF proteins [25,26], and their functional roles often exhibit species-specific characteristics. For example, in tomato, downregulation of SlIAA9 results in simple leaf formation and parthenocarpy [27], while SlIAA3 downregulation impairs apical dominance and reduces auxin sensitivity [28]. Silencing of SlIAA15 affects trichome development, enhances lateral root formation, and reduces fruit set [29]. Although functional redundancy among AUX/IAA genes has been reported in Arabidopsis [30], accumulating evidence from Solanaceae species suggests that silencing of individual AUX/IAA genes can produce distinct and specific phenotypes. Moreover, domesticated pepper varieties have exploited alterations in auxin pathway genes to enhance fruit size [31]. In the current study, AUX/IAA genes, such as Aux22 (Caz03g02700), IAA9 (Caz06g16250), and IAA16 (Caz08g10540), were significantly downregulated in the long-fruit mutant fe1 during the critical 15–30-day fruit elongation window. Together with previous findings, this suggests that these genes may exhibit both functional redundancy and distinct regulatory roles in pepper, influenced by species-specific differences, developmental expression patterns, and other context-dependent factors. In addition, GA signal transduction genes are deeply involved in the regulation of fruit shape [32,33,34]. Tanksley [35] reported that fruit morphology in tomato—including elongated and round shapes—is influenced by multiple QTLs, including those involving GA-related genes, such as fs8.1. Silencing of SlDELLA in tomato has been shown to markedly increase fruit length compared to the wild type [36]. In pepper, the CaOvate gene has been identified as a regulator of fruit shape, acting through modulation of CaGA20ox1 expression [37]. In our study, the GAI1-like gene (Caz03g00670), which encodes a DELLA protein functioning as a negative regulator of GA signaling, exhibited lower expression in fe1 than in LY0 at 30 days. This suggests a potential release from GA pathway suppression in the mutant. Meanwhile, the positive regulators SCL21 (Caz07g22210) and SCL13 (Caz12g26660) were significantly upregulated in fe1, implying that both activation and repression of GA signaling may contribute to enhanced fruit elongation.
Transcription factors are known to integrate hormonal signals and orchestrate gene regulatory networks during plant development, including fruit growth [38,39,40]. In this study, analysis of TF-related DEGs revealed that the MYB and AP2/ERF families were particularly abundant. Previous studies in Arabidopsis have demonstrated that MYB44 recruits histone deacetylase HDA19 to suppress Expansin expression, resulting in cell wall stiffening and reduced elongation [41]. In the current analysis, co-expression network data indicated a significant negative correlation between MYB44-like (Caz04g04550) and Expansin-A10 (Caz02g29940). Notably, MYB44-like was significantly downregulated in fe1 at 0 days, while Expansin-A10 was upregulated, suggesting that reduced MYB44-like expression may relieve the suppression of Expansin genes, promoting cell wall loosening and elongation. Zhang et al. [42] showed that multiple ERF genes are upregulated during sponge gourd fruit expansion, activating GA20ox transcription via GCC-box/DRE promoter elements. Similarly, the SlymiR159–SlGAMYB2 regulatory axis has been reported to modulate fruit size in tomato through GA biosynthesis. Inhibition of SlymiR159 using a short tandem target mimic (STTM) leads to upregulation of SlGAMYB2 and the production of larger fruits [43]. In our study, WGCNA and co-expression network analysis identified strong positive correlations between ERF4-like (Caz09g07350) and SCL21 (Caz07g22210), as well as between ERF3-like (Caz10g00810), MYB48 (Caz11g07190), and SCL13 (Caz12g26660). These genes displayed their highest expression levels at 30 days, the stage at which the phenotypic difference in fruit length between fe1 and LY0 was most apparent.
Considering both the expression patterns of these transcription factors and the cellular morphology observed via paraffin sectioning, it is plausible that specific cell cycle regulators contribute to fruit elongation. In tomato, high expression of XTH15, a gene involved in cell wall remodeling, promotes the longitudinal alignment of cell wall microfibrils, facilitating elongation along the fruit’s longitudinal axis [44]. XTH genes are regulated by ERF transcription factors in both tomato and persimmon, suggesting a conserved mechanism in fruit expansion [45,46]. In this study, XTH15-like (Caz07g19100) was strongly co-expressed with MYB48, ERF3-like, and SCL13, supporting their involvement in regulating fruit elongation. These findings support a model in which transcription factors upregulate GA-responsive genes, which in turn trigger changes in the cell wall’s longitudinal architecture, promoting directional growth. This also explains why only the fruit’s length, and not the width, was significantly altered in the mutant, as observed during phenotypic analysis. Furthermore, the expression levels of XTH15-like, MYB48, ERF3-like, and SCL13 peaked at 30 days in fe1, consistent with the observed morphological changes. Collectively, these results suggest that these genes act in coordination to regulate pepper fruit elongation. In conclusion, while inferring the potential functions of pepper homologs based on the well-characterized roles of genes in model plants, such as tomato and Arabidopsis, provides valuable insights, evolutionary divergence among species and pepper’s unique developmental and environmental adaptation traits may lead to functional diversification. Therefore, further experimental validation of candidate genes is essential to clarify their primary functions.

5. Conclusions

In this study, phenotypic characterization and transcriptomic analysis were conducted on two Capsicum annuum lines: the long-fruit mutant fe1 and the wild-type LY0. A total of 41,194 genes were identified through RNA-seq, of which 13,512 were differentially expressed. Functional enrichment analysis highlighted the plant hormone signal transduction pathway as a key regulatory mechanism. Notably, most AUX/IAA family genes were downregulated during the rapid fruit elongation phase. The GA signaling component SCL13 (Caz12g26660) was highly expressed in fe1 at 30 DAF, correlating with the observed phenotypic differences. WGCNA analysis revealed a strong positive correlation between SCL13 and the transcription factors MYB48 (Caz11g07190) and ERF3-like (Caz10g00810), as well as with the cell wall remodeling gene XTH15-like (Caz07g19100). These findings suggest that SCL13 may participate in the regulation of fruit length by interacting with or being regulated by MYB and AP2/ERF transcription factors, ultimately modulating the structural properties of the fruit cell wall. The integration of hormone signaling, transcriptional regulation, and cell wall remodeling presented in this study provides valuable insight into the molecular mechanisms governing pepper fruit elongation and offers candidate target genes for breeding programs focused on improving fruit morphology traits.

Supplementary Materials

The following supporting information can be downloaded at https://www.mdpi.com/article/10.3390/horticulturae11091025/s1, Table S1: Primers used for RT-qPCR in this study, Table S2: All genes identified in the samples, Table S3: Differentially expressed genes in each of the different comparison groups, Table S4: Transcription factors identified in this study, Table S5: Auxin and Gibberellin signaling pathway related genes identified in this study.

Author Contributions

Conceptualization, J.Z. and P.L.; methodology, J.Z.; software, P.L.; validation, J.D., F.H. and J.H.; formal analysis, J.D., F.H. and J.H.; investigation, J.Z. and P.L.; resources, J.Z. and P.L.; data curation, J.Z. and P.L.; writing—original draft preparation, J.Z. and P.L.; writing—review and editing, S.Y., Z.L. and L.O.; supervision, X.Z., S.Y., Z.L. and L.O.; project administration, X.Z., S.Y., Z.L. and L.O.; funding acquisition, X.Z., S.Y., Z.L. and L.O. All authors have read and agreed to the published version of the manuscript.

Funding

This research was funded by the Hunan Provincial Natural Science Foundation (2025JJ40022), the Natural Science Foundation of Changsha (kq2506023), the Postgraduate Scientific Research Innovation Project of Hunan Province (CX20240641, CX20230702), and the Outstanding Youth Project of the Hunan Provincial Department of Education (23B0185).

Data Availability Statement

Data available upon request from the authors. The data that support the findings of this study are available from the corresponding author upon reasonable request. Transcriptome data has been uploaded to the public database and can be found in https://www.ncbi.nlm.nih.gov/sra/PRJNA1283568 (This data has been accessible since 29-June-2026). Found in, login number PRJNA1283568. Physiological data are included in the article.

Conflicts of Interest

The authors declare no conflicts of interest.

Abbreviations

The following abbreviations are used in this manuscript:
EMSEthyl methylsulfone
DAFDNA amplification fingerprinting
RNA-SeqRNA sequencing
WGCNAWeighted gene co-expression network analysis
GOGene Ontology
KEGGKyoto Encyclopedia of Genes and Genomes

References

  1. Haralayya, B.; Asha, I.S. Molecular Marker Application in Capsicum spp: A Supplement to Conventional Plant Breeding. Int. J. Curr. Microbiol. App. Sci. 2017, 6, 3840–3855. [Google Scholar] [CrossRef]
  2. Zou, Z.; Zou, X. Geographical and Ecological Differences in Pepper Cultivation and Consumption in China. Front. Nutr. 2021, 8, 718517. [Google Scholar] [CrossRef] [PubMed]
  3. Rao, G.U.; Ben Chaim, A.; Borovsky, Y.; Paran, I. Mapping of yield-related QTLs in pepper in an interspecific cross of Capsicum annuum and C. frutescens. Theor. Appl. Genet. 2003, 106, 1457–1466. [Google Scholar] [CrossRef]
  4. Yu, T.; Ai, G.; Xie, Q.; Wang, W.; Song, J.; Wang, J.; Tao, J.; Zhang, X.; Hong, Z.; Lu, Y.; et al. Regulation of tomato fruit elongation by transcription factor BZR1.7 through promotion of SUN gene expression. Hortic. Res. 2022, 9, uhac121. [Google Scholar] [CrossRef]
  5. Ali, Q. Morphological and agronomic characterization of tomato under field conditions. Pure Appl. Biol. 2017, 6, 1021–1029. [Google Scholar] [CrossRef]
  6. Tswanya, M.; Kyuka, C. Correlation Analysis on Growth and Yield Parameters of Tomato Varieties as Influenced by Pinching, Mineral Fertilizers and Mulching in Three Seasons. J. Biol. Agric. Healthc. 2023, 13, 6. [Google Scholar]
  7. Che, G.; Pan, Y.; Liu, X.; Li, M.; Zhao, J.; Yan, S.; He, Y.; Wang, Z.; Cheng, Z.; Song, W.; et al. Natural variation in CRABS CLAW contributes to fruit length divergence in cucumber. Plant Cell 2023, 35, 738–755. [Google Scholar] [CrossRef]
  8. Wu, S.; Zhang, B.; Keyhaninejad, N.; Rodríguez, G.R.; Kim, H.J.; Chakrabarti, M.; Illa-Berenguer, E.; Taitano, N.K.; Gonzalo, M.J.; Díaz, A.; et al. A common genetic mechanism underlies morphological diversity in fruits and other plant organs. Nat. Commun. 2018, 9, 4734. [Google Scholar] [CrossRef]
  9. Xin, T.; Zhang, Z.; Li, S.; Zhang, S.; Li, Q.; Zhang, Z.-H.; Huang, S.; Yang, X. Genetic Regulation of Ethylene Dosage for Cucumber Fruit Elongation. Plant Cell 2019, 31, 1063–1076. [Google Scholar] [CrossRef]
  10. Chaim, A.B.; Paran, I.; Grube, R.C.; Jahn, M.; van Wijk, R.; Peleman, J. QTL mapping of fruit-related traits in pepper (Capsicum annuum). Theor. Appl. Genet. 2001, 102, 1016–1028. [Google Scholar] [CrossRef]
  11. Han, K.; Jeong, H.-J.; Yang, H.-B.; Kang, S.-M.; Kwon, J.-K.; Kim, S.; Choi, D.; Kang, B.-C. An ultra-high-density bin map facilitates high-throughput QTL mapping of horticultural traits in pepper (Capsicum annuum). DNA Res. 2016, 23, 81–91. [Google Scholar] [CrossRef] [PubMed]
  12. Lee, H.-Y.; Ro, N.-Y.; Patil, A.; Lee, J.-H.; Kwon, J.-K.; Kang, B.-C. Uncovering Candidate Genes Controlling Major Fruit-Related Traits in Pepper via Genotype-by-Sequencing Based QTL Mapping and Genome-Wide Association Study. Front. Plant Sci. 2020, 11, 1100. [Google Scholar] [CrossRef] [PubMed]
  13. Arjun, K.; Dhaliwal, M.S.; Jindal, S.K.; Fakrudin, B. Mapping of fruit length related QTLs in interspecific cross (Capsicum annuum L. × Capsicum galapagoense Hunz.) of chilli. Breed. Sci. 2018, 68, 219–226. [Google Scholar] [CrossRef] [PubMed]
  14. Ma, X.; Qiao, Y.-M.; Li, Y.; Yu, Y.-N.; Gong, Z.-H. Identification of Fruit Traits Related QTLs and a Candidate Gene, CaBRX, Controlling Locule Number in Pepper (Capsicum annuum L.). Horticulturae 2022, 8, 146. [Google Scholar] [CrossRef]
  15. Borovsky, Y.; Paran, I. Characterization of fs10.1, a major QTL controlling fruit elongation in Capsicum. Theor. Appl. Genet. 2011, 123, 657–665. [Google Scholar] [CrossRef]
  16. Mao, L.; Shen, Y.; Cui, Q.; Huang, Y.; Zhang, X.; Lv, J.; Xing, W.; Zhang, D.; Fang, N.; Chen, D.; et al. The IQ67-domain protein IQD1 regulates fruit shape through complex multiprotein interactions in pepper (Capsicum annuum L.). Plant Biotechnol. J. 2025, 23, 2651–2666. [Google Scholar] [CrossRef]
  17. Quan, G.; Xia, P.; Lian, S.; Wu, Y.; Zhu, G. Zinc uptake system ZnuACB is essential for maintaining pathogenic phenotype of F4ac+ enterotoxigenic E. coli (ETEC) under a zinc restricted environment. Vet. Res. 2020, 51, 127. [Google Scholar] [CrossRef]
  18. Shen, Y.; Mao, L.; Zhou, Y.; Sun, Y.; Lv, J.; Deng, M.; Liu, Z.; Yang, B. Transcriptome Analysis Reveals Key Genes Involved in Trichome Formation in Pepper (Capsicum annuum L.). Plants 2024, 13, 1090. [Google Scholar] [CrossRef]
  19. Zhang, F.; Ding, Y.; Zhang, B.; He, M.; Wang, Z.; Lu, C.; Kang, Y. Analysis of Methylome, Transcriptome, and Lipid Metabolites to Understand the Molecular Abnormalities in Polycystic Ovary Syndrome. Diabetes Metab. Syndr. Obes. 2023, 16, 2745–2763. [Google Scholar] [CrossRef]
  20. Amit, K.; Ahad, I.; Kumar, V.; Thakur, S. Genetic variability and correlation studies for growth and yield characters in chilli (Capsicum annuum L.). J. Spices Aromat. Crops 2014, 23, 170–177. [Google Scholar]
  21. Patel, D.; Patel, B.; Patel, J.R.; Kuchhadiya, G.V. Genetic variability and character association studies for green fruit yield and quality component traits in chilli (capsicum annuum var. longum (dc.) sendt.). Electron. J. Plant Breed. 2015, 6, 472–478. [Google Scholar]
  22. Tiwari, S.B.; Hagen, G.; Guilfoyle, T. The Roles of Auxin Response Factor Domains in Auxin-Responsive Transcription. Plant Cell 2003, 15, 533–543. [Google Scholar] [CrossRef]
  23. Abel, S.; Theologis, A. Early Genes and Auxin Action. Plant Physiol. 1996, 111, 9–17. [Google Scholar] [CrossRef] [PubMed]
  24. Woodward, A.W.; Bartel, B. Auxin: Regulation, Action, and Interaction. Ann. Bot. 2005, 95, 707–735. [Google Scholar] [CrossRef] [PubMed]
  25. Yu, Z.; Zhang, F.; Friml, J.; Ding, Z. Auxin signaling: Research advances over the past 30 years. J. Integr. Plant Biol. 2022, 64, 371–392. [Google Scholar] [CrossRef]
  26. Piya, S.; Shrestha, S.K.; Binder, B.; Stewart, C.N.; Hewezi, T. Protein-protein interaction and gene co-expression maps of ARFs and Aux/IAAs in Arabidopsis. Front. Plant Sci. 2014, 5, 744. [Google Scholar] [CrossRef] [PubMed]
  27. Wang, H.; Jones, B.; Li, Z.; Frasse, P.; Delalande, C.; Regad, F.; Chaabouni, S.; Latché, A.; Pech, J.-C.; Bouzayen, M. The tomato Aux/IAA transcription factor IAA9 is involved in fruit development and leaf morphogenesis. Plant Cell 2005, 17, 2676–2692. [Google Scholar] [CrossRef]
  28. Chaabouni, S.; Jones, B.; Delalande, C.; Wang, H.; Li, Z.; Mila, I.; Frasse, P.; Latché, A.; Pech, J.-C.; Bouzayen, M. Sl-IAA3, a tomato Aux/IAA at the crossroads of auxin and ethylene signalling involved in differential growth. J. Exp. Bot. 2009, 60, 1349–1362. [Google Scholar] [CrossRef]
  29. Deng, W.; Yan, F.; Liu, M.; Wang, X.; Li, Z. Down-regulation of SlIAA15 in tomato altered stem xylem development and production of volatile compounds in leaf exudates. Plant Signal Behav. 2012, 7, 911–913. [Google Scholar] [CrossRef]
  30. Overvoorde, P.J.; Okushima, Y.; Alonso, J.M.; Chan, A.; Chang, C.; Ecker, J.R.; Hughes, B.; Liu, A.; Onodera, C.; Quach, H.; et al. Functional genomic analysis of the AUXIN/INDOLE-3-ACETIC ACID gene family members in Arabidopsis thaliana. Plant Cell 2005, 17, 3282–3300. [Google Scholar] [CrossRef]
  31. Razo-Mendivil, F.G.; Hernandez-Godínez, F.; Hayano-Kanashiro, C.; Martínez, O. Transcriptomic analysis of a wild and a cultivated varieties of Capsicum annuum over fruit development and ripening. PLoS ONE 2021, 16, e0256319. [Google Scholar] [CrossRef] [PubMed]
  32. Hussain, Q.; Shi, J.; Scheben, A.; Zhan, J.; Wang, X.; Liu, G.; Yan, G.; King, G.J.; Edwards, D.; Wang, H. Genetic and signalling pathways of dry fruit size: Targets for genome editing-based crop improvement. Plant Biotechnol. J. 2020, 18, 1124–1140. [Google Scholar] [CrossRef] [PubMed]
  33. Xue, Z.; Yang, R.; Wang, Y.; Ma, Y.; Lin, Y.; Li, Z.; Song, Y.; Feng, X.; Li, L. Candidate gene mining of GA-mediated regulation of pear fruit shape. Hortic. Environ. Biotechnol. 2024, 65, 403–412. [Google Scholar] [CrossRef]
  34. de Jong, M.; Wolters-Arts, M.; Feron, R.; Mariani, C.; Vriezen, W.H. The Solanum lycopersicum auxin response factor 7 (SlARF7) regulates auxin signaling during tomato fruit set and development. Plant J. 2009, 57, 160–170. [Google Scholar] [CrossRef]
  35. Tanksley, S.D. The genetic, developmental, and molecular bases of fruit size and shape variation in tomato. Plant Cell 2004, 16 (Suppl. S1), S181–S189. [Google Scholar] [CrossRef]
  36. Martí, C.; Orzáez, D.; Ellul, P.; Moreno, V.; Carbonell, J.; Granell, A. Silencing of DELLA induces facultative parthenocarpy in tomato fruits. Plant J. 2007, 52, 865–876. [Google Scholar] [CrossRef]
  37. Tsaballa, A.; Pasentsis, K.; Darzentas, N.; Tsaftaris, A.S. Multiple evidence for the role of an Ovate-like gene in determining fruit shape in pepper. BMC Plant Biol. 2011, 11, 46. [Google Scholar] [CrossRef]
  38. Arce-Rodríguez, M.L.; Ochoa-Alejo, N. An R2R3-MYB Transcription Factor Regulates Capsaicinoid Biosynthesis. Plant Physiol. 2017, 174, 1359–1370. [Google Scholar] [CrossRef]
  39. Lu, R.; Zhang, J.; Wu, Y.-W.; Wang, Y.; Zhang, J.; Zheng, Y.; Li, Y.; Li, X.-B. bHLH transcription factors LP1 and LP2 regulate longitudinal cell elongation. Plant Physiol. 2021, 187, 2577–2591. [Google Scholar] [CrossRef]
  40. Liu, R.; Song, J.; Liu, S.; Chen, C.; Zhang, S.; Wang, J.; Xiao, Y.; Cao, B.; Lei, J.; Zhu, Z. Genome-wide identification of the Capsicum bHLH transcription factor family: Discovery of a candidate regulator involved in the regulation of species-specific bioactive metabolites. BMC Plant Biol. 2021, 21, 262. [Google Scholar] [CrossRef]
  41. Wang, F.; Yang, F.; Zhu, D.; Saniboere, B.; Zhou, B.; Peng, D. MYB44 plays key roles in regulating plant responses to abiotic and biotic stress, metabolism, and development. J. Plant Biochem. Biotechnol. 2024, 33, 462–473. [Google Scholar] [CrossRef]
  42. Zhang, H.; Tan, J.; Zhang, M.; Huang, S.; Chen, X. Comparative Transcriptomic Analysis of Two Bottle Gourd Accessions Differing in Fruit Size. Genes 2020, 11, 359. [Google Scholar] [CrossRef]
  43. Zhao, P.; Wang, F.; Deng, Y.; Zhong, F.; Tian, P.; Lin, D.; Deng, J.; Zhang, Y.; Huang, T. Sly-miR159 regulates fruit morphology by modulating GA biosynthesis in tomato. Plant Biotechnol. J. 2022, 20, 833–845. [Google Scholar] [CrossRef]
  44. Wu, S.; Xiao, H.; Cabrera, A.; Meulia, T.; van der Knaap, E. SUN Regulates Vegetative and Reproductive Organ Shape by Changing Cell Division Patterns. Plant Physiol. 2011, 157, 1175–1186. [Google Scholar] [CrossRef]
  45. Muñoz-Bertomeu, J.; Miedes, E.; Lorences, E.P. Expression of xyloglucan endotransglucosylase/hydrolase (XTH) genes and XET activity in ethylene treated apple and tomato fruits. J. Plant Physiol. 2013, 170, 1194–1201. [Google Scholar] [CrossRef]
  46. Han, Y.; Zhu, Q.; Zhang, Z.; Meng, K.; Hou, Y.; Ban, Q.; Suo, J.; Rao, J. Analysis of Xyloglucan Endotransglycosylase/Hydrolase (XTH) Genes and Diverse Roles of Isoenzymes during Persimmon Fruit Development and Postharvest Softening. PLoS ONE 2015, 10, e0123668. [Google Scholar] [CrossRef]
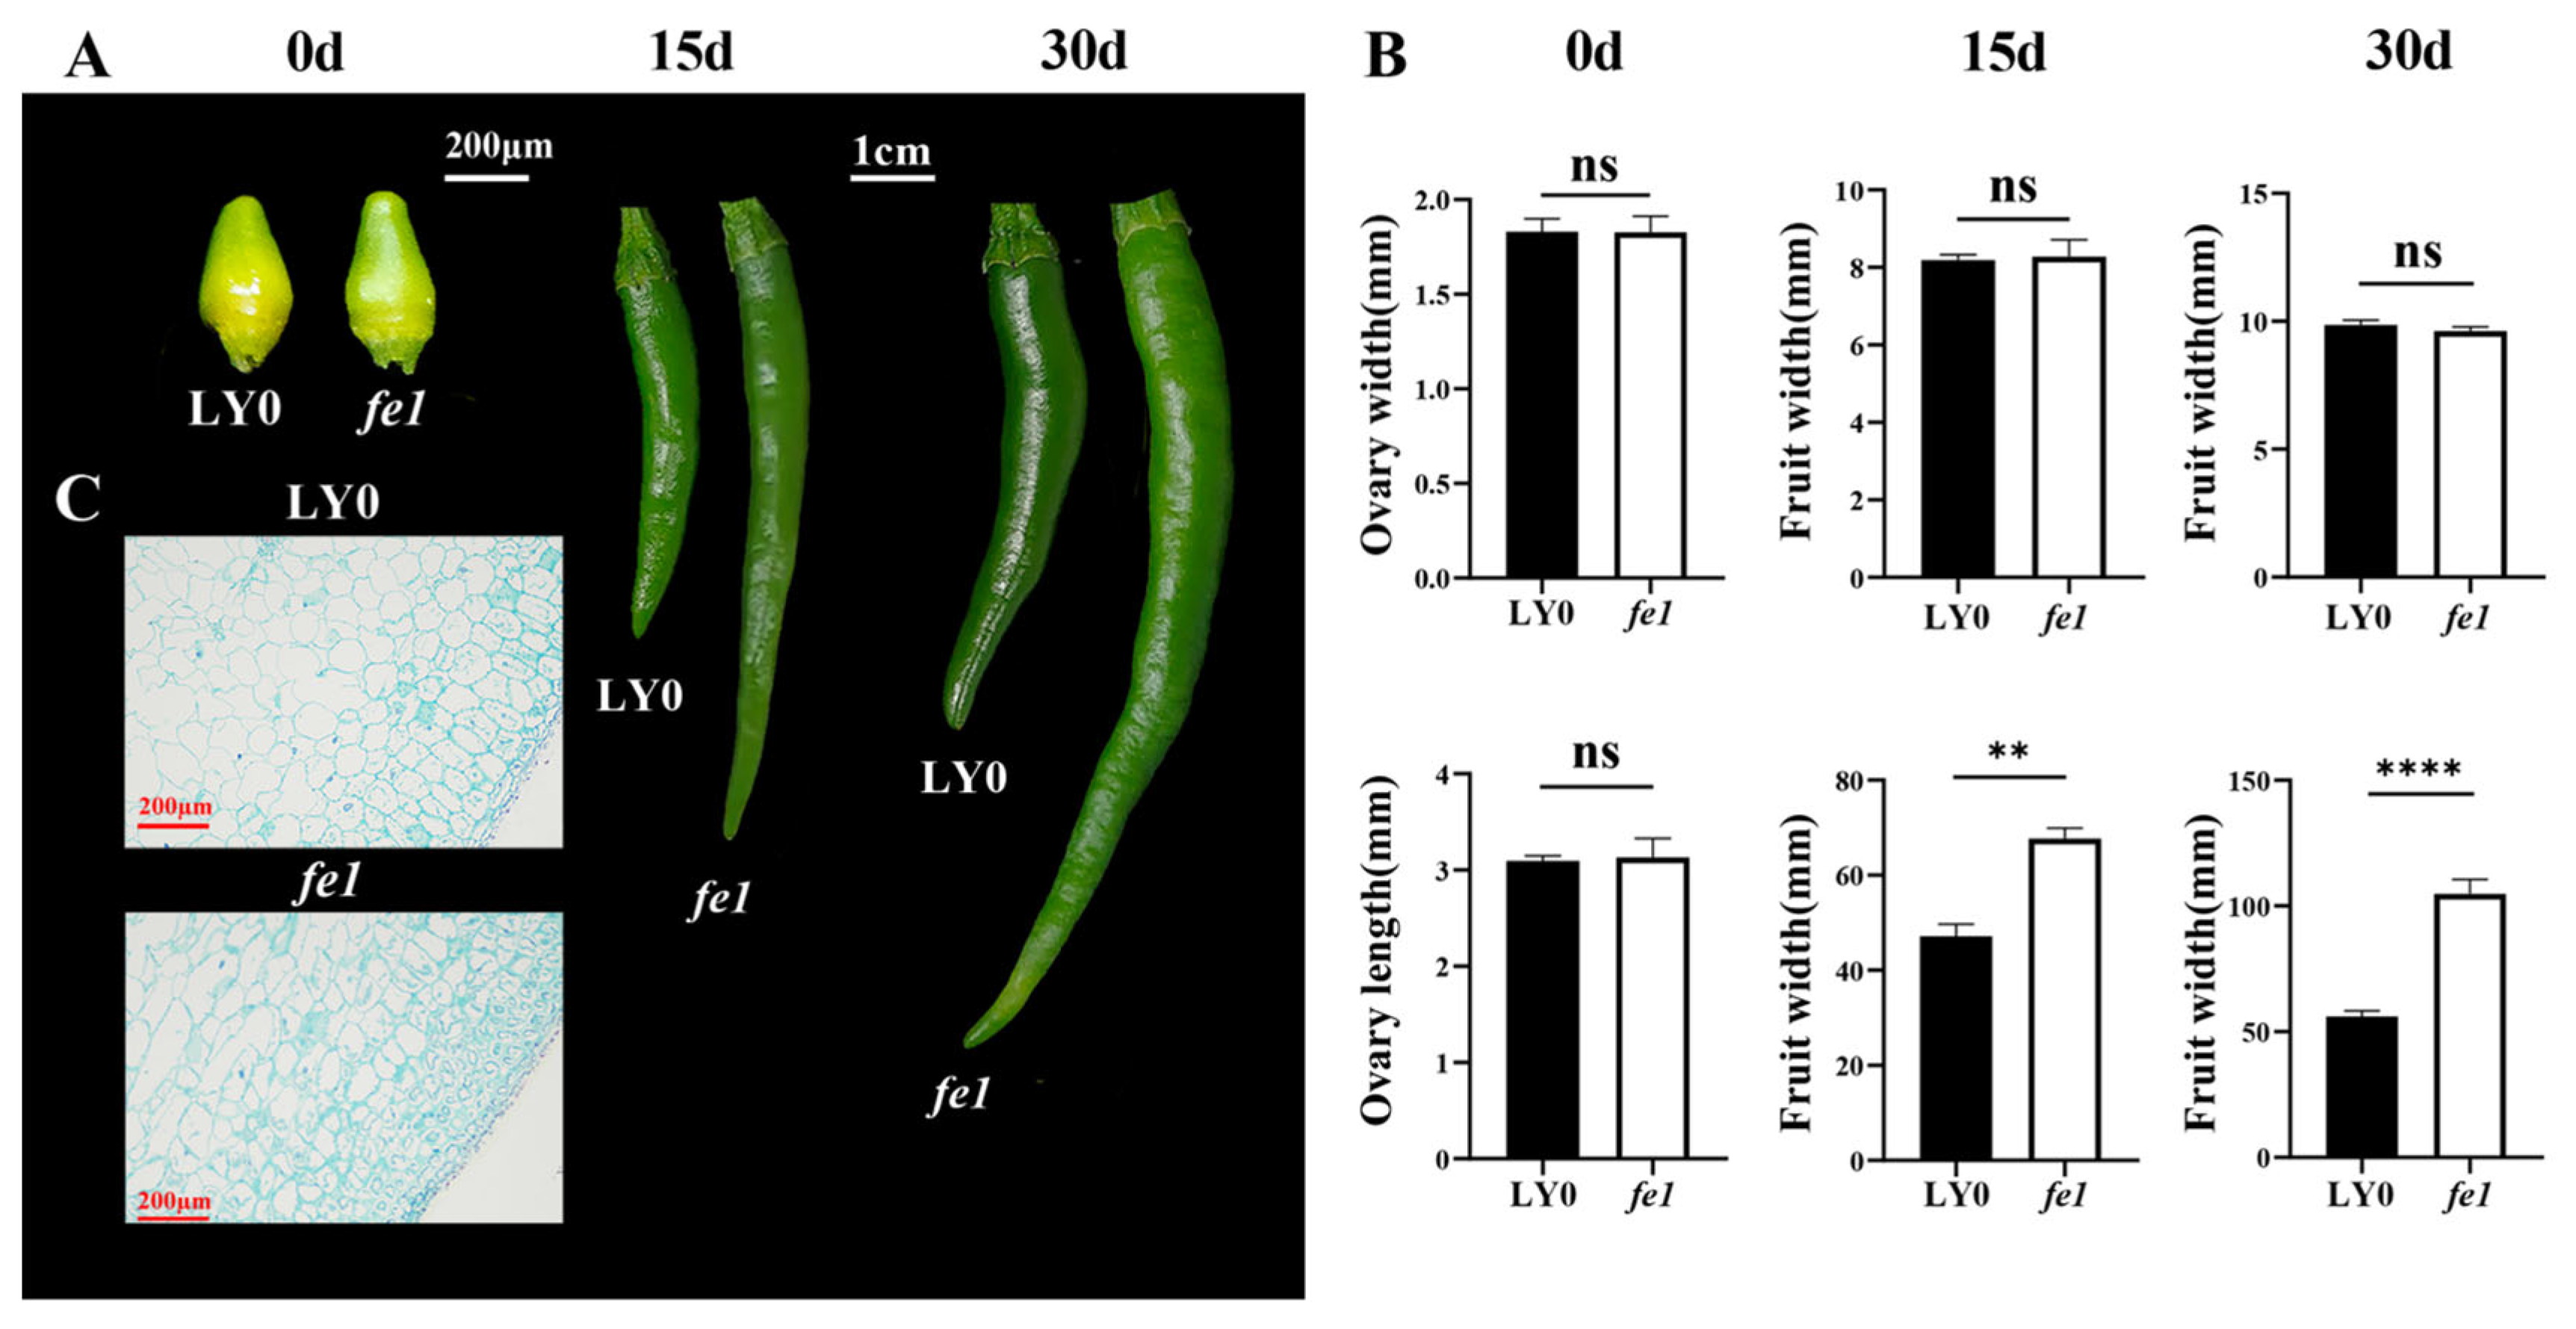
Figure 1. Fruit phenotypes and histological observations in LY0 and fe1. Note: (A) Representative fruit images from LY0 and fe1 at 0d, 15d, and 30d. (B) Quantitative measurements of fruit length and width. ns: not significant. All fruit parameters were measured from fruits harvested at 30 DAF from the same nodal position. All morphological traits were based on 18 biological replicates, and their statistical significance was assessed using a two-tailed Student’s t-test. ns: not significant; **: p < 0.01; ****: p < 0.0001. (C) Paraffin sections of 30-day fruits. Microscope images were taken at 100× magnification.
Horticulturae 11 01025 g001
Figure 2. Statistical analysis of genes identified in transcriptome profiling. Note: (A) Venn diagram of co-expressed and specific genes in LY0 and fe1. (B) Venn diagram of co-expressed and specifically expressed genes in LY0 across developmental stages. (C) Venn diagram of co-expressed and specifically expressed genes between LY0 and fe1 at the same stage. (D) Venn diagram of co-expressed and specifically expressed genes in fe1 across developmental stages. (E) DEG counts and direction of regulation across comparison groups.
Horticulturae 11 01025 g002
Figure 3. GO and KEGG enrichment heatmaps (log-scaled gene counts). Note: (A) GO classification annotation of DEGs in different comparison groups. (B) KEGG pathway classification of DEGs in the same groups. Sample abbreviations: S0, S15, and S30 represent LY0 fruit at 0, 15, and 30 days after flowering, respectively; L0, L15, and L30 represent fe1 fruit at the same time points.
Horticulturae 11 01025 g003
Figure 4. Analysis of transcription-factor-related DEGs (log-transformed FPKM values). Note: (A) Number of DEGs identified in each transcription factor family. (B) Heatmap showing the expression profiles of selected MYB and AP2/ERF family members across developmental stages.
Horticulturae 11 01025 g004
Figure 5. Differential expression of DEGs in auxin and GA signaling pathways (log-transformed FPKM values). Note: (A) Number of enriched DEGs across hormone signal transduction pathways. (B) Heatmap of DEGs related to auxin signaling. (C) Heatmap of DEGs related to GA signaling.
Horticulturae 11 01025 g005
Figure 6. Differential expression and WGCNA analysis of genes related to cell division and expansion (log-transformed FPKM values). Note: (A) Heatmap showing DEGs involved in cell division and cell expansion. (B) Correlation matrix between gene co-expression modules and key phenotypic traits (Numerical values extending to five or more decimal places are expressed in scientific notation for clarity). (C) Hierarchical clustering dendrogram of gene modules generated by WGCNA. (D) Gene co-expression network of fruit-length-associated DEGs. Yellow solid lines indicate positive correlations; blue-green solid lines indicate negative correlations.
Horticulturae 11 01025 g006
Figure 7. Validation and expression analysis of selected genes using qRT-qPCR (p ≤ 0.05).
Horticulturae 11 01025 g007
Disclaimer/Publisher’s Note: The statements, opinions and data contained in all publications are solely those of the individual author(s) and contributor(s) and not of MDPI and/or the editor(s). MDPI and/or the editor(s) disclaim responsibility for any injury to people or property resulting from any ideas, methods, instructions or products referred to in the content.