Optimizing Caraway Growth, Yield and Phytochemical Quality Under Drip Irrigation: Synergistic Effects of Organic Manure and Foliar Application with Vitamins B1 and E and Active Yeast
Abstract
1. Introduction
2. Materials and Methods
2.1. Experimental Design
2.2. Applied Treatments
2.3. Vegetative and Yield Measurements
2.4. Chemical Analysis
2.5. Statistical Analysis
3. Results
3.1. Vegetative Growth
3.2. Yield and Yield Components
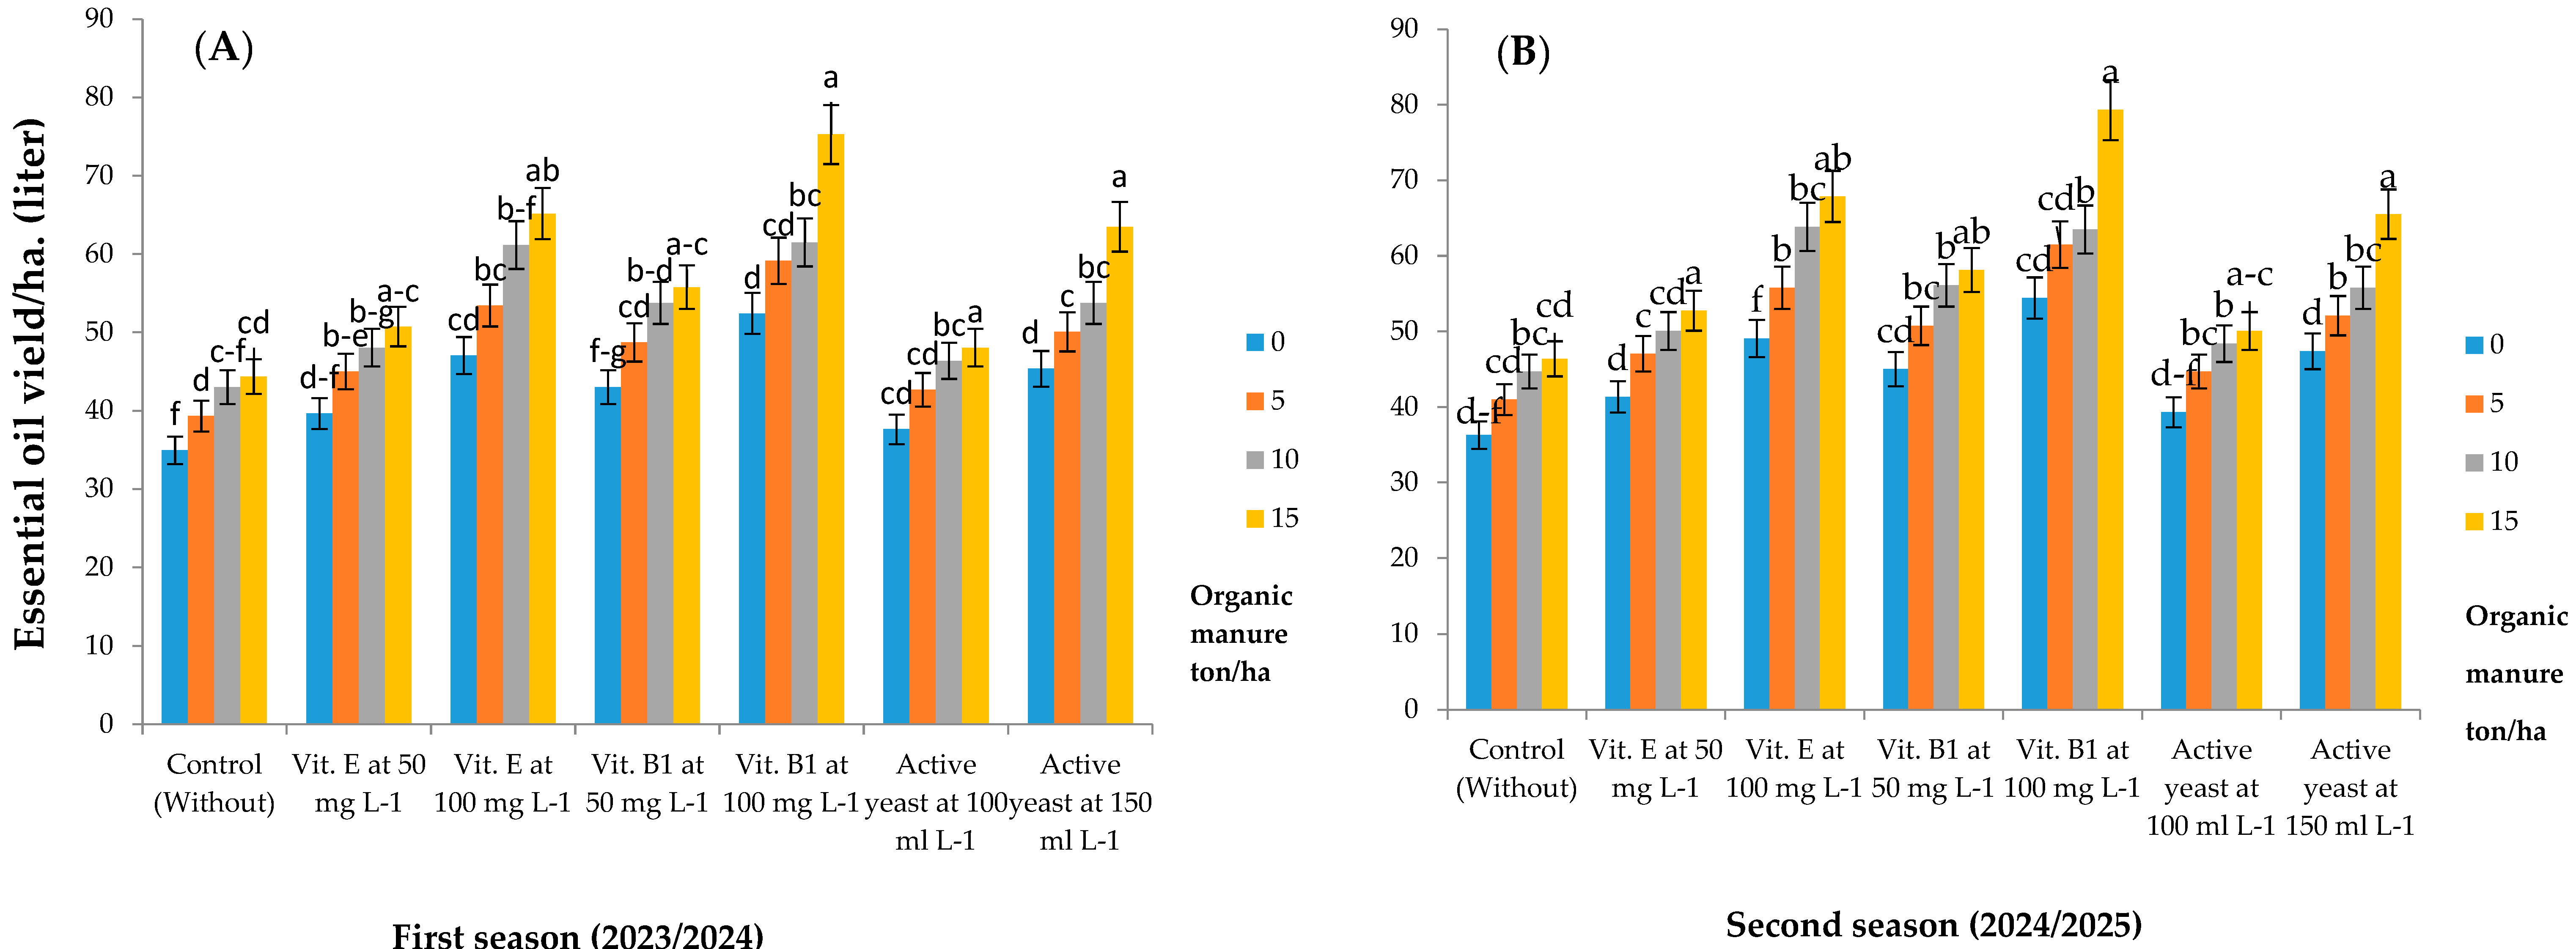
3.3. Essential Oil Productivity
3.4. Biochemical Constituents
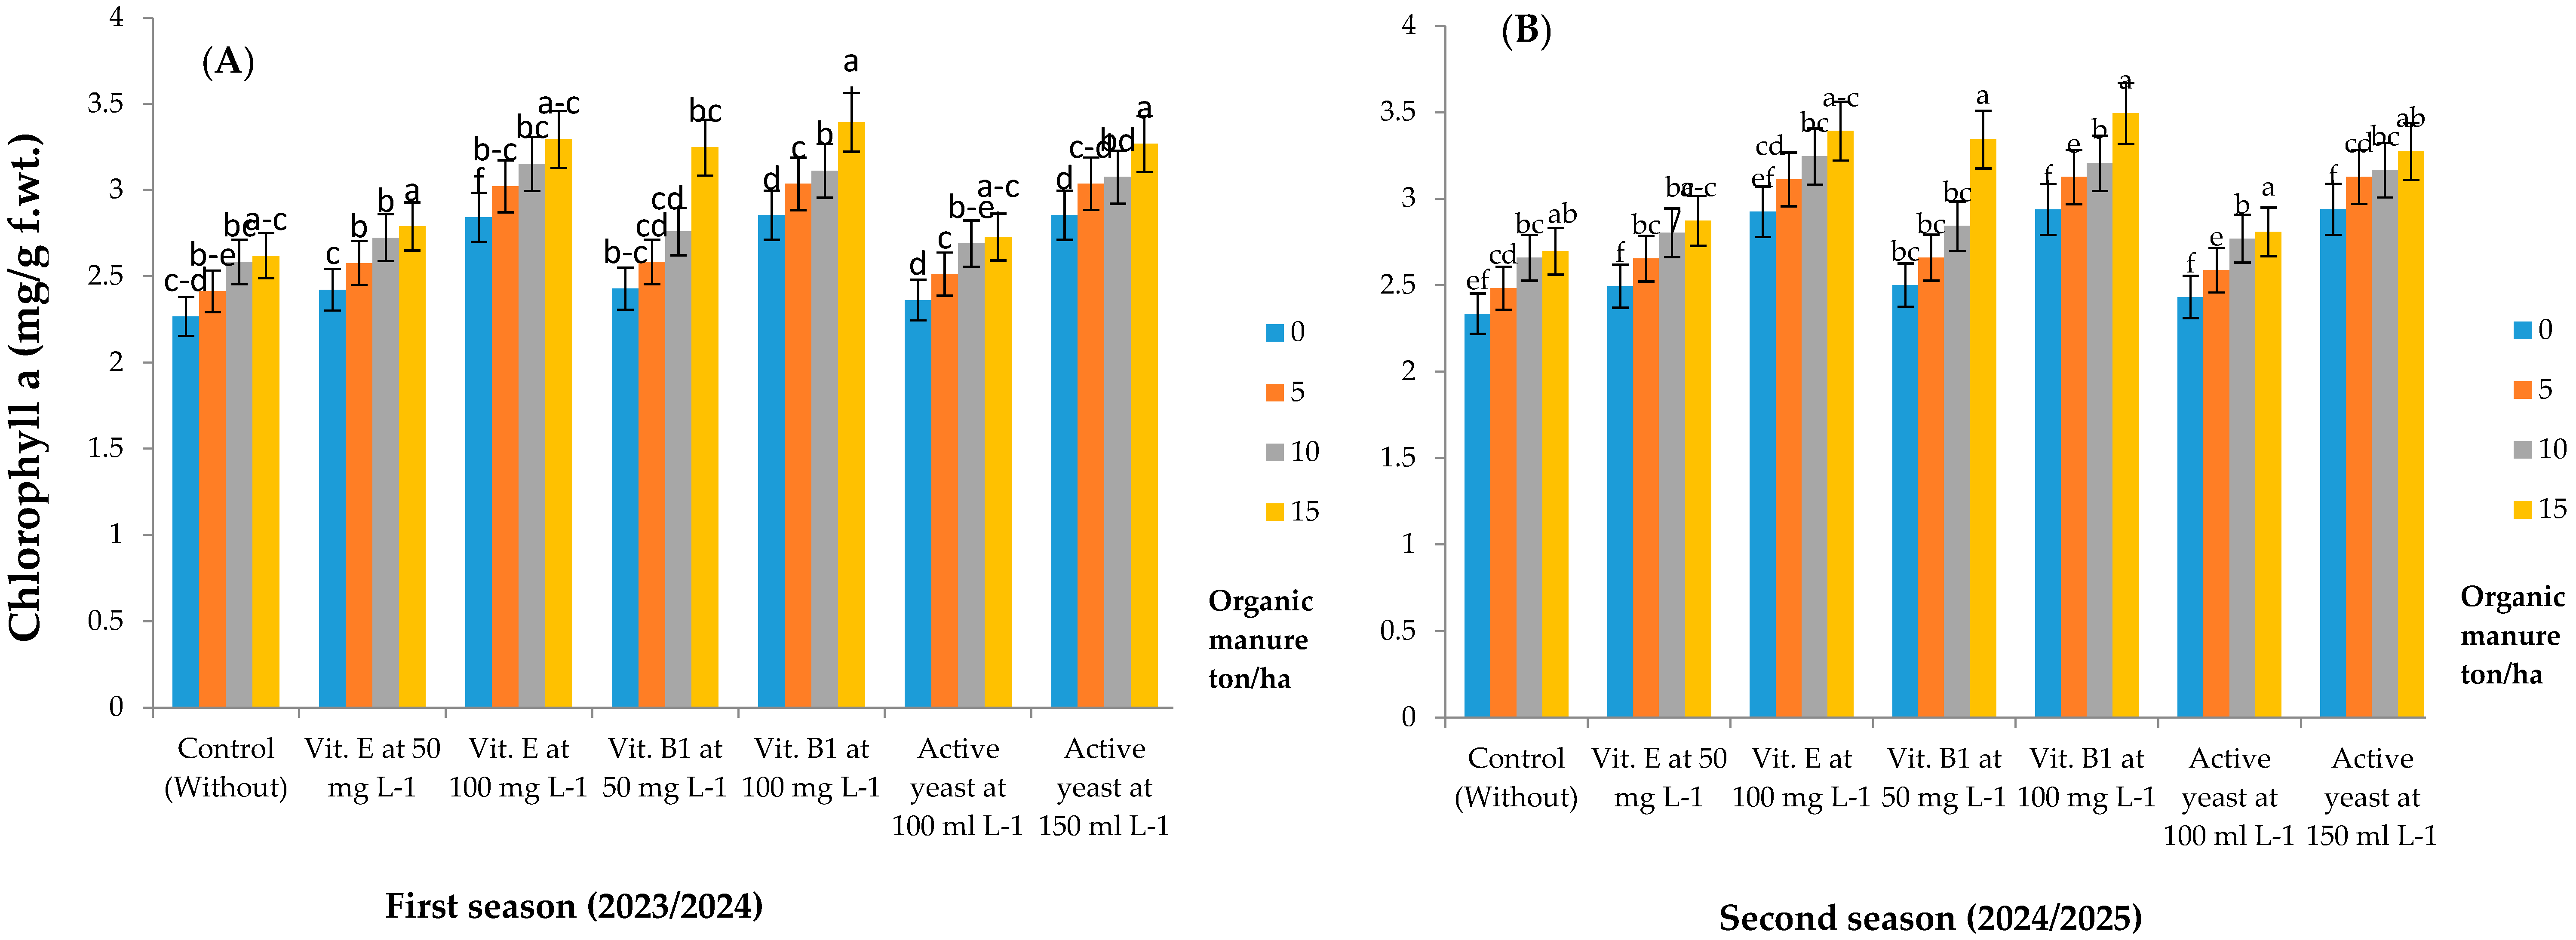
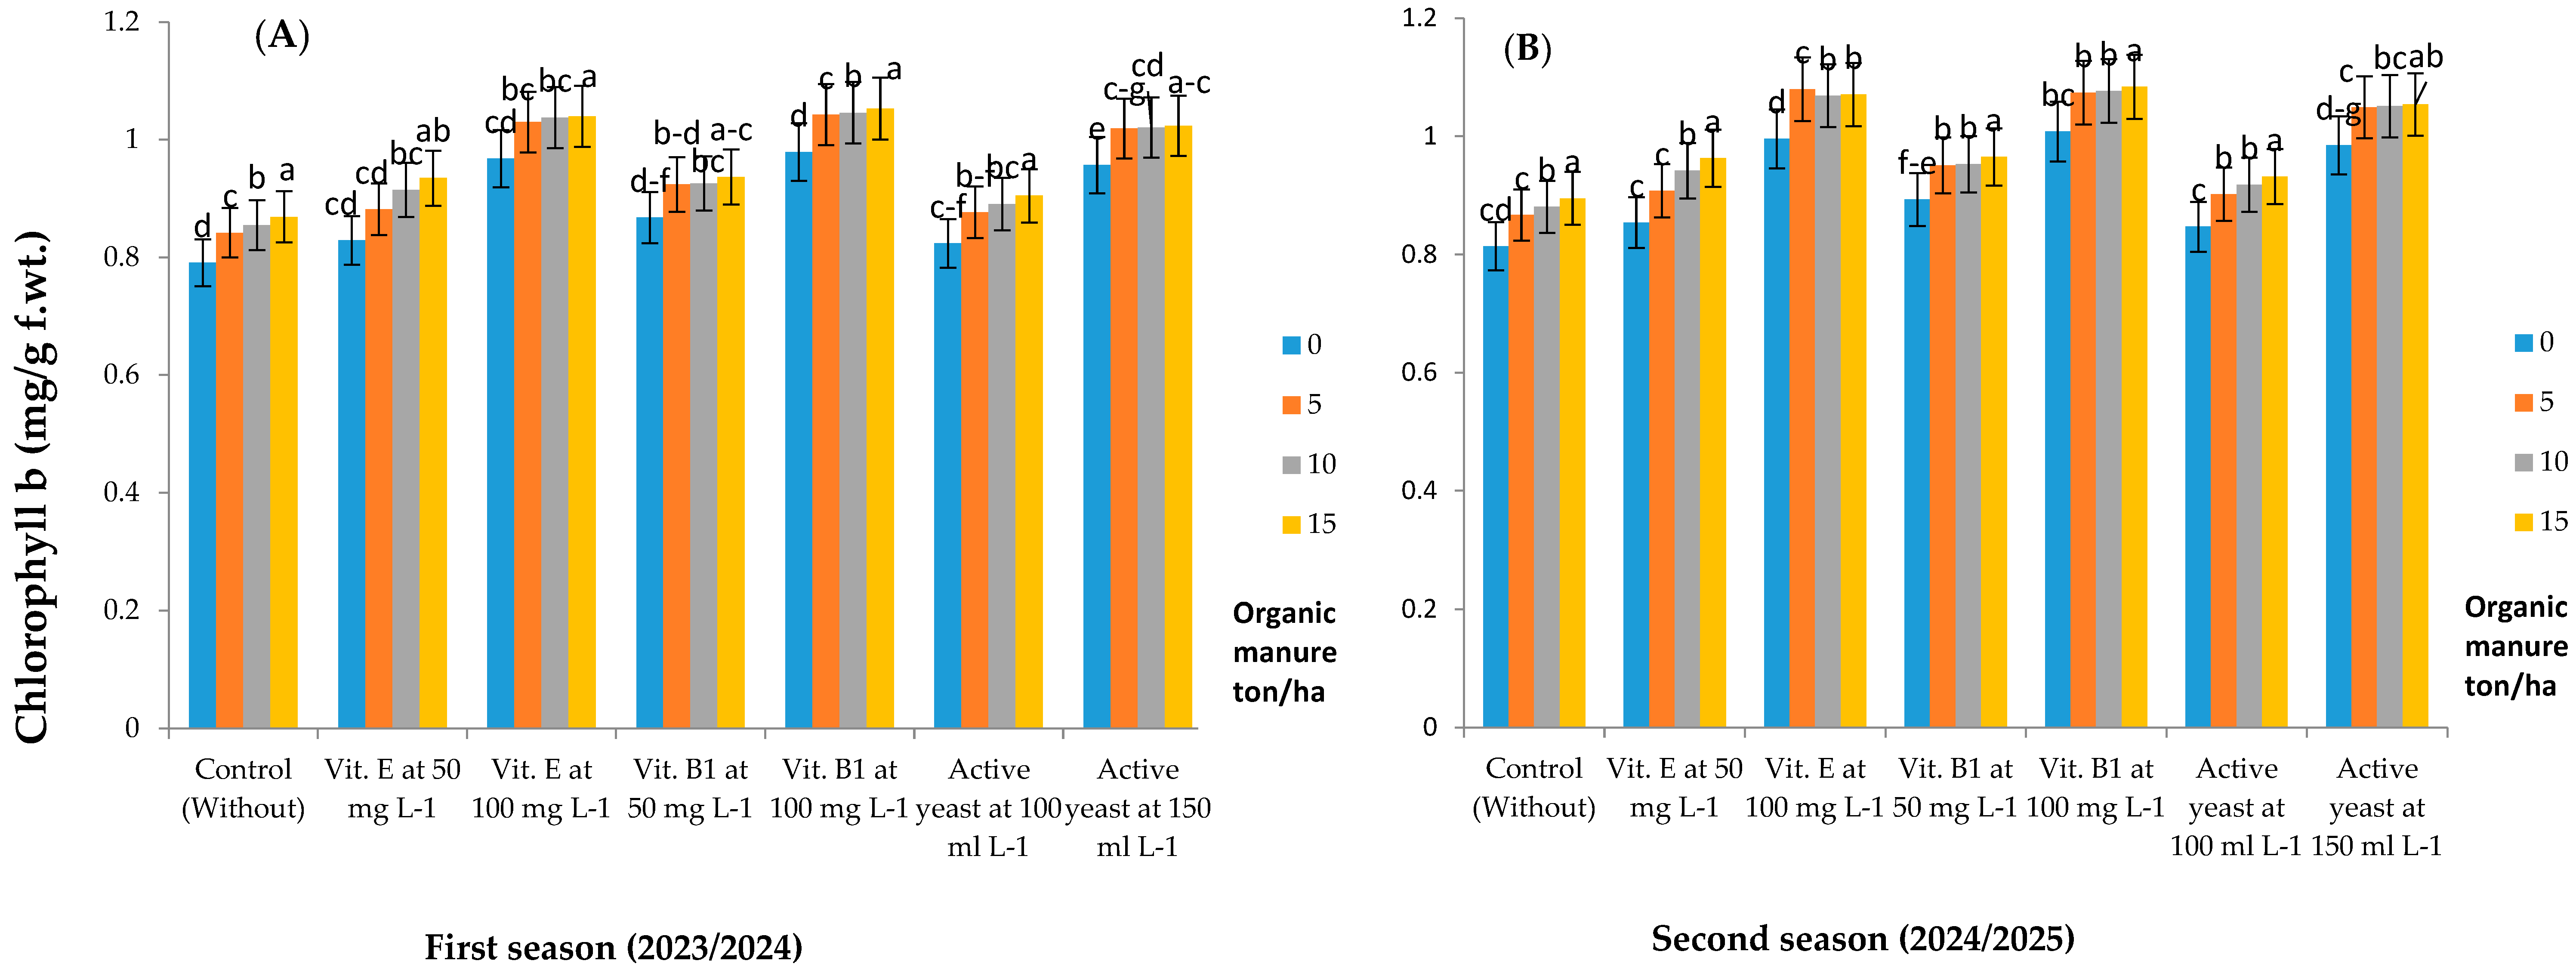
3.4.1. Photosynthetic Pigments
3.4.2. Nitrogen, Phosphorus and Potassium (%)
4. Discussion
4.1. Growth Parameters
4.2. Yield and Its Components
4.3. Chemical Composition
5. Conclusions
Author Contributions
Funding
Data Availability Statement
Acknowledgments
Conflicts of Interest
References
- Aćimović, M.G.; Oljača, S.I.; Tešević, V.V.; Todosijević, M.M.; Djisalov, J.N. Evaluation of Caraway Essential Oil from Different Production Areas of Serbia. Hortic. Sci. 2014, 41, 122–130. [Google Scholar] [CrossRef]
- Ibrahim, S.M.; El-labban, H.M.; Mohamed, F.I.; Naga, N.M. Effect of Organic Manures and Chemical Fertilizers on Foeniculum vulgare Mill. and Carum carvi L. Bull. Pharm. Sci. Assiut Univ. 2006, 29, 187–201. [Google Scholar]
- Hassan, E.A.; El-Gohary, A.E.; Radwan, E.M.A.; Nada, A.S. Response Caraway (Carum carvi L.) Plants to Humic Acid, Mycorrhizae Fungi and Azolla Extract. New Val. J. Agric. Sci. 2024, 4, 22–32. [Google Scholar]
- Basak, N.; Rai, A.K.; Barman, A.; Mandal, S.; Sundha, P.; Bedwal, S.; Kumar, S.; Yadav, R.K.; Sharma, P.C. Salt Affected Soils: Global Perspectives. In Soil Health and Environmental Sustainability: Application of Geospatial Technology; Springer: Cham, Switzerland, 2022; pp. 107–129. [Google Scholar]
- Omer, A.M.; Osman, M.S.; Ibrahim, S.M.; Badawy, A.A. Nanoparticle-Based Strategies for Enhancing Faba Bean (Vicia faba L.) Growth and Stress Tolerance in Saline Soils. Biocatal. Agric. Biotechnol. 2025, 67, 103630. [Google Scholar] [CrossRef]
- Zhang, R.; Meng, T.; Sun, Z.; Liu, Z. Effects of Applying Different Organic and Inorganic Soil Amendments to Improve the Late Stage of Reclaimed Soil from Abandoned Homesteads on Soil Nutrients and Maize Yield. Front. Sustain. Food Syst. 2025, 9, 1542710. [Google Scholar] [CrossRef]
- Badawy, A.A.; Alshammari, W.K.; Salem, N.F.G.; Alshammari, W.S.; Hussein, H.A. Arginine and Spermine Ameliorate Water Deficit Stress in Fenugreek (Trigonella foenum-graecum L.) by Enhancing Growth and Physio-Biochemical Processes. Antioxidants 2025, 14, 329. [Google Scholar] [CrossRef]
- Sarwar, G.; Ibrahim, M.; Tahir, M.A.; Iftikhar, Y.; Haider, M.S.; Noor-Us-Sabah, N.-U.-S.; Han, K.-H.; Ha, S.-K.; Zhang, Y.-S. Effect of Compost and Gypsum Application on the Chemical Properties and Fertility Status of Saline-Sodic Soil. Korean J. Soil Sci. Fertil. 2011, 44, 510–516. [Google Scholar] [CrossRef]
- Hashem, M.S.; Guo, W.; Qi, X.-B.; Li, P.; She, Y.; Cui, J.; Li, T. Effect of Using Reclaimed Water via Furrow and Subsurface Drip Systems under Alternate Partial Root-Zone Irrigation Mechanism on Crops Growth and Soil Properties. Irrig. Sci. 2024, 42, 919–936. [Google Scholar] [CrossRef]
- Farahat, M.M.; Ibrahim, M.M.S.; Taha, L.S.; El-Quesni, E.M.F. Response of Vegetative Growth and Some Chemical Constituents of Cupressus sempevirens L. to Foliar Application of Ascorbic Acid and Zinc at Nubaria. World J. Agric. Sci. 2007, 3, 496–502. [Google Scholar]
- El-Banna, H.; Fouda, K. Effect of Mineral, Organic, Biofertilizers and Humic Acid on Vegetative Growth and Fruit Yield Quality of Caraway Plants (Carum carvi L.). J. Soil Sci. Agric. Eng. 2018, 9, 237–241. [Google Scholar] [CrossRef]
- Khater, R.M.; Abd-Allah, W.H.; El Shafay, R. Effect of Organic Fertilization and Spraying Aloe vera Extract on the Growth and Productivity of Carum carvi L. Plant Under Shalateen Conditions in Egypt. Plant Arch. 2020, 20, 4959–4971. [Google Scholar]
- Sawsan, A.S.E.-Y.; Essam, G.S. Effect of Applied Organic Manure and Foliar Spray with Antioxidants on Growth, Yield and Chemical Constituents of Caraway Plant. Fayoum J. Agric. Res. Dev. 2008, 22, 42–59. [Google Scholar] [CrossRef]
- Zatimeh, A.A.; Al-Fraihat, A.H. Influence of Tryptophan and Glycine Acids on Growth and Productivity of Fennel under Different Organic Fertilizer Levels. Int. J. Hortic. Sci. Technol. 2025, 12, 207–218. [Google Scholar] [CrossRef]
- Hendawy, S.F.; Ezz El-Din, A.A. Growth and Yield of Foeniculum vulgare Var. Azoricum as Influenced by Some Vitamins and Amino Acids. Ozean J. Appl. Sci. 2010, 3, 113–123. [Google Scholar]
- Aly, M.; Ahmed, E.; Mohamed, M.; Kasem, M. Response of Anise Plants To Humic Acid, Amino Acids and Thiamine Treatments. Sci. J. Flowers Ornam. Plants 2022, 9, 153–165. [Google Scholar] [CrossRef]
- Tuna, A.L.; Kaya, C.; Altunlu, H.; Ashraf, M. Mitigation Effects of Non-Enzymatic Antioxidants in Maize (Zea mays L.) Plants under Salinity Stress. Aust. J. Crop Sci. 2013, 7, 1181–1188. [Google Scholar]
- Arrom, L.; Munné-Bosch, S. Tocopherol Composition in Flower Organs of Lilium and Its Variations during Natural and Artificial Senescence. Plant Sci. 2010, 179, 289–295. [Google Scholar] [CrossRef]
- Orabi, S.A.; Abdelhamid, M.T. Protective Role of α-Tocopherol on Two Vicia faba Cultivars against Seawater-Induced Lipid Peroxidation by Enhancing Capacity of Anti-Oxidative System. J. Saudi Soc. Agric. Sci. 2016, 15, 145–154. [Google Scholar] [CrossRef]
- Hammad, S.A.R.R.; Ali, O.A.M.M. Physiological and Biochemical Studies on Drought Tolerance of Wheat Plants by Application of Amino Acids and Yeast Extract. Ann. Agric. Sci. 2014, 59, 133–145. [Google Scholar] [CrossRef]
- El-Serafy, R. Growth and Productivity of Roselle (Hibiscus sabdariffa L.) As Affected By Yeast and Humic Acid. Sci. J. Flowers Ornam. Plants 2018, 5, 195–203. [Google Scholar] [CrossRef]
- Kowalska, J.; Krzymińska, J.; Tyburski, J. Yeasts as a Potential Biological Agent in Plant Disease Protection and Yield Improvement—A Short Review. Agric. 2022, 12, 1404. [Google Scholar] [CrossRef]
- Jackson, M.L. Soil Chemical Analysis: Advanced Course; UW-Madison Libraries Parallel Press: Madison, WI, USA, 2005. [Google Scholar]
- Yost, J.L.; Hartemink, A.E. Soil Organic Carbon in Sandy Soils: A Review. Adv. Agron. 2019, 158, 217–310. [Google Scholar]
- Black, C.A. Methods of Soil Analysis-Part 2; ASA Pub: Madison, WI, USA, 1965; pp. 771–1572. [Google Scholar]
- Egyptian Pharmacopoeia; General Organization for Governmental Printing Office. Ministry of Health, Egypt: Cairo, Egypt, 1984; pp. 31–33.
- Moran, R. Formulae for Determination of Chlorophyllous Pigments Extracted with N, N-Dimethylformamide. Plant Physiol. 1982, 69, 1376–1381. [Google Scholar] [CrossRef]
- Sparks, D.L.; Page, A.L.; Helmke, P.A.; Loeppert, R.H. Methods of Soil Analysis, Part 3: Chemical Methods; ACSESS: Madison, WI, USA, 2020. [Google Scholar]
- Ibrahim, E.M.; Badawy, A.A.; Ghanem, N.A.E. The Resilience of Ephedra alata Decne in Two Regions of Egypt: Soil Properties, Tissues Anatomy, and Physiological Responses. Egypt. J. Soil Sci. 2025, 65, 1331–1344. [Google Scholar] [CrossRef]
- Freed, R.; Eisensmith, S.P.; Everson, E.; Weber, M.; Paul, E.; Isleib, E. MSTAT-C: A Microcomputer Program for the Design, Management, and Analysis of Agronomic Research Experiments. East Lansing, MI, USA Michigan State Univ. 1991. [Google Scholar]
- Medani, R.A.; Taha, R.S. Improving Growth and Yield of Caraway (Carum carvi L.), Plants by Decapitation and/or Active Dry Yeast Application. Int. J. Curr. Microbiol. Appl. Sci. 2015, 4, 47–60. [Google Scholar]
- Ayyat, A.; Kenawy, A.G.M.; Aboel-Ainin, M.A.; Abdel-Mola, M.A.M. Improving Growth, Productivity and Oil Yield of Nigella sativa L. Plants by Foliar Spraying with Some Stimulants. J. Plant Prod. 2021, 12, 339–344. [Google Scholar] [CrossRef]
- Abdou, M.A.H.; Taha, R.A.; Abdel Gaber, A.F.M. Effect of Alpha Tocopherol and Moringa Leaf Extract on Volatile Oil and Certain Chemical Components of Marjoram Grown under Salinity Stress. Sci. J. Agric. Sci. 2024, 6, 73–87. [Google Scholar] [CrossRef]
- Elgohary, M.A.M.; Dawh, A.K.; Gendy, A.S.H.; Abdelkader, M.A.I. Response of Caraway (Carium carvi L.) Growth and Yield Components to NPKMg Fertilizer Rate and Antioxidants Type. Zagazig J. Agric. Res. 2020, 47, 883–894. [Google Scholar] [CrossRef]
- Eisa, E. Effect of Some Different Sourses of Organic Fertilizers and Seaweed Extract on Growth and Essential Oil of Sweet Fennel (Foeniculum vulgare Mill.) Plants. J. Plant Prod. 2016, 7, 575–584. [Google Scholar] [CrossRef]
- Lonhienne, T.; Mason, M.G.; Ragan, M.A.; Hugenholtz, P.; Schmidt, S.; Paungfoo-lonhienne, C. Yeast as a Biofertilizer Alters Plant Growth and Morphology. Crop Sci. 2014, 54, 785–790. [Google Scholar] [CrossRef]
- Zewail, R.M.Y.; Khedr, Z.M.A.; Ismael, F.H.M.; Abd Elhameed, E.F. Enhancement of Soya Bean (Glycine max L.) Plants Growth, Yield and Seed Quality by Using Putrescine, Benzyladenine and Yeast Extract. Ann. Agric. Sci. Moshtohor 2019, 57, 493–506. [Google Scholar] [CrossRef]
- Taiwo, L.B.; Adediran, J.A.; Sonubi, O.A. Yield and Quality of Tomato Grown with Organic and Synthetic Fertilizers. Int. J. Veg. Sci. 2007, 13, 5–19. [Google Scholar] [CrossRef]
- Aćimović, M.G. The Influence of Fertilization on Yield of Caraway, Anise and Coriander in Organic Agriculture. J. Agric. Sci. Belgrade 2013, 58, 85–94. [Google Scholar] [CrossRef]
- El-Tarawy, M.; Hegazi, M.; Mahmoud, E. Effect of Bio, Organic and Chemical Fertilization on Growth, Productivity and Oil Consituents of Caraway (Carum carvi L.). J. Plant Prod. 2017, 8, 993–997. [Google Scholar] [CrossRef]
- Awad, M. Poultry Manure and Humic Acid Foliar Applications Impact on Caraway Plants Grown on a Clay Loam. J. Soil Sci. Agric. Eng. 2016, 7, 1–10. [Google Scholar] [CrossRef][Green Version]
- Abdou, M.; El-Sayed, A.; Taha, R.; Ahmed, S.; El-Nady, M. Response of Cumin Plant To Some Organic, Biofertilization and Antioxidant Treatments Ii. Essential Oil Production and Chemical Constituents. Sci. J. Flowers Ornam. Plants 2019, 6, 89–97. [Google Scholar] [CrossRef]


| Soil Characteristics | 2023/2024 | 2024/2025 |
|---|---|---|
| Physical properties | ||
| Sand (%) | 91.22 | 90.50 |
| Silt (%) | 5.36 | 5.78 |
| Clay (%) | 3.42 | 3.72 |
| Soil type | sandy | Sandy |
| Available nutrients | ||
| Ca++ (mg L−1) | 133.0 | 138.0 |
| Mg++ (mg L−1) | 60.1 | 62.6 |
| Na+ (mg L−1) | 79.5 | 86.0 |
| K+ (mg L−1) | 15.7 | 21.3 |
| Cl− (mg L−1) | 10.5 | 11.3 |
| CO3−2 (mg L−1) | 12.4 | 13.3 |
| Chemical properties | ||
| pH | 8.16 | 8.20 |
| E.C. (dS/m) | 1.38 | 1.23 |
| Organic matter (%) | 0.17 | 0.14 |
| CaCO3 (%) | 13.94 | 13.99 |
| DTPA-extractable nutrients | ||
| Fe (mg L−1) | 0.85 | 0.94 |
| Cu (mg L−1) | 0.40 | 0.44 |
| Zn (mg L−1) | 0.31 | 0.34 |
| Mn (mg L−1) | 0.54 | 0.60 |
| 2023/2024 | 2024/2025 | |||||||||||||||||||||
|---|---|---|---|---|---|---|---|---|---|---|---|---|---|---|---|---|---|---|---|---|---|---|
| Months | Oct | Nov | Dec | Jan | Feb | Mar | Apr | May | Jun | Jul | Aug | Sep | Oct | Nov | Dec | Jan | Feb | Mar | Apr | May | Jun | Jul |
| Max. temp. (°C) | 30.24 | 26.0 | 21.4 | 20.3 | 22.1 | 25.6 | 30.6 | 34.7 | 36.8 | 39.0 | 36.9 | 35.4 | 29.12 | 25.0 | 20.1 | 20.4 | 22.1 | 25.6 | 30.6 | 33.5 | 36.8 | 39.0 |
| Mean temp. (°C) | 24.1 | 18.4 | 13.7 | 12.5 | 14.1 | 17.5 | 22.0 | 26.6 | 29.2 | 29.7 | 29.6 | 28.0 | 24.0 | 17.0 | 13.0 | 12.8 | 14.3 | 17.8 | 22.1 | 26.4 | 29.2 | 29.7 |
| Min. temp. (°C) | 17.4 | 11.8 | 7.1 | 5.5 | 6.6 | 9.6 | 13.5 | 18.1 | 21.0 | 22.2 | 22.4 | 20.9 | 17.1 | 12.0 | 7.0 | 5.4 | 6.5 | 10.0 | 13.8 | 18.3 | 21.0 | 22.2 |
| Low temp. (°C) | 10.0 | 3.0 | −0.8 | −3.4 | −0.3 | 1.0 | 4.5 | 9.0 | 14.3 | 16.0 | 16.2 | 13.5 | 10.0 | 3.2 | −0.9 | −3.4 | −0.3 | 1.0 | 3.5 | 7.0 | 14.3 | 16.0 |
| Aver. Preci. (mm) | 0 | 0.21 | 0.18 | 0.68 | 0.75 | 0.83 | 0.03 | 0.14 | 0 | 0 | 0 | 0 | 0 | 0.23 | 0.24 | 0.68 | 0.75 | 0.83 | 0.03 | 0.14 | 0 | 0 |
| Aver. precipitation days (≥1.0 mm) | 0 | 0.08 | 0.08 | 0.23 | 0.38 | 0.27 | 0 | 0.04 | 0 | 0 | 0 | 0 | 0 | 0.08 | 0.1 | 0.23 | 0.38 | 0.27 | 0 | 0.04 | 0 | 0 |
| Average relative humidity (%) | 55 | 61 | 67 | 43 | 37 | 40 | 46 | 51 | 53 | 55 | 42 | 42 | 55 | 54 | 62 | 66 | 42 | 39 | 43 | 53 | 53 | 55 |
| Manure Characteristics | Values | |
|---|---|---|
| 2023/2024 | 2024/2025 | |
| pH (1:1) | 7.43 | 7.39 |
| E.C. (dS/m) | 1.03 | 1.09 |
| O.M. (%) | 27.43 | 27.75 |
| O.C. (%) | 15.95 | 16.14 |
| C/N ratio | 19.69 | 18.55 |
| Humidity (%) | 8.04 | 7.93 |
| Total N (%) | 0.81 | 0.87 |
| Total P (%) | 0.24 | 0.29 |
| Total K (%) | 1.08 | 1.06 |
| Fe (mg kg−1) | 385 | 379 |
| Mn (mg kg−1) | 234 | 232 |
| Zn (mg kg−1) | 271 | 269 |
| Vitamins and Active Yeast Treatments (B) | Organic Manure (ton/ha) (A) | |||||||||||||
|---|---|---|---|---|---|---|---|---|---|---|---|---|---|---|
| 0.0 | 5.0 | 10 | 15 | Mean (B) | 0.0 | 5.0 | 10 | 15 | Mean (B) | |||||
| First Season (2023/2024) | Second Season (2024/2025) | |||||||||||||
| Plant Height (cm) | ||||||||||||||
| Control (Without) | 146.54 ± 4.90 | 155.90 ± 7.21 | 162.45 ± 8.14 | 174.41 ± 7.18 | 159.82 | 149.59 ± 6.88 | 159.06 ± 7.33 | 165.94 ± 8.28 | 178.01 ± 7.26 | 163.15 | ||||
| Vit. E at 50 mg L−1 | 157.98 ± 4.93 | 168.06 ± 5.24 | 172.12 ± 6.79 | 182.52 ± 6.55 | 170.17 | 161.36 ± 4.98 | 171.66 ± 5.31 | 175.72 ± 6.93 | 186.34 ± 6.59 | 173.77 | ||||
| Vit. E at 100 mg L−1 | 162.34 ± 5.38 | 172.74 ± 5.74 | 179.71 ± 7.22 | 183.77 ± 7.20 | 174.64 | 165.73 ± 5.47 | 176.35 ± 5.84 | 183.42 ± 7.37 | 187.59 ± 7.24 | 178.27 | ||||
| Vit. B1 at 50 mg L−1 | 158.39 ± 6.06 | 168.48 ± 6.49 | 172.74 ± 8.19 | 180.44 ± 8.25 | 170.01 | 161.98 ± 6.17 | 171.97 ± 6.57 | 176.45 ± 8.36 | 184.26 ± 8.30 | 173.66 | ||||
| Vit. B1 at 100 mg L−1 | 167.23 ± 7.34 | 177.94 ± 7.84 | 188.07 ± 9.51 | 198.08 ± 9.10 | 182.83 | 170.83 ± 7.50 | 181.65 ± 7.97 | 192.00 ± 9.73 | 202.02 ± 9.14 | 186.63 | ||||
| Active yeast at 100 mL L−1 | 152.57 ± 5.73 | 162.34 ± 6.48 | 169.21 ± 9.15 | 181.69 ± 9.01 | 166.45 | 155.84 ± 6.03 | 165.73 ± 6.03 | 172.70 ± 5.30 | 185.51 ± 9.01 | 169.94 | ||||
| Active yeast at 150 mL L−1 | 160.68 ± 5.55 | 171.50 ± 6.55 | 176.49 ± 5.26 | 183.04 ± 9.15 | 172.93 | 163.85 ± 5.55 | 174.26 ± 6.55 | 180.20 ± 5.26 | 186.96 ± 9.15 | 176.32 | ||||
| Mean (A) | 157.96 | 168.14 | 174.40 | 183.42 | 161.31 | 171.53 | 178.06 | 187.24 | ||||||
| L.S.D. at 5% | A: 5.95 | B: 4.11 | AB: 8.22 | A: 6.01 | B: 3.55 | AB: 7.10 | ||||||||
| Stem Diameter (cm) | ||||||||||||||
| Control (Without) | 2.170 ± 0.08 | 2.28 ± 0.09 | 2.38 ± 0.08 | 2.46 ± 0.07 | 2.32 | 2.21 ± 0.05 | 2.32 ± 0.09 | 2.44 ± 0.08 | 2.51 ± 0.08 | 2.37 | ||||
| Vit. E at 50 mg L−1 | 2.25 ± 0.07 | 2.39 ± 0.08 | 2.51 ± 0.06 | 2.58 ± 0.06 | 2.43 | 2.29 ± 0.07 | 2.45 ± 0.07 | 2.56 ± 0.06 | 2.63 ± 0.05 | 2.48 | ||||
| Vit. E at 100 mg L−1 | 2.31 ± 0.08 | 2.46 ± 0.08 | 2.54 ± 0.07 | 2.61 ± 0.07 | 2.48 | 2.36 ± 0.08 | 2.51 ± 0.08 | 2.59 ± 0.07 | 2.67 ± 0.05 | 2.53 | ||||
| Vit. B1 at 50 mg L−1 | 2.26 ± 0.09 | 2.41 ± 0.09 | 2.52 ± 0.08 | 2.60 ± 0.08 | 2.45 | 2.30 ± 0.09 | 2.47 ± 0.09 | 2.57 ± 0.08 | 2.65 ± 0.06 | 2.50 | ||||
| Vit. B1 at 100 mg L−1 | 2.43 ± 0.10 | 2.58 ± 0.11 | 2.66 ± 0.09 | 2.70 ± 0.09 | 2.59 | 2.36 ± 0.10 | 2.63 ± 0.10 | 2.72 ± 0.09 | 2.76 ± 0.08 | 2.62 | ||||
| Active yeast at 100 mL L−1 | 2.23 ± 0.04 | 2.37 ± 0.05 | 2.49 ± 0.03 | 2.56 ± 0.03 | 2.41 | 2.27 ± 0.04 | 2.43 ± 0.04 | 2.54 ± 0.03 | 2.61 ± 0.01 | 2.46 | ||||
| Active yeast at 150 mL L−1 | 2.28 ± 0.05 | 2.44 ± 0.06 | 2.53 ± 0.04 | 2.61 ± 0.04 | 2.46 | 2.32 ± 0.05 | 2.49 ± 0.05 | 2.58 ± 0.02 | 2.67 ± 0.01 | 2.52 | ||||
| Mean (A) | 2.27 | 2.42 | 2.52 | 2.59 | 2.30 | 2.47 | 2.57 | 2.64 | ||||||
| L.S.D. at 5% | A: 0.06 | B: 0.01 | AB: 0.02 | A: 0.05 | B: 0.01 | AB: 0.02 | ||||||||
| Vitamins and Active Yeast Treatments (B) | Organic Manure (ton/ha) (A) | |||||||||||||
|---|---|---|---|---|---|---|---|---|---|---|---|---|---|---|
| 0.0 | 5.0 | 10 | 15 | Mean (B) | 0.0 | 5.0 | 10 | 15 | Mean (B) | |||||
| First Season (2023/2024) | Second Season (2024/2025) | |||||||||||||
| Number of branches/plant | ||||||||||||||
| Control (Without) | 11.39 ± 0.72 | 12.11 ± 0.74 | 12.73 ± 0.59 | 13.14 ± 1.33 | 12.34 | 11.6 ± 0.75 | 12.33 ± 0.78 | 12.95 ± 0.62 | 13.36 ± 1.35 | 12.56 | ||||
| Vit. E at 50 mg L−1 | 12.11 ± 0.66 | 12.80 ± 0.68 | 13.35 ± 0.50 | 13.87 ± 1.34 | 13.04 | 12.33 ± 0.70 | 13.05 ± 0.72 | 13.68 ± 0.50 | 14.19 ± 1.34 | 13.31 | ||||
| Vit. E at 100 mg L−1 | 12.63 ± 0.72 | 13.46 ± 0.73 | 13.97 ± 0.52 | 14.39 ± 1.44 | 13.61 | 12.85 ± 0.76 | 13.78 ± 0.78 | 14.3 ± 0.53 | 14.71 ± 1.45 | 13.91 | ||||
| Vit. B1 at 50 mg L−1 | 12.21 ± 0.82 | 13.04 ± 0.83 | 13.46 ± 0.59 | 14.08 ± 1.65 | 13.20 | 12.43 ± 0.76 | 13.26 ± 0.88 | 13.78 ± 0.60 | 14.4 ± 1.66 | 13.47 | ||||
| Vit. B1 at 100 mg L−1 | 13.66 ± 0.99 | 14.42 ± 1.01 | 14.59 ± 0.69 | 17.25 ± 1.94 | 14.98 | 13.99 ± 1.05 | 14.75 ± 1.07 | 14.92 ± 0.69 | 17.58 ± 1.94 | 15.31 | ||||
| Active yeast at 100 mL L−1 | 11.9 ± 0.08 | 12.63 ± 0.72 | 13.25 ± 0.29 | 13.66 ± 1.32 | 12.86 | 12.12 ± 0.70 | 12.85 ± 0.75 | 13.57 ± 0.30 | 13.99 ± 1.32 | 13.13 | ||||
| Active yeast at 150 mL L−1 | 12.010.055 | 12.73 ± 0.75 | 13.66 ± 0.55 | 14.18 ± 1.55 | 13.15 | 12.22 ± 0.75 | 12.95 ± 72 | 13.99 ± 0.35 | 14.5 ± 1.42 | 13.42 | ||||
| Mean (A) | 12.27 | 13.03 | 13.57 | 14.37 | 12.51 | 13.28 | 13.88 | 14.68 | ||||||
| L.S.D. at 5% | A: 0.38 | B: 0.42 | AB: 0.84 | A: 0.41 | B: 0.52 | AB: 1.04 | ||||||||
| Herb dry weight/plant (g) | ||||||||||||||
| Control (Without) | 71.13 ± 8.43 | 75.63 ± 8.98 | 78.87 ± 8.35 | 81.48 ± 8.83 | 76.78 | 72.60 ± 8.58 | 77.10 ± 9.19 | 80.45 ± 8.52 | 83.16 ± 8.97 | 78.33 | ||||
| Vit. E at 50 mg L−1 | 76.04 ± 8.18 | 80.86 ± 8.72 | 83.78 ± 8.00 | 87.13 ± 8.49 | 81.95 | 77.52 ± 8.34 | 82.43 ± 8.92 | 85.47 ± 8.17 | 88.92 ± 8.63 | 83.58 | ||||
| Vit. E at 100 mg L−1 | 84.41 ± 8.65 | 89.85 ± 9.22 | 92.47 ± 8.37 | 94.35 ± 9.00 | 90.27 | 86.09 ± 8.81 | 91.64 ± 9.42 | 94.36 ± 8.54 | 96.24 ± 9.15 | 92.08 | ||||
| Vit. B1 at 50 mg L−1 | 78.55 ± 9.92 | 83.58 ± 10.56 | 86.50 ± 9.59 | 87.97 ± 10.38 | 84.15 | 80.13 ± 10.10 | 85.26 ± 10.80 | 88.19 ± 9.79 | 89.76 ± 10.65 | 85.83 | ||||
| Vit. B1 at 100 mg L−1 | 96.55 ± 11.81 | 102.72 ± 12.58 | 104.12 ± 11.34 | 108.32 ± 11.86 | 102.93 | 98.44 ± 12.02 | 104.82 ± 12.85 | 106.2 ± 11.56 | 110.42 ± 12.06 | 104.98 | ||||
| Active yeast at 100 mL L−1 | 74.06 ± 3.55 | 78.76 ± 3.78 | 82.11 ± 4.44 | 84.94 ± 9.01 | 79.97 | 75.53 ± 3.62 | 80.34 ± 3.85 | 83.79 ± 4.51 | 86.62 ± 9.01 | 81.57 | ||||
| Active yeast at 150 mL L−1 | 79.08 ± 9.82 | 84.10 ± 11.15 | 88.39 ± 10.22 | 93.20 ± 8.85 | 86.19 | 80.65 ± 10.25 | 85.78 ± 10.52 | 90.17 ± 10.24 | 95.09 ± 11.12 | 87.92 | ||||
| Mean (A) | 79.97 | 85.07 | 88.03 | 91.06 | 81.57 | 86.77 | 89.82 | 92.89 | ||||||
| L.S.D. at 5% | A: 2.71 | B: 1.10 | AB: 2.20 | A: 2.76 | B: 1.71 | AB: 3.42 | ||||||||
| Vitamins and Active Yeast Treatments (B) | Organic Manure (ton/ha) (A) | |||||||||||||
|---|---|---|---|---|---|---|---|---|---|---|---|---|---|---|
| 0.0 | 5.0 | 10 | 15 | Mean (B) | 0.0 | 5.0 | 10 | 15 | Mean (B) | |||||
| First Season (2023/2024) | Second Season (2024/2025) | |||||||||||||
| Number of umbels/plant | ||||||||||||||
| Control (Without) | 24.13 ± 2.94 | 25.67 ± 3.12 | 27.25 ± 2.92 | 27.35 ± 3.47 | 26.10 | 24.64 ± 3.00 | 26.22 ± 3.20 | 27.82 ± 2.99 | 30.04 ± 3.01 | 27.18 | ||||
| Vit. E at 50 mg L−1 | 25.81 ± 2.68 | 27.45 ± 2.85 | 29.01 ± 2.65 | 32.12 ± 2.59 | 28.60 | 26.35 ± 2.74 | 28.00 ± 2.93 | 29.62 ± 2.72 | 32.79 ± 2.64 | 29.19 | ||||
| Vit. E at 100 mg L−1 | 29.99 ± 2.64 | 31.91 ± 2.80 | 33.67 ± 2.62 | 35.74 ± 2.68 | 32.83 | 30.62 ± 2.69 | 32.58 ± 2.87 | 34.38 ± 2.69 | 36.49 ± 2.73 | 33.52 | ||||
| Vit. B1 at 50 mg L−1 | 27.65 ± 2.97 | 29.42 ± 3.15 | 30.25 ± 2.84 | 33.15 ± 2.99 | 30.12 | 28.23 ± 3.03 | 30.04 ± 3.23 | 30.88 ± 2.92 | 33.85 ± 3.05 | 30.75 | ||||
| Vit. B1 at 100 mg L−1 | 32.04 ± 3.54 | 34.08 ± 3.76 | 34.53 ± 3.28 | 37.67 ± 3.57 | 34.58 | 32.72 ± 3.61 | 34.83 ± 3.85 | 35.30 ± 3.37 | 38.45 ± 3.63 | 35.32 | ||||
| Active yeast at 100 mL L−1 | 25.13 ± 3.37 | 26.74 ± 3.59 | 28.39 ± 3.59 | 30.64 ± 3.45 | 27.73 | 25.66 ± 3.44 | 27.30 ± 3.66 | 28.98 ± 3.67 | 31.29 ± 2.56 | 28.31 | ||||
| Active yeast at 150 mL L−1 | 29.90 ± 2.42 | 31.81 ± 2.75 | 33.46 ± 2.45 | 35.22 ± 3.22 | 32.60 | 30.53 ± 2.58 | 32.47 ± 2.85 | 34.17 ± 2.55 | 35.96 ± 2.65 | 33.28 | ||||
| Mean (A) | 27.81 | 29.58 | 30.94 | 33.13 | 28.39 | 30.21 | 31.59 | 34.12 | ||||||
| L.S.D. at 5% | A: 1.18 | B: 1.24 | AB: 2.48 | A: 1.22 | B: 1.25 | AB: 2.50 | ||||||||
| Weight of 1000 seeds (g) | ||||||||||||||
| Control (Without) | 11.57 ± 0.67 | 12.39 ± 0.61 | 13.09 ± 0.51 | 13.49 ± 0.90 | 12.64 | 12.33 ± 0.70 | 13.19 ± 0.65 | 13.94 ± 0.53 | 14.37 ± 0.95 | 13.46 | ||||
| Vit. E at 50 mg L−1 | 12.49 ± 0.53 | 13.29 ± 0.45 | 13.69 ± 0.40 | 14.18 ± 0.85 | 13.41 | 13.30 ± 0.55 | 14.15 ± 0.49 | 14.58 ± 0.41 | 15.11 ± 0.89 | 14.29 | ||||
| Vit. E at 100 mg L−1 | 13.19 ± 0.56 | 14.00 ± 0.48 | 14.47 ± 0.41 | 14.67 ± 0.91 | 14.08 | 14.04 ± 0.59 | 14.90 ± 0.52 | 15.44 ± 0.42 | 15.65 ± 0.95 | 15.01 | ||||
| Vit. B1 at 50 mg L−1 | 12.59 ± 0.61 | 13.39 ± 50 | 13.79 ± 0.41 | 14.32 ± 1.04 | 13.52 | 13.40 ± 0.64 | 14.26 ± 0.54 | 14.68 ± 0.39 | 15.22 ± 1.10 | 14.39 | ||||
| Vit. B1 at 100 mg L−1 | 13.52 ± 0.73 | 14.01 ± 0.60 | 14.50 ± 0.46 | 16.38 ± 1.20 | 14.60 | 14.37 ± 0.77 | 14.98 ± 0.65 | 15.33 ± 0.45 | 17.41 ± 1.26 | 15.52 | ||||
| Active yeast at 100 mL L−1 | 12.08 ± 0.67 | 12.89 ± 0.66 | 13.59 ± 0.44 | 14.08 ± 0.82 | 13.16 | 12.86 ± 0.69 | 13.73 ± 0.67 | 14.47 ± 0.45 | 15.01 ± 1.05 | 14.02 | ||||
| Active yeast at 150 mL L−1 | 13.03 ± 0.52 | 13.82 ± 0.72 | 14.21 ± 0.35 | 14.61 ± 0.88 | 13.92 | 13.83 ± 0.72 | 14.68 ± 0.62 | 15.11 ± 0.42 | 15.54 ± 0.98 | 14.79 | ||||
| Mean (A) | 12.64 | 13.40 | 13.91 | 14.53 | 13.45 | 14.27 | 14.79 | 15.47 | ||||||
| L.S.D. at 5% | A: 0.41 | B: 0.89 | AB: 1.78 | A: 0.52 | B: 0.94 | AB: 1.88 | ||||||||
| Vitamins and Active Yeast Treatments (B) | Organic Manure (ton/ha) (A) | |||||||||||||
|---|---|---|---|---|---|---|---|---|---|---|---|---|---|---|
| 0.0 | 5.0 | 10 | 15 | Mean (B) | 0.0 | 5.0 | 10 | 15 | Mean (B) | |||||
| First Season (2023/2024) | Second Season (2024/2025) | |||||||||||||
| Nitrogen (%) | ||||||||||||||
| Control (Without) | 2.178 ± 0.24 | 2.317 ± 0.25 | 2.385 ± 0.25 | 2.428 ± 0.26 | 2.327 | 2.244 ± 0.24 | 2.388 ± 0.26 | 2.458 ± 0.26 | 2.502 ± 0.27 | 2.398 | ||||
| Vit. E at 50 mg L−1 | 2.299 ± 0.21 | 2.445 ± 0.23 | 2.514 ± 0.23 | 2.549 ± 0.24 | 2.452 | 2.369 ± 0.22 | 2.520 ± 0.23 | 2.591 ± 0.24 | 2.627 ± 0.25 | 2.527 | ||||
| Vit. E at 100 mg L−1 | 2.718 ± 0.20 | 2.892 ± 0.21 | 2.934 ± 0.22 | 3.016 ± 0.23 | 2.890 | 2.801 ± 0.21 | 2.980 ± 0.22 | 3.023 ± 0.23 | 3.108 ± 0.24 | 2.978 | ||||
| Vit. B1 at 50 mg L−1 | 2.530 ± 0.21 | 2.692 ± 0.23 | 2.714 ± 0.24 | 2.749 ± 0.24 | 2.671 | 2.607 ± 0.21 | 2.773 ± 0.23 | 2.797 ± 0.25 | 2.833 ± 0.25 | 2.753 | ||||
| Vit. B1 at 100 mg L−1 | 2.781 ± 0.26 | 2.959 ± 0.28 | 3.059 ± 0.29 | 3.108 ± 0.29 | 2.977 | 2.866 ± 0.22 | 3.049 ± 0.28 | 3.153 ± 0.30 | 3.203 ± 0.30 | 3.067 | ||||
| Active yeast at 100 mL L−1 | 2.269 ± 0.23 | 2.414 ± 0.25 | 2.484 ± 0.26 | 2.529 ± 0.29 | 2.424 | 2.338 ± 0.24 | 2.488 ± 0.26 | 2.560 ± 0.26 | 2.606 ± 0.30 | 2.498 | ||||
| Active yeast at 150 mL L−1 | 2.601 ± 0.21 | 2.768 ± 0.22 | 2.845 ± 0.26 | 2.889 ± 0.41 | 2.776 | 2.690 ± 0.25 | 2.853 ± 0.26 | 2.932 ± 0.28 | 2.977 ± 0.32 | 2.863 | ||||
| Mean (A) | 2.482 | 2.641 | 2.705 | 2.752 | 2.559 | 2.722 | 2.788 | 2.837 | ||||||
| L.S.D. at 5% | A: 0.055 | B: 0.046 | AB: 0.092 | A: 0.042 | B: 0.037 | AB: 0.074 | ||||||||
| Phosphorus (%) | ||||||||||||||
| Control (Without) | 0.290 ± 0.09 | 0.308 ± 0.10 | 0.316 ± 0.10 | 0.325 ± 0.10 | 0.310 | 0.300 ± 0.10 | 0.317 ± 0.10 | 0.326 ± 0.11 | 0.335 ± 0.10 | 0.319 | ||||
| Vit. E at 50 mg L−1 | 0.317 ± 0.09 | 0.338 ± 0.09 | 0.340 ± 0.10 | 0.348 ± 0.09 | 0.336 | 0.327 ± 0.09 | 0.348 ± 0.10 | 0.350 ± 0.10 | 0.359 ± 0.10 | 0.346 | ||||
| Vit. E at 100 mg L−1 | 0.490 ± 0.08 | 0.521 ± 0.09 | 0.537 ± 0.09 | 0.539 ± 0.09 | 0.522 | 0.504 ± 0.08 | 0.537 ± 0.09 | 0.552 ± 0.09 | 0.554 ± 0.09 | 0.537 | ||||
| Vit. B1 at 50 mg L−1 | 0.448 ± 0.09 | 0.477 ± 0.09 | 0.483 ± 0.09 | 0.489 ± 0.09 | 0.474 | 0.462 ± 0.09 | 0.491 ± 0.10 | 0.497 ± 0.10 | 0.503 ± 0.10 | 0.488 | ||||
| Vit. B1 at 100 mg L−1 | 0.510 ± 0.11 | 0.543 ± 0.12 | 0.547 ± 0.11 | 0.553 ± 0.11 | 0.538 | 0.525 ± 0.11 | 0.558 ± 0.12 | 0.564 ± 0.12 | 0.570 ± 0.12 | 0.554 | ||||
| Active yeast at 100 mL L−1 | 0.303 ± 0.10 | 0.321 ± 0.12 | 0.330 ± 0.10 | 0.339 ± 0.11 | 0.323 | 0.312 ± 0.10 | 0.331 ± 0.12 | 0.339 ± 0.10 | 0.349 ± 0.12 | 0.333 | ||||
| Active yeast at 150 mL L−1 | 0.456 ± 0.10 | 0.485 ± 0.10 | 0.492 ± 0.11 | 0.504 ± 0.11 | 0.484 | 0.470 ± 0.11 | 0.499 ± 0.12 | 0.508 ± 0.12 | 0.519 ± 0.13 | 0.499 | ||||
| Mean (A) | 0.402 | 0.428 | 0.435 | 0.442 | 0.414 | 0.440 | 0.448 | 0.456 | ||||||
| L.S.D. at 5% | A: 0.008 | B: 0.007 | AB: 0.014 | A: 0.007 | B: 0.006 | AB: 0.012 | ||||||||
| Potassium (%) | ||||||||||||||
| Control (Without) | 0.829 ± 0.23 | 0.883 ± 0.24 | 0.891 ± 0.24 | 0.916 ± 0.24 | 0.880 | 0.854 ± 0.23 | 0.909 ± 0.25 | 0.917 ± 0.25 | 0.943 ± 0.25 | 0.906 | ||||
| Vit. E at 50 mg L−1 | 0.877 ± 0.21 | 0.932 ± 0.23 | 0.945 ± 0.23 | 0.967 ± 0.23 | 0.930 | 0.903 ± 0.22 | 0.960 ± 0.24 | 0.972 ± 0.24 | 0.996 ± 0.23 | 0.958 | ||||
| Vit. E at 100 mg L−1 | 1.343 ± 0.20 | 1.429 ± 0.21 | 1.440 ± 0.21 | 1.444 ± 0.21 | 1.414 | 1.383 ± 0.20 | 1.472 ± 0.22 | 1.483 ± 0.22 | 1.487 ± 0.21 | 1.456 | ||||
| Vit. B1 at 50 mg L−1 | 1.146 ± 0.20 | 1.220 ± 0.21 | 1.233 ± 0.22 | 1.248 ± 0.22 | 1.212 | 1.180 ± 0.21 | 1.256 ± 0.22 | 1.270 ± 0.22 | 1.285 ± 0.22 | 1.248 | ||||
| Vit. B1 at 100 mg L−1 | 1.353 ± 0.25 | 1.440 ± 0.26 | 1.447 ± 0.22 | 1.460 ± 0.26 | 1.425 | 1.394 ± 0.25 | 1.483 ± 0.27 | 1.490 ± 0.27 | 1.503 ± 0.27 | 1.467 | ||||
| Active yeast at 100 mL L−1 | 0.864 ± 0.21 | 0.920 ± 0.22 | 0.928 ± 0.26 | 0.954 ± 0.23 | 0.916 | 0.890 ± 0.22 | 0.947 ± 0.23 | 0.956 ± 0.26 | 0.982 ± 0.25 | 0.944 | ||||
| Active yeast at 150 mL L−1 | 1.164 ± 0.21 | 1.238 ± 0.24 | 1.291 ± 0.22 | 1.337 ± 0.25 | 1.257 | 1.199 ± 0.22 | 1.275 ± 0.25 | 1.329 ± 0.22 | 1.377 ± 0.28 | 1.295 | ||||
| Mean (A) | 1.082 | 1.152 | 1.168 | 1.189 | 1.115 | 1.186 | 1.203 | 1.225 | ||||||
| L.S.D. at 5% | A: 0.018 | B: 0.016 | AB: 0.032 | A: 0.019 | B: 0.017 | AB: 0.034 | ||||||||
Disclaimer/Publisher’s Note: The statements, opinions and data contained in all publications are solely those of the individual author(s) and contributor(s) and not of MDPI and/or the editor(s). MDPI and/or the editor(s) disclaim responsibility for any injury to people or property resulting from any ideas, methods, instructions or products referred to in the content. |
© 2025 by the authors. Licensee MDPI, Basel, Switzerland. This article is an open access article distributed under the terms and conditions of the Creative Commons Attribution (CC BY) license (https://creativecommons.org/licenses/by/4.0/).
Share and Cite
Hassan, A.A.; Abdel-Rahim, A.F.A.; Al Hawas, G.H.; Alshammari, W.K.; Zewail, R.M.Y.; Badawy, A.A.; El-Desouky, H.S. Optimizing Caraway Growth, Yield and Phytochemical Quality Under Drip Irrigation: Synergistic Effects of Organic Manure and Foliar Application with Vitamins B1 and E and Active Yeast. Horticulturae 2025, 11, 977. https://doi.org/10.3390/horticulturae11080977
Hassan AA, Abdel-Rahim AFA, Al Hawas GH, Alshammari WK, Zewail RMY, Badawy AA, El-Desouky HS. Optimizing Caraway Growth, Yield and Phytochemical Quality Under Drip Irrigation: Synergistic Effects of Organic Manure and Foliar Application with Vitamins B1 and E and Active Yeast. Horticulturae. 2025; 11(8):977. https://doi.org/10.3390/horticulturae11080977
Chicago/Turabian StyleHassan, Ahmed A., Amir F.A. Abdel-Rahim, Ghadah H. Al Hawas, Wadha Kh. Alshammari, Reda M.Y. Zewail, Ali A. Badawy, and Heba S. El-Desouky. 2025. "Optimizing Caraway Growth, Yield and Phytochemical Quality Under Drip Irrigation: Synergistic Effects of Organic Manure and Foliar Application with Vitamins B1 and E and Active Yeast" Horticulturae 11, no. 8: 977. https://doi.org/10.3390/horticulturae11080977
APA StyleHassan, A. A., Abdel-Rahim, A. F. A., Al Hawas, G. H., Alshammari, W. K., Zewail, R. M. Y., Badawy, A. A., & El-Desouky, H. S. (2025). Optimizing Caraway Growth, Yield and Phytochemical Quality Under Drip Irrigation: Synergistic Effects of Organic Manure and Foliar Application with Vitamins B1 and E and Active Yeast. Horticulturae, 11(8), 977. https://doi.org/10.3390/horticulturae11080977


