Article

Salinity Tolerance of Novel and Established Olive (Olea europaea L.) Cultivars for Super-High-Density Systems

by
Xavier Rius-García
1,2,
María Videgain-Marco
1,3,
José Casanova-Gascón
1,3,
Luis Acuña-Rello
4 and
Pablo Martín-Ramos
4,*
1
Department of Agricultural and Environmental Sciences, Higher Polytechnic School of Huesca, University of Zaragoza, Ctra. Cuarte s/n, 22071 Huesca, Spain
2
Agromillora Group, Plaça Manel Raventós 3-5, St. Sadurní d’Anoia, 08770 Barcelona, Spain
3
AgriFood Institute of Aragón (IA2–CITA), University of Zaragoza, Ctra. Cuarte s/n, 22071 Huesca, Spain
4
Department of Agricultural and Forestry Engineering, ETSIIAA, University of Valladolid, Avda. Madrid 44, 34004 Palencia, Spain
*
Author to whom correspondence should be addressed.
Horticulturae 2025, 11(8), 957; https://doi.org/10.3390/horticulturae11080957
Submission received: 11 July 2025 / Revised: 8 August 2025 / Accepted: 10 August 2025 / Published: 13 August 2025
(This article belongs to the Special Issue Olive Stress Alleviation Strategies)

Abstract

The olive industry is transitioning from traditional to super-high-density (SHD) systems to optimize production costs and address labor shortages. This shift coincides with increasing challenges from soil salinization and deteriorating irrigation water quality. This study evaluated salinity tolerance in three novel olive cultivars (Lecciana, Coriana, and Sikitita) against the established SHD references Arbequina and Arbosana under controlled greenhouse conditions over five months with increasing NaCl concentrations (25, 50, and 75 mM). The analysis revealed distinct adaptation mechanisms among cultivars. Arbosana exhibited balanced tolerance across parameters, with minimal biomass reduction and remarkable photosynthetic resilience. Lecciana demonstrated superior ion regulation, maintaining the highest K+/Na+ ratios across all salinity levels despite pronounced shoot growth sensitivity at high salinity. Sikitita showed moderate tolerance through biomass maintenance but with significant photosynthetic sensitivity under stress. Arbequina displayed effective chloride exclusion and consistent shoot growth despite biomass sensitivity, whereas Coriana presented notable biomass increases at moderate salinity but poor ion discrimination. Tissue-specific analysis revealed common compartmentalization patterns across cultivars, with roots accumulating the highest Na+ and Cl concentrations. These data identify Arbosana and Lecciana as promising candidates for salinized SHD orchards.

1. Introduction

The olive tree (Olea europaea L.) is one of the most important woody crops in the world, with a global cultivation area of over 11.6 million hectares and an annual production of around 20 million tons of olives [1]. The Mediterranean basin accounts for approximately 95% of this production. Ensuring economic and environmental sustainability remains a key challenge for the olive industry, which requires significant improvements in orchard efficiency [2]. Traditional olive groves, which account for approximately 80% of total oil production, are labor-intensive and face rising production costs as well as labor shortages. To address these challenges, the super-high-density (SHD) system was developed in Spain three decades ago. Characterized by reduced planting distances (e.g., 4.0 × 1.5 m) and a continuous canopy hedge, SHD enables full mechanization and over-the-row harvesting [3,4]. This system requires specific cultivars adapted to high planting densities and mechanical harvesting, with Arbequina and Arbosana serving as the primary commercial references. Intensifying olive cultivation through SHD systems offers a potential path toward greater environmental sustainability by reducing water use and other agricultural inputs [4].
Currently, SHD olive orchards occupy approximately 420,000 hectares globally, with Spain, Portugal, and California leading in terms of adoption rates, and approximately 20,000 new hectares being planted annually [5]. This expansion increasingly overlaps with salt-affected areas, which comprise 1.38 billion hectares (10.7%) of global land, including 33% of irrigated cropland, with salinization rates accelerating at ~10% per year [6,7,8,9].
As olive cultivation expands globally and climate patterns shift, water resource management has become increasingly critical. The use of low-quality groundwater (brackish, reclaimed, or drainage water) is becoming inevitable in many regions [10]. This situation is particularly acute in coastal and semi-arid areas, where competition for high-quality water (i.e., water with low salinity and low concentrations of toxic ions) and seawater intrusion into aquifers compound the challenge [11]. High evaporation rates, insufficient leaching, and widespread saline irrigation create conditions where salinity-related stress poses a major constraint for olive cultivation [12].
Salt stress impacts olive trees through multiple mechanisms. Excess sodium (Na+) accumulation disrupts ionic balance and induces oxidative stress, leading to cellular damage, growth inhibition, and altered plant morphology and biochemistry [13]. When Na+ and chloride (Cl) accumulate in the rhizosphere, they can cause metabolic toxicity unless effectively compartmentalized in vacuoles. This toxicity manifests distinctly: chloride typically causes bronzing and yellowing of leaf tips progressing to necrosis [14], whereas sodium toxicity appears as marginal yellowing before tissue death [15].
Olive trees demonstrate moderate salt tolerance [16], employing various adaptation mechanisms. These include preventing salt transport through Na+ and Cl exclusion from leaves [17,18] and compartmentalizing toxic ions within vacuoles [19,20,21]. However, significant cultivar-dependent variations exist in salt tolerance, particularly in root Na+ accumulation patterns and ion translocation to aerial tissues [22,23].
Recent research has expanded our understanding of olive tree responses to salinity stress. Molecular studies have made progress in the elucidation of key ion transport mechanisms, including the Salt Overly Sensitive (SOS) pathway components, high-affinity K+ transporters (HKT1), and vacuolar Na+/H+ antiporters (NHX family), which collectively regulate cellular ion homeostasis under salt stress [24,25,26]. Studies examining different cultivars (such as Arbequina, Koroneiki, Royal de Cazorla, and Fadak 86) have revealed variations in net photosynthesis, chlorophyll content, and plant growth under saline conditions [27]. A comprehensive review by El Yamani and Cordovilla [28] synthesized information on olive tree adaptations to salt stress, highlighting the importance of morphological, physiological, biochemical, and molecular mechanisms in conferring salinity tolerance. The study emphasized the role of osmotic adjustment, ion homeostasis (the ability to maintain the intracellular ionic balance through selective uptake, compartmentalization, and exclusion mechanisms), and antioxidant defense systems in mitigating the adverse effects of salinity. Further studies with Chemlali, Koroneiki, Ayvalık, Gemlik, and Kilis provided additional insights into cultivar-specific responses, demonstrating how different genotypes manage osmotic potential and maintain crucial K+/Na+ ratios under saline conditions [29,30].
The convergence of expanding SHD cultivation and increasing salinity challenges necessitates the identification of cultivars that combine adaptation to intensive growing systems with salt tolerance [31]. However, no comparative ionomic screening of newly developed SHD-compatible cultivars under moderate to high salinity conditions currently exists. This study investigated the salinity responses of three new olive cultivars (Lecciana, Coriana, and Sikitita) against established SHD references (Arbequina and Arbosana) under controlled conditions. The objectives were to assess NaCl salinity tolerance, rank cultivars on the basis of stress response, and determine critical NaCl thresholds associated with visible stress symptoms. We hypothesize that (i) Arbosana will outperform Arbequina in terms of growth and photosynthetic resilience at 75 mM NaCl, and (ii) Lecciana will maintain superior K+/Na+ ratios but exhibit growth inhibition under high salinity. This evaluation aims to provide crucial insights for cultivar selection in areas where both intensive cultivation and salinity management are required.

2. Materials and Methods

2.1. Location and Experimental Design

The experiment was conducted in a polyethylene greenhouse at the Escuela Politécnica Superior, Universidad de Zaragoza, in Huesca, Spain (42°07′12.78″ N, 0°26′49.04″ O). In June 2022, uniform 12-month-old, self-rooted olive plants from five genotypes (Lecciana, Coriana, Sikitita, Arbequina, and Arbosana) were obtained from Agromillora Iberia nursery (Spain) and transplanted into black plastic pots (15 × 15 × 20 cm, 4.5 L) filled with quartziferous sand (0.05–2.0 mm). The quartziferous sand was analyzed for residual cations and anions prior to use, showing negligible salt content. During transplantation, the roots were rinsed with deionized water to remove any remaining peat.
The plants were grown for 7 months, and, in January 2023, they were pruned to a uniform height of 60 cm. The experiment started on June 1, once the newly developed main shoot had reached a height of 50 cm, and continued until 1 November 2023 (five months). The plants were grown under natural light conditions in the greenhouse, where the daily temperatures ranged between 18 °C and 33 °C and the day/night relative humidity levels were maintained between 55% and 85%. A mobile automatic shading screen was deployed when the temperature exceeded 27 °C to prevent excessive heat accumulation. Additionally, an automatic ventilation system was activated to ensure that the internal temperature remained below 35 °C.
The experiment followed a completely randomized block design, comprising a total of 80 olive plants, with four plants per treatment (corresponding to four salinity levels) and five cultivars.

2.2. Irrigation Management

The solution used in this experiment was a one-quarter strength Hoagland solution [32], prepared with locally sourced freshwater and with an electrical conductivity (EC) of 0.8 dS m−1. This base solution served as the control treatment (0 mM NaCl), ensuring identical nutrient availability across all treatments while differences in plant response were attributable solely to NaCl-induced osmotic and ionic stresses. The five genotypes were subjected to four salinity levels (0, 25, 50, and 75 mM NaCl) for five months. Salt concentrations were gradually increased by 25 mM NaCl per week until the target levels were reached on 1 June 2023.
The irrigation schedule was determined by weather conditions, with four-minute irrigation sessions applied one to three times per day. Each pot was irrigated using two drippers, each with a flow rate of 1.3 L h−1 (Click Tip HD, Naandanjain, Jalgaon, India). Saline solutions were injected using a MixRite E-300 volumetric pump (Tefen Flow and Dosing Technologies Ltd., Kibbutz Nahsholim, Hof HaCarmel, Haifa, Israel), and irrigation was automatically regulated by an Agronic 5500 irrigation controller (Sistemes Electrònics PROGRÉS, Barcelona, Spain).
The electrical conductivity (EC) and sodium absorption ratio (SAR) of the irrigation solutions were 0.8, 3.0, 6.0, and 9.0 dS m−1 and 2, 30, 60, and 90, respectively, with pH values ranging between 7.2 and 7.4. To maintain stable salinity conditions in the pots throughout the experiment, a leaching fraction of 20–30% was ensured [33]. This leaching fraction was controlled through the monitoring of the drainage water. The experimental setup included pots arranged on an inclined table (2% slope) covered with waterproof plastic sheeting, allowing for efficient drainage collection. The measured EC values of the drainage water consistently matched the expected levels throughout the experiment, confirming salinity stability (0.8, 3.2, 6.1, and 9.2 dS m−1 for the control, 25, 50, and 75 mM NaCl treatments, respectively).

2.3. Plant Material Analysis

Every 15 days, shoot length and trunk diameter (measured at a height of 10 cm) were recorded for four plants per treatment using a digital ABS caliper (Hoffman Group, Munich, Germany). This interval was selected on the basis of preliminary observations showing detectable growth changes within this timeframe under salt stress conditions. At the end of the experiment, four plants from each treatment and cultivar were removed from the substrate and separated into roots, wood, stems, old leaves, and new leaves. The aerial plant parts were washed with distilled water, while the roots were washed with deionized water to remove residual salts and debris. The fresh weights of all the plant parts were recorded, and the samples were subsequently dried at 70 °C for 24 h to determine their dry weights.
To ensure both cost-effectiveness and precise quantification of all the target elements, a combination of portable X-ray fluorescence (pXRF) and atomic absorption spectrometry (AAS) was chosen for the elemental analysis. The pXRF method enables rapid, non-destructive analysis of Ca2+, K+, and Cl with minimal sample preparation, allowing for high-throughput screening of a large sample set. However, given the limitations of pXRF for light element quantification, AAS was employed for Na+ quantification, providing higher sensitivity and analytical reliability. Despite potential interferences (e.g., phosphate effects on Ca2+ determination), AAS remains the standard method for accurate Na+ quantification in plant tissues.
The dried plant materials were then ground into particles smaller than 2 mm using an HC400 electrical grain grinder (CGoldenwall, Wuxi, Jiangsu, China) to simulate processed soil sample conditions suitable for measurement with the pXRF probe, following established protocols [34,35,36].
A Niton XL3t GOLDD+ pXRF spectrometer (Thermo Scientific, Waltham, MA, USA) was used to determine the Ca2+, K+, and Cl concentrations without pretreatment. The ‘soil mode’ was applied for Ca2+ and K+, while Cl was analyzed in the ‘mining mode’ [37,38]. The internal calibration of the pXRF instrument was conducted at Thermo Fisher Messtechnik GmbH (Munich, Germany). Method validation was carried out via parallel analysis using conventional techniques. Atomic absorption spectrometry (AAS) was used as the reference method for Ca2+ and K+, while ion chromatography was employed for Cl determination in an accredited laboratory (Eurofins Scientific, Lleida, Spain). The correlations between the pXRF and reference methods showed strong linear relationships. Specifically, the validation results demonstrated excellent agreement: calcium (r = 0.9146, R2 = 0.8364, RMSE = 0.3218, slope = 0.9140 ± 0.0738), potassium (r = 0.9884, R2 = 0.9769, RMSE = 0.1913, slope = 0.9057 ± 0.0254), and chloride (r = 0.9902, R2 = 0.9804, RMSE = 0.1303, slope = 0.9435 ± 0.0243), with all the correlations being significant at p < 0.001 (n = 32 for each ion). To ensure data reliability, quality control measures included a regular check standard analysis, daily instrument verification, blank measurements, duplicate sample analyses, and standardized sample preparation protocols.
For sodium (Na+) analysis, the dried and ground samples were subjected to nitric acid digestion. Approximately 0.5 g of sample material was predigested with 10 mL of trace metal-grade HNO3 for 1 h, followed by heating to 115 °C for 2 h. The digested solution was then diluted to 50 mL with deionized water [39]. The Na+ concentration was determined via atomic absorption spectrometry (SpectrAA 10 apparatus; Varian, Palo Alto, CA, USA), following the methodology described by Kalra [40].
All reported values represent the averages of four replicate measurements.

2.4. Physiological Parameters

2.4.1. Chlorophyll Fluorescence

Chlorophyll fluorescence parameters were recorded every two weeks using a portable Handy PEA fluorimeter (Hansatech Instruments Ltd., Norfolk, UK). The parameters measured included initial fluorescence (F0), maximum fluorescence (Fm), variable fluorescence (Fv = Fm − F0), and the maximum quantum yield of photosystem II (PSII) (Fv/Fm) in dark-adapted leaves. Measurements were conducted on four leaves per plant from four plants per treatment (n = 16 measurements per cultivar × treatment combination). The recorded parameters were categorized into three functional groups: overall efficiency of photosystem II, energy and electron transport, and energy dissipation and photodamage [41,42,43]. Following the JIP-test methodology established by Strasser et al. [43], fluorescence parameters were analyzed by comparing the endpoint values to those of the baseline controls, expressing results as percentage changes from initial measurements. This standard approach in fluorescence analysis integrates treatment effects while accounting for individual plant variability.

2.4.2. Stomatal Conductance

Stomatal conductance (gs, mmol H2O m−2 s−1) was measured every two weeks using a portable SC-1 porometer (Meter Group, Washington, DC, USA). Measurements were conducted on two well-exposed, fully expanded leaves located at the median part of the shoot from four plants per treatment and cultivar. Data collection was performed between 9:00 AM and 11:00 AM to ensure stable environmental conditions.

2.4.3. Soil Plant Analysis Development (SPAD)

The total chlorophyll content was determined every two weeks using a portable SPAD-502Plus chlorophyll meter (Konica Minolta, Osaka, Japan), allowing for rapid, non-destructive measurements. SPAD values were obtained from fully expanded functional leaves, with the operator ensuring that the meter was shielded from direct sunlight during each measurement to prevent interference. Fifteen leaves were randomly selected from each cultivar and treatment, and the individual readings were averaged to obtain a single SPAD value per plant.

2.5. Statistical Analysis

The statistical analyses were performed using R software (v. 4.4.1:2024) [44]. The experimental design followed a three-factor factorial arrangement, incorporating genotype, treatment, and plant organ as factors. The analysis focused on the fresh weight, dry weight, Ca2+, Na+, K+, and Cl concentrations, and key ionic ratios (Ca2+/Na+ and K+/Na+). A systematic data assessment guided the statistical approach. Initial normality testing revealed significant deviations in ion concentration and biomass data, as confirmed by the Kolmogorov–Smirnov test with Lilliefors correction [45] or the Shapiro–Wilk test [46] (α = 0.05), depending on sample size. Q-Q normal probability plots provided additional visual validation. Homoscedasticity was evaluated using Levene’s test [47]. Given the frequent violations of normality and homoscedasticity assumptions, two alternative statistical approaches were employed: the Kruskal–Wallis test [48] for non-normal but homoscedastic data and Welch’s heteroscedastic F-test with trimmed means and bootstrapping [49,50] when neither normality nor homoscedasticity could be assumed. Additionally, bootstrap methods were employed to construct robust confidence intervals for location and homogeneous group comparisons [51], using Welch’s robust t-test with bootstrap resampling (n = 5000) for trimmed means (0.1). Effect sizes (Table S1) were calculated using Wilcox and Tian’s ξ2, which bypasses the equal variance requirement of Cohen’s d and provides generalized effect size estimates [52]. These robust methods ensure reliable statistical inference despite the moderate sample size and assumption violations. This approach was particularly suitable for analyzing the interactions among genotype, treatment, and organ factors in a factorial design. Hochberg’s method was applied to adjust p-values for multiple comparisons, controlling family-wise error rates across the extensive genotype × organ × salinity contrasts.
The response models employed for shoot length, trunk diameter, stomatal conductance, and SPAD values were natural cubic splines [53,54,55]. Model evaluation was based on residual analysis, the correlation coefficient (R2 value) [56], the Akaike information criterion (AIC) [57], and the Bayesian information criterion (BIC) [58,59]. These criteria, in combination with the likelihood-ratio test and Wald’s test, were used to assess model goodness-of-fit and ensure robust statistical inference.
For mineral content analyses specifically, logarithmic transformations were applied to dependent variables to stabilize variance and approximate normality for factorial ANOVA (Table S2). The model structure was defined as: log(Dependent variable) ~ fact.A(Genotype) × fact.B(Treatment) × fact.C(Organ). When transformations failed to satisfy parametric assumptions, the robust comparison methods described above were employed using untransformed variables to ensure appropriate biological interpretation. All three factors and their interactions were statistically significant across the models (Table S3).

3. Results

3.1. Growth Parameters

3.1.1. Fresh and Dry Weight

Fresh and dry weight measurements revealed distinct genotypic responses to salinity stress. Under control conditions, Arbosana exhibited the highest fresh weight (17.82 g, Figure S1 and Table S4), while Coriana showed the lowest (10.80 g). At 25 mM NaCl, most genotypes maintained or increased their biomass, with Lecciana showing a notable 16.6% rise. As the salinity increased to 50 mM NaCl, Coriana demonstrated salt tolerance with a 17.4% increase in biomass, Sikitita maintained stable values, and Arbosana showed resilience despite an 8.5% reduction. At 75 mM NaCl, Sikitita showed a 5.6% increase compared to the control, Arbosana again displayed resilience with a 5.4% reduction, whereas Arbequina emerged as the most sensitive genotype with an 11% reduction.
The dry weight measurements followed similar genotypic patterns (Figure S3 and Table S6). Arbosana consistently demonstrated superior performance, reaching 8.15 g at 75 mM NaCl; Coriana initially decreased at 25 mM NaCl but showed a significant improvement at 50 mM NaCl with a 19.2% increase; Lecciana and Sikitita maintained stable values across treatments; and Arbequina showed increasing sensitivity at higher salt concentrations.
Organ-specific responses significantly varied. Under control conditions (Figure S2 and Table S5), stems and new leaves exhibited the highest fresh weights (averaging 18.00 g), followed by roots, wood, and old leaves (6.69 g). At 25 mM NaCl, new leaves and stems showed slight increases, while other organs remained stable. At 75 mM NaCl, new leaves experienced a 9.2% reduction compared with those at 25 mM NaCl, stems remained resilient, roots showed the highest sensitivity (with a 20.2% reduction from the control), wood tissue unexpectedly increased by 24.9%, and old leaves remained stable.
The dry weight distribution among organs showed similar trends (Figure S4 and Table S7), with stems and new leaves maintaining the highest values (8.26 g and 7.77 g, respectively) under control conditions. At 75 mM NaCl, new leaves showed a 13.5% reduction compared with those at 25 mM NaCl, stems and roots maintained relatively stable values, wood tissue displayed unexpected growth (18.6% increase), and old leaves reached their highest values, with a 16.8% increase from those of the control.

3.1.2. Shoot Length

The spline data revealed distinct patterns in shoot length among the genotypes and treatments (Table S8). Under control conditions (Figure 1), Arbosana reached 134.20 cm, with rapid growth between fortnights 4 and 7; Sikitita achieved 130.00 cm, with an 8.23 cm per fortnight growth rate; Coriana reached 125.50 cm; Arbequina attained 120.50 cm, with a consistent 8.33 cm per fortnight rate; and Lecciana showed the lowest performance at 115.20 cm. At 25 mM NaCl, height reductions were minimal, with Arbosana maintaining dominance at 131.00 cm, followed by Lecciana and Sikitita (both 128.70 cm) and Arbequina (125.70 cm). Coriana showed early salt sensitivity, reaching only 113.00 cm. At 50 mM NaCl, growth reductions became apparent after fortnight 6, with heights decreasing to 117.70 cm for Arbosana, 116.5 cm for Arbequina, 115.20 cm for Coriana, 112.50 cm for Sikitita, and 106.50 cm for Lecciana (which showed the lowest growth rate at 6.63 cm per fortnight). At 75 mM NaCl, genotypic differences in salt tolerance became pronounced: Arbosana maintained a relatively high performance (128.70 cm), followed by Arbequina (123.50 cm). Sikitita and Coriana showed moderate tolerance (116.70 cm and 114.50 cm, respectively), while Lecciana exhibited the highest sensitivity, with a significant reduction to 100.00 cm.
Upon replotting the shoot length data for each genotype as a function of the treatment dose and date (Figure S5), it may be observed more clearly that Arbequina demonstrated consistent growth across all salinity levels throughout the experiment, with final heights varying by only 9.25 cm between treatments; Arbosana exhibited superior growth across all treatments, with peak growth between fortnights 5 and 7 (25.75 cm increase); Sikitita showed variable growth with distinct treatment responses from fortnights 6 to 9, demonstrating moderate salinity tolerance; Coriana’s growth initially matched that of Sikitita (fortnights 1 to 4) but diverged after fortnight 6 under salt stress; and Lecciana displayed high salt sensitivity, with severe growth reduction at 75 mM NaCl.

3.1.3. Trunk Diameter

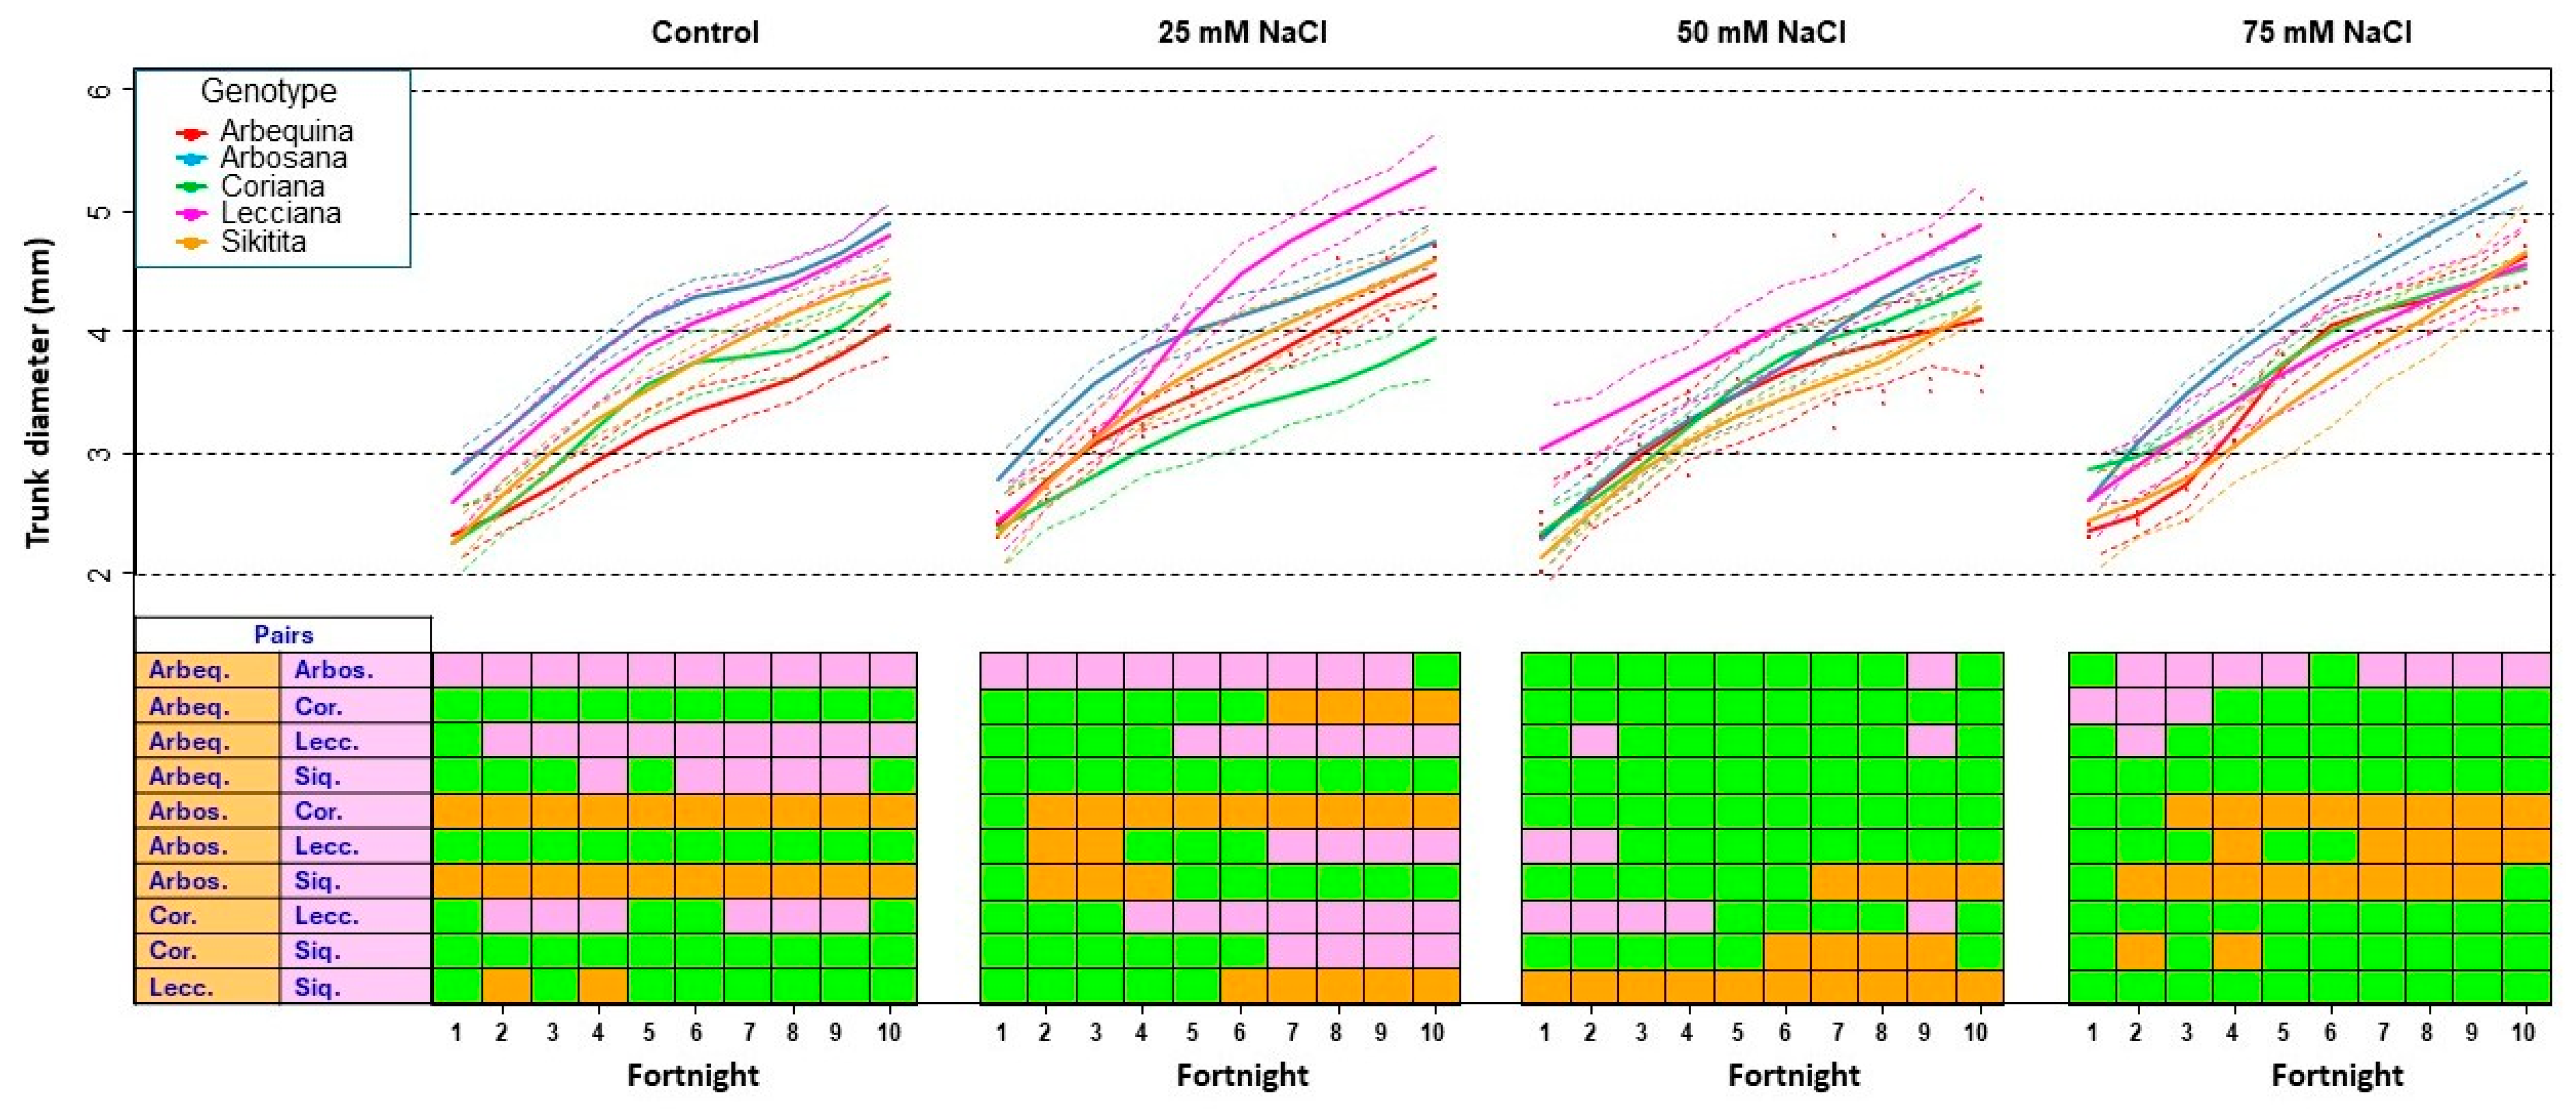
Spline analysis revealed distinct patterns in trunk diameter development across genotypes and treatments (Table S9). Under control conditions (Figure 2), initial diameters ranged from 2.85 cm (Arbosana) to 2.27 cm (Coriana). By fortnight 10, Arbosana showed the largest diameter (4.90 cm) and Arbequina the smallest (4.02 cm). At 25 mM NaCl, initial diameters varied from 2.78 cm (Arbosana) to 2.28 cm (Sikitita), with Lecciana achieving the highest final growth (5.35 cm). Peak growth occurred between fortnights 4 and 8. At 50 mM NaCl, initial diameters ranged from 3.00 cm (Lecciana) to 2.10 cm (Sikitita). By fortnight 10, Lecciana reached 4.85 cm, while Arbequina showed the smallest diameter (4.10 cm), with maximum growth between fortnights 5 and 7. At 75 mM NaCl, initial diameters varied from 2.85 cm (Coriana) to 2.42 cm (Sikitita). The final measurements showed Arbosana maintaining the largest diameter (5.18 cm), while Lecciana and Coriana exhibited the smallest (4.53 cm each), with peak growth occurring between fortnights 4 and 7.
If the information is instead presented for each genotype as a function of the treatment dose and date (Figure S6), it becomes apparent that Arbequina showed steady growth across treatments and that peak growth at 75 mM NaCl occurred between fortnights 5 and 7; Arbosana maintained larger diameters throughout the study, with notable growth between fortnights 3 and 5; treatment differences emerged after fortnight 5 in the case of Coriana; Lecciana showed the highest overall trunk growth under 25 mM NaCl, particularly between fortnights 4 and 8; and Sikitita also showed pronounced growth between fortnights 4 and 8.

3.2. Physiological Responses Under Salt Treatments

3.2.1. Fluorimetry

The results of the statistical analysis of the fluorimetry parameters across treatments and genotypes are summarized in Table S10. Electron flux assessment (Figure 3a) and energy dissipation analysis (Figure 3b) revealed minor variations among cultivars in the control conditions, indicating optimal photosynthetic performance. At 25 mM NaCl, Arbosana maintained levels close to the control ones; Arbequina and Sikitita showed reduced electron transport rate per reaction center (REo/RC) and relative variable fluorescence at the J-step of the OJIP fluorescence transient (Vj) values, and increases in the energy dissipated in the form of heat and fluorescence per reaction center (DIo/RC); while Lecciana and Coriana experienced mild declines in the efficiency with which a trapped exciton can move an electron into the electron transport chain beyond QA (ψ(Eo)) and mild increases in DIo/RC. At 50 mM NaCl, greater disruptions emerged in the energy dissipated in the form of heat and fluorescence per cross-section (DIo/CSo) and in ψ(Eo), particularly in Arbequina and Sikitita. Lecciana and Coriana showed moderate reductions in Vj and the initial to maximum fluorescence ratio (Fo/Fm), with Coriana maintaining slightly better stability. Arbosana continued to exhibit the best stability. At 75 mM NaCl, Arbequina and Sikitita showed the greatest disruption across all parameters, while Lecciana and Coriana maintained better function despite considerable stress. Arbosana remained the most resilient.
Photosynthetic performance assessment (Figure 3c) at 25 mM NaCl showed early reductions in the performance index on an absorption basis (PI(abs)) and the maximum quantum yield of primary photochemistry (φ(Po)) for Arbequina and Sikitita, while Lecciana and Coriana maintained stable variable to initial fluorescence ratio (Fv/Fo) and variable to maximum fluorescence ratio (Fv/Fm) values. Arbosana showed minimal changes. At 50 mM NaCl, Arbequina and Sikitita exhibited significant reductions in φ(Po) and Fv/Fm, while Lecciana and Coriana showed moderate declines in PI(abs) and in the electron transport rate per reaction center (ETo/RC), with Coriana performing slightly better. At 75 mM NaCl, Arbequina and Sikitita displayed severe reductions across all parameters, particularly in PI(abs) and Fv/Fo. Lecciana and Coriana maintained better function, with Coriana showing higher Fv/Fm and ETo/RC values. Arbosana demonstrated superior tolerance with minimal reductions in PI(abs) and Fv/Fo.

3.2.2. Gas Exchange

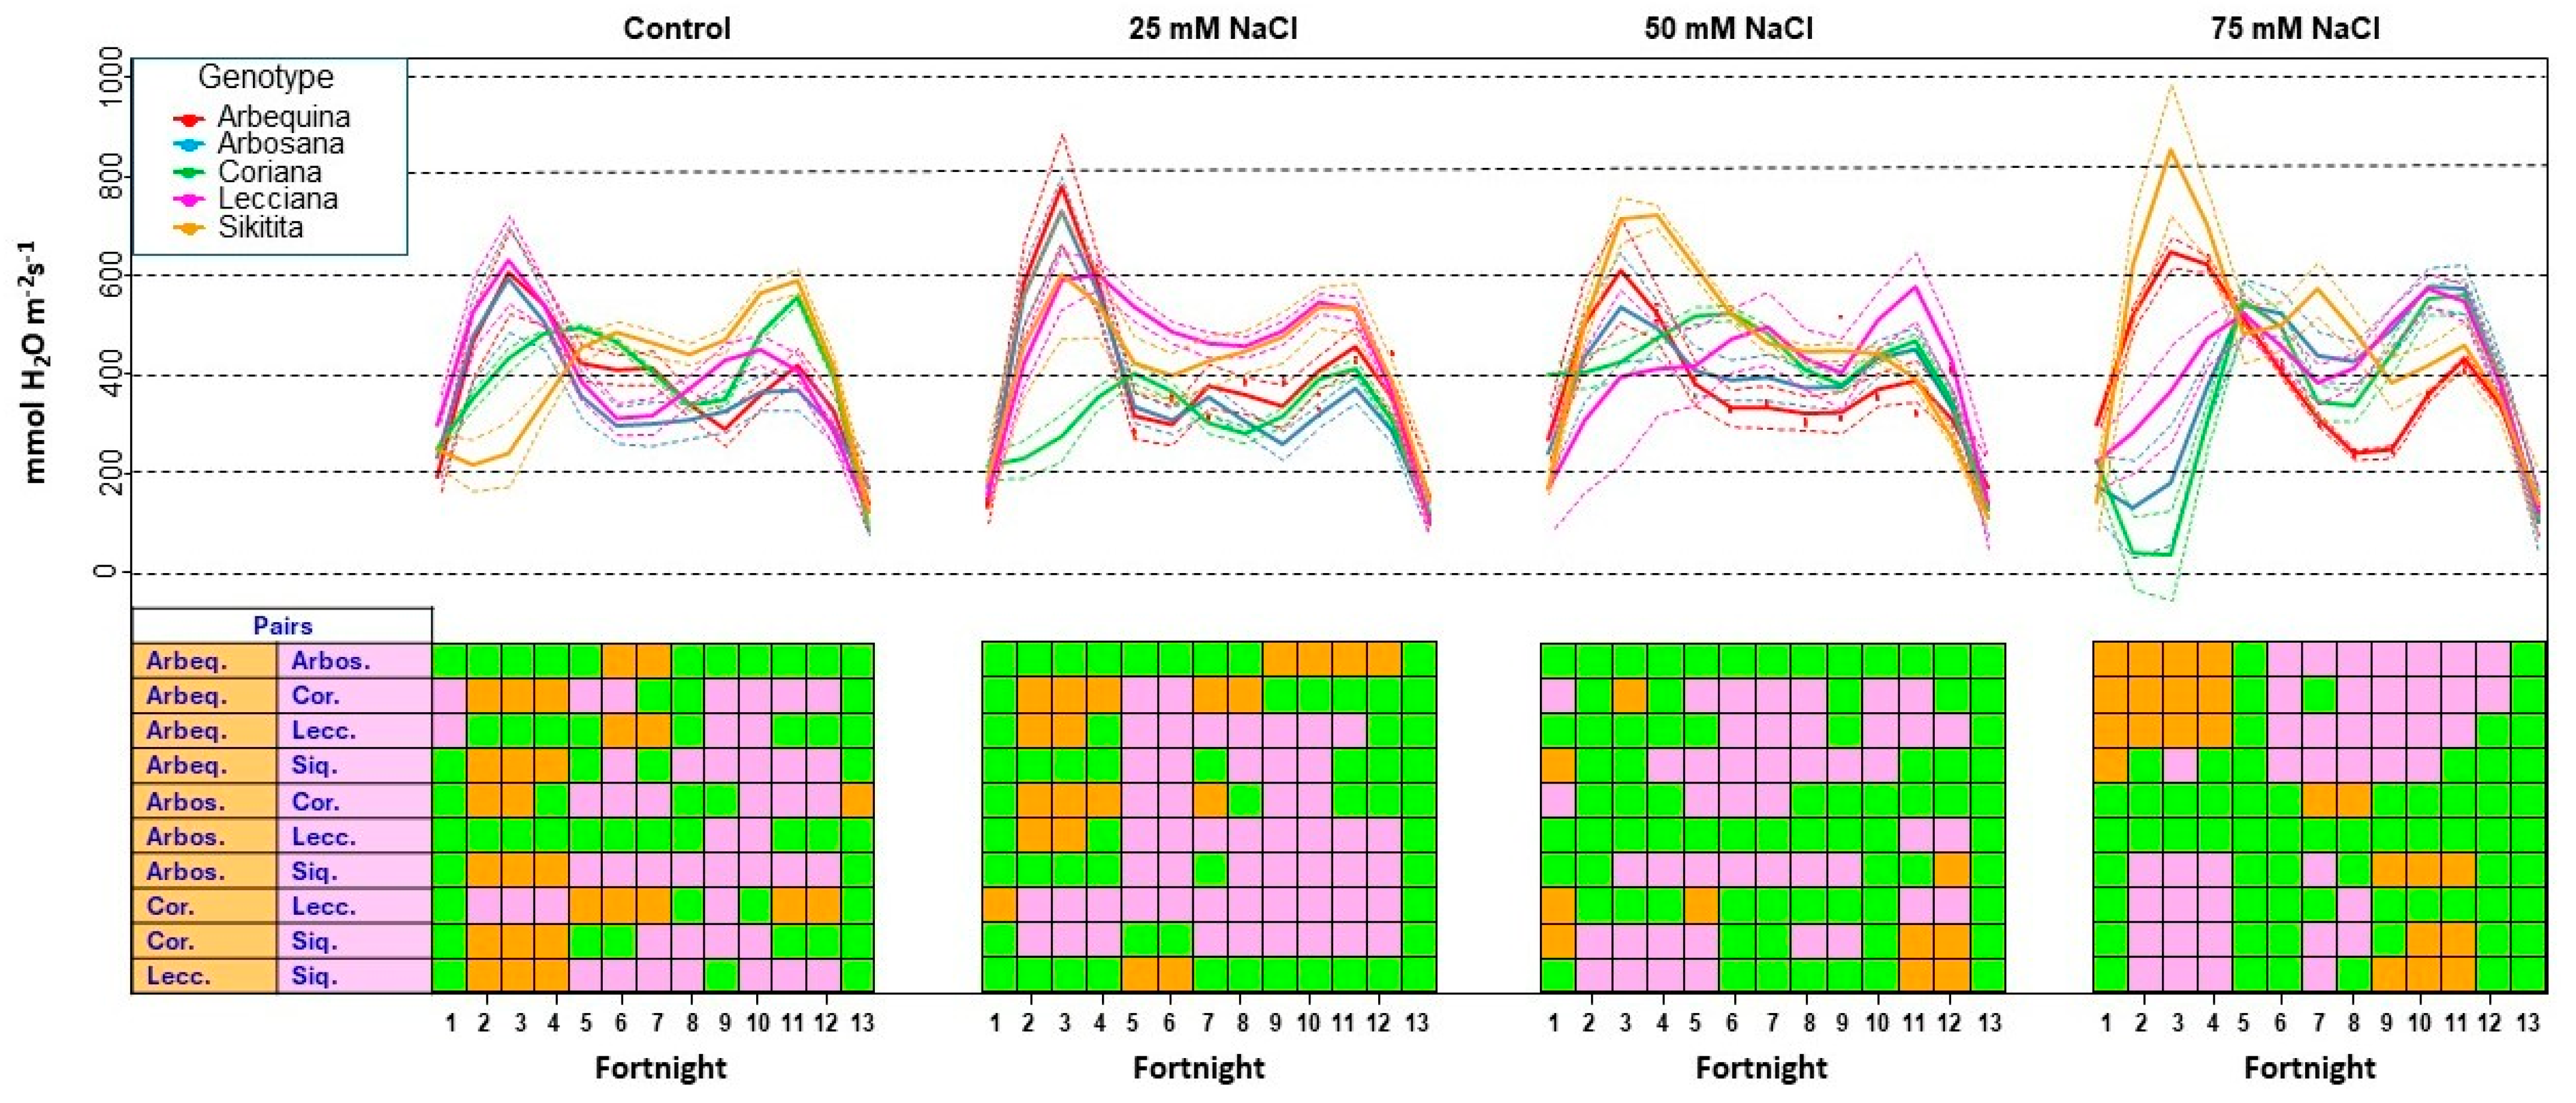
All the genotypes exhibited initial peaks in stomatal conductance followed by treatment-specific patterns over time (Table S11). Under control conditions (Figure 4), Lecciana and Coriana showed the highest initial conductance, followed by Sikitita, Arbosana, and Arbequina. The values increased between fortnights 4 and 6, declined during fortnights 8−10 (except for Sikitita and Coriana), and peaked again at fortnight 11. At 25 mM NaCl, despite lower initial values, significant increases occurred during fortnights 4 and 5, particularly in Lecciana and Arbequina, with a second peak at fortnight 11. At 50 mM NaCl, Coriana maintained high initial conductance, whereas other genotypes started lower. Substantial increases occurred during fortnights 4−6, with Sikitita and Lecciana maintaining the highest levels through fortnights 7−9. At 75 mM NaCl, Arbequina showed the highest initial values, with all genotypes showing increased conductance between fortnights 4−6, particularly Sikitita and Arbosana. Most genotypes maintained elevated conductance during fortnights 8−10, with maximum peaks occurring at fortnight 11, especially in Arbosana and Coriana.
If the stomatal conductance data are represented for each genotype as a function of treatment dose and date (Figure S7), it is notable that Arbequina showed a quite similar response pattern across treatments, with sharp increases by fortnight 4, followed by a gradual decline through fortnights 6−8. Arbosana demonstrated treatment-specific patterns: under control conditions, it showed moderate initial values, peaking at fortnight 4, declining during fortnights 7−8, and recovering by fortnight 10, while under high salinity, despite lower initial values, significant increases occurred at fortnights 6 and 11. Coriana exhibited unique responses with major peaks under control conditions at fortnights 10–11; under moderate salinity, it maintained high initial conductance through fortnights 6–8, while high salinity treatment led to progressive increases peaking at fortnight 11. Lecciana showed substantial increases under control conditions at fortnights 4 and 8, sustained high conductance under moderate salinity from fortnights 6 to 11, and distinct peaks at 75 mM NaCl at fortnights 8 and 11. Sikitita also displayed treatment-specific responses, with control conditions leading to peaks at fortnights 8 and 11, consistently high values under 50 mM NaCl during fortnights 6−8, and distinct peaks under high salinity at fortnights 6 and 11.

3.2.3. Chlorophyll Content Analysis by Soil–Plant Analysis Development (SPAD)

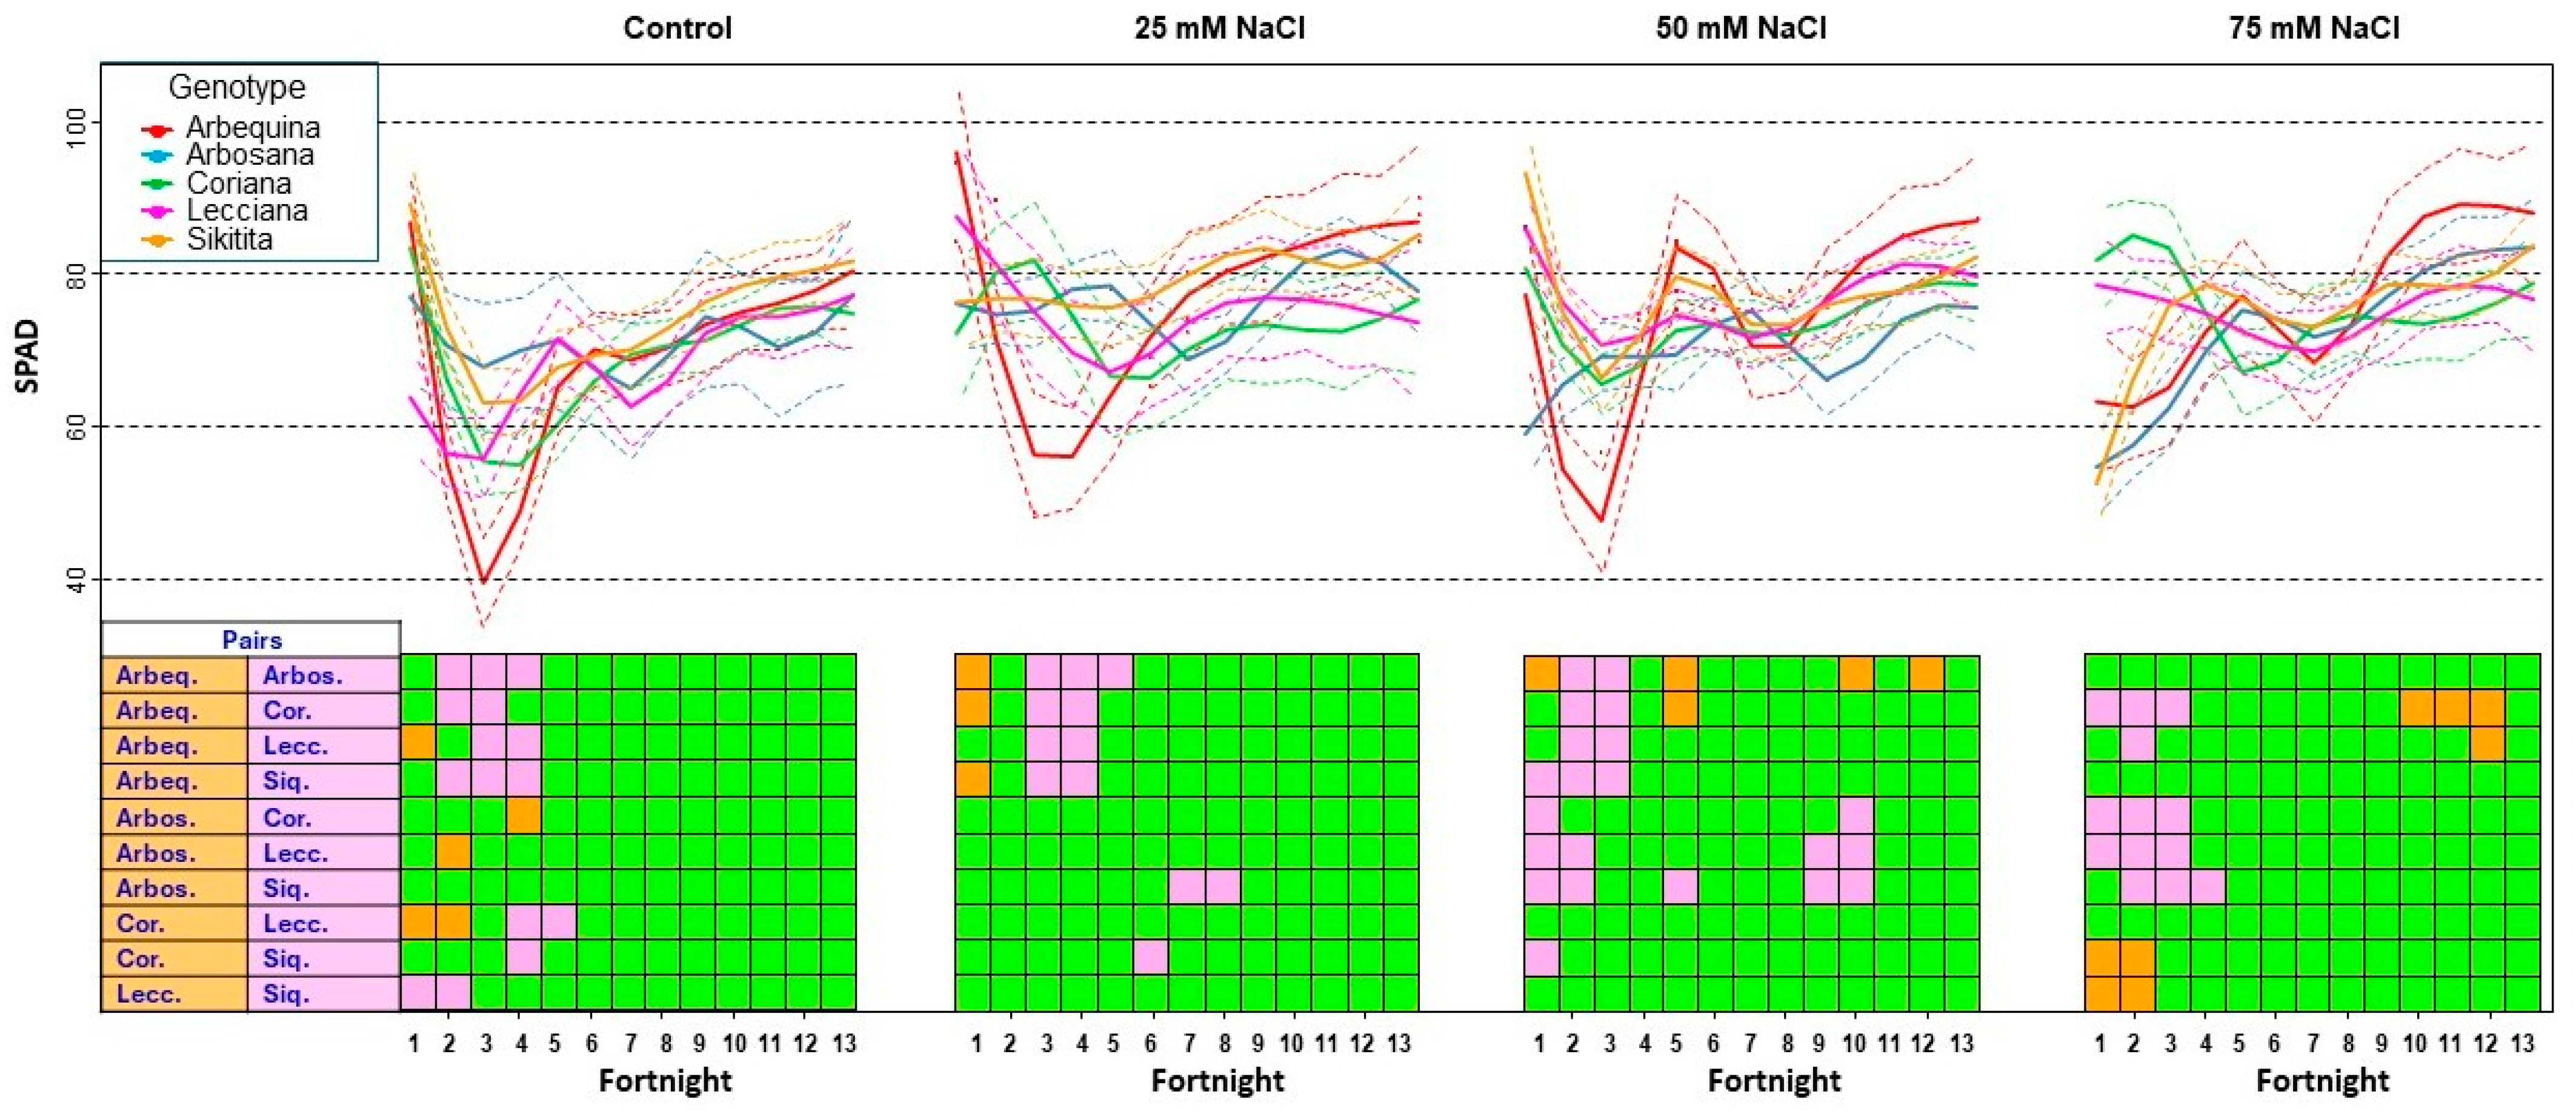
The results of the statistical analysis of SPAD values across treatments and genotypes are summarized in Table S12. Under control conditions (Figure 5), initial readings were highest in Sikitita and Arbequina, moderate in Arbosana and Coriana, and lowest in Lecciana. The values stabilized after fortnight 6, with all genotypes converging toward moderate levels by fortnight 13, though Sikitita and Arbequina maintained slightly higher readings. At 25 mM NaCl, Arbequina and Lecciana showed the highest initial values, with final measurements revealing superior performance in Arbequina and Sikitita. At 50 mM NaCl, Sikitita initially showed notably high values, followed by Arbequina and Lecciana, while Arbosana displayed the lowest readings. By the study’s end, Arbequina demonstrated the highest values, closely followed by Lecciana and Sikitita, with Arbosana showing consistent recovery. At 75 mM NaCl, the initial readings varied considerably, with Coriana being the highest and Arbosana the lowest. The final measurements showed the strongest adaptation in Arbequina, followed by Sikitita and Arbosana, with most genotypes demonstrating significant recovery from initial stress.
As shown in Figure S8, Arbequina showed high initial SPAD values under control conditions, with an initial stress response across treatments. After fortnight 5, values progressively increased with increasing salinity, with final readings showing a positive correlation with the salinity level. Arbosana started with moderate values under control conditions and lower values in the saline treatments but stabilized after fortnight 8, with final measurements ranging from 75.8 (control) to 81.6 (75 mM NaCl). Coriana maintained moderate stability throughout the study, with final readings increasing gradually with increasing salinity to 79.1 at 75 mM NaCl. Lecciana exhibited variable initial values and fluctuations throughout the study, with the highest final values at 50 mM NaCl. Sikitita showed high initial values at 50 mM NaCl, followed by a marked decrease across treatments by fortnight 2. Recovery began after fortnight 4, with final values ranging from 81.4 (control) to 85.1 (25 mM NaCl).

3.3. Changes in Mineral Content

3.3.1. Calcium Content and Distribution

Under control conditions, all the genotypes showed similar calcium levels, ranging from the highest in Coriana (2.49%) to the lowest in Lecciana (2.20%) (Figure S9, Table S13). At 25 mM NaCl, Arbequina decreased to 1.98%, Coriana maintained the highest value (2.32%), and Arbosana, Lecciana, and Sikitita showed moderate reductions (2.15−2.23%). At 50 mM NaCl, Arbequina maintained the lowest calcium content, Coriana and Sikitita remained stable, Lecciana showed a 9.7% decrease from 25 mM NaCl values, and Arbosana decreased to 2.08%. At 75 mM NaCl, Arbosana increased to 2.25%, Arbequina maintained the lowest value (1.94%), and Coriana declined to 2.16%, with Lecciana and Sikitita showing similar values.
The tissue-specific calcium distribution showed distinct patterns (Figure S10, Table S14). Under control conditions, roots and old leaves maintained the highest concentrations, followed by new leaves, while stems and wood showed lower levels. At 25 mM NaCl, the calcium content of old leaves increased, whereas those of new leaves and roots decreased. At 50 mM NaCl, old leaves maintained high levels while new leaves and roots showed further reductions. At 75 mM NaCl, old leaves reached maximum values (3.60%) while roots showed their minimum concentration (2.01%). Stem and wood tissues demonstrated consistent increases in calcium content with rising salinity.

3.3.2. Potassium Accumulation Patterns

Under control conditions, the potassium content moderately varied among genotypes (3.35−3.57%), with Lecciana and Arbequina showing the highest levels (3.57%) and Sikitita the lowest (Figure S11, Table S15). Genotype-specific responses emerged with increasing salinity. At 25 mM NaCl, Lecciana maintained the highest potassium content (3.06%), while Coriana showed the strongest decrease (1.98%). This pattern persisted at higher salinity levels, with Lecciana maintaining superior potassium retention at 75 mM NaCl (2.08%) and Coriana showing the lowest values (1.09%). Sikitita maintained intermediate values across treatments, while Arbequina and Arbosana showed moderate but consistent declines.
The tissue distribution patterns were also distinct (Figure S12, Table S16). Under control conditions, new leaves showed the highest potassium concentration (4.81%), followed by roots (4.08%) and old leaves, while stem and wood maintained the lowest levels. With increasing salinity, all the tissues showed progressive potassium reduction at different rates. Roots exhibited the most dramatic decrease, dropping from 4.08% to 1.14% at 75 mM NaCl, while wood tissue maintained relatively stable potassium levels across treatments.

3.3.3. Chloride Accumulation and Distribution

Under control conditions, the chloride content showed slight genotypic variation (0.12−0.21%), with the highest concentrations in Lecciana and the lowest in Arbosana (Figure S13, Table S17). At 25 mM NaCl, Sikitita and Lecciana emerged as high-accumulating genotypes (0.38% and 0.33% respectively), while Arbequina maintained the lowest chloride levels. This trend continued at 50 mm NaCl, but at 75 mM NaCl, Coriana showed the highest accumulation (0.54%), followed by Lecciana and Sikitita (0.50% and 0.46%, respectively), while Arbequina maintained the lowest values (0.32%).
The issue distribution revealed clear compartmentalization patterns (Figure S14, Table S18). Under control conditions, the roots presented the highest chloride concentration (0.33%), while other tissues showed considerably lower levels. With increasing salinity, the roots demonstrated the most significant chloride accumulation, reaching a value of 1.10% at 75 mM NaCl. Other tissues showed more moderate increases, with old and new leaves, stems, and wood maintaining relatively similar levels.

3.3.4. Sodium Content and Distribution

Under control conditions, the sodium content showed minimal variation among genotypes (0.21−0.25%), with Coriana and Lecciana displaying slightly higher levels (Figure S15, Table S19). Genotype-specific responses emerged with increasing salinity. At 25 mM NaCl, Coriana accumulated the highest sodium content (0.67%), while Sikitita maintained the lowest level (0.48%). This pattern continued at 50 mM NaCl. By 75 mM NaCl, all the genotypes showed similar high sodium levels (1.03−1.11%), with Coriana maintaining slightly higher accumulation.
Tissue distribution revealed distinct compartmentalization patterns (Figure S16, Table S20). Under control conditions, the roots maintained the highest concentration (0.37%), whereas the new leaves showed the lowest (0.15%). With increasing salinity, the roots consistently accumulated the highest sodium levels, reaching 1.51% at 75 mM NaCl. New leaves showed the second-highest accumulation (1.33%), while wood tissue maintained the lowest levels throughout all the treatments (0.54% at 75 mM NaCl).

3.3.5. Potassium/Sodium Ratio Analysis

Under control conditions, the genotypes showed distinct K+/Na+ ratios, with Arbosana exhibiting the highest values (19.34) and Coriana the lowest (14.07) (Figure S17, Table S21). With increasing salinity, all the genotypes showed progressive decreases in K+/Na+ ratios, maintaining consistent hierarchical patterns. Lecciana demonstrated the best maintenance of K+/Na+ ratios across all salinity levels, while Coriana consistently showed the lowest values. At 75 mM NaCl, the ratios ranged from 2.35 (Lecciana) to 1.09 (Coriana).
The organ-specific K+/Na+ ratios varied significantly (Figure S18, Table S22). Under control conditions, new leaves had the highest ratio (32.72) and wood the lowest (8.21). Salinity reduced the K+/Na+ ratios across all tissues, with the greatest decline in new leaves. At 75 mM NaCl, wood had the highest ratio (2.62), while roots had the lowest (0.78), reflecting altered ion balance under severe stress.

3.3.6. Calcium/Sodium Ratio Analysis

Under control conditions, Sikitita exhibited the highest Ca2+/Na+ ratio (12.53), followed by Arbosana (11.17) and Arbequina (10.69), while Coriana had the lowest (9.87) (Figure S19, Table S23). With increasing salinity, all genotypes experienced progressive decreases in their Ca2+/Na+ ratios. Arbosana showed a strong decrease from 25 mM NaCl (4.49) to 50–75 mM NaCl (2.80 and 2.74, respectively). Sikitita and Lecciana demonstrated the best maintenance of Ca2+/Na+ ratios at 25 and 50 mM NaCl (4.59–5.13 and 3.17–3.67, respectively), followed closely by Coriana. Arbequina consistently exhibited the lowest values, dropping from 3.31 (25 mM NaCl) to 1.87 (75 mM NaCl).
The tissue-specific Ca2+/Na+ ratios varied significantly (Figure S20, Table S24). Under control conditions, new leaves had the highest ratio (18.50), while wood exhibited the lowest (5.73). With increasing salinity, all the tissues experienced reductions, but the roots showed the steepest decline, dropping from 8.81 in the control to 1.36 in the 75 mM NaCl treatment. At 75 mM NaCl, wood maintained the highest ratio (3.68), while roots had the lowest (1.36).

4. Discussion

4.1. Differential Growth and Resource Allocation Under Salinity

Salinity stress fundamentally impacts plant growth. The significant variability in biomass and morphological responses observed among the olive cultivars highlights a range of distinct tolerance strategies [60]. Rather than a uniform reduction in growth, the cultivars demonstrated a clear trade-off in terms of resource allocation, either prioritizing biomass accumulation, vertical growth, or maintenance. For instance, Arbequina sustained its shoot length at the expense of biomass, suggesting a specific tolerance mechanism geared towards maintaining apical growth even when overall productivity is compromised by ionic stress [17,61]. Conversely, Coriana showed a remarkable, albeit temporary, increase in biomass at 50 mM NaCl, indicating a capacity to leverage mild salt conditions, possibly through enhanced nutrient uptake, before succumbing to stress at higher concentrations.
Cultivars such as Arbosana, Lecciana, and Sikitita emerged as more broadly resilient, maintaining relatively stable biomass and growth across a range of salinities. This stability points to more effective and integrated salt-coping mechanisms, including superior water balance, osmotic adjustment, and ionic regulation [60,62]. The enhanced trunk diameter in Arbosana at 75 mM NaCl is particularly noteworthy, potentially indicating a hormetic effect where moderate-to-high stress triggers beneficial physiological responses, a phenomenon observed in some salt-tolerant genotypes [27].
Organ-specific responses further clarified these strategies. Roots consistently bore the brunt of ionic toxicity, showing reduced biomass as Na+ and Cl accumulation disrupted nutrient balance. In contrast, woody tissues and old leaves fulfilled critical buffering roles, with wood acting as a reservoir for sequestering ions and old leaves serving to buffer ionic and osmotic imbalances, thereby protecting younger, more metabolically active tissues [60].

4.2. Physiological Adjustments: Photosynthesis and Stomatal Regulation

The physiological data reveal that the cultivars’ differential growth responses are underpinned by their distinct capacities to protect the photosynthetic machinery and regulate gas exchange. Photosynthetic efficiency, measured via chlorophyll fluorescence, served as a clear indicator of stress. Arbequina and Sikitita exhibited early signs of photosynthetic disruption (photoinhibition) even at mild salinity, as evidenced by declines in PI(abs) and φ(Po), indicating that their photosynthetic apparatus is highly sensitive to the initial osmotic shock and subsequent ionic toxicity [63,64].
In contrast, Arbosana demonstrated superior resilience, maintaining stable photochemical performance and minimal energy dissipation across all salinity levels, marking it as the most photosynthetically robust cultivar [65]. Lecciana and Coriana displayed an intermediate response, preserving photochemical function more effectively than the sensitive cultivars but showing signs of stress at higher salinity. This suggests that while they possess effective protective mechanisms, these can be overwhelmed by severe stress [66].
Stomatal conductance patterns revealed different water-use strategies. Arbequina responded to salinity with rapid and severe stomatal closure, a classic sensitivity response that limits water loss but severely restricts CO2 uptake and photosynthesis [67]. Conversely, the periodic peaks in stomatal conductance observed in the tolerant Arbosana under high salinity suggest a sophisticated adaptive strategy, likely involving the accumulation of compatible solutes to maintain turgor and gas exchange [68,69]. Other cultivars, such as Sikitita and Lecciana, showed an initial decline followed by partial recovery, pointing to a slower, delayed adaptation process involving adjustments in mesophyll conductance and water-use efficiency over time [23,70].
Interestingly, Arbequina demonstrated a remarkable recovery in chlorophyll content (SPAD) at the highest salinity, contrasting with its poor performance in other metrics. This suggests the operation of highly effective chloroplast protection mechanisms that function independently of whole-leaf ion accumulation patterns [61], representing a specific and noteworthy trait of this cultivar.

4.3. Ion Homeostasis as the Core Mechanism of Salt Tolerance

4.3.1. Role of Calcium in Mitigating Sodium Toxicity

Calcium is critical for maintaining membrane integrity and signaling under salt stress, and its regulation was a key differentiator among cultivars [71,72]. With the exception of Arbequina, which displayed impaired calcium homeostasis early on, the other cultivars successfully maintained stable calcium levels even under high salinity. This capacity for calcium homeostasis is strongly correlated with salt tolerance, as it enables the activation of signaling pathways and preserves the structural integrity of root barriers against Na+ influx [73,74]. The distribution within the plant confirmed that old leaves and roots act as primary calcium reservoirs, while vacuolar sequestration across tissues is an essential mechanism for maintaining cytosolic Ca2+ homeostasis under stress [75].

4.3.2. Potassium Accumulation Patterns

Potassium aids in sodium exclusion and osmotic control [76], and its loss results in disrupted metabolism [27] and enzymatic activity [61]. Genotypic variation in potassium homeostasis revealed distinct ion regulatory mechanisms. Under control conditions, Lecciana and Arbequina exhibited enhanced selective transport capacity. However, under increasing salinity doses, Arbequina showed compromised potassium-sodium selectivity; Coriana showed the poorest discrimination; and Lecciana maintained its superior homeostasis, indicating stronger ion selectivity.
The tissue distribution patterns showed roots and new leaves experienced the most significant potassium declines under salinity, while older tissues retained potassium for ionic buffering [65]. Wood tissue showed minimal reductions, suggesting a protective buffering role. At the highest salinity (75 mM NaCl), the roots showed the steepest decline, indicating transport failure due to disrupted K+ homeostasis [76], while the stem and wood tissues showed slight increases, suggesting redistribution for the mitigation of cytosolic ion toxicity [75].

4.3.3. Sodium and Chloride Exclusion as a Primary Defense

A cultivar’s ability to limit the uptake and translocation of Na+ and Cl from the roots to the shoots is a primary determinant of its salt tolerance [77,78]. The results clearly distinguished the cultivars based on this capacity. Lecciana and Arbequina demonstrated the most effective regulation of Na+ and Cl, respectively. Lecciana showed the lowest Na+ concentration at the highest salinity, while Arbequina was uniquely successful in excluding Cl from its tissues. This points to highly efficient exclusion mechanisms at the root level and limited root-to-shoot translocation [79].
In contrast, Coriana consistently accumulated high levels of both ions. Other cultivars, including Arbequina, Sikitita, and Arbosana, also struggled with Na+ accumulation as stress intensified, suggesting that their exclusion mechanisms were overwhelmed at the highest salinity levels [30]. The finding that new leaves contained more Na+ than old leaves at the highest salinity level is particularly significant. It challenges the conventional view of old leaves as terminal sinks for toxic ions and suggests that under severe stress, the plant’s ability to compartmentalize Na+ in older tissues can break down, leading to the contamination of new, photosynthetically active leaves [80]. Roots consistently acted as the primary sink for both Na+ and Cl, physically sequestering the ions to buffer the rest of the plant, a cornerstone of salt tolerance in olive [18,27].

4.3.4. Ionic Ratios as Key Indicators of Tolerance

The K+/Na+ and Ca2+/Na+ ratios serve as crucial indicators of cellular health and ionic selectivity under salinity. A high ratio is essential for preserving membrane potential, enzymatic activity, and signal transduction [81,82]. Lecciana excelled in maintaining the highest K+/Na+ ratio, showcasing its superior ability to selectively uptake K+ over Na+, likely through efficient high-affinity transporters (HAK/KUP/KT family) and ion channel regulation [26,27,83]. Sikitita and Arbosana also demonstrated robust ionic regulation, maintaining K+/Na+ and Ca2+/Na+ ratios indicative of tolerance, with Arbosana showing particularly effective Ca2+/Na+ balance under severe stress. The maintenance of ratios above 2.0 (observed in Arbosana, Lecciana, and Sikitita at 75 mM NaCl) suggests functional SOS (Salt Overly Sensitive) pathway activation, where Ca2+ signals trigger Na+ exclusion mechanisms through the SOS3-SOS2-SOS1 signaling cascade [25,84].
Conversely, the low ratios in Coriana and Arbequina reflect their struggle with ionic toxicity, resulting from a flood of Na+ that overwhelms their capacity for selective uptake and compartmentalization [30]. Across all cultivars, woody tissues consistently maintained the most stable ionic ratios, highlighting their vital role as buffered reservoirs that sequester Na+ and conserve Ca2+ and K+, thereby protecting sensitive photosynthetic tissues from ionic stress [85,86]. This tissue-specific ion partitioning is a fundamental strategy for whole-plant survival under high salinity.

4.4. Genotype Performance Comparison

The analysis of the five olive cultivars under increasing salinity revealed distinct adaptive mechanisms, with each genotype demonstrating parameter-specific strengths and weaknesses.
Arbosana exhibited balanced tolerance across multiple parameters, maintaining superior shoot length and trunk diameter growth under high salinity with remarkable photosynthetic resilience across all fluorimetry parameters. It showed minimal fresh weight reduction compared to control conditions and consistently demonstrated superior biomass performance across all salinity levels. Its stomatal conductance showed unique adaptation patterns, developing significant peaks under high salinity that suggest successful physiological adjustments. While it exhibited moderate ion regulation capacity, its calcium homeostasis remained functional even under stress, and it maintained the second-lowest chloride levels among all the tested genotypes. This multifaceted resilience under salinity stress, particularly its superior photosynthetic stability and growth maintenance, establishes Arbosana as the most balanced performer in this study.
Lecciana demonstrated superior ion regulation mechanisms, maintaining the highest K+/Na+ ratios across all salinity levels and superior trunk diameter development under mild salinity. It showed a remarkable biomass increase at 25 mM NaCl and stable values at higher salinity levels, indicating effective adaptation mechanisms at moderate stress. Its photosynthetic machinery maintained significantly better function at 75 mM NaCl compared to Arbequina and Sikitita, and it accumulated sodium more gradually, showing the lowest Na+ concentration among all the cultivars at 75 mM NaCl. However, it displayed pronounced sensitivity in shoot growth at high salinity. This discrepancy between excellent ionic regulation and compromised shoot growth suggests that while Lecciana possesses superior cellular protection mechanisms, these are insufficient alone to maintain optimal vertical growth under severe stress. This discrepancy likely reflects the substantial energetic costs associated with maintaining ion homeostasis. The ATP requirements for operating H+-ATPases, K+/Na+ antiporters, and other ion transport systems under severe salinity may divert resources from growth-related processes. While Lecciana’s superior K+/Na+ regulation provides cellular protection, the metabolic burden of sustaining these gradients against a 75-fold higher external Na+ concentration appears to compromise carbon allocation to shoot elongation [75].
Sikitita demonstrated moderate tolerance through biomass maintenance across all salinity treatments. It showed effective early exclusion mechanisms at lower salinity levels, maintaining the lowest Na+ accumulation at 25 mM NaCl. Under 50 mM NaCl, it sustained consistently high stomatal conductance, indicative of effective water regulation. However, it exhibited significant sensitivity in photosynthetic parameters at higher salinity, with substantial disruptions across fluorimetry measurements. It also accumulated Cl at significantly higher levels than other cultivars at moderate salinities (25 and 50 mM NaCl), suggesting an increased risk of ion toxicity that may explain its photosynthetic vulnerability. Despite these physiological challenges, its ability to maintain or even increase biomass under stress indicates alternative compensatory mechanisms that warrant further investigation.
Arbequina displayed notable parameter-specific responses, showing effective chloride exclusion across all salinity levels (the lowest Cl contents among all cultivars) and maintaining consistent shoot growth despite biomass sensitivity. This differential response reflects targeted resource allocation, prioritizing vertical growth over total biomass. It demonstrated superior chlorophyll content adaptation and recovery at high salinity, ultimately achieving the strongest SPAD values among all genotypes at 75 mM NaCl. However, it displayed poor Ca2+/Na+ ratios, compromised photosynthetic efficiency under stress, and showed the highest overall sensitivity in biomass reduction (11% at 75 mM NaCl). These contradictory responses (effective chloride exclusion and chlorophyll maintenance despite poor ionic balance and photosynthetic efficiency) suggest specialized adaptation mechanisms that prioritize specific physiological functions at the expense of others.
Coriana exhibited the most variable responses, showing remarkable biomass increases at 50 mM NaCl despite early sensitivity at 25 mM NaCl in shoot growth. It maintained significantly better photochemical function at 75 mM NaCl compared to Arbequina and Sikitita, with particularly high Fv/Fm and ETo/RC values. However, at 75 mM NaCl, it demonstrated poor ion discrimination with the lowest K+/Na+ ratios across all the cultivars and the highest Cl accumulation. It also displayed pronounced trunk diameter reductions under high salinity. This suggests specialized adaptation mechanisms optimized specifically for moderate salinity, with metabolic adjustments that enhance growth at 50 mM NaCl but become ineffective at higher concentrations.
The contrasting tolerance mechanisms observed, from Arbosana’s photosynthetic resilience to Lecciana’s superior ion discrimination, likely reflect the differential expression of stress-responsive gene networks. Transcriptomic studies in olive have revealed cultivar-specific upregulation of ion transporter genes (HKT1, NHX1, SOS1) under salt stress [30,87]. The phenotypic differences observed here may arise from variations in osmolyte biosynthesis pathways, particularly proline synthesis through P5CS (Δ1-pyrroline-5-carboxylate synthetase) and degradation via ProDH (proline dehydrogenase) [88], or differential activation of antioxidant systems including SOD (superoxide dismutase), CAT (catalase), and APX (ascorbate peroxidase) [89]. Such molecular insights would facilitate marker-assisted selection for combining complementary tolerance traits, as demonstrated in recent olive breeding programs [90].

4.5. Genotype-Specific Applications

On the basis of the comprehensive evaluation of cultivar responses to salinity, specific recommendations can be provided for their optimal deployment in different environmental conditions and management systems.
Arbosana is particularly well-suited for areas with moderate to high salinity where consistent production is required despite variable water quality. Its balanced tolerance across most parameters, particularly its photosynthetic stability under stress and superior shoot growth maintenance, makes it valuable in challenging environments where salt levels may fluctuate. The minimal fresh weight reduction at 75 mM NaCl suggests a robust capacity to maintain productivity under saline conditions. Management practices should emphasize appropriate irrigation scheduling to optimize its performance, as it demonstrated treatment-specific stomatal conductance responses with beneficial peaks under high salinity. Its moderate ion discrimination capacity suggests that standard potassium fertilization regimes would be adequate to support its salt tolerance mechanisms.
Lecciana is recommended for areas with persistent salinity issues where ion balance is critical. Its superior potassium retention and superior K+/Na+ ratios across all salinity levels, combined with the lowest Na+ concentration at 75 mM NaCl, suggest a reduced need for potassium fertilization compared to other cultivars. It performed exceptionally well at 25 mM NaCl, showing a biomass increase and the highest trunk diameter development, making it ideal for mildly saline conditions. Management should focus on supporting shoot growth through balanced fertilization programs, as vertical growth is its primary limitation at high salinity despite excellent ionic regulation. This cultivar would be particularly valuable in breeding programs targeting salt tolerance mechanisms based on superior ion discrimination.
Sikitita shows promise for areas with moderate salinity where biomass maintenance is a priority. However, its photosynthetic sensitivity and significant chloride accumulation at moderate salinity levels (25 and 50 mM NaCl) suggest potential long-term productivity challenges in highly saline environments. Irrigation management should aim to optimize gas exchange conditions, potentially through more frequent but lighter irrigation events to minimize chloride accumulation in the root zone. Its intermediate K+/Na+ ratios suggest that moderate potassium supplementation would be beneficial in supporting its tolerance mechanisms.
Arbequina may be particularly suitable for areas with chloride-dominated soils due to its effective chloride exclusion mechanisms across all salinity levels, which are the lowest among all tested genotypes. Its consistent shoot growth across salinity levels indicates resilience in maintaining vertical development even under stress. Its remarkable chlorophyll content adaptation at high salinity, achieving the strongest final SPAD values among all the genotypes, suggests maintained photosynthetic potential despite stressed conditions. However, its biomass reductions and poor Ca2+/Na+ balance indicate that caution is needed in sodium-rich environments. Management should focus on potassium and calcium fertilization to counterbalance sodium uptake, potentially through foliar applications to bypass root uptake limitations.
Coriana may be suitable for specific applications at moderate salinity (around 50 mM NaCl), where a unique increase in biomass was observed. Its specialized adaptation to this specific salinity level, combined with maintained photochemical function even at higher salinity, suggests that it could be valuable in environments with stable, moderate salinity. However, its poor ion discrimination (lowest K+/Na+ ratios) and high chloride accumulation at 75 mM NaCl necessitate careful fertilization regimes with an emphasis on potassium and calcium supplementation to mitigate ion imbalances.
The diverse salinity responses observed among novel cultivars can be partially understood through their parentage. Lecciana (Arbosana × Leccino) inherited exceptional K+/Na+ regulation capacity, likely from Leccino’s reported Na+ exclusion mechanisms. However, its pronounced shoot growth sensitivity contrasts with Arbosana’s superior growth maintenance, indicating independent genetic control of ion homeostasis versus growth resilience.
Sikitita (Picual × Arbequina) demonstrated transgressive segregation for biomass maintenance, showing an increase at 75 mM NaCl despite both parents’ salt sensitivity. This suggests favorable gene combinations or heterotic effects, though high Cl accumulation indicates inheritance of poor anion exclusion from both parents.
Coriana (Arbosana × Koroneiki) exhibited specialized adaptations to moderate salinity (50 mM NaCl), potentially derived from Koroneiki’s Mediterranean adaptation. However, poor ion discrimination at high salinity suggests incomplete inheritance of Arbosana’s broader stress resilience.
These patterns reveal that: (i) beneficial parental traits are not always transmitted to progeny, (ii) transgressive segregation can enhance specific tolerance parameters, (iii) ion regulation and growth performance appear under independent genetic control, and (iv) cultivar-specific salinity optima suggest potential for targeted variety development. These findings emphasize comprehensive phenotyping across multiple traits, as progeny performance cannot be predicted from parental characteristics alone.

4.6. Study Limitations and Future Research

While this study provides valuable insights into salinity tolerance mechanisms in olive cultivars, several limitations should be acknowledged. Despite rigorous control, greenhouse conditions cannot fully replicate field conditions where multiple environmental stressors interact with salinity. The five-month duration of the experiment, though longer than many comparable studies, might not capture long-term adaptation mechanisms that perennial crops like olive trees develop over multiple growing seasons. Additionally, the study focused primarily on vegetative growth parameters without addressing reproductive development, fruit quality, or oil composition—critical aspects for commercial olive production. The relatively low number of biological replicates (n = 4 per cultivar × treatment), while consistent with similar published studies, may have limited the detection of subtle higher-order interactions. Future studies would benefit from increased replication to enhance statistical power and generalizability.
Future research should address these limitations through several approaches. Long-term field trials in naturally saline areas would validate the observed tolerance mechanisms under authentic conditions and across multiple seasons, providing insights into cumulative effects and potential acclimation processes. An investigation of reproductive parameters, including flowering behavior, fruit set, yield stability, and oil quality under salinity stress, would provide valuable commercial information beyond vegetative tolerance.
Molecular analyses should comprehensively investigate the genetic and biochemical mechanisms underlying the observed physiological responses. Transcriptomic profiling could reveal cultivar-specific expression patterns of key salt tolerance genes, including ion transporters (HKT1 for Na+ exclusion, the NHX family for vacuolar sequestration, and SOS1 for Na+ efflux), K+ channels (HAK/KUP/KT family and AKT1), and Ca2+ transporters (CAX and ACA families). Proteomic analyses should examine the differential abundance of osmolyte biosynthesis enzymes, particularly P5CS (Δ1-pyrroline-5-carboxylate synthetase), which is involved in proline synthesis, ProDH (proline dehydrogenase), which is involved in proline catabolism, and antioxidant enzymes (SOD, CAT, APX, GR), which mitigate oxidative stress.
Metabolomic approaches could be used to quantify stress-responsive metabolites, including compatible solutes (proline, glycine betaine, trehalose), polyamines, and phenolic compounds that contribute to osmotic adjustment and ROS scavenging. Integration of these multi-omics datasets through systems biology approaches would provide a holistic understanding of the regulatory networks governing salt tolerance, potentially identifying key transcription factors (DREB, MYB, and WRKY families) and epigenetic modifications that coordinate stress responses. Such comprehensive molecular characterization would facilitate the development of molecular markers for marker-assisted selection, enabling the pyramiding of complementary tolerance mechanisms identified in this study (e.g., combining Arbosana’s photosynthetic resilience with Lecciana’s ion discrimination) into elite cultivars adapted to saline environments.
Root architecture studies would enhance our understanding of below-ground adaptations to salinity, particularly given the observed importance of roots in ion sequestration. An examination of interactions between salinity and other environmental factors, such as drought, heat stress, and soil texture, would better reflect real-world conditions where multiple stressors co-occur. Economic analyses of cultivar selection under saline conditions would benefit growers transitioning to salt-affected areas or dealing with degrading water quality, helping to quantify the trade-offs between tolerance traits and productive potential.

5. Conclusions

This study demonstrated that salt tolerance in olive cultivars involves multiple, independent physiological mechanisms rather than a single adaptive strategy. Among the five cultivars evaluated, Arbosana emerged as the most balanced performer, combining minimal biomass loss with stable photosynthetic performance and moderate ion regulation. Lecciana maintained superior K+/Na+ selectivity across all salinity levels but at the cost of reduced shoot growth under severe stress. Sikitita sustained biomass despite photosynthetic impairment, Arbequina efficiently excluded Cl but showed high biomass sensitivity, and Coriana demonstrated specialized adaptation to moderate salinity with poor ion discrimination at high salt concentrations.
The complementary traits of Arbosana’s vegetative resilience and Lecciana’s efficient K+/Na+ regulation represent valuable genetic resources for pre-breeding programs. These distinct tolerance mechanisms could potentially be combined through targeted breeding approaches to develop cultivars with enhanced overall salinity resilience.
For immediate SHD deployment, Arbosana is recommended for variable or high salinity environments, while cultivar-specific responses should guide selection based on local salinity profiles and production priorities. However, these recommendations remain provisional pending validation through long-term field trials that include assessments of reproductive performance and oil quality parameters.
This work provides the first comprehensive physiological and ionomic characterization of novel SHD olive cultivars under salinity stress, establishing a foundation for developing next-generation cultivars combining multiple tolerance mechanisms for sustainable production in increasingly saline environments.

Supplementary Materials

The following supporting information can be downloaded at: https://www.mdpi.com/article/10.3390/horticulturae11080957/s1, Figure S1: Boxplot for total plant fresh weight as a function of the genotype × treatment interaction; Figure S2: Boxplot for fresh weight as a function of the treatment × organ interaction; Figure S3: Boxplot for total plant dry weight as a function of the genotype × treatment interaction; Figure S4: Boxplot for dry weight as a function of the treatment × organ interaction; Figure S5: Spline representation of shoot lengths for each genotype as a function of treatment and date; Figure S6: Spline representation of trunk diameter for each genotype as a function of treatment and date; Figure S7: Spline representation of stomatal conductance for each genotype as a function of treatment and date; Figure S8: Spline representation of SPAD data for each genotype as a function of treatment and date; Figure S9: Boxplot for calcium as a function of the genotype × treatment interaction; Figure S10: Boxplot for calcium as a function of the treatment × organ interaction; Figure S11: Boxplot for potassium as a function of the genotype × treatment interaction; Figure S12: Boxplot for potassium as a function of the treatment × organ interaction; Figure S13: Boxplot for chloride as a function of the genotype × treatment interaction; Figure S14: Boxplot for chloride as a function of the treatment × organ interaction; Figure S15: Boxplot for sodium as a function of the genotype × treatment interaction; Figure S16: Boxplot for sodium as a function of the treatment × organ interaction; Figure S17: Boxplot for potassium/sodium ratio as a function of the genotype × treatment interaction; Figure S18: Boxplot for the potassium/sodium ratio as a function of the treatment × organ interaction; Figure S19: Boxplot for calcium/sodium ratio as a function of the genotype × treatment interaction; Figure S20: Boxplot for the calcium/sodium ratio as a function of the treatment × organ interaction; Table S1: Effect sizes; Table S2: Descriptive statistics and robustness analysis of ion concentrations, biomass parameters, and ion ratios; Table S3: Robust comparisons of the group p-values of each of the factors along with their interactions; Table S4: Statistical data for total plant fresh weight as a function of the genotype × treatment interaction; Table S5: Statistical data for fresh weight as a function of the treatment × organ interaction; Table S6: Statistical data for total plant dry weight as a function of the genotype × treatment interaction; Table S7: Statistical data for fresh weight as a function of the treatment × organ interaction; Table S8: Spline data for the effects of genotype and treatment combinations on shoot length; Table S9: Spline data for the effects of genotype and treatment combinations on trunk diameter; Table S10: Descriptive statistics of fluorimeter measurements; Table S11: Spline data for the effects of genotype and treatment combinations on stomatal conductance; Table S12: Spline data for the effects of genotype and treatment combinations on SPAD values; Table S13: Statistical data for calcium as a function of the genotype × treatment interaction; Table S14: Statistical data for calcium as a function of the treatment × organ interaction; Table S15: Statistical data for potassium as a function of the genotype × treatment interaction; Table S16: Statistical data for potassium as a function of the treatment × organ interaction; Table S17: Statistical data for chloride as a function of the genotype × treatment interaction; Table S18: Statistical data for chloride as a function of the treatment × organ interaction; Table S19: Statistical data for sodium as a function of the genotype × treatment interaction; Table S20: Statistical data for sodium as a function of the treatment × organ interaction; Table S21: Statistical data for the potassium/sodium ratio as a function of the genotype × treatment interaction; Table S22: Statistical data for the potassium/sodium ratio as a function of the treatment × organ interaction; Table S23: Statistical data for the calcium/sodium ratio as a function of the genotype × treatment interaction; Table S24: Statistical data for the calcium/sodium ratio as a function of the treatment × organ interaction.

Author Contributions

Conceptualization, X.R.-G., J.C.-G. and P.M.-R.; methodology, M.V.-M., J.C.-G., L.A.-R. and P.M.-R.; software, L.A.-R.; validation, J.C.-G.; formal analysis, M.V.-M., J.C.-G., L.A.-R. and P.M.-R.; investigation, X.R.-G., M.V.-M. and J.C.-G.; resources, X.R.-G.; data curation, L.A.-R.; writing—original draft preparation, X.R.-G., M.V.-M., J.C.-G., L.A.-R. and P.M.-R.; writing—review and editing, X.R.-G. and P.M.-R.; visualization, X.R.-G. and L.A.-R.; supervision, M.V.-M. and J.C.-G. All authors have read and agreed to the published version of the manuscript.

Funding

This research received no external funding.

Data Availability Statement

All data supporting the findings of this study are available within the paper and its Supplementary Information. Should any raw data files be needed in another format, they are available from the corresponding author upon reasonable request.

Conflicts of Interest

Author Xavier Rius-Garcia was employed by the company Agromillora Group. All authors declare that they have no known competing financial interests or personal relationships that could have appeared to influence the work reported in this paper.

Abbreviations

The following abbreviations are used in this manuscript:
AASatomic absorption spectrometry
ACAautoinhibited Ca2+-ATPase
AICAkaike information criterion
AKTArabidopsis K+ transporter
ANOVAanalysis of variance
APXascorbate peroxidase
BICBayesian information criterion
CATcatalase
CAXcation/H+ exchanger
CIconfidence interval
CVcoefficient of variation
DIo/CSoenergy dissipated per cross-section
DIo/RCenergy dissipated per reaction center
DREBdehydration-responsive element-binding
ECelectrical conductivity
ETo/RCelectron transport rate per reaction center
F0initial fluorescence
Fmmaximum fluorescence
Fvvariable fluorescence
Fv/Fmmaximum quantum yield of PSII
Fv/F0variable to initial fluorescence ratio
F0/Fminitial to maximum fluorescence ratio
GRglutathione reductase
HAKhigh-affinity K+ transporter
HKThigh-affinity K+ transporter
KTK+ transporter
KUPK+ uptake permease
MYBmyeloblastosis
Nturnover number
NHXNa+/H+ exchanger
OJIPchlorophyll fluorescence transient phases
P5CSΔ1-pyrroline-5-carboxylate synthetase
PI(abs)performance index on absorption basis
ProDHproline dehydrogenase
PSIIphotosystem II
pXRFportable X-ray fluorescence
QAprimary quinone electron acceptor
REo/RCelectron transport rate beyond QA per reaction center
ROSreactive oxygen species
SARsodium absorption ratio
SDstandard deviation
SEstandard error
SHDsuper-high-density
Smnormalized total complementary area
SODsuperoxide dismutase
SOSsalt overly sensitive
SPADsoil-plant analysis development
SWShapiro-Wilk test
Vjrelative variable fluorescence at J-step
WRKYWRKY transcription factor family
φ(Po)maximum quantum yield of primary photochemistry
ψ(Eo)efficiency of electron movement into the electron transport chain

References

  1. Vilar, J.; Hernández, M.L.; Pereira, J.A.; Hoyo, R. International Olive Growing: Worldwide Analysis and Summary; Fundación Caja Rural Jaén: Jaén, Spain, 2018; p. 153. [Google Scholar]
  2. Camposeo, S.; Vivaldi, G.A.; Russo, G.; Melucci, F.M. Intensification in olive growing reduces global warming potential under both integrated and organic farming. Sustainability 2022, 14, 6389. [Google Scholar] [CrossRef]
  3. Sobreiro, J.; Patanita, M.I.; Patanita, M.; Tomaz, A. Sustainability of high-density olive orchards: Hints for irrigation management and agroecological approaches. Water 2023, 15, 2486. [Google Scholar] [CrossRef]
  4. Lo Bianco, R.; Proietti, P.; Regni, L.; Caruso, T. Planting systems for modern olive growing: Strengths and weaknesses. Agriculture 2021, 11, 494. [Google Scholar] [CrossRef]
  5. DeAndreis, P. One-Third of Global Olive Oil Production Comes from Intensive Farming. Available online: https://www.oliveoiltimes.com/production/one-third-of-global-olive-oil-production-comes-from-intensive-farming/112809 (accessed on 8 August 2025).
  6. Shokri, N.; Hassani, A.; Sahimi, M. Multi-scale soil salinization dynamics from global to pore scale: A review. Rev. Geophys. 2024, 62, e2023RG000804. [Google Scholar] [CrossRef]
  7. Shokri, N.; Hassani, A.; Sahimi, M. Soil salinization: A rising threat to ecosystems and global food security. Eos 2024, 105. [Google Scholar] [CrossRef]
  8. Singh, A. Soil salinity: A global threat to sustainable development. Soil Use Manag. 2021, 38, 39–67. [Google Scholar] [CrossRef]
  9. FAO. Global Status of Salt-Affected Soils; FAO: Rome, Italy, 2024; p. 240. [Google Scholar] [CrossRef]
  10. Chartzoulakis, K.S. Salinity and olive: Growth, salt tolerance, photosynthesis and yield. Agric. Water Manag. 2005, 78, 108–121. [Google Scholar] [CrossRef]
  11. Jung, E.; Park, N.; Park, J. Composite modeling for evaluation of groundwater and soil salinization on the multiple reclaimed land due to sea-level rise. Transp. Porous Media 2020, 136, 271–293. [Google Scholar] [CrossRef]
  12. Carr, M.K.V. The water relations and irrigation requirements of olive (Olea europaea L.): A review. Exp. Agric. 2013, 49, 597–639. [Google Scholar] [CrossRef]
  13. Hoque, M.N.; Imran, S.; Hannan, A.; Paul, N.C.; Mahamud, M.A.; Chakrobortty, J.; Sarker, P.; Irin, I.J.; Brestic, M.; Rhaman, M.S. Organic amendments for mitigation of salinity stress in plants: A review. Life 2022, 12, 1632. [Google Scholar] [CrossRef] [PubMed]
  14. Khademi, F.; Ghasemnezhad, M.; Salehi, M.M.; Seyedi, A. Evaluation of salinity tolerance in three Olea europaea L. cultivars. Russ. J. Plant Physiol. 2023, 70, 85. [Google Scholar] [CrossRef]
  15. Grieve, C.M.; Grattan, S.R.; Maas, E.V. Plant salt tolerance. In Agricultural Salinity Assessment and Management, 2nd ed.; Wallender, W.W., Tanji, K.K., Eds.; American Society of Civil Engineers: Reston, VA, USA, 2011; pp. 405–459. [Google Scholar] [CrossRef]
  16. Maas, E.V.; Hoffman, G.J. Crop salt tolerance—Current assessment. J. Irrig. Drain. Div. 1977, 103, 115–134. [Google Scholar] [CrossRef]
  17. Kchaou, H.; Larbi, A.; Gargouri, K.; Chaieb, M.; Morales, F.; Msallem, M. Assessment of tolerance to NaCl salinity of five olive cultivars, based on growth characteristics and Na+ and Cl exclusion mechanisms. Sci. Hortic. 2010, 124, 306–315. [Google Scholar] [CrossRef]
  18. Soda, N.; Ephrath, J.E.; Dag, A.; Beiersdorf, I.; Presnov, E.; Yermiyahu, U.; Ben-Gal, A. Root growth dynamics of olive (Olea europaea L.) affected by irrigation induced salinity. Plant Soil 2016, 411, 305–318. [Google Scholar] [CrossRef]
  19. Tabatabaei, S.J. Effects of salinity and N on the growth, photosynthesis and N status of olive (Olea europaea L.) trees. Sci. Hortic. 2006, 108, 432–438. [Google Scholar] [CrossRef]
  20. Tabatabaei, S. Salinity stress and olive: An overview. Plant Stress 2007, 1, 105–112. [Google Scholar]
  21. Bracci, T.; Minnocci, A.; Sebastiani, L. In vitro olive (Olea europaea L.) cvs Frantoio and Moraiolo microshoot tolerance to NaCl. Plant Biosyst.—Int. J. Deal. All Asp. Plant Biol. 2008, 142, 563–571. [Google Scholar] [CrossRef]
  22. Karimi, S.; Rahemi, M.; Zeinanloo, A.A. Ion compartmentalization determines salinity tolerance in olive cultivars. Erwerbs-Obstbau 2023, 65, 2527–2536. [Google Scholar] [CrossRef]
  23. Chartzoulakis, K.; Loupassaki, M.; Bertaki, M.; Androulakis, I. Effects of NaCl salinity on growth, ion content and CO2 assimilation rate of six olive cultivars. Sci. Hortic. 2002, 96, 235–247. [Google Scholar] [CrossRef]
  24. Claros, M.G.; Bullones, A.; Castro, A.J.; Lima-Cabello, E.; Viruel, M.Á.; Suárez, M.F.; Romero-Aranda, R.; Fernández-Pozo, N.; Veredas, F.J.; Belver, A.; et al. Multi-omic advances in olive tree (Olea europaea subsp. europaea L.) under salinity: Stepping towards ‘smart oliviculture’. Biology 2025, 14, 287. [Google Scholar] [CrossRef]
  25. Ji, H.; Pardo, J.M.; Batelli, G.; Van Oosten, M.J.; Bressan, R.A.; Li, X. The Salt Overly Sensitive (SOS) pathway: Established and emerging roles. Mol. Plant 2013, 6, 275–286. [Google Scholar] [CrossRef] [PubMed]
  26. Assaha, D.V.M.; Ueda, A.; Saneoka, H.; Al-Yahyai, R.; Yaish, M.W. The role of Na+ and K+ transporters in salt stress adaptation in glycophytes. Front. Physiol. 2017, 8, 509. [Google Scholar] [CrossRef] [PubMed]
  27. Regni, L.; Del Pino, A.M.; Mousavi, S.; Palmerini, C.A.; Baldoni, L.; Mariotti, R.; Mairech, H.; Gardi, T.; D’Amato, R.; Proietti, P. Behavior of four olive cultivars during salt stress. Front. Plant Sci. 2019, 10, 867. [Google Scholar] [CrossRef] [PubMed]
  28. El Yamani, M.; Cordovilla, M.d.P. Tolerance mechanisms of olive tree (Olea europaea) under saline conditions. Plants 2024, 13, 2094. [Google Scholar] [CrossRef]
  29. Boussadia, O.; Zgallai, H.; Mzid, N.; Zaabar, R.; Braham, M.; Doupis, G.; Koubouris, G. Physiological responses of two olive cultivars to salt stress. Plants 2023, 12, 1926. [Google Scholar] [CrossRef]
  30. Mousavi, S.; Regni, L.; Bocchini, M.; Mariotti, R.; Cultrera, N.G.M.; Mancuso, S.; Googlani, J.; Chakerolhosseini, M.R.; Guerrero, C.; Albertini, E.; et al. Physiological, epigenetic and genetic regulation in some olive cultivars under salt stress. Sci. Rep. 2019, 9, 1093. [Google Scholar] [CrossRef]
  31. Ayaz, M.; Varol, N.; Yolcu, S.; Pelvan, A.; Kaya, Ü.; Aydoğdu, E.; Bor, M.; Özdemir, F.; Türkan, İ. Three (Turkish) olive cultivars display contrasting salt stress-coping mechanisms under high salinity. Trees 2021, 35, 1283–1298. [Google Scholar] [CrossRef]
  32. Hoagland, D.R.; Arnon, D.I. The Water-Culture Method for Growing Plants Without Soil; College of Agriculture, University of California; California Agricultural Experiment Station: Berkeley, CA, USA, 1950; p. 31. [Google Scholar]
  33. Perica, S.; Goreta, S.; Selak, G.V. Growth, biomass allocation and leaf ion concentration of seven olive (Olea europaea L.) cultivars under increased salinity. Sci. Hortic. 2008, 117, 123–129. [Google Scholar] [CrossRef]
  34. Sapkota, Y.; McDonald, L.M.; Griggs, T.C.; Basden, T.J.; Drake, B.L. Portable x-ray fluorescence spectroscopy for rapid and cost-effective determination of elemental composition of ground forage. Front. Plant Sci. 2019, 10, 317. [Google Scholar] [CrossRef]
  35. Antonangelo, J.; Zhang, H. Soil and plant nutrient analysis with a portable XRF probe using a single calibration. Agronomy 2021, 11, 2118. [Google Scholar] [CrossRef]
  36. Towett, E.K.; Shepherd, K.D.; Lee Drake, B. Plant elemental composition and portable X-ray fluorescence (pXRF) spectroscopy: Quantification under different analytical parameters. X-Ray Spectrom. 2016, 45, 117–124. [Google Scholar] [CrossRef]
  37. McGladdery, C.; Weindorf, D.C.; Chakraborty, S.; Li, B.; Paulette, L.; Podar, D.; Pearson, D.; Kusi, N.Y.O.; Duda, B. Elemental assessment of vegetation via portable X-ray fluorescence (pXRF) spectrometry. J. Environ. Manag. 2018, 210, 210–225. [Google Scholar] [CrossRef]
  38. Singh, V.K.; Sharma, N.; Singh, V.K. Application of X-ray fluorescence spectrometry in plant science: Solutions, threats, and opportunities. X-Ray Spectrom. 2021, 51, 304–327. [Google Scholar] [CrossRef]
  39. Jones, J.B.; Case, V.W. Sampling, handling, and analyzing plant tissue samples. In Soil testing and Plant Analysis, 3rd ed.; Westerman, R.L., Ed.; Soil Science Society of America: Madison, WI, USA, 2018; Volume 3, pp. 389–427. [Google Scholar]
  40. Kalra, Y. Handbook of Reference Methods for Plant Analysis; CRC Press: Boca Raton, FL, USA, 1997; p. 320. [Google Scholar] [CrossRef]
  41. Kalaji, H.M.; Schansker, G.; Ladle, R.J.; Goltsev, V.; Bosa, K.; Allakhverdiev, S.I.; Brestic, M.; Bussotti, F.; Calatayud, A.; Dąbrowski, P.; et al. Frequently asked questions about in vivo chlorophyll fluorescence: Practical issues. Photosynth. Res. 2014, 122, 121–158. [Google Scholar] [CrossRef]
  42. Stirbet, A.; Govindjee. On the relation between the Kautsky effect (chlorophyll a fluorescence induction) and Photosystem II: Basics and applications of the OJIP fluorescence transient. J. Photochem. Photobiol. B Biol. 2011, 104, 236–257. [Google Scholar] [CrossRef]
  43. Strasser, R.J.; Tsimilli-Michael, M.; Srivastava, A. Analysis of the chlorophyll a fluorescence transient. In Chlorophyll a Fluorescence: A Signature of Photosynthesis; Papageorgiou, G.C., Govindjee, Eds.; Springer: Dordrecht, The Netherlands, 2004; pp. 321–362. [Google Scholar] [CrossRef]
  44. R Core Team. R: A Language and Environment for Statistical Computing; R Foundation for Statistical Computing: Vienna, Austria, 2021. [Google Scholar]
  45. Lilliefors, H.W. On the Kolmogorov-Smirnov test for normality with mean and variance unknown. J. Am. Stat. Assoc. 1967, 62, 399–402. [Google Scholar] [CrossRef]
  46. Shapiro, S.S.; Wilk, M.B. An analysis of variance test for normality (complete samples). Biometrika 1965, 52, 591–611. [Google Scholar] [CrossRef]
  47. Brown, M.B.; Forsythe, A.B. Robust tests for the equality of variances. J. Am. Stat. Assoc. 1974, 69, 364. [Google Scholar] [CrossRef]
  48. Kruskal, W.H.; Wallis, W.A. Use of ranks in one-criterion variance analysis. J. Am. Stat. Assoc. 1952, 47, 583–621. [Google Scholar] [CrossRef]
  49. Wilcox, R.R. Introduction to Robust Estimation and Hypothesis Testing, 5th ed.; Academic Press: London, UK, 2021. [Google Scholar]
  50. Welch, B.L. On the comparison of several mean values: An alternative approach. Biometrika 1951, 38, 330–336. [Google Scholar] [CrossRef]
  51. Mond, C.E.D.; Lenth, R.V. A robust confidence interval for location. Technometrics 1987, 29, 211. [Google Scholar] [CrossRef]
  52. Wilcox, R.R.; Tian, T.S. Measuring effect size: A robust heteroscedastic approach for two or more groups. J. Appl. Stat. 2011, 38, 1359–1368. [Google Scholar] [CrossRef]
  53. Harrell, F.E. Regression Modeling Strategies. With Applications to Linear Models, Logistic and Ordinal Regression, and Survival Analysis, 2nd ed.; Springer: New York, NY, USA, 2015; p. 582. [Google Scholar] [CrossRef]
  54. Friedman, J.H. Multivariate adaptive regression splines. Ann. Stat. 1991, 19, 1–67. [Google Scholar] [CrossRef]
  55. Durrleman, S.; Simon, R. Flexible regression models with cubic splines. Stat. Med. 2006, 8, 551–561. [Google Scholar] [CrossRef]
  56. Krzanowski, W.J. An Introduction to Statistical Modelling; Wiley: London, UK, 2010; p. 272. [Google Scholar]
  57. Akaike, H. Information theory and an extension of the maximum likelihood principle. In Selected Papers of Hirotugu Akaike; Parzen, E., Tanabe, K., Kitagawa, G., Eds.; Springer: New York, NY, USA, 1998; pp. 199–213. [Google Scholar] [CrossRef]
  58. Schwarz, G. Estimating the dimension of a model. Ann. Stat. 1978, 6, 461–464. [Google Scholar] [CrossRef]
  59. Chen, J.; Chen, Z. Extended Bayesian information criteria for model selection with large model spaces. Biometrika 2008, 95, 759–771. [Google Scholar] [CrossRef]
  60. Khoshgoftarmanesh, A.H.; Naeini, M.R. Salinity effect on concentration, uptake, and relative translocation of mineral nutrients in four olive cultivars. J. Plant Nutr. 2008, 31, 1243–1256. [Google Scholar] [CrossRef]
  61. Azimi, M.; Khoshzaman, T.; Taheri, M.; Dadras, A. Evaluation of salinity tolerance of three olive (Olea europaea L.) cultivars. J. Cent. Eur. Agric. 2021, 22, 571–581. [Google Scholar] [CrossRef]
  62. Rahemi, M.; Karimi, S.; Sedaghat, S.; Rostami, A.A. Physiological responses of olive cultivars to salinity stress. Adv. Hortic. Sci. 2017, 31, 53–60. [Google Scholar] [CrossRef]
  63. Tadić, J.; Dumičić, G.; Veršić Bratinčević, M.; Vitko, S.; Radić Brkanac, S. Physiological and biochemical response of wild olive (Olea europaea subsp. europaea var. sylvestris) to salinity. Front. Plant Sci. 2021, 12, 712005. [Google Scholar] [CrossRef]
  64. Baker, N.R. Chlorophyll fluorescence: A probe of photosynthesis in vivo. Annu. Rev. Plant Biol. 2008, 59, 89–113. [Google Scholar] [CrossRef] [PubMed]
  65. Acosta-Motos, J.; Ortuño, M.; Bernal-Vicente, A.; Diaz-Vivancos, P.; Sanchez-Blanco, M.; Hernandez, J. Plant responses to salt stress: Adaptive mechanisms. Agronomy 2017, 7, 18. [Google Scholar] [CrossRef]
  66. Kalaji, H.M.; Jajoo, A.; Oukarroum, A.; Brestic, M.; Zivcak, M.; Samborska, I.A.; Cetner, M.D.; Łukasik, I.; Goltsev, V.; Ladle, R.J. Chlorophyll a fluorescence as a tool to monitor physiological status of plants under abiotic stress conditions. Acta Physiol. Plant. 2016, 38, 102. [Google Scholar] [CrossRef]
  67. Ashraf, M.; Harris, P.J.C. Photosynthesis under stressful environments: An overview. Photosynthetica 2013, 51, 163–190. [Google Scholar] [CrossRef]
  68. Ben Ahmed, C.; Ben Rouina, B.; Boukhris, M. Changes in water relations, photosynthetic activity and proline accumulation in one-year-old olive trees (Olea europaea L. cv. Chemlali) in response to NaCl salinity. Acta Physiol. Plant. 2008, 30, 553–560. [Google Scholar] [CrossRef]
  69. Ben Abdallah, M.; Trupiano, D.; Polzella, A.; De Zio, E.; Sassi, M.; Scaloni, A.; Zarrouk, M.; Ben Youssef, N.; Scippa, G.S. Unraveling physiological, biochemical and molecular mechanisms involved in olive (Olea europaea L. cv. Chétoui) tolerance to drought and salt stresses. J. Plant Physiol. 2018, 220, 83–95. [Google Scholar] [CrossRef]
  70. Flexas, J.; Barbour, M.M.; Brendel, O.; Cabrera, H.M.; Carriquí, M.; Díaz-Espejo, A.; Douthe, C.; Dreyer, E.; Ferrio, J.P.; Gago, J.; et al. Mesophyll diffusion conductance to CO2: An unappreciated central player in photosynthesis. Plant Sci. 2012, 193–194, 70–84. [Google Scholar] [CrossRef]
  71. White, P.J.; Broadley, M.R. Calcium in plants. Ann. Bot. 2003, 92, 487–511. [Google Scholar] [CrossRef]
  72. Tan, J.; Ben-Gal, A.; Shtein, I.; Bustan, A.; Dag, A.; Erel, R. Root structural plasticity enhances salt tolerance in mature olives. Environ. Exp. Bot. 2020, 179, 104224. [Google Scholar] [CrossRef]
  73. Melgar, J.C.; Mohamed, Y.; Serrano, N.; García-Galavís, P.A.; Navarro, C.; Parra, M.A.; Benlloch, M.; Fernández-Escobar, R. Long term responses of olive trees to salinity. Agric. Water Manag. 2009, 96, 1105–1113. [Google Scholar] [CrossRef]
  74. Bsoul, E.Y.; Shahrestani, S.A.; Shdiefat, S.M. Growth, nutrient acquisition, and physiological responses of three olive cultivars to induced salt stress. J. Plant Nutr. 2017, 40, 1955–1968. [Google Scholar] [CrossRef]
  75. Mansour, M.M.F. Role of vacuolar membrane transport systems in plant salinity tolerance. J. Plant Growth Regul. 2022, 42, 1364–1401. [Google Scholar] [CrossRef]
  76. Shabala, S.; Pottosin, I. Regulation of potassium transport in plants under hostile conditions: Implications for abiotic and biotic stress tolerance. Physiol. Plant. 2014, 151, 257–279. [Google Scholar] [CrossRef]
  77. Kchaou, H.; Larbi, A.; Chaieb, M.; Sagardoy, R.; Msallem, M.; Morales, F. Genotypic differentiation in the stomatal response to salinity and contrasting photosynthetic and photoprotection responses in five olive (Olea europaea L.) cultivars. Sci. Hortic. 2013, 160, 129–138. [Google Scholar] [CrossRef]
  78. Hagagg, L.F.; Abd El-Migeed, M.M.M.; Shahin, M.F.M.; Mustafa, N.S.; El-Hady, E.S. Response of some olive cultivars to different salinity levels under shade house conditions. Middle East J. Appl. Sci. 2022, 12, 212–219. [Google Scholar] [CrossRef]
  79. Hasegawa, P.M.; Bressan, R.A.; Zhu, J.-K.; Bohnert, H.J. Plant cellular and molecular responses to high salinity. Annu. Rev. Plant Physiol. Plant Mol. Biol. 2000, 51, 463–499. [Google Scholar] [CrossRef] [PubMed]
  80. Ahmad, R.; Anjum, M.A. Physiological and molecular basis of salinity tolerance in fruit crops. In Fruit Crops: Diagnosis and Management of Nutrient Constraints; Srivastava, A.K., Hu, C., Eds.; Elsevier: Amsterdam, The Netherlands, 2020; pp. 445–464. [Google Scholar] [CrossRef]
  81. Shabala, S.; Cuin, T.A. Potassium transport and plant salt tolerance. Physiol. Plant. 2008, 133, 651–669. [Google Scholar] [CrossRef]
  82. Tester, M. Na+ tolerance and Na+ transport in higher plants. Ann. Bot. 2003, 91, 503–527. [Google Scholar] [CrossRef]
  83. Isayenkov, S.V.; Maathuis, F.J.M. Plant salinity stress: Many unanswered questions remain. Front. Plant Sci. 2019, 10, 80. [Google Scholar] [CrossRef] [PubMed]
  84. Zhu, J.-K. Regulation of ion homeostasis under salt stress. Curr. Opin. Plant Biol. 2003, 6, 441–445. [Google Scholar] [CrossRef]
  85. Sodini, M.; Astolfi, S.; Francini, A.; Sebastiani, L.; Qian, S. Multiple linear regression and linear mixed models identify novel traits of salinity tolerance in Olea europaea L. Tree Physiol. 2022, 42, 1029–1042. [Google Scholar] [CrossRef] [PubMed]
  86. Trapp, S.; Feificova, D.; Rasmussen, N.F.; Bauer-Gottwein, P. Plant uptake of NaCl in relation to enzyme kinetics and toxic effects. Environ. Exp. Bot. 2008, 64, 1–7. [Google Scholar] [CrossRef]
  87. Gerós, H.; Bazakos, C.; Manioudaki, M.E.; Sarropoulou, E.; Spano, T.; Kalaitzis, P. 454 Pyrosequencing of olive (Olea europaea L.) transcriptome in response to salinity. PLoS ONE 2015, 10, e0143000. [Google Scholar] [CrossRef]
  88. Rossi, L.; Borghi, M.; Francini, A.; Lin, X.; Xie, D.-Y.; Sebastiani, L. Salt stress induces differential regulation of the phenylpropanoid pathway in Olea europaea cultivars Frantoio (salt-tolerant) and Leccino (salt-sensitive). J. Plant Physiol. 2016, 204, 8–15. [Google Scholar] [CrossRef]
  89. Petridis, A.; Therios, I.; Samouris, G.; Tananaki, C. Salinity-induced changes in phenolic compounds in leaves and roots of four olive cultivars (Olea europaea L.) and their relationship to antioxidant activity. Environ. Exp. Bot. 2012, 79, 37–43. [Google Scholar] [CrossRef]
  90. León, L.; de la Rosa, R.; Velasco, L.; Belaj, A. Using wild olives in breeding programs: Implications on oil quality composition. Front. Plant Sci. 2018, 9, 232. [Google Scholar] [CrossRef] [PubMed]
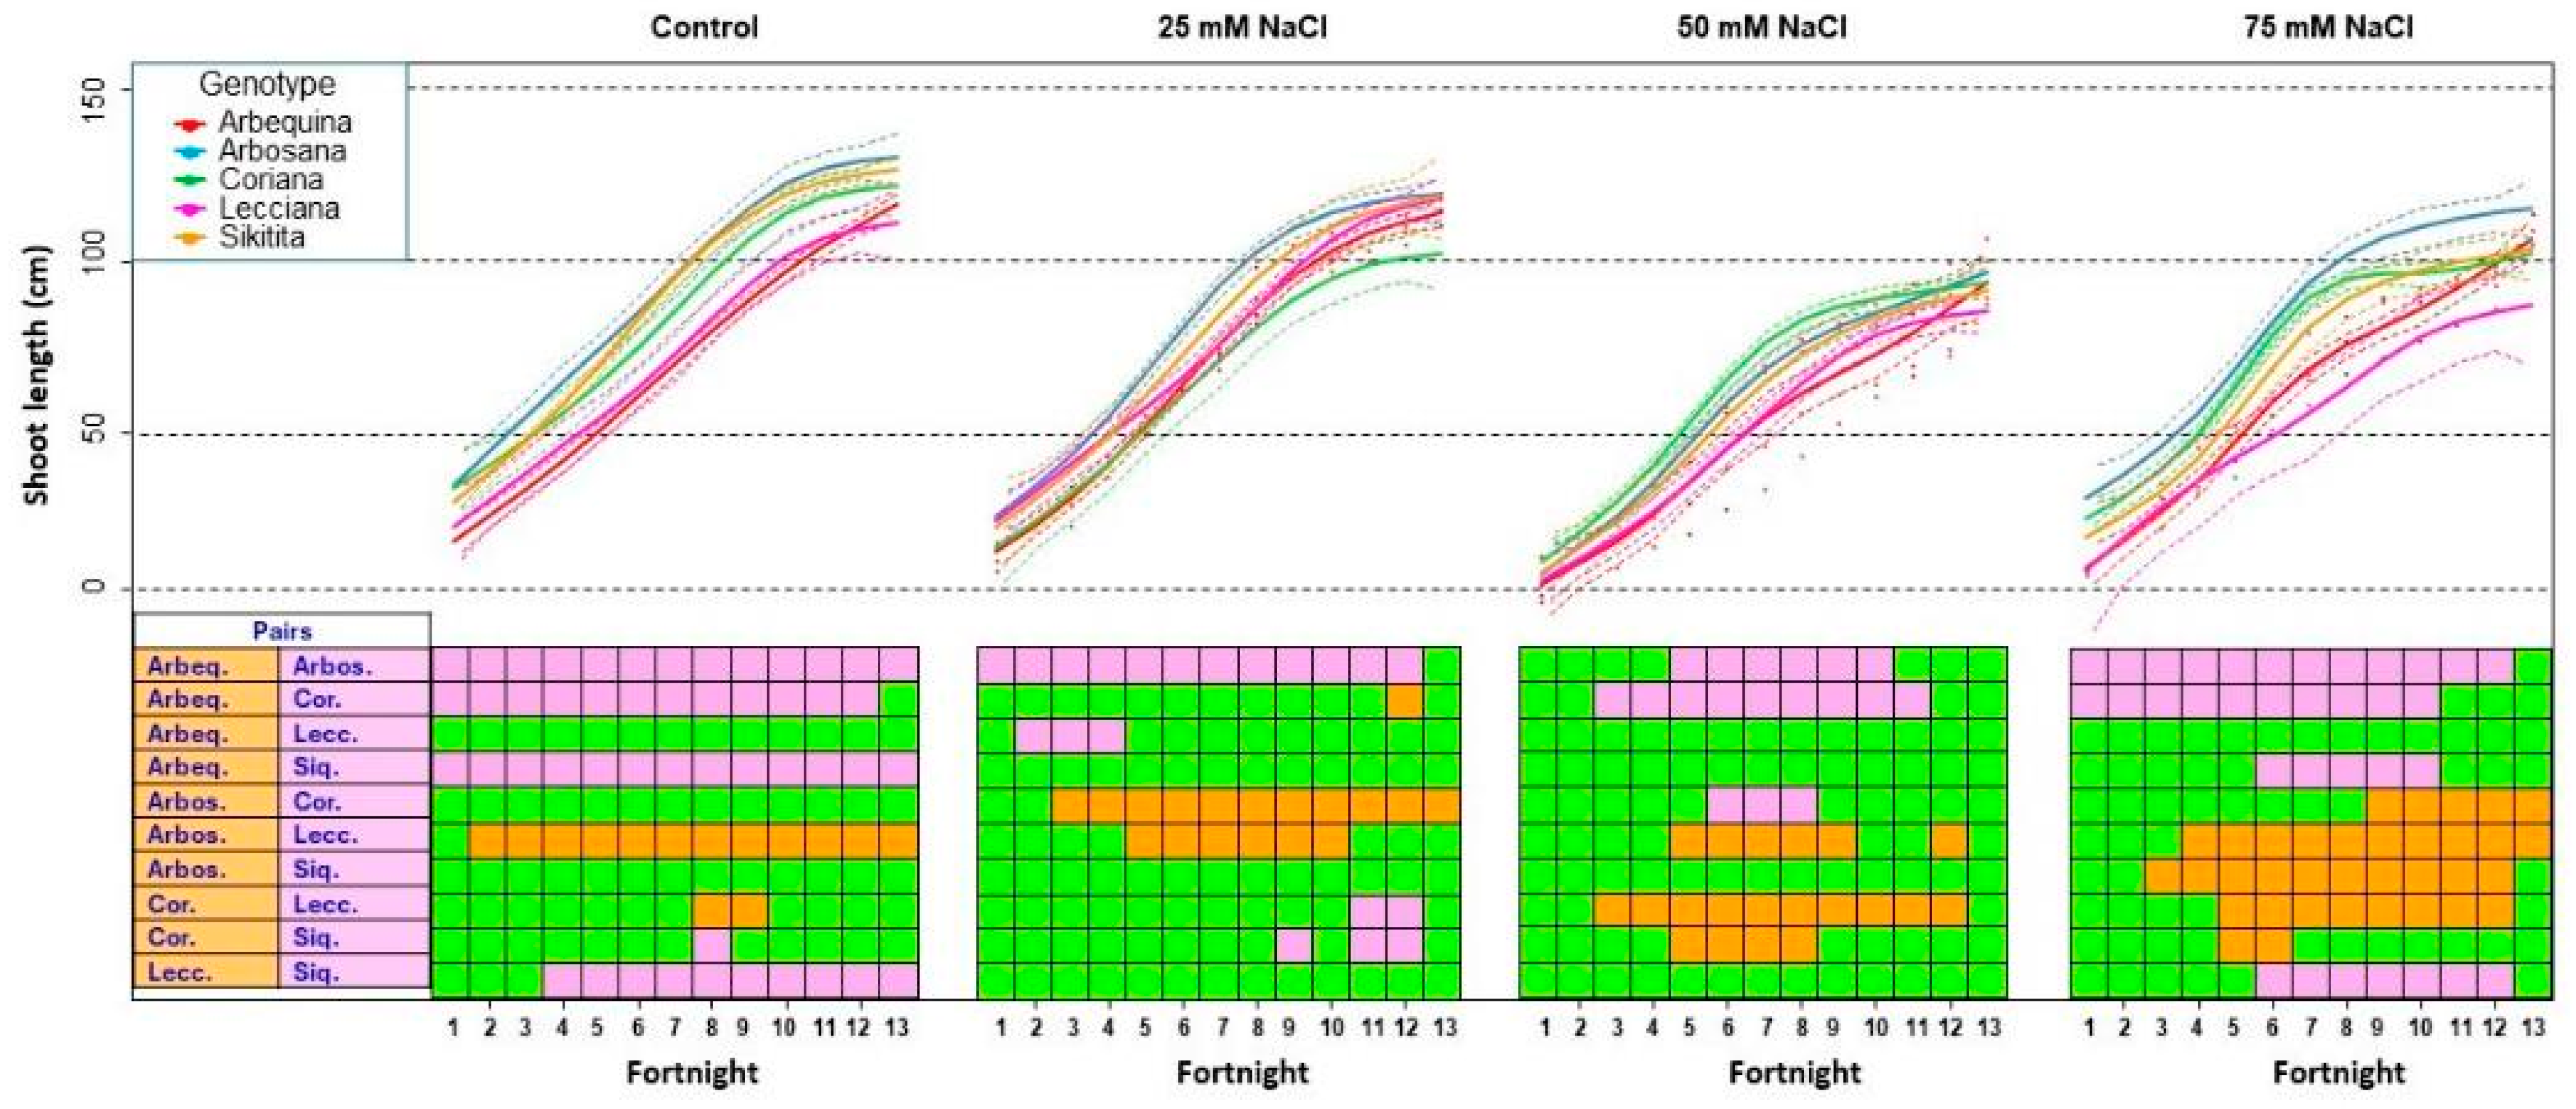
Figure 1. Spline representation of shoot lengths for each treatment as a function of genotype and date. For each treatment, the central line depicts the fitted spline curve, providing an approximation of shoot length growth trends, while the dotted lines above and below indicate the 95% confidence interval for the predicted values from the fitted spline model. Statistical comparisons were performed between treatments for each genotype. The results are color-coded to indicate statistical significance: green represents no significant differences between genotypes (overlapping CIs), orange represents significant differences with higher values in the first genotype than in the second genotype, and purple represents significant differences with higher values in the second genotype.
Horticulturae 11 00957 g001
Figure 2. Spline representation of trunk diameter for each treatment as a function of genotype and date. For each treatment, the central line depicts the fitted spline curve, providing an approximation of trunk diameter trends, while the dotted lines above and below indicate the 95% confidence interval for the predicted values from the fitted spline model. Statistical comparisons were performed between treatments for each genotype. The results are color-coded to indicate statistical significance: green represents no significant differences between genotypes (overlapping CIs), orange represents significant differences with higher values in the first genotype than in the second genotype, and purple represents significant differences with higher values in the second genotype.
Horticulturae 11 00957 g002
Figure 3. (a) Electron flux, (b) energy dissipation, and (c) photosynthetic performance for the different genotypes as a function of salinity at the end of the experiment. ‘Olive control*’ indicates the average of all genotypes in April. Area represents the area above the fluorescence induction curve between the minimum fluorescence (F0) and the maximum fluorescence (Fm) and is related to the pool size of electron acceptors in the photosynthetic electron transport chain. Fv/Fm is the maximum quantum efficiency of photosystem II (PSII) when all reaction centers are open. Vj represents the relative variable fluorescence at the J-step of the OJIP fluorescence transient and provides information about the reduction state of the primary quinone electron acceptor (QA). Sm is the normalized total complementary area above the OJIP transient and is related to the energy needed to close all PSII reaction centers. N represents the turnover number of QA, which is the number of times that QA is reduced and oxidized during the measurement. DIo/RC is the energy dissipated in the form of heat and fluorescence per reaction center. ETo/RC represents the electron transport rate per reaction center. REo/RC is the rate of electron transport beyond QA per reaction center. φ(Po) is the maximum quantum yield of primary photochemistry. ψ(Eo) represents the efficiency with which a trapped exciton can move an electron into the electron transport chain beyond QA. DIo/CSo is the energy dissipated in the form of heat and fluorescence per cross-section. PI(abs) is the performance index on an absorption basis, which combines several fluorescence parameters to provide an overall measure of the performance of PSII.
Horticulturae 11 00957 g003
Figure 4. Spline representation of stomatal conductance (mmol H2O m−2 s−1) for each treatment as a function of genotype and date. For each treatment, the central line depicts the fitted spline curve, providing an approximation of stomatal conductance trends, while the dotted lines above and below indicate the 95% confidence interval for the predicted values from the fitted spline model. Statistical comparisons were performed between treatments for each genotype. The results are color-coded to indicate statistical significance: green indicates no significant differences between genotypes (overlapping CIs), orange indicates significant differences with higher values in the first genotype than in the second genotype, and purple indicates significant differences with higher values in the second genotype.
Horticulturae 11 00957 g004
Figure 5. Spline representation of SPAD data for each treatment as a function of genotype and date. For each treatment, the central line depicts the fitted spline curve, providing an approximation of shoot length growth trends, while the dotted lines above and below indicate the 95% confidence interval for the predicted values from the fitted spline model. Statistical comparisons were performed between treatments for each genotype. The results are color-coded to indicate statistical significance: green represents no significant differences between genotypes (overlapping CIs), orange represents significant differences with higher values in the first genotype than in the second genotype, and purple represents significant differences with higher values in the second genotype.
Horticulturae 11 00957 g005
Disclaimer/Publisher’s Note: The statements, opinions and data contained in all publications are solely those of the individual author(s) and contributor(s) and not of MDPI and/or the editor(s). MDPI and/or the editor(s) disclaim responsibility for any injury to people or property resulting from any ideas, methods, instructions or products referred to in the content.