Article

Light–Nutrient Optimization Enhances Cherry Tomato Yield and Quality in Greenhouses

by
Jianglong Li
1,
Zhenbin Xie
1,
Tiejun Zhao
2,
Hongjun Li
3,
Riyuan Chen
1,4,
Shiwei Song
1 and
Yiting Zhang
1,4,*
1
College of Horticulture, South China Agricultural University, Guangzhou 510642, China
2
Faculty of Agro-Food Science, Niigata Agro-Food University, Niigata 959-2702, Japan
3
Tian Nong Agricultural Service Co., Ltd., Guangzhou 510630, China
4
Huangpu Innovation Research Institute, South China Agricultural University, Guangzhou 510642, China
*
Author to whom correspondence should be addressed.
Horticulturae 2025, 11(8), 874; https://doi.org/10.3390/horticulturae11080874
Submission received: 19 June 2025 / Revised: 20 July 2025 / Accepted: 23 July 2025 / Published: 25 July 2025

Abstract

To ensure the year-round efficient production of high-quality cherry tomatoes, this study evaluated how four cherry tomato cultivars can enhance yield and quality through optimized nutrient solution and supplementary lighting. Nutrient solutions (N1 and N2) were adjusted, with EC at 1.6 dS/m (N1: nitrogen 10.7 me/L, phosphorus 2.7 me/L, potassium 5.3 me/L) during flowering stage, and 2.4 dS/m (N1: nitrogen 16 me/L, phosphorus 4 me/L, potassium 8 me/L; N2: nitrogen 10.7 me/L, phosphorus 5.4 me/L, potassium 10.8 me/L) from fruit setting to harvest. N1 used standard adjustments, while N2 was optimized by adding solely with KCl and KH2PO4. Lighting treatments included L1 (natural light) and L2 (supplemental red/blue light). The application of N2 effectively decreased nitrate levels while it significantly enhanced the content of soluble sugars, flavor, and overall palatability, especially fruit coloring in cherry tomatoes, irrespective of supplementary lighting conditions. However, such optimization also increased sourness or altered the sugar–acid ratio. Supplementary lighting generally promoted the accumulation of soluble sugars, sweetness, and tomato flavor, although its effects varied markedly among different fruit clusters. The combination of optimized nutrient solutions and supplementary lighting exhibited synergistic effects, improving the content of soluble sugars, vitamin C, proteins, and flavor. N1 combined with L2 achieved the highest plant yield. Among the cultivars, ‘Linglong’ showed the greatest overall quality improvement, followed by ‘Baiyu’, ‘Miying’, and ‘Moka’. In conclusion, supplementary lighting can enhance the effect of nitrogen on yield and amplify the influence of phosphorus and potassium on fruit quality improvement in cherry tomatoes. The findings of this study may serve as a theoretical basis for the development of year-round production techniques for high-quality cherry tomatoes.

1. Introduction

Cherry tomato (Solanum lycopersicum var. cerasiforme) is characterized by its diverse fruit colors and a composition that includes various soluble sugars and organic acids. It is rich in bioactive compounds, such as the antioxidant lycopene, ascorbic acid, and γ-aminobutyric acid, which contribute significantly to its nutritional and health-promoting properties. As a result, it has gained popularity among consumers as a fruit-type vegetable [1]. However, under fluctuating environmental conditions, the quality of fruit from the same cultivar can vary considerably [2]. Consequently, optimizing external conditions for a given cultivar is crucial to enhancing cherry tomato quality.
A reasonable management strategy for nutrient solution concentration (electrical conductivity, EC) can not only enhance the efficiency of fertilizer application but also increase the yield and quality of fruits [3,4]. Compared with providing a constant concentration of 3.0 dS/m of nutrient solution throughout the growth cycle of tomatoes, reducing the concentration of nutrient solution from 3.0 dS/m to 1.5 dS/m at the seedling and flowering stages can effectively promote the growth of plants and enhance the photosynthetic capacity of leaves. Starting from the fruiting or harvesting period, an increase of EC from 3.0 dS/m to 4.5 dS/m significantly improved fruit quality and increased yield [4]. Potassium is the quality element in tomato fruits; increasing the potassium concentration in the nutrient solution can elevate the content of soluble sugars, soluble solids, sugar-to-acid ratio, and ascorbic acid in tomato fruits [5], while significantly boosting the levels of ascorbic acid and lycopene [6,7]. Increasing the nitrogen concentration from 10 mmol/L to 16 mmol/L was found to increase the hue angle and brightness, reduce sugar content and citric acid percentage but decrease soluble solids content and lycopene content. Conversely, increasing the potassium concentration in the nutrient solution from 5 mmol/L to 13 mmol/L increased soluble solids, citric acid, reducing sugars, lycopene, yield, and fruit brightness, while decreasing the fruit hue angle [8]. The combined application of nitrogen and phosphorus or phosphorus and potassium fertilizers can reduce the acid content, whereas the combined application of nitrogen and potassium tends to increase the total acid content. Furthermore, the combined application of nitrogen and potassium or phosphorus and potassium fertilizers enhances the ascorbic acid content in tomatoes [9].
Previous studies have demonstrated that tomatoes cultivated under extreme root restriction conditions (multiple cropping, low node order, and high density) coupled with a nutrient solution regime characterized by minimal volume and high-frequency applications can achieve an annual yield of 35 t per 1000 square meters of medium-sized tomatoes. These tomatoes exhibit a sugar content exceeding 7%, vibrant coloration, and elevated levels of antioxidants such as lycopene [10]. Our prior findings have demonstrated that under a root restriction condition of 0.25 L per plant, adjusting nutrient management by controlling nitrogen and phosphorus and potassium can moderately reduce leaf expansion while enhancing fruit growth and quality formation [11]. Increasing potassium concentration in the nutrient solution can mitigate tomato fruit sunburn, a physiological disorder often caused by high temperature and intense light during summer [12]. Furthermore, our recent research has shown that implementing segmented EC management can effectively enhance growth and fruit quality in tomatoes grown under root restriction ranging from 0.25 L to 0.75 L per plant [13,14]. Therefore, investigating the regulation of the nutritional environment under root-limiting cultivation is of significant importance for achieving consistent, high-quality tomato production throughout the year.
Studies have shown that insufficient light significantly reduces the photosynthetic capacity of plants, ultimately leading to losses in both yield and quality [15]. In tomato cultivation, inadequate light not only causes poor or even failed fruit coloration but also results in degradation of fruit quality, severely impacting the year-round production of greenhouse tomatoes and the high-quality stable supply [12,16,17]. Therefore, improving weak light environments through supplementary lighting is of great importance. Research has found that supplementary lighting significantly enhances the stomatal conductance and carbon assimilation capacity of tomato plant leaves, particularly in the middle and lower layers, thereby improving the efficiency of photosynthetic carbon absorption and assimilation [18]. Moreover, supplementary lighting significantly enhances leaf chlorophyll content [19]. Supplementary lighting has been shown to improve both the yield and quality of tomato fruits [20,21], with a positive linear correlation observed between fruit fresh weight and the duration of supplementary lighting [22]. Tomato fruit coloration and pigmentation can be significantly enhanced by LED blue light supplementation during the fruit development or ripening stages, while also increasing yield and nutritional quality [23]. Intermittent supplementary lighting has also been found to substantially boost lycopene content in tomato fruits [24].
According to the above references, recent studies have extensively documented the individual effects of nutritional management or light conditions on cherry tomatoes yield and quality. However, research investigating their synergistic interactions and combined physiological impacts remains limited. This study investigated four colored cherry tomato varieties under soilless cultivation (5 L/plant) with two nutrient solutions (N1/N2) and lighting treatments (L1/L2). Key parameters, including growth metrics, chlorophyll levels, fruit dimensions, nutritional components, and quality indicators, were analyzed. The research aimed to optimize light and nutrient conditions for factory-scale production of high-quality cherry tomatoes, establishing theoretical guidance for controlled agricultural environments.

2. Materials and Methods

2.1. Plant Materials

The experimental materials consisted of four distinct cherry tomato cultivars of Solanum lycopersicum var. cerasiforme, namely ‘Miying’, ‘Linglong’, ‘Baiyu’, and ‘Moka’, which exhibit distinctive coloration as described by the local company (Figure 1a). The characteristics of these cultivars are illustrated in Figure 1a.

2.2. Experimental Disign

This experiment was conducted in a plastic film greenhouse at the College of Horticulture, South China Agricultural University (23.3925° N, 113.309° E, elevation 15 m). Cherry tomato seedlings were raised in 72-cell trays and transplanted into non-woven fabric bags (5 L) filled with coconut coir at the five-true-leaf stage, with a plant spacing of 40 cm and row spacing of 120 cm. Plants were managed using a double-stem training system without flower thinning or fruit thinning, with both the main and lateral stems pinched after setting five fruit clusters. Plants were irrigated with an Enshi formulation nutrient solution [11], with each nutrient solution treatment utilizing an independent hydroponic system. Nutrient solution delivery was controlled by a timer, employing a high-frequency, low-volume strategy with a pump flow rate of 60 mL/min; the delivery volume was determined based on achieving approximately 20% drainage. All other plant and environmental management practices followed our previous research [25].
Tomato plants grown under natural light served as the control (L1, without supplementary lighting). For treatment L2, LED lights (red light 660 nm: blue light 460 nm = 2:1) were used to illuminate the plant tops starting from the onset of fruit set to the end of maturity. These LED lights, supplied by iGrowLite Co. (Guangzhou, China, Zhihuiguangtian Agricultural Science and Technology Co., Ltd.) were adjusted in height as the plants grew to maintain a horizontal positioning 15–20 cm above the plant canopy (Figure 1b). The supplementary light intensity was maintained at 100 ± 5 µmol/m2/s (30 cm from the LEDs), and the lighting period was set from 06:00 to 18:00 daily. Additionally, two levels of nutrient solution were applied (N1 and N2): Before the first fruit cluster set on the tomato plants, the nutrient solution EC for both treatments was 1.6 dS/m. After fruit setting, the EC of the N1 treatment was adjusted to 2.4 dS/m. For the N2 treatment, KCl and KH2PO4 were added to the nutrient solution maintained at the baseline EC of 1.6 dS/m, increasing its EC to 2.4 dS/m (Figure 1c). Both N1 and N2 nutrient solutions were improved based on our previous research in extremely low-volume substrate [12] or medium-sized tomatoes [3,13]
A four-cultivar 2 × 2 factorial design including total of four treatments (T1: N1 and L1, T2: N1 and L2, T3: N2 and L1, T4: N2 and L2) was designed in this experiment. Each treatment was replicated three times with six plants per replication. At fruit maturity, three biological replicates were collected simultaneously for each treatment, with each replicate consisting of at least 10 fruits. After removing seeds, jelly, and placental tissues, the fruit samples were immediately flash-frozen in liquid nitrogen and stored at −80 °C for subsequent fruit quality analysis.

2.3. Plant Growth and Fruit Production

For each treatment, three replicates were conducted. In each replicate, four uniformly growing cherry tomato plants were randomly selected for growth indicator measurements. Plant height was measured from the first cotyledon to the growth point using a flexible ruler. Stem diameter was determined as the width below the first true leaf using a digital vernier caliper. Leaf count was based on fully unfolded true leaves. The largest functional leaf beneath the second fruit cluster was measured for length and width with a flexible ruler; leaf area was calculated according to our previous research [3]. The relative chlorophyll content of these leaves was quantified using a SPAD-502Plus instrument (Konica Minolta Business Associates Co. Ltd., Tokyo, Japan). At full ripening stage, fruit equatorial diameter was measured with a digital vernier caliper. Fruit shape index was calculated as follows:
F r u i t   S h a p e   I n d e x   ( F S I ) = E q u a t o r i a l   D i a m e t e r L o n g i t u d i n a l   D i a m e t e r
The higher FSI indicates elongated fruits and lower values denote flattened spherical fruits. Individual fruit weight was recorded using a 0.01 g precision electronic balance.

2.4. Fruits Quality of Nutritional, Flavor, Antioxidant Activity

Fully mature fruits were harvested from each treatment. Fruit color differences were assessed using a Konica Minolta CM-2300d spectrophotometer (Konica Minolta Business Associates Co. Ltd., Tokyo, Japan) with D65 standard illumination, following the manufacturer’s protocol. For each treatment, 10–15 fruits were selected. Measurements were taken at three equidistant points (120° apart) per fruit, with results expressed in the color space CIE L × a × b. Soluble solids were measured using a PAL-1 portable refractometer (Atago Co., Ltd., Tokyo, Japan). Total acidity was determined by acid–base neutralization. Total soluble sugars were quantified via anthrone colorimetry, soluble protein via Coomassie brilliant blue assay, and vitamin C and nitrate contents by molybdenum blue colorimetry [26].
Antioxidant activities (DPPH radical scavenging, FRAP reducing power) and compounds (flavonoid and polyphenols) were analyzed. For each treatment, three biological replicates (10 fruits each, gel tissue removed) were flash-frozen in liquid nitrogen and stored at −40 °C. DPPH and FRAP assays followed Khan et al. [27]; the determination of polyphenols content was based on the method of Quadrana et al. [28]. The content of flavonoids was determined by the Mashiba method, as referred in our previous research [25].
Flavor quality was assessed by a panel of at least 20 postgraduate students within the laboratory who possessed extensive experience in sensory assessment of fruit flavors, using a standardized scoring. The evaluated attributes included sweetness, flavor intensity, overall deliciousness (positive indicators: 100/80/60/40/20 points), as well as peel thickness, firmness, and acidity (negative indicators: −100/−80/−60/−40/−20 points).

2.5. Statistical Analysis

Statistical analyses were performed using IBM SPSS Statistics 22.0 software. Independent samples t-test, one-way analysis of variance (ANOVA), three-way ANOVA, and Duncan’s multiple range test were used to determine significant differences among treatments (p < 0.05). Graphical visualization of results was conducted using Microsoft Excel 2020 and Origin 2018 software packages.

3. Results

3.1. Effects of Optimized Nutrient Solution and Supplementary Lighting on Growth of Cherry Tomatoes

As shown in Table 1, plants under T4 generally showed superior growth. Relative to T2, T4 significantly increased stem diameter in ‘Miying’, and plant height and leaf number in ‘Linglong’ and ‘Moka’. Compared to T1, T3 enhanced leaf number in ‘Linglong’ and ‘Moka’. T4 significantly outperformed T1 across multiple cultivars: enhancing stem diameter and leaf area in ‘Miying’; stem diameter and leaf number in ‘Linglong’; plant height and stem diameter in ‘Baiyu’; and plant height and leaf number in ‘Moka’. Statistical analysis revealed significant interactions: cultivar–nutrient solution affected plant height and leaf number, while cultivar–lighting affected stem diameter. Collectively, optimized nutrient solution with supplementary lighting promoted cherry tomato growth.

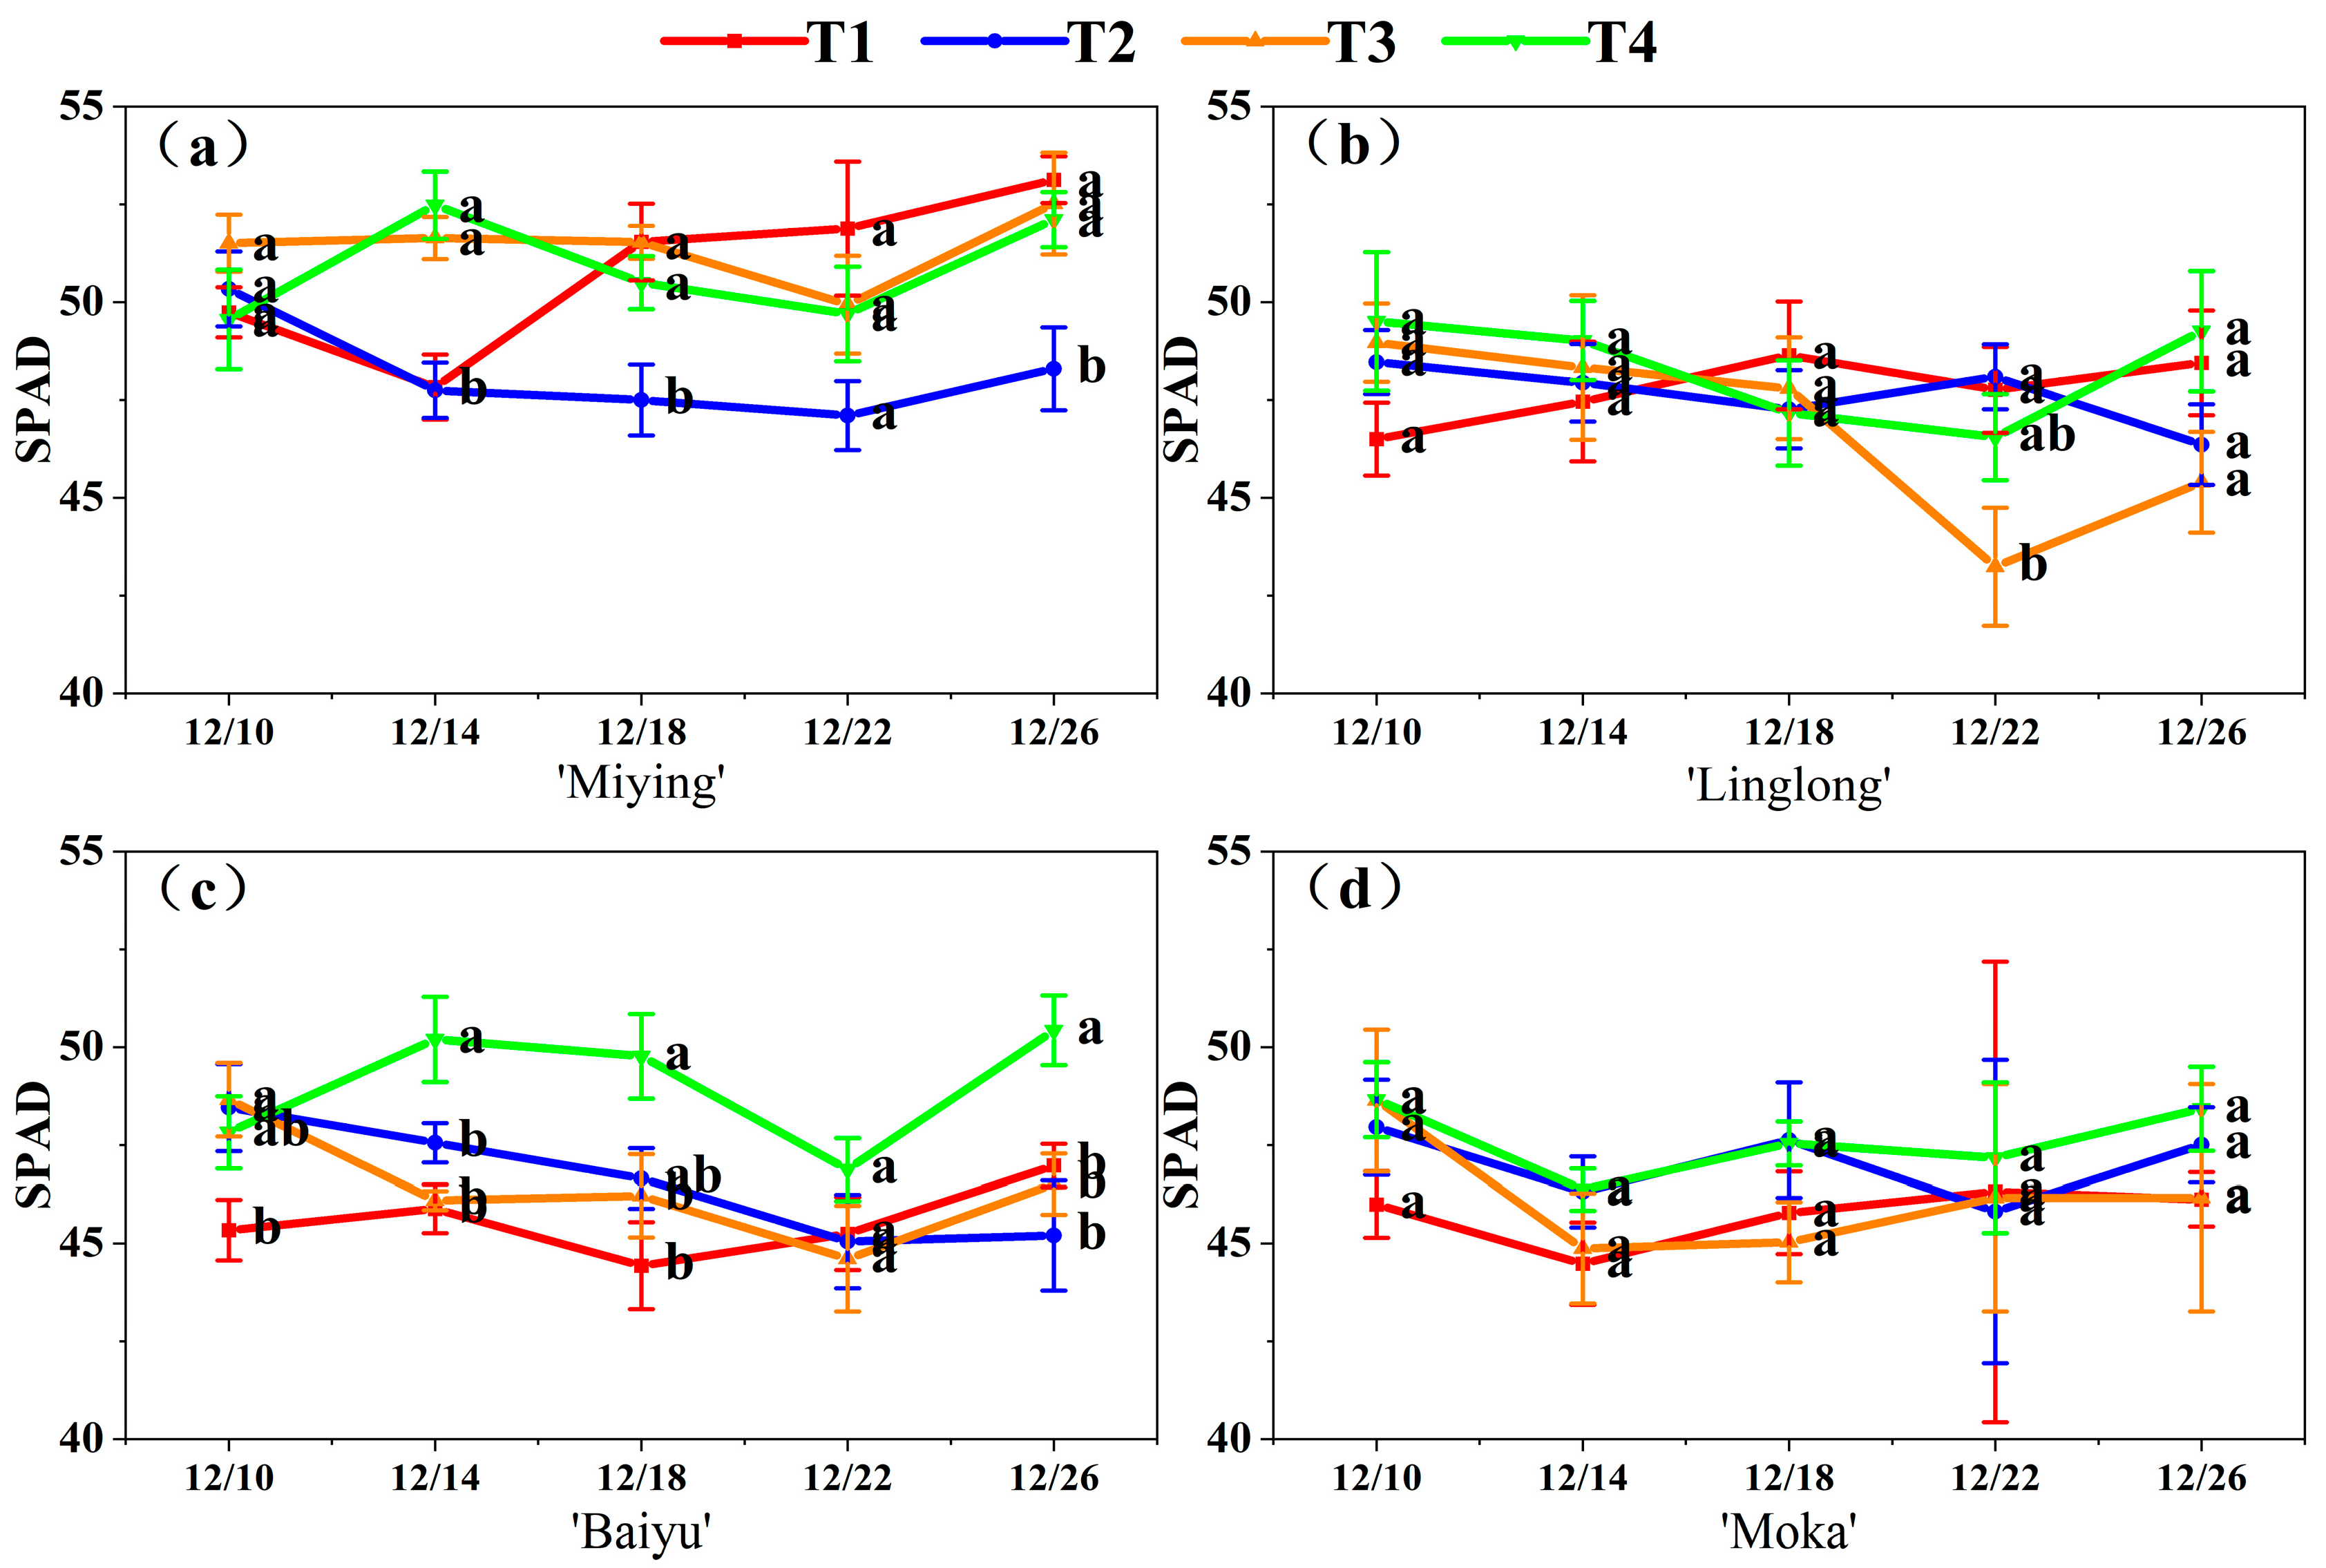
3.2. Effects of Optimized Nutrient Solution and Supplementary Lighting on SPAD Values of Cherry Tomato Leaves

Optimized nutrient solution and supplementary lighting significantly influenced SPAD values across cherry tomato cultivars. Compared to T1, T3 elevated SPAD values in ‘Baiyu’ (Figure 2c), while T4 consistently increased values across all cultivars relative to T2, especially in ‘Miying’ and ‘Baiyu’ (Figure 2a,c). T2 generally increased SPAD values over T1 in ‘Linglong’, ‘Baiyu’, and ‘Moka’ (Figure 2b–d). T4 significantly increased SPAD values relative to T3 in ‘Baiyu’ and ‘Moka’ (Figure 2c,d), with the strongest effect in ‘Baiyu’ (Figure 2c). Compared to T1, T4 elevated SPAD values in ‘Linglong’, ‘Baiyu’, and ‘Moka’ (Figure 2b–d), where ‘Baiyu’ showed the most pronounced response (Figure 1c). These results demonstrate that the combined treatment increased SPAD values, with ‘Baiyu’ exhibiting the strongest physiological response.

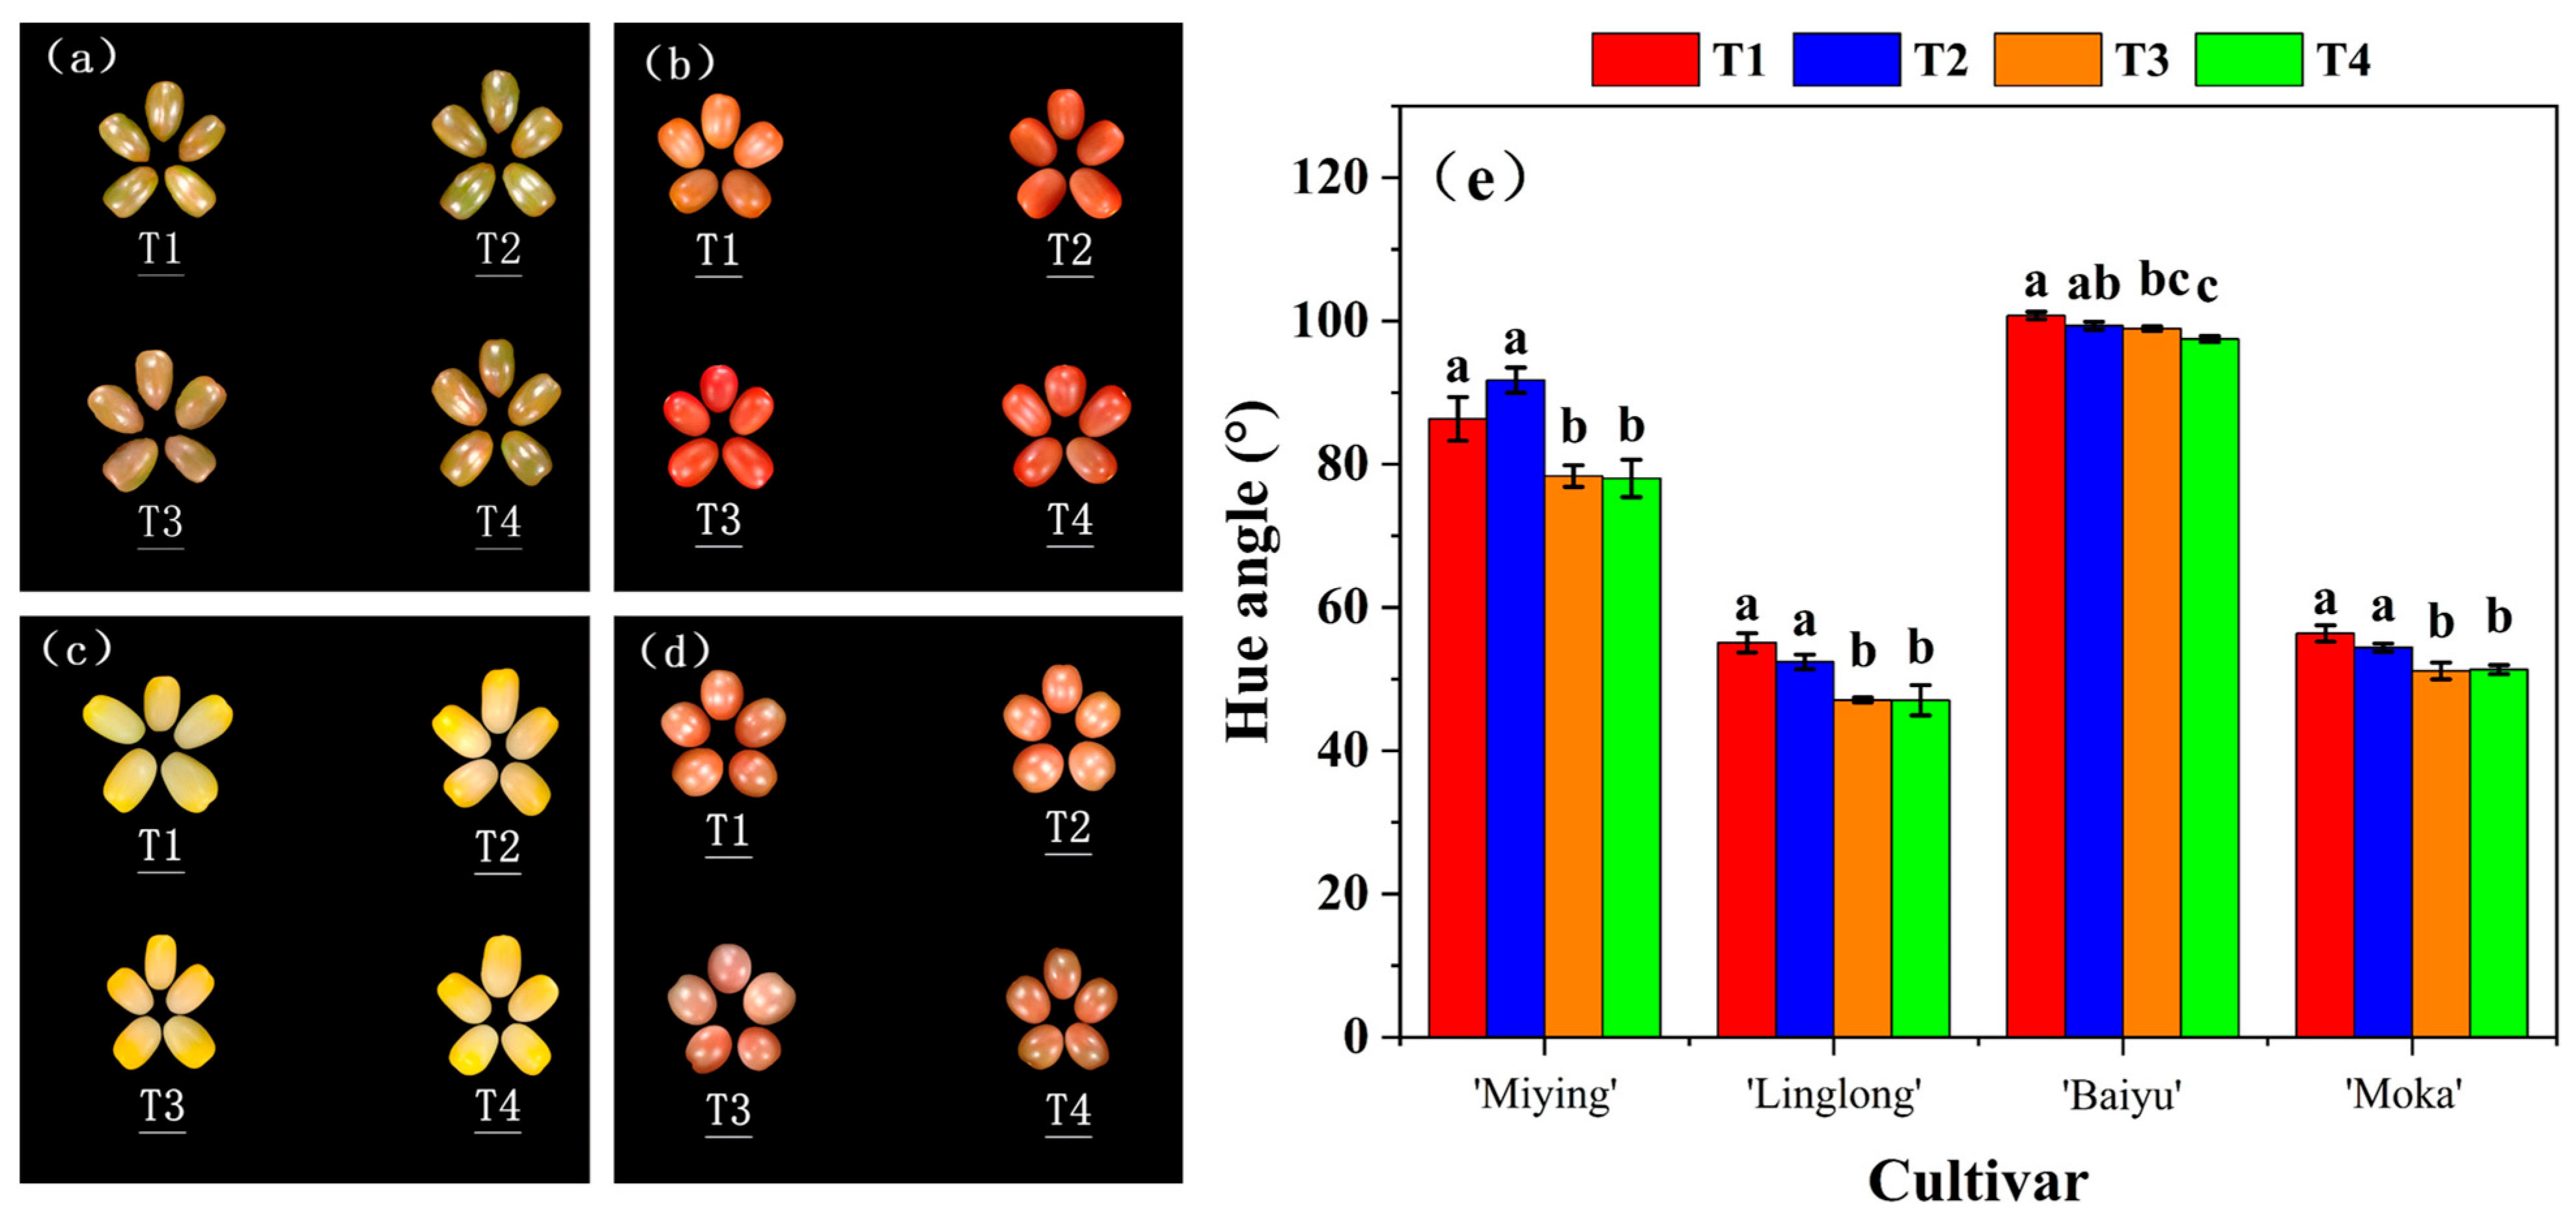
3.3. Effects of Optimized Nutrient Solution and Supplementary Lighting on the Appearance of Cherry Tomato Fruits

The fruit color of various cherry tomato cultivars was influenced by the optimized nutrient solution and supplementary lighting (Figure 3a–d). The hue angle of all cherry tomato cultivars significantly decreased (indicating intensified coloration) compared to T1 at T3 and T2 at T4. Under T4 treatment, the reductions in hue angle relative to T2 were 14.94% for ‘Miying’, 10.23% for ‘Linglong’, 1.87% for ‘Baiyu’, and 5.67% for ‘Moka’. However, no significant differences in hue angle were detected between T2 and T1 or between T4 and T3 under varying lighting conditions. In summary, optimization of the nutrient solution markedly enhances the pigmentation of cherry tomato fruits.

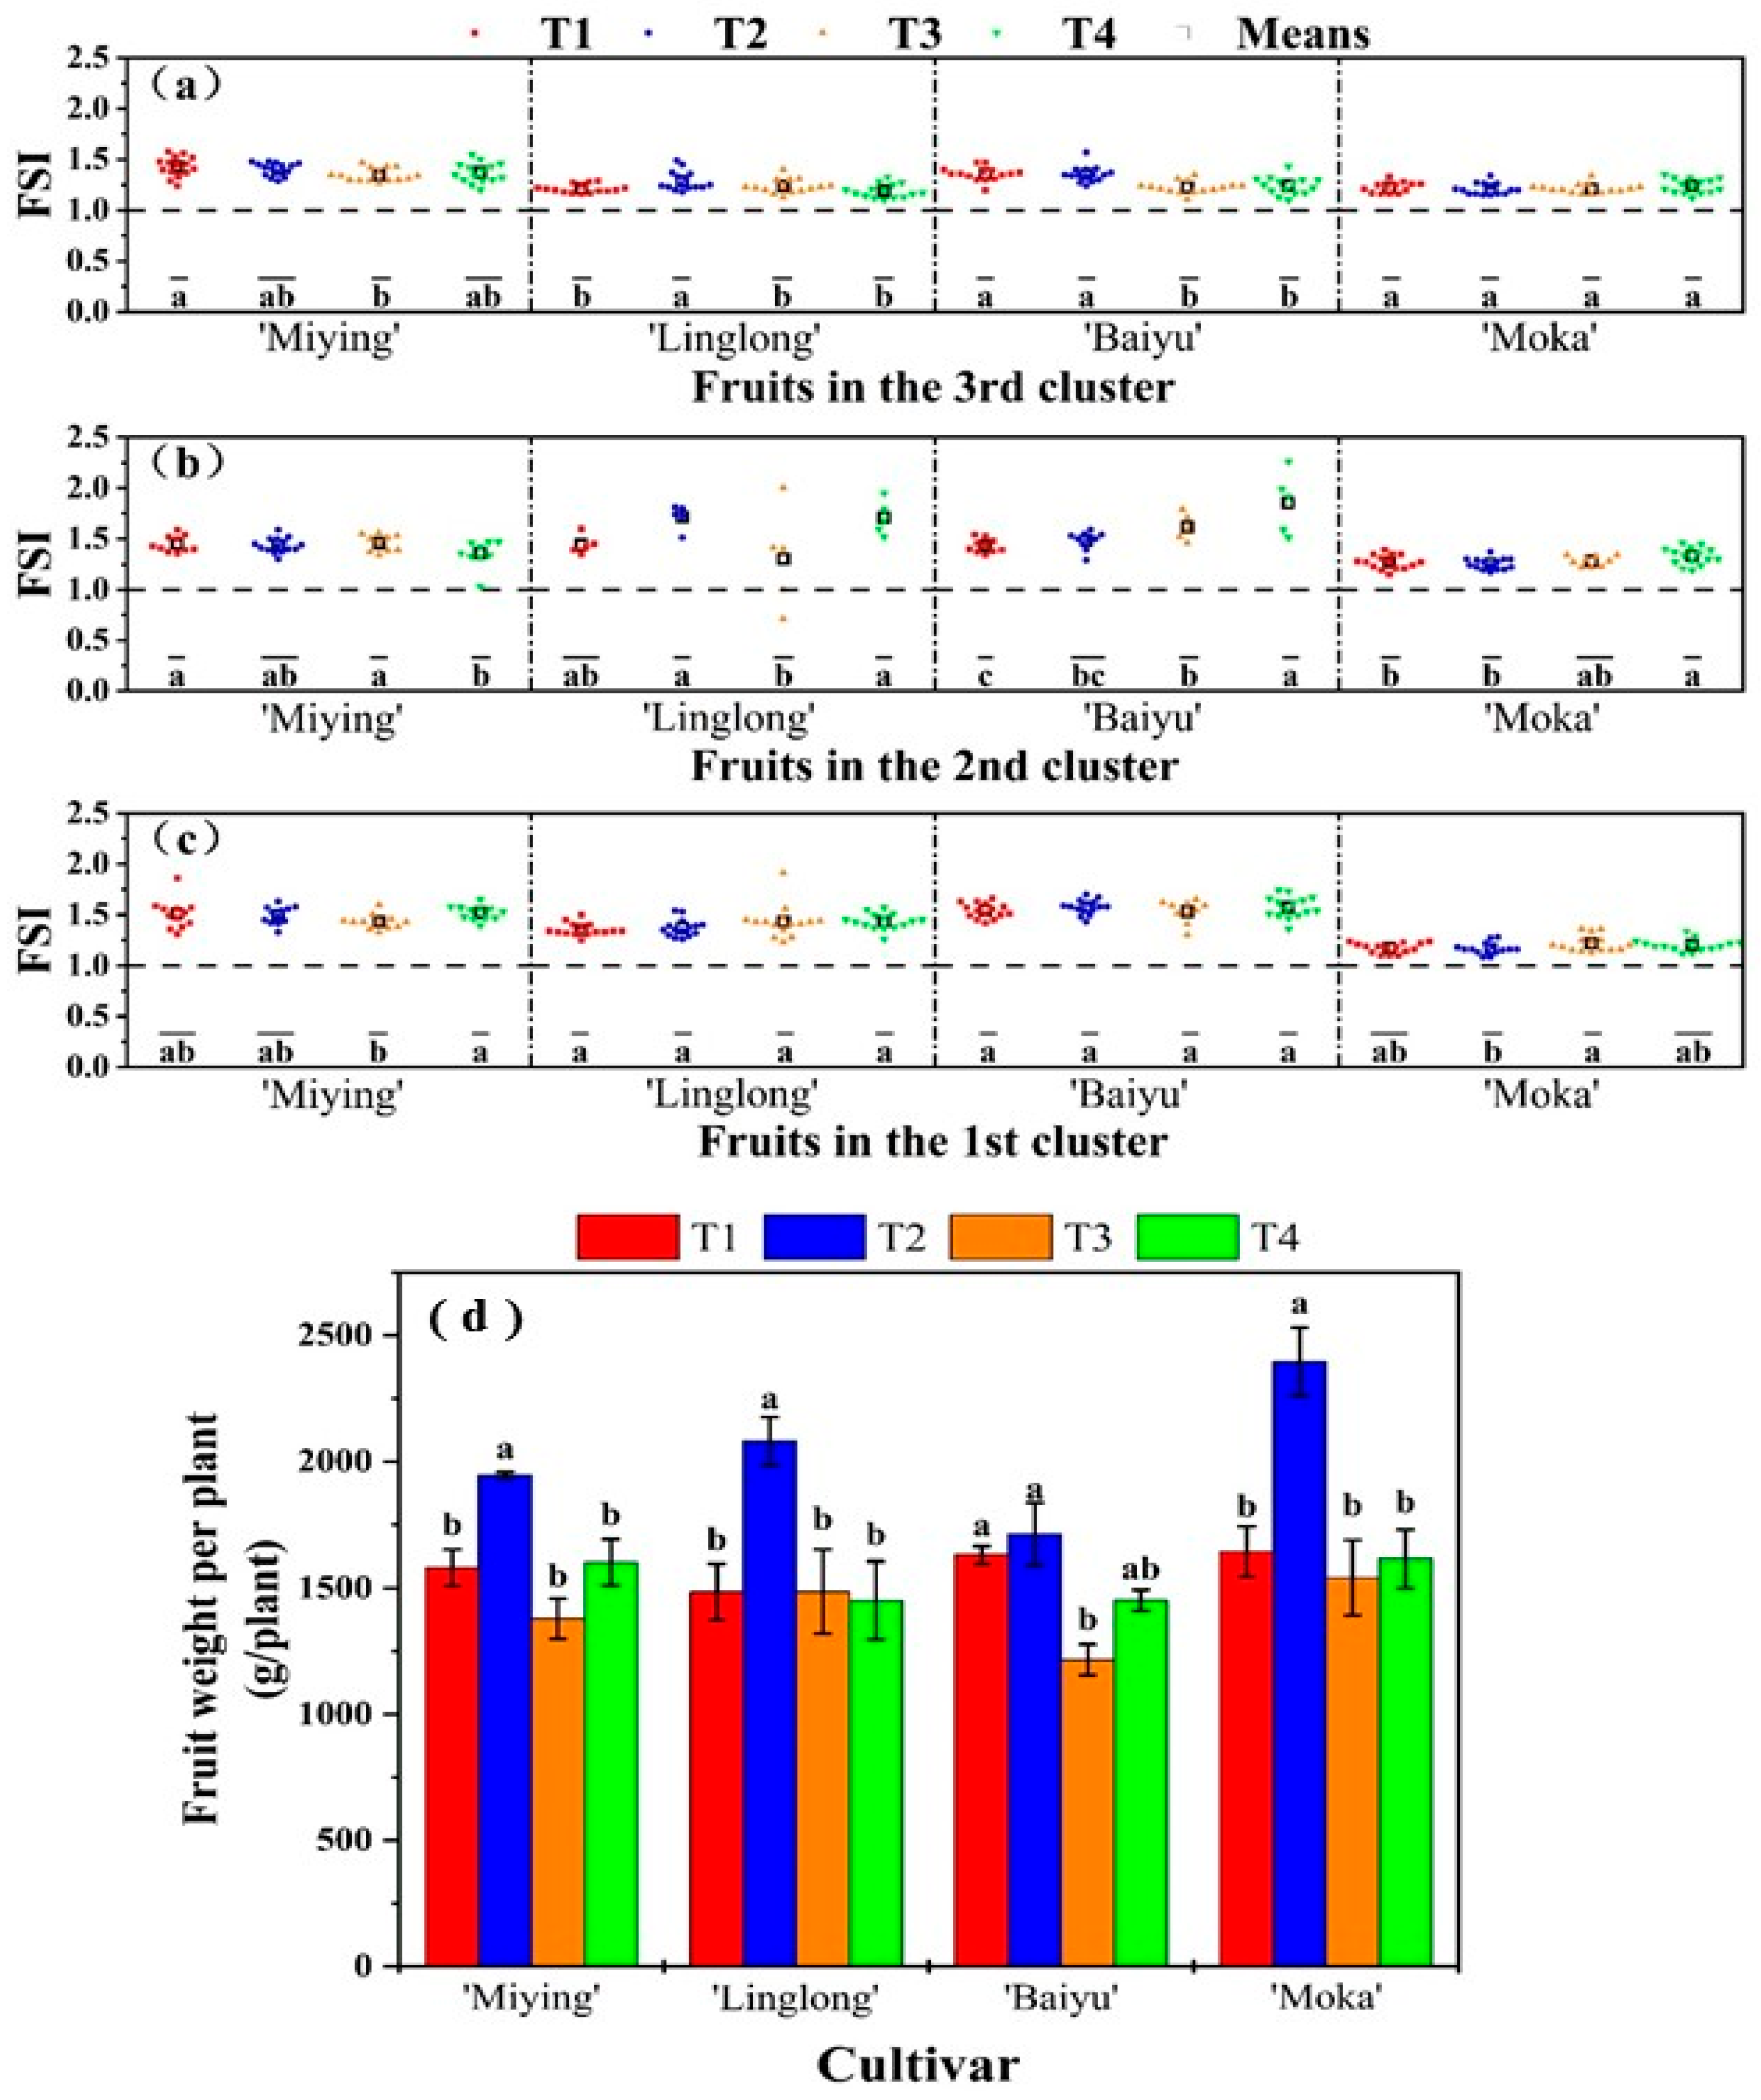
3.4. Effects of Optimized Nutrient Solution and Supplementary Lighting on the Shape and Weight of Cherry Tomato Fruits

The effects of optimizing the nutrient solution and supplementary lighting on the FSI of cherry tomatoes varied depending on the variety, cluster position, and treatment combination. Specifically, T3 significantly increased the FSI of the second cluster of ‘Baiyu’ fruits compared to T1, while it decreased the FSI of the third cluster of ‘Miying’ and ‘Baiyu’ (Figure 4a,b). In contrast, T4 significantly increased the FSI of the second clusters of ‘Baiyu’ and ‘Moka’ fruits compared to T2, while decreasing the FSI of the third clusters of ‘Linglong’ and ‘Baiyu’ fruits, as well as the second cluster of ‘Miying’ fruits (Figure 4a,b). Additionally, T4 increased the FSI of the second clusters of ‘Linglong’ and ‘Baiyu’ fruits and the first cluster of ‘Miying’ fruits compared to T3 (Figure 4c), while decreasing the FSI of the second cluster of ‘Miying’ fruits (Figure 4b). Furthermore, T2 significantly increased the FSI of the third cluster of ‘Linglong’ fruits compared to T1 (Figure 4a). FSI values reflect fruit shape characteristics, with higher values indicating more elongated and round shapes and lower values indicating more flattened and round shapes. The combined effect of optimized nutrient solution and supplementary lighting enhanced the longitudinal roundness of the second cluster of ‘Baiyu’ fruits. Similarly, lighting alone enhanced longitudinal roundness of the third cluster of ‘Linglong’. The experimental results indicated significant variations in the yield of cherry tomato cultivars under different treatments (Figure 4d). Under T2 treatment, all tested cultivars exhibited the highest single-plant fruit weight compared to other treatments. Specifically, the yield of ‘Baiyu’ under T1 treatment was notably superior to that under T3. For ‘Miying’, ‘Linglong’, and ‘Moka’, their yields under T2 treatment were significantly higher than those under T4 and T1 treatments. Additionally, the yields of ‘Miying’, ‘Baiyu’, and ‘Moka’ under T4 treatment were slightly higher than under T3, though the difference was not statistically significant when compared with T1 treatment.

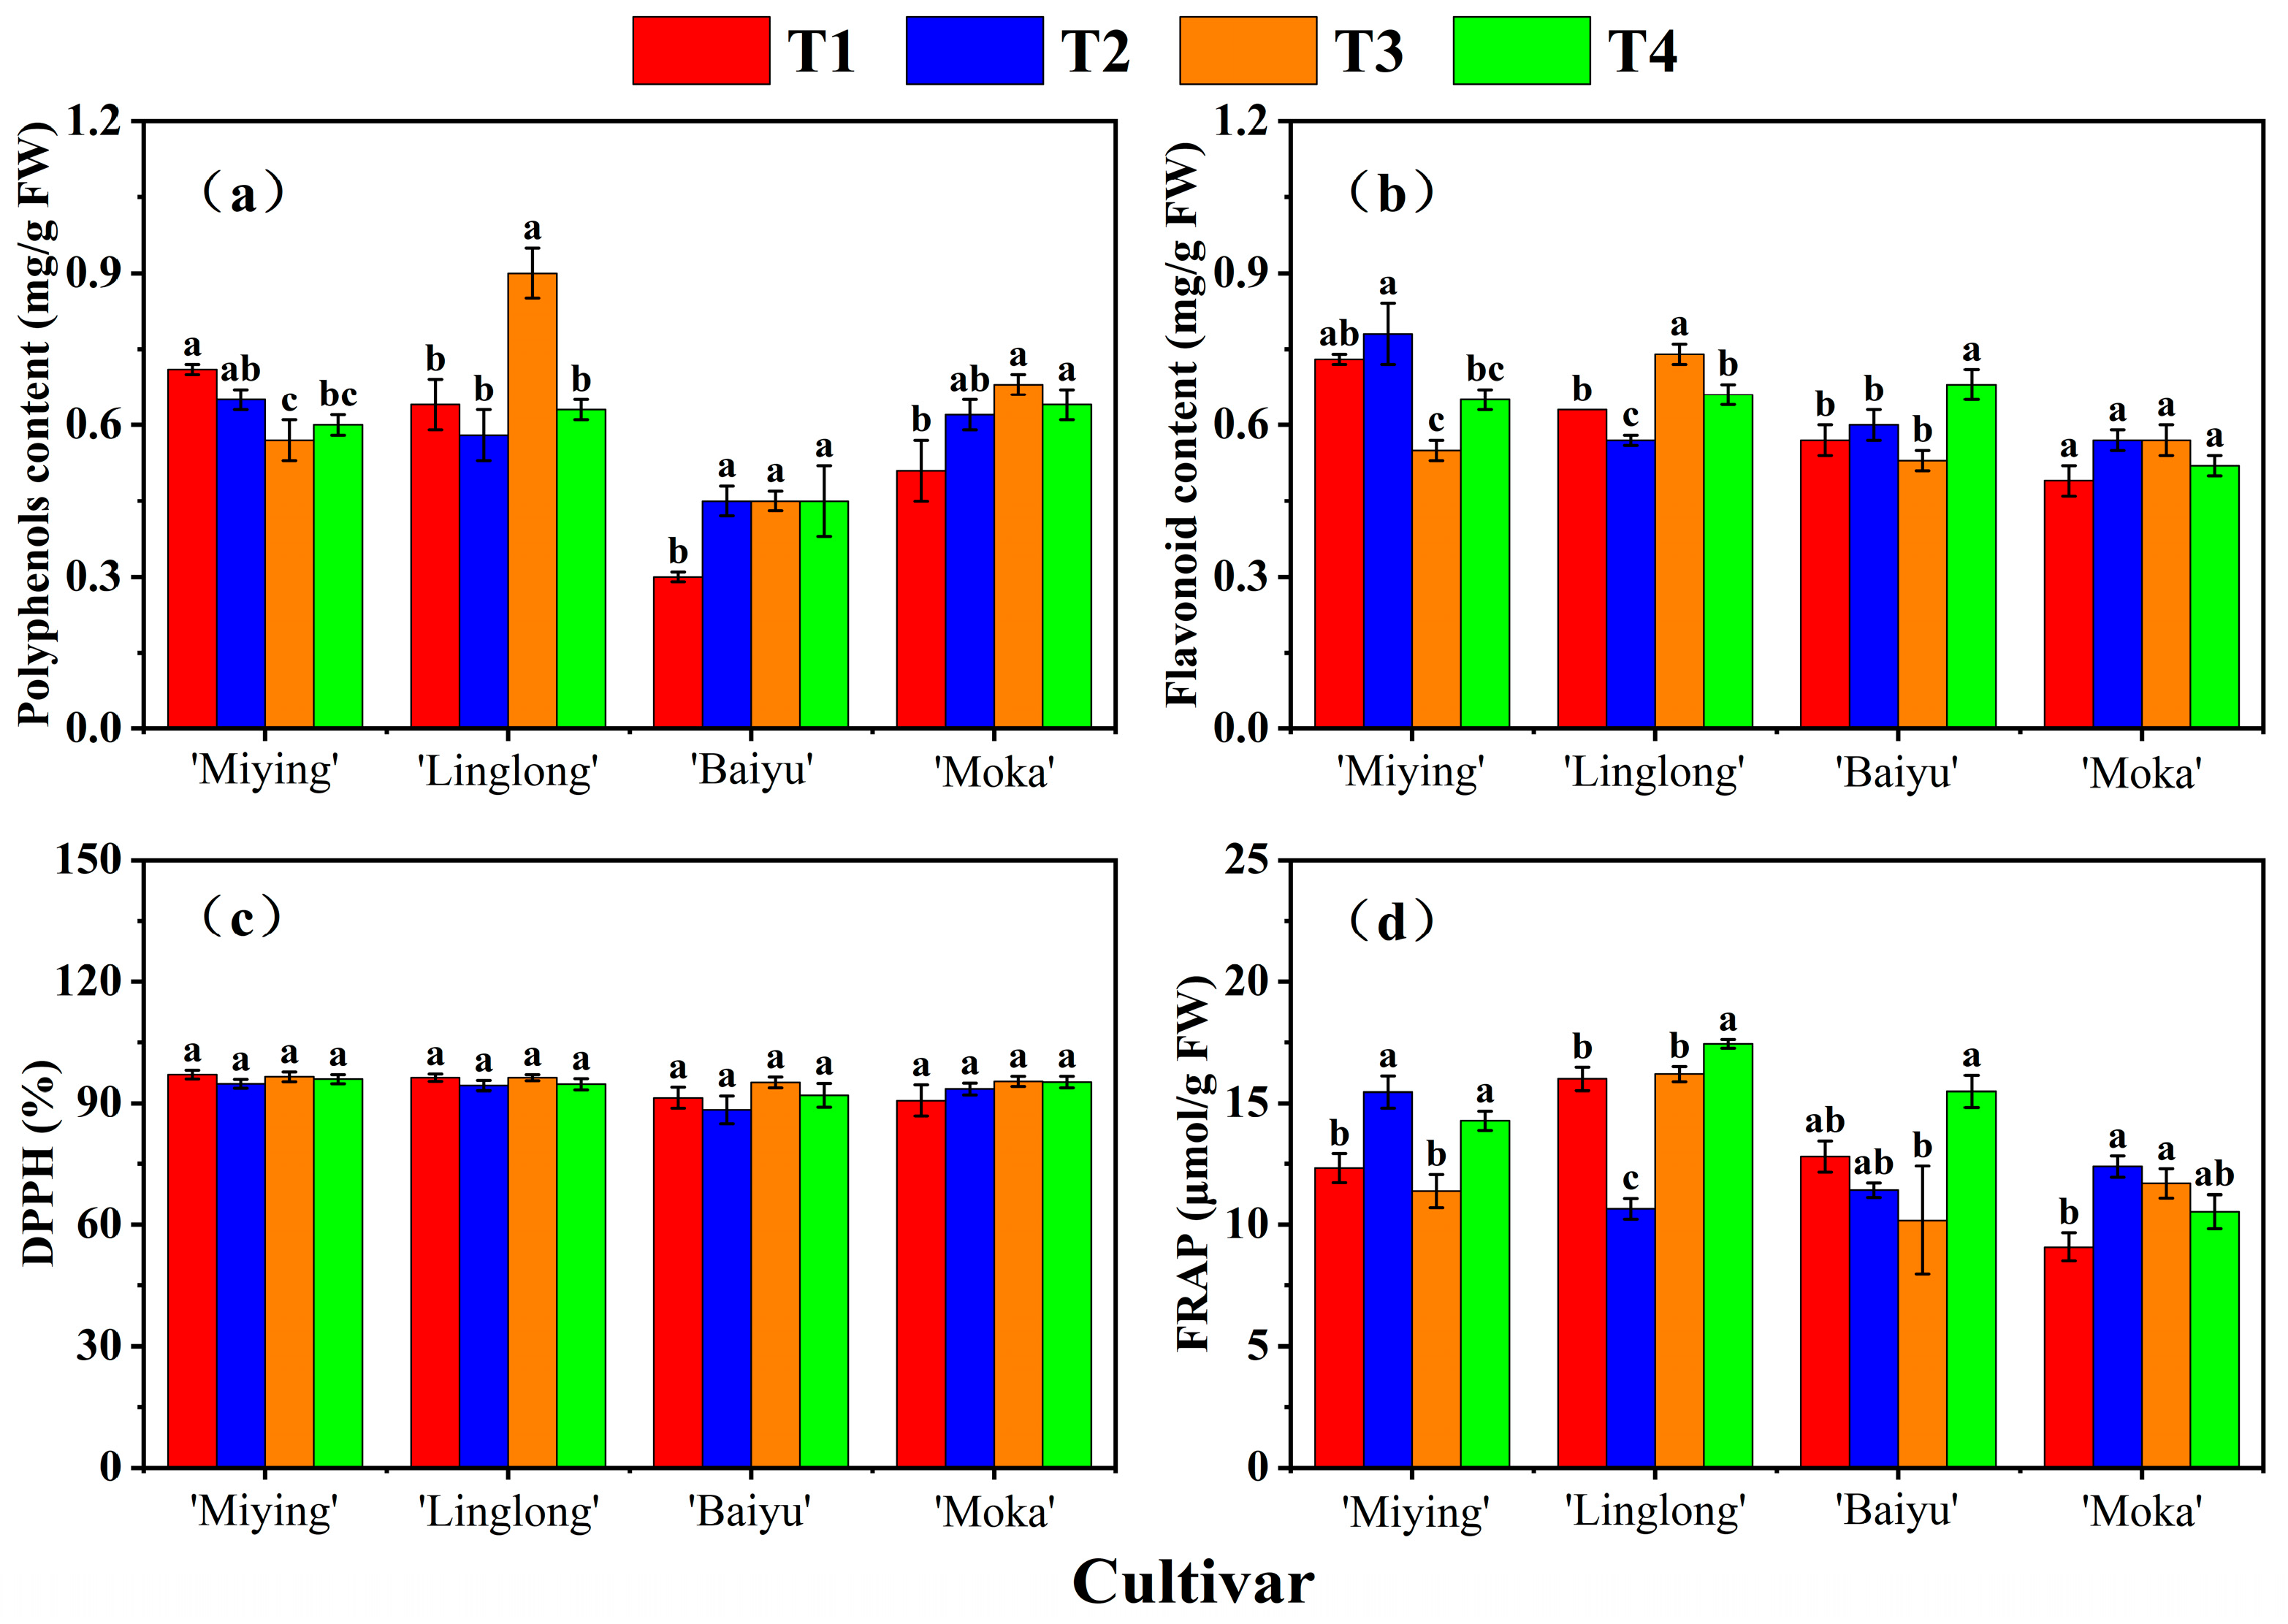
3.5. Effects of Optimized Nutrient Solution and Supplementary Lighting on Antioxidant Capacity of Cherry Tomatoes

Figure 5 shows that the effects of optimizing nutrient solutions and supplementary lighting on cherry tomato antioxidant indices varied by cultivar. Regarding polyphenol content, T2 significantly increased levels in ‘Baiyu’ and ‘Moka’ compared to T1, while T3 significantly increased levels in ‘Linglong’, ‘Baiyu’, and ‘Moka’ (Figure 5a). For flavonoid content, T4 significantly increased levels in ‘Baiyu’ compared to T3, and T3 significantly increased levels in ‘Linglong’ compared to T1 (Figure 5b). DPPH levels showed no significant differences among cultivars across treatments (Figure 5c). For FRAP activity, T2 significantly increased levels in ‘Miying’ and ‘Moka’ relative to T1. T3 significantly increased FRAP in ‘Moka’, and T4 significantly increased FRAP in ‘Linglong’ compared to T2, and in ‘Miying’, ‘Linglong’, and ‘Baiyu’ compared to T3. In summary, for the ‘Baiyu’ cultivar, both single-factor treatments increased polyphenol, flavonoid, and FRAP levels, and their combination significantly enhanced polyphenol and flavonoid content. ‘Baiyu’ showed the greatest overall enhancement in antioxidant capacity (‘Baiyu’ > ‘Linglong’ > ‘Miying’ > ‘Moka’).

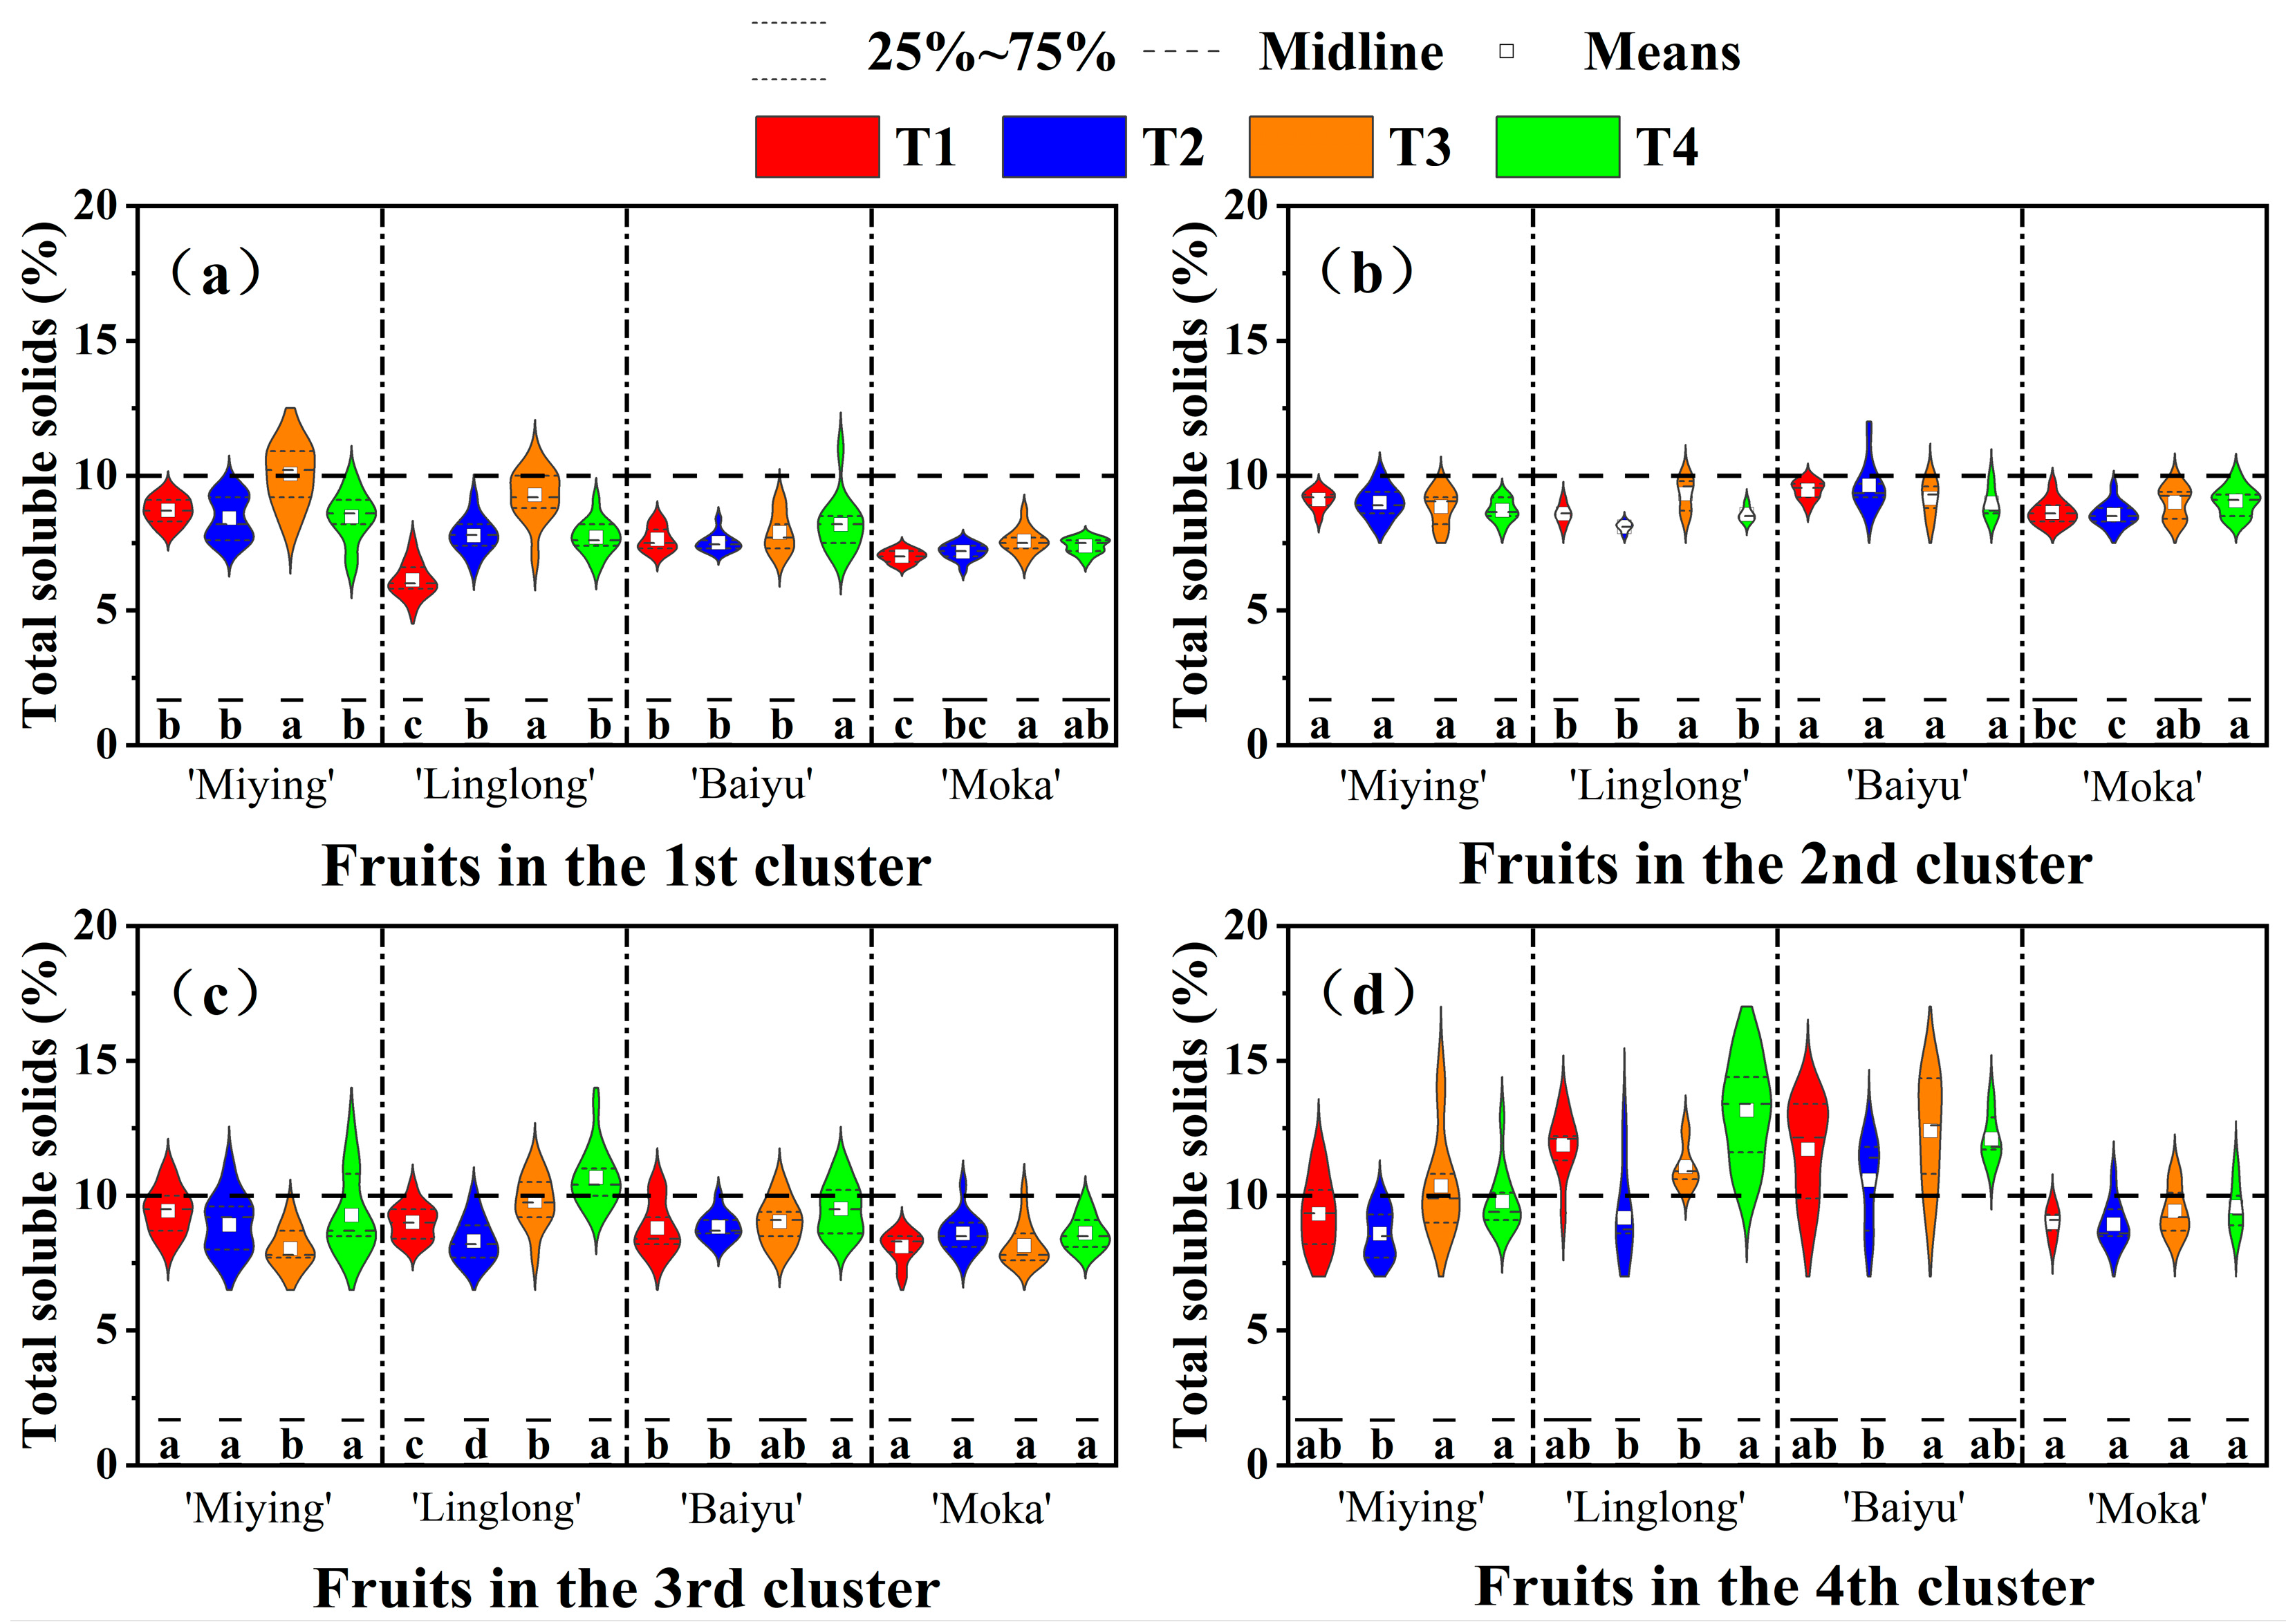
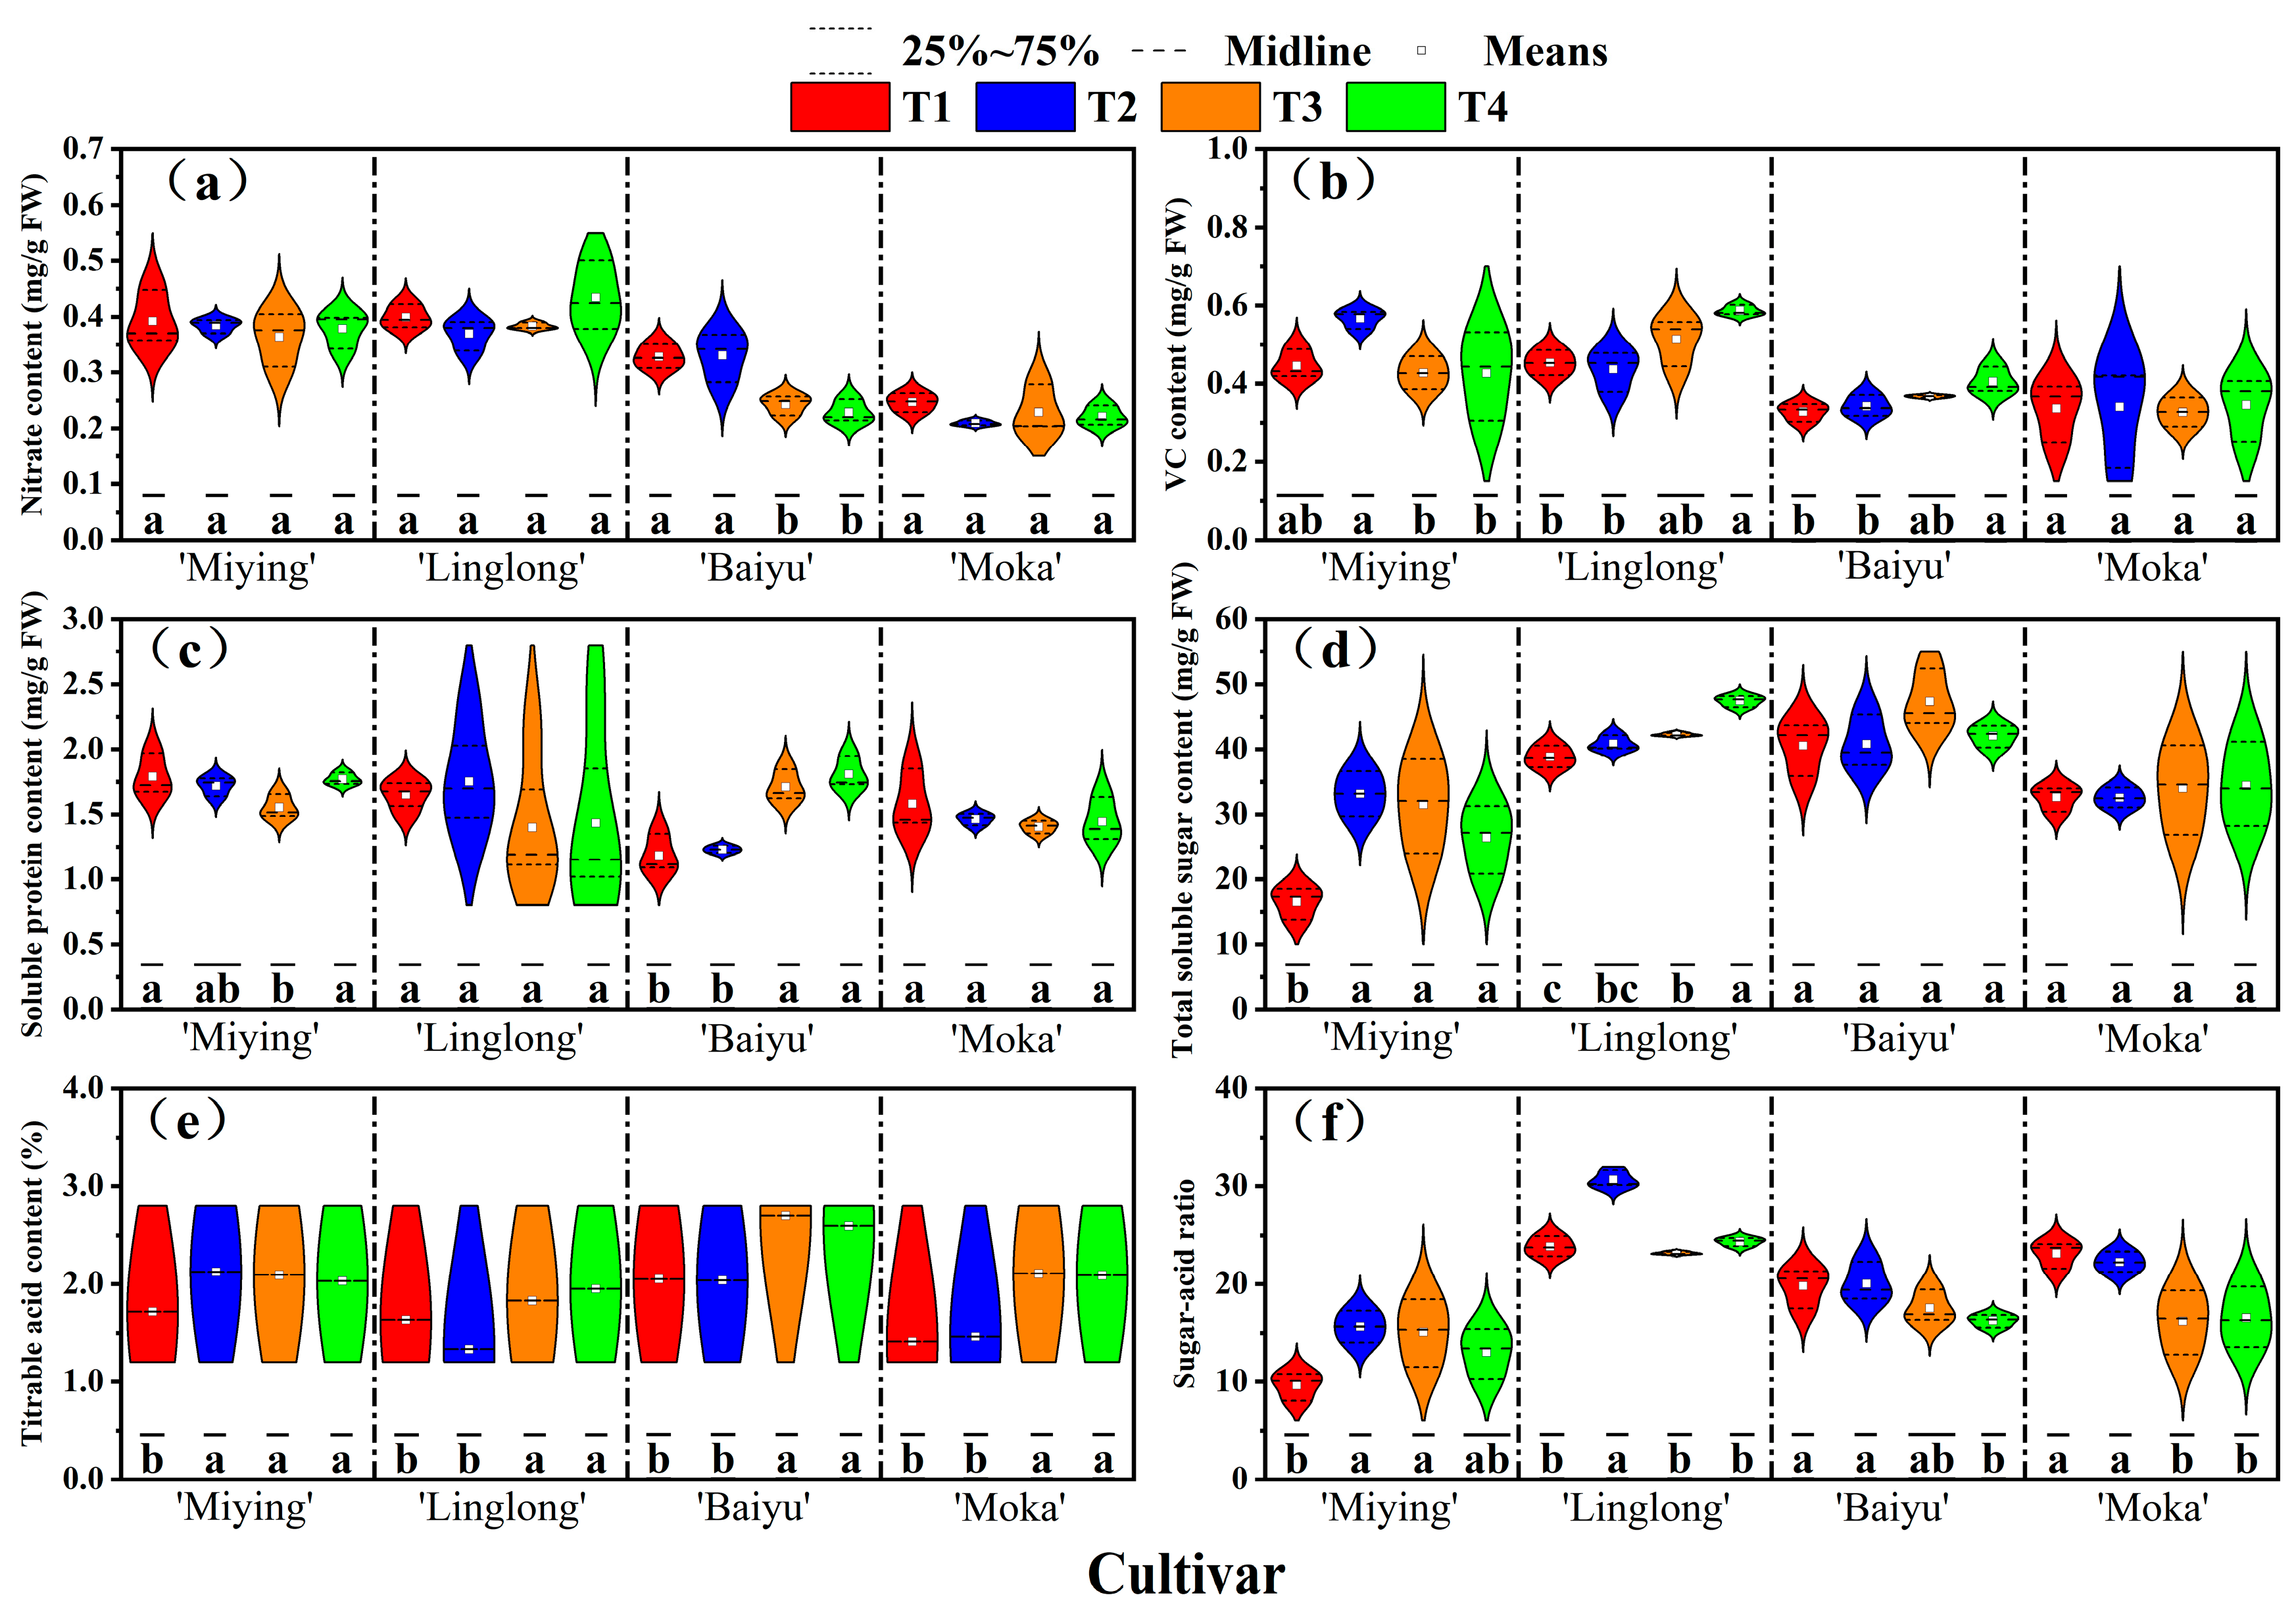
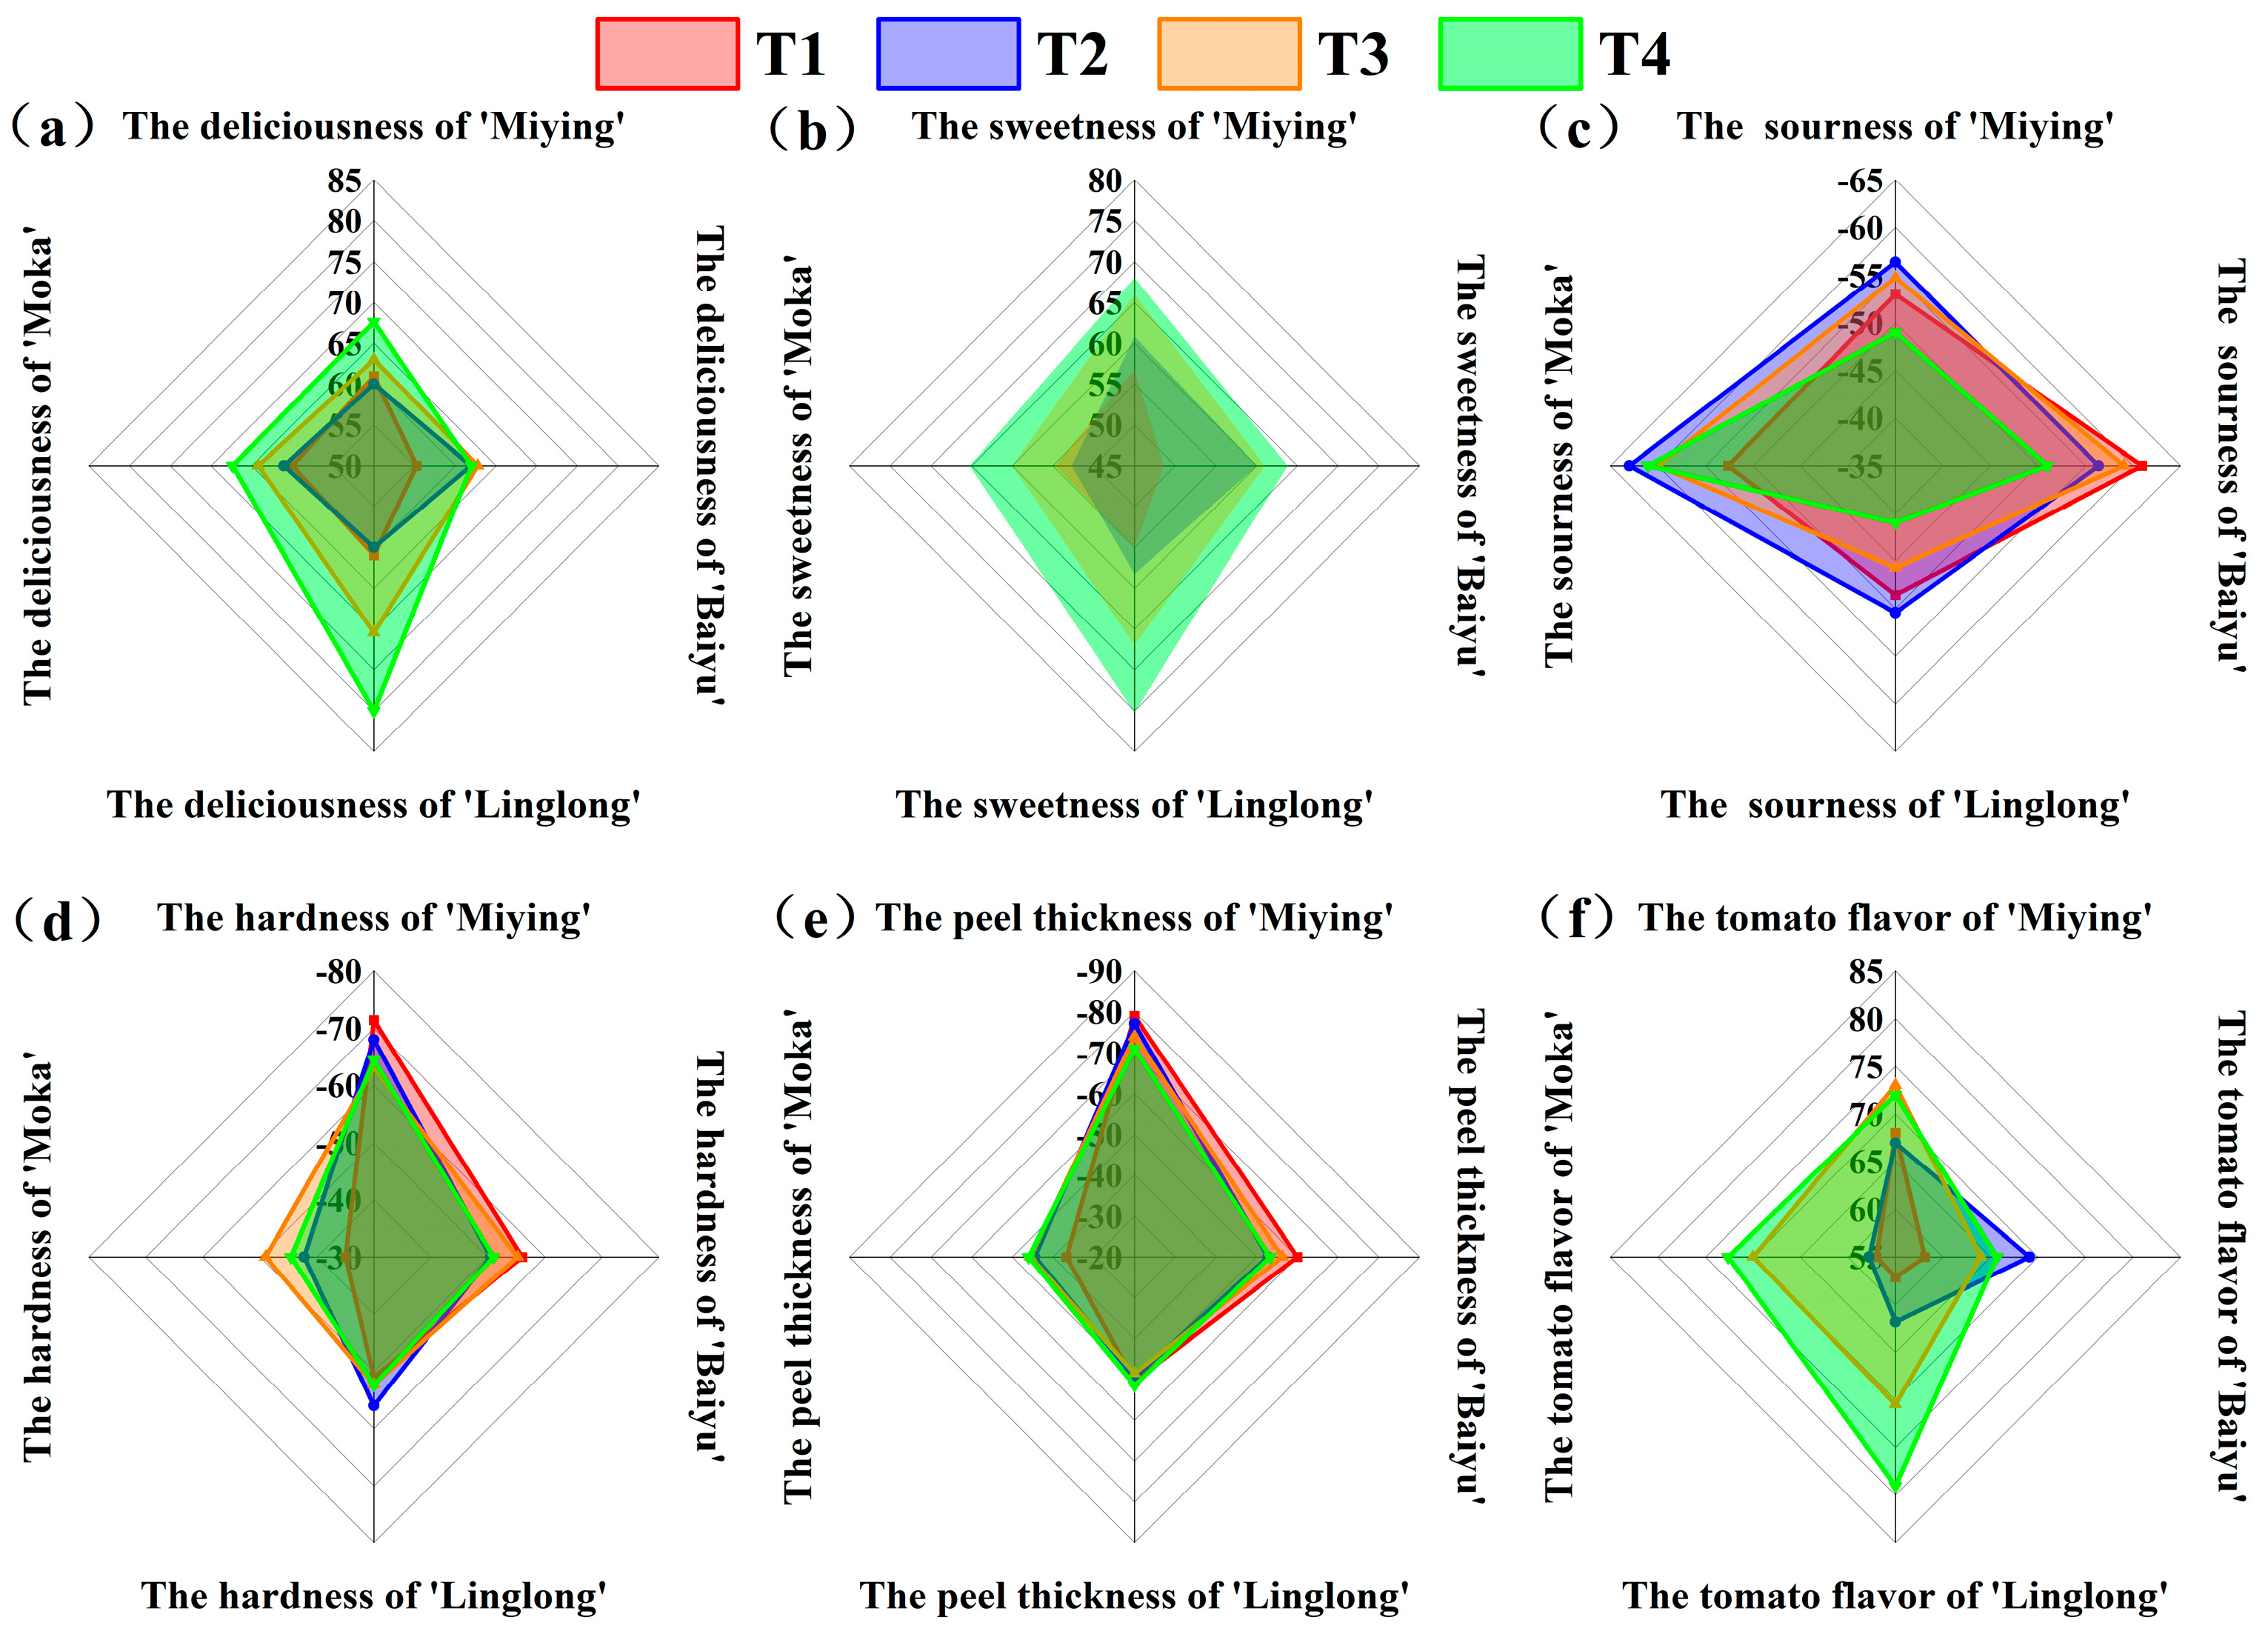
3.6. Effects of Optimized Nutrient Solution and Supplementary Lighting on Fruit Quality Attributes of Cherry Tomatoes

Figure 6 illustrates that the effects of nutrient solution optimization and supplementary lighting on cherry tomato soluble solids content (TSS) varied significantly by cultivar and fruit cluster position. Generally, higher TSS values were observed in fruits located in upper clusters. Specifically, compared to T1, treatment T3 enhanced TSS in ‘Miying’ clusters 1 and 2, ‘Linglong’ clusters 1, 2, and 3, and ‘Moka’ cluster 1, while it decreased TSS in ‘Miying’ cluster 3. In comparison to T2, T4 increased TSS in ‘Miying’ cluster 4, ‘Linglong’ clusters 3 and 4, ‘Baiyu’ clusters 1 and 3, and ‘Moka’ cluster 2. Relative to T1, T2 elevated TSS in ‘Linglong’ cluster 1 but reduced it in cluster 3. When comparing T3 to T4, TSS was increased in ‘Miying’ cluster 3, ‘Baiyu’ cluster 1, and ‘Linglong’ clusters 3 and 4, whereas it decreased in ‘Miying’ cluster 1 and ‘Linglong’ clusters 1 and 2. Compared to T1, T4 significantly improved TSS in ‘Linglong’ and ‘Baiyu’ clusters 1 and 3, as well as in ‘Moka’ clusters 1 and 2. Fruits with TSS ≥ 10% (indicating high quality) were predominantly observed in ‘Miying’ clusters 1 and 2 under T3, ‘Linglong’ cluster 3 under T4, and ‘Linglong’ and ‘Baiyu’ cluster 4 across all treatments. Overall, ‘Linglong’ demonstrated the most substantial improvement in TSS, with cultivar performance ranked as follows: ‘Linglong’ > ‘Baiyu’ > ‘Moka’ > ‘Miying’.
Figure 7 illustrates the differential effects of optimized nutrient solution and supplementary lighting on the nutritional quality of various cherry tomato cultivars. Specifically, T3 and T4 significantly decreased nitrate levels in ‘Baiyu’ compared to T1 and T2 (Figure 7a). For vitamin C (VC), T2 enhanced VC content in ‘Miying’ relative to T3 and T4, while T4 elevated VC levels in ‘Linglong’ and ‘Baiyu’ compared to T1 and T2 (Figure 7b). Regarding soluble protein, T1 and T4 increased its content in ‘Miying’ compared to T3, whereas T3 and T4 promoted higher soluble protein levels in ‘Baiyu’ relative to T1 and T2 (Figure 7c). Total soluble sugar content was significantly elevated in ‘Miying’ under T2, T3, and T4 compared to T1; for ‘Linglong’, T3 increased sugar levels relative to T1, and T4 further enhanced them compared to T2 and T3 (Figure 7d). Titratable acid content decreased markedly in ‘Miying’ under T1 compared to other treatments, and reductions were also observed in ‘Linglong’, ‘Baiyu’, and ‘Moka’ under T1 and T2 relative to T3 and T4 (Figure 7e). The sugar–acid ratio improved significantly in ‘Miying’ under T2 and T3 compared to T1, in ‘Linglong’ under T2 compared to other treatments, in ‘Baiyu’ under T1 and T2 compared to T4, and in ‘Moka’ under T1 and T2 compared to T3 and T4 (Figure 7f). Overall, ‘Baiyu’ exhibited the most substantial improvement in nutritional quality, followed by ‘Linglong’, ‘Miying’, and ‘Moka’.
As shown in Figure 8, T3 significantly improved flavor quality (deliciousness, sweetness, and flavor) across all cultivars compared to T1, though it reduced fruit peel thickness in ‘Miying’, ‘Linglong’, and ‘Baiyu’ while increasing it in ‘Moka’ (Figure 8a,b,f). Compared to T2, treatment T4 enhanced deliciousness and sweetness in all cultivars, flavor in ‘Miying’, ‘Linglong’, and ‘Moka’, and reduced acidity across all cultivars. However, T4 also increased peel thickness in ‘Linglong’, ‘Baiyu’, and ‘Moka’, and decreased flavor in ‘Baiyu’ (Figure 8a–c,e,f). T2 increased sweetness and flavor in some cultivars compared to T1 but negatively impacted acidity and peel thickness in others (Figure 8b,c,e,f). Relative to T3, T4 improved deliciousness and sweetness in most cultivars but also caused decreases in deliciousness in ‘Baiyu’ and increases in acidity and hardness in some cultivars (Figure 8a–d,f). Overall, T4 significantly enhanced deliciousness, sweetness, and flavor in all cultivars compared to T1, though it reduced acidity in ‘Miying’, ‘Linglong’, and ‘Baiyu’ while increasing it in ‘Moka’ (Figure 8a–c,f). Flavor quality responses varied among cultivars, with ‘Linglong’ performing best, followed by ‘Miying’ and ‘Baiyu’, while ‘Moka’ showed relatively weaker improvement.

3.7. Comprehensive Analysis of the Effects of Optimized Nutrient Solution and Supplementary Lighting on the Fruit Production and Quality of Cherry Tomatoes

As illustrated in Figure 9, the application of optimized nutrient solutions effectively decreased nitrate levels while significantly enhancing the content of soluble sugars, flavor, and overall palatability in cherry tomatoes, irrespective of supplementary lighting conditions. However, such optimization might also increase sourness or alter the sugar–acid ratio. Supplementary lighting generally promoted the accumulation of soluble sugars, sweetness, and tomato flavor, although its effects varied markedly among different fruit clusters (e.g., increasing the sugar–acid ratio in the first cluster while reducing sugar content in the third cluster). The combination of optimized nutrient solutions and supplementary lighting exhibited synergistic effects, improving the content of soluble sugars, vitamin C, proteins, and flavor across all fruit clusters. Nevertheless, this combination also increased acidity and slightly reduced the sugar–acid ratio. Among the tested cultivars, ‘Linglong’ demonstrated the most significant improvement in comprehensive fruit quality, followed by ‘Baiyu’, ‘Miying’, and ‘Moka’.

4. Discussion

This study was conducted in a typical serrated multi-span greenhouse in South China, where tomatoes were grown using a low-volume-substrate and a high-density, low-nod-order plant management method (Figure 1b). The purpose of the optimized nutrient solution in the experimental treatment was to moderately inhibit vegetative growth and promote reproductive growth by controlling nitrogen and increasing potassium and phosphorus. Moreover, although the temperature at that time was the suitable temperature for tomato growth, the light intensity was relatively weak during te season throughout the local year (Figure S1), which has a negative impact on the annual tomato production. Therefore, it was desired to increase the yield and quality by using the optimized nutrient solution combined with supplementary lighting (SL). The yield of tomatoes was significantly correlated with the concentration of nitrogen concentration in nutrient solution [11]. In the present study, among the four cultivars, the fruit weight per plant of ‘Baiyu’ was significantly higher at N1 (nitrogen 16 me/L, phosphorus 4 me/L, potassium 8 me/L) than at N2 (nitrogen 10.7 me/L, phosphorus 5.4 me/L, potassium 10.8 me/L) (Figure 4d). These results indicate that the impact of nitrogen supply levels on yield was only reflected in the ‘Baiyu’. The appropriate EC levels for tomatoes vary with cultivar salt tolerance, cultivation pattern, nutrient solution management, and environmental factors. EC of 0.6–1.2 dS/m with small-amount, high-frequency drip irrigation was appropriate [11,29]. EC 4.8 dS/m with 20% drainage enhanced tomato growth [3]. EC 10 dS/m can produce better-quality cherry tomatoes without yield loss [30]. Our latest research reported that SL combined with EC 4.2 dS/m (nitrogen 18 me/L, phosphorus 4.6 me/L, potassium 17.4 me/L) boosted quality, while EC 3.7 dS/m (nitrogen 16 me/L, phosphorus 4.1 me/L, potassium 15.4 me/L) maintained higher yield [31]. In the present study, the EC of the two nutrient solutions were both EC1.6 (N1: nitrogen 10.7 me/L, phosphorus 2.7 me/L, potassium 5.3 me/L and N2: nitrogen 10.7 me/L, phosphorus 2.7 me/L, potassium 5.3 me/L) during the flowering period and EC2.4 (N1: nitrogen 16 me/L, phosphorus 4 me/L, potassium 8 me/L and N2: nitrogen 10.7 me/L, phosphorus 5.4 me/L, potassium 10.8 me/L) from fruit setting to harvest, which were lower than in previous research [31]; however, the nitrogen, potassium and phosphorus were different. The results showed that except for ‘Baiyu’, in the other three cultivars, SL significantly increased single-plant fruit weight at a nitrogen supply level of 16 me/L (N1) but had no significant effect at the lower level (10.7 me/L, N2) (Figure 4d). These results indicate that the effect of SL on cherry tomato yield depends on the nitrogen supply and cultivars; the nitrogen supply of 16 me/L under EC 2.4 dS/m was necessary and sufficient for the fruit production of cherry tomatoes.
The coloring of tomato fruits was mainly determined by the content of carotenoids, which are key indicators of nutrition and commercial quality [32]. As the most abundant cation in the plant, potassium plays a role in osmotic regulation and effectively promotes the accumulation of metabolic substances (including carotenoids) in the fruit [7,23,33]. Previous research showed that appropriate addition of phosphorus and potassium in the nutrient solution can promote the absorption of nitrogen by tomatoes [11], and the increased application of potassium and phosphorus was helpful to alleviate the symptoms of sunburned tomato fruits under high temperature and strong light in the summer growing season; plant potassium uptake rate was correlated with fruit coloring [12]. Regardless of SL, this study demonstrated that the N2 treatment alone accelerated cherry tomato ripening and enhanced pigmentation (Figure 3). In addition, we observed that growth indicators, such as plant height, stem diameter, and leaf number, were improved at N2 rather than at N1 (Table 1), which means the source was enhanced. Crops’ response to SL is complex, sensitive to orientation, intensity, duration, and wavelength [34]. SL significantly increased biomass in ‘Micro-Tom’ tomatoes through enhanced stem diameter and root length [7,35]. Under-canopy SL application promoted growth and leaf photosynthesis [35,36,37]. SL’s growth enhancement was cultivar- and EC-dependent under these conditions [35]. In the current study, the SL source was positioned 15–20 cm above the canopy and adjusted with plant growth (Figure 1b); the SL intensity was maintained at 100 ± 5 µmol/m2/s (30 cm from the LEDs), but it did not improve the fruit coloration of cherry tomatoes. This may have been attributable to the SL mode or intensity being insufficient to fulfill the requirements for enhancing fruit coloration.
Increasing potassium under sufficient phosphorus elevates soluble sugar in vegetables and soluble solids in fruits [9]. Increased potassium fertilizer typically raises titratable acids and lowers soluble sugar/solids-to-acid ratios [38]. The present study yielded comparable results: consistent with the observed changes in fruit coloration, treatment N2 significantly enhanced the contents of soluble sugars, vitamin C, soluble proteins, and soluble solids in cherry tomato fruits. However, such optimization may intensify sourness or alter the sugar-to-acid ratio (Figure 7). This result indicated the role of potassium and phosphorus in fruit quality enhancement, which is consistent with previous studies [11,12]. Moreover, the improvement effects vary among cultivars: for ‘Baiyu’ and ‘Linglong’ it was most significant due to the optimization of the nutrient solution, followed by ‘Miying’ and ‘Moka’, and SL further enhanced these effects (Figure 7). In spite of SL having no promoting effect on fruit coloring at N2, it does promote the accumulation of certain primary metabolic substances, such as soluble sugar, soluble protein, VC, etc. Additionally, the N2 can effectively reduce the nitrate content of fruits (Figure 7a), as its nitrogen supply level was lower than that of N1 (10.7 me/L < 16 me/L). The SL significantly enhances fruit antioxidant capacity and substances [24]. This study demonstrated that the cultivar ‘Baiyu’ had the greatest overall antioxidant capacity enhancement (‘Baiyu’ > ‘Linglong’ > ‘Miying’ > ‘Moka’). For ‘Baiyu’, single-factor treatments increased polyphenol, flavonoid, and FRAP levels, while their combination significantly boosted polyphenol and flavonoid content (Figure 5). It suggested that optimizing nutrient solution combined with SL better promotes antioxidant substance accumulation in ‘Baiyu’ tomato fruits and meets market demands. Cherry tomatoes with TSS ≥ 10% are generally regarded as high-quality ones [25]. In the current study, the N2 treatment can help increase TSS, and SL can further enhance TSS (>10%), although the extent of this improvement varies among different varieties. ‘Linglong’ showed the most significant improvement in TSS, followed by ‘Baiyu’, ‘Moka’, and ‘Miying’ (Figure 6). It was indicated that optimizing the nutrient solution in combination with SL enables cherry tomatoes to achieve high quality standards. The effectiveness of this combination was influenced by both cultivar type and cluster position. Consistent with the quality index results, the combination of N2 and L2 significantly enhanced deliciousness, sweetness, and flavor in all cultivars (Figure 8 and Figure 9) and it could also reduce the firmness, acidity, and peel thickness of most varieties (‘Miying’, ‘Linglong’, ‘Baiyu’) (Figure 8), with T3 being the second best after T4.
Previous studies have also reported that the light environment and nutrition have a synergistic effect: in a fully artificial light factory, the interaction of photoperiod and nutrient solution concentration had significant effects on lettuce quality improvement [39]. Different nutritional conditions can lead to differences in the metabolic components of tomato fruits, and the effect of SL varies depending on the nutritional conditions [40]. In conclusion, optimizing the nutrient solution in combination with SL technology enables cherry tomatoes to achieve high-quality standards. SL can enhance the effect of nitrogen on the yield improvement of cherry tomatoes and amplify the influence of phosphorus and potassium on fruit quality improvement.

5. Conclusions

The combination of standard nutrient solution (N1) and SL demonstrated a significant yield-enhancing effect, which was influenced by nitrogen levels and cultivar types, with a nitrogen concentration of 16 me/L under an EC of 2.4 dS/m found optimal for fruit production. Optimized nutrient solution (N2) combined with SL supports high-quality cherry tomato production, with outcomes also affected by potassium, phosphorus supply, and cultivar-specific responses. In conclusion, supplementary lighting could enhance the effect of nitrogen on yield improvement and amplify the influence of phosphorus and potassium on fruit quality improvement of cherry tomatoes.

Supplementary Materials

The following supporting information can be downloaded at: https://www.mdpi.com/article/10.3390/horticulturae11080874/s1, Figure S1: Net and total solar radiation.

Author Contributions

Conceptualization, Y.Z. and R.C.; methodology, Z.X. and H.L.; investigation, Z.X.; data curation, J.L.; writing—original draft preparation, J.L.; writing—review and editing, Y.Z., S.S. and T.Z.; visualization, J.L.; funding acquisition, Y.Z., R.C. and S.S. All authors have read and agreed to the published version of the manuscript.

Funding

This research was funded by the Science and Technology Development Programs for Huangpu Innovation Research Institute of SCAU (2023GG005), Guangdong Provincial Special Fund for Modern Agriculture Industry Technology Innovation Teams (2024CXTD01), and the China Agriculture Research System (CARS-23-B11).

Data Availability Statement

The original contributions presented in this study are included in the article and Supplementary Material. Further inquiries can be directed to the corresponding author.

Conflicts of Interest

Hongjun Li was employed by the company (Tian Nong Agricultural Service Co., Ltd.). The remaining authors declare that the research was conducted in the absence of any commercial or financial relationships that could be construed as a potential conflict of interest.

References

  1. Rapa, M.; Ciano, S.; Ruggieri, R.; Vinci, G. Bioactive compounds in cherry tomatoes (Solanum lycopersicum var. Cerasiforme): Cultivation techniques classiffcation by multivariate analysis. Food Chem. 2021, 355, e129630. [Google Scholar] [CrossRef] [PubMed]
  2. Tian, Y.; Gao, L. Theory and technology for facility cultivation of high-quality tomato. China Veg. 2021, 2, 30–40, (In Chinese with English Abstract). [Google Scholar]
  3. Ou, X.; Liu, D.; Liu, A.; Liu, H.; Chen, R.; Zhang, Y. Effects of nutrient solution management modes on fruit production and quality of tomatoes grown in extremely root restriction. Sci. Hortic. 2023, 321, 112366. [Google Scholar] [CrossRef]
  4. Lu, T.; Yu, H.; Wang, T.; Zhang, T.; Shi, C.; Jiang, W. Influence of the electrical conductivity of the nutrient solution in different phenological stages on the growth and yield of cherry tomato. Horticulturae 2022, 8, 378. [Google Scholar] [CrossRef]
  5. Chen, Y.; Zou, H.; Sun, L.; Tian, Y.; Gao, L. Effects of different cultivation densities and K+, Na+ ion treatments on tomato yield and quality under substrate cultivation. China Veg. 2019, 368, 26–31, (In Chinese with English abstract). [Google Scholar]
  6. Almeselmani, M.; Pant, R.; Singh, B. Potassium level and physiological response and fruit quality in hydroponically grown tomato. Int. J. Veg. Sci. 2009, 16, 85–99. [Google Scholar] [CrossRef]
  7. Wang, W.; Liu, D.; Qin, M.; Xie, Z.; Chen, R.; Zhang, Y. Effects of supplemental lighting on potassium transport and fruit coloring of tomatoes grown in hydroponics. Int. J. Mol. Sci. 2021, 22, 2687. [Google Scholar] [CrossRef] [PubMed]
  8. San-Martín-Hernández, C.; Gómez-Merino, F.C.; Rivera-Vargas, G.; Saucedo-Veloz, C.; Vaquera-Huerta, H.; Trejo-Téllez, L.I. Tomato fruit quality between clusters is differentially affected by nitrogen and potassium supply. Rev. Fitotec. Mex. Soc. Mex. Fitogenética 2022, 45, 183–192. [Google Scholar] [CrossRef]
  9. Zhang, S.; Zhao, Z.; Sun, Y.; Cai, K.; Wang, W.; Zhao, M. Effect of nitrogen, phosphorus and potassium fertilizers on tomato cultivation in greenhouse. Soil Fertil. Sci. China 2016, 262, 65–71, (In Chinese with English Abstract). [Google Scholar]
  10. Tamai, D. The practical cultivation and technologist training in tomato low node order pinching and high density planting cultivation. Shisetsu Engei 2014, 165, 62–65. (In Japanese) [Google Scholar]
  11. Zhang, Y.; Kiriiwa, Y.; Nukaya, A. Effects of lower nitrogen concentration of nutrient solution combined with K supplementation and changing the concentration on growth, yield, and yellow-shoulder disorder for tomatoes grown in extremely low-volume substrate. Hortic. J. 2015, 84, 46–51. [Google Scholar] [CrossRef]
  12. Zhang, Y.; Suzuki, K.; Liu, H.; Nukaya, A.; Kiriiwa, Y. Fruit yellow-shoulder disorder as related to mineral element uptake of tomatoes grown in high temperature. Sci. Hortic. 2018, 242, 25–29. [Google Scholar] [CrossRef]
  13. Liu, A.; Liu, D.; Yin, D.; Lian, H.; Zhang, Y.; Chen, R. Effects of extremely low drainage rate and nutrient solution concentration regulating on tomato fruit quality. China Veg. 2021, 10, 66–78, (In Chinese with English Abstract). [Google Scholar]
  14. Liu, D.; Chen, J.; Hao, Y.; Yang, X.; Chen, R.; Zhang, Y. Effects of extreme root restriction on the nutritional and flavor quality, and sucrose metabolism of tomato (Solanum lycopersicum L.). Horticulturae 2023, 9, 813. [Google Scholar] [CrossRef]
  15. Liu, Y.; Wang, J.; Li, J.; Luo, X.; Liu, M. Research progress on the effect of LED light quality on the growth and quality of vegetables. Hunan Agric. Sci. 2020, 12, 105–108, (In Chinese with English Abstract). [Google Scholar]
  16. Bertin, N.; Genard, M. Tomato quality as influenced by preharvest factors. Sci. Hortic. 2018, 233, 264–276. [Google Scholar] [CrossRef]
  17. Davis, P.; Burns, C. Photobiology in protected horticulture. Food Energy Secur. 2016, 5, 223–238. [Google Scholar] [CrossRef]
  18. Li, Q.; Liu, Y.; Tian, S.; Liang, Z.; Li, S.; Li, Y.; Wei, M.; Zhang, D. Effectemental lighting on water transport, photosynthetic carbon gain and water use efficiency in greenhouse tomato. Sci. Hortic. 2019, 256, 108630. [Google Scholar] [CrossRef]
  19. Tewolde, F.T.; Lu, N.; Shiina, K.; Maruo, T.; Takagaki, M.; Kozai, T.; Yamori, W. Nighttime supplemental LED inter-lighting improves growth and yield of Single-Truss tomatoes by enhancing photosynthesis in both winter and summer. Front. Plant Sci. 2016, 7, 448. [Google Scholar] [CrossRef] [PubMed]
  20. Gómez, C.; Mitchell, C. Supplemental lighting for greenhouse-grown tomatoes: Intracanopy LED towers vs. overhead HPS lamps. Acta Hortic. 2014, 1037, 855–862. [Google Scholar] [CrossRef]
  21. Heuvelink, E.; Bakker, M.; Hogendonk, L.; Janse, J.; Kaarsemaker, R.; Maaswinkel, R. Horticultural lighting in the Netherlands: New developments. Acta Hortic. 2006, 711, 25–33. [Google Scholar] [CrossRef]
  22. Lu, N.; Maruo, T.; Johkan, M.; Hohjo, M.; Tsukagoshi, S.; Ito, Y.; Ichimura, T.; Shinohara, Y. Effects of supplemental lighting within the canopy at different developing stages on tomato yield and quality of single-truss tomato plants grown at high density. Environ. Control Biol. 2012, 50, 1–11. [Google Scholar] [CrossRef]
  23. Wang, W.; Liu, D.; He, X.; Xia, S.; Zhang, Y.; Chen, R. Effects of supplemental blue light at different stages on tomato plant growth, fruit quality and nutrient uptake. North. Hortic. 2021, 11, 1–9, (In Chinese with English Abstract). [Google Scholar]
  24. He, R.; Wei, J.; Zhang, J.; Tan, X.; Li, Y.; Gao, M.; Liu, H. Supplemental blue light frequencies improve ripening and nutritional qualities of tomato fruits. Front. Plant Sci. 2022, 13, 888976. [Google Scholar] [CrossRef] [PubMed]
  25. Chen, J.; Wang, Y.; Liang, J.; Xie, Z.; Qin, M.; Yang, X.; Chen, R.; Zhang, Y. Comprehensive evaluation of 6 cherry tomato varieties under the substrate bag cultivation mode in multi-span greenhouse in south China. Guangdong Agric. Sci. 2023, 50, 143–145, (In Chinese with English Abstract). [Google Scholar]
  26. Li, H. Principles and Techniques of Plant Physiological and Biochemical Experiments; Higher Education Press: Beijing, China, 2000. (In Chinese) [Google Scholar]
  27. Khan, I.; Azam, A.; Mahmood, A. The impact of enhanced atmospheric carbon dioxide on yield, proximate composition, elemental concentration, fatty acid and vitamin C contents of tomato (Lycopersicon esculentum). Environ. Monit. Assess. 2013, 185, 205–214. [Google Scholar] [CrossRef] [PubMed]
  28. Quadrana, L.; Almeida, J.; Otaiza, S.N.; Duffy, T.; da Silva, J.V.C.; de Godoy, F.; Asís, R.; Bermúdez, L.; Fernie, A.R.; Carrari, F.; et al. Transcriptional regulation of tocopherol biosynthesis in tomato. Plant Mol. Biol. 2012, 81, 309–325. [Google Scholar] [CrossRef] [PubMed]
  29. Zhang, Y.; Kiriiwa, Y.; Nukaya, A. Inffuence of nutrient solution concentration and composition on the growth, uptake patterns of nutrient elements and fruit coloring disorder for tomatoes grown in extremely low-volume substrate. Hortic. J. 2015, 84, 37–45. [Google Scholar] [CrossRef]
  30. Signore, A.; Serio, F.; Santamaria, P. A targeted management of the nutrient solution in a soilless tomato crop according to plant needs. Front. Plant Sci. 2016, 7, 391. [Google Scholar] [CrossRef] [PubMed]
  31. Xie, Z.; Chen, J.; Liu, H.; Chen, R.; Yang, X.; Song, S.; Zhang, Y. Influence of combined supplemental lighting and nutrient solution concentration on fruit production and quality of cherry tomato. Horticulturae 2024, 10, 990. [Google Scholar] [CrossRef]
  32. Chen, X. Effects of Different Light Emitting Diode Sources on Physiological Characteristics and Quality in Chinese Chive. Master’s Thesis, Shandong Agricultural University, Taian, China, 2012. (In Chinese with English Abstract). [Google Scholar]
  33. Serio, F.; Leo, J.J.; Parente, A.; Santamaria, P. Potassium nutrition increases the lycopene content of tomato fruit. J. Hortic. Sci. Biotechnol. 2015, 82, 941–945. [Google Scholar] [CrossRef]
  34. Liu, H.; Son, J.; Niu, G.; Li, Q. Editorial: Growth and quality formation regulated by light in horticulture plants. Front. Plant Sci. 2024, 15, 1414970. [Google Scholar] [CrossRef] [PubMed]
  35. Maeda, K.; Masuda, E.; Tamashiro, T.; Maharjan, G.; Maruo, T. Comparison of supplemental LED top- and interlighting for year-round production of cherry tomato. Agronomy 2022, 12, 1878. [Google Scholar] [CrossRef]
  36. Aponov, M.; Verheul, M.; Dobrev, P.; Paponov, I. Additive effects of light and branching on fruit size and chemical fruit quality of greenhouse tomatoes. Front. Plant Sci. 2023, 14, 1221163. [Google Scholar] [CrossRef] [PubMed]
  37. Jiang, C.; Wu, H.; Zhang, X.; Liu, J.; Li, Y.; Song, Y.; Wang, J.; Zheng, Y. Integrating omics reveals insights into tomato abaxial/adaxial leafy supplemental lighting. Front. Plant Sci. 2023, 14, 1118895. [Google Scholar] [CrossRef] [PubMed]
  38. Song, J.; Huang, H.; Song, S.; Zhang, Y.; Su, W.; Liu, H. Effects of potassium application on flavor compounds of cherry tomato fruits. J. Plant Nutr. 2009, 32, 1451–1468. [Google Scholar] [CrossRef]
  39. Song, J.; Huang, H.; Song Zhang, Y.; Su, W.; Liu, H. Effects of photoperiod interacted with nutrient solution concentration on nutritional quality and antioxidant and mineral content in lettuce. Agronomy 2020, 10, 920. [Google Scholar] [CrossRef]
  40. Kim, Y.X.; Son, S.; Lee, S.; Jung, E.; Lee, Y.; Sung, J.; Lee, C. Combined effects of nutrients×water×light on metabolite composition in tomato fruits (Solanum lycopersicum L.). Plants 2021, 10, 1437. [Google Scholar] [CrossRef] [PubMed]
Figure 1. Growth conditions and experimental treatments. (a) Cultivar information of cherry tomatoes used in the experiment; (b) Growth conditions for cultivated plants; (c) Nutrient solution and light condition treatments. Note: Numbers before “/” represent the ion concentration at EC1.6 dS/m, and the numbers after the “/”represent the ion concentration at EC2.4 dS/m.
Horticulturae 11 00874 g001
Figure 2. Effects of optimized nutrient solution and supplementary lighting on leaf SPAD values of cherry tomatoes. (a) Leaf SPAD value of ‘Miying’; (b) Leaf SPAD value of ‘Linglong’; (c) Leaf SPAD value of ‘Baiyu’; (d) Leaf SPAD value of ‘Moka’. T1, T2, T3 and T4 represent the combinations of two nutrient solutions and two light conditions: N1 and L1, N1 and L2, N2 and L1, N2 and L2. All data represent the average of ten replicates ± standard error. Different letters indicate significant differences among treatments according to Duncan’s multiple range test (p ≤ 0.05).
Horticulturae 11 00874 g002
Figure 3. Effects of optimized nutrient solution and supplementary lighting on fruit appearance and coloring. (a) Fruit appearance of ‘Miying’; (b) Fruit appearance of ‘Linglong’; (c) Fruit appearance of ‘Baiyu’; (d) Fruit appearance of ‘Moka’; (e) Fruit hue angle value. T1, T2, T3 and T4 represent the combinations of two nutrient solutions and two light conditions: N1 and L1, N1 and L2, N2 and L1, N2 and L2. All data represent the average of ten to fifteen replicates ± standard error. Different letters indicate significant differences among treatments according to Duncan’s multiple range test (p ≤ 0.05).
Horticulturae 11 00874 g003
Figure 4. Effects of optimized nutrient solution and supplementary lighting on fruit shape and weight of cherry tomatoes (a) Fruit in the third cluster; (b) Fruit in the second cluster; (c) Fruit in the first cluster; (d) Fruit weight per plant. T1, T2, T3 and T4 represent the combinations of two nutrient solutions and two light conditions: N1 and L1, N1 and L2, N2 and L1, N2 and L2. All data represent the average of five to ten replicates ± standard error. Different letters indicate significant differences among treatments according to Duncan’s multiple range test (p ≤ 0.05).
Horticulturae 11 00874 g004
Figure 5. Effects of optimized nutrient solution and supplementary lighting on the antioxidant capacity of cherry tomatoes. (a) Polyphenols content; (b) Flavonoid content; (c) DPPH; (d) FRAP. T1, T2, T3 and T4 represent the combinations of two nutrient solutions and two light conditions: N1 and L1, N1 and L2, N2 and L1, N2 and L2. All data represent the average of three replicates ± standard error. Different letters indicate significant differences among treatments according to Duncan’s multiple range test (p ≤ 0.05).
Horticulturae 11 00874 g005
Figure 6. Effects of optimized nutrient solution and supplementary lighting on total soluble solids of cherry tomato fruits. (a) Fruits in the first cluster; (b) Fruits in the second cluster; (c) Fruits in the third cluster; (d) Fruits in the 4th cluster. T1, T2, T3 and T4 represent the combinations of two nutrient solutions and two light conditions: N1 and L1, N1 and L2, N2 and L1, N2 and L2. All data represent the average of ten to fifteen replicates ± standard error. Different letters indicate significant differences among treatments according to Duncan’s multiple range test (p ≤ 0.05).
Horticulturae 11 00874 g006
Figure 7. Effects of optimized nutrient solution and supplementary lighting on the nutritional quality of cherry tomato fruits. (a) Nitrate content; (b) VC content; (c) Soluble protein content; (d) Total soluble sugar content; (e) Titratable acid content; (f) Sugar–acid ratio. T1, T2, T3 and T4 represent the combinations of two nutrient solutions and two light conditions: N1 and L1, N1 and L2, N2 and L1, N2 and L2. All data represent the average of three replicates ± standard error. Different letters indicate significant differences among treatments according to Duncan’s multiple range test (p ≤ 0.05).
Horticulturae 11 00874 g007
Figure 8. Effects of optimized nutrient solution and supplementary lighting on fruit flavor tasting. (a) Scores for the deliciousness; (b) Scores for the sweetness. (c) Scores for the sourness; (d) Scores for the hardness. (e) Scores for the peel thickness. (f) Scores for the tomato flavor. T1, T2, T3 and T4 represent the combinations of two nutrient solutions and two light conditions: N1 and L1, N1 and L2, N2 and L1, N2 and L2.
Horticulturae 11 00874 g008
Figure 9. Cluster heatmap analysis of the effects of optimized nutrient solution and supplementary lighting on fruit production and quality of cherry tomatoes. Results are visualized using a false color scale with red and green exhibiting the increase and decrease response, respectively. T1, T2, T3 and T4 represent the combinations of two nutrient solutions and two light conditions: N1 and L1, N1 and L2, N2 and L1, N2 and L2.
Horticulturae 11 00874 g009
Table 1. Effects of optimized nutrient solution and supplementary lighting on the growth of cherry tomato plants.
CultivarTreatmentsPlant HeightStem DiameterLeaf NumberLeaf Area
(C)(cm)(mm)Per Plant(cm2/Plant)
‘Miying’T1127.57 ± 3.11 a13.64 ± 1.00 b25.83 ± 1.45 a468.25 ± 25.80 b
T2128.71 ± 3.44 a13.72 ± 0.39 b25.20 ± 1.31 a506.27 ± 31.13 ab
T3127.74 ± 2.43 a14.60 ± 0.41 ab27.56 ± 1.45 a576.99 ± 18.83 ab
T4128.76 ± 1.99 a15.70 ± 0.44 a28.17 ± 1.08 a585.69 ± 20.91 a
‘Linglong’T1148.17 ± 1.63 ab14.63 ± 0.39 b25.63 ± 0.50 b509.34 ± 21.13 a
T2144.20 ± 1.36 b15.62 ± 0.79 ab25.67 ± 0.71 b498.66 ± 47.38 a
T3150.61 ± 2.83 ab14.70 ± 0.44 b29.40 ± 1.17 a484.18 ± 43.46 a
T4153.88 ± 2.19 a16.53 ± 0.29 a29.60 ± 1.02 a413.47 ± 32.48 a
‘Baiyu’T1139.13 ± 1.56 b14.61 ± 0.32 b23.83 ± 0.51 a711.53 ± 58.60 a
T2144.77 ± 0.99 ab14.78 ± 0.52 ab25.57 ± 0.65 a773.96 ± 36.17 a
T3138.28 ± 2.27 b14.77 ± 0.34 ab23.86 ± 0.74 a656.47 ± 59.28 a
T4149.05 ± 2.25 a16.17 ± 0.50 a25.26 ± 0.71 a775.62 ± 27.58 a
‘Moka’T1142.24 ± 2.46 bc16.42 ± 0.28 ab24.20 ± 1.00 b536.74 ± 48.03 a
T2140.50 ± 3.14 bc15.50 ± 0.64 b24.33 ± 0.90 b537.42 ± 47.77 a
T3149.81 ± 2.64 ab18.24 ± 1.33 a27.71 ± 0.68 a536.95 ± 34.70 a
T4153.22 ± 2.37 a16.97 ± 0.46 ab27.73 ± 0.81 a566.27 ± 25.03 a
ANOVA
significance
C********
N******NS
LNSNSNSNS
C × N*NS*NS
C × LNS*NSNS
N × LNSNSNSNS
C × N × LNSNSNSNS
Note: T1, T2, T3 and T4 represent the combinations of two nutrient solutions and two light conditions: N1 and L1, N1 and L2, N2 and L1, N2 and L2. Values are presented as “mean ± standard error”. Different letters following data within the same column indicate significant differences (p ≤ 0.05) as determined by Duncan’s multiple range test; NS means not significantly different; * and ** mean significantly different at 5% and 1% levels, respectively.
Disclaimer/Publisher’s Note: The statements, opinions and data contained in all publications are solely those of the individual author(s) and contributor(s) and not of MDPI and/or the editor(s). MDPI and/or the editor(s) disclaim responsibility for any injury to people or property resulting from any ideas, methods, instructions or products referred to in the content.

