Article

Impact of Reduced Chemical Fertilizer and Organic Amendments on Yield, Nitrogen Use Efficiency, and Soil Microbial Dynamics in Chinese Flowering Cabbage

1
School of Civil and Hydraulic Engineering, Ningxia University, Yinchuan 750021, China
2
School of Enology and Horticulture, Ningxia University, Yinchuan 750021, China
3
Engineering Research Center of Water-Efficient Utilization in Modern Agriculture for Arid Regions, Ministry of Education, Yinchuan 750021, China
4
Jiangsu Academy of Agricultural Sciences, Nanjing 210000, China
*
Author to whom correspondence should be addressed.
Horticulturae 2025, 11(7), 859; https://doi.org/10.3390/horticulturae11070859
Submission received: 6 June 2025 / Revised: 14 July 2025 / Accepted: 16 July 2025 / Published: 21 July 2025
(This article belongs to the Section Plant Nutrition)

Abstract

(1) Background: The escalating issue of soil degradation caused by excessive chemical fertilizer application poses significant threats to the sustainable development of Chinese flowering cabbage (Brassica campestris L. ssp. chinensis (L.) var. utilis Tsen et Lee) production. This research aimed to identify the impacts of reduced chemical fertilizer application integrated with organic amendments on cabbage yield and rhizosphere soil microenvironment characteristics. (2) Methods: A biennial field experiment was conducted during the 2022–2023 growing seasons at Lijun Town, Yinchuan City, Ningxia Hui Autonomous Region. Five treatments were tested: (i) Control (CK, no fertilizer); (ii) Conventional chemical fertilization (CF1, chemical fertilizer only); (iii) Reduced chemical fertilization (CF2, 30% less chemical fertilizer); (iv) CF2 + Well-decomposed chicken manure (FCM, 30% less chemical fertilizer + rotted chicken manure); and (v) CF2 + Vermicompost (FEM, 30% less chemical fertilizer + vermicompost). (3) Results: In 2023, the FCM treatment reduced electrical conductivity (EC) by 24.80% and pH by 2.16%, while the FEM treatment decreased EC by 31.13% and pH by 3.84% compared to controls. The FEM treatment significantly enhanced total nitrogen content by 12.71% and 8.85% relative to CF1 and FCM treatments, respectively. Compared to CF1, FEM increased soil organic matter content by 10.49% in 2022 and 11.24% in 2023. Organic fertilizer amendments elevated available nitrogen, phosphorus, and potassium levels while enhancing sucrase activity: FCM and FEM treatments increased sucrase activity by 23.62% and 32.00%, respectively, in 2022. Organic fertilization improved bacterial diversity and richness, optimized microbial community structure, and increased the relative abundance of Bacillus. It also upregulated microbial metabolic pathways related to carbohydrate and amino acid metabolism. Soil nutrients and bacterial community structure showed positive correlations with yield, whereas soil enzyme activities exhibited negative correlations. Key factors influencing yield were identified as Proteobacteria, Chloroflexi, available potassium, organic matter, available nitrogen, Actinobacteria, Firmicutes, total nitrogen, pH, and sucrase activity. (4) Conclusions: Integrated analysis of yield and soil microenvironmental parameters demonstrates that the fertilization regimen combining 30% chemical fertilizer reduction with vermicompost amendment (FEM) constitutes a more efficient fertilization strategy for Chinese flowering cabbage, making it suitable for regional promotion in the Ningxia area.

1. Introduction

Chinese flowering cabbage (Brassica campestris L. ssp. chinensis (L.) var. utilis Tsen et Lee), a cruciferous variety belonging to the Brassica genus, is native to southern China and was introduced to Ningxia, China, in 2006 [1]. As a traditional Chinese vegetable, it has gained popularity among consumers in Asian and Western countries [2]. The arid summer climate, significant diurnal temperature variation, and abundant sunlight in Ningxia promote the accumulation of sugars and proteins during growth, resulting in superior nutritional value, reduced fiber content, vibrant green coloration, and higher quality compared to traditional production regions [3]. By 2020, Ningxia—recognized as a star production area for Hong Kong-bound vegetables—had cultivated 15,100 hectares of Chinese flowering cabbage, generating an annual output value exceeding 3.6 billion CNY, making it a pivotal pillar of the local agricultural economy. This crop not only serves as the cornerstone of Ningxia’s “winter vegetables northward and summer vegetables southward” strategy but also constitutes a major source of agricultural revenue. However, with the expansion of large-scale cultivation, soil degradation caused by excessive chemical fertilizer application has become increasingly severe, threatening the sustainable development of the industry. A 2014 study by the Ministry of Agriculture of China highlighted that the application rates of inorganic fertilizers had surpassed safe thresholds, with inefficient and excessive usage remaining a critical concern [4,5].
Studies demonstrate that organic fertilizer application can meet plant nutritional demands, improve soil structure, regulate rhizosphere microbial communities, enhance plant stress resistance, and increase crop nutrient uptake capacity and fertilizer use efficiency, thereby achieving dual improvements in yield and quality [6]. Long-term organic fertilization significantly elevates soil total nitrogen content, with the combined application of organic and inorganic fertilizers exerting the greatest impact on total nitrogen accumulation [7]. Increased organic inputs raise soil organic matter levels, as root litter and other residues accumulate in the soil, expanding the soil carbon pool and enhancing system productivity [8]. In maize cultivation, the partial substitution of chemical fertilizers with semi-bioorganic fertilizers improves soil structure while elevating organic matter and available nutrient contents. The integrated application of organic and inorganic fertilizers has been proven to boost crop yields and serves as a key factor in enhancing yield stability [9,10]. Current research identifies the optimal substitution ratio of organic nitrogen for inorganic nitrogen to range between 20% and 30%. Excessive organic fertilizer application may result in no significant yield improvement but instead inhibit plant growth [11].
Organic fertilizers, as soil amendments, enhance crop productivity in agricultural ecosystems through multiple pathways, including elevating soil nutrient availability, improving soil microbial activity, and altering the diversity and composition of microbial communities [12]. Fertilization practices directly influence microbial community structure by modifying soil nutrient content and chemical properties, with single fertilizer applications typically leading to structural simplification of soil microbiota [13]. Research indicates that organic fertilizer application increases soil nutrient concentrations, with Bacteroidetes significantly proliferating in soils receiving combined organic and chemical fertilizers [14]. Organic fertilizers activate diverse soil microorganisms, playing increasingly critical roles in enhancing crop production, restoring soil fertility, and suppressing soil-borne pathogens [15]. Among bacterial phyla, Proteobacteria, Actinobacteria, and Acidobacteria dominate soil ecosystems. Proteobacteria represent copiotrophic taxa sensitive to carbon sources, with most members functioning as key organic matter transformers that promote plant growth and disease suppression. These dominant phyla contribute to improved nitrogen use efficiency and plant development [16,17]. The integration of organic fertilizers with optimized chemical inputs enhances soil physicochemical properties. The substantial organic and inorganic constituents in organic fertilizers stimulate metabolic activities of Proteobacteria and arbuscular mycorrhizal fungi, thereby restructuring soil microbial communities, augmenting soil fertility, and ultimately promoting crop growth [18].
Current research on chemical fertilizer reduction combined with organic amendments predominantly focuses on field crops, while studies targeting vegetable crops, particularly Chinese flowering cabbage, remain limited, with scant documentation on soil microenvironmental impacts. This study systematically investigates the effects of reduced chemical fertilizer coupled with organic amendments on the soil microenvironment of Chinese flowering cabbage, aiming to elucidate interactions between microbial communities and plant growth. The findings provide scientific insights for the sustainable production of Chinese flowering cabbage, optimizing fertilizer management strategies for vegetable crops and advancing sustainable agricultural development.

2. Materials and Methods

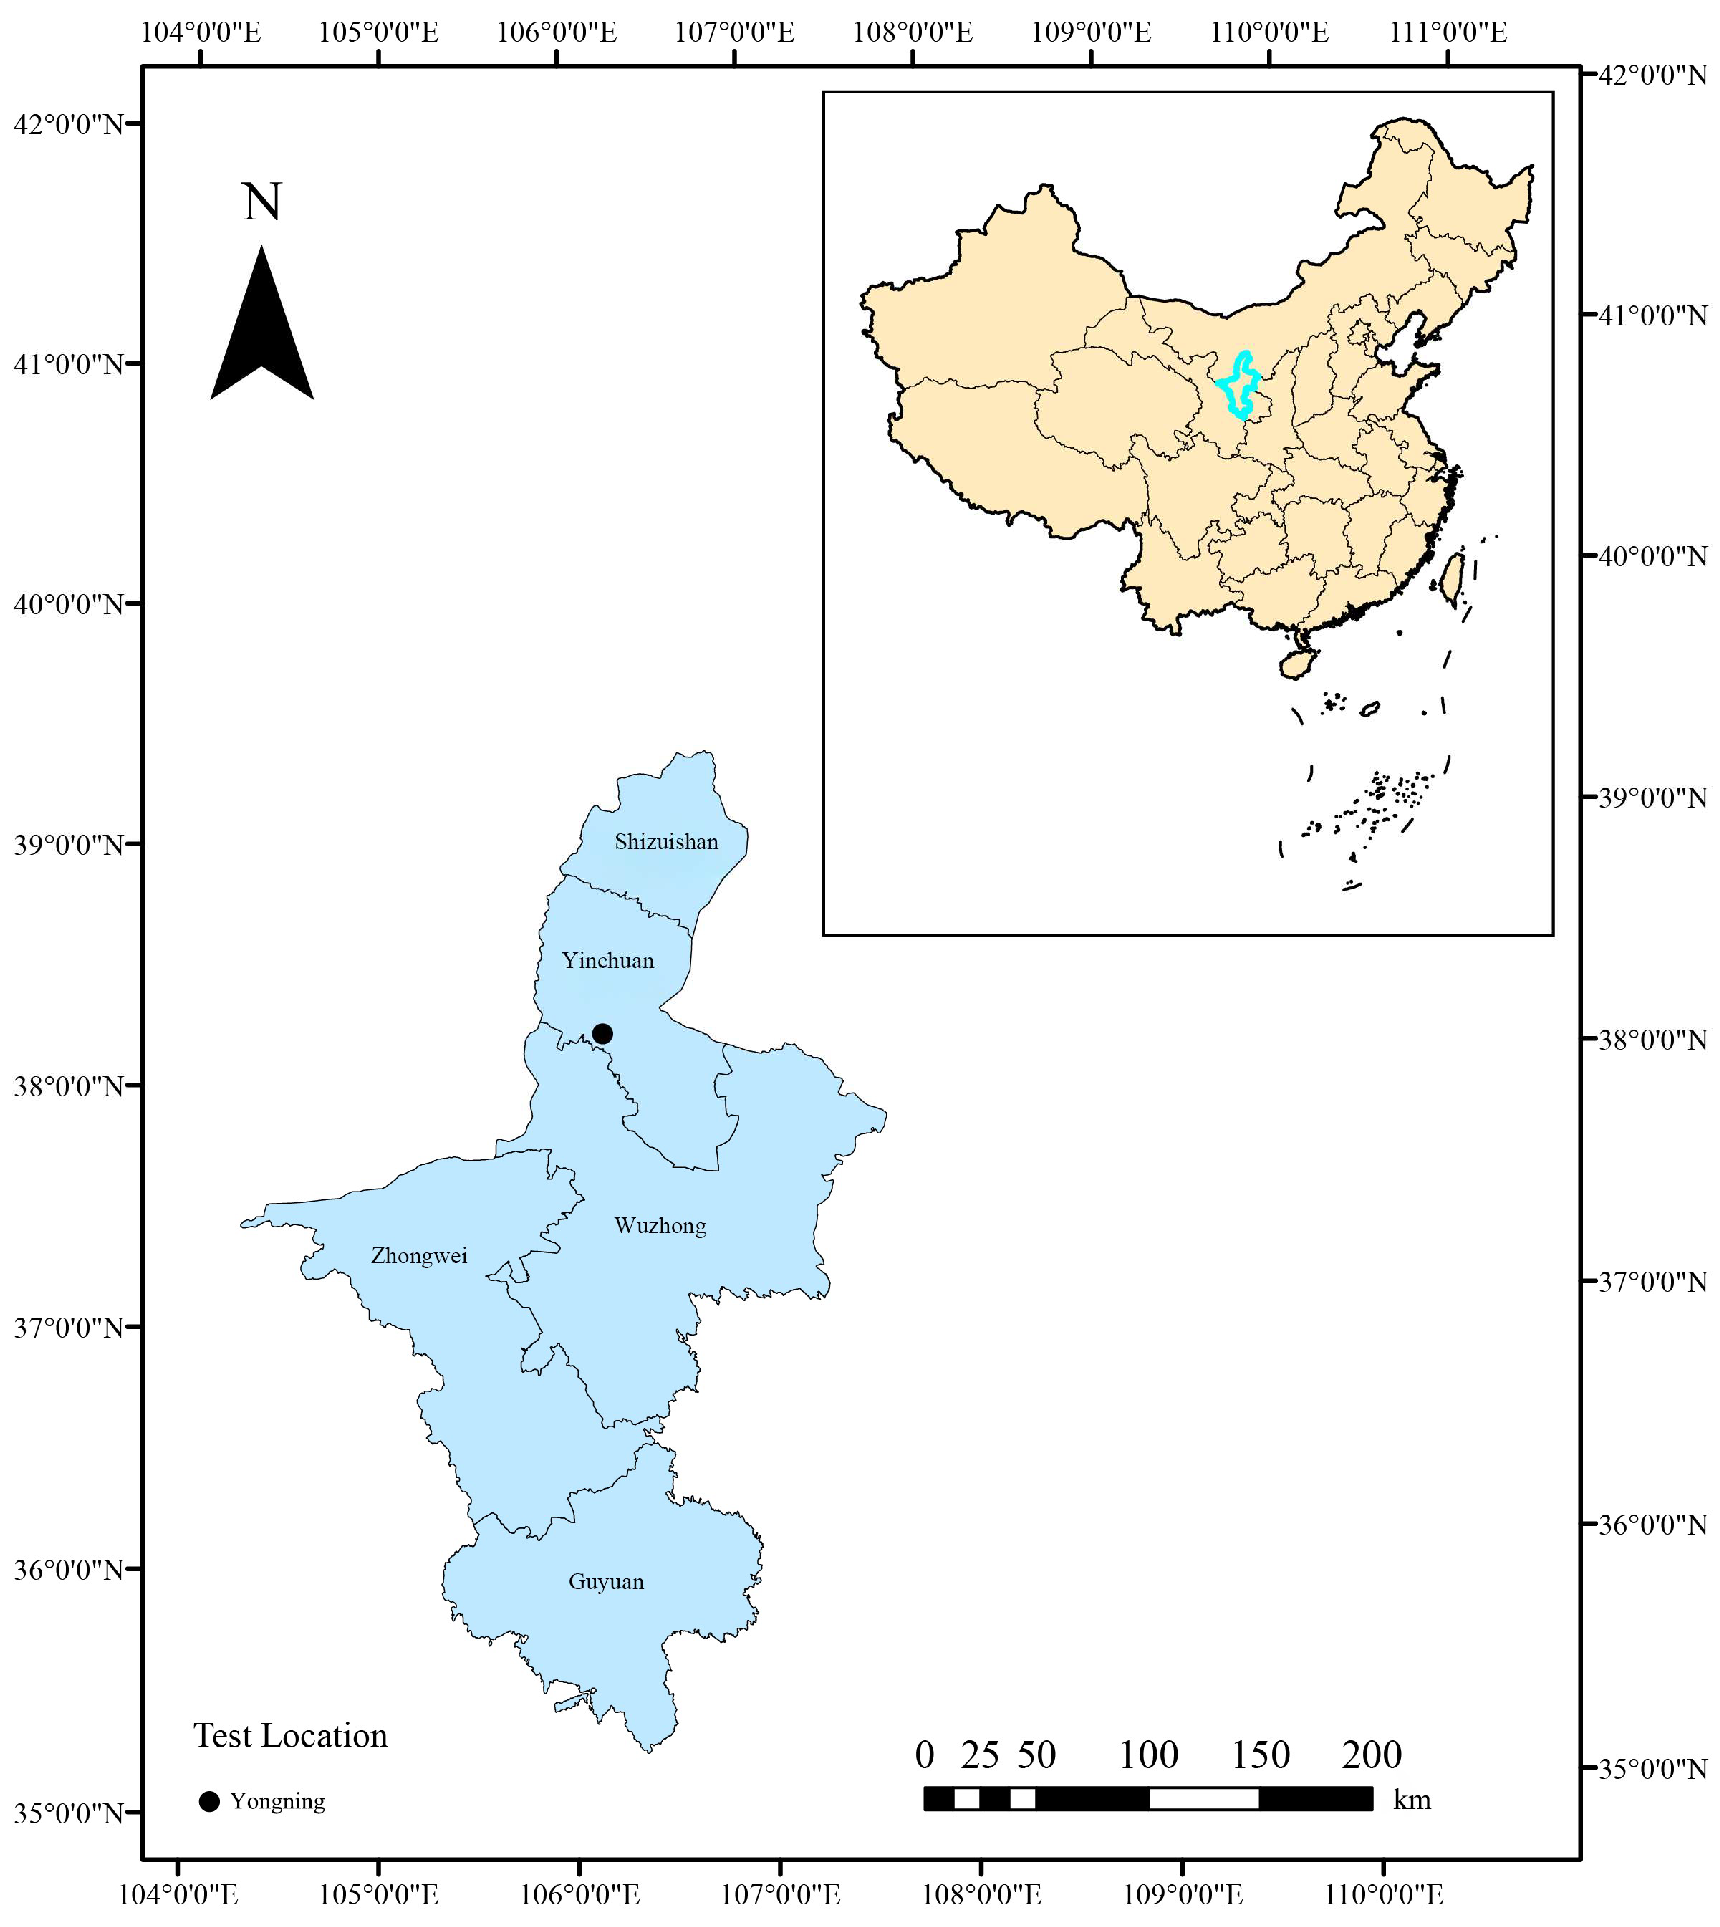
2.1. Experimental Materials and Site

The tested flowering Chinese cabbage (Brassica campestris L. ssp. chinensis (L.) var. utilis Tsen et Lee) cultivar was ‘Jianye-70’, with a growth cycle of 55–65 days, provided by Ningxia Yuefeng Ecological Agriculture Technology Co., Ltd., Yinchuan, China. Sowing occurred on 10 September 2022 and 10 September 2023. The trials were conducted from 10 September to 5 November 2022, and 10 September to 5 November 2023, at a vegetable supply base for Hong Kong in Lijun Town, Yongning County, Yinchuan City, Ningxia (38°27′ N, 106°25′ E) (Figure 1). The region features a temperate arid climate, with an average altitude of 1223 m, mean annual temperature of 8.9 °C, and mean annual precipitation of 179.6 mm. As an intensive vegetable production area under long-term agricultural use, management records indicated that the experimental field had been continuously cultivated with cruciferous vegetables for more than 3 years. The study plots had undergone long-term conventional fertilization management prior to the experiment. Pre-trial baseline soil properties were pH 8.75, electrical conductivity (EC) 0.81 mS·cm−1, organic matter 5.83 g·kg−1, total nitrogen 0.36 g·kg−1, available nitrogen 1.45 mg·kg−1, available phosphorus 150.47 mg·kg−1, and available potassium 33.41 mg·kg−1.

2.2. Experimental Design

The experiment comprised five treatments, with three treatments—chemical fertilizer alone (CF1), 30% reduced chemical fertilizer + composted chicken manure (FCM), and 30% reduced chemical fertilizer + vermicompost (FEM)—receiving identical nitrogen inputs. The treatments were (1) No fertilization (CK); (2) Chemical fertilizer alone (CF1); (3) 30% reduced chemical fertilizer (CF2); (4) 30% reduced chemical fertilizer + composted chicken manure (FCM); (5) 30% reduced chemical fertilizer + vermicompost (FEM). Each treatment had three replicates, with plot dimensions of 30 m2 (15 m length × 2 m width), totaling 15 plots. Treatment 2 (CF1) received the conventional fertilizer rate, determined through local survey-based calculations. Chemical and organic fertilizers were sourced from Huasheng Green Energy (Ningxia) Agricultural Technology Co., Ltd., Yinchuan, China.
Tested organic fertilizers had the following properties: composted chicken manure contained 3.26 g·kg−1 total nitrogen; vermicompost contained 2.65 g·kg−1 total nitrogen. Chemical fertilizers used were urea (46% N), single superphosphate (12% P2O5), and potassium sulfate (50% K2O). Application rates are detailed in Table 1. All organic fertilizers and phosphorus fertilizers were applied as basal dressing one week before sowing. Nitrogen and potassium fertilizers were split-applied: 60% as basal dressing and 40% as topdressing at the three-true-leaf stage of Chinese flowering cabbage. Topdressing occurred at 5, 12, and 20 days after the three-true-leaf stage, applying 10%, 10%, and 20% of the total fertilizer amount, respectively. Cultivation followed a double-row ridge pattern with sprinkler irrigation. Weeding, pesticide application, and other field management practices aligned with standard technical protocols.

2.3. Determination Items and Methods

2.3.1. Soil Indicators

Soil sampling and analysis: After plant removal, intact root systems were randomly excavated. Soil adhering to fibrous roots was gently brushed off using fine brushes and collected in sterile Ziplock bags (≥2 kg per sample). Samples were immediately flash-frozen in liquid nitrogen and stored at −80 °C for subsequent soil chemical and microbiological analyses.
Soil chemical properties:
The analysis of air-dried and sieved soil samples was performed by weighing 10.00 g of air-dried soil passed through a 1 mm aperture sieve into a plastic bottle. Then, 50 mL of CO2-free water (pre-boiled for 10 min and cooled) was added. The mixture was oscillated for 5 min in a mechanical shaker to ensure thorough dispersion of soil particles, followed by a 30 min settling period. The pH and electrical conductivity (EC) of the suspension were measured using calibrated instruments: a pH meter (model PHS-25; Leici, Shanghai, China) and an EC meter (model DDS-307A; Leici, Shanghai, China).
Soil organic matter (SOM) was quantified by the potassium dichromate oxidation–capacity method [19]. Soil organic matter (SOM) was determined using the potassium dichromate oxidation–external heating method. Air-dried soil samples sieved to 0.25 mm (0.50 g ± 0.0001 g) were weighed into hard glass tubes. Then, 0.1 g of silver sulfate powder, 5.00 mL of 0.8 mol·L−1 potassium dichromate standard solution, and 5 mL of concentrated sulfuric acid were added. Blank controls were prepared concurrently by replacing soil with 0.5 g of silicon dioxide. After sealing, tubes were placed in an oil bath at 180 °C. Timing commenced when internal solutions reached boiling and digestion proceeded for exactly 5 min. Cooled digests were transferred quantitatively to 250 mL Erlenmeyer flasks. Rinsates were combined and diluted to 60–70 mL with deionized water. Subsequently, 3–4 drops of o-phenanthroline indicator were added, and titration was performed with 0.2 mol·L−1 ferrous sulfate standard solution until the color exhibited a sharp transition from orange-yellow through blue-green to brick-red. Volumes of ferrous sulfate consumed by samples and blanks were recorded as V and V0, respectively. SOM content (g·kg−1) was calculated as (C × 5/V0) × [(V0 − V) × 0.003 × 1.724 × 1.10 × 1000]/m, where C = concentration of K2Cr2O7 solution (0.8 mol·L−1); 5 = volume of K2Cr2O7 added (mL); 0.003 = millimolar mass of carbon (g·mmol−1); 1.10 = oxidation correction factor; 1.724 = organic carbon conversion coefficient (van Bemmelen factor); m = oven-dry soil mass (g); V0 = blank titration volume (mL); V = sample titration volume (mL).
Total nitrogen (TN) was analyzed via Kjeldahl method. Air-dried soil samples sieved to 0.25 mm (0.500–1.000 g) were weighed into digestion tubes, moistened with 0.5–1 mL deionized water, and mixed with 2 g of catalyst mixture (K2SO4:CuSO4:Se = 100:10:1) and 5 mL concentrated sulfuric acid. After low-temperature preheating (10–15 min), samples were digested at 380 °C until the digest turned grayish-white, followed by continued digestion for 1 h. Cooled digests were diluted to 100 mL with deionized water, with blank controls processed concurrently. For distillation, 25 mL aliquots of digest were transferred to Kjeldahl flasks, combined with 20 mL of 40% NaOH solution, and distilled. Liberated ammonia was trapped in 5 mL of 20 g·L−1 boric acid-indicator solution. The distillate was titrated with 0.01 mol·L−1 sulfuric acid standard solution to the endpoint (color transition from blue-green to reddish-purple). TN content (g·kg−1) was calculated as (V − V0) × C × 0.014 × 1000/m, where V = Titration volume for sample (mL); V0 = Titration volume for blank (mL); C = Concentration of H2SO4 standard solution (0.01 mol·L−1); 0.014 = Millimolar mass of nitrogen (g·mmol−1); m = Oven-dry soil mass (g).
Available nitrogen (AN) was determined by the alkali-hydrolyzation diffusion method. Alkaline-hydrolyzable nitrogen (AN) was determined using the alkaline hydrolysis diffusion method. Air-dried soil samples (5.00 g, sieved to 1 mm) were weighed into extraction bottles. Then, 50 mL of 1.0 mol·L−1 K2SO4 solution was added. The mixture was oscillated at 180 rpm and 25 °C for 30 min, followed by 5 min sedimentation and filtration. A 10 mL aliquot of the filtrate was transferred to a Kjeldahl flask, then mixed with 20 mL of 40% NaOH solution and two spatulas of catalyst (K2SO4:CuSO4:Se = 100:10:1). Blank controls were prepared using 10 mL saturated K2SO4 solution. Liberated ammonia was distilled and absorbed in 5 mL of 20 g·L−1 boric acid-indicator solution. Titration was performed with 0.01 mol·L−1 H2SO4 standard solution to the endpoint (distinct color transition from blue-green to reddish-purple). Available nitrogen content (mg·kg−1) was calculated as (V − V0) × C × 14 × 1000/m, where V = Titration volume for sample (mL); V0 = Titration volume for blank (mL); C = Concentration of H2SO4 standard solution (0.01 mol·L−1); 14 = Millimolar mass of nitrogen (g·mmol−1); 1000 = Unit conversion factor (to mg·kg−1); m = Oven-dry soil mass (5.00 g).
Note: The endpoint color shift corresponds to the mixed indicator (bromocresol green–methyl red) in boric acid solution.
Available phosphorus (AP) was measured using ammonium molybdate colorimetry. Air-dried soil samples (2.50 g, sieved to 1 mm) were weighed into extraction bottles, then mixed with 0.5 g phosphorus-free activated carbon and 50 mL of 0.5 mol·L−1 NaHCO3 extracting solution. The mixture was oscillated at 180 ± 20 rpm and 25 ± 1 °C for 30 min, then immediately filtered through phosphorus-free filter paper. A 10 mL aliquot of filtrate (or 2.5–5.0 mL for high-P samples diluted to 10 mL with extractant) was transferred to a 50 mL volumetric flask. After adding 5 mL of molybdenum antimony ascorbate chromogenic agent and thorough mixing (to release CO2), the solution was diluted to volume. Blank controls were prepared concurrently. Following 30 min color development, absorbance was measured at 700 nm using a spectrophotometer (model 7230G; Jinghua, Shanghai, China). AP content (mg·kg−1) was calculated as Psoil = (P × Vshol × Vext)/(m × Valip) × 1000, where P = Phosphorus concentration in colored solution (mg·L−1, derived from standard curve); Vshol = Final chromogenic volume (50 mL); Vext = Total extraction volume (100 mL, accounting for 50 mL initial extractant and subsequent rinse dilution); Valip = Aliquot volume of extract used for color development (10 mL); m = Oven-dry soil mass (2.50 g); 1000 = Conversion factor to mg·kg−1.
Available potassium (AK) was extracted with ammonium acetate solution and quantified by flame photometry [20]. Available potassium (AK) was determined using the ammonium acetate extraction–flame photometry method. Air-dried soil samples (5.00 g, sieved to 1 mm) were weighed into extraction bottles. Subsequently, 50 mL of 1 mol·L−1 ammonium acetate solution (pH 7.0) was added. The mixture was oscillated at 180 r·min−1 for 30 min at 15–25 °C. After oscillation, the suspension was immediately filtered through quantitative filter paper. The filtrate was analyzed using a flame photometer (model HD-22; Huorde Electronics, Weifang, China), with instrument calibration performed every 20 samples. The zero point was adjusted using a blank solution (extractant without soil), while the full-scale reading (100 units) was calibrated against a 30 mg·L−1 potassium standard solution. Standard Curve Preparation: Potassium standard series (0–30 mg·L−1) were prepared by transferring 0, 3.00, 6.00, 9.00, 12.00, and 15.00 mL aliquots of a 100 mg·L−1 potassium stock solution into 50 mL volumetric flasks. Each flask was diluted to volume with 1 mol·L−1 ammonium acetate solution. Calculation: Soil available potassium content (mg·kg−1) was calculated as Ksoil = (K × V)/m, where K = Potassium concentration (mg·L−1) derived from the regression equation based on flame photometer readings; V = Volume of extractant (50 mL); m = Oven-dry soil mass (5.00 g).
Note: Results reflect exchangeable and water-soluble potassium fractions. All reagents and glassware were verified as phosphorus-free to prevent contamination.
Soil Enzyme Activity Analysis: Sucrase activity was quantified using the 3,5-dinitrosalicylic acid (DNS) colorimetric method. Standard Curve Preparation: Aliquots of 0–0.5 mL of 1 mg·mL−1 glucose standard solution were transferred into test tubes, diluted to 1 mL with distilled water, and mixed with 3 mL DNS reagent. After boiling in a water bath for exactly 5 min, tubes were immediately cooled in an ice bath to room temperature. Absorbance was measured at 508 nm against a blank (zero adjustment). A standard curve was plotted with glucose concentration (mg·mL−1) as the abscissa and OD 508 as the ordinate. Soil Sucrase Assay: A 5 g aliquot of air-dried soil (sieved ≤ 2 mm) was placed in a 50 mL Erlenmeyer flask. Then, 15 mL of 8% sucrose solution, 5 mL of pH 5.5 phosphate buffer, and 5 drops of toluene were added. After thorough mixing, samples were incubated at 37 °C for 24 h. Post-incubation, suspensions were immediately filtered. A 1 mL aliquot of filtrate was transferred to a 50 mL volumetric flask, mixed with 3 mL DNS reagent, and heated in a boiling water bath for 5 min. After cooling under tap water flow for 3 min, solutions were diluted to 50 mL with distilled water. Absorbance was measured at 508 nm using a spectrophotometer (model 7230G; Jinghua, Shanghai, China). Controls included substrate-free control (no sucrose) for each soil sample. Soil-free control (no soil) for the entire experiment. Sample dilutions or reduced soil weights were applied if absorbance exceeded the standard curve range. Calculation: Sucrase activity was expressed as milligrams of glucose produced per gram of dry soil per 24 h, calculated as Sucrase Activity = (asample − asoil-free − asubstrate-free) × n/m, where asample, asoil-free, asubstrate-free = Glucose content (mg) derived from the standard curve for sample, soil-free control, and substrate-free control, respectively; n = Dilution factor (e.g., 50 for 1 mL filtrate diluted to 50 mL); m = Oven-dry soil mass (g).
Soil Urease Activity Analysis: Urease activity was determined using the phenol-sodium hypochlorite colorimetric method. Air-dried soil samples (5.00 g, sieved ≤ 2 mm) were weighed into incubation flasks, mixed with 1 mL toluene, and equilibrated for 15 min. Subsequently, 10 mL of 10% urea solution and 20 mL of pH 6.7 citrate buffer were added. Samples were incubated at 37 °C for 24 h. Post-incubation, suspensions were filtered. A 1-mL aliquot of filtrate was transferred to a 50-mL volumetric flask. Then, 4 mL of sodium phenolate solution and 3 mL of sodium hypochlorite solution were added sequentially with continuous shaking. After 20 min of color development, the volume will be made up to 50 mL with distilled water. Absorbance was measured at 578 nm within 1 h using a spectrophotometer (model 7230G; Jinghua, Shanghai, China). Standard Curve Preparation: Ammonium nitrogen (NH4+-N) working standards (0–13 mL) were diluted to 20 mL with distilled water and subjected to identical chromogenic treatment. A concentration-absorbance regression equation was established. Calculation: Urease activity (Ure, mg NH3-N·g−1·24 h−1) was calculated as: Ure = [(as−at−am) × V × n]/m, where: as = NH3-N mass derived from sample (mg, via standard curve); at = NH3-N mass from soil-free control (no soil); am = NH3-N mass from substrate-free control (distilled water instead of urea); V = Chromogenic solution volume (50 mL); n = Dilution factor (total extract volume/aliquot volume); m = Oven-dry soil mass (g).
Note: Controls account for background ammonium and reagent interference. Sodium hypochlorite must be added dropwise with vigorous shaking to ensure homogeneous reaction.
Catalase activity was assessed via potassium permanganate titration [21]. Air-dried soil samples (2.00 g, sieved ≤ 2 mm) were weighed into 150 mL conical flasks. Then, 40 mL distilled water and 5 mL of 0.3% H2O2 solution were added, and flasks were immediately sealed with gas-tight stoppers. Soil-free controls (40 mL H2O + 5 mL H2O2) were processed concurrently. After oscillating at 25 °C for 20 min, reactions were terminated by adding 5 mL of 1.5 mol·L−1 H2SO4. Suspensions were filtered through quantitative filter paper. A 25 mL aliquot of filtrate was titrated with 0.02 mol·L−1 KMnO4 solution until a persistent pale pink endpoint (≥30 s stability) was reached. Calculation: Catalase activity was expressed as milligrams of H2O2 decomposed per gram of dry soil per 20 min: Catalase Activity (V − Vs) × C × 51/V0 × 17/W, where V = KMnO4 volume consumed by blank (mL); Vs = KMnO4 volume consumed by sample (mL); C = KMnO4 concentration (mol·L−1); V0 = Titrated filtrate volume (25 mL); W = Oven-dry soil mass (g); 51 = Stoichiometric conversion factor (5/2 × molecular mass ratio); 17 = Equivalent mass of H2O2, (g·mol−1, corresponding to 0.5 mol electron transfer).
Bacterial 16S rRNA high-throughput sequencing: Total DNA was extracted from rhizosphere soil using the E.Z.N.A.® Soil DNA Kit (Omega Bio-Tek, Norcross, GA, USA) following manufacturer protocols. DNA quality was verified by 1% agarose gel electrophoresis, while concentration and purity were measured with a NanoDrop 2000 spectrophotometer (Thermo Fisher Scientific, Waltham, MA, USA). The V3-V4 hypervariable regions of bacterial 16S rRNA genes were amplified with primers 338F (5′-ACTCCTACGGGAGGCAGCAG-3′) and 806R (5′-GGACTACHVGGGTWTCTAAT-3′) [22]. PCR products were separated by 2% agarose gel electrophoresis, purified using the AxyPrep DNA Gel Extraction Kit (Axygen Biosciences), and quantified with QuantiFluor™-ST (Promega). Paired-end sequencing was performed on an Illumina HiSeq platform (Majorbio, Shanghai, China). Chimeric sequences were removed against the UCHIME reference dataset. Quality-filtered sequences were clustered into operational taxonomic units (OTUs) at 97% similarity threshold using USEARCH11-uparse algorithm.

2.3.2. Yield and Nitrogen Fertilizer Contribution Rate

Yield determination: After discarding plants with the largest and smallest morphological appearances from each treatment, selected flowering Chinese cabbage samples were weighed using a balance with a precision of 0.1 g. The total mass of sampled plants was divided by the number of samples to calculate the average mass per plant. Crop yield per hectare was derived based on plot area (30 m2) and the number of cultivated plants.
Agronomic Efficiency (AE) of nitrogen (kg·kg−1): AE = (Yield of N-fertilized plot − Yield of non-N-fertilized plots)/N application rate
Partial Factor Productivity (PFP) of nitrogen (kg·kg−1): PFP = Yield of N-fertilized plot/N application rate
Nitrogen Fertilizer Contribution Rate (%): Contribution Rate = [(Yield of N-fertilized plot − Yield of non-N-fertilized plots)/Yield of N-fertilized plot × 100%]

2.4. Data Processing

Data compilation was performed using Excel 2021. Statistical analyses were conducted with SPSS 18.0, where one-way ANOVA followed by Waller–Duncan (W) post hoc tests at p < 0.05 significance level was applied for group comparisons. Data visualization was implemented through GraphPad Prism 9.0. Microbiome bioinformatics utilized QIIME2 2019.4 and R packages 4.4.1. Functional profiling was predicted via PICRUSt after rarefying raw sequencing data to uniform depth for species abundance normalization. Metabolic pathways and KEGG orthologs (KO) at level 3 were annotated by mapping against preconstructed genome functional gene catalogs. Correlation analysis between microbial community structure, functional metabolism, and environmental factors was executed using the Mantel test in the R linkET package, with significance validated through permutation procedures. The direct relationship between the root-zone soil environment and the yield of Chinese cabbage was explored using Partial Least Squares Path Modeling (PLS-PM). Model validation included bootstrap resampling (n = 1000) and goodness-of-fit indices calculation. Random Forest regression was implemented in R using the randomForest package to rank soil environmental factors by relative importance. Feature significance was quantified through Mean Decrease in Accuracy (MDA) with 5000 permutation iterations.

3. Results

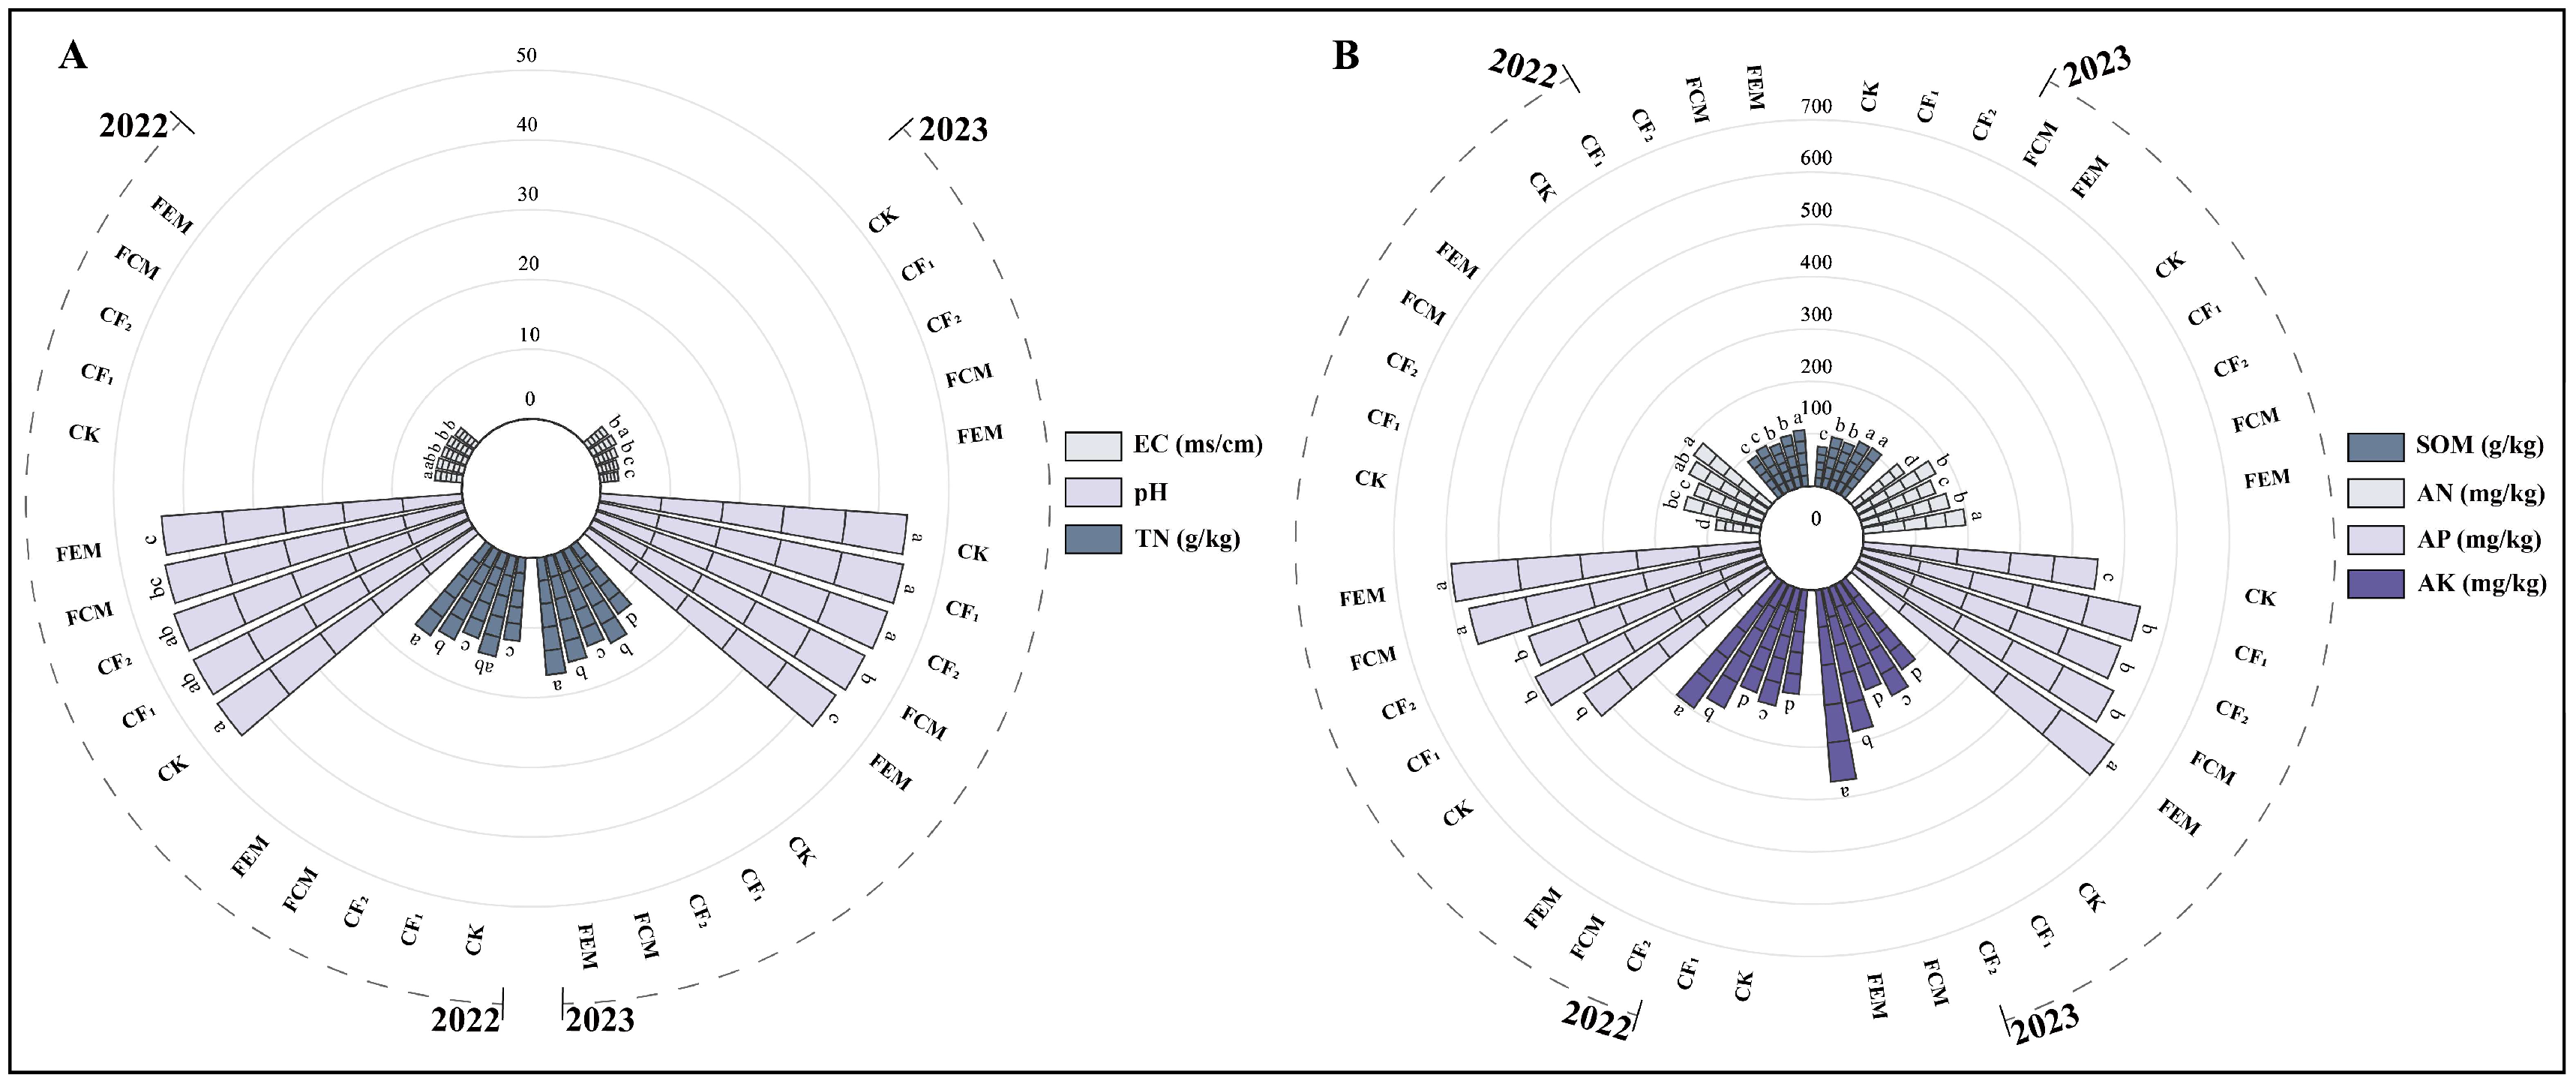
3.1. Influence of Reduced Chemical Fertilizer Combined with Organic Fertilizer on Rhizosphere Soil Nutrients

During the trial period, soil nutrient analysis within the root-zone layer of flowering Chinese cabbage plots revealed the following results (Figure 2). In 2023, the electrical conductivity (EC) under the CK treatment was 3.69% lower than under the CF1 treatment. The CF2 treatment exhibited a 14.78% reduction in EC compared to CF1. However, neither CK nor CF2 showed a significant difference in EC relative to CF1; this pattern was consistent across both 2022 and 2023. The application of organic fertilizer amendments consistently reduced both soil EC and pH. As shown in the figure, the FCM treatment significantly decreased EC and pH by 24.80% and 2.16%, respectively, compared to CF1 in 2023. Similarly, the FEM treatment reduced both EC and pH relative to CF1 in both years: in 2022, reductions were 15.05% for EC and 2.52% for pH, while, in 2023, reductions were 31.13% for EC and 3.84% for pH. No significant difference was observed between FEM and FCM treatments in reducing EC. However, in 2023, FEM resulted in a significantly greater pH reduction compared to FCM.
Compared to CF1, the CK treatment significantly decreased total nitrogen (TN) content, with reductions of 18.31% in 2022 and 20.40% in 2023. Similarly, the CF2 treatment significantly reduced TN relative to CF1, by 12.64% in 2022 and 6.29% in 2023. In 2022, the FEM treatment significantly increased TN by 8.86% compared to FCM. In 2023, FEM significantly enhanced TN compared to both CF1 and FCM, with increases of 12.71% and 8.85%, respectively. Organic fertilizer amendments universally increased soil organic matter (SOM). FEM increased SOM by 10.49% in 2022 and 11.24% in 2023 compared to CF1. Furthermore, FEM resulted in significantly higher SOM than FCM in 2022. Regarding alkaline nitrogen (AN), differences were observed between FEM and CF1 in both years: FEM increased alkaline nitrogen (AN) by 16.95% in 2022 and 16.67% in 2023 relative to CF1. In contrast, the FCM treatment showed no significant change in alkaline nitrogen (AN) compared to CF1. Organic fertilizer amendments consistently enhanced available phosphorus (AP) and available potassium (AK) levels, with similar trends in both years. Specifically, for available phosphorus (AP) in 2022, both FCM and FEM treatments increased available phosphorus (AP) compared to CF1 (15.85% and 20.33%, respectively). In 2023, FEM increased available phosphorus (AP) by 10.31% relative to CF1, and a significant difference was observed between FCM and FEM, with FEM exhibiting a 9.31% greater increase than FCM. For available potassium (AK) in 2022, FCM and FEM increased available potassium (AK) compared to CF1 by 16.43% and 29.62%, respectively, and FEM showed a significant increase over FCM. In 2023, FCM and FEM increased available potassium (AK) by 16.76% and 54.26%, respectively, relative to CF1. FEM’s available potassium (AK) increase was significantly greater than FCM’s, amounting to a 32.11% higher value.

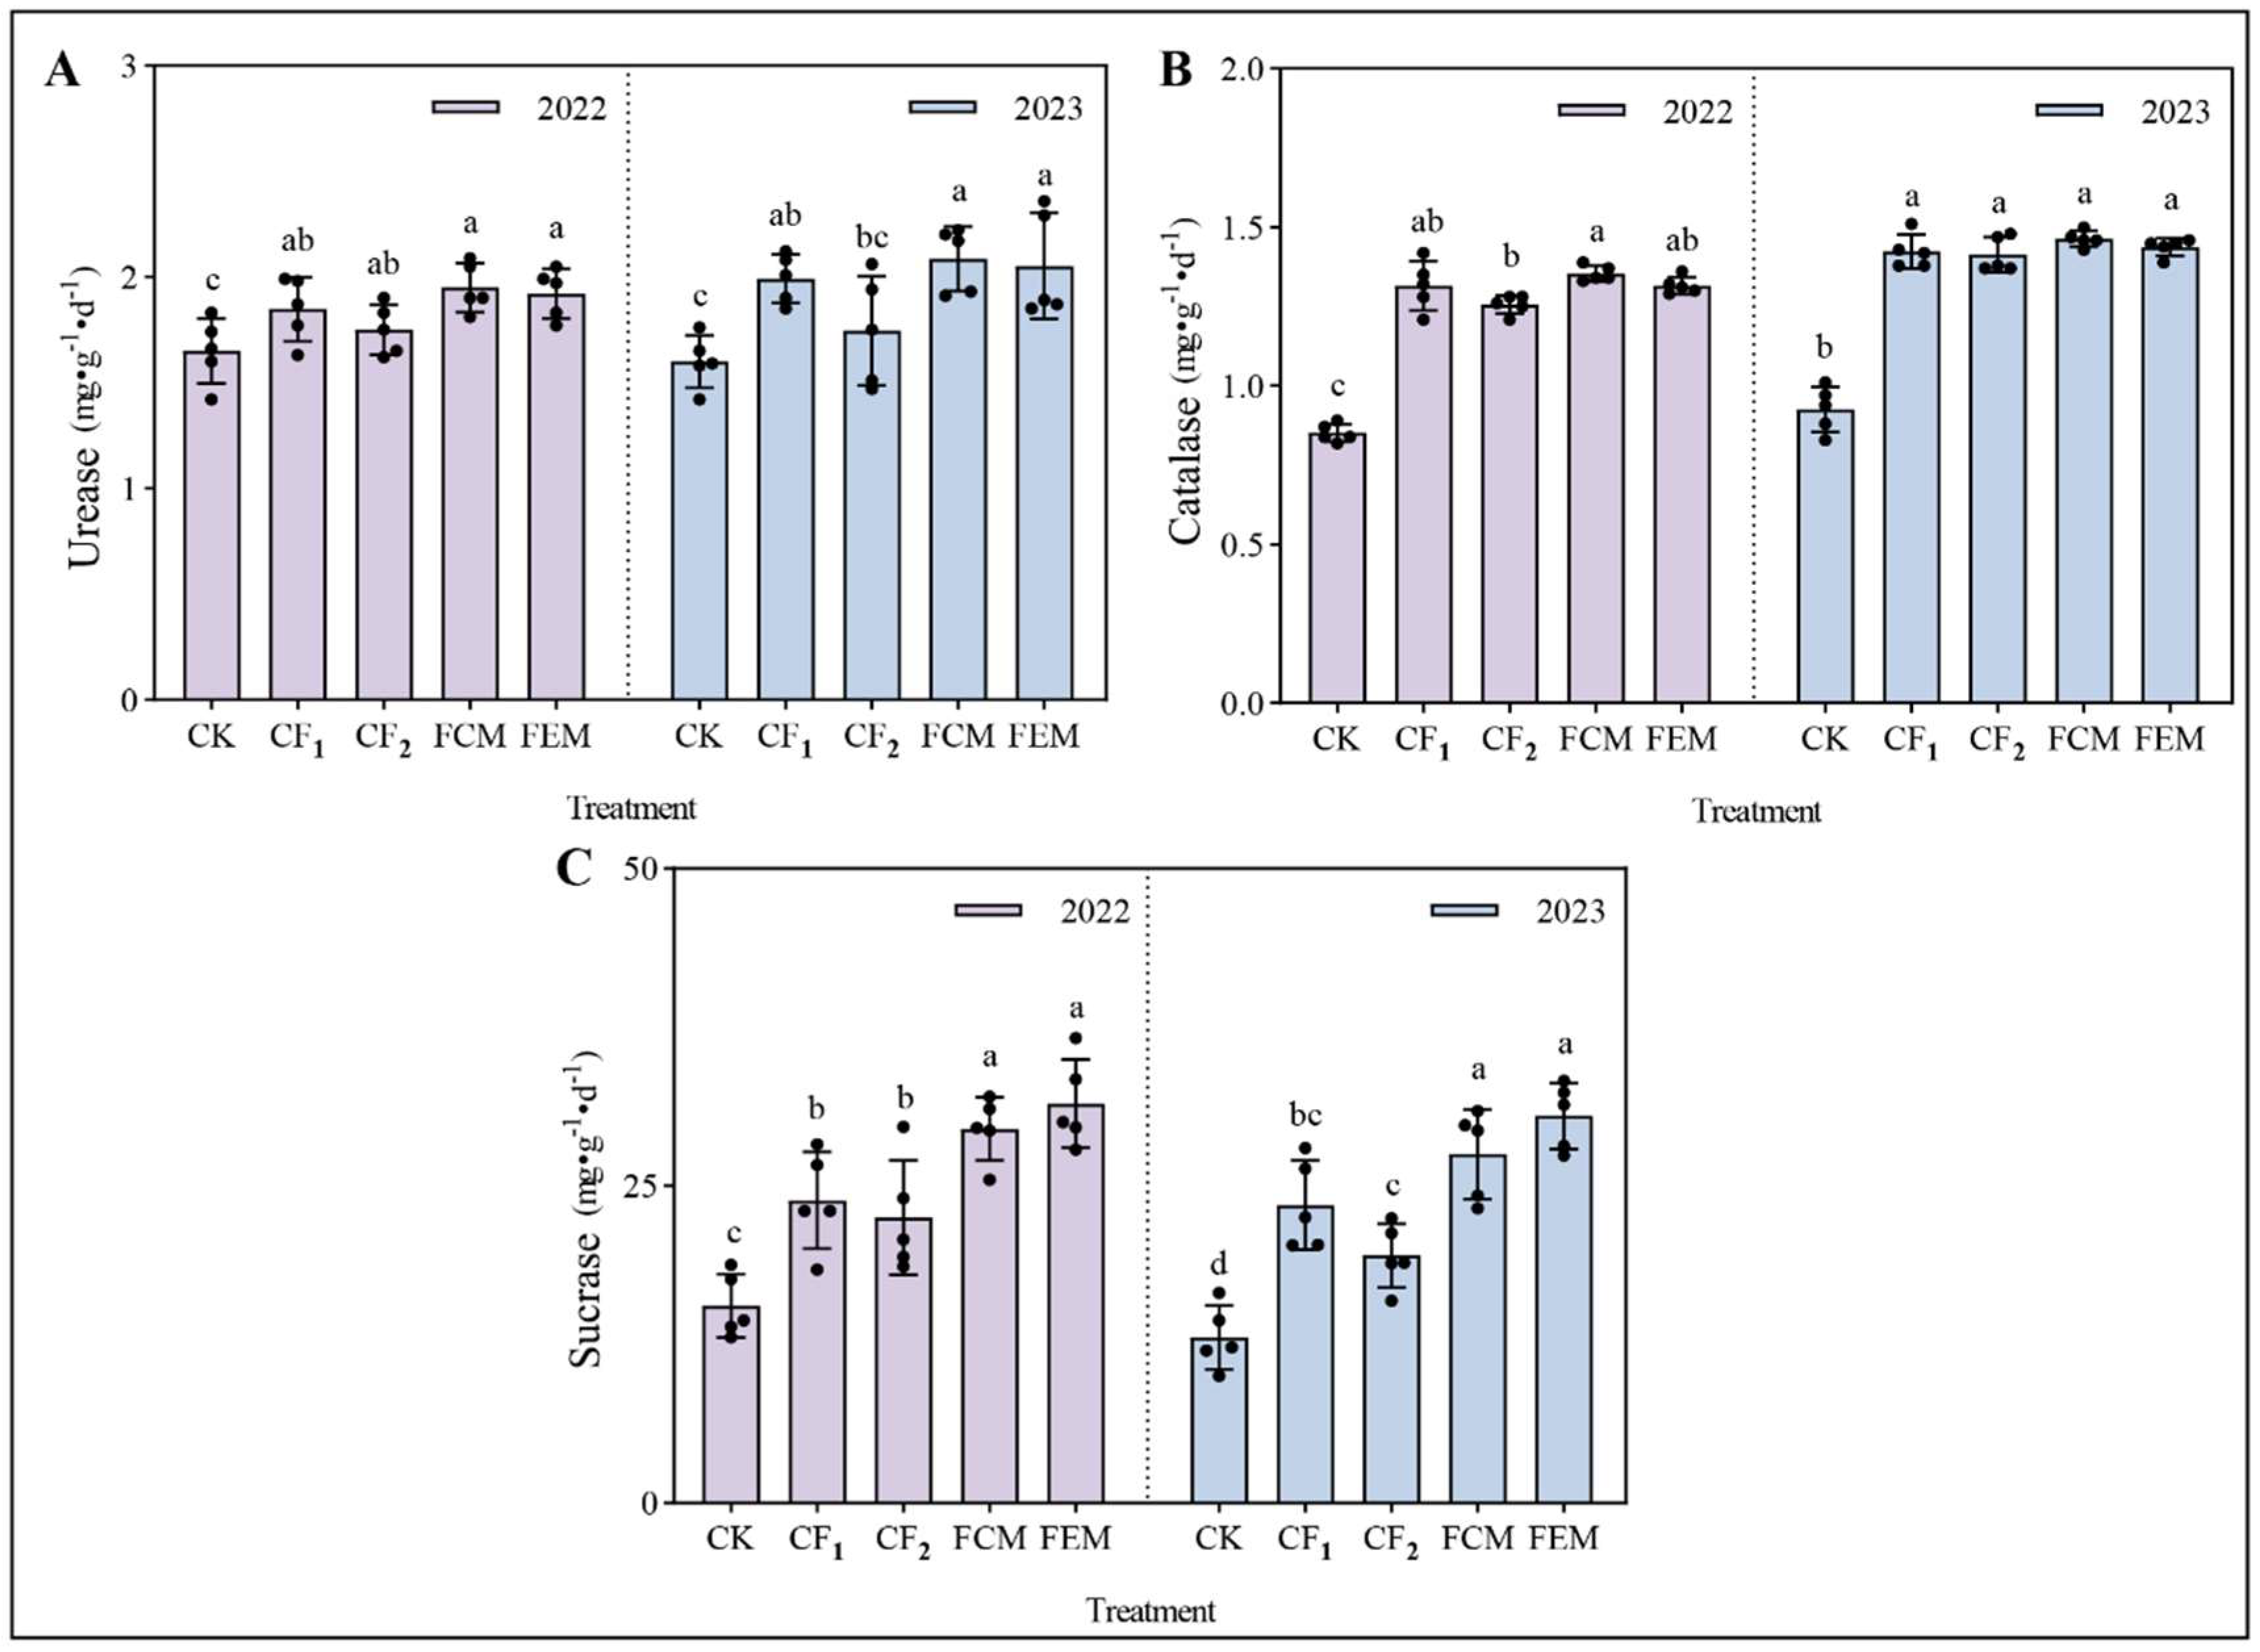
3.2. Impact of Reduced Chemical Fertilizer with Organic Amendments on Rhizosphere Soil Enzyme Activities

Highlighting variations in soil enzyme activities (0–20 cm rhizosphere layer) in the flowering Chinese cabbage field, the dynamics of soil enzyme activities in the 0–20 cm rhizosphere layer are illustrated in Figure 3. Organic fertilizer amendments showed an upward trend in urease activity, though without significant differences. Compared to the CF1 treatment, the CK treatment significantly reduced urease activity by 10.71% (2022) and 19.68% (2023), while no significant differences were observed between CF2 and CF1. Neither FEM nor FCM treatments exhibited notable effects on urease activity, with consistent results across both years. Catalase activity followed a similar trend to urease. The CK treatment significantly decreased catalase activity by 35.26% (2022) and 34.97% (2023) relative to CF1, whereas CF2 showed no significant deviation from CF1. Both FEM and FCM treatments had negligible impacts on catalase activity. Saccharase activity was markedly enhanced by organic fertilization. In 2022, FCM and FEM increased saccharase activity by 23.62% and 32.00%, respectively, compared to CF1. By 2023, these increments remained substantial at 17.03% (FCM) and 29.80% (FEM). No significant differences in saccharase activity were detected between FEM and FCM.

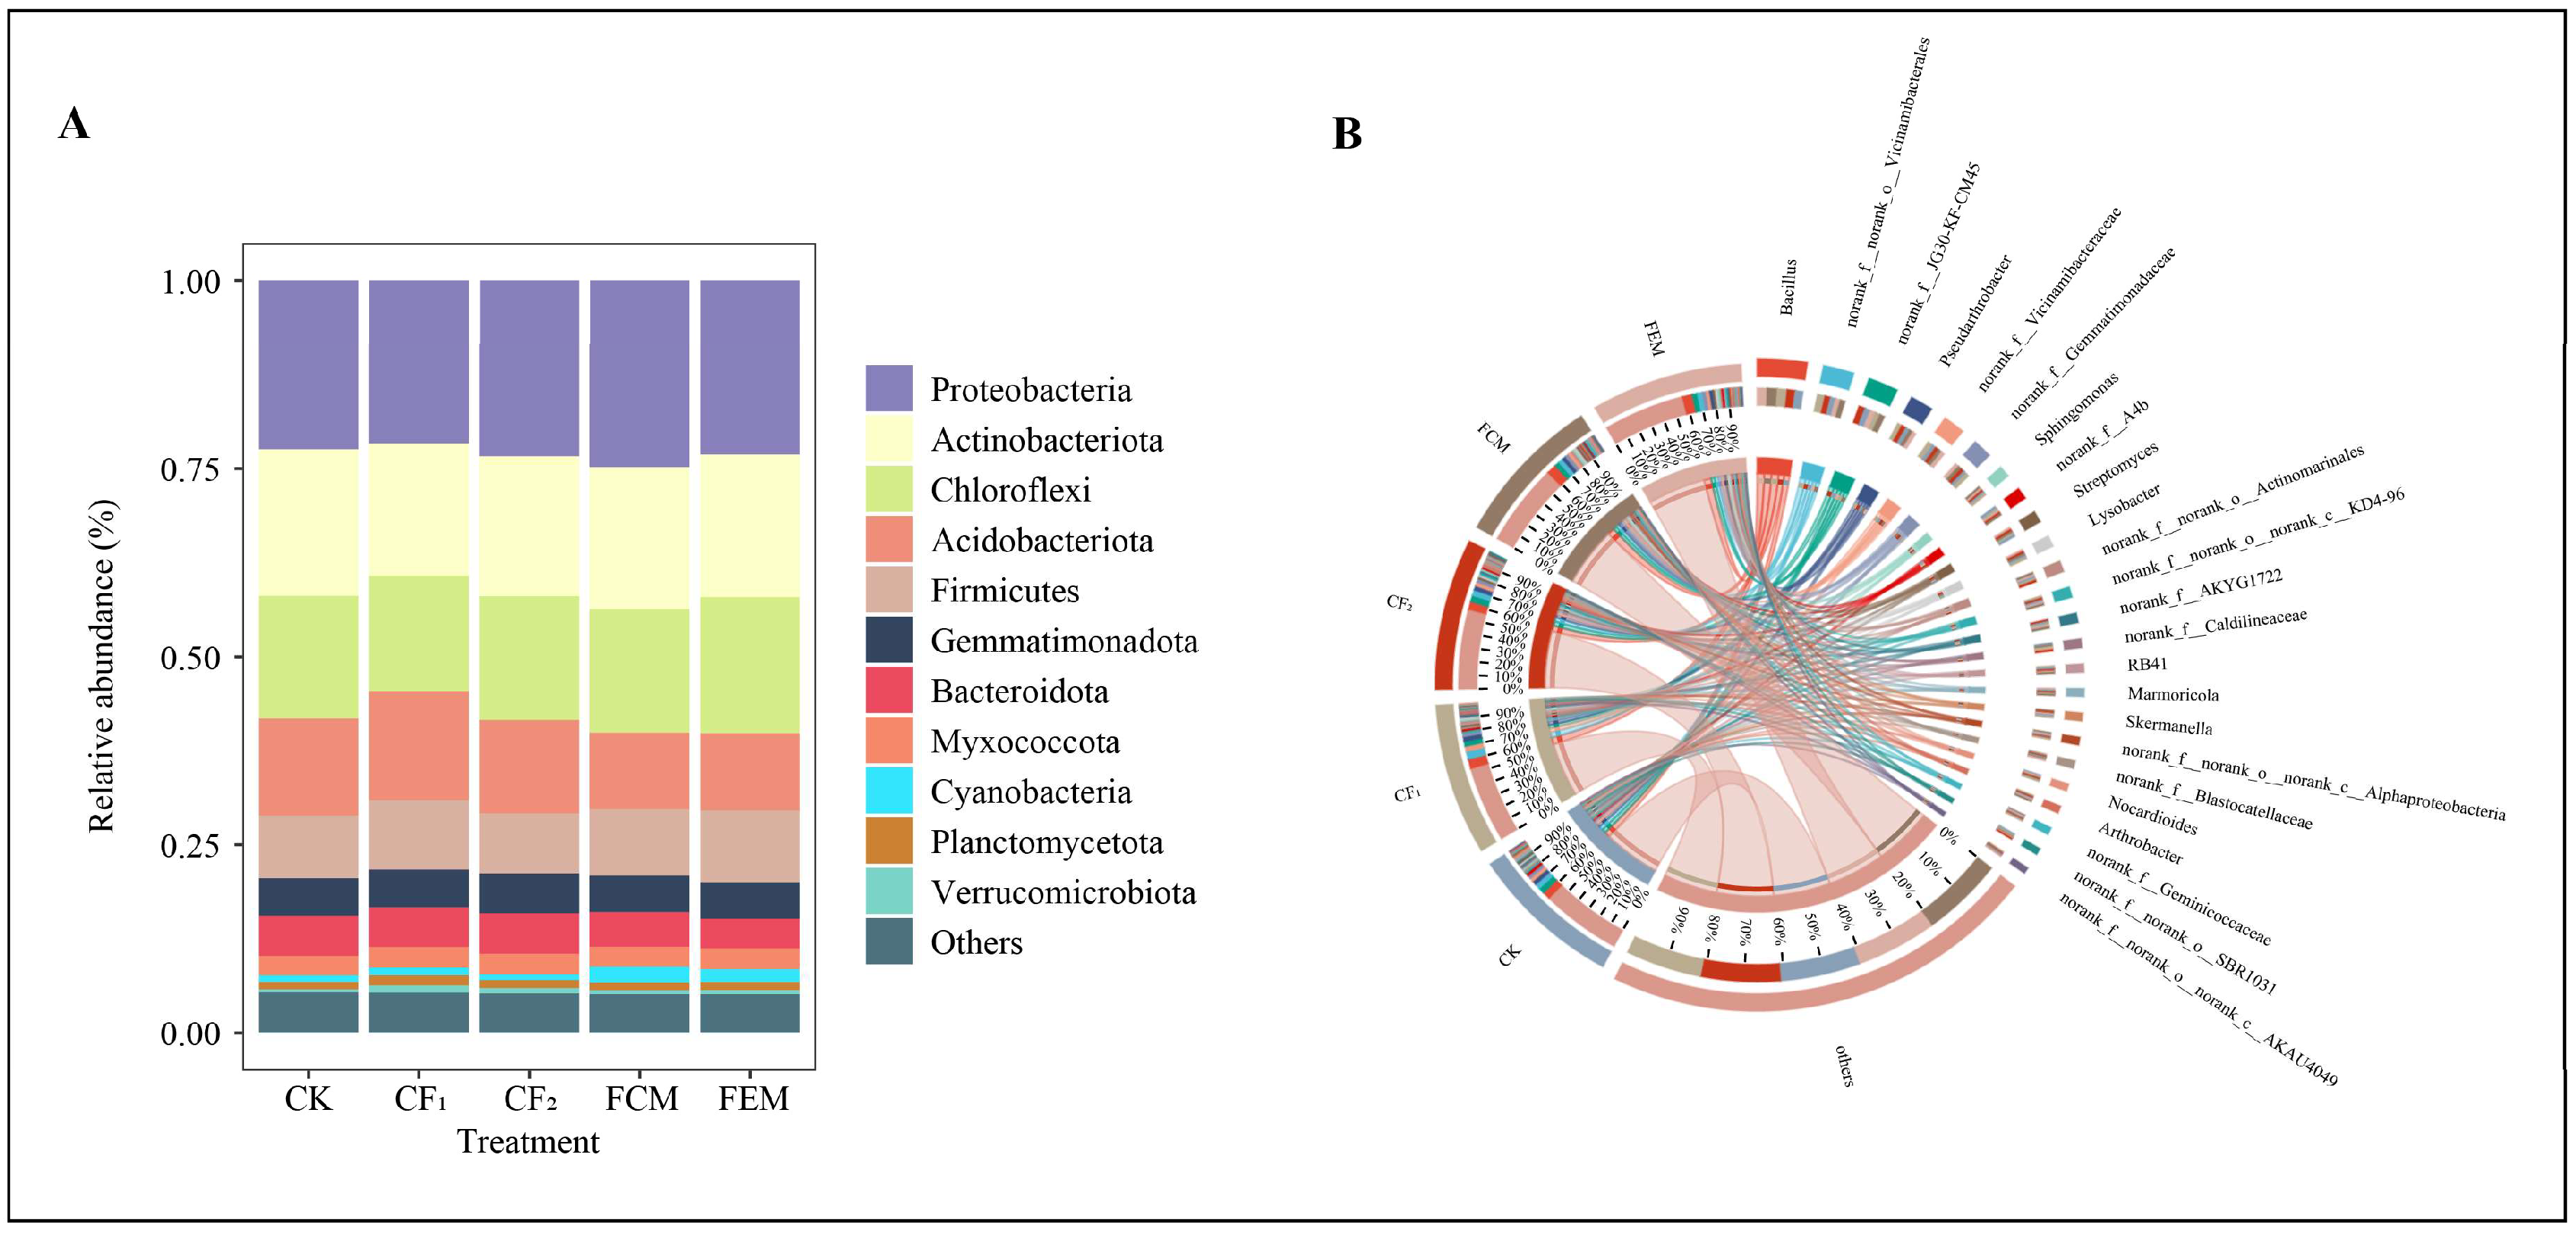
3.3. Effects of Reduced Chemical Fertilizer and Organic Fertilizer Co-Application on Bacterial Community Structure and Composition

For the composition of bacterial community structure at the phylum level (Figure 4A), taxa with average relative abundance <1% were categorized as “Others,” yielding 12 taxonomic groups. The top-five dominant phyla were Proteobacteria (21.69–24.80%), Actinobacteria (17.56–19.49%), Chloroflexi (15.33–18.08%), Acidobacteria (10.17–14.47%), and Firmicutes (7.96–9.56%). Compared to CF1, the FCM treatment increased Proteobacteria abundance, while both FCM and FEM treatments elevated Firmicutes abundance. FEM enhanced Chloroflexi abundance significantly relative to CF1 and FCM. Organic fertilizer amendments reduced Acidobacteria and Bacteroidetes abundances: FCM decreased Acidobacteria by 32.44% and Bacteroidetes by 16.49%, whereas FEM reduced Acidobacteria by 30.45% and Bacteroidetes by 26.52%, with FEM showing significantly greater Bacteroidetes reduction than FCM.
Composition of bacterial community structure at genus level (Figure 4B), at the genus level, taxa with average relative abundance <1% were grouped as “Others,” resulting in 25 taxonomic groups. Dominant genera included Bacillus, g__norank_f__norank_o__Vicinamibacterales, g__norank_f__JG30-KF-CM45, Pseudarthrobacter, g__norank_f__Vicinamibacteraceae, and g__norank_f__Gemmatimonadaceae, all exceeding 2% average relative abundance. Bacillus abundance ranked highest in FEM, followed by FCM, with the order CK < CF2 < CF1 < FCM < FEM. Compared to CF1, FCM and FEM increased Bacillus abundance by 2.98% and 3.83%, respectively, with FEM surpassing FCM by 0.81% (all differences significant).
The structural shifts in microbial communities directly or indirectly influenced metabolic pathways. To elucidate these microbial–metabolic interactions, we conducted hierarchical analysis, focusing on Level 1 metabolic processes (Metabolism). Figure 5 displays Level 2 KEGG metabolic pathways, ordered from right to left as follows: Carbohydrate metabolism, Amino acid metabolism, Energy metabolism, Nucleotide metabolism, Lipid metabolism, Metabolism of other amino acids, Biosynthesis of other secondary metabolites, and Metabolism of terpenoids and polyketides. All pathways except Metabolism of other amino acids, Biosynthesis of other secondary metabolites, and Metabolism of terpenoids and polyketides exhibited relative abundances exceeding 5%.
Notably, FCM and FEM treatments significantly enhanced carbohydrate metabolism compared to CF1, with FEM showing highly significant differences (p < 0.01). Amino acid metabolism under FEM reached extreme significance (p < 0.01) relative to CF1. These results demonstrate that organic fertilizer amendments specifically bolster microbial carbohydrate and amino acid metabolic functionalities. No significant alterations were observed in other metabolic pathways.
Figure 6 shows Level 3 KEGG metabolic pathways, listing the top-19 KEGG orthologous function predictions based on relative abundance. The results of the Level 3 KEGG orthologous function prediction show that, among the top-19 metabolic pathways, the relative abundance of the ABC transporters pathway in the FEM treatment is higher than in the CF1 and FCM treatments, with an increase of 1.86% and 4.19%, respectively. The relative abundance of the Microbial metabolism in diverse environments pathway in the FEM treatment increased by 2.13% and 2.12% compared to the CF1 and FCM treatments, respectively. The relative abundance of the Biosynthesis of secondary metabolites pathway in the FEM treatment increased by 1.08% compared to the CF1 treatment, with no significant change compared to the FCM treatment. The relative abundance of the Two-component system pathway in the FEM treatment increased by 2.47% and 2.24% compared to the CF1 and FCM treatments, respectively. The relative abundance of the Fatty acid metabolism pathway in the FEM treatment was higher than in the CF1 and FCM treatments, with an increase of 2.19% and 2.34%, respectively. The relative abundance of the Quorum sensing pathway in the FEM treatment increased by 3.39% compared to the FCM treatment, with no significant change compared to the CF1 treatment. The relative abundance of the Purine metabolism pathway in the FEM treatment increased by 1.56% compared to the CF1 treatment, with no significant change compared to the FCM treatment. The relative abundance of the Pyruvate metabolism pathway in the FEM treatment increased by 1.62% compared to the CF1 treatment, with no significant change compared to the FCM treatment. In the Pyrimidine metabolism pathway, the relative abundance of the FCM treatment increased by 1.49% compared to the CF1 treatment.

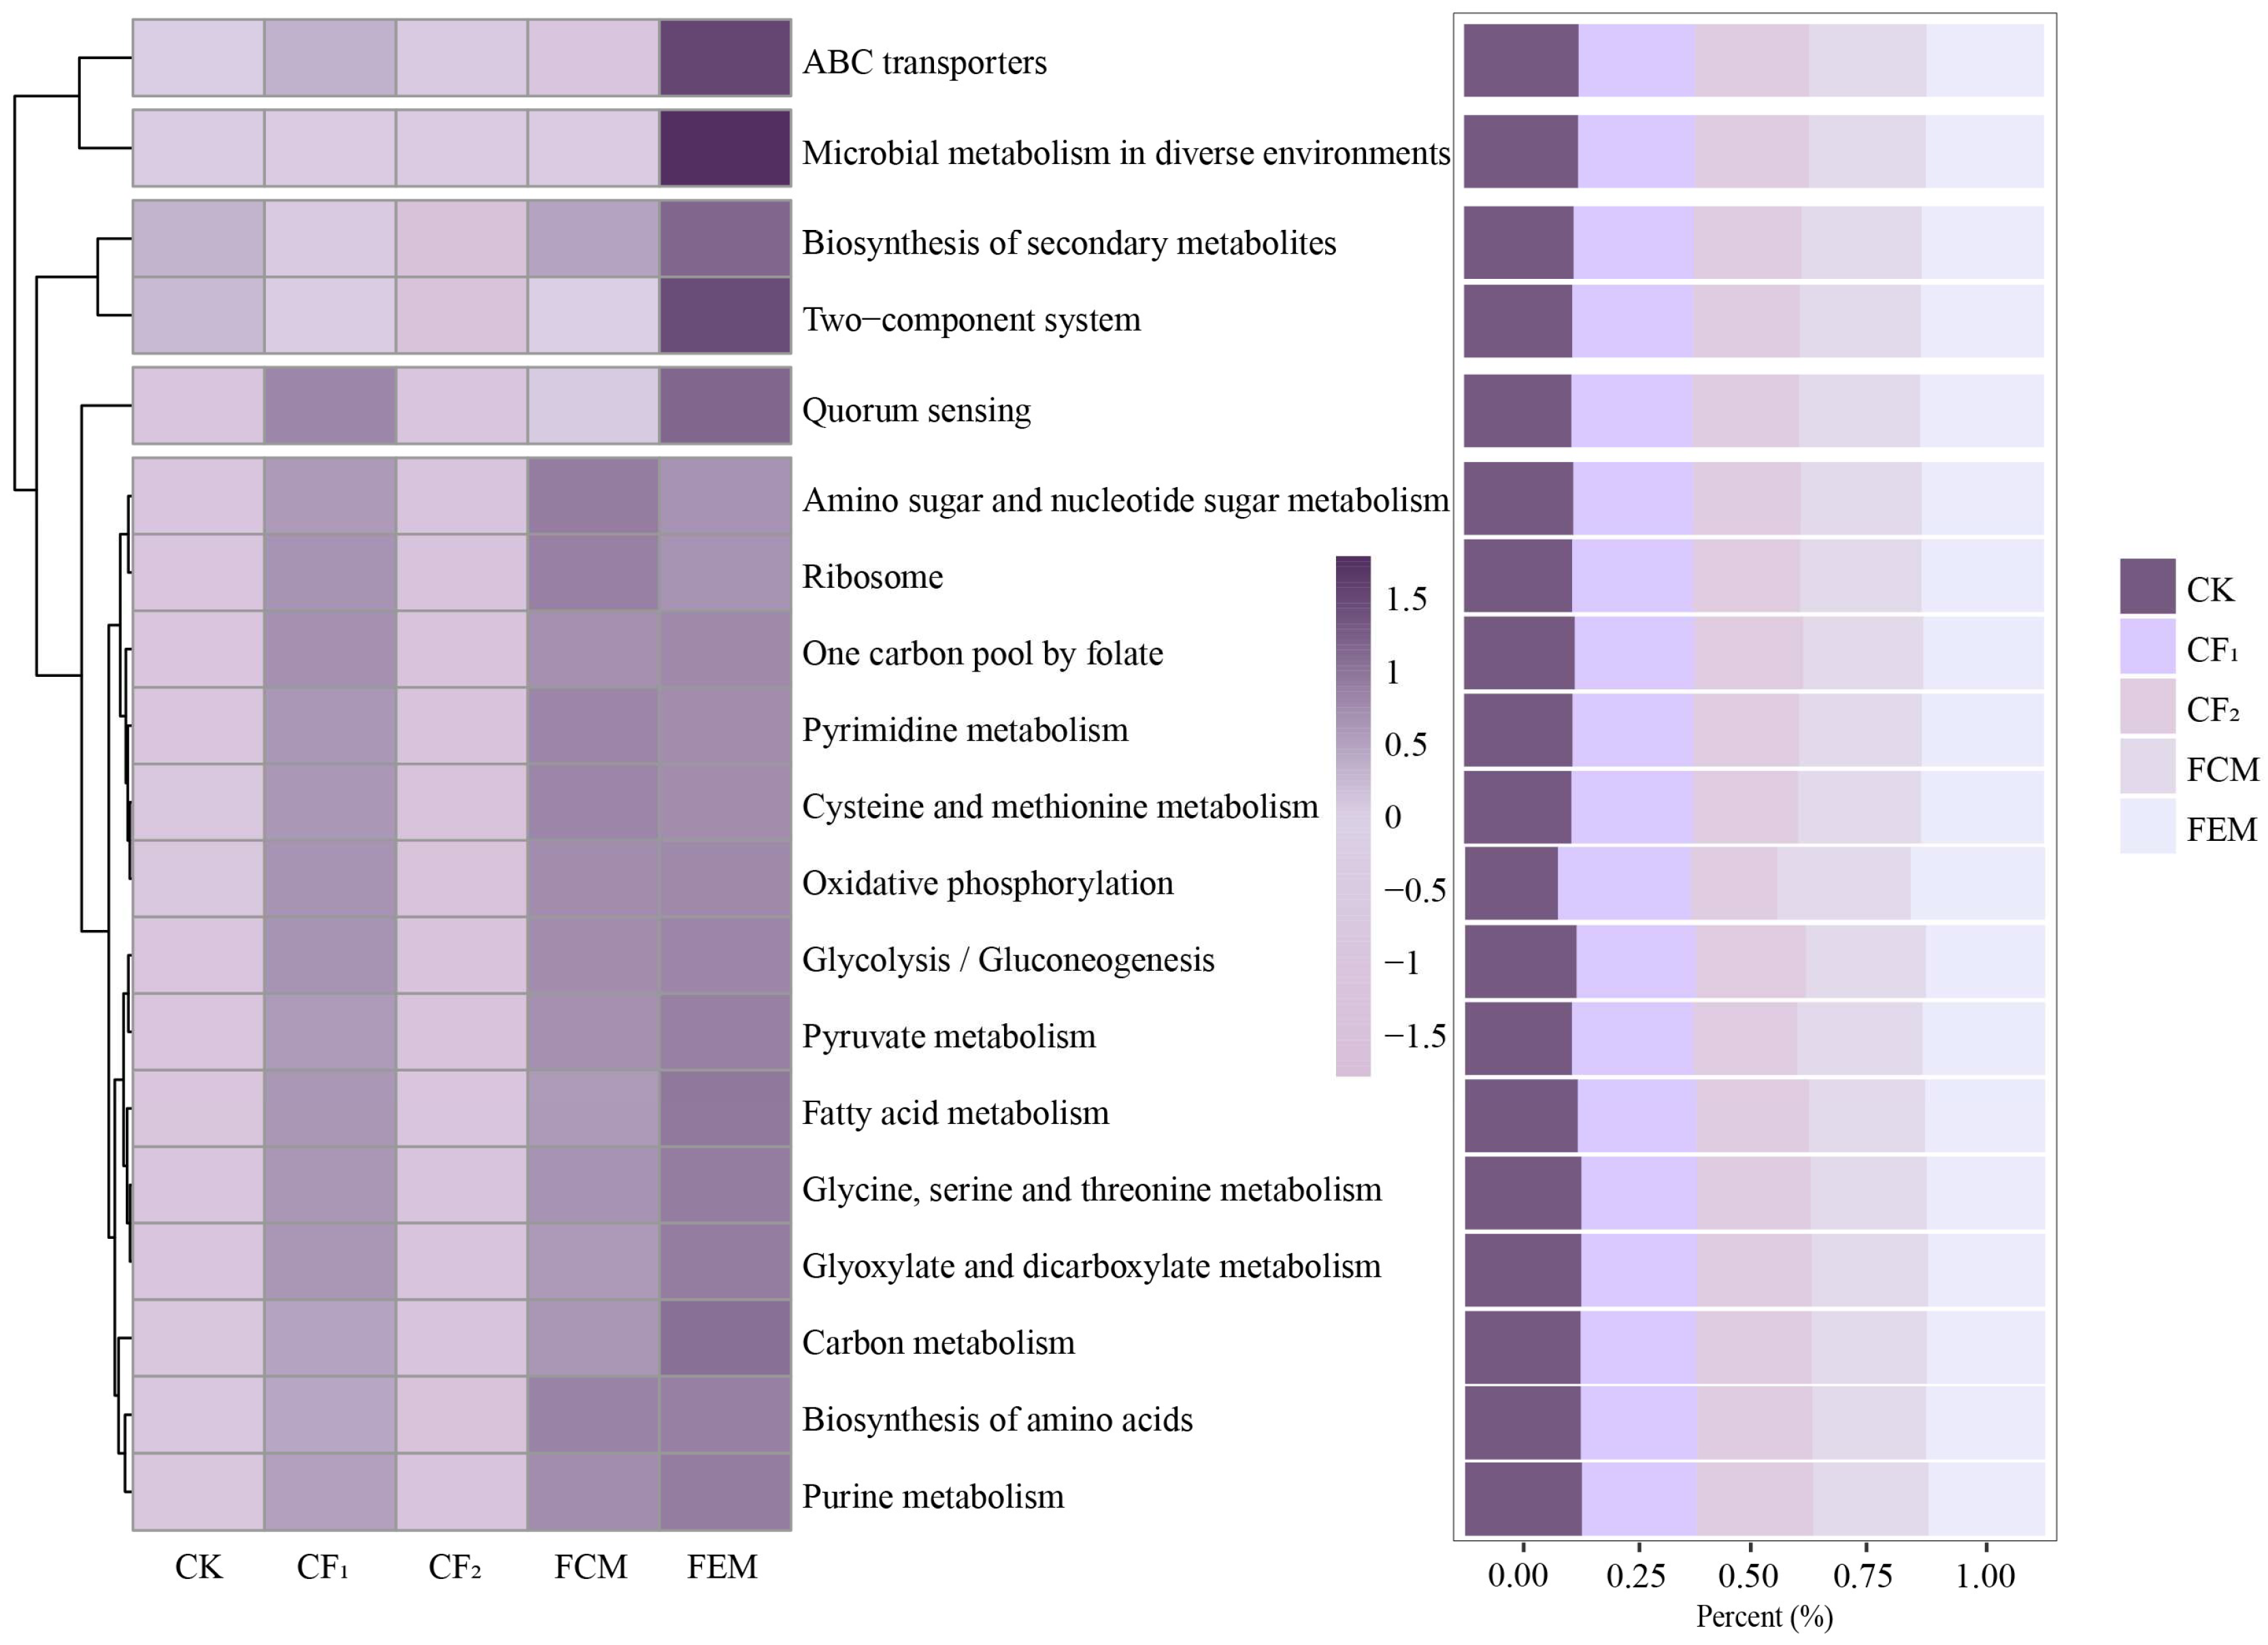
3.4. Interaction Analysis Among Microbial Community Structure, Functional Metabolism, and Soil Environmental Factors

The Mantel test analysis (Figure 7) revealed significant correlations between soil environmental factors and four dominant bacterial phyla (excluding Acidobacteriota). Proteobacteria showed the strongest associations with soil organic matter (SOM: r = 0.75, p < 0.01), available nitrogen (AN: r = 0.74, p < 0.01), catalase activity (r = 0.71, p < 0.01), and total nitrogen (TN: r = 0.67, p < 0.01), followed by secondary correlations with sucrase activity (r = 0.66, p < 0.01) and available phosphorus (AP: r = 0.51, p < 0.01). Actinobacteriota was predominantly influenced by total nitrogen (TN) (r = 0.71, p < 0.01), followed by available potassium (AK: r = 0.64, p < 0.01), sucrase activity (r = 0.63, p < 0.01), SOM (r = 0.47, p < 0.01), available nitrogen (AN) (r = 0.45, p < 0.01), and pH (r = 0.41, p < 0.01). Chloroflexi exhibited dominant regulation by available potassium (AK) (r = 0.82, p < 0.01) and total nitrogen (TN) (r = 0.77, p < 0.01), with additional associations to SOM (r = 0.61, p < 0.01), available nitrogen (AN) (r = 0.61, p < 0.01), available phosphorus (AP) (r = 0.57, p < 0.01), sucrase activity (r = 0.54, p < 0.01), and pH (r = 0.53, p < 0.01). Firmicutes displayed significant linkages to total nitrogen (TN) (r = 0.51, p < 0.01), sucrase activity (r = 0.47, p < 0.01), available nitrogen (AN) (r = 0.45, p < 0.01), and SOM (r = 0.40, p < 0.01), highlighting nitrogen and carbon cycling as cross-phylum regulatory drivers. Notably, Acidobacteriota remained insensitive to environmental factors, contrasting with conventional pH-driven microbial dynamics observed in other studies.

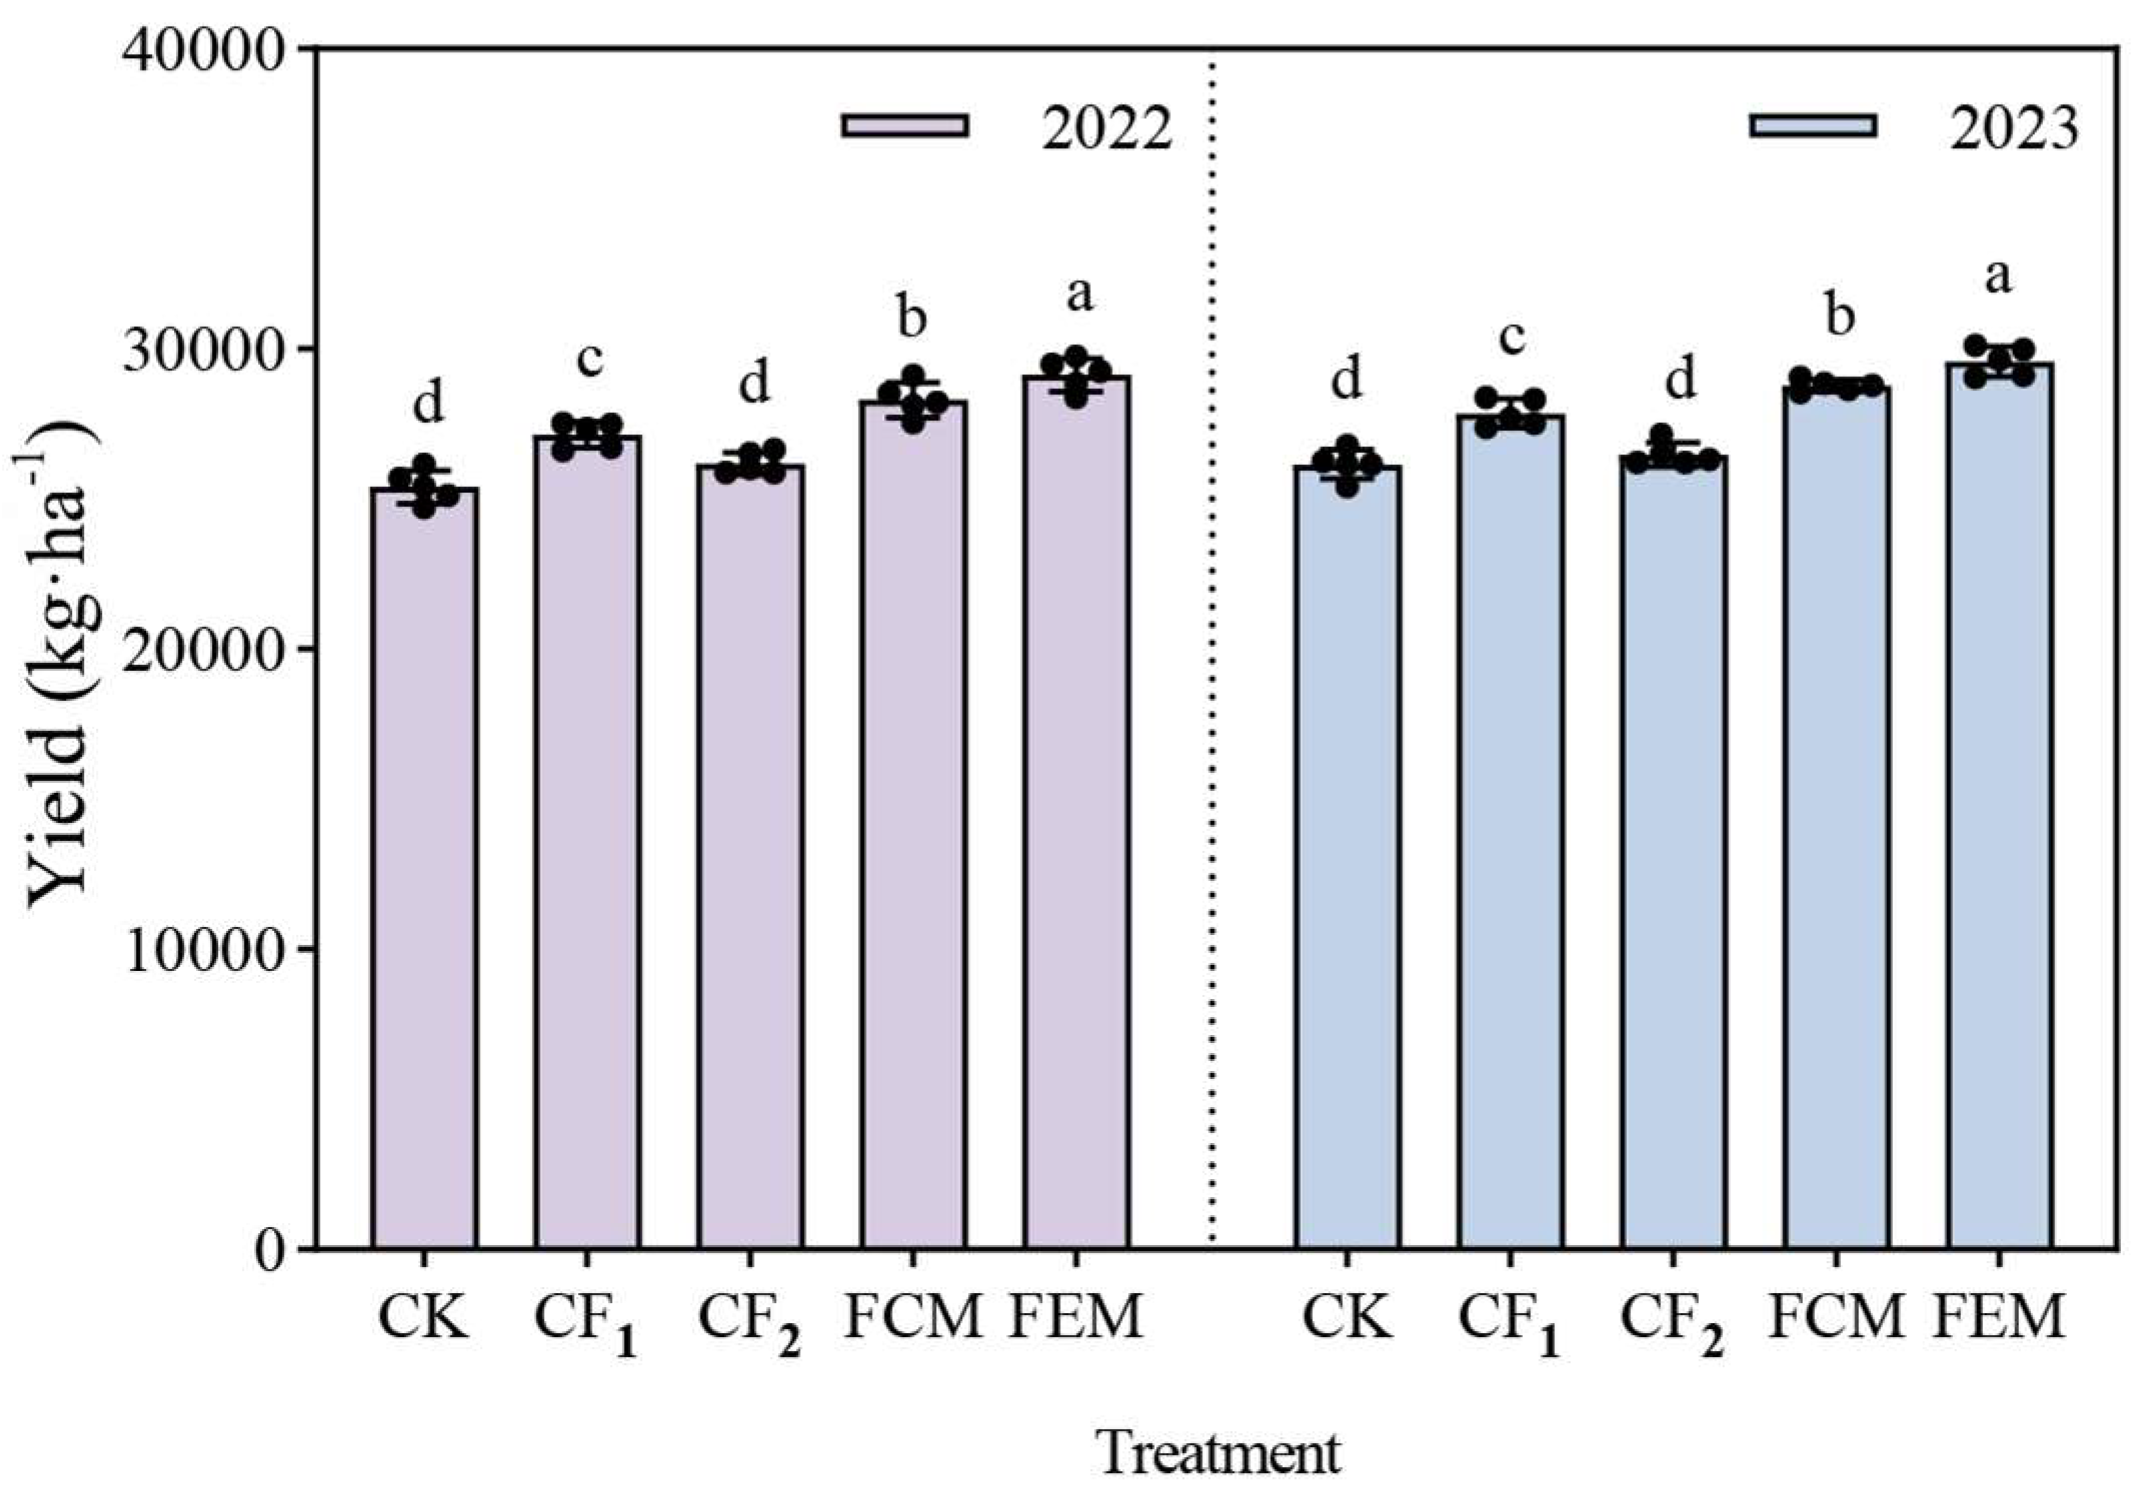
3.5. Yield Response of Flowering Chinese Cabbage to Reduced Chemical Fertilizer Integrated with Organic Fertilizer

As depicted in Figure 8, the per-hectare yield of flowering Chinese cabbage varied significantly among treatments. In 2022, CK and CF2 reduced yields by 6.38% and 3.51%, respectively, compared to CF1. Organic fertilizer amendments (FCM and FEM) enhanced productivity, with FCM and FEM increasing yields by 4.29% and 7.34% relative to CF1, respectively. Notably, FEM outperformed FCM by 2.93%. In 2023, yield trends mirrored those of 2022: CK and CF2 diminished yields by 6.13% and 4.96%, respectively, versus CF1. FCM and FEM again surpassed CF1, achieving 3.30% and 6.17% yield increases. The superiority of FEM over FCM persisted, with a 2.78% yield advantage.

3.6. Nitrogen Use Efficiency (NUE) of Flowering Chinese Cabbage Under Reduced Chemical Fertilizer and Organic Fertilizer Regimes

As shown in Table 2 regarding the effects on nitrogen use efficiency in 2022 and 2023, the application of organic fertilizer was found to enhance nitrogen agronomic efficiency and nitrogen contribution rate, while reduced chemical fertilizer application improved nitrogen partial factor productivity. Specifically, in 2022, the CF2 treatment decreased nitrogen agronomic efficiency by 35.80% compared to CF1 treatment, whereas FCM and FEM treatments markedly increased nitrogen agronomic efficiency by 67.19% and 115.14%, respectively, relative to CF1, with no significant difference observed between FCM and FEM. In 2023, CF2 treatment exhibited a 72.74% reduction in nitrogen agronomic efficiency versus CF1, while FCM and FEM treatments showed increases of 53.90% and 100.78%, respectively. Regarding nitrogen partial factor productivity, CF2 treatment increased this parameter by 37.84% compared to CF1 in 2022, while FCM and FEM treatments enhanced nitrogen agronomic partial factor productivity by 4.29% and 7.34%, respectively, with FEM demonstrating a significant 2.93% improvement over FCM. Similarly, in 2023, CF2 treatment increased nitrogen partial factor productivity by 35.78% versus CF1, while FCM and FEM treatments elevated it by 3.30% and 6.17%, respectively, showing a significant 2.78% advantage of FEM over FCM. For nitrogen contribution rate, CF2 treatment reduced this parameter by 53.15% relative to CF1 in 2022, whereas FCM and FEM treatments increased it by 61.17% and 101.18%, respectively, with no significant difference between these two treatments. In 2023, CF2 treatment decreased nitrogen contribution rate by 80.07% compared to CF1, while FCM and FEM treatments improved it by 49.25% and 88.99%, respectively, again with no significant divergence observed between FCM and FEM.

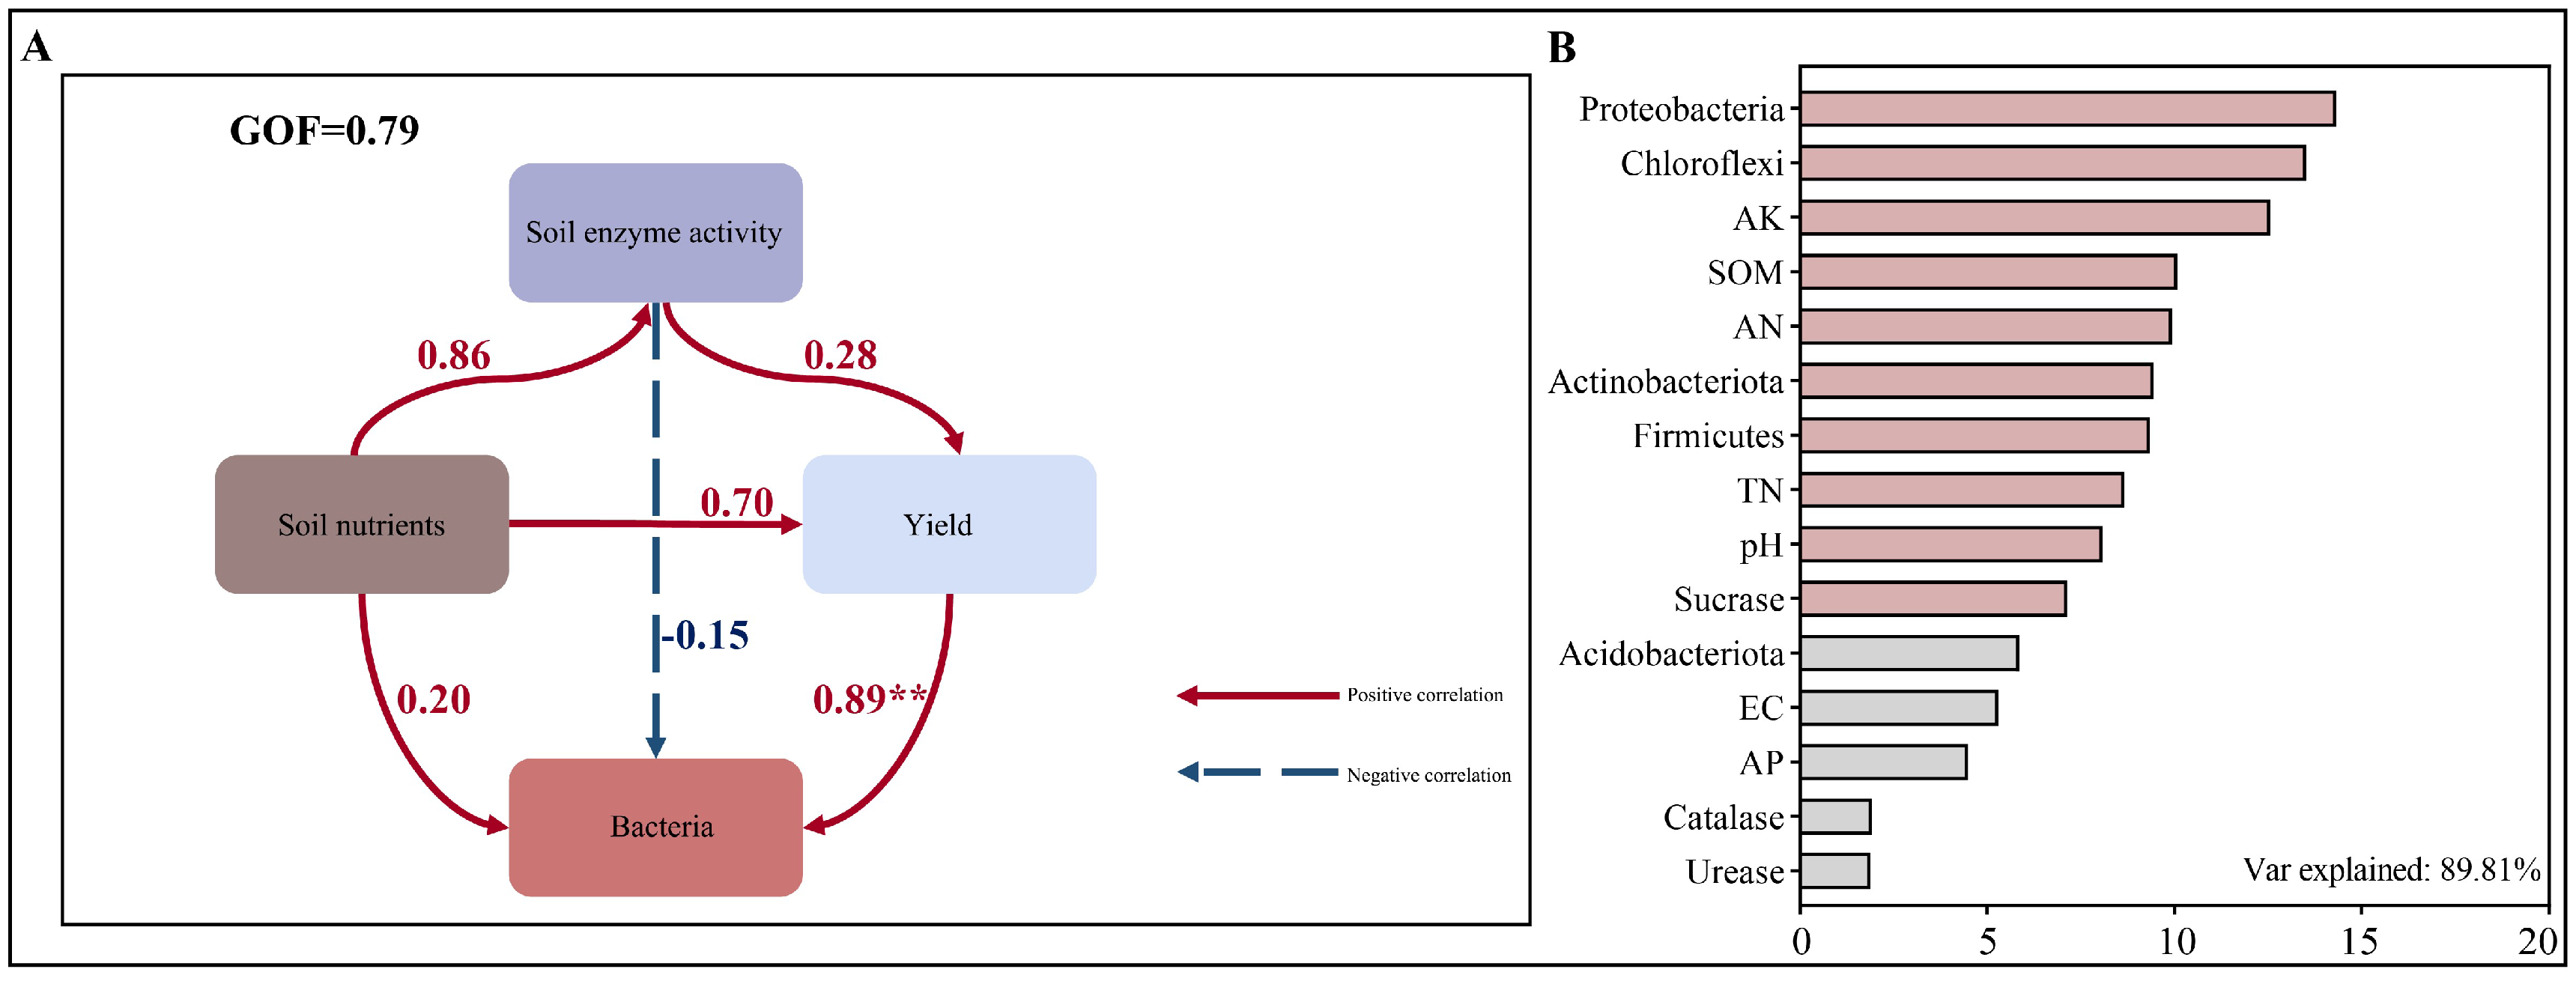
3.7. Correlation Analysis Between Crop Yield and Rhizosphere Soil Environmental Parameters

Figure 9A presents a partial least squares path analysis (PLS-PA) model constructed using Chinese flowering cabbage yield, soil nutrients, soil enzyme activities, and bacterial community structure to delineate the direct and indirect effects of soil environmental factors on yield. The PLS model revealed that soil nutrients and bacterial community structure exerted positive impacts on yield, with the bacterial community structure showing a highly significant positive effect (path coefficient = 0.89, p < 0.01). Conversely, soil enzyme activities negatively influenced yield (path coefficient = −0.15). Soil nutrients positively affected both soil enzyme activities (path coefficient = 0.86) and bacterial community structure (path coefficient = 0.70), while soil enzyme activities exhibited a positive correlation with bacterial community structure (path coefficient = 0.28). Additionally, a Random Forest model ranked the importance of 15 soil environmental factors influencing yield. As shown in Figure 9B, the model achieved an explanatory power of 89.81%, with the key factors ranked in descending order of importance as Proteobacteria, Chloroflexi, available potassium (AK), soil organic matter (SOM), available nitrogen (AN), Actinobacteria, Firmicutes, total nitrogen (TN), pH, and sucrase activity. In contrast, Acidobacteria, electrical conductivity (EC), available phosphorus (AP), catalase, and urease activities demonstrated relatively minor contributions to yield variability.

4. Discussion

4.1. Effects of Reduced Chemical Fertilization Combined with Organic Fertilizer Application on Soil Nutrients and Enzyme Activities in Chinese Flowering Cabbage

The application of organic fertilizers consistently reduced soil EC and pH, with the effect being more pronounced for vermicompost. Organic fertilizer application significantly lowered the pH of alkaline soil and ameliorated soil salinization, which aligns with previous findings [23]. Vermicompost is rich in organic carbon. Its addition not only enhanced soil fertility but also mitigated issues like high bulk density, reduced porosity, and diminished water-holding capacity [24]. Furthermore, organic fertilizer application likely reduces the activity of metal ions in the soil (e.g., K+, Na+, Ca2+, Mg2+), thereby decreasing soil pH [25]. Studies indicate that organic fertilizers contain abundant humic substances, which are organic acids capable of complexing with soil cations to form humate salts such as ammonium nitrohumate and nitrohumic acid. The interconversion between humic acids and humates establishes a buffering system crucial for regulating soil pH and stabilizing the soil’s acid–base environment. Appropriate vermicompost application in continuous cropping soil can effectively adjust pH, reduce total salt content, and reduce electrical conductivity, thereby alleviating soil acidification and salinization [26].
The increased organic fertilizer application significantly elevated soil total nitrogen, organic matter, available nitrogen, and available potassium, with varying effectiveness observed among different organic materials. Adding organic materials combined with chemical nitrogen fertilizer in the field may provide additional nitrogen sources for the microbial degradation of organic matter, altering the C/N ratio to favor microbial development and enhance microbial activity. This accelerates the microbial decomposition of organic materials and the release of nutrients, consequently increasing soil organic matter content [27]. Soil organic matter content rises with prolonged organic fertilizer application. Therefore, compared to solely chemical fertilizer, reducing chemical fertilizers while increasing organic amendments will further enhance soil organic matter levels.
Increased organic fertilizer application significantly boosted soil sucrase activity. This is likely because the organic inputs provided abundant enzymatic substrates for the soil microbial community, stimulating its metabolic activity and enzyme production in the vegetable soil [28]. Research shows that organic fertilizers significantly enhance enzyme activity in topsoil. Another contributing factor is that organic fertilizer application increases soil microbial biomass, accelerating the cycling of carbon, nitrogen, phosphorus, and other elements. These changes promote microbial activity and consequently improve soil fertility [29].

4.2. Impact of Reduced Chemical Fertilization Integrated with Organic Amendments on Soil Microbial Community in Chinese Flowering Cabbage

In this study, the dominant soil bacterial phyla across all treatments were Proteobacteria, Actinobacteria, Chloroflexi, Acidobacteria, and Firmicutes, consistent with previous findings [30]. Proteobacteria, known for favoring eutrophic conditions, exhibited higher relative abundances with the organic-amended treatments (FCM, FEM) compared to chemical fertilizer alone. Studies indicate that organic fertilizer application enhances soil nutrients and promotes symbiotic nitrogen fixation by Proteobacteria and carbon source utilization by Bacteroidetes [31]. The Proteobacteria-to-Acidobacteria ratio serves as an indicator of soil nutritional status, with a higher ratio signifying greater organic matter input, aligning with our results [32]. Following organic amendment, the relative abundance of Acidobacteria—associated with continuous cropping obstacles—decreased. These findings suggest that the Proteobacteria/Acidobacteria ratio can predict soil nutritional status.
Organic amendment increased the relative abundance of Chloroflexi, corroborating previous research [33]. Prior studies also reported increased abundances of the Firmicutes phylum and specific genera with organic fertilizer input, consistent with our results [34]. Specifically, organic amendment significantly increased Firmicutes relative abundance. Bacillus species are recognized for their beneficial roles in plant growth promotion and phytopathogen suppression [35]. Our study observed a significant increase in the relative abundance of Bacillus with organic amendment. These shifts align with the copiotrophic hypothesis, which suggests that nutrient-rich conditions favor faster-growing copiotrophic taxa over slower-growing oligotrophic taxa [36].
Previous research demonstrates that applying vermicompost to continuous cropping soil enhances fruit vitamin C and soluble sugar content while reducing nitrate levels and total acidity, thereby optimizing sugar–acid ratio and improving fruit quality [37]. Using the KEGG database for metabolic function analysis, we identified Carbohydrate Metabolism as playing a significant role in soil amelioration. Studies report elevated nitrate ion content in red soil with increasing vermicompost dosage [38]. In contrast, our study found higher relative abundance for amino acid metabolic functions in organic-amended treatments versus chemical fertilizer alone. These results indirectly support vermicompost’s role in mitigating soil nutrient imbalances caused by continuous cropping, improving soil physicochemical properties, stimulating microbial growth, and optimizing the soil microbial biomass carbon-to-nitrogen ratio [39]. Therefore, organic fertilizer addition enhances soil multifunctionality by increasing nutrient content and availability.

4.3. Influence of Chemical Fertilizer Reduction Coupled with Organic Fertilization on Yield and Nitrogen Use Efficiency of Chinese Flowering Cabbage

This study demonstrates that reduced chemical fertilizer combined with organic amendment significantly increased Chinese flowering cabbage yield and nitrogen use efficiency (NUE), aligning with previous findings. For instance: Chinese cabbage under 15% chemical fertilizer reduction + 15% organic substitution achieved a yield of 307.43 t·ha−1 with a 60.71% increase in NUE. Trials with cabbage and pak choi showed 25% organic substitution for fertilizer nitrogen increased yield by 15~16% while reducing ammonia volatilization by 23~42% [40,41]. The slow-release effect of organic fertilizer is closely linked to its regulation of soil nutrient availability. By providing carbon sources and active humic acids, organic fertilizers stimulate microbe-driven nitrogen mineralization, promoting the dynamics of soil ammonium and nitrate nitrogen and reducing nitrogen leaching.
Soil physicochemical properties decisively shape microbial community composition, as different microorganisms possess varying substrate utilization capacities, critically impacting their growth and reproduction. Here, the relative abundance of Proteobacteria showed a positive correlation with soil organic matter content, consistent with prior research [42]. Conversely, Proteobacteria, Actinobacteria, and Firmicutes exhibited negative correlations with soil total nitrogen, available nitrogen, available phosphorus, and available potassium—contradictory to previous studies. Research has shown significant positive correlations between the relative abundance of Firmicutes and soil organic carbon, available phosphorus, and pH in acidic soils after organic fertilizer application [43]. On the one hand, these soil nutrients may impose limitations on Proteobacteria growth; excessive concentrations could inhibit bacterial proliferation, leading to reduced relative abundance [44]. On the other hand, organic fertilizers enhance microbial activity and nutrient utilization primarily by providing abundant organic matter and inorganic nutrients. Furthermore, organic acids produced during microbial decomposition buffer or regulate pH in alkaline soils, potentially contributing to abundance reductions [45].
Mantel test analysis identified soil pH, organic matter, and total nitrogen as key controlling factors for microbial community shifts during organic amendment. These results indicate that organic fertilizer-induced changes in soil nutrient status and microbial communities are interrelated and likely jointly contribute to enhanced yield and NUE.

5. Conclusions

The application of organic fertilizer significantly enhances soil fertility and nutrient content while reducing soil electrical conductivity (EC) and pH, thereby improving soil chemical properties. Additionally, organic fertilizer markedly increases enzyme activity but exhibits no significant effects on urease and catalase activities. Organic fertilization elevates the relative abundance of beneficial bacterial genera such as Bacillus, and vermicompost treatments demonstrate the most pronounced enhancement in microbial carbohydrate and amino acid metabolic functions. Soil organic matter (SOM), total nitrogen (TN), available nitrogen (AN), and invertase activity are identified as shared environmental drivers influencing the relative abundances of Proteobacteria, Actinobacteria, Chloroflexi, and Firmicutes, while SOM, available nitrogen (AN), catalase, and invertase jointly regulate nucleotide metabolism, and urease governs carbohydrate metabolism.
Enhanced organic fertilization improves nitrogen agronomic efficiency, partial factor productivity, and nitrogen contribution rate, with soil nutrient status and bacterial community structure positively correlating with Chinese cabbage yield, though soil enzyme activities inversely correlate with yield. Proteobacteria, Chloroflexi, available potassium (AK), SOM, AN, Actinobacteria, Firmicutes, TN, pH, and invertase activity emerge as primary determinants of yield, while Acidobacteria, EC, available phosphorus (AP), catalase, and urease exhibit lower importance.
This integrated analysis of yield and soil microenvironment indicates that reducing chemical fertilizer by 30% combined with vermicompost (FEM) represents an optimized fertilization strategy for Chinese cabbage cultivation in Ningxia, balancing productivity with soil sustainability.

Author Contributions

J.X. designed and implemented the experiments and wrote the manuscript. J.L., X.Z., Z.L., K.C. and H.X. collected the data. J.X., J.L., X.Z., Z.L. and H.X. analyzed and interpreted the data. L.Y. contributed to the conception, design, implementation, and funding acquisition. All authors have read and agreed to the published version of the manuscript.

Funding

We gratefully acknowledge the following agencies for funding this research article: (1) National Key Research and Development Program of China (2021YFD1600300); (2) the Ningxia Hui Autonomous Region Key R&D Program Project (2023BCF01042).

Data Availability Statement

All of the data are represented in the form of tables and figures. Raw data can be provided on request.

Conflicts of Interest

The authors declare no conflicts of interest.

References

  1. Dai, Y.; Zhang, F.-S.; Guan, J.-T.; Wang, S.-X.; Zhang, H.; Li, G.-L.; Sun, R.-F.; Li, F.; Zhang, S.-J. Single-Cell Transcriptomic Analysis of Flowering Regulation and Vernalization in Chinese Cabbage Shoot Apex. Hortic. Res. 2024, 11, uhae214. [Google Scholar] [CrossRef]
  2. Zhang, H.-Y.; Cun, Y.-H.; Wang, J.-J.; Wu, M.-Y.; Li, X.-J.; Liang, Q.-X.; Wang, C.; Zhao, L.; Deng, J.-Q. Acetylsalicylic acid and salicylic acid alleviate postharvest leaf senescence in Chinese flowering cabbage (Brassica rapa var. parachinensis). Postharvest Biol. Technol. 2022, 194, 112070. [Google Scholar] [CrossRef]
  3. Fu, X.; Xiao, W.; Wang, H.; Chen, Y.; Wang, R.; Wang, Y. Effects of fertigation with carboxymethyl cellulose potassium on water conservation, salt suppression, and maize growth in salt-affected soil. Agric. Water Manag. 2023, 287, 108436. [Google Scholar] [CrossRef]
  4. Rasool, C.; Guo, X.-M.; Wang, Z.-C.; Hassan, M.; Aleem, M.; Javed, Q.; Chen, S. Effect of Buried Straw Layer Coupled with Fertigation on Florescence and Yield Parameters of Chinese Cabbage Under Greenhouse Environment. J. Soil Sci. Plant Nutr. 2020, 20, 598–609. [Google Scholar] [CrossRef]
  5. Rasool, G.; Guo, X.-M.; Wang, Z.-C.; Sheng, C.-D.; Hamoud, Y.-A.; Javed, Q. Response of Fertigation Under Buried Straw Layer on Growth, Yield, and Water-fertilizer Productivity of Chinese Cabbage Under Greenhouse Conditions. Commun. Soil Sci. Plant Anal. 2019, 50, 1030–1043. [Google Scholar] [CrossRef]
  6. Gong, Z.-Y.; Gao, X.; Huang, Y.; Li, R.; Wang, D.-S.; Shen, Q.-R. Research on continuous application of bio-organic fertilizer for improving greenhouse cucumber yield and quality. J. Nanjing Agric. Univ. 2016, 39, 777–783. [Google Scholar] [CrossRef]
  7. Gao, P.; Zhang, T.; Lei, X.-Y.; Chen, X.-W.; Lu, Y.-H.; Fan, L.-S.-P.; Huang, J.; Gao, J.-Y.; Zhang, Z.-H.; Zhang, H.-M. Improvement of soil fertility and rice yield after long-term application of cow manure combined with inorganic fertilizers. J. Integr. Agric. 2023, 22, 2221–2232. [Google Scholar] [CrossRef]
  8. Lv, Z.-Z.; Wu, X.-D.; Hou, H.-X.; Ji, J.-H.; Liu, X.-M.; Liu, Y.-R. Effect of different application ratios of chemical and organic fertilizers on soil quality in double cropping paddy fields. J. Plant Nutr. Fertil. 2017, 23, 904–913. [Google Scholar] [CrossRef]
  9. Gu, S.-Y.; Geng, Z.-M.; Wang, R.; Nie, Y.-L.; Hu, Y.; Cai, H.-S.; Wang, J.-J. Effect of different ratio of bio- organic fertilizer on saline- alkali soil improvement. J. Northeast Agric. Univ. (Engl. Ed.). 2014, 45, 26–30. [Google Scholar] [CrossRef]
  10. Zhao, N.; Dai, C.-Y.; Han, G.-J.; Fang, C.-Y.; Chen, N.-L.; Zhang, Z.; Huang, H.-X. Effect of organic management on soil fertility and wheat production in Minqin oasis. ARAA 2012, 30, 76–81. [Google Scholar] [CrossRef]
  11. Seufert, V.; Ramankutty, N.; Foley, J.-A. Comparing the yields of organic and conventional agriculture. Nature 2012, 485, 229–232. [Google Scholar] [CrossRef] [PubMed]
  12. Kumar, U.; Kumar, N.-A.; Shahid, M.; Gupta, V.-V.-S.-R.; Panneerselvam, P.; Mohanty, S.; Kaviraj, M.; Kumar, A.; Chatterjee, D.; Lal, B.; et al. Continuous application of inorganic and organic fertilizers over 47 years in paddy soil alters the bacterial community structure and its influence on rice production. Agric. Ecosyst. Environ. 2018, 262, 65–75. [Google Scholar] [CrossRef]
  13. Huang, L.-F.; Song, L.-X.; Xia, X.-J.; Mao, W.-H.; Shi, K.; Zhou, Y.-H.; Yu, J.-N. Plant-Soil Feedbacks and Soil Sickness: From Mechanisms to Application in Agriculture. Chem. Ecol. 2013, 39, 232–242. [Google Scholar] [CrossRef]
  14. Cai, F.; Pang, G.; Li, R.-X.; Li, R.; Gu, X.-P.; Chen, W. Bioorganic fertilizer maintains a more stable soil microbiome than chemical fertilizer for monocropping. Biol. Fertil. Soils 2017, 53, 861–872. [Google Scholar] [CrossRef]
  15. Schoebitz, M.; Mengual, C.; Roldán, A. Combined effects of clay immobilized Azospirillum brasilense and Pantoea dispersa and organic olive residue on plant performance and soil properties in the revegetation of a semiarid area. Sci. Total Environ. 2014, 466–467, 67–73. [Google Scholar] [CrossRef]
  16. Brennan, E.-B.; Acosta, M.-V. Cover cropping frequency is the main driver of soil microbial changes during six years of organic vegetable production. Soil Biol. Biochem. 2017, 109, 188–204. [Google Scholar] [CrossRef]
  17. Finkel, O.-M.; Castrillo, C.; Paredes, S.-H.; González, I.-S.; Dangl, J.-L. Understanding and exploiting plant beneficial microbes. Curr. Opin. Plant Biol. 2017, 38, 155–163. [Google Scholar] [CrossRef]
  18. Han, J.-Q.; Dong, Y.-Y.; Zhang, M. Chemical fertilizer reduction with organic fertilizer effectively improve soil fertility and microbial community from newly cultivated land in the Loess Plateau of China. Appl Soil Ecol. 2021, 165, 103966. [Google Scholar] [CrossRef]
  19. Bao, S.D. Soil Agricultural Chemical Analysis, 3rd ed.; China Agricultural Press: Beijing, China, 2000; pp. 25–144. Available online: https://libopac.bift.edu.cn (accessed on 28 June 2025).
  20. Yang, J.-H.; Wang, C.-L.; Dai, H.-L. Soil Agrochemica Analysis and Environmental Monitoring; China Land Publishing House: Beijing, China, 2008. Available online: https://www.shukui.net/book/1828543.html (accessed on 28 June 2025).
  21. Guan, S.-Y.; Zhang, D.; Zhang, Z. Soil Enzyme and Its Research Methods; Chinese Agricultural Press: Beijing, China, 1986; pp. 294–297. Available online: http://opac.stlib.cn (accessed on 28 June 2025).
  22. Zhang, S.-N.; Wang, Y.; Sun, L.-T.; Qiu, C.; Ding, Y.-Q.; Gu, H.-L. Organic mulching positively regulates the soil microbial communities and ecosystem functions in tea plantation. BMC Microbiol. 2020, 20–103. [Google Scholar] [CrossRef]
  23. Guo, H.-J.; Gao, J.; Zhang, Q.; Li, J.-H.; Jin, D.-S.; Xu, M.-G. Differences and reasons for the effects of organic fertilizer on the pH of acidic and alkaline soils in China. Chin. J. Appl. Environ. Biol. 2024, 30, 496–503. [Google Scholar] [CrossRef]
  24. Wang, X.-X.; Zhao, F.-J.; Zhang, G.-X.; Zhang, Y.-Y.; Yang, L.-J. Vermicompost Improves Tomato Yield and Quality and the Biochemical Properties of Soils with Different Tomato Planting History in a Greenhouse Study. Front. Plant Sci. 2017, 8, 1978. [Google Scholar] [CrossRef]
  25. Chintala, R.; Mollinedo, J.; Schumacher, T.-E. Effect of biochar on chemical properties of acidic soil. Arch. Agron. Soil Sci. 2014, 60, 393–404. [Google Scholar] [CrossRef]
  26. Zhang, Y.-Y.; Bai, G.-W.; Yu, J.-H.; Wang, F.; Liu, L.-J.; Zhu, L.; Wu, Y.-D.-L. Screening, identification, and enzyme production condition optimization of a cellulose-degrading bacterial strain. Microbiol. China 2025, 1–20. [Google Scholar] [CrossRef]
  27. Pinggera, J.; Geisseler, D.; Piepho, H.-P.; Joergensen, R.-G.; Ludwig, B. Effect of substrate quality on the N uptake routes of soil microorganisms in different soil depths. Pedobiologia 2015, 58, 211–218. [Google Scholar] [CrossRef]
  28. Li, Q.-J.; Zhang, D.-Q.; Song, Z.-X.; Ren, L.-R.; Jin, X.; Fang, W.-S.; Yan, D.-D.; Li, Y.; Wang, Q.-W.; Cao, A. Organic fertilizer activates soil beneficial microorganisms to promote strawberry growth and soil health after fumigation. Environ. Pollut. 2022, 295, 118653. [Google Scholar] [CrossRef]
  29. Liu, Q.; Mu, X.; Zhao, G.-J.; Cao, Q.-C.; Sun, W.-L. Effects of fertilization on soil water use efficiency and crop yield on the loess plateau, China. Appl. Ecol. Env. Res. 2020, 18, 6555–6568. [Google Scholar] [CrossRef]
  30. Ding, J.-L.; Jiang, X.; Ma, M.-C.; Zhou, B.-K.; Guan, D.-K.; Zhao, B.; Zhou, J.; Cao, F.-M.; Li, L.; Li, J. Effect of 35 years inorganic fertilizer and manure amendment on structure of bacterial and archaeal communities in black soil of northeast China. Appl. Soil Ecol. 2016, 105, 187–195. [Google Scholar] [CrossRef]
  31. Xu, N.; Tan, G.-C.; Wang, H.-Y.; Gai, X.-P. Effect of biochar additions to soil on nitrogen leaching, microbial biomass and bacterial community structure. Eur. J. Soil Biol. 2016, 74, 1–8. [Google Scholar] [CrossRef]
  32. Torsvik, V.; Øvreås, L. Microbial diversity and function in soil: From genes to ecosystems. Curr. Opin. Microbiol. 2002, 5, 240–245. [Google Scholar] [CrossRef]
  33. Liu, Z.-D.; Jiao, Y.-Q.; Yin, J.; Dong, L.; Wang, B.-B.; Zhang, K.-L.; Zheng, X.-X.; Hong, Y.-B.; Zhang, H.-X.; Xie, C.; et al. Productivity and quality of banana in response to chemical fertilizer reduction with bio-organic fertilizer: Insight into soil properties and microbial ecology. Agric. Ecosyst. Environ. 2021, 322, 107659. [Google Scholar] [CrossRef]
  34. Liu, J.; Shu, A.-P.; Song, W.-F.; Shi, W.-C.; Li, M.-C.; Zhang, W.-X.; Li, Z.-Z.; Liu, G.-G.; Yuan, F.-M.; Zhang, S.-X.; et al. Long-term organic fertilizer substitution increases rice yield by improving soil properties and regulating soil bacteria. Geoderma 2021, 404, 115287. [Google Scholar] [CrossRef]
  35. Aloo, B.-N.; Makumba, B.-A.; Mbega, E.-R. The potential of Bacilli rhizobacteria for sustainable crop production and environmental sustainability. Microbiol. Res. 2019, 219, 26–39. [Google Scholar] [CrossRef]
  36. Fierer, N.; Lauber, C.-L.; Ramirez, K.-S.; Zaneveld, J.; Bradford, M.-A.; Knight, R. Comparative metagenomic, phylogenetic and physiological analyses of soil microbial communities across nitrogen gradients. ISME J. 2012, 6, 1007–1017. [Google Scholar] [CrossRef] [PubMed]
  37. Tian, G.-L.; Zhang, L.-S. Alleviation of vermicompost to obstacle in sterilized continuous cropping soil in strawberry production. Plant Nutr. Fert. Sci. 2016, 22, 759–767. [Google Scholar] [CrossRef]
  38. Chen, X.-J.; Cong, W.-W.; Chen, Y.-L.; Lu, N.; Cheng, J.; Cao, X.-L.; Dai, H.-W.; Yao, F.-X.; Sheng, H.-J.; Qian, X.-Q. Effect of earthworm manure on improvement of red soil and its effect on growth of non-pelleting Chinese cabbage. J. Agric. Sci. 2016, 44, 248–250. [Google Scholar] [CrossRef]
  39. Yu, Y.-C.; Wang, C.; Sun, M.-S.; Liu, M.-L. Meliorative effect of earthworm-mycorrhiza interaction on coastal saline soil. J. China Agric. Univ. 2019, 24, 123–129. [Google Scholar]
  40. Liu, Z.-L.; Gao, J.-J.; Chen, Z.; Yan, W.-Q.; Gu, R.-Y. Effects of nitrogen fertilizer reduction combined with organic fertilizeron yield, quality and nitrogen utilization efficiency of Chinese Cabbage. J. Irrig. Drain. Eng. 2022, 40, 1138–1144. [Google Scholar] [CrossRef]
  41. Wu, X.-K.; Jiang, Z.-C.; Lu, Z.-X.; Lu, G.; Xu, Y.-H.; Shi, W.-M.; Min, J. Effects of the partial replacement of chemical fertilizer with manure on the yield and nitrogen emissions in leafy vegetable production. Chin. J. Eco-Agric. 2020, 28, 349–356. [Google Scholar] [CrossRef]
  42. Liu, W.; Wang, S.-T.; Lin, P.; Sun, H.-W.; Hou, J.; Zuo, Q.-Q.; Huo, R. Response of CaCl2-extractable heavy metals, polychlorinated biphenyls, and microbial communities to biochar amendment in naturally contaminated soils. J. Soil Sediment. 2016, 16, 476–485. [Google Scholar] [CrossRef]
  43. Xun, W.-B.; Xiong, W.; Huang, T.; Wei, R.; Li, D.-C.; Shen, Q.-R.; Lu, Q.; Zhang, R.-F. Swine manure and quicklime have different impacts on chemical properties and composition of bacterial communities of an acidic soil. Appl. Soil Ecol. 2016, 100, 38–44. [Google Scholar] [CrossRef]
  44. Wu, Y.-R.; Yang, W.-Q.; Li, Q.-Y.; Qiao, Q.-L.; Zhao, S.; Zhang, Y.-L.; Yu, Y.-H.; Zhang, S.-X.; Li, X.-L.; Kou, J.-C. Microbial Community Response to Alpine Meadow Degradation and Its Impact on Soil Nutrient Cycling. Agron. J. 2024, 14, 195. [Google Scholar] [CrossRef]
  45. Yang, Y.; Wang, C.-J.; Guo, J.-H.; Guan, H.-L.; Li, L.; Tang, G.-M.; Huang, J.-X. The Effects of Cadmium Stress on Seed Germination and Seedling Growth of Bidens Pilosa (L.) and Pennisetum Alopecuroides (L.). J. Yunnan Univ. Nat. Sci. Ed. 2022, 42, 50–57 + 63. [Google Scholar] [CrossRef]
Figure 1. Experimental site.
Horticulturae 11 00859 g001
Figure 2. (A) Soil electrical conductivity (EC), pH value and total nitrogen (TN) content under different treatments; (B) Soil organic matter (SOM), available nitrogen (AN), available phosphorus (AP) and available potassium (AK) content under different treatments. Different lowercase letters in the figure indicate significant differences between different treatments at the 0.05 level (p < 0.05).
Horticulturae 11 00859 g002
Figure 3. (A) Urease activity in soil under different treatments; (B) Catalase activity in soil under different treatments; (C) Sucrase activity in soil under different treatments. Lowercase letters (a, b, c, d) indicate significant differences (p < 0.05) among treatments within an indicator-year (different letters: significant; same letter: non-significant). Error bars (vertical lines with end caps) represent data variability (SE or SD); greater length indicates higher dispersion among replicates. Black dots plot raw data points (replicate measurements), showing actual data distribution to complement the mean (bar height) and error bars, providing a comprehensive view of variability.
Horticulturae 11 00859 g003
Figure 4. Composition and relative abundance of soil bacterial phylum level (A) and genus level (B) in different treatments.
Horticulturae 11 00859 g004
Figure 5. Biochemical metabolic pathways of soil bacterial community as affected by treatments. In statistical analysis, asterisks (* and **) serve as standard notation for indicating significance levels, where * denotes a statistically significant difference at p < 0.05, and ** signifies a highly statistically significant difference at p < 0.01.
Horticulturae 11 00859 g005
Figure 6. The level 3 KEGG homologous function predictions of soil bacterial community as affected by treatments.
Horticulturae 11 00859 g006
Figure 7. Microbial community (A), metabolic function (B), and soil environmental factors Mantel test.
Horticulturae 11 00859 g007
Figure 8. Chinese flowering cabbage production in 2022 and 2023. Different lowercase letters in the figure indicate significant differences between different treatments at the 0.05 level (p < 0.05).
Horticulturae 11 00859 g008
Figure 9. Partial least squares models of yield and environmental factors (A) and Random Forest models prediction (B). No statistical correction for multiple comparisons was implemented in the correlation analyses. Each box represents an observed variable. Red solid arrows represent positive correlations, blue dashed arrows represent negative correlations, and the numbers above the arrows indicate the path coefficients: red for positive path coefficients and blue for negative path coefficients (A). Path coefficients and coefficients of determination are calculated after 999 bootstraps. **—p < 0.01. TN: total nitrogen, SOM: soil organic matter, AN: available nitrogen, AP: available phosphorus, AK: available potassium. Urease: urease, Catalase: catalase, Sucrase: sucrase.
Horticulturae 11 00859 g009
Table 1. Fertilization treatment and application rate of fertilizer.
TreatmentFertilizer DesignUrea
(kg·hm−2)
Calcium Superphosphate
(kg·hm−2)
Potassium Sulfate
(kg·hm−2)
Organic Fertilizer
(kg·hm−2)
CKno fertilizer0000
CF1chemical fertilizer only2601201100
CF230% less chemical fertilizer18284770
FCM30% less chemical fertilizer + rotted chicken manure182847711,000
FEM30% less chemical fertilizer + vermicompost182847713,500
Table 2. Effects of different treatments on nitrogen fertilizer use efficiency of Chinese flowering cabbage.
YearTreatmentNitrogen Agronomic Efficiency
(kg·kg−1)
Nitrogen Partial Factor Productivity
(umol·m−2·s−1)
Nitrogen Fertilizer
Reductions
(%)
2022CF114.47 ± 3.47b226.93 ± 1.61d6.34 ± 1.50b
CF29.29 ± 2.38b312.80 ± 1.96a2.97 ± 0.76b
FCM24.20 ± 1.71a236.65 ± 2.16c10.22 ± 0.69a
FEM31.14 ± 3.19a243.59 ± 2.00b12.75 ± 1.23a
2023CF114.27 ± 1.64b232.95 ± 1.77d6.12 ± 0.68b
CF23.89 ± 3.10c316.29 ± 2.08a1.22 ± 0.97c
FCM21.96 ± 1.21ab240.64 ± 0.73c9.13 ± 0.52a
FEM28.66 ± 2.73a247.33 ± 1.83b11.56 ± 1.03a
Note: Different lowercase letters in the figure indicate significant differences between different treatments at the 0.05 level (p < 0.05).
Disclaimer/Publisher’s Note: The statements, opinions and data contained in all publications are solely those of the individual author(s) and contributor(s) and not of MDPI and/or the editor(s). MDPI and/or the editor(s) disclaim responsibility for any injury to people or property resulting from any ideas, methods, instructions or products referred to in the content.

