1. Introduction
In modern agriculture, phenotypic research plays a central role in understanding the mechanisms of crop growth, development, and interactions with the environment. It is of great significance for crop genetic improvement, precision breeding, and intelligent cultivation management. Accurate phenotypic data not only provide a solid scientific foundation for genetic improvement and precision breeding but also support the development and implementation of intelligent cultivation strategies, thereby enhancing agricultural productivity and resource-use efficiency [
1,
2]. As the global demand for high-throughput breeding continues to grow, the development of automated, non-contact, and high-precision phenotypic information extraction technologies has become a key technical pathway for advancing the transformation and upgrading of smart agriculture [
3]. With the ongoing refinement of deep-learning theory and the continuous improvement of computational hardware, deep learning has achieved extensive and in-depth progress in image processing, feature extraction, and pattern recognition. Its outstanding performance in high-dimensional data modeling, nonlinear feature representation, and end-to-end learning has made it a critical research focus in the field of artificial intelligence, providing a robust technical foundation for the automation of various complex tasks [
4].
Among various economic crops, cucumber is an important vegetable crop whose fruit appearance contains rich phenotypic information, including fruit length, peduncle-to-fruit length ratio, transverse diameter variation, and arch height. These fruit phenotypic traits are not only closely related to key agronomic characteristics such as yield, quality, and disease resistance [
5,
6], but they also directly influence market value and consumer preferences. For instance, the uniformity and integrity of fruit shape are often regarded as important criteria for high-quality cucumbers, directly affecting retail price and brand perception. High-precision and automated phenotypic measurement technologies for cucumber fruits play a crucial role in breeding and cultivation management. By accurately modeling and quantitatively analyzing fruit morphological traits, these technologies provide stable and reliable phenotypic evidence for genetic improvement and variety selection, thereby enhancing breeding efficiency and the scientific basis of decision-making. Moreover, phenotype-based quality evaluation systems can support standardized grading and traceability management, effectively improving product market competitiveness and consumer trust. Overall, such technologies offer significant advantages in promoting the intelligent and refined transformation of the cucumber industry, demonstrating strong application potential and value for broader adoption.
Traditional phenotypic extraction methods mainly rely on manual operations, which suffer from low efficiency and large errors, making them inadequate for the demands of smart agriculture in terms of high-throughput and precise phenotypic analysis. In recent years, deep-learning theories and image processing algorithms have been widely applied in the field of phenotypic extraction, providing new technical tools for crop phenotyping research [
7,
8]. Existing studies have primarily focused on fruit target detection and the extraction of basic geometric parameters, such as fruit count, length, width, and area. These tasks mainly depend on image segmentation and object detection frameworks. In the field of object detection, Qiu et al. [
9] proposed a lightweight object detection network, GSE-YOLO, which builds upon YOLOv8n by incorporating a feature reparameterization module. This approach significantly reduces model complexity while maintaining high accuracy, thereby improving the performance of dragon fruit maturity recognition. Xu et al. [
10] combined YOLOv8 with OpenCV to extract ten quantitative and four qualitative phenotypic traits of non-heading Chinese cabbage leaves, demonstrating the feasibility of integrating deep learning with traditional image processing algorithms. In terms of image segmentation, existing research has achieved notable success in extracting regions of fruits and plant structures. For example, Ndikumana et al. [
11] developed a multitask detection framework combining YOLOv4 and U-Net, which effectively balances strawberry fruit detection and maturity classification, showing strong robustness under varying lighting and occlusion conditions. Zhang et al. [
12] used image segmentation techniques to precisely extract spot patterns on pear fruits, obtaining phenotypic traits such as spot count, area, and color. Wei et al. [
13] employed a synthetic occlusion image augmentation strategy to achieve high-throughput instance segmentation of mushroom caps, enabling accurate size estimation without the need for explicit masks. Wang et al. [
14] introduced an edge attention mechanism into the apple instance segmentation framework, which significantly enhanced the extraction of structural details. Gai et al. [
15] designed the HPPEM model by integrating hybrid task cascades with ConvNeXt, enabling high-precision segmentation of blueberry clusters and automated extraction of phenotypic traits such as count, maturity, and compactness. Cao et al. [
16] proposed the EGF-Former model for instance segmentation of sweet peppers in complex scenes. With the guidance of multi-scale feature fusion and boundary-aware modules, the model achieved a mean Intersection over Union (mIoU) of 83.45%, significantly outperforming existing segmentation methods.
Although deep-learning technologies have achieved remarkable progress in crop phenotypic information extraction, most existing methods rely on coarse-grained structural representations such as bounding boxes or segmentation masks. These approaches primarily focus on the overall shape and edge regions of fruits, making it difficult to effectively capture spatial relationships and geometric features between different parts. For modeling tasks involving significant variations in fruit posture, complex morphology, or indistinct local features, such methods often struggle to ensure representation accuracy and structural consistency, thereby limiting their applicability in fine-grained phenotypic analysis. To enhance the model’s ability to describe fruit appearance and structure, it is essential to introduce more geometrically expressive and structured modeling approaches. Such methods can enable precise localization of key components and effectively represent their spatial relationships, thereby improving the accuracy and robustness of phenotypic characterization.
In recent years, structural modeling has gradually become a key direction in visual perception and representation tasks. Some methods have introduced keypoint detection, pose estimation, and structure-aware mechanisms to enhance the model’s ability to capture spatial structures and morphological features [
17]. Compared to traditional bounding box and segmentation mask approaches, keypoint detection enables explicit modeling of essential structural parts of fruits or organisms, offering greater geometric consistency and generalization capability in tasks such as morphology description, geometric parameter measurement, and behavior pattern analysis. Keypoint detection methods have shown strong accuracy and adaptability in animal structure modeling. For instance, Peng et al. [
18] designed a non-contact system combining monocular depth images with keypoint detection to measure major body parts of cattle. Su et al. [
19] reformulated the traditional horse body measurement problem as a keypoint localization task and proposed a top-down automatic Mongolian horse body measurement method by integrating object detection and keypoint detection algorithms. The method achieved an average accuracy of 90.1%, with the RTMPose algorithm reaching 91.4%. Li et al. [
20] employed an improved YOLOv8-based keypoint detection algorithm to monitor cattle rumination behavior non-invasively, achieving an average error of only 5.6% in chew count. Chen et al. [
21] developed the YOLOv8l-Pose model for high-precision detection of carapace keypoints in the Chinese mitten crab, extending the application of this strategy to aquatic structure modeling. Owing to its promising performance in animal structural modeling, keypoint detection techniques are increasingly being applied to plant phenotyping tasks. He et al. [
22] developed the DEKR-SPrior network, which incorporates target location priors to guide the learning of discriminative features, enabling the high-precision detection of densely arranged and occluded keypoints in soybean pods. Zheng et al. [
23] proposed a deep-learning vision algorithm based on RGB images for fruit instance segmentation and picking point localization, significantly improving task efficiency and performance through an end-to-end network that performs both tasks in parallel. Du et al. [
24] combined image keypoints and point cloud processing methods to achieve accurate 3D pose estimation of tomato fruits, supporting structural modeling and size measurement tasks. Gao et al. [
25] introduced SCPE, a structure-aware maize plant architecture estimation method based on YOLOv7-SlimPose for keypoint detection, combined with geometric reconstruction to obtain traits such as plant height and leaf angles. Chen et al. [
26] proposed a grapefruit and picking point co-detection method based on the improved YOLOv8-GP model, improving the localization accuracy and efficiency of harvesting robots. Zheng et al. [
27] developed an enhanced YOLOv8n-CK model for fast and accurate keypoint detection of cabbage heads, achieving 99.2% accuracy even under occlusion while significantly reducing model parameters and computational cost. Wang et al. [
28] designed the improved YOLOv8n-Pose-LBD algorithm for efficient detection and localization of goji berries and picking points in complex environments. Wang et al. [
29] proposed the YOLO-TMPPD model, which improves tomato ripeness classification and picking point localization in complex greenhouse environments by integrating Depthwise Convolution, CARAFE up-sampling, and CBAM attention mechanisms, achieving higher detection accuracy and reduced model size. Ma et al. [
30] developed the STRAW-YOLO method to jointly detect strawberries and their keypoints, enhancing the association between fruit objects and structural components.
Keypoint detection, as an intermediate representation that combines lightweight design with structural constraints, has demonstrated significant advantages in structured modeling tasks for agricultural imagery. Compared to traditional coarse-grained approaches based on bounding boxes or segmentation masks, keypoints are capable of capturing internal spatial structures and geometric axes of the target, making them particularly suitable for modeling phenotypic traits with complex morphology and tightly coupled structures. This contributes to improving both the accuracy and interpretability of structural representations. Although keypoint detection methods have seen preliminary applications in crop phenotyping studies, their systematic exploration in modeling fruit crops remains limited. Issues such as annotation protocols and model architecture design still require further optimization. Taking cucumber as an example, its fruit is typically elongated and naturally curved, with the stem and blossom ends exhibiting high similarity in color and texture. This makes it difficult for traditional appearance-based methods to distinguish and localize these regions precisely. Furthermore, geometric traits such as fruit length and curvature rely heavily on accurate modeling of the overall structural axis, which cannot be effectively represented using bounding boxes or segmentation masks due to their lack of continuity and structural constraints. Several keypoint detection approaches have been proposed, and models in the YOLO series have shown promising performance in agricultural keypoint detection tasks, offering both lightweight and efficient solutions. However, most of these models are trained on general-purpose datasets and lack targeted optimization for the morphological features of fruit crops. As a result, they still face challenges related to model complexity and computational cost, limiting their applicability in field conditions where low power consumption, real-time performance, and ease of deployment are essential requirements.
To address the challenges of inaccurate localization of key cucumber fruit structures, insufficient precision in geometric feature extraction, and high deployment costs of existing methods, this study proposes a lightweight phenotypic modeling model based on keypoint detection, named YOLO11m-SCFPose. By strategically designing the keypoint layout, the model extracts critical phenotypic indicators such as fruit length, stem-to-fruit length ratio, transverse diameter variation, and arch height. While maintaining high detection accuracy, the model features a low parameter count and minimal computational overhead, meeting the practical demands of real-time performance and ease of deployment in agricultural field environments. This provides a feasible solution for efficient fruit phenotyping and holds significant application value and potential for broader adoption.
2. Materials and Methods
This chapter consists of six sections:
Section 2.1 describes the dataset acquisition and preprocessing procedures;
Section 2.2 explains the calculation methods of cucumber phenotypic parameters;
Section 2.3 focuses on the improved approach based on the YOLO11m-Pose model;
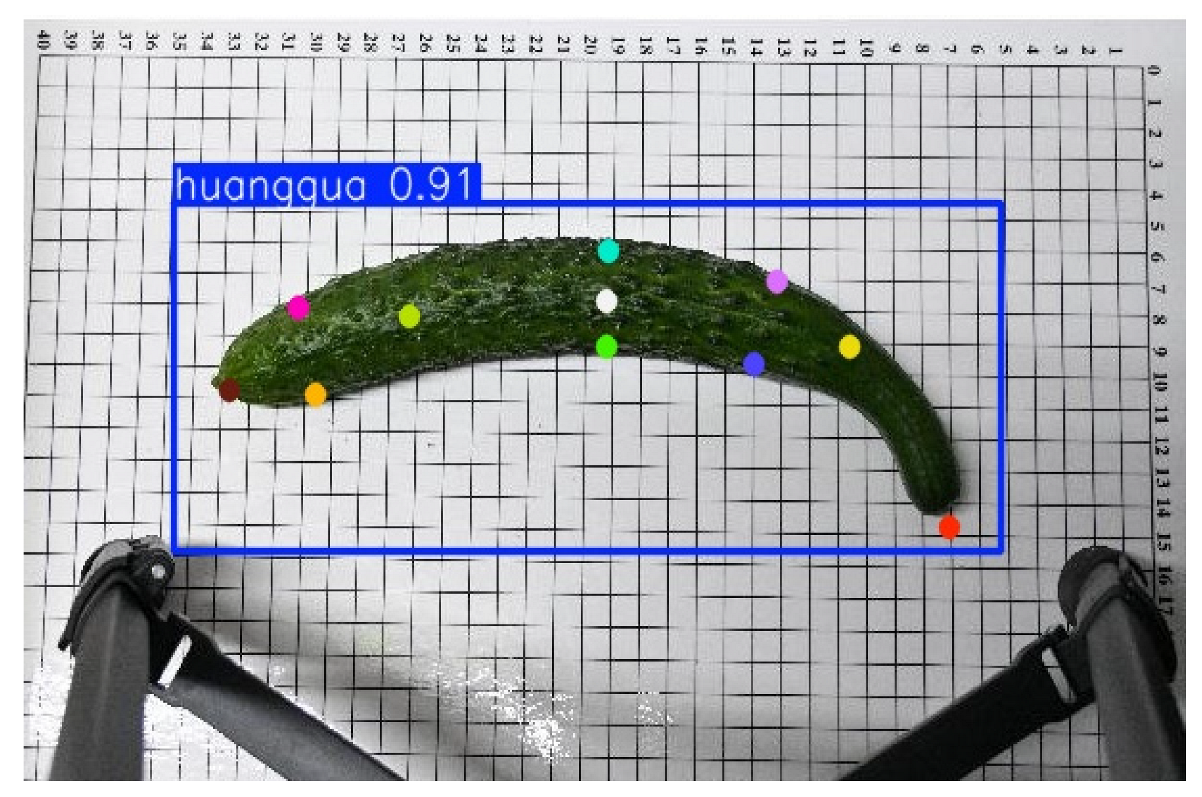
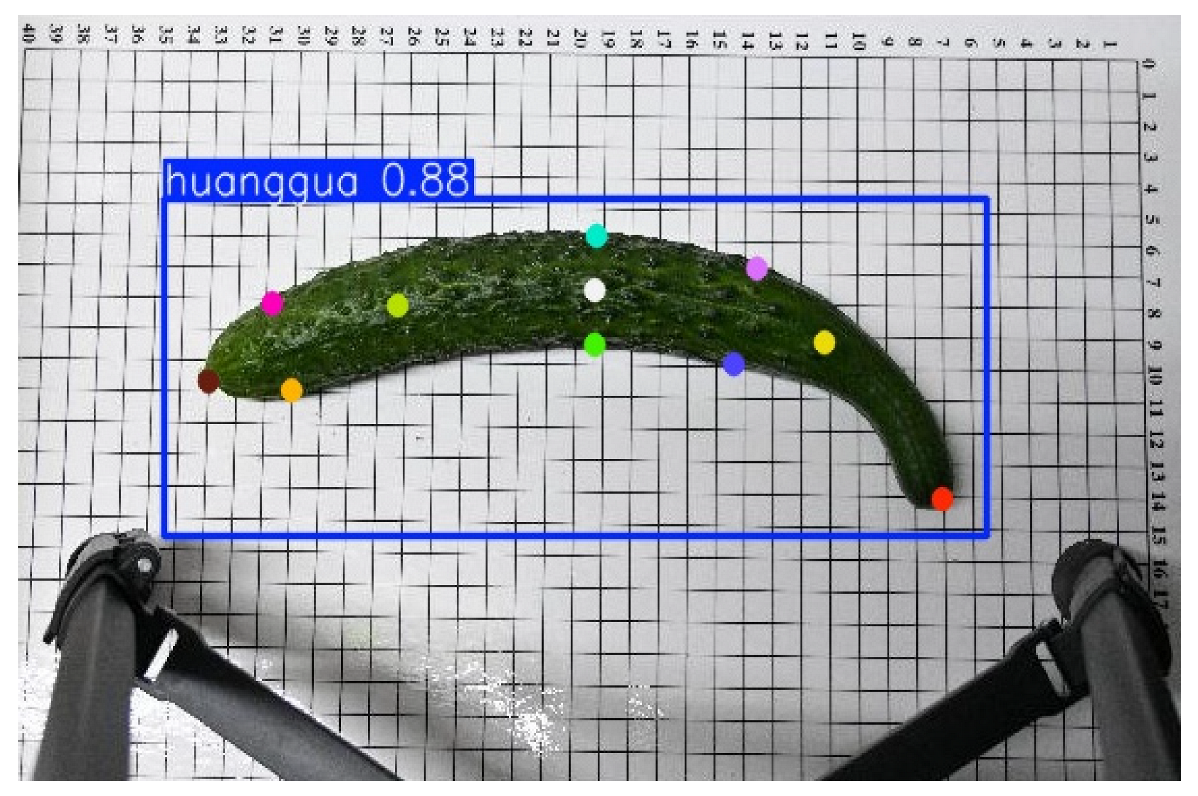
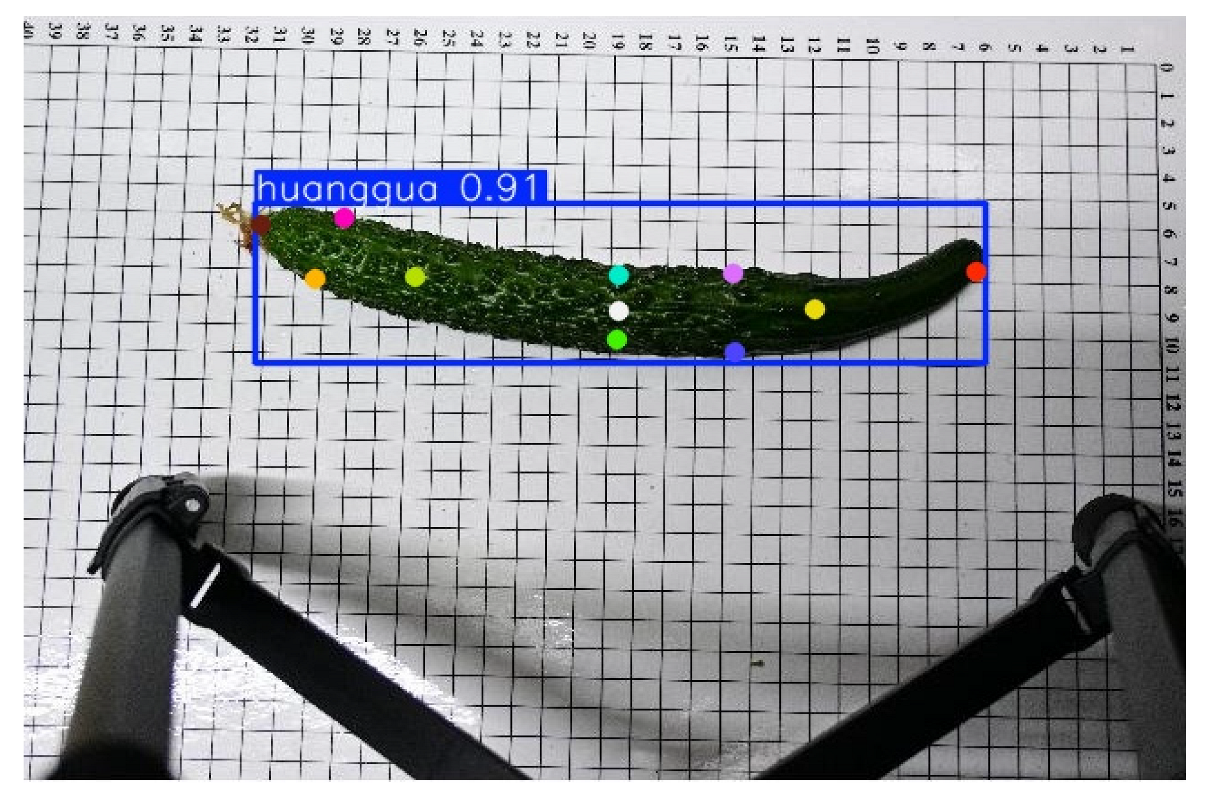
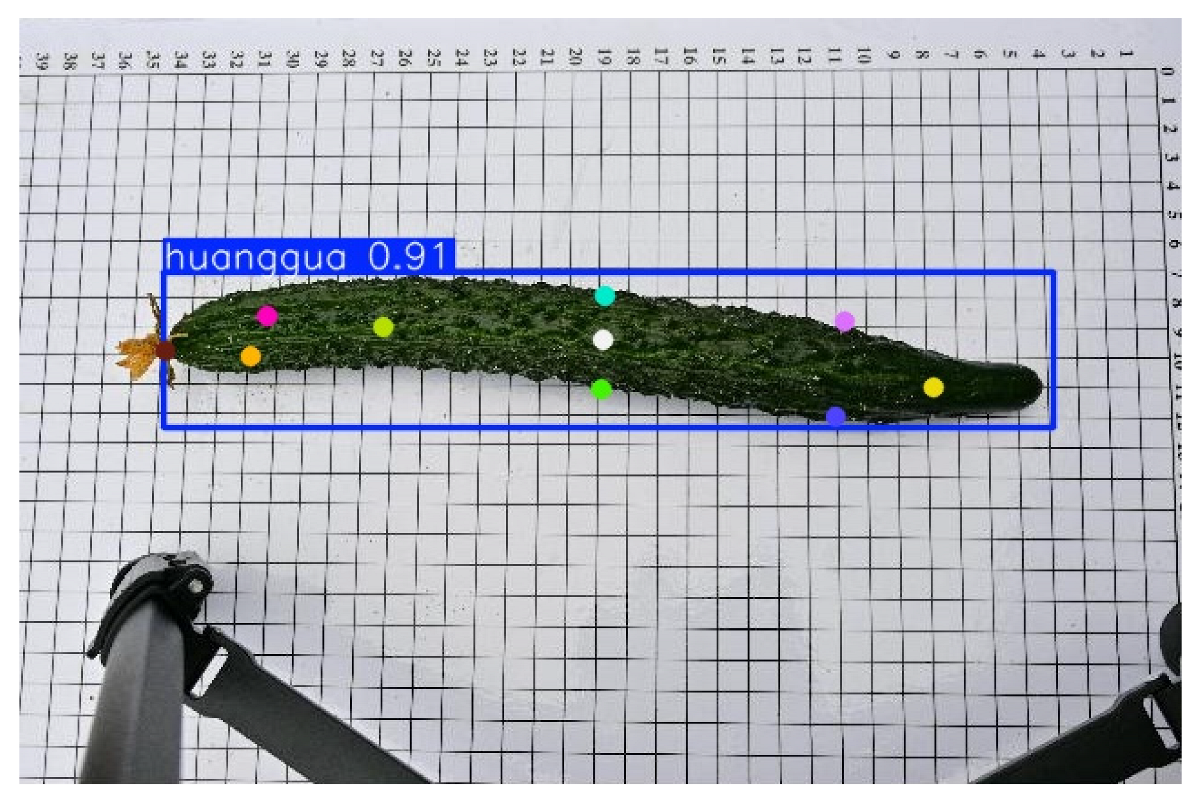
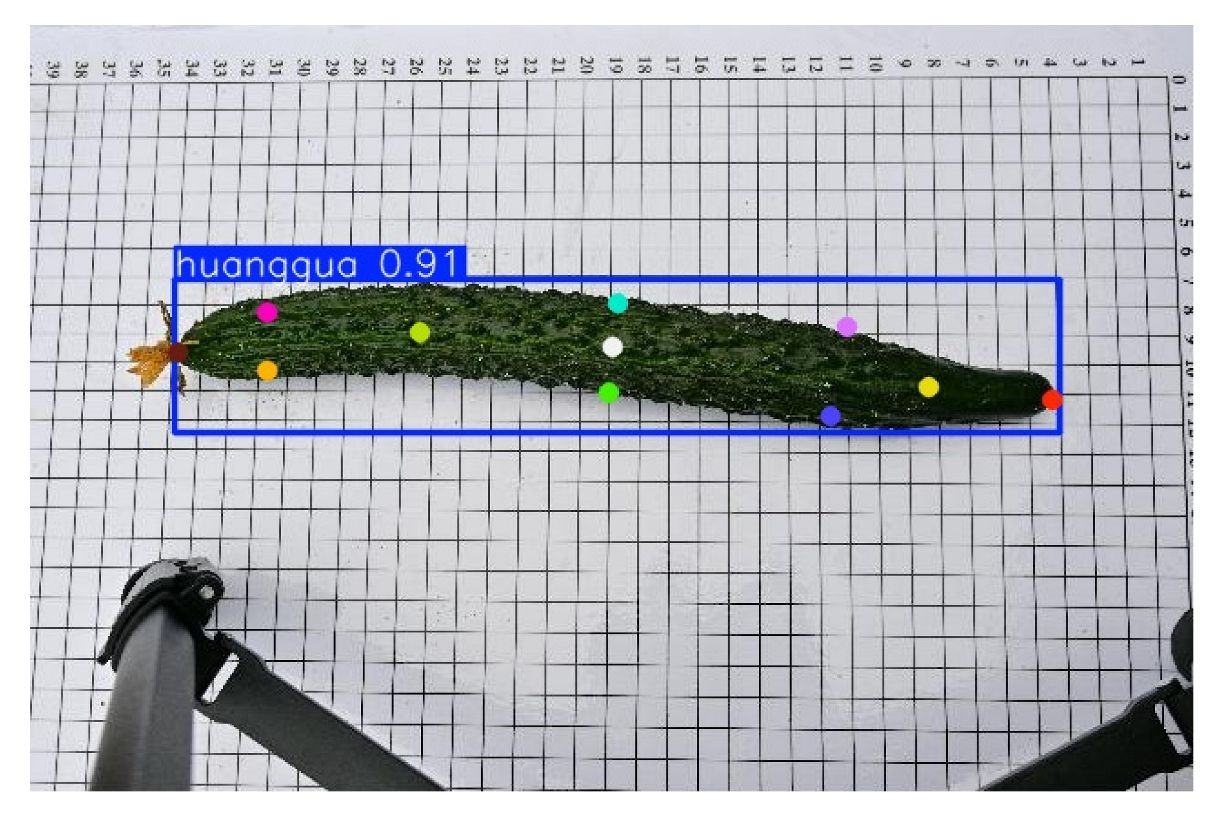
Section 2.4 presents the keypoint detection visualization results of the original and improved models;
Section 2.5 outlines the evaluation metrics used for model performance assessment.
2.1. Data Acquisition and Processing
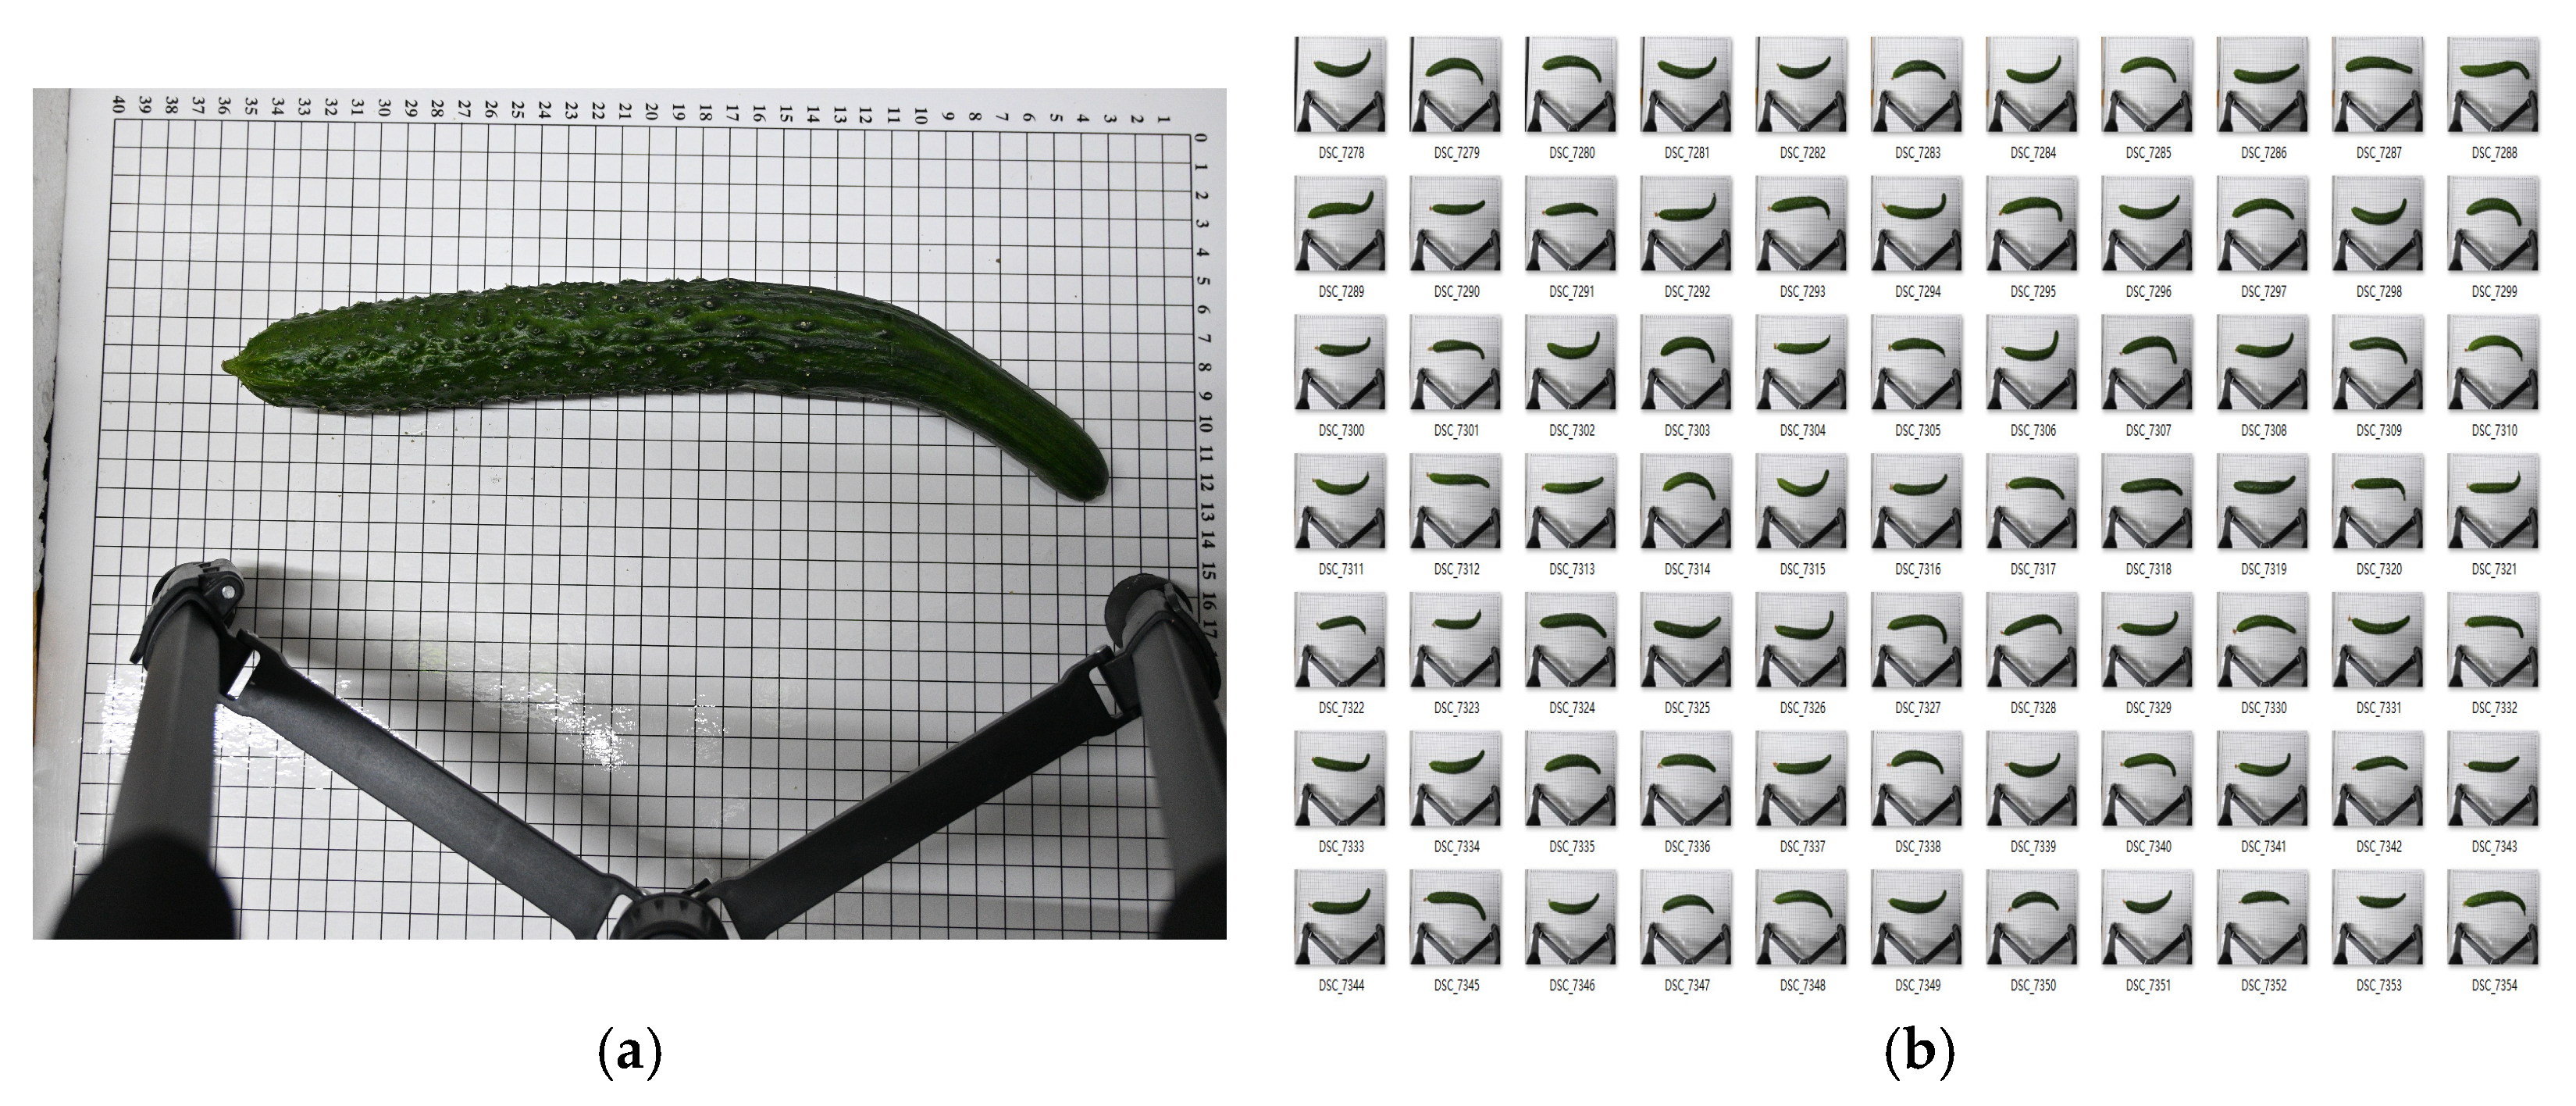
The cucumber sample images used in this study were collected at the Cucumber Science and Technology Courtyard in Juye, Shandong, focusing on the North China-type spined cucumber. To ensure image quality and experimental consistency, all images were captured indoors under controlled conditions between 3:00 PM and 5:00 PM each day, using a fixed artificial lighting system to minimize the impact of external light variations. Image acquisition was conducted using a Nikon Z30 (Nikon Corporation, Bangkok, Thailand) camera equipped with a 16–50 mm standard lens, with the focal length set to 30 mm. The camera was mounted on a stable tripod, with the lens positioned 50 cm above the ground. To maintain consistency, the camera position and angle remained unchanged throughout the acquisition process. All cucumbers used for shooting were harvested within 1–2 days and were not subjected to any cleaning, trimming, or other human interventions before shooting, thus preserving their natural state. The samples were placed on a calibration background board with a white base and black grid lines, featuring 1 cm grid intervals to enhance contrast between the cucumber contour and background and to serve as a reference for subsequent image annotation and dimensional measurements. As cucumber keypoints are morphologically similar, the samples were placed horizontally on the calibration board during acquisition to standardize their orientation and improve annotation accuracy and model training performance. The collected cucumber sample images are shown in
Figure 1. A total of 900 images were collected, covering various natural shape variations, and served as the data foundation for subsequent model training and evaluation, as shown in
Figure 1. Twenty images were randomly selected from the dataset, and 10 calibration grids were measured in each image to determine their pixel lengths. The average real-world distance represented by a single pixel was calculated as 0.638 mm, and this value was used as the scale for all subsequent distance-related calculations and analyses.
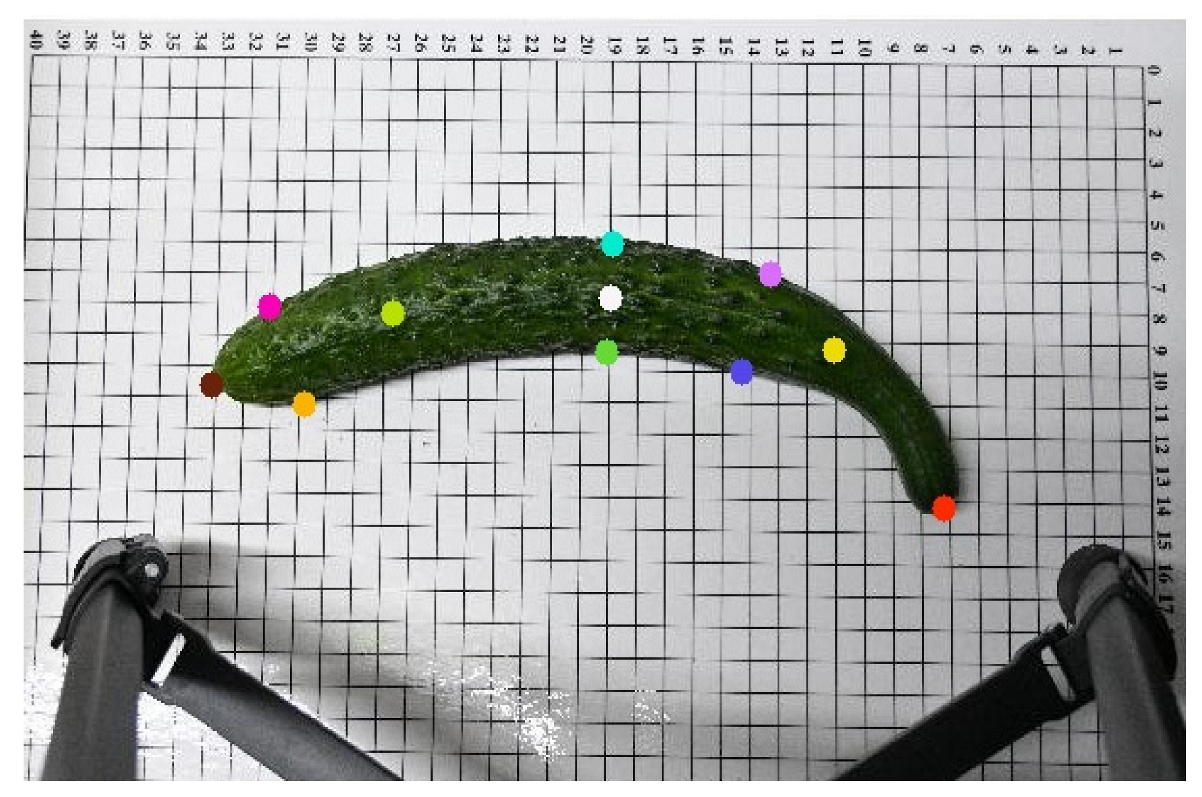
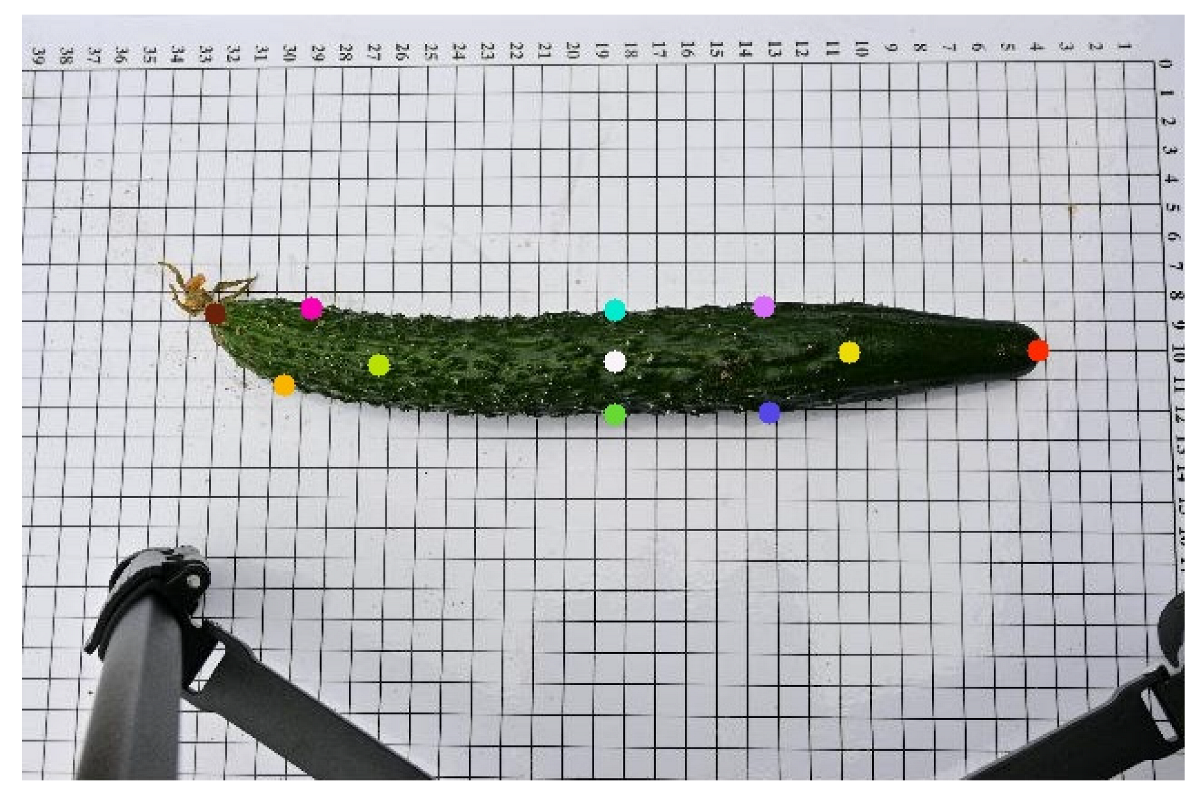
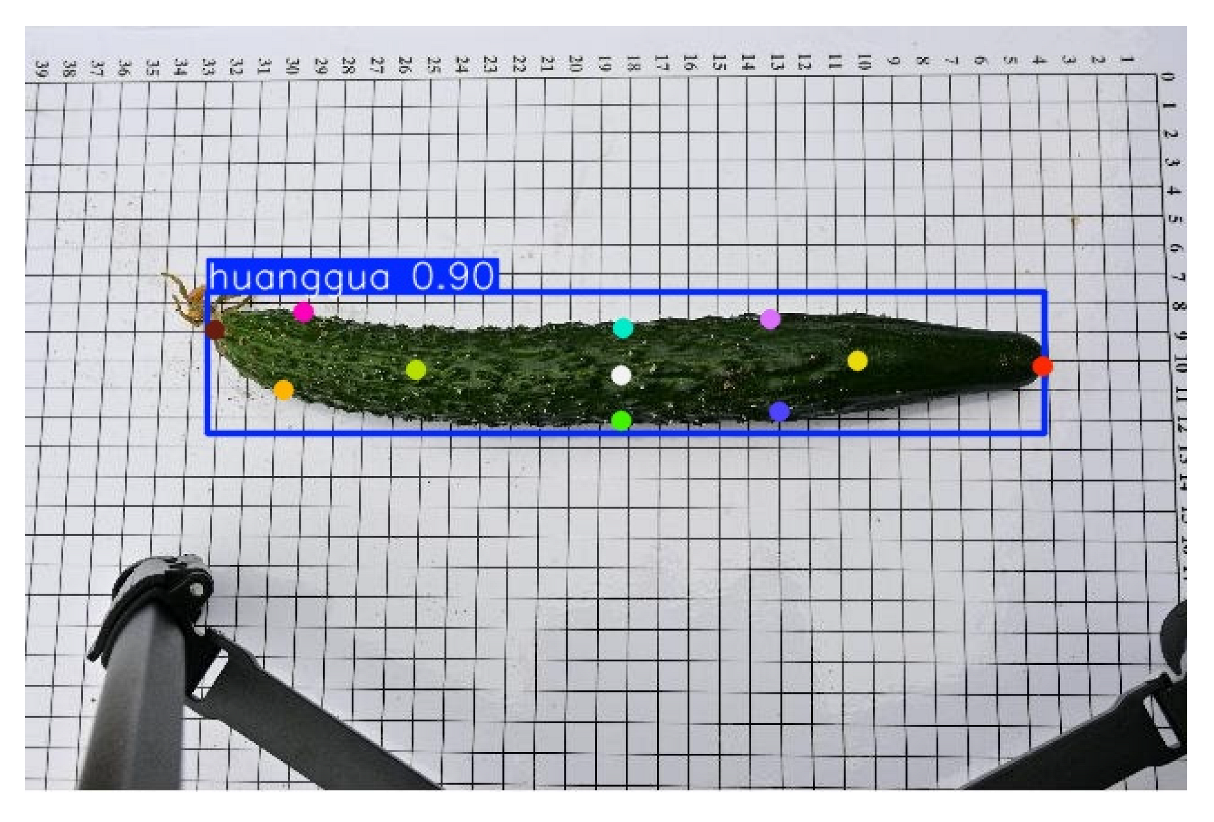
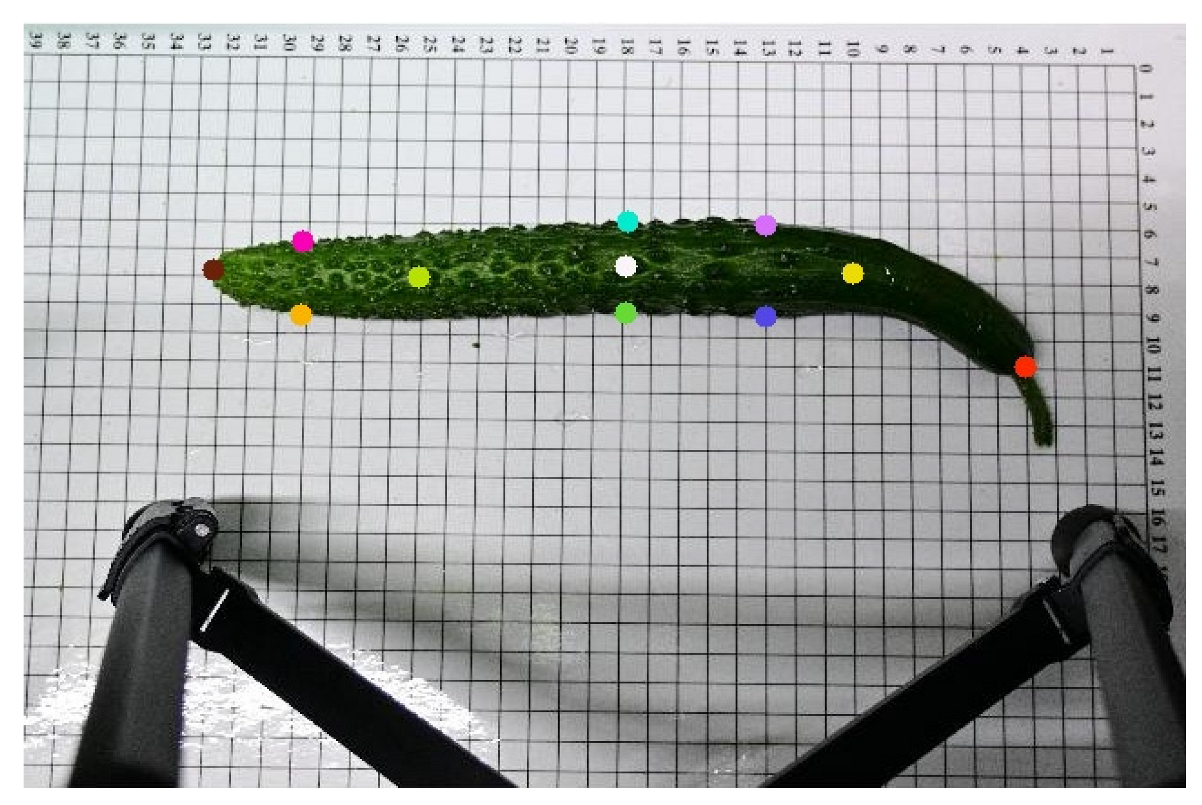
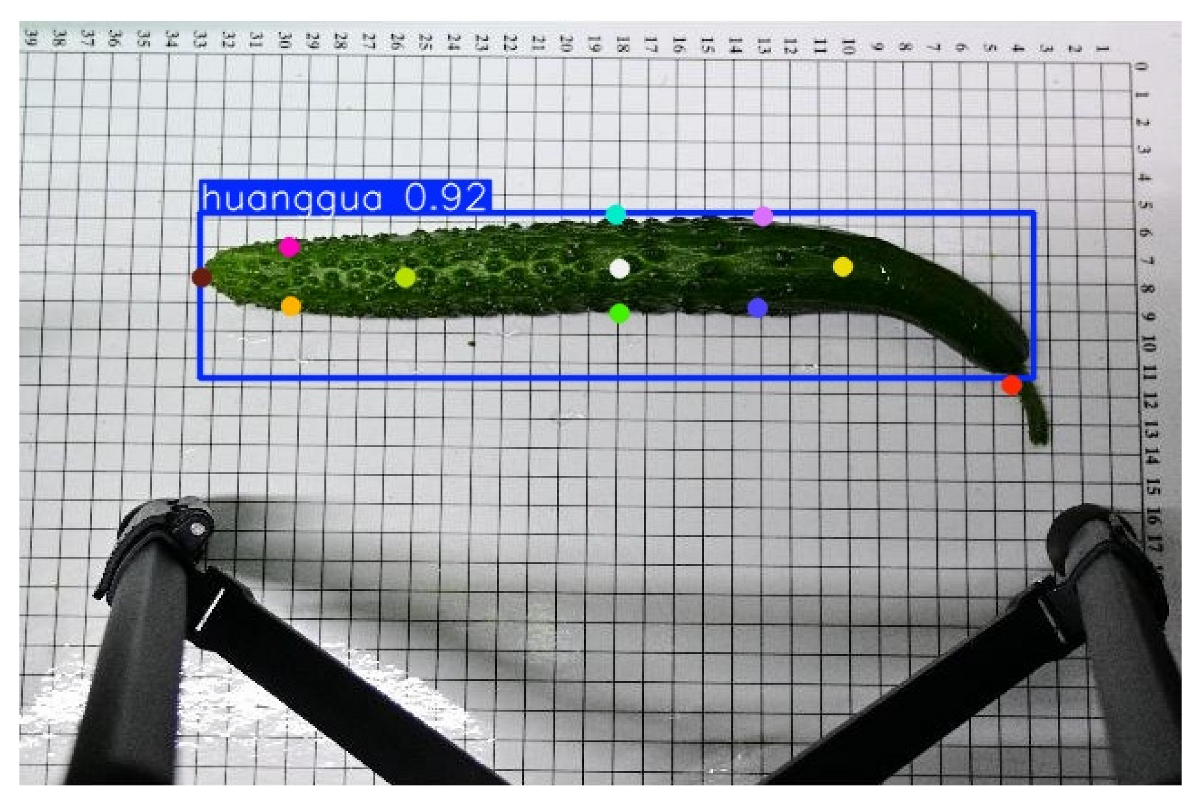
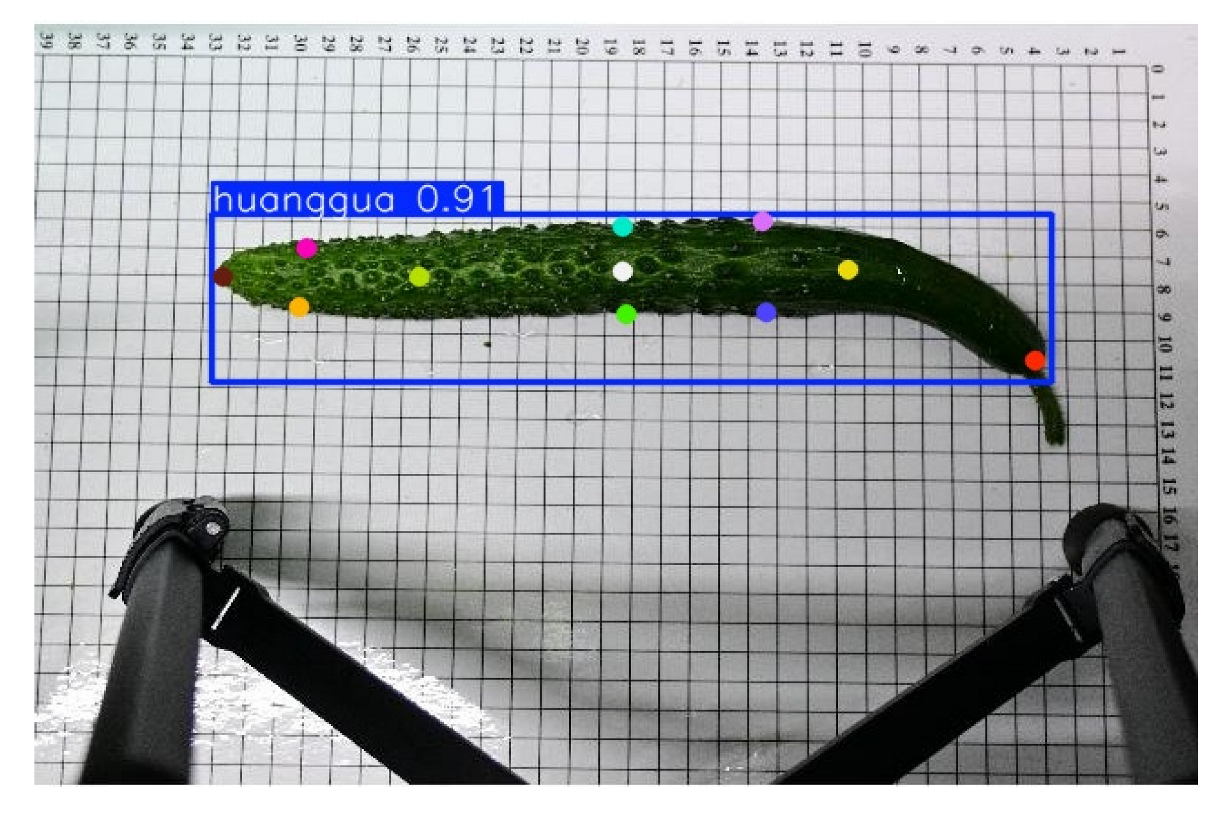
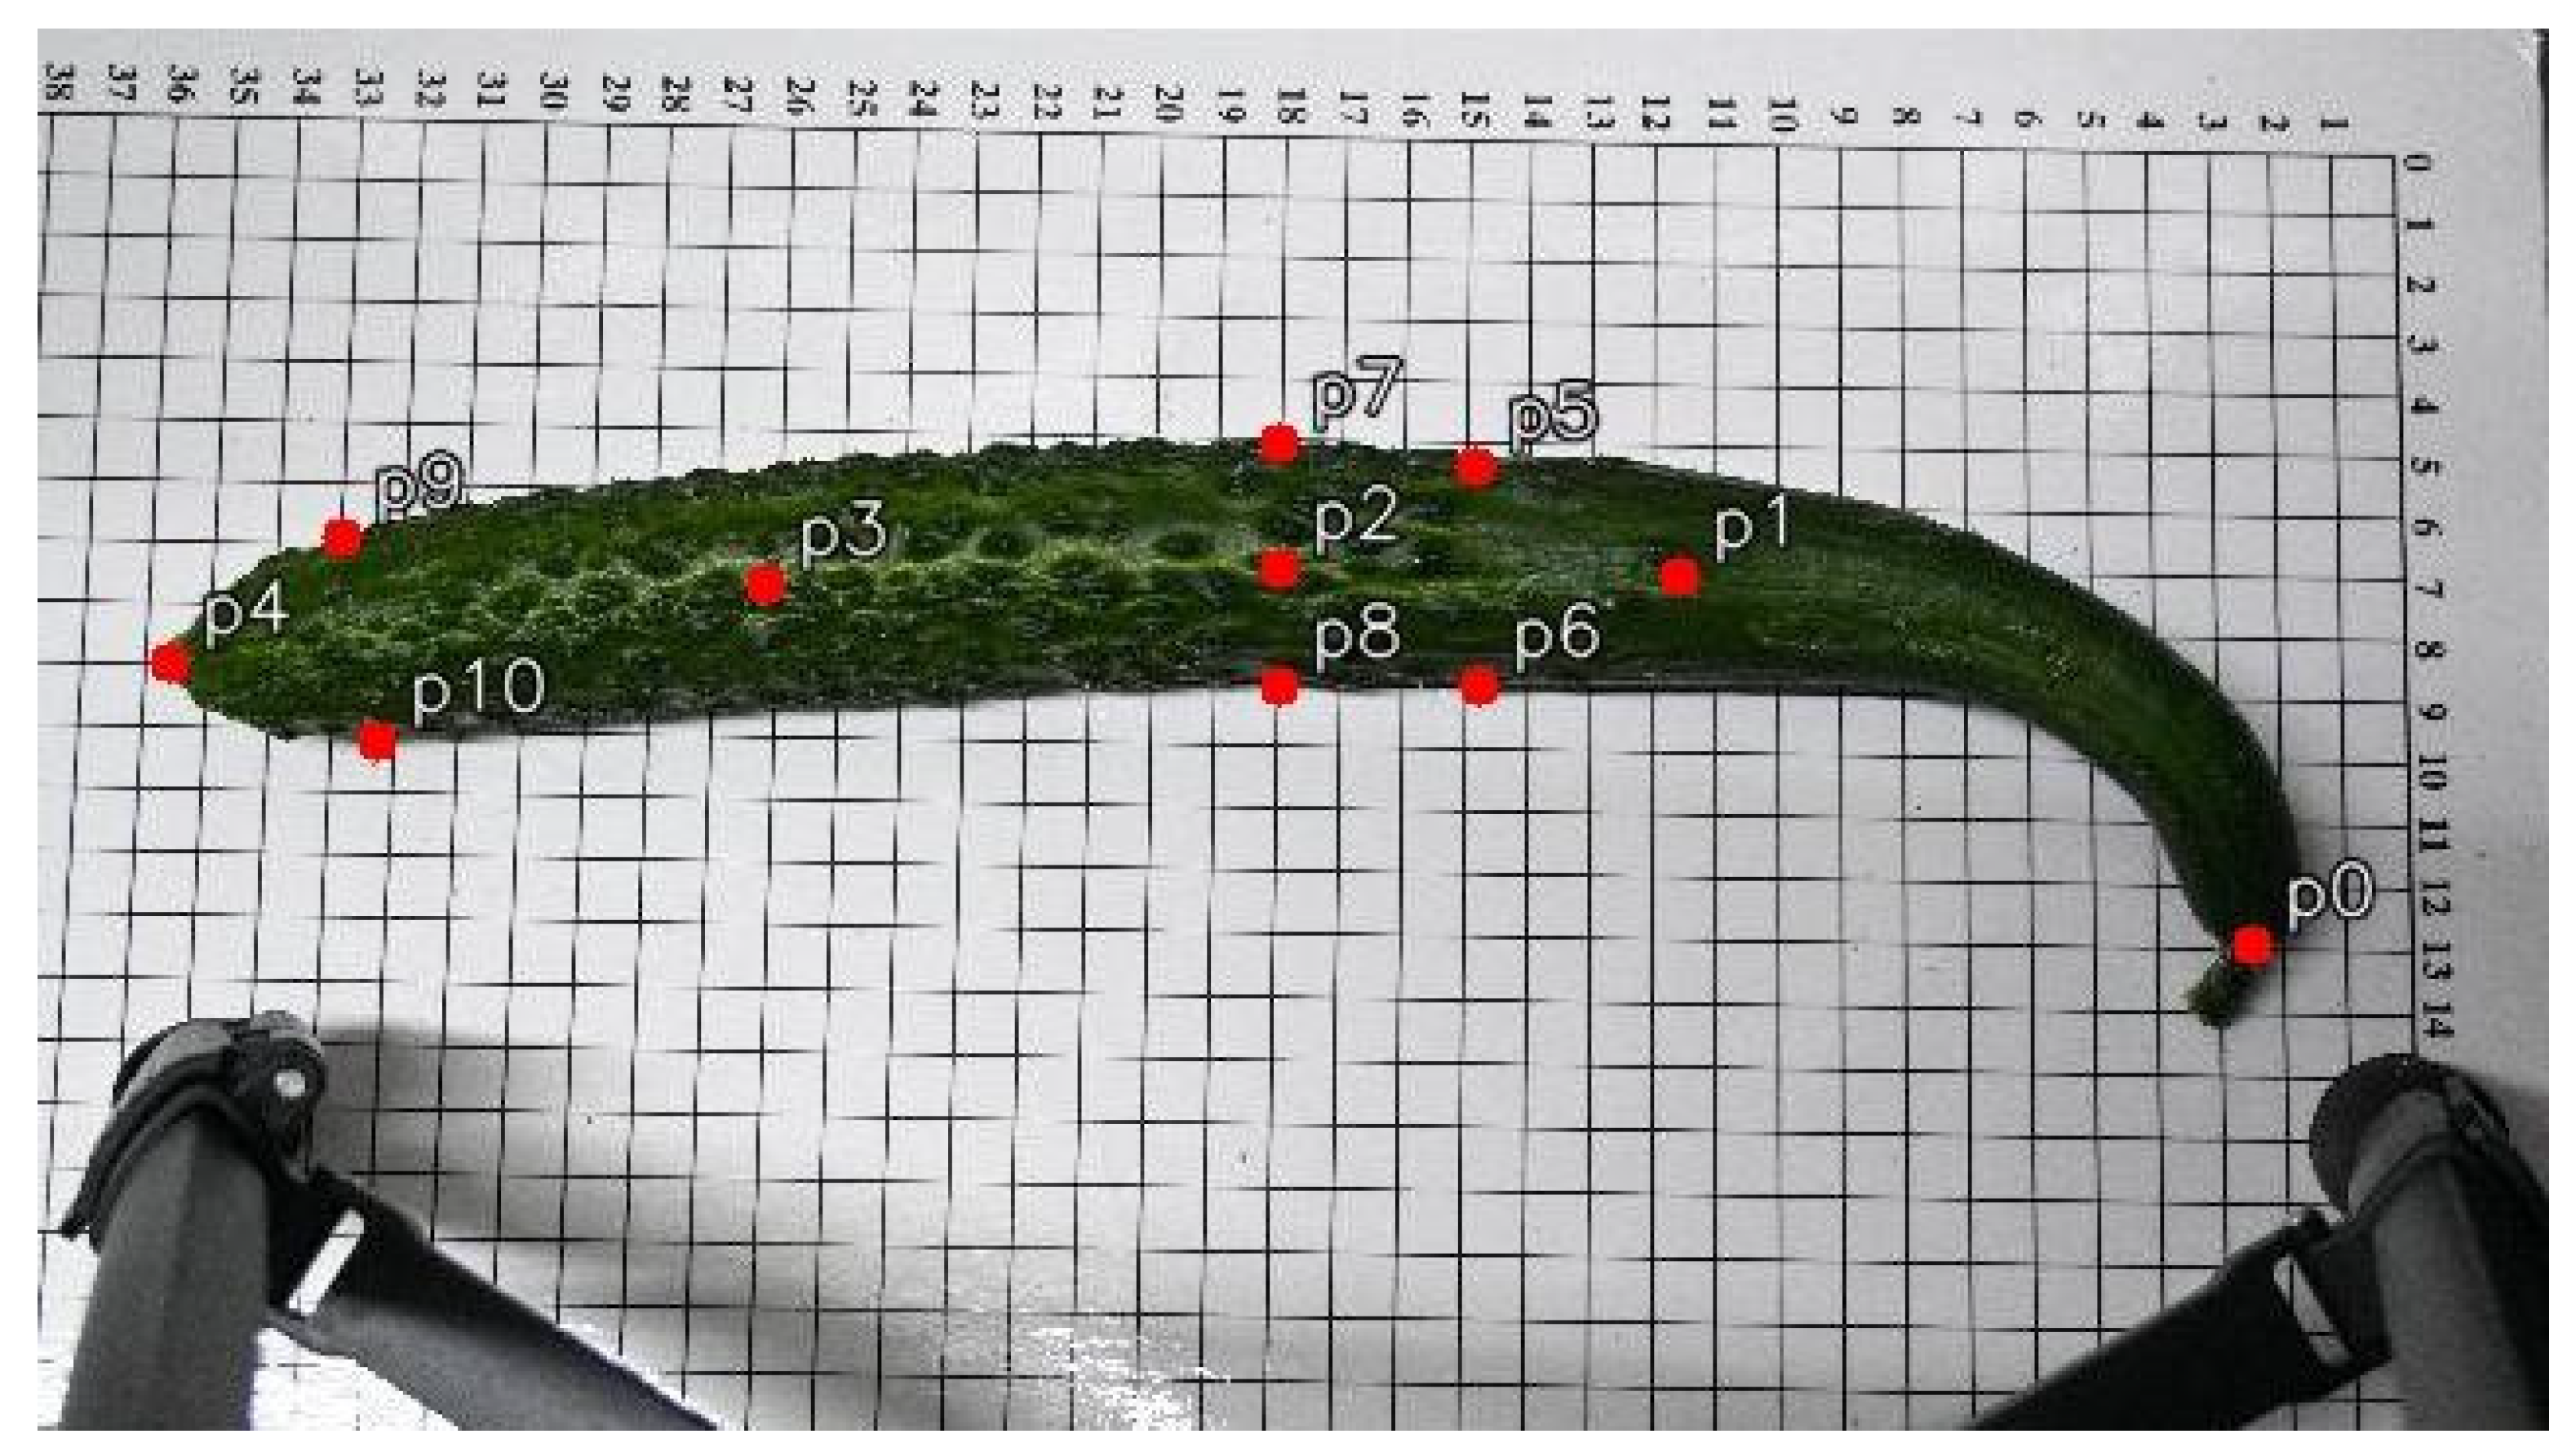
This study employed the Roboflow annotation tool to manually label keypoints on cucumber images, with a total of 11 key landmarks annotated per cucumber. These include the peduncle point, the two endpoints, the central point, cross-sectional diameter points located 3 cm from both the apex and the base, and the central cross-sectional diameter points. An example of the annotation is shown in
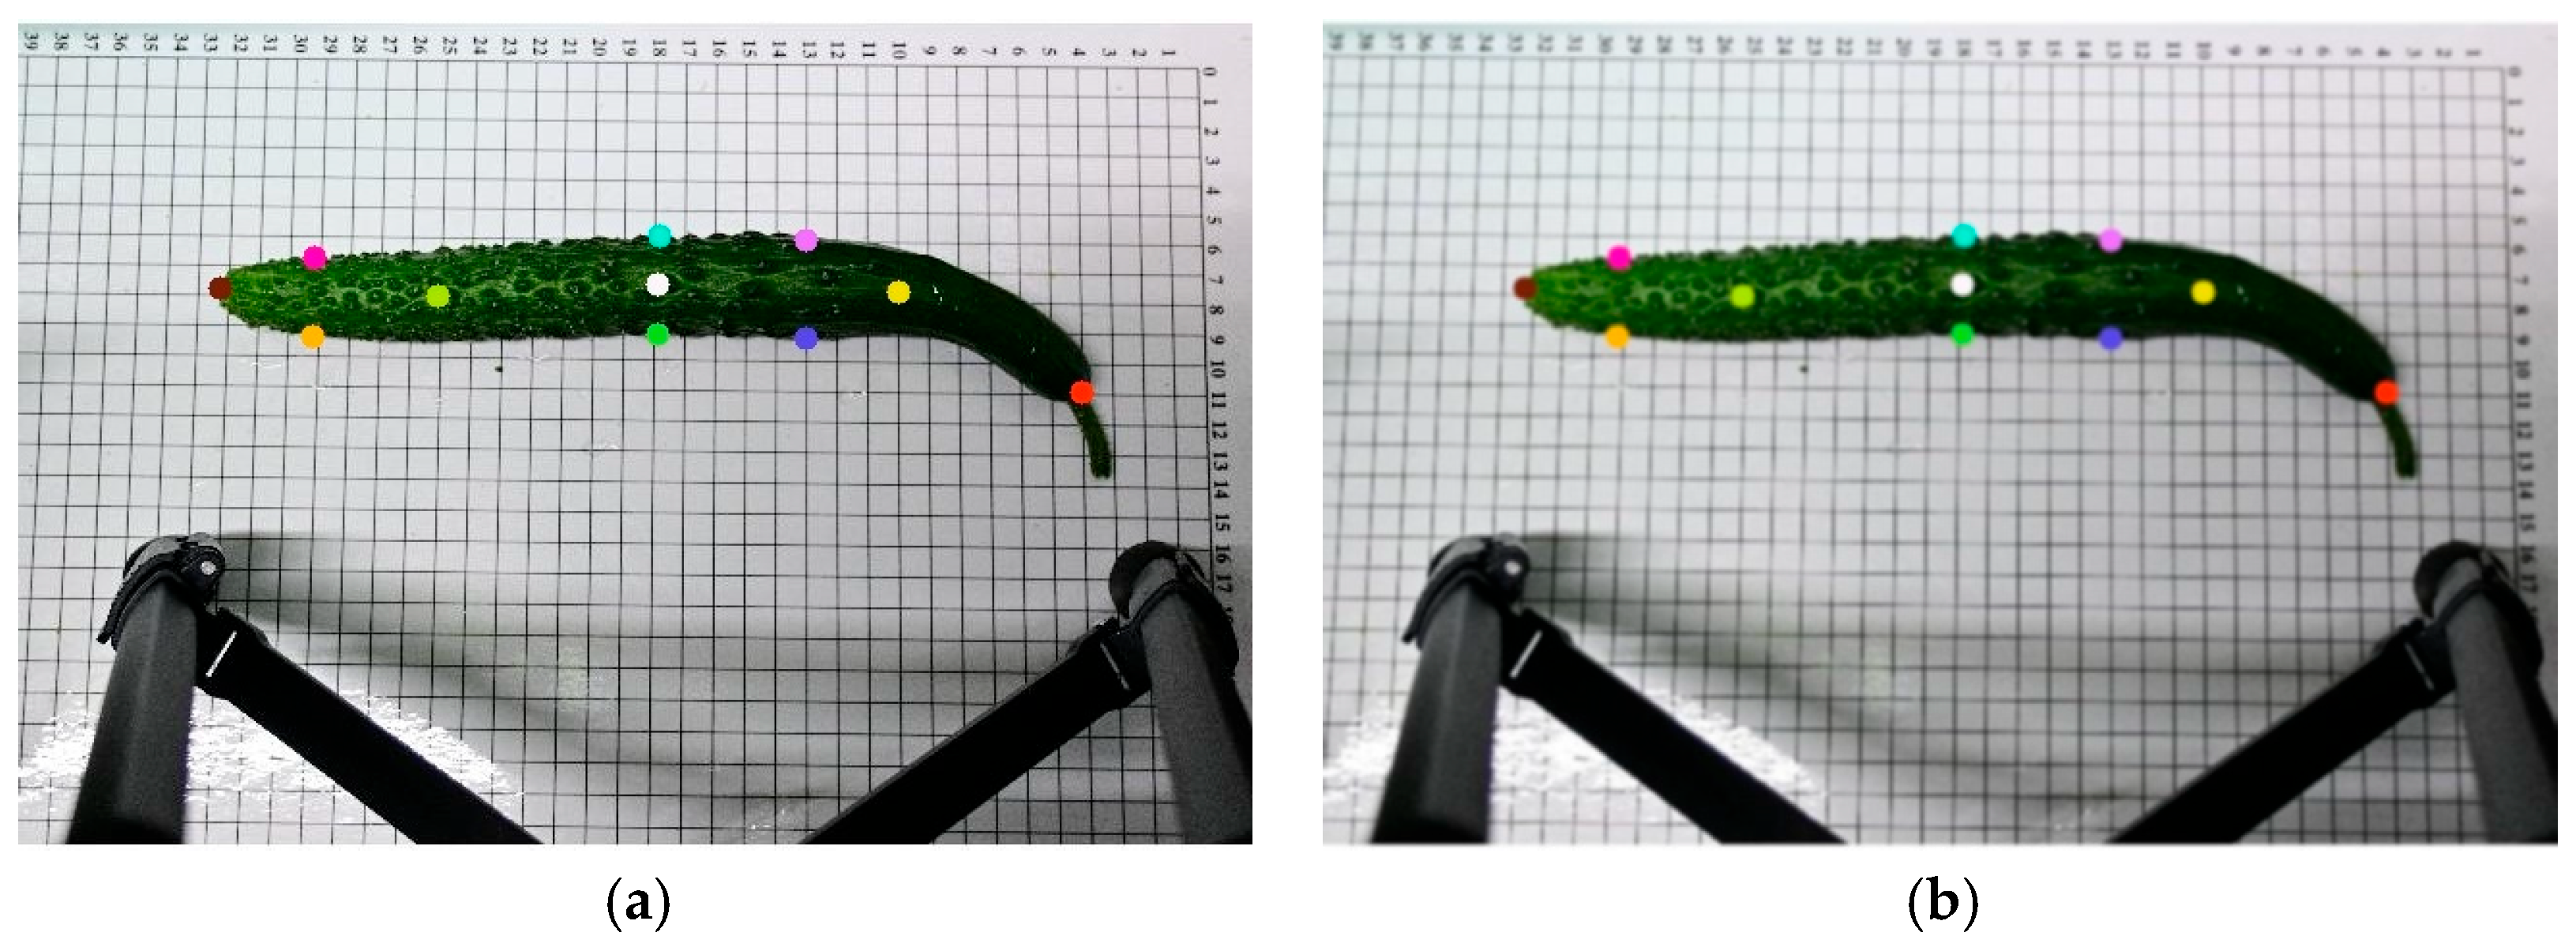
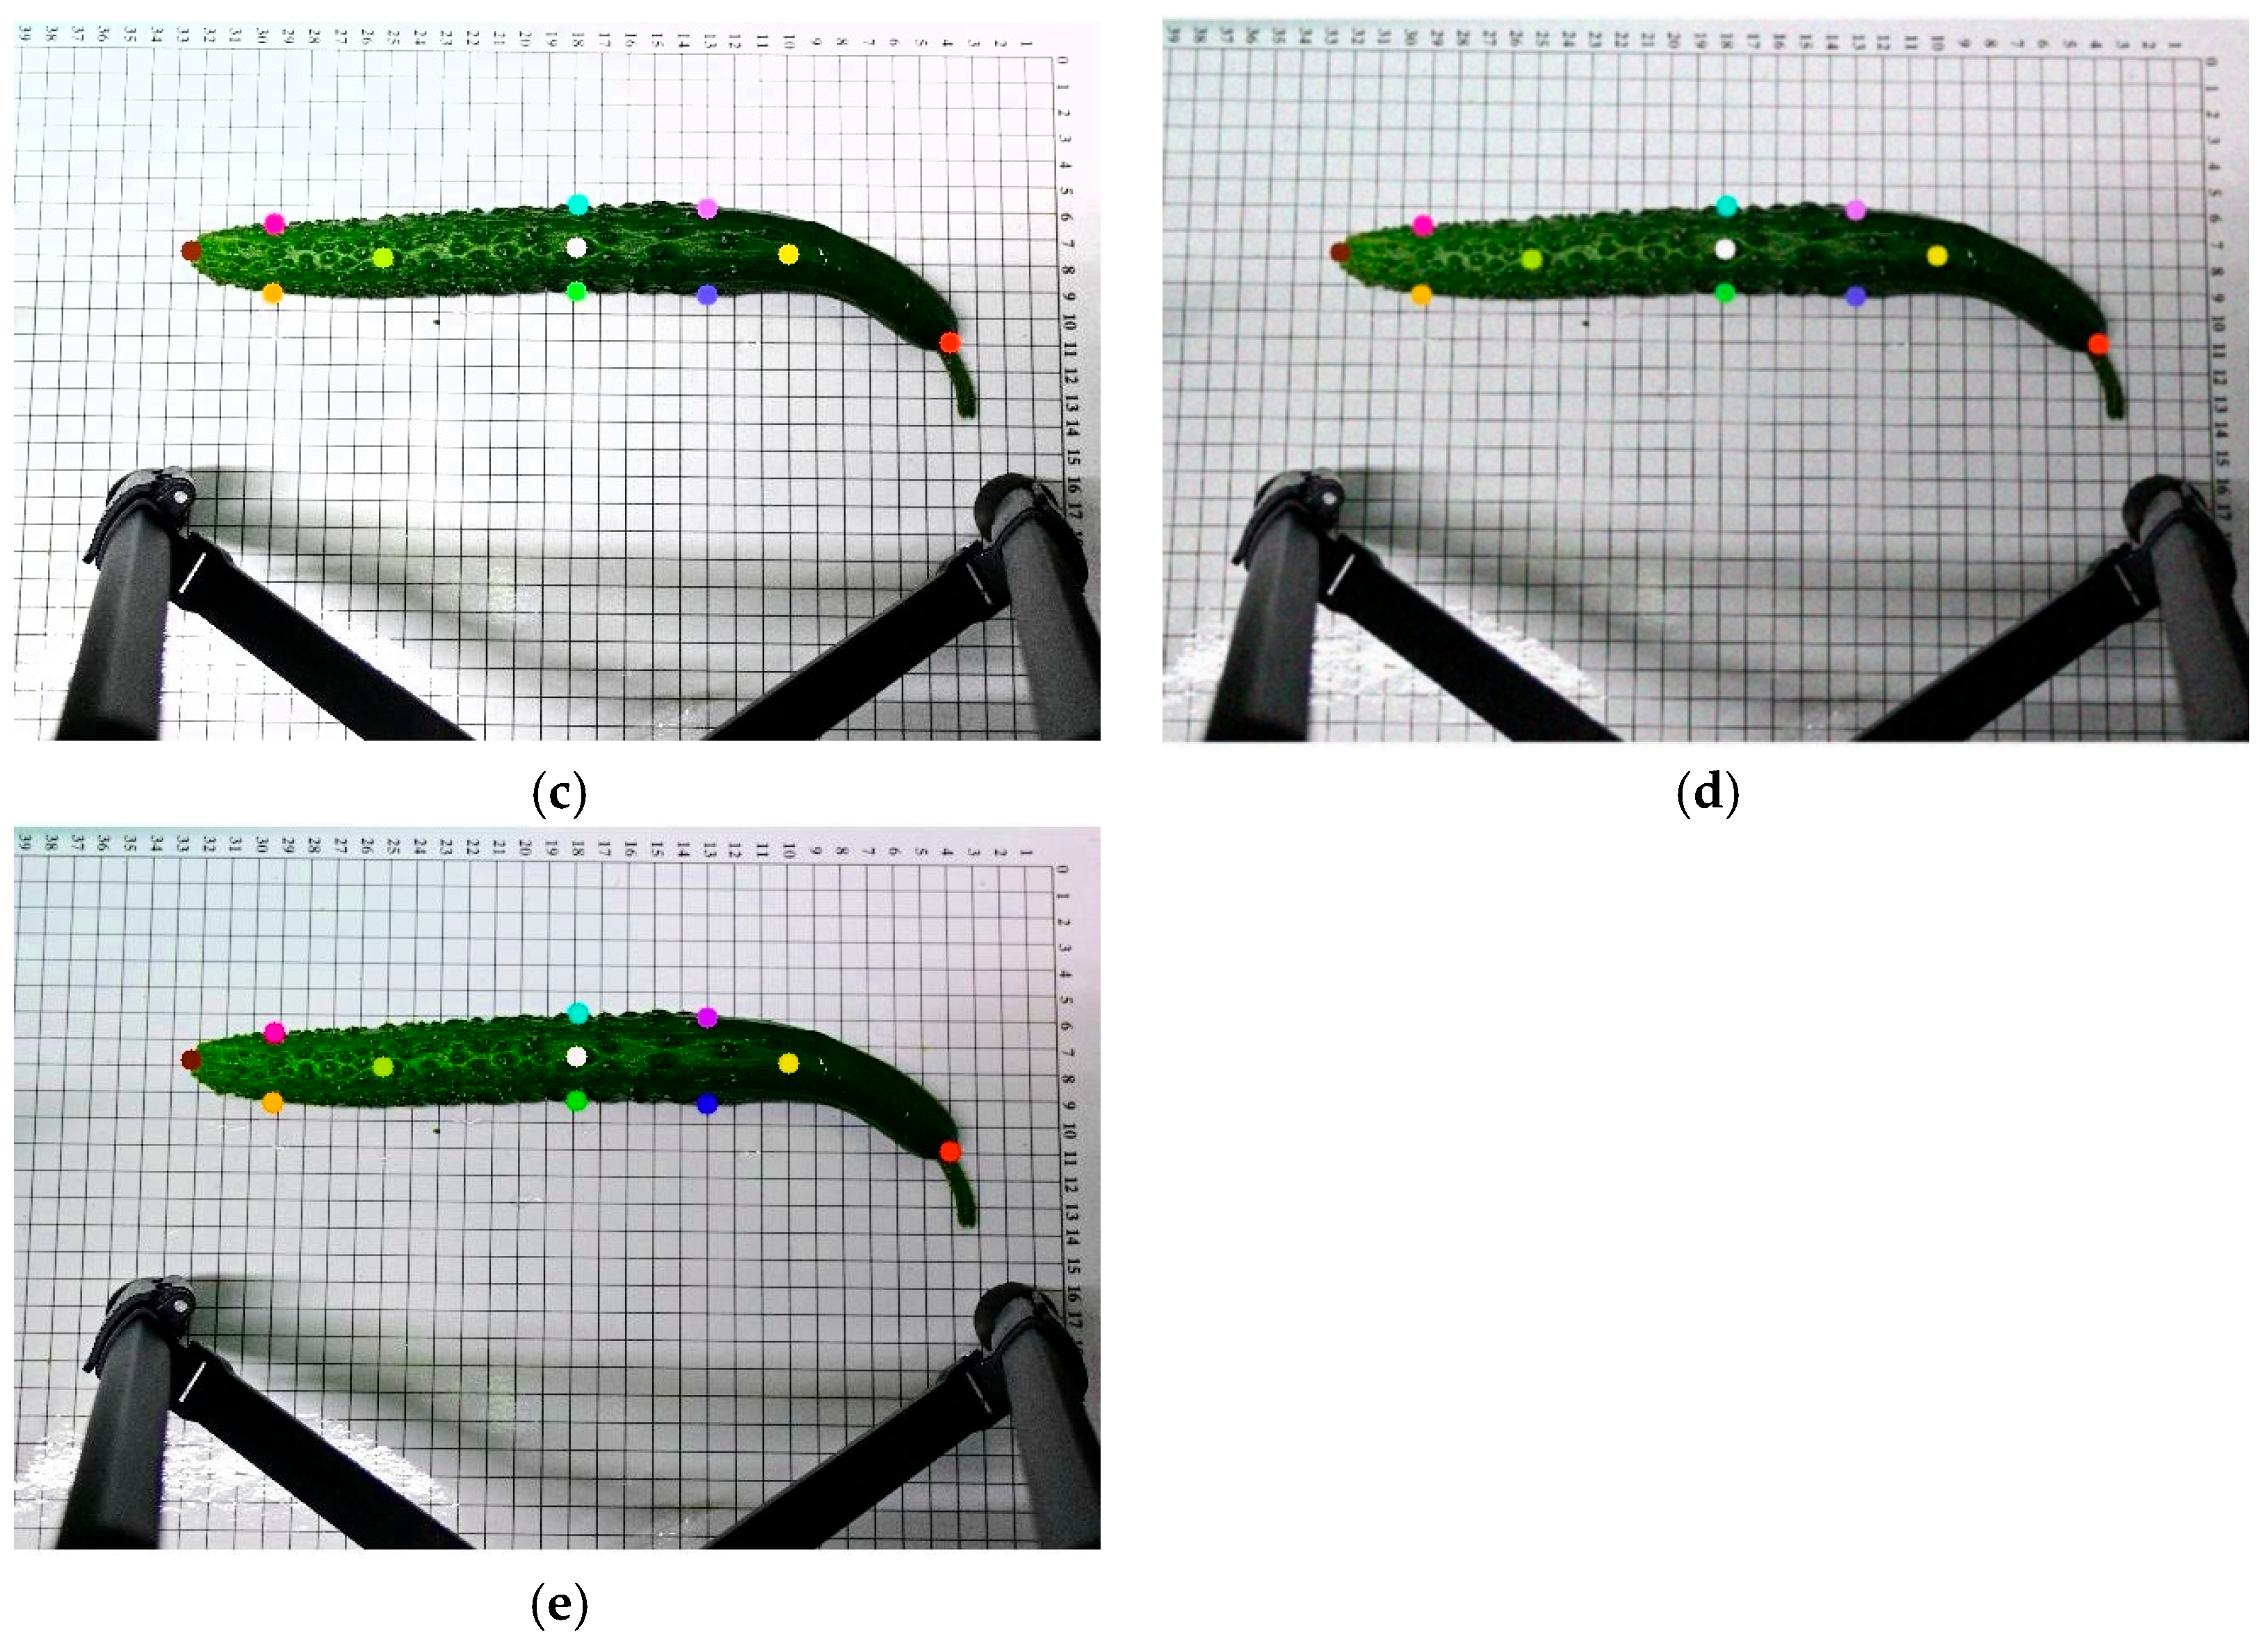
Figure 2. To enhance data diversity and complexity, the dataset was systematically augmented using multiple techniques, including increasing saturation to 1.8 times, enhancing brightness to 1.3 times, applying Gaussian blur with a kernel size of 5 × 5, and adding Gaussian noise with a mean of 0 and a standard deviation of 10, thereby improving the model’s generalization ability and robustness.
Figure 3 illustrates the visual effects of these augmentation operations on the original images. The dataset was divided into training, validation, and test sets in a ratio of 8:1:1. After augmentation, the final dataset consisted of 2270 images, with 1816 used for training and 227 each for validation and testing. Images were randomly selected from the original dataset to form the test set, without any augmentation, to ensure an objective evaluation of the model’s generalization ability.
2.2. Cucumber Phenotypic Parameter Calculation Method
The phenotypic traits of cucumbers primarily include fruit length, the ratio of stem length to fruit length, horizontal diameter difference, and arch height. To automate the extraction of these features, this study utilizes the normalized coordinates of annotated keypoints in the images. By combining image dimensions and a known scale reference, distances in pixel space are converted into actual physical measurements. This conversion process effectively corrects for scale variations caused by differences in image resolution and shooting conditions, ensuring the accuracy and consistency of the measurements. Based on this mapping, the relevant phenotypic parameters are derived and quantified using precise geometric formulas, as detailed below:
In the formula, denotes the cucumber length; represents the two-dimensional coordinates of the -th keypoint on the cucumber’s central axis.
- (2)
Peduncle-to-Fruit Length Ratio
In the formula,denotes the stem length;represents the ratio of stem length to cucumber length.
- (3)
Horizontal Diameter Difference
In the formula,represents the horizontal diameter difference; denotes the horizontal diameter measured 3 cm from the top of the cucumber; denotes the horizontal diameter at the center of the cucumber; and denotes the horizontal diameter measured 3 cm from the bottom of the cucumber.
- (4)
Curvature Height
To overcome the limitations of traditional curvature height measurement methods that rely on complete contour information, this study proposes an indirect characterization approach to approximate the curvature height of cucumbers. Using conventional methods, cucumber samples were collected and their corresponding curvature heights were extracted. These values were then converted into angular ranges formed by keypoints, establishing an interval mapping relationship between the traditional curvature height and the target angle.
The keypoints along the central axis of the cucumber are denoted as
from right to left, where
and
are used to determine the bending direction and calculate the angle. To distinguish the bending direction of the cucumber, the relative vertical positions of
and
are compared: if
, the cucumber bends upward; if
, the cucumber bends downward. Taking
as the vertex, two vectors are constructed, as shown in Equations (5) and (6).
The formula for calculating the angle between two vectors is shown in Equation (7).
Let the curvature height of the cucumber be denoted as . The specific mapping relationship is as follows: cm, cm cm cm cm.
2.3. Model Improvement Based on YOLO11m-Pose
The YOLO11m-Pose model is based on the YOLO architecture and integrates object detection with keypoint estimation techniques, enabling fast inference while maintaining high localization accuracy. As a result, it has been applied in the field of keypoint detection. By utilizing an end-to-end deep neural network structure, the model effectively captures spatial features and keypoint distributions of the target, significantly improving the efficiency of automated acquisition and analysis of phenotypic data. However, cucumber fruits exhibit complex and variable morphological characteristics, with similar appearances among keypoints such as the peduncle, ends, and arch height, making them difficult to distinguish. This increases the challenge for the model in expressing and fusing multi-scale features. Moreover, the backbone network used in YOLO11m-Pose has a relatively large number of parameters and high computational resource demands, which limits its applicability on resource-constrained edge devices or real-time systems. In addition, traditional keypoint localization loss functions lack sufficient sensitivity to positional deviations in keypoints located at edges or regions with morphological variation, resulting in room for improvement in localization accuracy in these critical areas.
Based on the aforementioned issues, this study introduces three improvements to the YOLO11m-Pose model and employs the enhanced YOLO11m-SCFPose model for training and testing. The final architecture of the proposed YOLO11m-SCFPose model is shown in
Figure 4.
- (1)
A lightweight backbone network, StarNet-S1, is adopted to replace the original backbone, significantly reducing computational complexity and improving operational efficiency.
- (2)
To enhance the model’s capability in representing and fusing multi-scale features, the efficient C3K2_PartialConv module is introduced into the neck network. This module strengthens feature interaction and fusion across scales while maintaining computational efficiency, thereby optimizing the overall detection performance.
- (3)
The Focaler-IoU loss function is employed to replace the traditional loss function, improving the model’s sensitivity to keypoint positional deviations. This enhancement leads to better overall keypoint localization accuracy and greater robustness, particularly in edge regions.
2.3.1. StarNet-S1 Backbone Network
To further enhance the deployment efficiency and inference capability of the model on edge devices, the original backbone network in the YOLO11m model was replaced with the lightweight StarNet-S1 backbone. The StarNet series [
31,
32], designed specifically for efficient visual perception tasks, represents a class of lightweight convolutional neural networks that significantly reduce the number of parameters and computational complexity while maintaining high detection accuracy.
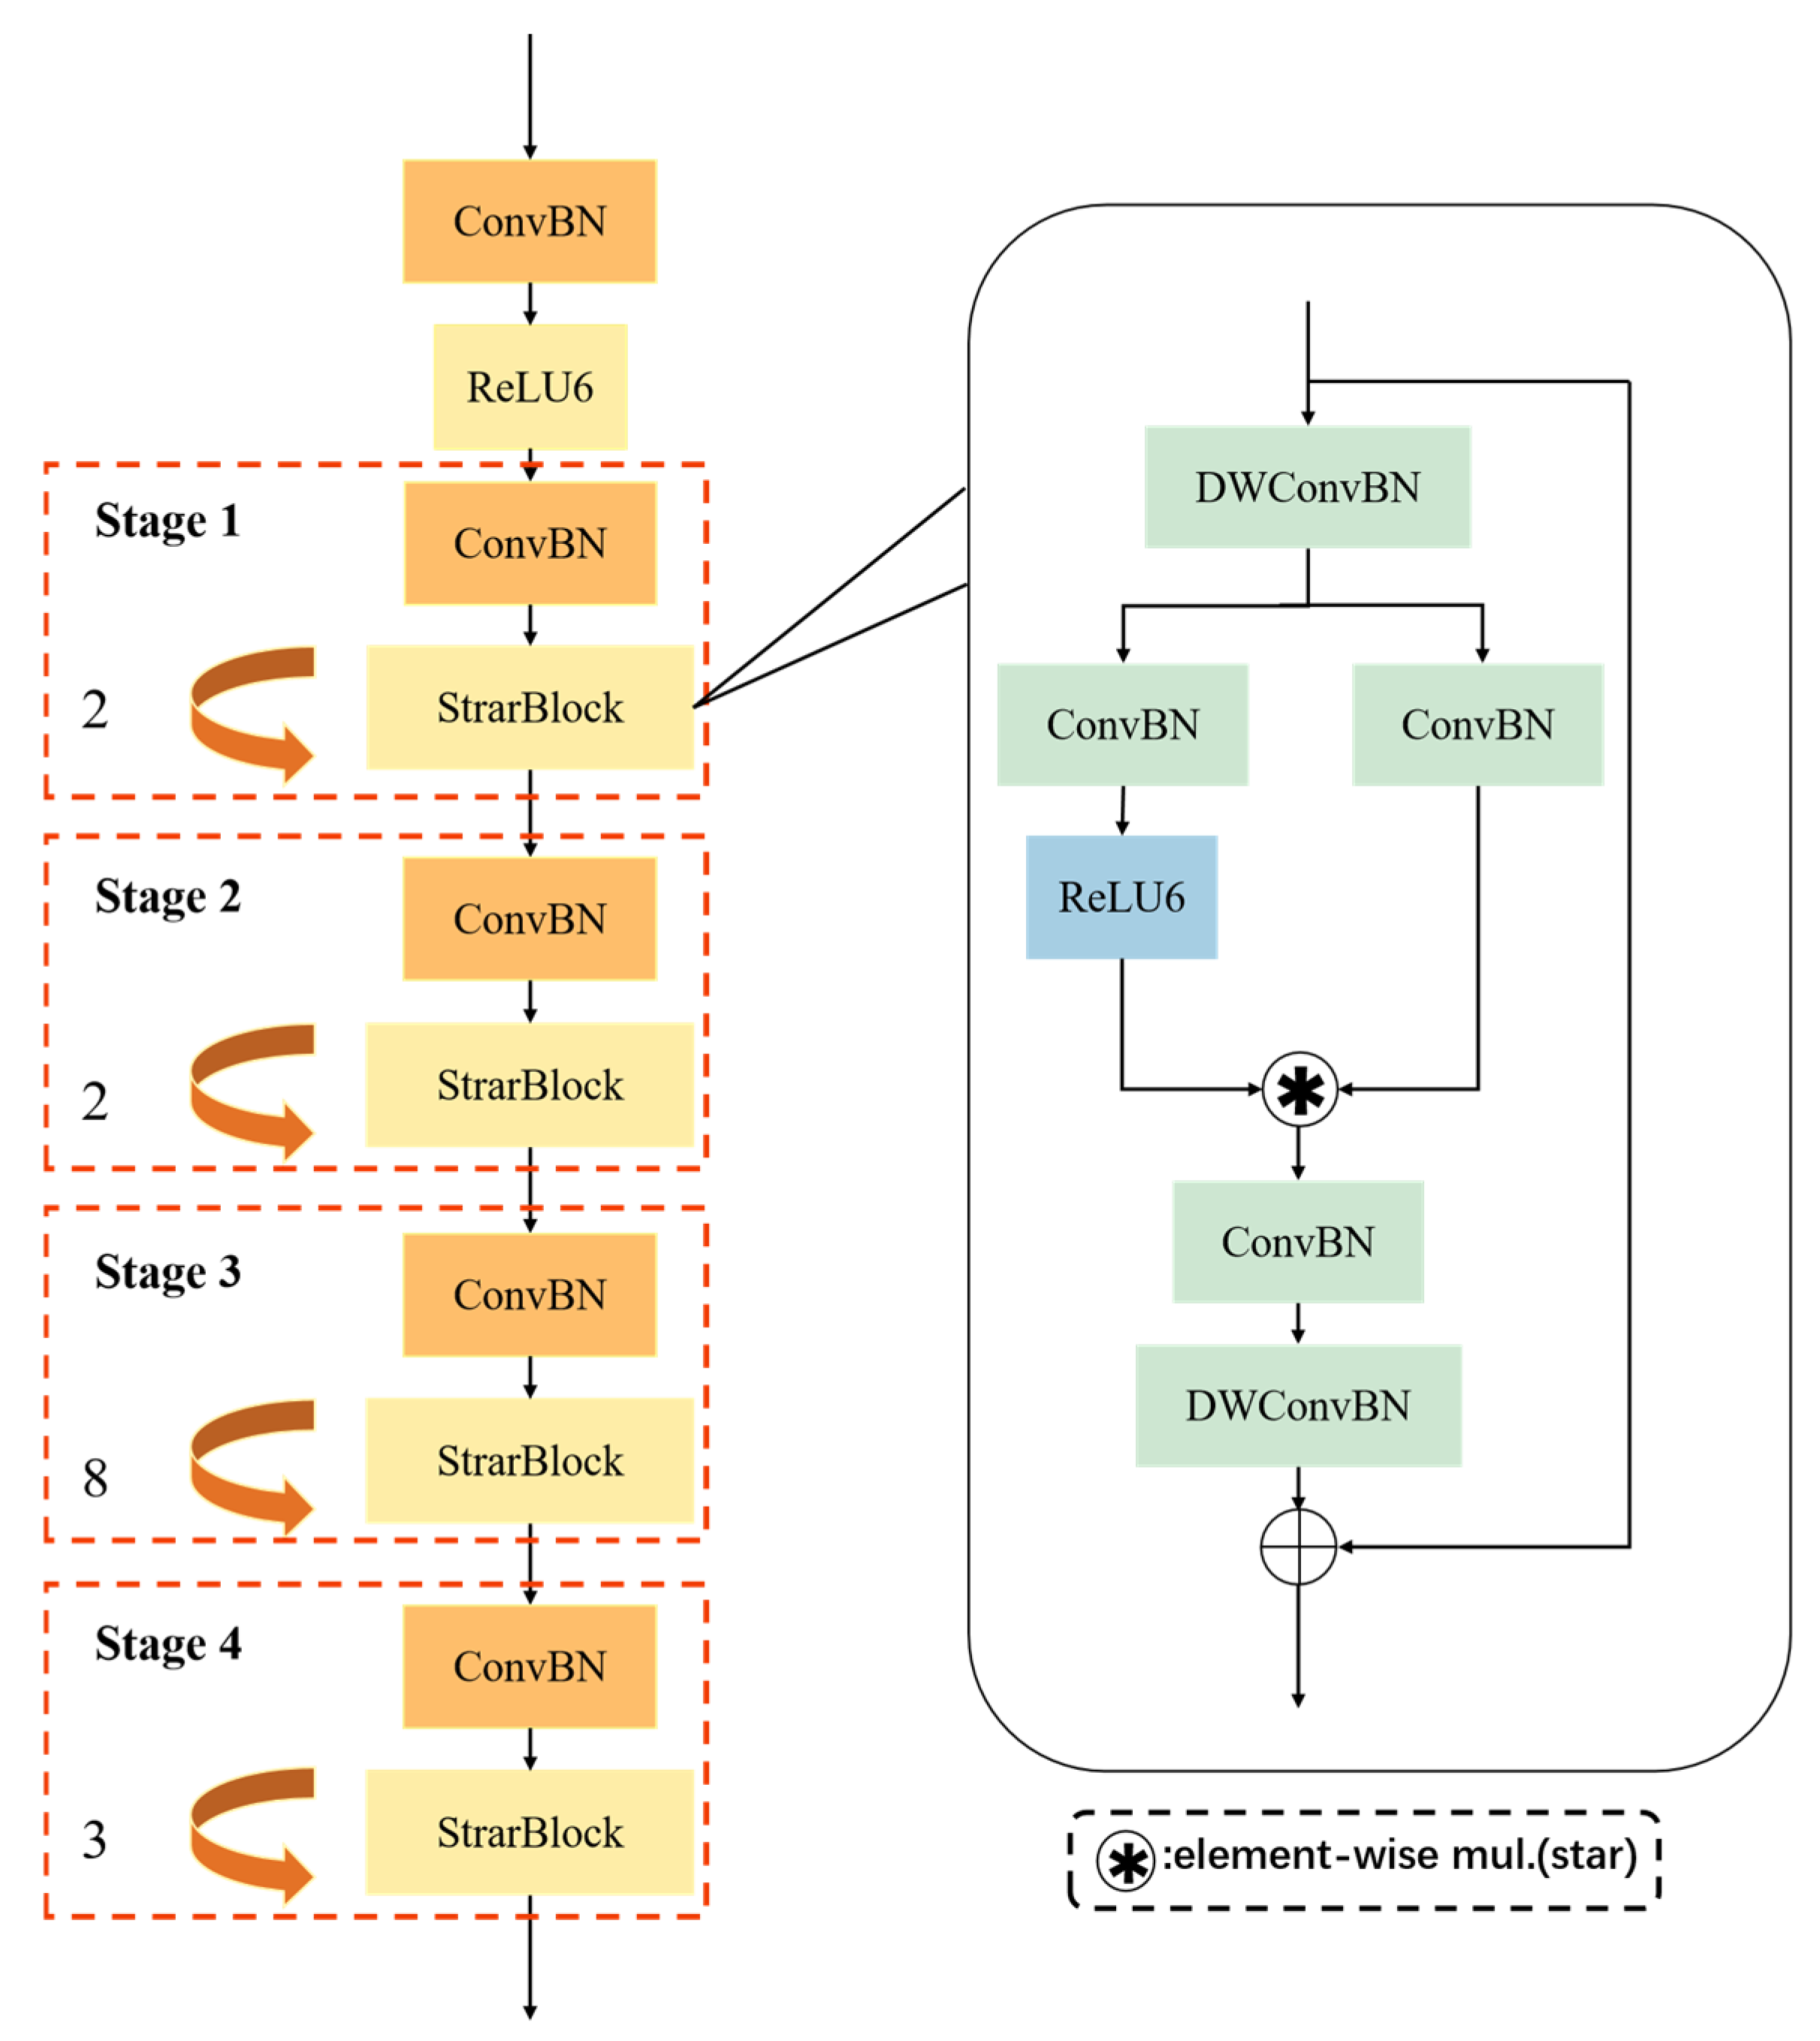
The architecture of StarNet-S1 consists of four hierarchically structured feature extraction stages (Stage1–Stage4), which include 2, 2, 8, and 3 deep residual blocks, respectively, forming a pyramidal structure. Each stage comprises a combination of downsampling modules and lightweight residual units, enabling progressive extraction of multi-level feature information from shallow to deep layers. StarNet-S1 incorporates depth-wise separable convolutions and point-wise convolutions in its modular design, decoupling the spatial and channel dimensions of traditional convolutions. This significantly reduces redundant computations. The architecture maintains a sufficient receptive field and strong feature representation capability while reducing the overall number of parameters, thereby improving runtime efficiency on edge devices. Additionally, the network integrates a multi-branch nonlinear activation mechanism. In this design, a portion of the channels undergo computationally expensive activation operations, while the remaining channels utilize more lightweight operations. This balances the model’s nonlinear expressiveness with reduced computational complexity.
To enhance training stability and generalization capability, StarNet-S1 incorporates the DropPath strategy [
33] during the training phase. The core idea of DropPath is to randomly drop certain residual connection paths during each forward pass, thereby reducing inter-layer dependencies and strengthening the model’s regularization. The architecture of the StarNet-S1 backbone network is illustrated in
Figure 5.
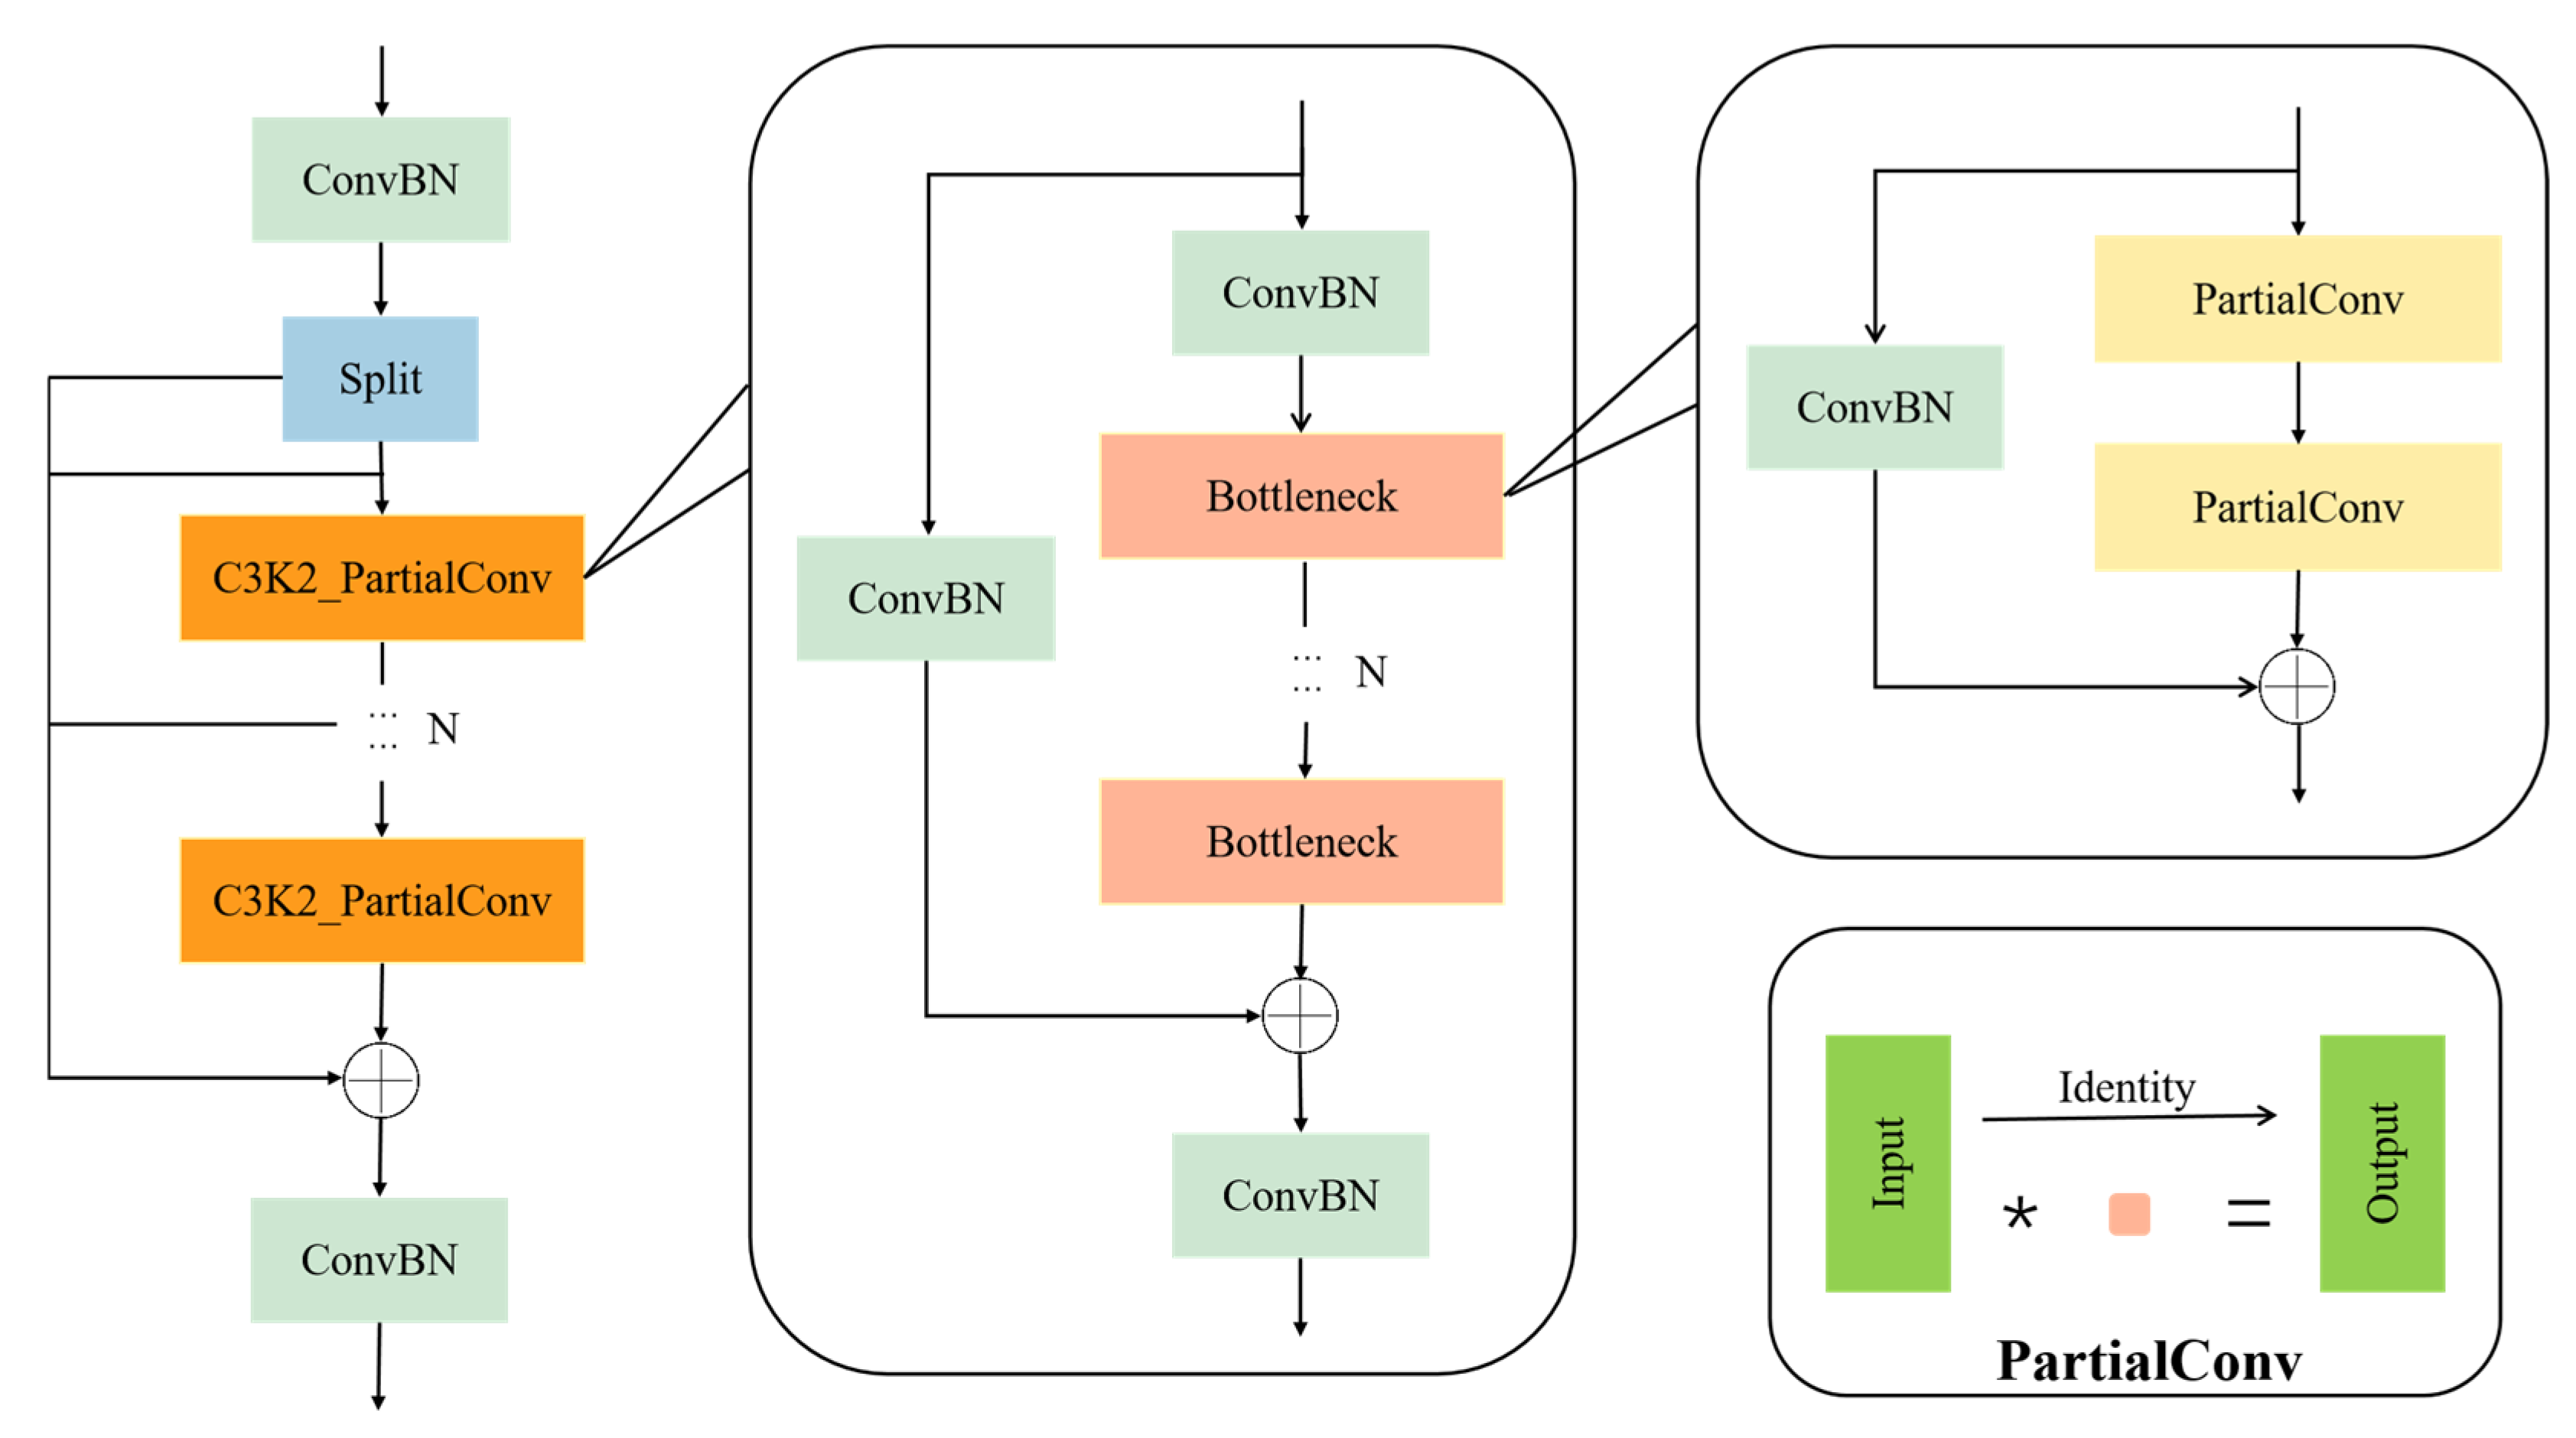
2.3.2. C3K2_PartialConv Module
This study optimizes the structure of the C3K2 module in the neck network. The C3K2 module originates from the widely used C3 structure in the YOLO series networks. Its core consists of multiple residual-connected Bottleneck units, which effectively enhance the model’s nonlinear modeling capability and semantic representation through cross-layer connections and feature reuse mechanisms. Compared to the standard C3 module, C3K2 deepens the convolutional path structurally, thereby further strengthening the ability to capture and fuse key features within local regions.
However, the C3K2 module still heavily relies on standard convolution operations involving all channels. Such convolutions perform joint computations across spatial and channel dimensions, which significantly increase the model’s parameter count and computational complexity, especially in scenarios involving high-resolution image processing and multi-scale feature extraction. This high computational complexity severely limits the model’s real-time deployment capability on edge computing devices, making it difficult to meet the practical requirements for low latency and low power consumption.
To address this, the present study proposes the C3K2_PartialConv module, which replaces the standard convolutions in the original module with Partial Convolution (PConv) [
34], reducing computational costs while maintaining strong feature representation capability. The architecture of the C3K2_PartialConv module is shown in
Figure 6. PConv is a lightweight convolution strategy that performs convolution operations on only a subset of channels, while the remaining channels retain the input features directly, thereby reducing redundant convolution computations and improving computational efficiency. In the improved structure, the convolution channels are divided into two parts: one part is used to extract new feature representations, while the other part preserves the original information through skip connections and merges it at the output stage. This design not only significantly reduces the model’s floating-point operations and parameter size but also alleviates information loss and gradient vanishing issues during deep feature learning, enhancing the network’s stability and generalization performance in edge environments.
Let the spatial size of the input feature map be
, the convolution kernel size be
, nd the total number of channels be
, where the number of channels involved in the convolution operation is
. The computational cost of PConv is shown in Equation (8).
The computational cost of standard convolution is shown in Equation (9).
when
, the computational complexity of PConv can be reduced to one-quarter of that of standard convolution. By introducing PConv into the C3K2 module, the model’s computational complexity and parameter count are effectively reduced. Activating only a portion of the channels ensures that the information flow in key feature channels is not weakened, thereby minimizing the loss of feature information.
2.3.3. Optimization of Network Training Loss Function
Focaler-IoU [
35] is a localization loss function improved based on the IoU loss, which combines a dynamic sample focusing mechanism with a gradient weight adjustment strategy to achieve adaptive weighting of different samples. This method reconstructs the loss response within a linear interval and establishes a mapping relationship between prediction error and gradient weight, effectively enhancing the model’s attention to samples that are difficult to localize accurately. In this study, Focaler-IoU is applied to the keypoint detection task to strengthen the model’s representation and learning ability for keypoint samples with large localization errors, thereby improving the accuracy and robustness of keypoint localization. The formula of the Focaler-IoU loss function is shown in Equation (10).
In Focaler-IoU, a hard-thresholding function based on the IoU value is introduced to assign weights to predicted boxes in a piecewise manner according to their quality. The core idea of this function is to divide the predicted boxes into three intervals based on their IoU with the ground truth and assign different training weights accordingly. When the IoU is below the lower threshold
, the predicted box is regarded as a low-quality sample, and its weight is set to zero to avoid interfering with the optimization process. Within the intermediate interval
, a linear transition is applied to smoothly adjust the weight, enhancing the model’s focus on hard-to-localize samples and increasing their contribution during gradient computation. When the IoU exceeds the upper threshold
, the prediction is considered sufficiently accurate, and the weight is fixed at 1 to prevent high-quality samples from dominating the training and causing overfitting. The loss is defined as shown in Equation (11).
2.4. Evaluation Metrics
In performance evaluation, the model uses the Object Keypoint Similarity (OKS) metric to assess the accuracy of cucumber fruit phenotypic keypoint detection. This metric measures the positional similarity between predicted keypoints and ground-truth keypoints by calculating their Euclidean distance. The OKS calculation formula is shown in Equation (12).
In the formula, denotes the -th keypoint of the-th object; represents the Euclidean distance between the predicted and ground-truth keypoints; is the visibility indicator of a keypoint, where 1 indicates that the keypoint is visible and annotated; denotes the square root of the area of the object’s bounding box; and represents the standard deviation for the -th keypoint, and this study adopts the official values set by the COCO dataset.
The evaluation metrics of the model include Precision (P), Recall (R), F1 score, and mean Average Precision (mAP), which serve as the primary indicators for assessing cucumber phenotypic recognition performance. Precision refers to the proportion of correctly predicted positive keypoints among all keypoints predicted as positive, reflecting the accuracy of the predictions; Recall denotes the proportion of correctly predicted positive keypoints out of all actual positive keypoints, indicating the model’s ability to capture relevant instances; and the F1 score is the harmonic mean of precision and recall, providing a balanced measure of both accuracy and completeness. In addition, floating point operations (GFLOPs) are used to measure the inference speed, while the number of parameters (Parameters) is used to evaluate the model’s scale and complexity, serving as an indicator of its lightweight design. The formulas for computing Precision, Recall, and F1 score are provided in Equations (13)–(15).
In the equations, TP denotes the number of positive samples correctly predicted as positive; FP denotes the number of negative samples incorrectly predicted as positive; and FN denotes the number of positive samples incorrectly predicted as negative.
In this study, the evaluation method of keypoint accuracy and recall is not based on the traditional object detection statistics of TP, FP, and FN determined by the intersection over union (IoU) of bounding boxes, but instead adopts the object keypoint similarity to measure the matching degree between the model-predicted keypoints and the ground truth keypoints. By calculating the numbers of TP and FP under different object keypoint similarity thresholds (0.50, 0.95), the corresponding average precision mAP50 and multi-threshold average precision mAP50-95 are obtained, comprehensively quantifying the performance of the keypoint detection algorithm. The calculation formulas of mAP50 and mAP50-95 are shown in formulas (16) and (17).
To comprehensively assess the accuracy and stability of the proposed key-point regression model for cucumber fruit phenotypic trait prediction, three commonly used statistical error metrics are adopted, Mean Absolute Error (MAE), Root Mean Square Error (RMSE), and Standard Deviation (SD), to quantify the deviation between the model’s predictions and the true values. Mean Absolute Error is a statistical measure representing the arithmetic mean of absolute prediction errors, reflecting the average discrepancy between predicted and actual observations. Root Mean Square Error is the square root of the mean of squared prediction errors, placing higher emphasis on larger errors. Standard Deviation is a standard statistical metric describing the dispersion of a random variable or error distribution, representing the average deviation of all data points from their mean. MAE, RMSE, and SD are computed according to Equations (18)–(20).
denotes the
-th observed value;
represents the corresponding predicted value; and
is the total number of samples.
denotes the ground truth value; an
represents the predicted value; and
is the total number of samples.
denotes the
i-th value in the sample;
represents the sample mean; and
is the total number of samples.
2.5. Experimental Platform and Parameter Settings
The model was trained for 350 epochs with a batch size of 16, an initial learning rate of 0.01, and an initial momentum of 0.937.
Table 1 presents the experimental environment and configuration used in this study. PyTorch 2.4.0 was employed as the deep-learning framework, combined with Python 3.12.4 for image preprocessing, model construction, and training. The training process leveraged CUDA 12.1.1 for GPU acceleration to improve computational efficiency. The operating environment was based on the Ubuntu system, and the hardware setup included an Intel Xeon E5-2680 processor and an NVIDIA GeForce RTX 3090 Ti graphics card, ensuring stability and high performance during large-scale image data training and inference.
4. Discussion
In cucumber variety breeding and fruit commodity quality evaluation, morphological parameters such as fruit length, peduncle-to-fruit length ratio, transverse diameter difference, and arch height are key phenotypic indicators. These parameters not only affect the external quality of the fruit but are also closely related to market acceptance, transportation adaptability, and management decisions during cultivation. Traditional measurement methods primarily rely on manual operations, such as grid methods or ruler measurements. Although these methods are simple to perform, they are inefficient for large-scale planting or breeding trials and are prone to significant subjective errors. This is especially true when fruit morphology is irregular or exhibits considerable curvature, resulting in poor consistency and reliability of measurements, which in turn affects the scientific basis of breeding strategies and cultivation management.
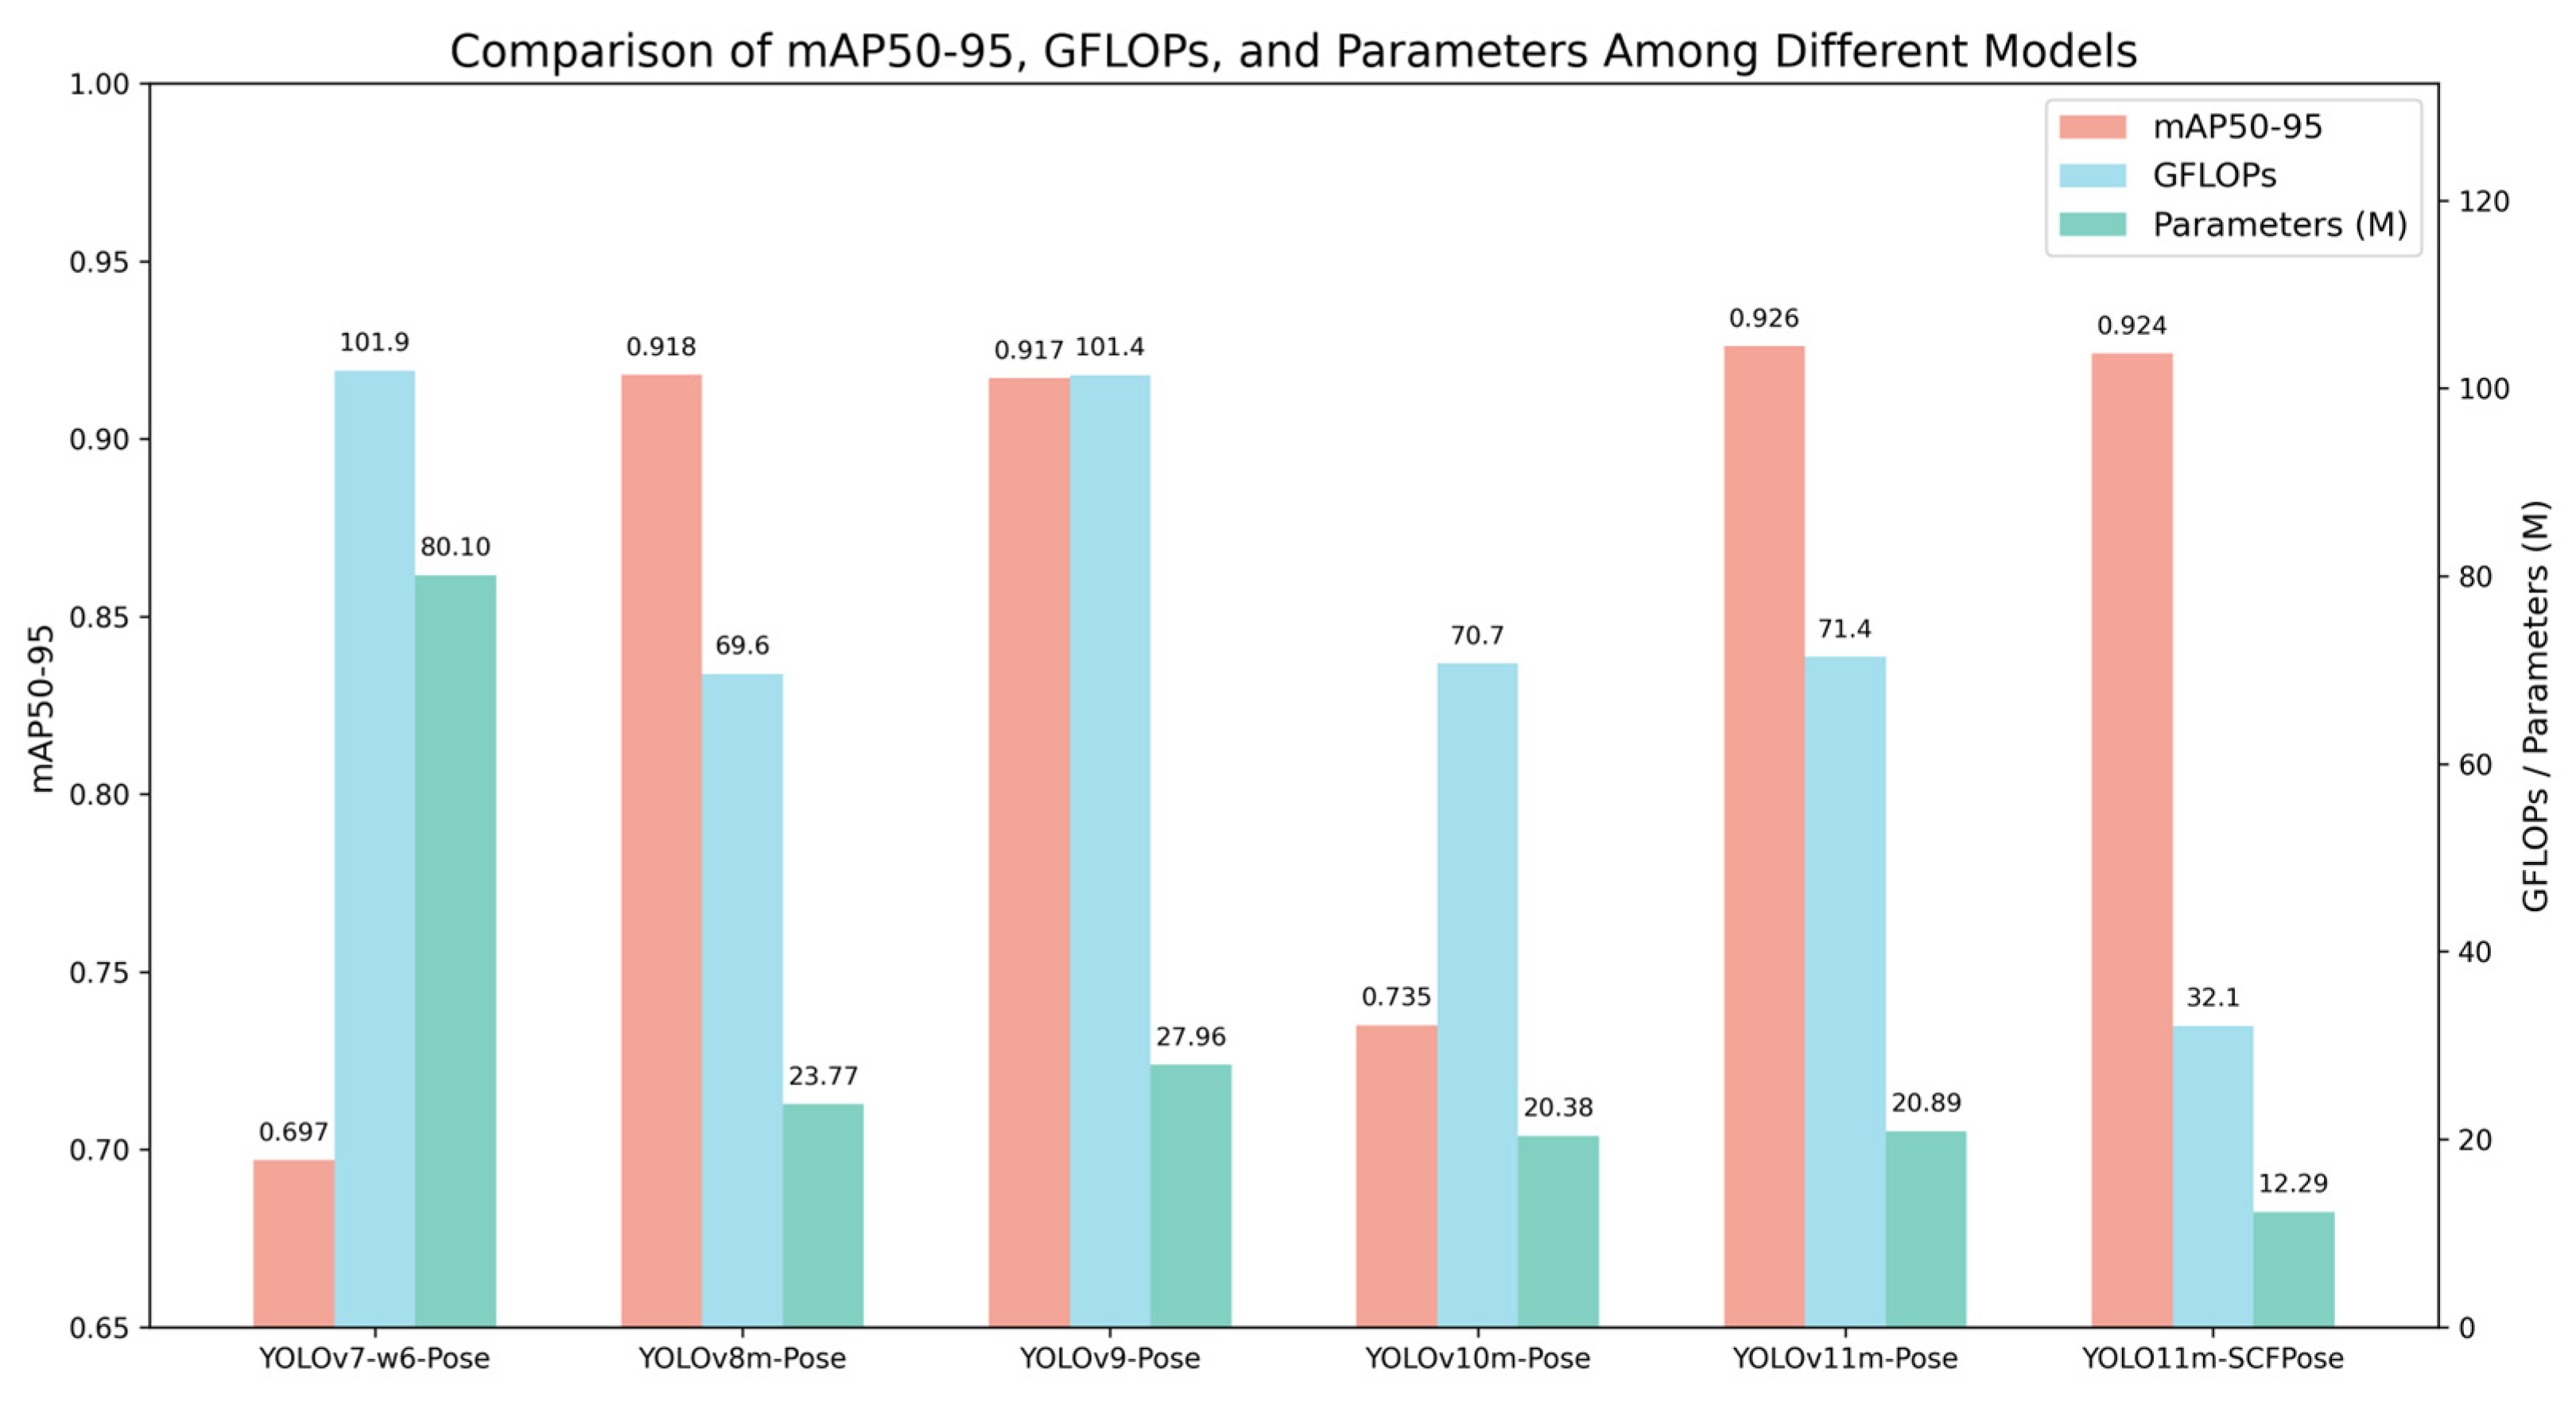
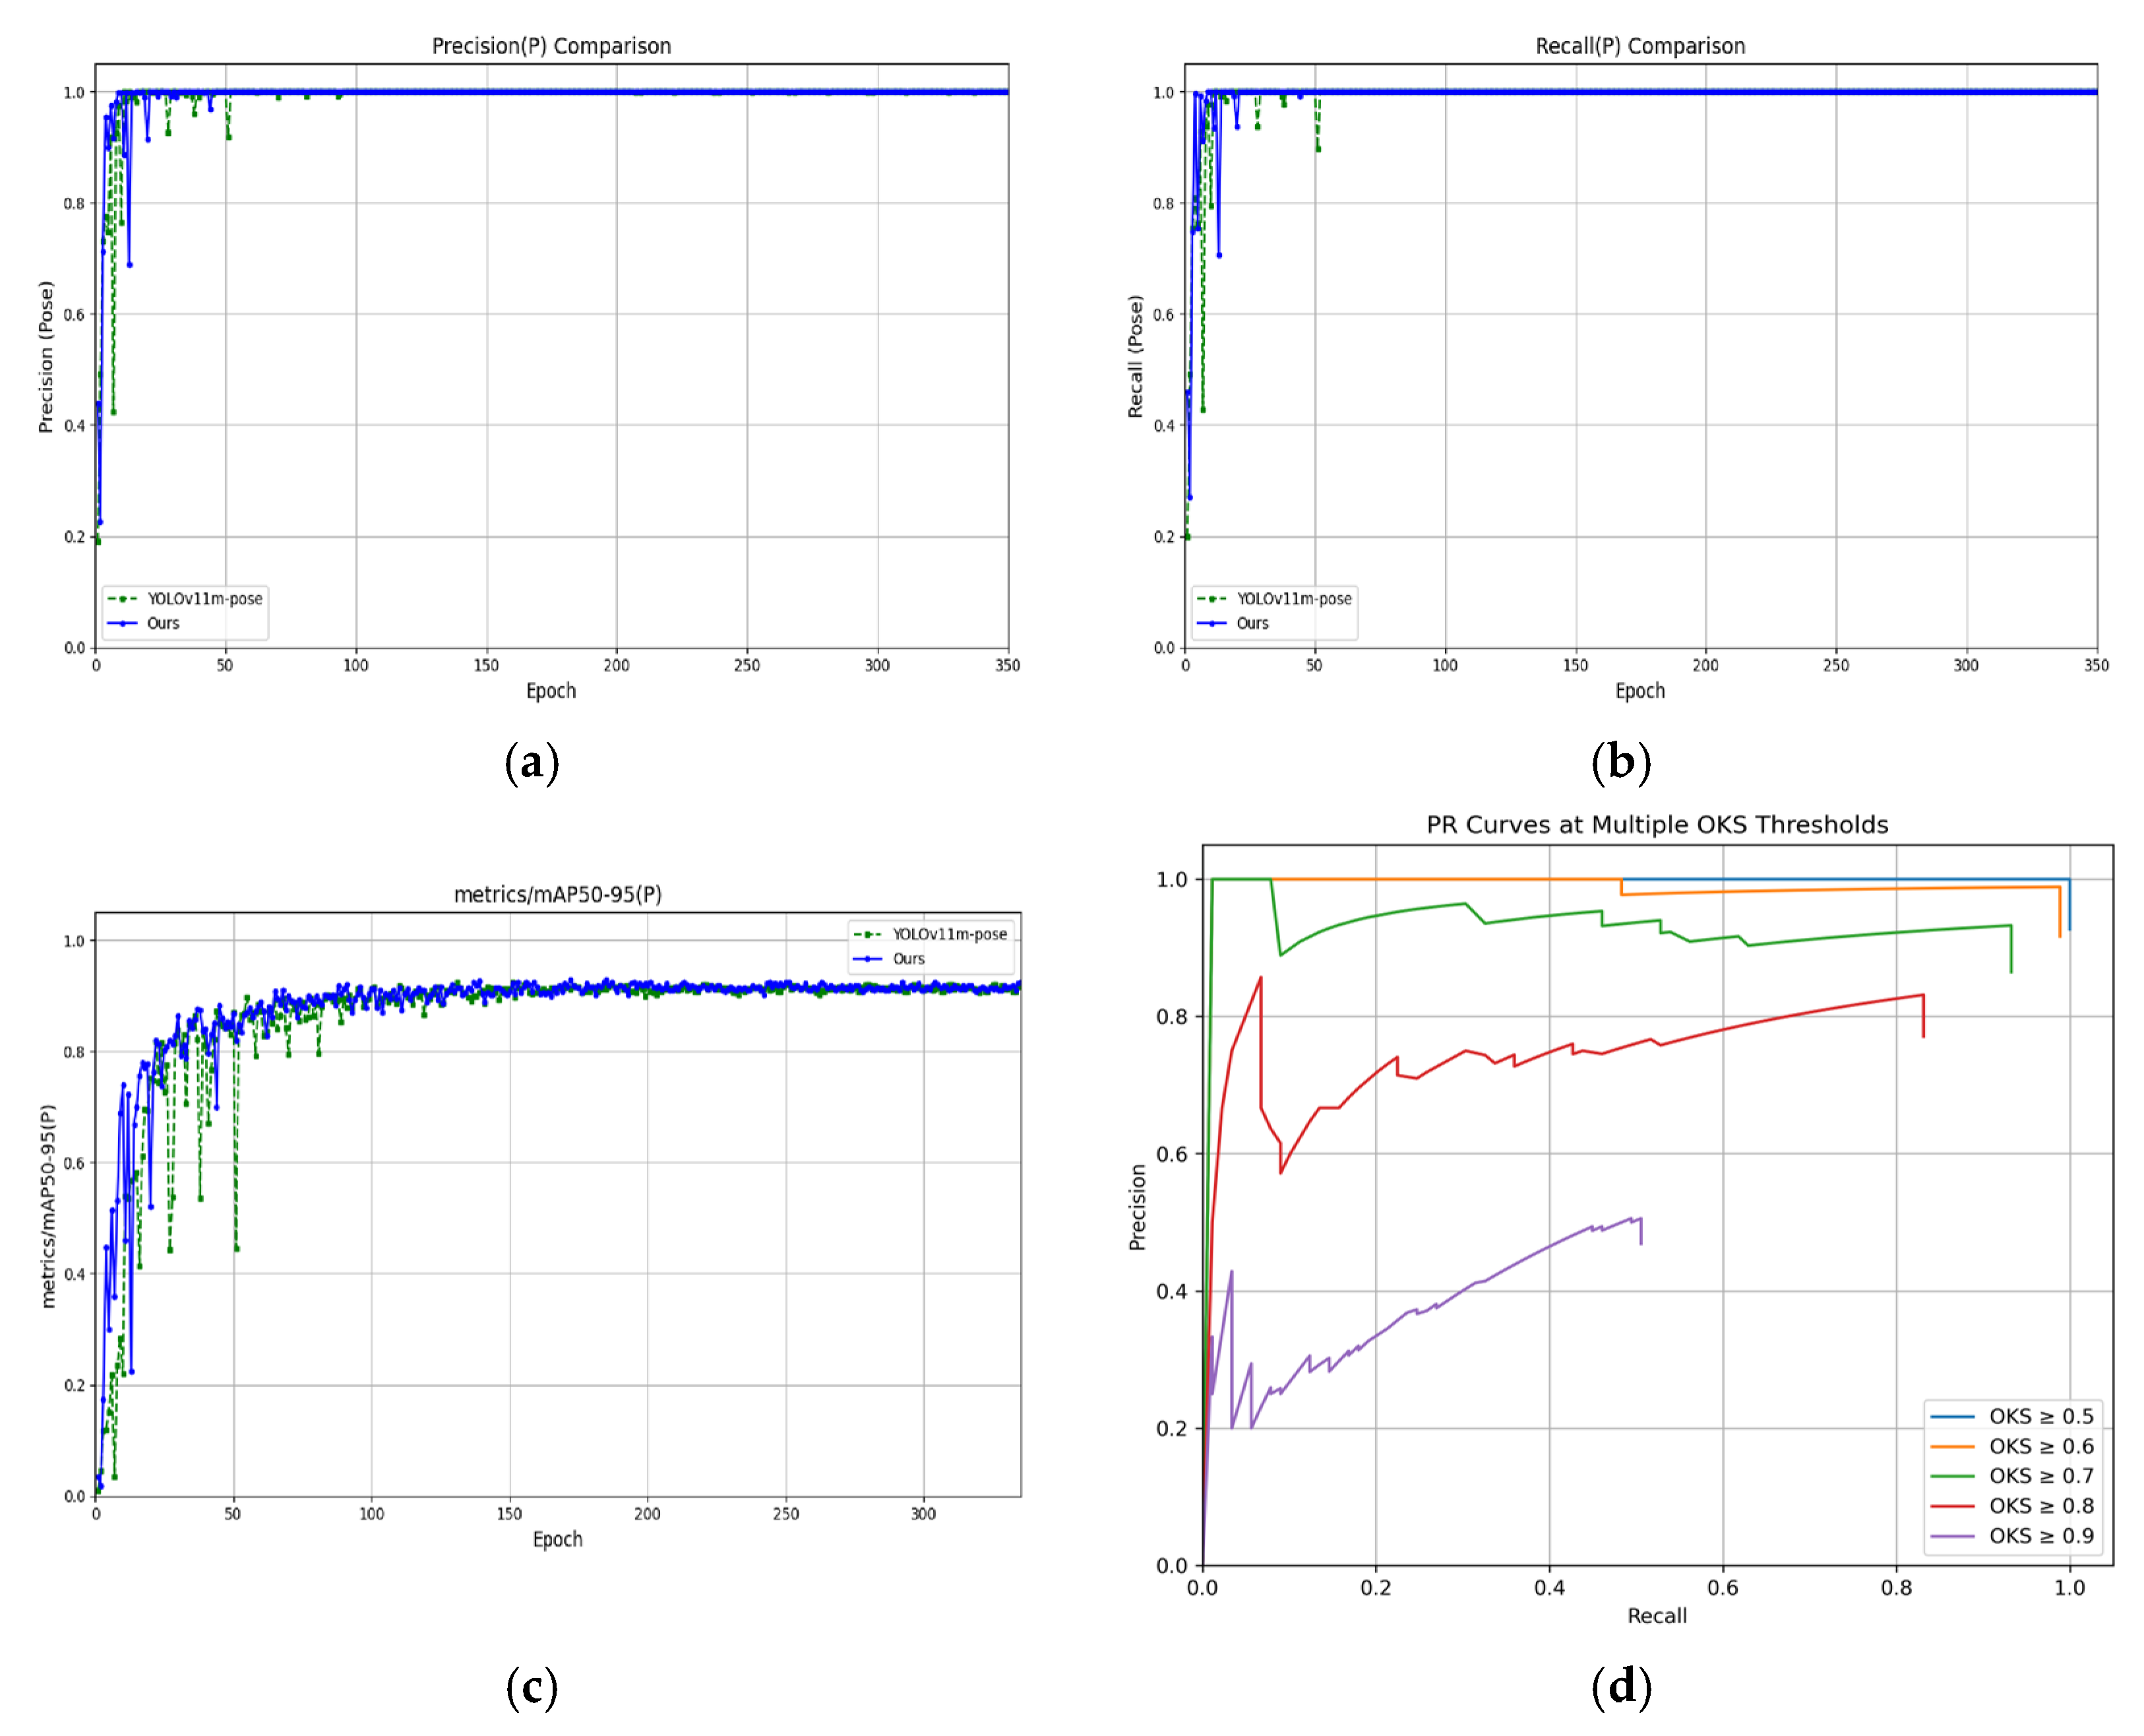
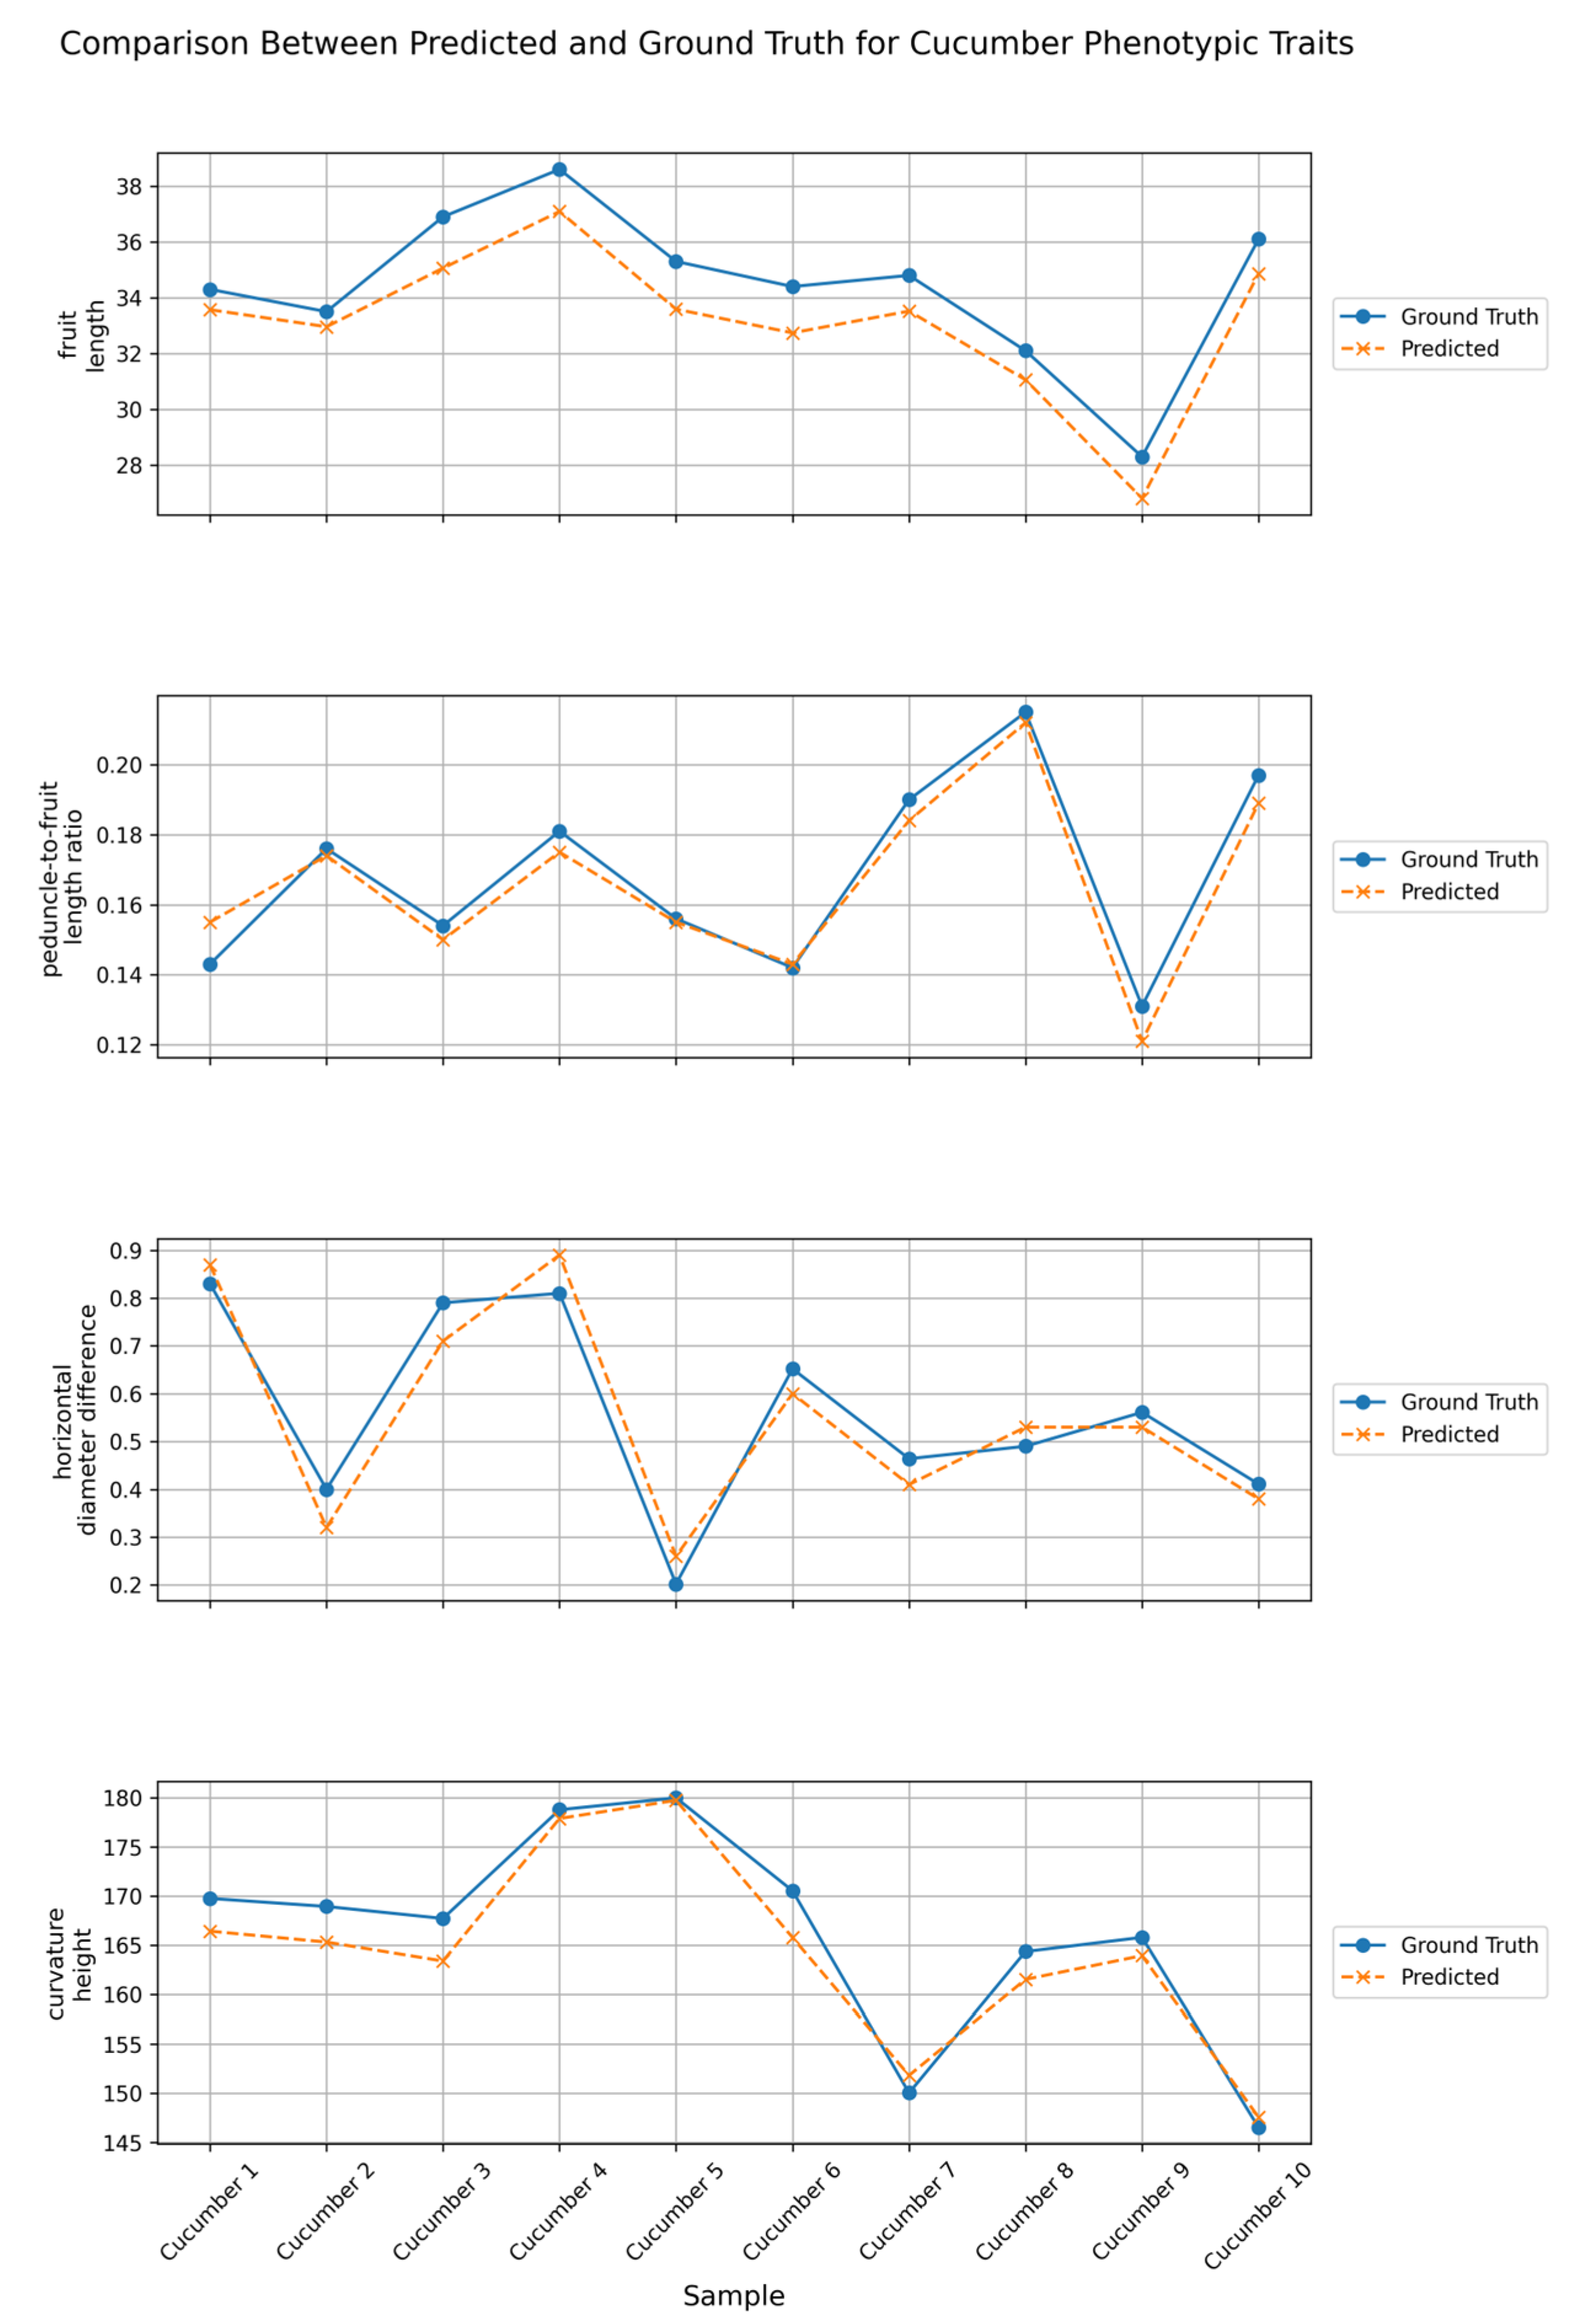
The keypoint detection method based on YOLOv11m-Pose proposed in this study derives the aforementioned phenotypic parameters from the detected keypoint locations, preliminarily validating the feasibility and practicality of this approach for automated phenotypic analysis of cucumber fruits. Experimental results demonstrate that the model achieves a mean absolute error (MAE) of 1.304 and a root mean square error (RMSE) of 1.366 in predicting fruit length, indicating good fitting capability. For the prediction of the peduncle-to-fruit length ratio, the errors are stable and low, with an MAE of 0.0053 and an RMSE of 0.0064. The errors for transverse diameter difference and arch height also fall within reasonable ranges, with MAEs of 0.0546 and 2.468 and RMSEs of 0.0577 and 2.865, respectively. The improved model further enhances performance, achieving an mAP50-95 of 0.924, reducing floating-point operations (GFLOPs) to 32.1, and compressing the model parameter count to 1.229 × 10⁷. These results indicate that the model maintains high stability and accuracy across various phenotypic parameter extraction tasks, demonstrating strong advantages in lightweight design and promising potential for practical applications.
Although the current model performs stably under standard acquisition conditions, variations in fruit morphology and lighting changes in greenhouse environments may pose greater challenges to its generalization ability. Despite the inclusion of a certain degree of sample diversity in the experiments, practical deployment still requires appropriate fine-tuning or incremental learning tailored to specific production scenarios. As this technology advances toward broader applications, further refinement in model design and system integration is necessary to enhance adaptability and reliability.
5. Conclusions
This study addresses the limitations of traditional manual methods for cucumber fruit phenotypic trait extraction, which suffer from low efficiency, high error rates, and difficulties in automation. We propose a keypoint detection-based approach for extracting cucumber phenotypic features. A YOLO11m-SCFPose model based on YOLOv11m-Pose was constructed, wherein optimizations were made to the model architecture and loss function to achieve accurate localization of cucumber keypoints and a lightweight model design. The model incorporates the lightweight StarNet-S1 structure in the backbone network to replace the original modules, significantly improving inference speed and deployment flexibility while substantially reducing the number of parameters without compromising detection accuracy. In the neck, the traditional C3K2 module is replaced by an improved C3K2_PartialConv module, enhancing information interaction among multi-scale features and target representation capability while reducing computational resource consumption. To improve the model’s sensitivity to keypoint localization errors, especially at edge regions and low-confidence samples, the Focaler-IoU loss function was introduced to enhance robustness and localization precision. Experimental results demonstrate that YOLO11m-SCFPose achieves excellent accuracy and computational efficiency in cucumber keypoint detection tasks, reliably extracting key phenotypic parameters such as fruit length, peduncle-to-fruit length ratio, transverse diameter difference, and arch height while maintaining low model complexity and enabling efficient computation.
Although the proposed YOLO11m-SCFPose model has achieved promising results in keypoint detection tasks on static images, certain limitations remain in its practical deployment and large-scale application. The current system is based on static image analysis and lacks the capability to process dynamic scenarios, which hinders its ability to meet the demands for real-time and continuous extraction of fruit phenotypic parameters. Extending this method to video stream data processing is expected to enhance its practicality and timeliness in actual agricultural production. To advance the system toward higher levels of automation and integration, it is imperative to strengthen the collaborative design with customized image acquisition devices, thereby constructing a complete measurement system that integrates image capture, keypoint detection, and phenotypic parameter output, which can improve overall system stability and deployment efficiency. In the follow-up work, we will further explore the dynamic image acquisition method based on the professional cucumber keypoint acquisition device to achieve efficient and stable acquisition of keypoint information. By integrating technical means such as high-quality industrial cameras, stable tracking, and synchronous labeling, the accuracy and automation level of data collection are improved so as to provide higher-quality input data for cucumber key point detection model and then optimize the detection efficiency and deployment convenience of the model in practical applications.


