Article

Effect of Tm-2a, Sw-5 and Ty-1 Gene Introduction on the Agronomic Performance and Metabolic Profile of Traditional Muchamiel-Type Tomato Varieties

1
Instituto Murciano de Investigación Agraria y Medioambiental (IMIDA), c/Mayor s/n, 30150 Murcia, Spain
2
Instituto de Investigación e Innovación Agroalimentaria y Agroambiental (CIAGRO-UMH), Universidad Miguel Hernández, ctra. de Beniel km 3.2, 03312 Orihuela, Spain
3
Biotechnology Program, Universitat Politècnica de València, 46022 Valencia, Spain
*
Author to whom correspondence should be addressed.
Horticulturae 2025, 11(7), 838; https://doi.org/10.3390/horticulturae11070838
Submission received: 3 June 2025 / Revised: 9 July 2025 / Accepted: 11 July 2025 / Published: 15 July 2025
(This article belongs to the Special Issue Genetics, Genomics and Breeding of Vegetable Crops)

Abstract

The introduction of virus resistance genes into traditional tomato varieties offers a strategy to preserve genetic diversity and enhance commercial viability. However, the homozygous presence of these genes has been associated with negative effects on yield and fruit quality. This two-year study evaluated the impact of introducing the Tm-2a, Sw-5 and Ty-1 genes, which are associated with resistance to ToMV, TSWV and TYLCV, respectively, on the agronomic yield, fruit characteristics and metabolic profile of Muchamiel-type cultivars. Four hybrids were obtained by crossing two breeding lines carrying the resistance genes in homozygosis (UMH1139 and UMH1200) with two traditional susceptible varieties (MC1 and MC2). Hybrids matched or exceeded the agronomic performance of their parents. Fruit morphology of the hybrids was similar to traditional parents. The presence of Ty-1 correlated with reduced organic acid concentration, though hybrids exhibited higher levels than the homozygous line, UMH1200. No negative effects on soluble sugars or secondary metabolites were observed. Genotypes carrying resistance genes, breeding lines and hybrids exhibited higher flavonoid contents, suggesting a potential role in virus response. Hybrids maintained or improved the bioactive profile of traditional varieties. These findings support the development of Muchamiel-type hybrids that combine the presence of virus resistance genes in heterozygosity with the desirable traits of traditional tomatoes.

Graphical Abstract

1. Introduction

Tomato (Solanum lycopersicum L.) is one of the most economically valuable horticultural crops in the world. According to the Food and Agriculture Organization, it is the second biggest crop in terms of cultivated area, accounting for 14% of total vegetable production (excluding potatoes) in 2023 [1]. Since the advent of modern plant breeding, programs have prioritized the development of varieties with high yields and disease resistance, as well as a longer postharvest life. This has resulted in a genetic bottleneck and a significant loss of crop and variety diversity [2]. The recovery of traditional varieties is a promising strategy for increasing agricultural biodiversity, particularly in the Mediterranean basin, a secondary center of tomato diversification [3]. In addition to reducing genetic erosion, many of these varieties are notable for their flavor and fruit quality, attributes that are gaining increasing importance among consumers [4,5]. The flavor-related quality is determined by primary metabolites, such as sugars and organic acids, while nutritional quality is associated with secondary metabolites, such as carotenoids, phenolic compounds, and vitamins [6,7]. The flavor profile is influenced by the interaction and balance between organic acids, such as malic, citric, and glutamic acids, and soluble sugars, including fructose and glucose [8]. Secondary metabolites are bioactive compounds that have been shown to promote health. Lycopene, for instance, has been associated with a reduced risk of cardiovascular disease, macular degeneration, and cancer [9]. Despite their outstanding quality, traditional varieties are limited by their susceptibility to viral diseases, which are among the leading causes of economic losses in tomato cultivation [10]. The tomato mosaic virus (ToMV), the tomato spotted wilt virus (TSWV), and the tomato yellow curl virus (TYLCV) are three viral agents that cause significant economic losses in crops. Integrated pest management can reduce populations of thrips and whiteflies, the main vectors of TSWV and TYLCV, to levels that limit direct damage, but it is often insufficient to prevent virus transmission. In the case of ToMV, mechanical spread further complicates disease control in greenhouse systems [10]. The development of breeding programs to introduce resistance genes is considered to be an effective and sustainable strategy, particularly in the Mediterranean basin, where intensive agriculture contributes to high virosis pressure that compromises tomato production [11]. The dominant genes that confer resistance to ToMV and TSWV, as well as tolerance to TYLCV, are Tm-2a, Sw-5, and Ty-1, respectively. These genes were isolated and characterized in previous studies. These genes have been identified in wild tomatoes, specifically S. peruvianum (Tm-2a and Sw-5) and S. chilense (Dunal) accession LA1969 (Ty-1) [12,13,14]. Due to the high incidence of mixed infections, breeding programs have focused on introducing multiple genes using technologies such as marker-assisted selection (MAS), which accelerates the selection process [11].
The Muchamiel tomato variety, a traditional cultivar with significant value in local markets in southeastern Spain, is limited by its susceptibility to virosis [15]. Like other traditional varieties, its cultivation has declined despite being highly appreciated for its flavor, due to its replacement by commercially available varieties that are resistant to viruses, particularly virosis [10]. In order to address this issue, in 1998, the CIAGRO-UMH plant breeding group initiated a program intending to enhance traditional varieties by introducing virus-resistance genes into local varieties from southeastern Spain. These varieties include the Muchamiel variety, as well as others such as the De la Pera and Moruno varieties. Breeding lines incorporating the Tm-2a, Sw-5, and Ty-1 resistance genes in homozygosis have been developed and officially registered within the Spanish Plant Variety Office since 2011 [11]. However, the introgression of resistance genes from wild species has been shown to have a negative impact on fruit quality and yield. This can be attributed to either the genes themselves or to linkage drag. A decline in yield and fruit quality has been observed in the processing of tomatoes resistant to ToMV [16], as well as in tobacco plants that possess the N gene from the Nicotiana glutinosa L. species, which confers resistance to TMV [17]. As described by Verlaan et al., the recombination of the Ty-1 gene was restricted in the S. chilense region [18]. This was attributed to the presence of two chromosomal inversions in S. chilense LA1969 and S. lycopersicum. According to Alonso et al., the introgression of Ty-1 had a negative effect on yield and quality traits in De la Pera breeding lines [19]. In the Muchamiel and De la Pera breeding lines, yield was reduced by up to 50% due to the presence of Ty-1 and in the absence of TYLCV [15,20]. Rubio et al., also reported that Ty-1 homozygosity significantly compromised most of the measured parameters in near-isogenic lines (NILs), with homozygosity for one, two or all of the three introgressed genes (Tm-2a, Sw-5, and Ty-1), resulting in a 40–50% yield decrease [21].
Although the Muchamiel-type breeding lines developed by the CIAGRO-UMH carry resistance genes targeting the major viruses affecting tomatoes, improving quality and productivity remain a challenge. Therefore, alternative strategies must be explored to preserve their exceptional fruit quality. One promising approach is to use resistance genes in the heterozygous state, as this maintains resistance through dominant inheritance while reducing yield and quality losses [16]. A hybrid resulting from a cross between a Muchamiel breeding line and a US heirloom variety was evaluated in a previous study [22]. While a reduction in the negative impact of gene introgression on yield and quality was observed, this hybrid could not be categorized as Muchamiel-type, since one of its parents belonged to a different cultivar. In this context, the CIAGRO-UMH and the IMIDA have developed new Muchamiel tomato hybrids using varietal-type Muchamiel parents carrying resistance genes in the homozygous state for ToMV, TSWV, and TYLCV [15,23], as well as traditional varieties that were previously selected for their high quality yet remain sensitive to these viruses [24,25,26]. The present study aims to evaluate the impact of introducing the Tm-2a, Sw-5, and Ty-1 genes into Muchamiel-type hybrids on their agronomic performance, fruit morphology, and metabolic composition. This approach seeks to increase the available biodiversity for tomato cultivars and to provide viable alternatives without compromising the distinctive traits that are particularly valued by consumers.

2. Materials and Methods

2.1. Plant Materials

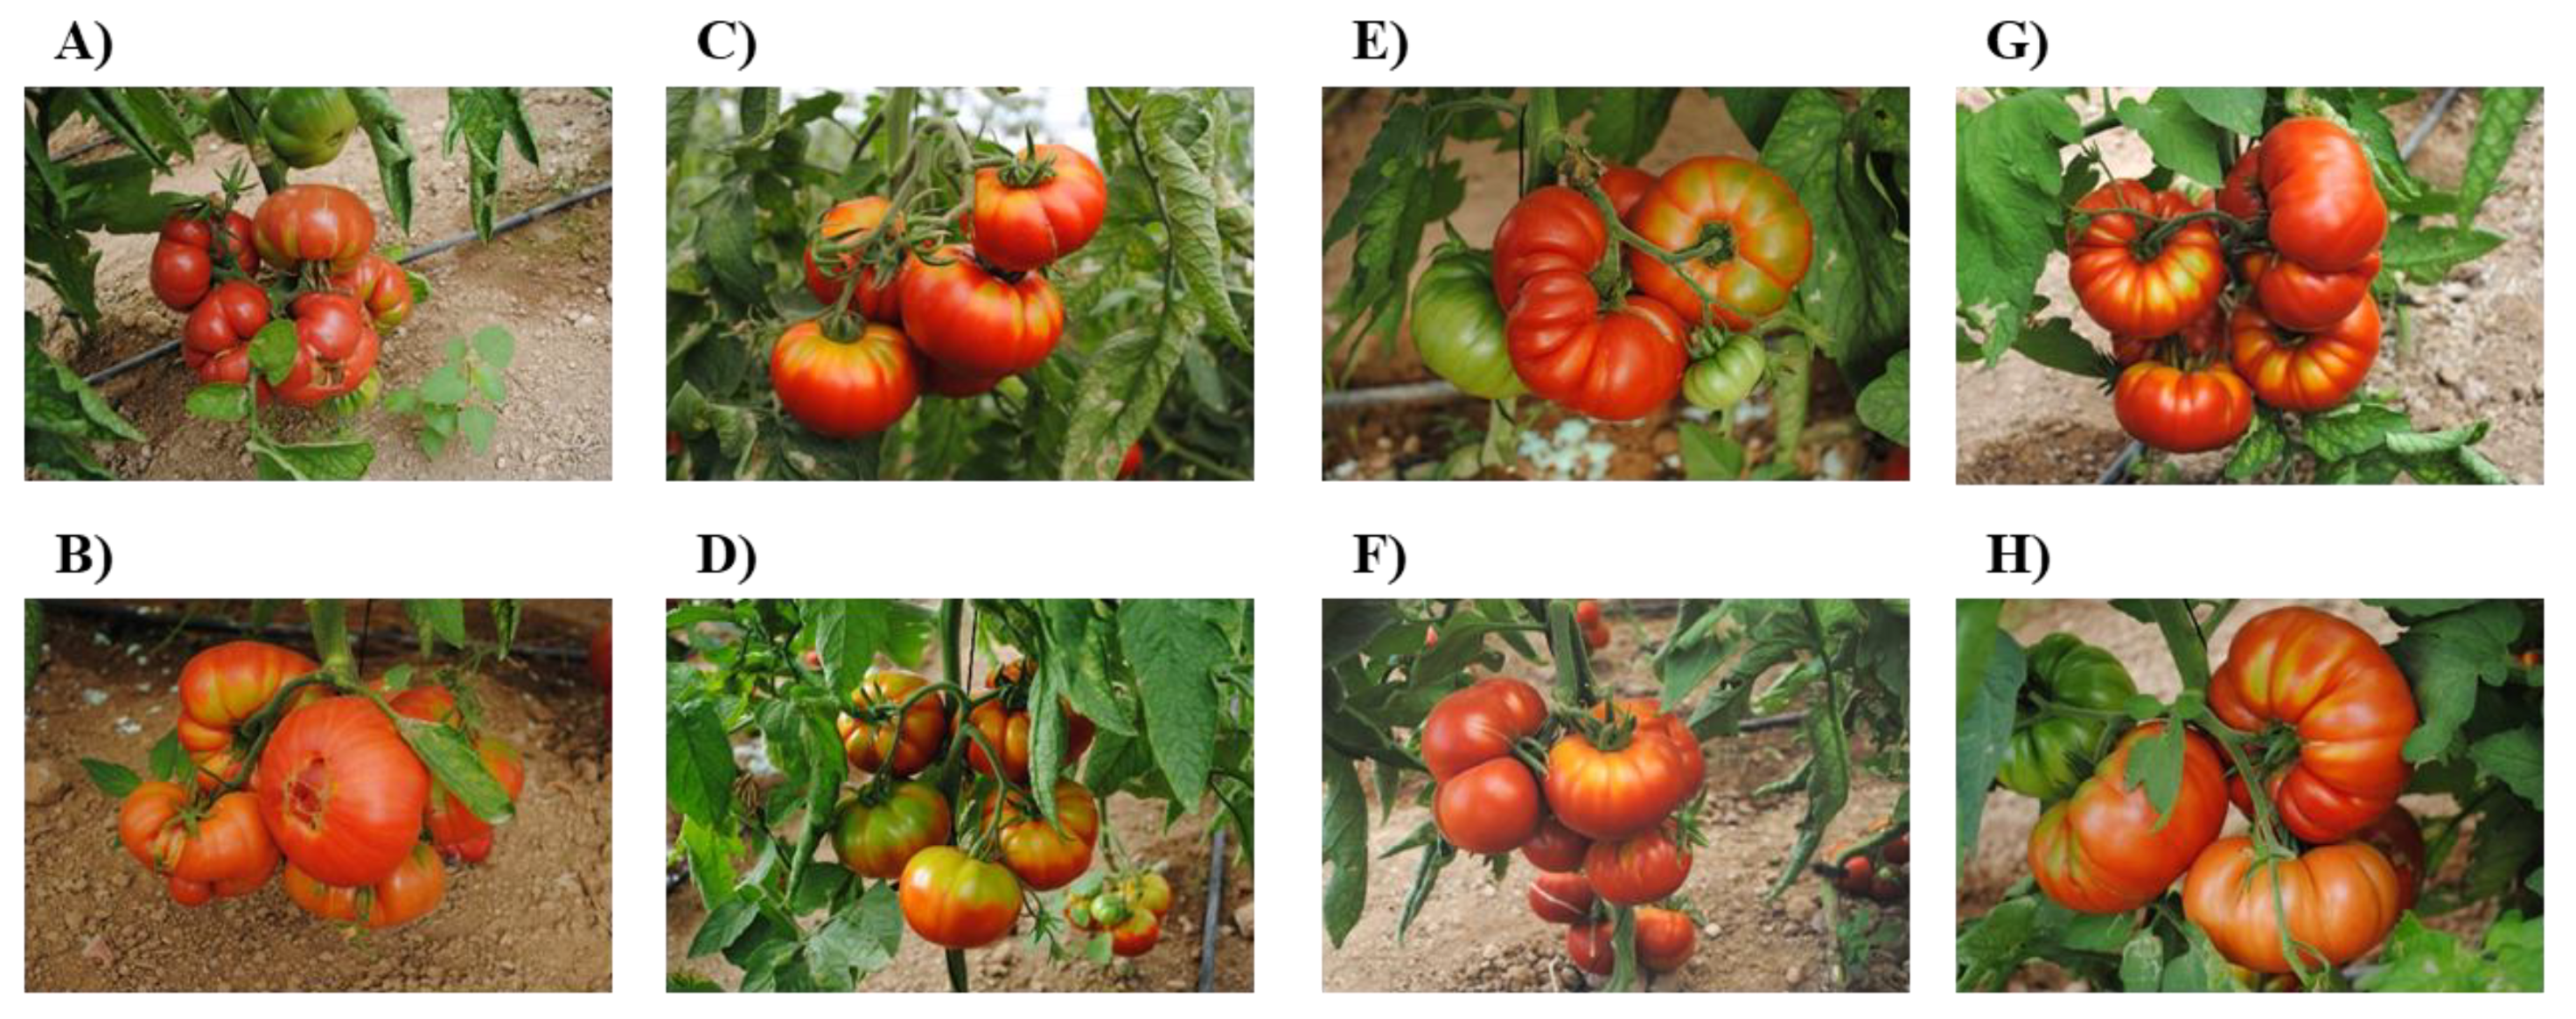
A total of eight Muchamiel-type tomato cultivars were evaluated, including two traditional varieties, two breeding lines, and four hybrids developed by the CIAGRO-UMH Plant Breeding Group and the IMIDA (Figure 1 and Table 1). The MC1 (BGMU0753) and MC2 (BGMU0672) traditional varieties were selected from the IMIDA germplasm bank (BAGERIM) for their outstanding quality traits and agronomic performance [24,26]. The UMH1200 and UMH1139 breeding lines were developed through a backcrossing program involving a Muchamiel variety and six backcrosses, as described in [15,23]. Each breeding line carries a distinct combination of virus-resistance genes that were introgressed during the breeding program. UMH1200 and UMH1139 carry the Tm-2a and Sw-5 genes, respectively associated with resistance to ToMV and TSWV. Additionally, UMH1200 carries the Ty-1 gene, linked to tolerance of TYLCV. The four hybrids were obtained through simple crosses between the two breeding lines and two traditional varieties, each of which was heterozygous for the corresponding resistance genes. The Anairis commercial variety (Seminis, Bayer S.L., Barcelona, Spain), whose size is comparable to that of Muchamiel, was included as a yield reference, but was excluded from the statistical analysis due to its different varietal group. The virus resistance performance of hybrid varieties was evaluated in laboratory, using agroinoculation for TYLCV and mechanical inoculation for ToMV and TSWV.

2.2. Experimental Desingn and Crop Conditions

The above-described cultivars were grown in a polyethylene multi-tunnel greenhouse at the “Torreblanca” experimental farm in Torre Pacheco, Murcia, southeastern Spain (37°46′33.564″ N, 0°53′47.225″ W), which is characterized by an arid to semi-arid Mediterranean-type climate. Water for irrigation was supplied from the Tajo-Segura transfer system (electrical conductivity: 0.8–1.3 dS m−1). Mineral fertilization was carried out following standard agronomic practices adapted to the soil and climatic conditions of the region, in compliance with the technical guidelines for integrated tomato production set out in the Order of 10 May 2012 [27].
Cultivars were grown during the spring season (March–July) of two consecutive years (2022 and 2023). Transplanting was performed using 40-day-old seedlings on 22 March 2022 and 14 March 2023. The planting frame was 0.4 m between plants and 1 m between rows, resulting in a transplant density of 2.5 plants per square meter. The experimental design included three randomized blocks, each comprising three rows containing eight cultivars, with ten plants per cultivar (a total of eighty plants per block). The same experimental design was used in both years. Plants were grown vertically with one stem after axillary bud removal and maintained until the fourth truss.
During the two-year study, average daily temperature and accumulated radiation were recorded by the TP42 weather station in the experimental farm of the SIAM (Murcia Agricultural Information System). Temperature was measured using a 50Y thermohygrometer (serial number W0940091; Vaisala, Vantaa, Finland), while solar radiation was monitored with a CMP7 pyranometer (serial number 980198; Kipp & Zonen, Delft, The Netherlands), both integrated into the station. Whereas the cycles had a similar length in both years (120 days in the first year and 112 days in the second year), environmental conditions varied between years (Supplementary Figure S1). The vegetative development phase occurred within the first 60 days after transplanting. In the first year, the maximum temperatures during this period were slightly higher than in the second year. After the onset of fruit set (60 days after transplanting), minimum temperatures remained similar in both years, whereas higher maximum temperature and cumulative radiation values were recorded during the second year. Four harvests were made: 98, 105, 113, and 120 DAT, and 91, 98, 105, and 112 DAT in the first and second years, respectively. Climatic conditions were similar in both years during this period of fruit production.

2.3. Agronomic and Fruit Morphology Evaluation

To evaluate the agronomic performance of the studied cultivars, all the fruit from ten plants per replicate (thirty plants per cultivar) was harvested and weighed. Yield was determined as the total weight of the fruit harvested per plant (kg/plant). To characterize the fruit and analyze the metabolites, three replicates were established for each cultivar, with each replicate consisting of ten fully ripe, homogeneously colored and defect-free fruits selected from the ten plants corresponding to each experimental block. The equatorial and longitudinal diameters, as well as the external color, were measured using a Mitutoyo 500–196–30 Digimatic caliper (Kawasaki, Japan) and a Minolta CR-200 Chroma Meter (Ramsey, NJ, USA), respectively. The L* (lightness), a* (redness), and b* (yellowness) color parameters were measured in three areas on the surface of each fruit. Subsequently, the hue angle (h° = tan − 1 [b*/a*]) and saturation or chroma (C* = [a*2 + b*2]/2) were calculated from these primary measurements.

2.4. Metabolite Analysis

To analyze the metabolites, ten mature, uniform fruits from the same replicate were cut into small pieces, mixed together, and frozen at −80 °C. This mixture was then homogenized using a Thermomix and frozen at −80 °C until further analysis.
Individual soluble sugars, glucose (GLU) and fructose (FRU), were extracted using deionized water and purified with C18 Sep-Pak cartridges. These were subsequently analyzed using molecular exclusion chromatography on an Agilent 1100 liquid chromatograph (Waldbronn, Germany). The device was equipped with a refractive index (RI) detector and a CHO-682 LEAD 300 × 7.8 mm ID CARBOSep column (Concise Separations, San Jose, CA, USA). Deionized water was used as the mobile phase at a flow rate of 0.4 mL/min [28]. Results are expressed as milligrams per gram of fresh weight (FW).
Organic acids were analyzed as described in [28], using liquid chromatography (Agilent 1200; Agilent Technologies, Santa Clara, CA, USA) with a G6410A triple quadrupole mass spectrometer detector (Supplementary Table S1, HPLC-MS-MS). Organic acids were quantified relative to their corresponding standards (Sigma-Aldrich, Steinheim, Germany). Results are expressed as mg g−1 FW.
Vitamin C (ascorbic acid and its derivative, dehydroascorbic acid) was extracted using a solution of 0.05% (w/v) ethylenediaminetetraacetic acid (EDTA) and dithiothreitol (Sigma-Aldrich, Steinheim, Germany). The extract was analyzed using high-performance liquid chromatography coupled with tandem mass spectrometry (HPLC-MS-MS), according to the methodology developed in [29]. Vitamin C (VC) is expressed as µg g−1 FW, using commercial ascorbic acid (Sigma-Aldrich, Steinheim, Germany) as a standard.
Two separate extractions were performed to analyze the carotenoid profile, as detailed in Supplementary Table S2. Polar carotenoids were extracted using the method described in [28], entailing the utilization of a methanol–tetrahydrofuran (1:1, v/v) solution containing 200 mg of MgO and 0.1% BHT. This was followed by evaporation and dissolution in a methanol–tetrahydrofuran (1:1, v/v) solution containing 2% BHT. Non-polar carotenoids were extracted using the method of [30], involving the use of a mixture of hexane, acetone, and ethanol (2:1:1) containing 0.1% BHT. The hexane layer was then evaporated, and the residue was dissolved in a mixture of methanol and tetrahydrofuran (1:1, v/v) containing 2% BHT. The polar and non-polar carotenoids were analyzed using the methodology validated in [31], with a Hewlett-Packard 1100 HPLC system (Waldbronn, Germany) equipped with a photodiode array UV/Vis detector operating in the 250–800 nm spectral range. Separation was achieved using a 250 mm × 4.6 mm, 3 µm Prontosil C30 column (Bischoff, Leonberg, Germany), with a mobile phase consisting of methanol (solvent A) and methyl tert-butyl ether (solvent B). Elution was performed at a flow rate of 1.3 mL min−1 with an injection volume of 20 µL, with detection performed at 287 nm for phytoene, 347 nm for phytofluene, and 444 nm for lutein, neoxanthin, and violaxanthin. The carotenoids in the samples were identified by comparing their retention times (min) and UV/Vis absorptions with the corresponding standards reported in the literature [28]. Compounds were quantified in µg g−1 FW.
Phenolic compounds were extracted using a methanol–formic acid solution (97:3, v/v) and identified as described in [32]. Analysis was performed using HPLC-MS/MS (Agilent Series 1100; Agilent Technologies) with an ESI interface operating in negative ion mode, and the following operating parameters: capillary voltage of 2000 V, nebulizer pressure of 60 psi, drying gas flow of 13 L min−1, and drying gas temperature of 350 °C. Separation was achieved using an analytical column (250 mm × 4 mm, 5 μm particle size) of Lichrosphere C18 (Agilent Technologies, Waldbronn, Germany), with a mobile phase consisting of solvent A (0.1% formic acid in water) and solvent B (0.1% formic acid in acetonitrile) at a flow rate of 1 mL min−1. Full-scan, neutral loss scan, and precursor ion scan experiments were performed to confirm the identity of some compounds for which standards were unavailable (Supplementary Table S3). Polyphenols were quantified relative to their corresponding standards, which were purchased from Sigma-Aldrich. When standards were unavailable, quantification was performed relative to the corresponding isomers, hydroxycinnamic acids or aglycones. Compounds were quantified in µg g−1 FW.

2.5. Statistical Analysis

All of the statistical analyses were conducted using IBM SPSS Statistics 21. First, normality of the data distribution was assessed using the Shapiro–Wilk test, while homogeneity of variances was evaluated through the Levene’s test based on the median. A two-way analysis of variance (ANOVA) was performed separately for each F1 hybrid and its two parental lines to evaluate the effect of variety (V), harvesting year (Y), and their interaction (V × Y). Duncan’s multiple range test was applied to each group (hybrid and parents) when significant differences were found.

3. Results

3.1. Yield and Fruit Characterization

Table 2 shows the yield per plant and fruit characteristics for the Muchamiel-type hybrids (UMH1139×MC1 and UMH1200×MC1) and their respective parents. The two-way ANOVA data included the effects of year and variety, as well as the interaction between these two factors. The yield per plant of the hybrids ranged from 3.2 to 4.4 kg per plant in 2022 and from 3.0 to 3.5 kg per plant in 2023. UMH1200×MC1 exhibited the lowest yield in both years, whereas UMH1200×MC2 attained the highest yield. No variety × year interaction was found for this parameter, and no significant differences were observed between years either, except for UMH1200×MC2, whose yield in 2023 was 12% lower than in 2022. However, significant differences were found for the variety factor in hybrids with UMH1200 as the parent; these were more productive than their parents. Regarding fruit morphology, the year factor did not affect the longitudinal or equatorial diameters of the studied hybrids, except for UMH1200×MC2 and UMH1139×MC1, where the fruit was slightly smaller in 2023 than in 2022 (−5% in both cases). The variety effect was significant in all of the hybrids compared to their parents, with the hybrids retaining the morphology of the traditional varieties. The UMH1139×MC1 hybrid exhibited a comparable longitudinal diameter and a larger equatorial diameter than its parents. In contrast, the other three hybrids exhibited diameters comparable to the traditional parent and exceeding those of the breeding line, which generally produced smaller fruit. No variety × year interaction was observed for these parameters. When color was evaluated using the chroma (C*; saturation) and hue angle (h°; hue) parameters, variability was observed between cultivars and years. However, the variety × year interaction was not significant. In general terms, hybrids exhibited more intense, reddish colors (higher C* and h°) than their traditional parents, with a decrease in C* and an increase in h° observed in 2023 compared to 2022.

3.2. Primary Metabolites

The characterization of flavor-related traits in ripe fruit was performed based on the presence of primary metabolites, thus determining the concentrations of soluble sugars (mainly fructose and glucose; Figure 2) and organic acids (mainly citric, glutamic, and malic acids; Figure 3), as well as isocitric and quinic acids at lower concentrations (Supplementary Table S4). Two-way ANOVA was used to analyze the effects of year and variety, as well as the interaction between the two factors (Table 3).

3.2.1. Soluble Sugars

Significant differences were found in the variety and year factors of the four developed hybrids concerning this parameter, with no variety × year interactions (Table 3). Among the parents, MC1 exhibited higher fructose and glucose concentrations than MC2. Among the breeding lines, UMH1200 exhibited lower values than UMH1139 (Figure 2). The developed hybrids outperformed their traditional parents in terms of concentration of these sugars, with glucose and fructose increases ranging from 13% to 34%, depending on the hybrid and year. The glucose concentration in the hybrids ranged from 9.7 to 9.9 mg g−1 in 2022 and from 10.2 to 11.9 mg g−1 in 2023. Meanwhile, the fructose concentration ranged from 10.1 to 10.9 mg g−1 in 2022 and from 12.7 to 14.9 mg g−1 in 2023. A significant overall increase was observed in the second year.

3.2.2. Organic Acids

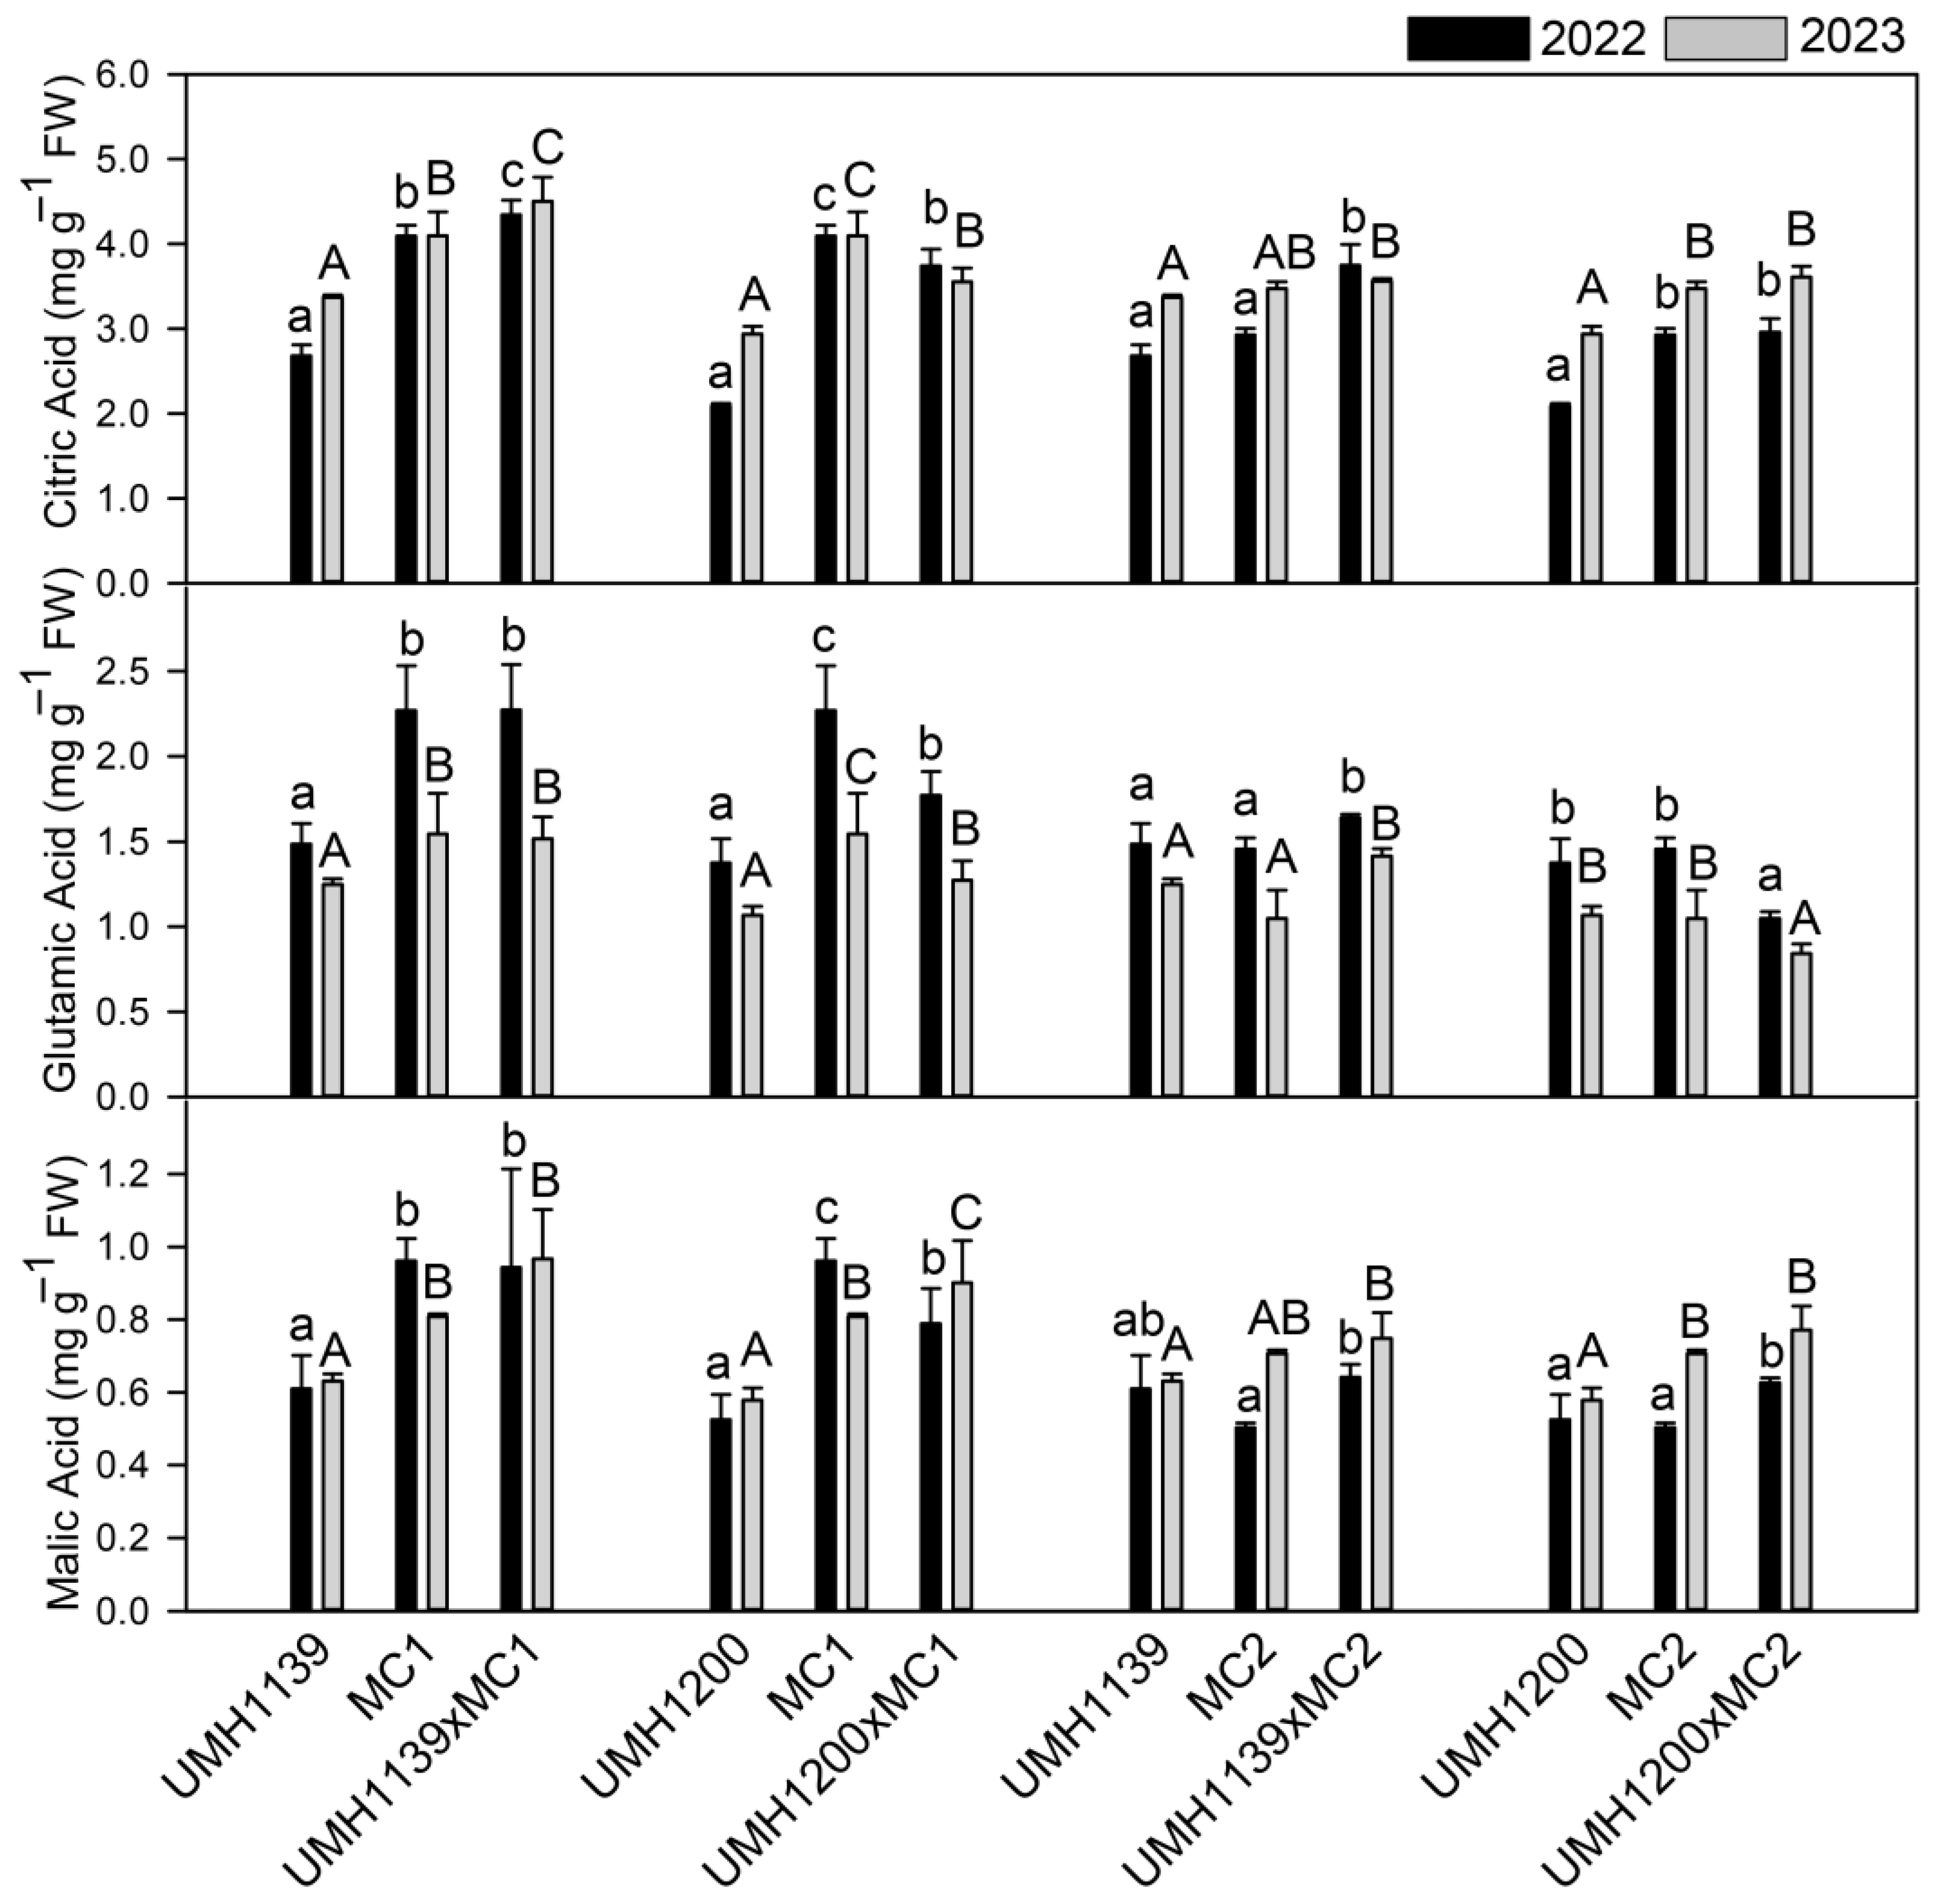
Eleven organic acids were identified and quantified in the analyzed cultivars (Supplementary Table S1). This study assessed the three major acids: citric acid, representing 60% of the total acid concentration on average; glutamic acid, constituting 25% on average; and malic acid, accounting for 13% on average. These percentages varied according to variety and year (Figure 3). Significant differences in the concentrations of these metabolites were observed between hybrids and their parents, and between years of cultivation, as well as between these two factors (Table 3).
Of the four hybrids evaluated in terms of citric acid concentration, the UMH1139×MC1 hybrid performed exceptionally well, exceeding its traditional parent (MC1) by 6% and 9% in 2022 and 2023, respectively. By contrast, the values determined for UMH1200×MC1 were lower than those obtained for MC1. Regarding glutamic acid, crosses with the UMH1200 resistance line exhibited lower values than those obtained with MC1 and MC2. However, hybrids with the UMH1139 resistance line outperformed or equaled their traditional parent (MC2 or MC1). Regarding malic acid, all of the hybrids, except UMH1139×MC2 in 2022, exhibited a superior performance than the respective breeding lines used as their parents. The effect of the year varied according to the compound and hybrid versus parental combination. Whereas the concentration of glutamic acid decreased in all of the cultivars in 2023, the concentrations of citric and malic acids were influenced by the interaction between variety and year. An increase in citric acid concentration was recorded in the breeding lines and MC2 in 2023, whereas MC1 maintained a constant concentration of citric acid in its fruits. Regarding malic acid, the breeding lines exhibited stable concentrations in both years, whereas MC1 decreased and MC2 increased in 2023 compared to 2022. A heterogeneous response was observed among the hybrids concerning citric acid: an increase was observed in UMH1200×MC2, a decrease in UMH1139×MC2 and UMH1200×MC1, and stability in UMH1139×MC1. All of the hybrids exhibited an increase in malic acid concentration by 2023, except for UMH1139×MC1, which remained stable over both years.

3.3. Secondary Metabolites

3.3.1. Vitamin C

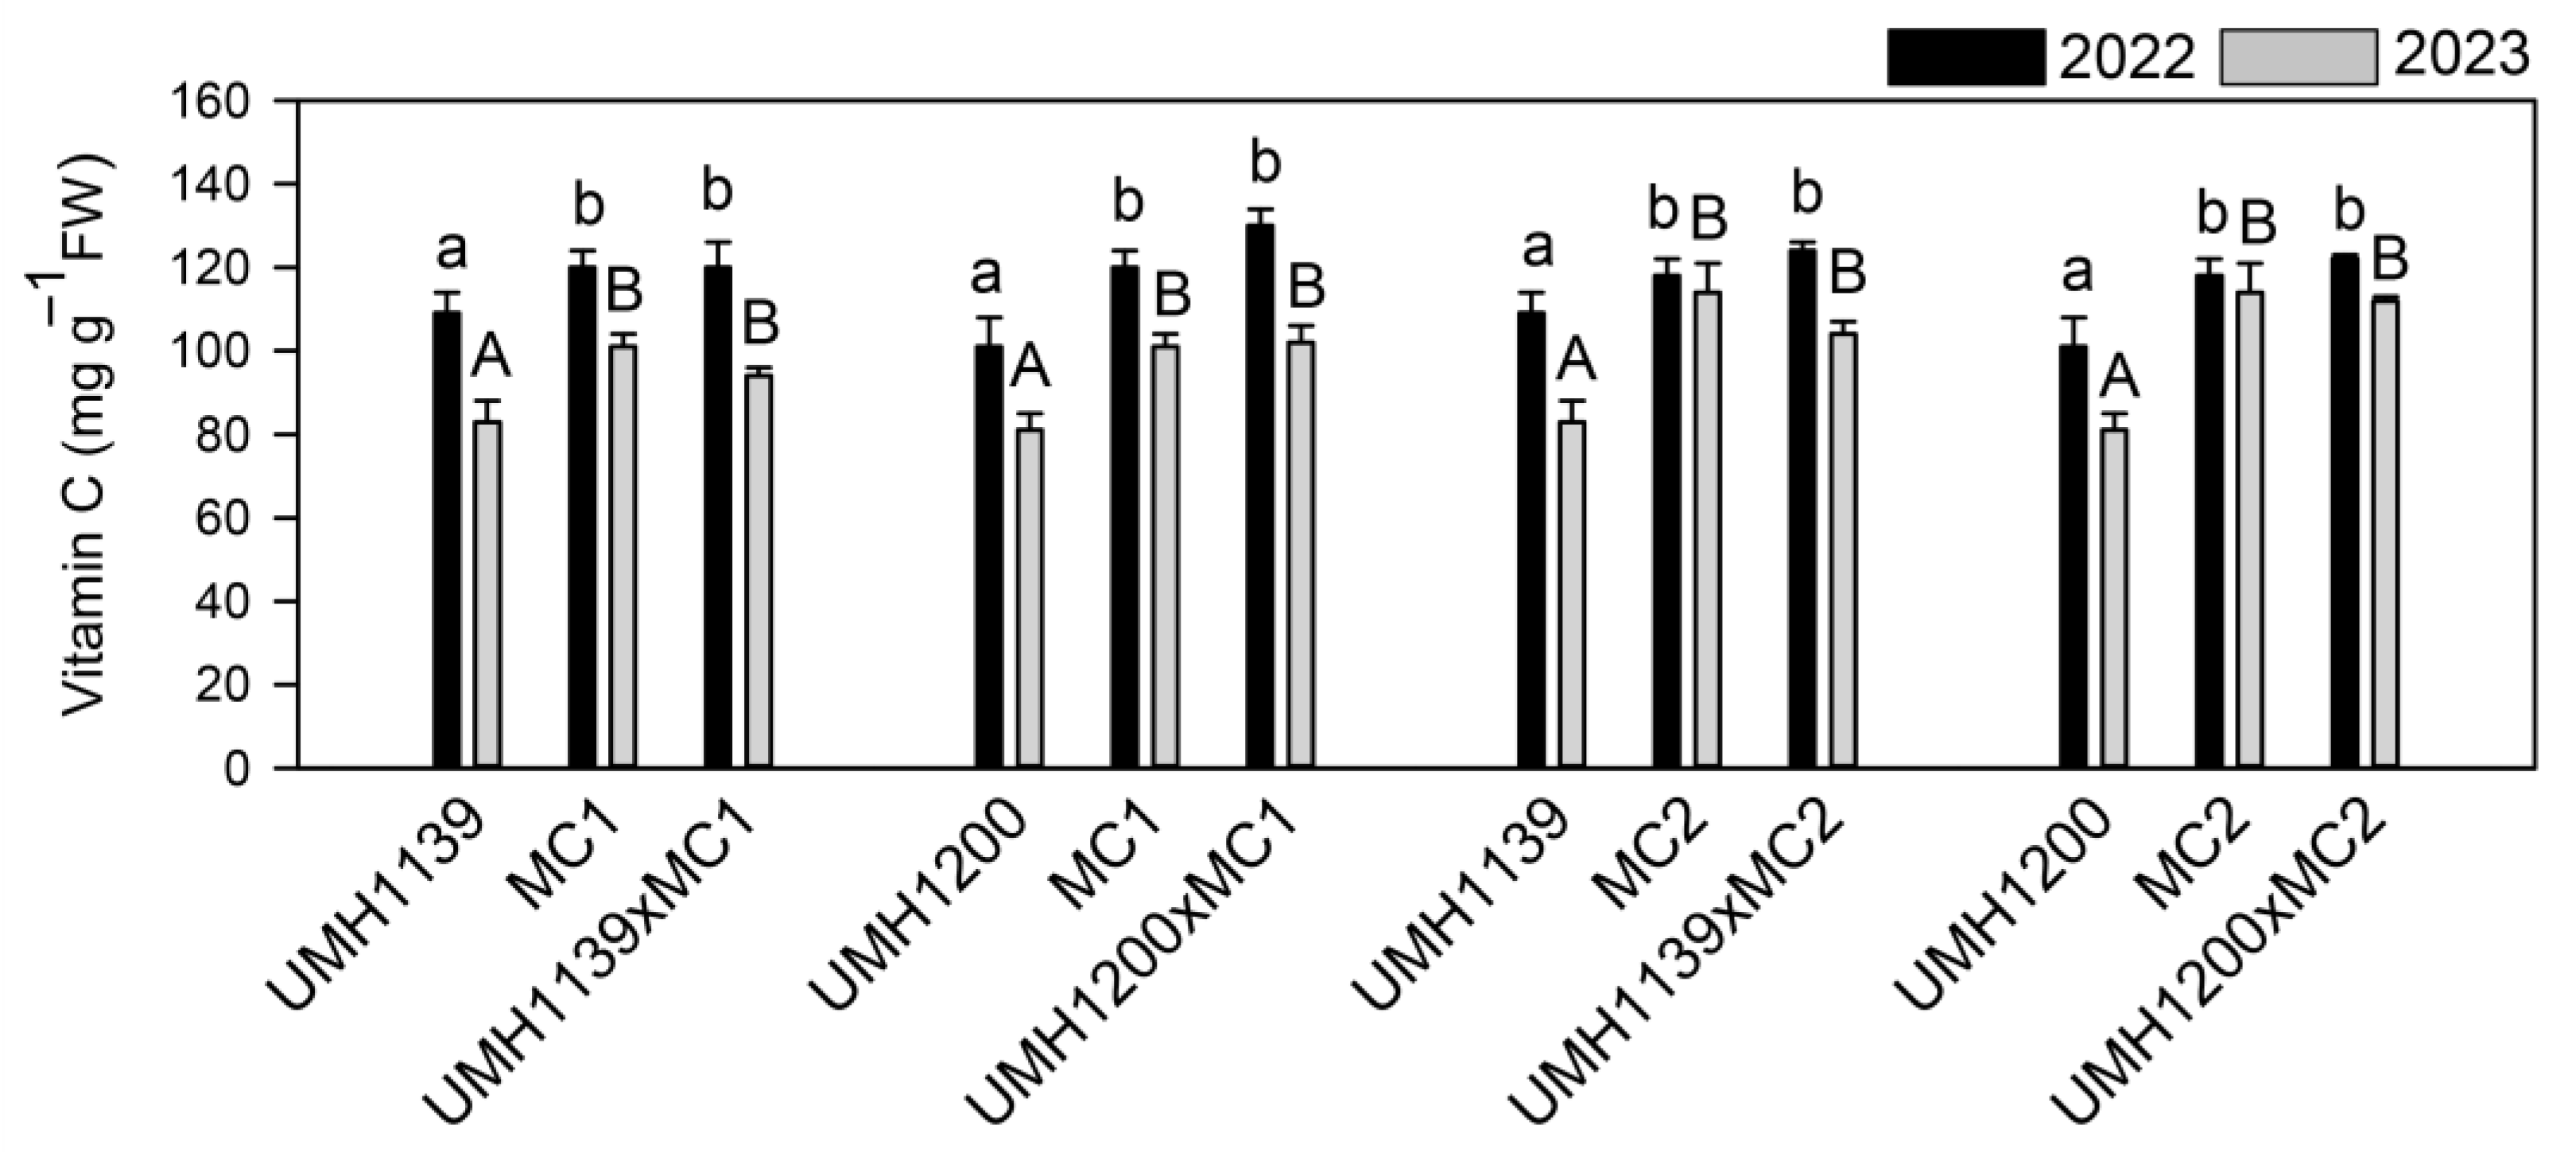
The concentration of vitamin C in the studied cultivars was significantly affected by variety and year, with no meaningful interactions between the two factors (Table 4). The developed hybrids had higher vitamin concentrations than the breeding lines, which were similar to those observed in the traditional parents in both years of the study (Figure 4). In 2022, the values in the developed hybrids ranged from 120 µg g−1 (UMH1139×MC1) to 130 µg g−1 (UMH1139×MC2), and in 2023, they ranged from 94 µg g−1 (UMH1139×MC1) to 112 µg g−1 (UMH1200×MC2). There was an overall decrease in vitamin C concentration in 2023 compared to 2022.

3.3.2. Carotenoids

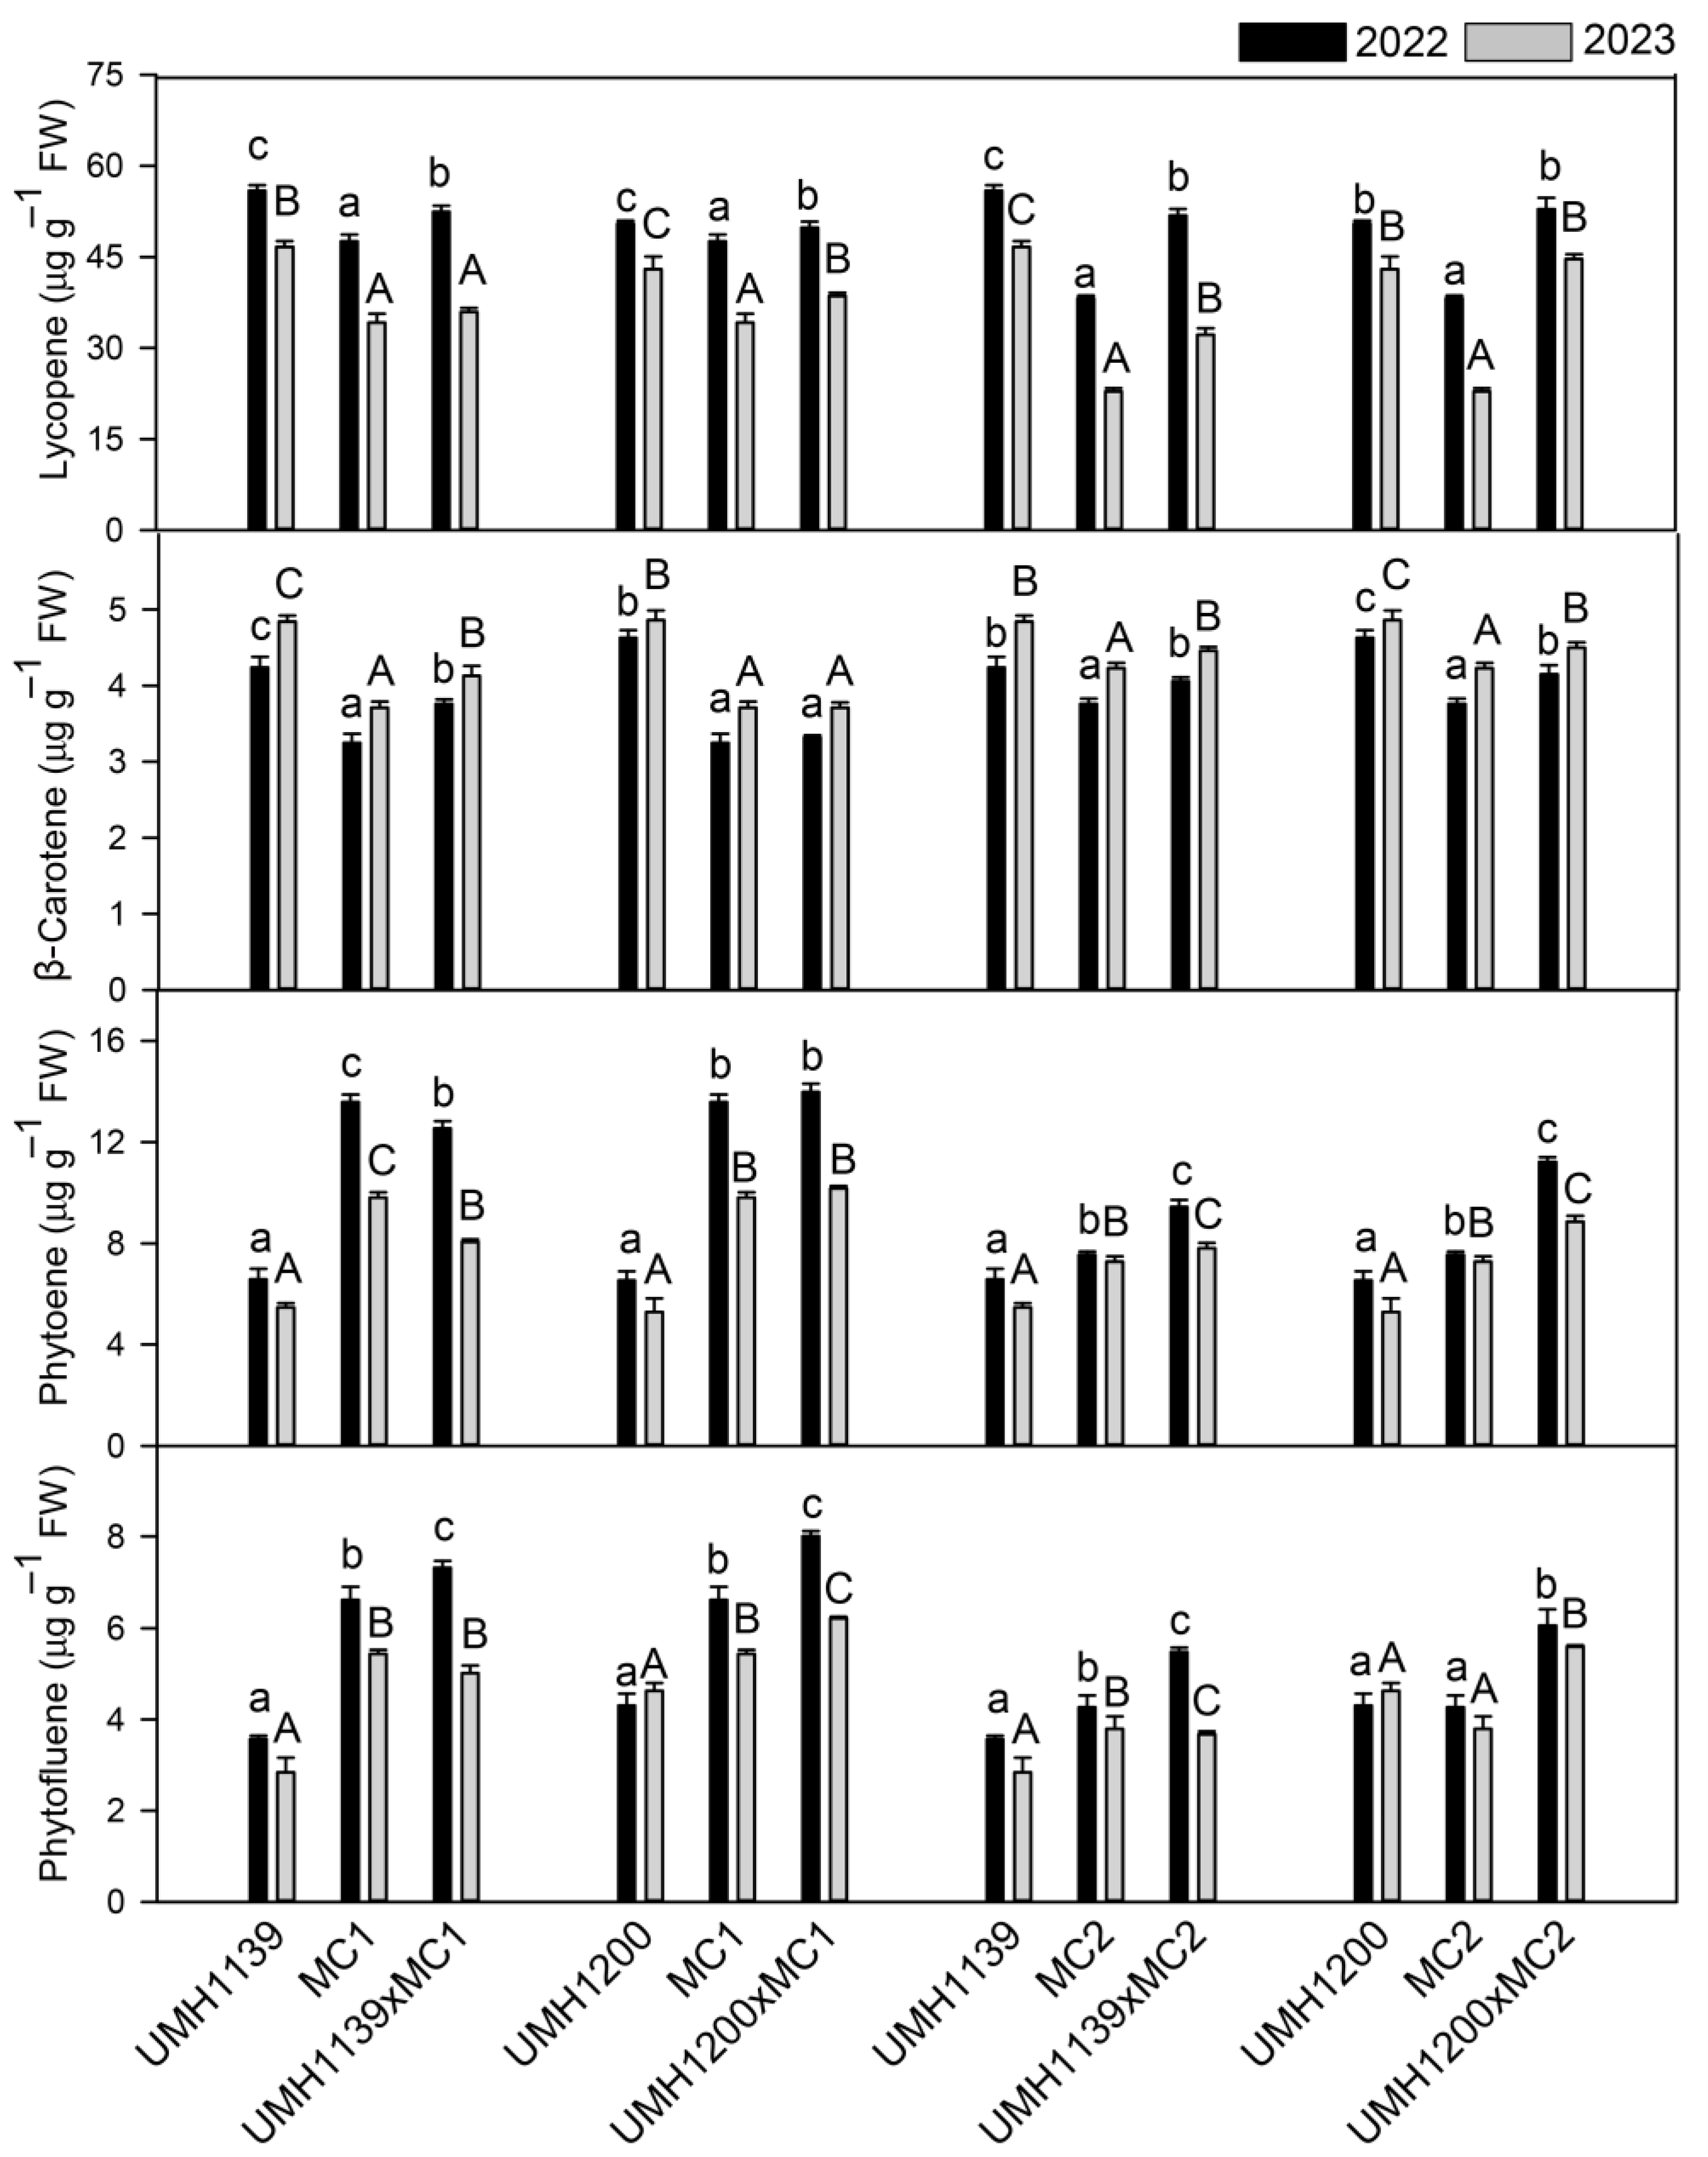
A total of nineteen compounds were identified, which together constituted the carotenoid profiles of the studied cultivars (Supplementary Table S2). Eight compounds of interest were considered in this study: phytofluene (calculated as the sum of phytofluene I and II), phytoene, lycopene (the sum of the all-trans, 13-cis, 13′-cis, 9-cis, 9′-cis, 5-cis, and 5′-cis isomers), β-carotene, δ-carotene, and three xanthophylls (lutein, neoxanthin, and violaxanthin). As expected, lycopene was identified as the dominant component, followed by the carotenoid precursors phytoene and phytofluene.
The concentrations of the major carotenoids lycopene, β-carotene, phytoene, and phytofluene were found to be significantly affected by the variety and year (Table 4). The interaction between variety and year was found to be significantly associated with phytofluene concentration in cultivars. For phytoene, however, this interaction was only observed in hybrids whose traditional parent was MC2. A significant variety × year interaction was also detected for lycopene concentration in the UMH1139×MC1 hybrid compared to its parents. In both years, hybrids exhibited concentrations equal to or greater than those of their traditional parents, except for UMH1139×MC1, which had a lower phytoene concentration. Compared to breeding lines, hybrids exhibited similar or lower lycopene and β-carotene concentrations. However, phytoene and phytofluene values were higher than those observed in the breeding lines. Regarding the effect of the year, the concentration of these carotenoids decreased in 2023 compared to 2022, except for β-carotene, which increased in all of the studied cultivars (Figure 5). The concentrations of δ-carotene (a lutein precursor), lutein, and xanthophylls (neoxanthin and violaxanthin) were significantly affected by variety (except for neoxanthin in the UMH1139×MC1 hybrid and its parents) and crop year (except for lutein concentration in all of the cultivars, and for violaxanthin concentration in the UMH1139×MC1 hybrid and its parents) (Table 5.) The interaction between variety and year was only significant for violaxanthin in the UMH1200×MC1 hybrid compared to its parents. In terms of variety, hybrids exhibited equal or higher concentrations of δ-carotene, violaxanthin, and neoxanthin than their traditional parents. Lutein concentration was lower than that found in the traditional parent in hybrids derived from MC1, and the same as in hybrids derived from MC2, in both years. The year had a significant effect on the concentrations of δ-carotene and neoxanthin, with a decrease in δ-carotene and an increase in neoxanthin observed in all of the cultivars in 2023 compared to 2022. A significant year effect was observed for violaxanthin, with a generalized decrease in 2023, except for the UMH1200×MC1 hybrid, in which case an increase was recorded.

3.3.3. Phenolic Compounds

In this study, 29 phenolic compounds were identified (Supplementary Table S3), the most important of which were phenolic acids (Table 6), followed by flavonols and flavanones (Table 7). Among the former were chlorogenic acid and its derivatives (chlorogenic acid-like 1 and 2 and chlorogenic acid), followed by homovallinic acid-O-hexoside (1 and 2), caffeic acid and its derivatives (caffeic acid, caffeic-acid-O-hexoside 1, 2, and 3, and dicaffeoylquinic acid 1, 2, and 3), ferulic acid and its derivatives (ferulic acid and ferulic-acid-O-hexoside 1 and 2), and cryptochlorogenic acid. Among the flavonols, rutin and its derivatives (rutin and rutin-O-pentoside), together with kaempferol-3-O-ruthinoside, were predominant, whereas flavanones were represented only by naringenin and its derivatives (naringenin and naringenin-O-hexoside 1, 2, 3, 4, and 5). The presented results correspond to the total concentration of the compounds and their derivatives (Table 6 and Table 7).
All of the tested phenolic compounds were significantly affected by variety, whereas the effect of the year depended on the tested compound and cultivar. Homovanillic acid-O-hexoside and ferulic acid concentrations were significantly affected by the year in all of the hybrid–parent comparisons. However, chlorogenic acid showed significant differences only in UMH1139×MC1 and its respective parents. In those cases where the effect of the year was significant, an overall decrease in these compounds was observed in 2023 compared to 2022. A significant variety × year interaction was observed for rutin, kaempferol-3-O-rutinoside (K-3-O-R), naringenin, and phloretin. These compounds exhibited a decline in the hybrids in 2023, except for K-3-O-R, whose concentrations remained stable. Additionally, phloretin concentrations in UMH1139×MC1 and naringenin concentrations in UMH1200×MC1 and UMH1200×MC2 showed no variation between years. The concentrations of chlorogenic acid, the most abundant phenolic acid, in the hybrids were similar to those of the traditional parent and higher than the ones found in the breeding line in both years, except for UMH1139×MC1 in 2023, which showed significantly higher values than both parents (67% higher than UMH1139 and 38% higher than MC1). The concentrations of homovanillic acid-O-hexoside and caffeic acid in all of the hybrids were comparable to or greater than those found in their respective traditional parents. The hybrids showed higher concentrations of cryptochlorogenic and ferulic acids than the breeding lines. However, contrasting responses were observed when compared with their traditional counterparts. All of the hybrids exhibited higher levels of cryptochlorogenic acid. In the case of ferulic acid, however, only UMH1139×MC1 and UMH1200×MC2 attained concentrations that were comparable to those of MC1 and MC2, respectively; lower concentrations were observed in the rest of the hybrids. Regarding the main flavonols (rutin and kaempferol-3-O-rutinoside), flavanones (naringin), and phloretin, the hybrids exhibited intermediate concentrations that were higher than those of the traditional parent, but lower than those of the breeding line. The exception was UMH1139×MC1, which exhibited values comparable to those of the UMH1139 breeding line in naringenin, and UMH1200×MC1, which reached similar results to the ones found in the traditional parent in phloretin.

4. Discussion

The recovery of traditional varieties is limited by their susceptibility to viruses, such as ToMV, TYLCV, and TSWV, which leads to a substantial reduction in profitability for farmers [10]. To address this issue and maintain genetic diversity, in 1998, the CIAGRO-UMH plant breeding group initiated a program to introduce three dominant genes (Tm-2a, Sw-5, and Ty-1), previously described as conferring resistance to these viruses into traditional varieties from southeastern Spain, including the Muchamiel type [11]. However, the breeding lines with the Ty-1 gene in a homozygous state obtained through this program exhibited a reduced yield and, in certain instances, an inferior fruit quality compared to the original variety. These losses are attributed to the introgression of linked genes that cannot be eliminated during the backcrossing process [18]. One strategy to minimize these adverse effects is to use resistance genes in a heterozygous state [16]. This study sought to evaluate the impact of introducing the Tm-2a, Sw-5, and Ty-1 genes on the agronomic performance, fruit morphology, and metabolic composition of Muchamiel-type hybrids. This approach aimed at enhancing the biodiversity available for tomato cultivars and providing viable alternatives without compromising the distinctive traits that are particularly valued by consumers.
Although the introduction of the Ty-1 gene has been reported to negatively affect yield [18,19], no comparable effects were detected in the present study, either in the breeding lines or the hybrids. These results are consistent with those obtained by [22], who also found no yield differences between the UMH1200 and UMH1139 breeding lines used in the present study. However, it is essential to note that these breeding lines do not originate from identical Muchamiel cultivars, which could result in minor genetic variations masking the negative impact of Ty-1 on yield. Indeed, a study previously carried out by the same research group observed a 48% reduction in yield in Muchamiel NILs that were homozygous for Ty-1 compared to susceptible lines [21]. In contrast, the hybrids that were developed in this study had a higher yield than their parents, even though this was only significant for UMH1200×MC1 and UMH1200×MC2. This increase could be attributed to the vigor of the hybrid, albeit moderated by the reduced genetic distance between the parental lines, which are both of the Muchamiel type [33]. The yield of the evaluated hybrids (3 to 4.4 kg per plant) is within the range reported for traditional Muchamiel varieties, with values ranging from 2 to 2.8 kg [21] and up to 4.5 kg per plant [23]. Resistance genes were found to influence fruit morphology, as determined by longitudinal and equatorial diameters and parameters directly correlated with fruit weight. The breeding lines exhibited the smallest diameters, consistent with prior research indicating a potential adverse effect of these genes on fruit size [19,21,22]. However, the hybrids that were heterozygous for the resistance genes recovered the longitudinal and equatorial diameter values of their traditional parents. This confirms that the introduction of virus-resistance genes in a heterozygous state can help to avoid the negative effects observed in homozygous lines [22].
Consumer preferences shape the commercial value of tomatoes, as fruits with a balance between acidity and sweetness are often preferred [34]. Primary metabolites play a key role in determining the flavor. The Muchamiel variety is characterized by intermediate concentrations of glucose, fructose, and citric acid, as well as high concentrations of malic acid and glutamic acid. The latter is closely linked to the “umami” flavor, which is important for the sensory quality of the fruit [25,26]. Whereas the impact of resistance genes’ introductions on the primary metabolite profile of tomatoes remains largely unexplored, the literature does offer insights into their influence on parameters such as titratable acidity and total soluble solids, which are primarily determined by organic acids and soluble sugars, respectively. Rubio et al. observed that the presence of the Ty-1 gene in homozygosis in NILs of the traditional Muchamiel and De la Pera varieties reduced titratable acidity without affecting the total soluble solids [21]. This effect was subsequently confirmed in [22,35]. The Ty-1 locus from S. chilense is located within a non-recombinant genomic region of approximately 35.5 Mb on chromosome 6, where two chromosomal inversions suppress recombination. As a result, this large introgressed segment may retain wild tomato genes that negatively affect acidity [18]. The results of this study are consistent with these findings. Hybrids derived from the UMH1139 line, in which the Ty-1 gene is not present, were found to maintain or increase their organic acid concentration compared to the traditional parent line. In contrast, hybrids derived from the UMH1200 line, which carries the Ty-1 gene, exhibited reductions in all of the three major organic acids (UMH1200×MC1) or the glutamic acid only (UMH1200×MC2). However, in the UMH1200×MC1 hybrid, this decrease did not reach the levels observed in the breeding line, instead presenting an intermediate concentration of the three acids, possibly due to the presence of a single copy of the Ty-1 gene [16,22]. No effect that could be attributed to the introduction of resistance genes was detected with regard to soluble sugars, but it was noted that hybrids consistently outperformed their traditional parents (MC2 and MC1), with an average increase in glucose and fructose of 18% and 22%, respectively, over MC2 and MC1, and variations depending on the hybrid and year.
In recent years, consumer interest in the functional value of agri-food products, primarily driven by the secondary metabolites found in tomatoes, has increased due to the health benefits offered by these metabolites [36]. The concentrations of different secondary metabolites in the cultivars examined in this study were consistent with those reported in previous studies on Muchamiel-type cultivars [25,26,37]. However, the metabolic profiles of these breeding lines and their hybrids remain to be characterized. The adverse effect of the introduction of resistance genes, particularly Ty-1, observed on organic acid concentrations, was not detected in the profile of secondary metabolites. It was reported that the Ty-1 introgression in De la Pera breeding lines did not affect the antioxidant activity of the fruit [35]. In this study, the cultivars carrying resistance genes (both the homozygous breeding lines and the heterozygous hybrids) showed higher concentrations of rutin, kaempherol-3-O-rutinoside, naringenin, and phloretin than the susceptible cultivars (the traditional parents). The breeding lines showed the highest concentrations, whereas the hybrids exhibited intermediate values. This suggests a direct relationship between the number of copies of the resistance genes and the accumulation of these antioxidant compounds. A higher basal antioxidant level, induced by increased flavonoid synthesis, can enable a quick response to the virus without causing significant oxidative stress. Modulating ROS accumulation during viral infection enables a rapid defense response, such as a hypersensitive reaction, while preventing excessive oxidative damage to surrounding tissues [38]. Differences in the metabolome of virus-susceptible and virus-resistant tomato cultivars have been observed. For example, a 14.17-fold increase in naringenin in resistant cultivars following TSWV infection has been observed, compared to 2.81- and 1.57-fold increases in susceptible lines [39]. Similarly, higher concentrations of secondary metabolites were reported in TYLCV-resistant cultivars prior to infection, which suggests that these metabolites play a role in conferring virus tolerance [40]. Further studies with near-isogenic lines are recommended to confirm the effect of resistance genes on flavonoid accumulation, as these lines are genetically identical, except for the single introgressed region. This enables a more accurate evaluation of the impact of these introgressed regions, particularly the resistance genes, in this context [21].
Maintaining an outstanding functional quality is crucial for Muchamiel cultivars. Therefore, it is important to note that hybrids have conserved or improved the functional characteristics of their parents. Depending on the compound, they present a higher concentration of each secondary metabolite in either the breeding line or the traditional parent. Previous studies have suggested that the predominant gene action for traits such as secondary metabolite content is additive [25,33], which is consistent with these results. From a nutritional perspective, vitamin C is recognized for its potent antioxidant properties and its ability to donate electrons, thereby protecting DNA from oxidative damage [41]. The traditional parents were notable for their high vitamin C concentration, a trait that the hybrids have retained. Due to their antioxidant properties, carotenoids such as lycopene, β-carotene, and lutein play a crucial role in preventing chronic diseases, including cancer, cardiovascular disease, and macular degeneration [9]. Despite their limited bioavailability, xanthophylls are believed to bolster cellular defense and potentially reduce the risk of certain cancers and skin damage [42]. Breeding lines (UMH1139 and UMH1200) exhibited the highest concentrations of lycopene and β-carotene, consistent with their intense color. They also showed elevated levels of neoxanthin and violaxanthin, whereas traditional parents had higher amounts of lutein, phytoene, and phytofluene. Hybrids showed intermediate values, even though some equaled their parents in terms of lycopene, β-carotene, and neoxanthin content. Additionally, they outperformed traditional parents in phytofluene and, in the case of those with MC2 as a parent, in phytoene. Phenolic acids have been associated with anticancer effects and protection against inflammation-induced diabetic nephropathy [43]. Naringenin, the primary flavanone in tomatoes, has been shown to play a role in preventing cancer and other diseases [6]. Flavonols have been extensively studied for their pharmacological properties, including anticancer, analgesic, and anti-arthritic effects, as well as their benefits to various bodily systems [44]. All of the hybrids maintained the high concentration of chlorogenic acid (the main phenolic acid found in tomatoes) characteristic of their traditional parents. Most of the hybrids outperformed their parents in terms of concentrations of caffeic and cryptochlorogenic compounds, except for UMH1200×MC1, which matched them. The ferulic acid concentration of UMH1139×MC1 is similar to that of MC1. Among the flavonols and flavanones, the breeding lines exhibited the highest concentrations, the traditional parents, the lowest, and the hybrids, intermediate values.
Finally, as most traits are quantitative and sensitive to environmental factors, analyzing the effect of the year of culture on the development of new varieties is essential. Semi-arid zones are characterized by elevated levels of solar radiation and high summer temperatures, which can impact crop productivity and quality [45]. The yield of hybrids remained stable in both years, indicating a high productive stability. The only significant yield reduction observed in UMH1200×MC2 in 2023 is within the range of interannual variation previously reported [23]. Given the added value of this hybrid, such a reduction can be considered acceptable from the perspective of the farmer. However, visual (morphology and color), flavor-related (primary metabolites), and nutritional (secondary metabolites) quality parameters exhibited interannual variability, attributed to environmental differences between 2022 and 2023. Increased temperatures and cumulative irradiance during the fruiting period in 2023 compared to 2022 could have triggered variations in the composition of the studied fruit varieties (Supplementary Figure S1). Such conditions have been reported to favor an increase in sugars, as well as variations in organic acids [45,46,47]. Regarding the secondary metabolites, most compounds showed a reduction in 2023, which was consistent with previous studies [47], although β-carotene increased in all of the cultivars [48]. Other metabolites, such as lutein and violaxanthin in certain cases, chlorogenic acid in some cultivars, and caffeic acid, naringenin, and its derivatives under certain conditions, remained stable between years. The interannual response of these compounds varied according to the analyzed cultivar and metabolite, explaining the diversity of patterns that were observed [49]. Despite these variations, differences between parents and hybrids were maintained, indicating that the observed variability depended mainly on the genetic component, with annual environmental conditions having a minor effect.
5. Conclusions

This study demonstrates that the introduction of virus-resistance genes (Tm-2a, Sw-5 and Ty-1) into traditional Muchamiel varieties in a heterozygous state did not compromise yield or fruit quality. In contrast to previous reports on homozygous breeding lines, the evaluated hybrids did not exhibit a reduced yield; in some instances, they even outperformed their traditional parents and breeding lines, likely due to hybrid vigor, highlighting their commercial potential. Fruit morphology and visual quality were preserved, with hybrids maintaining the characteristic diameters of the traditional variety. Flavor-related quality was also retained, as there were no adverse effects on soluble sugars; in fact, glucose and fructose levels increased. Although Ty-1 negatively affected organic acid content, this effect was reduced in the heterozygous state. Furthermore, the introgression of resistance genes did not reduce the levels of secondary metabolites; instead, an increase in flavonoid concentration was observed, which could enhance the functional quality of the hybrids. Further studies using NILs are needed to clarify the specific metabolic effects of these resistance genes. Overall, the introduction of heterozygosity is a promising strategy for preserving the identity and quality of Muchamiel varieties while enhancing their resistance and market potential.

Supplementary Materials

The following supporting information can be downloaded at: https://www.mdpi.com/article/10.3390/horticulturae11070838/s1, Figure S1: Evolution of minimum, maximum and cumulative radiation during the two cycles; Table S1: Organic acids identified in the studied varieties by MS/MS approaches; Table S2: Carotenoids identified in the studied varieties by UV-vis HPLC; Table S3: Phenolic compounds identified in the studied varieties by MS/MS approaches; Table S4: Concentration of the isocitric and quinic acid (µg g−1 FW) and the p-values from a two-way ANOVA assessing the effects of variety, year and their interaction in the developed hybrids and their respective parents in 2022 and 2023 years.

Author Contributions

Conceptualization, A.S., P.F. and P.H.; Data curation, A.S., P.F. and P.H.; Formal analysis, A.S., V.H., P.F. and P.H.; Funding acquisition, P.F., S.G.-M. and P.H.; Investigation, A.S., V.H., P.F., S.G.-M., E.S. and P.H.; Methodology, A.S., J.C., P.C., N.L. and E.M.; Resources, P.F., S.G.-M., P.C., E.S. and P.H.; Software, A.S. and P.H.; Validation, V.H., P.F. and S.G.-M.; Visualization, A.S., V.H., P.F., S.G.-M. and J.F.; Writing-original draft, A.S. and P.H.; Writing-review and editing, A.S., S.G.-M. and P.H. All authors have read and agreed to the published version of the manuscript.

Funding

This research was funded by Spanish State Research Agency, project number PID2019 110221RR-C31 and grant number PRE2020-093994.

Data Availability Statement

The original contributions presented in this study are included in the article and Supplementary Materials. Further inquiries can be directed to the corresponding author.

Acknowledgments

The authors are grateful to Carlos Colomer, Inmaculada Fernández, Inmaculada Garrido, José Gomariz, Ángeles Jiménez, Jose Luis Lozano and María Molina for technical assistance.

Conflicts of Interest

The authors declare no conflicts of interest.

References

  1. Food and Agriculture Organization. FAO Statistical Datababases (FAOSTAT). Available online: https://www.fao.org/ (accessed on 10 April 2025).
  2. Ficiciyan, A.; Loos, J.; Sievers-Glotzbach, S.; Tscharntke, T. More than Yield: Ecosystem Services of Traditional versus Modern Crop Varieties Revisited. Sustainability 2018, 10, 2834. [Google Scholar] [CrossRef]
  3. Pons, C.; Casals, J.; Palombieri, S.; Fontanet, L.; Riccini, A.; Rambla, J.L.; Ruggiero, A.; Figás, M.; Rosario, D.; Plazas, M.; et al. Atlas of Phenotypic, Genotypic and Geographical Diversity Present in the European Traditional Tomato. Hortic. Res. 2022, 9, uhac112. [Google Scholar] [CrossRef]
  4. Casals, J.; Martí, M.; Rull, A.; Pons, C. Sustainable Transfer of Tomato Landraces to Modern Cropping Systems: The Effects of Environmental Conditions and Management Practices on Long-Shelf-Life Tomatoes. Agronomy 2021, 11, 533. [Google Scholar] [CrossRef]
  5. Sinesio, F.; Cammareri, M.; Cottet, V.; Fontanet, L.; Jost, M.; Moneta, E.; Palombieri, S.; Peparaio, M.; Del Castillo, R.R.; Civitelli, E.S.; et al. Sensory Traits and Consumer’s Perceived Quality of Traditional and Modern Fresh Market Tomato Varieties: A Study in Three European Countries. Foods 2021, 10, 2521. [Google Scholar] [CrossRef]
  6. Quinet, M.; Angosto, T.; Yuste-Lisbona, F.J.; Blanchard-Gros, R.; Bigot, S.; Martinez, J.P.; Lutts, S. Tomato Fruit Development and Metabolism. Front. Plant Sci. 2019, 10, 1554. [Google Scholar] [CrossRef]
  7. Tamasi, G.; Pardini, A.; Bonechi, C.; Donati, A.; Pessina, F.; Marcolongo, P.; Gamberucci, A.; Leone, G.; Consumi, M.; Magnani, A.; et al. Characterization of Nutraceutical Components in Tomato Pulp, Skin and Locular Gel. Eur. Food Res. Technol. 2019, 245, 907–918. [Google Scholar] [CrossRef]
  8. Villena, J.; Moreno, C.; Roselló, S.; Beltrán, J.; Cebolla-Cornejo, J.; Moreno, M.M. Breeding Tomato Flavor: Modeling Consumer Preferences of Tomato Landraces. Sci. Hortic. 2023, 308, 111597. [Google Scholar] [CrossRef]
  9. Friedman, M. Anticarcinogenic, Cardioprotective, and Other Health Benefits of Tomato Compounds Lycopene, α-Tomatine, and Tomatidine in Pure Form and in Fresh and Processed Tomatoes. J. Agric. Food Chem. 2013, 61, 9534–9550. [Google Scholar] [CrossRef] [PubMed]
  10. Picó, B.; Herraiz, J.; Ruiz, J.J.; Nuez, F. Widening the Genetic Basis of Virus Resistance in Tomato. Sci. Hortic. 2002, 94, 73–89. [Google Scholar] [CrossRef]
  11. Carbonell, P.; Alonso, A.; Grau, A.; Salinas, J.F.; García-Martínez, S.; Ruiz, J.J. Twenty Years of Tomato Breeding at EPSO-UMH: Transfer Resistance Fromwild Types to Local Landraces-from the First Molecular Markers to Genotyping by Sequencing (GBS). Diversity 2018, 10, 12. [Google Scholar] [CrossRef]
  12. Brommonschenkel, S.H.; Frary, A.; Frary, A.; Tanksley, S.D. The Broad-Spectrum Tospovirus Resistance Gene Sw-5 of Tomato Is a Homolog of the Root-Knot Nematode Resistance Gene Mi. Mol. Plant-Microbe Interact. 2000, 13, 1130–1138. [Google Scholar] [CrossRef]
  13. Lanfermeijer, F.C.; Dijkhuis, J.; Sturre, M.J.G.; De Haan, P.; Hille, J. Cloning and Characterization of the Durable Tomato Mosaic Virus Resistance Gene Tm-22 from Lycopersicon Esculentum. Plant Mol. Biol. 2003, 52, 1037–1049. [Google Scholar] [CrossRef]
  14. Verlaan, M.G.; Hutton, S.F.; Ibrahem, R.M.; Kormelink, R.; Visser, R.G.F.; Scott, J.W.; Edwards, J.D.; Bai, Y. The Tomato Yellow Leaf Curl Virus Resistance Genes Ty-1 and Ty-3 Are Allelic and Code for DFDGD-Class RNA-Dependent RNA Polymerases. PLoS Genet. 2013, 9, e1003399. [Google Scholar] [CrossRef] [PubMed]
  15. García-Martínez, S.; Grau, A.; Alonso, A.; Rubio, F.; Valero, M.; Ruiz, J.J. UMH 1200, a Breeding Line within the Muchamiel Tomato Type Resistant to Three Viruses. HortScience 2011, 46, 1054–1055. [Google Scholar] [CrossRef]
  16. Tanksley, S.D.; Bernachi, D.; Beck-Bunn, T.; Emmatty, D.; Eshed, Y.; Inai, S.; Lopez, J.; Petiard, V.; Sayama, H.; Uhlig, J.; et al. Yield and Quality Evaluations on a Pair of Processing Tomato Lines Nearly Isogenic for the Tm2a Gene for Resistance to the Tobacco Mosaic Virus. Euphytica 1998, 99, 77–83. [Google Scholar] [CrossRef]
  17. Lewis, R.S.; Linger, L.R.; Wolff, M.F.; Wernsman, E.A. The Negative Influence of N-Mediated TMV Resistance on Yield in Tobacco: Linkage Drag versus Pleiotropy. Theor. Appl. Genet. 2007, 115, 169–178. [Google Scholar] [CrossRef]
  18. Verlaan, M.G.; Szinay, D.; Hutton, S.F.; De Jong, H.; Kormelink, R.; Visser, R.G.F.; Scott, J.W.; Bai, Y. Chromosomal Rearrangements between Tomato and Solanum Chilense Hamper Mapping and Breeding of the TYLCV Resistance Gene Ty-1. Plant J. 2011, 68, 1093–1103. [Google Scholar] [CrossRef]
  19. Alonso, A.; García-Martínez, S.; Arroyo, A.; García-Gusano, M.; Grau, A.; Giménez-Ros, M.; Romano, M.E.; Valero, M.; Ruiz, J.J. Efecto de La Introducción de Resistencia a TYLCV (Gen Ty-1) En Caracteres Productivos y de Calidad En Tomate. Actas Hortic. 2008, 51, 173–174. [Google Scholar]
  20. García-Martínez, S.; Grau, A.; Alonso, A.; Rubio, F.; Valero, M.; Ruiz, J.J. UMH 1203, a Multiple Virus-Resistant Fresh-Market Tomato Breeding Line for Open-Field Conditions. HortScience 2012, 47, 124–125. [Google Scholar] [CrossRef]
  21. Rubio, F.; Alonso, A.; García-Martínez, S.; Ruiz, J.J. Introgression of Virus-Resistance Genes into Traditional Spanish Tomato Cultivars (Solanum lycopersicum L.): Effects on Yield and Quality. Sci. Hortic. 2016, 198, 183–190. [Google Scholar] [CrossRef]
  22. Carbonell, P.; Salinas, J.F.; Alonso, A.; Grau, A.; Cabrera, J.A.; García-Martínez, S.; Ruiz, J.J. Effect of Low Inputs and Salinity on Yield and Quality–A 3 Year Study in Virus-Resistant Tomato (Solanum lycopersicum L.) Breeding Lines and Hybrids. Sci. Hortic. 2020, 260, 108889. [Google Scholar] [CrossRef]
  23. García-Martínez, S.; Grau, A.; Alonso, A.; Rubio, F.; Carbonell, P.; Ruiz, J.J. UMH 916, UMH 972, UMH 1093, UMH 1127, AND UMH 1139: Four Freshmarket Breeding Lines Resistant to Viruses within the Muchamiel Tomato Type. HortScience 2015, 50, 927–929. [Google Scholar] [CrossRef]
  24. Flores, P.; Sánchez, E.; Fenoll, J.; Hellín, P. Genotypic Variability of Carotenoids in Traditional Tomato Cultivars. Food Res. Int. 2017, 100, 510–516. [Google Scholar] [CrossRef]
  25. Sánchez, A.S.; Flores, P.; Hernández, V.; Sánchez, E.; Molina, E.; López, N.; Rodríguez-Burruezo, A.; Fenoll, J.; Hellín, P. Fruit Agronomic and Quality Traits of Tomato F1 Hybrids Derived from Traditional Varieties. Horticulturae 2024, 10, 440. [Google Scholar] [CrossRef]
  26. Sánchez, A.; Hernández, V.; Molina, E.; Fenoll, J.; Flores, P.; Hellín, P. Characterization and Phenotypic Evaluation of Fruit Quality Traits Related to Functional and Organoleptic Quality of Spanish Tomato Landraces. J. Int. Sci. Publ. Agric. Food 2023, 11, 30–41. [Google Scholar] [CrossRef]
  27. BORM. Orden de 10 de Mayo de 2012, Por La Que Se Regulan Las Normas Técnicas de Producción Integrada En El Cultivo de Tomate. Boletín Of. Región Murcia 2012, 118, 22217–22225. [Google Scholar]
  28. Flores, P.; Hernández, V.; Hellín, P.; Fenoll, J.; Cava, J.; Mestre, T.; Martínez, V. Metabolite Profile of the Tomato Dwarf Cultivar Micro-Tom and Comparative Response to Saline and Nutritional Stresses with Regard to a Commercial Cultivar. J. Sci. Food Agric. 2016, 96, 1562–1570. [Google Scholar] [CrossRef] [PubMed]
  29. Fenoll, J.; Martínez, A.; Hellín, P.; Pilar, F. Simultaneous Determination of Ascorbic and Dehydroascorbic Acids in Vegetables and Fruits by Liquid Chromatography with Tandem-Mass Spectrometry. Food Chem. 2011, 127, 340–344. [Google Scholar] [CrossRef]
  30. Olives-Barba, A.I.; Cámara-Huerado, M.; Sánchez Mata, M.C.; Fernández-Ruiz, V.; López-Sáenz de Tejada, M. Application of a UV–Vis Detection-HPLC Method for a Rapid Determination of Lycopene and b -Carotene in Vegetables. Food Chem. 2006, 95, 328–336. [Google Scholar] [CrossRef]
  31. Motilva, M.J.; Macià, A.; Romero, M.P.; Labrador, A.; Domínguez, A.; Peiró, L. Optimisation and Validation of Analytical Methods for the Simultaneous Extraction of Antioxidants: Application to the Analysis of Tomato Sauces. Food Chem. 2014, 163, 234–243. [Google Scholar] [CrossRef]
  32. Vallverdú-Queralt, A.; Medina-Remón, A.; Martínez-Huélamo, M.; Jáuregui, O.; Andres-Lacueva, C.; Lamuela-Raventos, R.M. Phenolic Profile and Hydrophilic Antioxidant Capacity as Chemotaxonomic Markers of Tomato Varieties. J. Agric. Food Chem. 2011, 59, 3994–4001. [Google Scholar] [CrossRef]
  33. Fortuny, A.P.; Bueno, R.A.; Pereira Da Costa, J.H.; Zanor, M.I.; Rodríguez, G.R. Tomato Fruit Quality Traits and Metabolite Content Are Affected by Reciprocal Crosses and Heterosis. J. Exp. Bot. 2021, 72, 5407–5425. [Google Scholar] [CrossRef]
  34. Casals, J.; Rivera, A.; Sabaté, J.; del Castillo, R.R.; Simó, J. Cherry and Fresh Market Tomatoes: Differences in Chemical, Morphological, and Sensory Traits and Their Implications for Consumer Acceptance. Agronomy 2019, 9, 9. [Google Scholar] [CrossRef]
  35. Cabrera, J.Á.; Carbonell, P.; Salinas, J.F.; Grau, A.; Alonso, A.; Hernández, F.; Ruiz, J.J.; García-Martínez, S. Effect of Introgression of Ty-1 and Ty-5 Genes on Productivity, Quality, and Antioxidant Compounds in De La Pera Tomato Breeding Lines. Agriculture 2024, 14, 1192. [Google Scholar] [CrossRef]
  36. Ali, M.Y.; Sina, A.A.I.; Khandker, S.S.; Neesa, L.; Tanvir, E.M.; Kabir, A.; Khalil, M.I.; Gan, S.H. Nutritional Composition and Bioactive Compounds in Tomatoes and Their Impact on Human Health and Disease: A Review. Foods 2021, 10, 45. [Google Scholar] [CrossRef] [PubMed]
  37. Meza, S.L.R.; Egea, I.; Massaretto, I.L.; Morales, B.; Purgatto, E.; Egea-Fernández, J.M.; Bolarin, M.C.; Flores, F.B. Traditional Tomato Varieties Improve Fruit Quality Without Affecting Fruit Yield Under Moderate Salt Stress. Front. Plant Sci. 2020, 11, 588754. [Google Scholar] [CrossRef]
  38. Hernández, J.A.; Gullner, G.; Clemente-Moreno, M.J.; Künstler, A.; Juhász, C.; Díaz-Vivancos, P.; Király, L. Oxidative Stress and Antioxidative Responses in Plant–Virus Interactions. Physiol. Mol. Plant Pathol. 2016, 94, 134–148. [Google Scholar] [CrossRef]
  39. Lv, J.; Deng, M.; Li, Z.; Zhu, H.; Wang, Z.; Yue, Y.; Yang, Z.; Xu, J.; Jiang, S.; Zhao, W.; et al. Integrative Analysis of the Transcriptome and Metabolome Reveals the Response Mechanism to Tomato Spotted Wilt Virus. Hortic. Plant J. 2023, 9, 958–970. [Google Scholar] [CrossRef]
  40. Sade, D.; Shriki, O.; Cuadros-Inostroza, A.; Tohge, T.; Semel, Y.; Haviv, Y.; Willmitzer, L.; Fernie, A.R.; Czosnek, H.; Brotman, Y. Comparative Metabolomics and Transcriptomics of Plant Response to Tomato Yellow Leaf Curl Virus Infection in Resistant and Susceptible Tomato Cultivars. Metabolomics 2015, 11, 81–97. [Google Scholar] [CrossRef]
  41. Scarano, A.; Olivieri, F.; Gerardi, C.; Liso, M.; Chiesa, M.; Chieppa, M.; Frusciante, L.; Barone, A.; Santino, A.; Rigano, M.M. Selection of Tomato Landraces with High Fruit Yield and Nutritional Quality under Elevated Temperatures. J. Sci. Food Agric. 2020, 100, 2791–2799. [Google Scholar] [CrossRef]
  42. Abdel-Aal, E.-S.M.; Akhtar, H.; Zaheer, K.; Ali, R. Dietary Sources of Lutein and Zeaxanthin Carotenoids and Their Role in Eye Health. Nutrients 2013, 5, 1169–1185. [Google Scholar] [CrossRef]
  43. Tommonaro, G.; De Prisco, R.; Abbamondi, G.R.; Marzocco, S.; Saturnino, C.; Poli, A.; Nicolaus, B. Evaluation of Antioxidant Properties, Total Phenolic Content, and Biological Activities of New Tomato Hybrids of Industrial Interest. J. Med. Food 2012, 15, 483–489. [Google Scholar] [CrossRef]
  44. Tieman, D.; Zhu, G.; Resende, M.F.R.; Lin, T.; Nguyen, C.; Bies, D.; Rambla, J.L.; Beltran, K.S.O.; Taylor, M.; Zhang, B.; et al. A Chemical Genetic Roadmap to Improved Tomato Flavor. Science 2017, 355, 391–394. [Google Scholar] [CrossRef]
  45. Rosales, M.A.; Cervilla, L.M.; Sánchez-Rodríguez, E.; Rubio-Wilhelmi, M.d.M.; Blasco, B.; Ríos, J.J.; Soriano, T.; Castilla, N.; Romero, L.; Ruiz, J.M. The Effect of Environmental Conditions on Nutritional Quality of Cherry Tomato Fruits: Evaluation of Two Experimental Mediterranean Greenhouses. J. Sci. Food Agric. 2011, 91, 152–162. [Google Scholar] [CrossRef]
  46. Gautier, H.; Diakou-Verdin, V.; Bénard, C.; Reich, M.; Buret, M.; Bourgaud, F.; Poëssel, J.L.; Caris-Veyrat, C.; Génard, M. How Does Tomato Quality (Sugar, Acid, and Nutritional Quality) Vary with Ripening Stage, Temperature, and Irradiance? J. Agric. Food Chem. 2008, 56, 1241–1250. [Google Scholar] [CrossRef] [PubMed]
  47. Hernández, V.; Hellín, P.; Fenoll, J.; Flores, P. Increased Temperature Produces Changes in the Bioactive Composition of Tomato, Depending on Its Developmental Stage. J. Agric. Food Chem. 2015, 63, 2378–2382. [Google Scholar] [CrossRef] [PubMed]
  48. Delgado-Vargas, V.A.; Ayala-Garay, O.J.; Arévalo-Galarza, M.d.M.; Gautier, H. Increased Temperature Affects Tomato Fruit Physicochemical Traits at Harvest Depending on Fruit Developmental Stage and Genotype. Horticulturae 2023, 9, 212. [Google Scholar] [CrossRef]
  49. Fibiani, M.; Paolo, D.; Leteo, F.; Campanelli, G.; Picchi, V.; Bianchi, G.; Lo Scalzo, R. Influence of Year, Genotype and Cultivation System on Nutritional Values and Bioactive Compounds in Tomato (Solanum lycopersicum L.). Food Chem. 2022, 389, 133090. [Google Scholar] [CrossRef]
Figure 1. Images of eight cultivars: traditional varieties (A) MC1, (B) MC2; breeding lines (C) UMH1139, (D) UMH1200; developed hybrids (E) UMH1139×MC1, (F) UMH1200×MC1, (G) UMH1139×MC2, and (H) UMH1200×MC2.
Horticulturae 11 00838 g001
Figure 2. Concentrations of glucose and fructose (mg g−1 FW) in the developed hybrids and their respective parents in 2022 and 2023. Different letters indicate significant differences between genotypes within each year according to Duncan’s test at p < 0.05: lowercase letters for 2022 and uppercase letters for 2023. Statistical significance of the main effects (variety, year, and interaction) is provided in Table 3. Values are means ± SE (n = 6).
Horticulturae 11 00838 g002
Figure 3. Concentration of the main organic acids (citric, glutamic, and malic acids) (mg g−1 FW) in the developed hybrids and their respective parents for 2022 and 2023. Different letters indicate significant differences between genotypes within each year according to Duncan’s test at p < 0.05: lowercase letters for 2022 and uppercase letters for 2023. Statistical significance of the main effects (variety, year, and interaction) is provided in Table 3. Values are means ± SE (n = 6).
Horticulturae 11 00838 g003
Figure 4. Concentration of vitamin C (µg g−1 FW) in the developed hybrids and their respective parents in 2022 and 2023. Different letters indicate significant differences between genotypes within each year according to Duncan’s test at p < 0.05: lowercase letters for 2022 and uppercase letters for 2023. Statistical significance of the main effects (variety, year, and interaction) is provided in Table 4. Values are means ± SE (n = 6).
Horticulturae 11 00838 g004
Figure 5. Concentrations of lycopene, β-carotene, phytoene and phytofluene (µg g−1 FW) in the developed hybrids and their respective parents in 2022 and 2023. Different letters indicate significant differences between genotypes within each year according to Duncan’s test at p < 0.05: lowercase letters for 2022 and uppercase letters for 2023. Statistical significance of the main effects (variety, year, and interaction) is provided in Table 4. Values are means ± SE (n = 6).
Horticulturae 11 00838 g005
Table 1. Genotypes of the resistance genes Tm-2a (tomato mosaic virus), Sw-5 (tomato spotted wilt virus) and Ty-1 (tomato yellow leaf curl virus) in traditional varieties, breeding lines and developed hybrids (RR: resistant homozygous; rr: susceptible homozygous; Rr: heterozygous).
TypeCultivarGenotype
Tm-2aSw-5Ty-1
Traditional varietyMC1 (BGMU0753)rrrrrr
MC2 (BGMU0672)rrrrrr
Breeding lineUMH1200RRRRRR
UMH1139RRRRrr
Developed hybridUMH1200×MC1RrRrRr
UMH1200×MC2RrRrRr
UMH1139×MC1RrRrrr
UMH1139×MC2RrRrrr
Table 2. Yield (kg plant−1), longitudinal diameter (LD; mm), equatorial diameter (ED; mm), chroma (C*) and hue angle (h°) and the p-values from ANOVA for the effects of variety, year and variety × year interaction in the developed hybrids and their respective parents during the years 2022 and 2023.
YieldLDEDC*
2022202320222023202220232022202320222023
UMH11392.8 ± 0.22.5 ± 0.258 ± 156 ± 193 ± 4 a85 ± 1 a42 ± 1 c39 ± 1 c48 ± 1 c54 ± 1 c
MC12.6 ± 0.32.5 ± 0.157 ± 159 ± 192 ± 3 a92 ± 2 a29 ± 1 a24 ± 1 a36 ± 1 a37 ± 1 a
UMH1139×MC13.2 ± 0.43.1 ± 0.459 ± 257 ± 1100 ± 2 b95 ± 3 b34 ± 1 b32 ± 1 b46 ± 1 b45 ± 1 b
Variety0.1050.6540.003 **0 ***0 ***
Year0.4650.5680.024 *0 ***0.001 **
Variety × Year0.9340.3070.5420.0740 ***
UMH12002.5 ± 0.1 a2.5 ± 0.3 a56 ± 1 a54 ± 1 a87 ± 3 a81 ± 2 a44 ± 1 c37 ± 1 c50 ± 1 c50 ± 1 c
MC12.6 ± 0.3 a2.5 ± 0.1 a57 ± 1 b59 ± 1 b92 ± 3 b92 ± 2 b29 ± 1 a24 ± 1 a36 ± 1 a37 ± 1 a
UMH1200×MC13.2 ± 0.3 b3.0 ± 0.1 b58 ± 1 b57 ± 1 b95 ± 3 b93 ± 2 b35 ± 1 b28 ± 1 b46 ± 1 b47 ± 1 b
Variety0.015 *0.012 *0.001 **0 ***0 ***
Year0.5470.6910.1530 ***0.133
Variety × Year0.9450.2280.8280.3530.138
UMH11392.8 ± 0.22.5 ± 0.258 ± 1 a56 ± 1 a93 ± 4 a85 ± 1 a42 ± 1 c39 ± 1 c48 ± 1 c54 ± 1 c
MC23.4 ± 0.42.5 ± 0.262 ± 2 b63 ± 1 b104 ± 3 b106 ± 3 b29 ± 1 a27 ± 1 a38 ± 1 a43 ± 1 a
UMH1139×MC23.5 ± 0.43.2 ± 0.262 ± 2 b60 ± 1 b107 ± 2 b101 ± 2 b36 ± 1 b32 ± 1 b46 ± 1 b50 ± 1 b
Variety0.1290 ***0 ***0 ***0 ***
Year0.0550.2070.030 *0 ***0 ***
Variety × Year0.5050.3560.1440.7320.723
UMH12002.5 ± 0.1 a2.5 ± 0.3 a56 ± 1 a54 ± 1 a87 ± 3 a81 ± 2 a44 ± 1 c37 ± 1 c50 ± 1 c50 ± 1 b
MC23.4 ± 0.4 a2.5 ± 0.2 a62 ± 2 b63 ± 1 b104 ± 3 b106 ± 3 b29 ± 1 a27 ± 1 a38 ± 1 a43 ± 1 a
UMH1200×MC24.0 ± 0.2 b3.5 ± 0.1 b63 ± 1 b60 ± 1 b109 ± 3 b101 ± 2 b37 ± 1 b34 ± 1 b47 ± 1 b49 ± 1 b
Variety0.001 *0 ***0 ***0 ***0 ***
Year0.024 **0.1450.0920 ***0.009 **
Variety × Year0.2130.2570.2490.005 **0.019 *
*, **, *** Significant differences between means at a 5, 1 or 0.1% probability levels, respectively. Different letters in the same column indicate significant differences between genotypes within each year according to Duncan’s test at p < 0.05. Values are means ± SE (n = 6).
Table 3. p-values from a two-way ANOVA assessing the effects of variety, year and their interaction on concentrations of soluble sugars and organic acids. Each analysis was performed separately for each hybrid and its two corresponding parental lines, which are grouped under the hybrid name in the table.
EffectGlucoseFructoseCitric AcidGlutamic AcidMalic Acid
UMH1139×MC1Variety0 ***0 ***0 ***0 ***0.001 **
Year0.05 **0 ***0.012 *0 ***0.609
Variety × Year0.7850.5170.033 *0.0850.001 **
UMH1200×MC1Variety0 ***0 ***0 ***0 ***0 ***
Year0.025 *0 ***0.022 *0 ***0.933
Variety × Year0.5390.7700 ***0.1900.026 *
UMH1139×MC2Variety0 ***0 ***0 ***0.001 **0.024 *
Year0.024 *0 ***0 ***0 ***0 ***
Variety × Year0.8190.2490 ***0.3150.035 *
UMH1200×MC2Variety0 ***0 ***0 ***0 ***0 ***
Year0 ***0 ***0 ***0 ***0 ***
Variety × Year0.2560.0990.1140.3590.042 *
*, **, *** Significant differences between means at a 5, 1 or 0.1% level of probability, respectively.
Table 4. p-values from a two-way ANOVA assessing the effects of variety, year and their interaction on vitamin C and carotenoid concentrations. Each analysis was performed separately for each hybrid and its two corresponding parental lines, which are grouped under the hybrid name in the table.
EffectVitamin CLycopeneβ-CarotenePhytoenePhytofluene
UMH1139×MC1Variety0 ***0 ***0 ***0 ***0 ***
Year0 ***0 ***0 ***0 ***0 ***
Variety × Year0.4390.002 **0.5520.1120.002 **
UMH1200×MC1Variety0 ***0 ***0 ***0 ***0 ***
Year0 ***0 ***0 ***0 ***0 ***
Variety × Year0.4400.2250.4540.4690.039 *
UMH1139×MC2Variety0 ***0 ***0 ***0 ***0 ***
Year0 ***0 ***0 ***0 ***0 ***
Variety × Year0.1160.1590.4590.034 *0.008 **
UMH1200×MC2Variety0 ***0 ***0 ***0 ***0 ***
Year0.002 **0 ***0 ***0 ***0 ***
Variety × Year0.1370.1690.4600.048 *0.020 *
*, **, *** Significant differences between means at a 5, 1 or 0.1% level of probability, respectively.
Table 5. Concentrations of δ-carotene, lutein, neoxanthin, and violaxanthin (µg g−1 FW) and the p-values from a two-way ANOVA assessing the effects of variety, year and their interaction in the developed hybrids and their respective parents in 2022 and 2023 years.
δ-CaroteneLuteinNeoxanthinViolaxanthin
20222023202220232022202320222023
UMH11394.42 ± 0.08 ab3.22 ± 0.05 ab1.80 ± 0.03 a1.57 ± 0.03 a0.15 ± 0.010.22 ± 0.010.71 ± 0.01 c0.67 ± 0.02 c
MC14.17 ± 0.08 a3.04 ± 0.15 a2.21 ± 0.05 c2.33 ± 0.11 c0.16 ± 0.010.19 ± 0.020.55 ± 0.01 a0.52 ± 0.02 a
UMH1139×MC14.74 ± 0.05 b3.22 ± 0.03 b2.05 ± 0.04 b2.04 ± 0.05 b0.18 ± 0.010.21 ± 0.010.61 ± 0.02 b0.61 ± 0.01 b
Variety0.007 **0 ***0.0890 ***
Year0 ***0.3700 ***0.098
Variety × Year0.1980.2210.2220.500
UMH12004.45 ± 0.13 b4.11 ± 0.17 b1.78 ± 0.05 a1.78 ± 0.02 a0.19 ± 0.01 b0.25 ± 0.02 b0.84 ± 0.01 c0.69 ± 0.03 b
MC14.17 ± 0.08 a3.04 ± 0.15 a2.21 ± 0.05 c2.33 ± 0.11 c0.16 ± 0.01 a0.19 ± 0.02 a0.55 ± 0.01 a0.52 ± 0.02 a
UMH1200×MC14.54 ± 0.12 b3.88 ± 0.07 b2.10 ± 0.04 b2.06 ± 0.05 b0.19 ± 0.01 b0.24 ± 0.01 b0.59 ± 0.01 b0.63 ± 0.03 b
Variety0 ***0 ***0 ***0 ***
Year0 ***0.6060 ***0.009 **
Variety × Year0.1120.4410.4300 ***
UMH11394.42 ± 0.08 b3.22 ± 0.05 b1.80 ± 0.03 a1.57 ± 0.03 a0.15 ± 0.01 c0.22 ± 0.01 c0.71 ± 0.01 b0.67 ± 0.02 b
MC23.95 ± 0.09 a2.63 ± 0.15a2.01 ± 0.05 b2.04 ± 0.06 b0.10 ± 0.01 a0.13 ± 0.01 a0.63 ± 0.01 a0.55 ± 0.01 a
UMH1139×MC24.61 ± 0.05 c3.44 ± 0.02 c1.94 ± 0.03 b2.00 ± 0.07 b0.13 ± 0.01 b0.18 ± 0.01 b0.63 ± 0.03 a0.53 ± 0.01 a
Variety0 ***0 ***0 ***0 ***
Year0 ***0.2140 ***0 ***
Variety × Year0.6290.0690.5590.304
UMH12004.45 ± 0.13 b4.11 ± 0.17 b1.78 ± 0.05 a1.78 ± 0.02 a0.19 ± 0.01 c0.25 ± 0.02 c0.84 ± 0.01 b0.69 ± 0.03 b
MC23.95 ± 0.09 a2.63 ± 0.15 a2.01 ± 0.05 b2.04 ± 0.06 b0.10 ± 0.01 a0.13 ± 0.01 a0.63 ± 0.01 a0.55 ± 0.01 a
UMH1200×MC24.90 ± 0.11 c4.72 ± 0.06 c1.99 ± 0.03 b1.95 ± 0.03 b0.13 ± 0.01 b0.17 ± 0.01 b0.62 ± 0.03 a0.57 ± 0.01 a
Variety0 ***0 ***0 ***0 ***
Year0 ***0.9370 ***0 ***
Variety × Year0.0710.7080.0720.062
**, *** Significant differences between means at a 1 or 0.1% level of probability, respectively. Different letters in the same column indicate significant differences between genotypes within each year according to Duncan’s test at p < 0.05. Values are means ± SE (n = 6).
Table 6. Concentration of the main phenolic acids (µg g−1 FW) and the p-values from a two-way ANOVA assessing the effects of variety, year and their interaction in the developed hybrids and their respective parents in 2022 and 2023 years.
Chlorogenic AcidH-O-HCaffeic and DerFerulic and DerCryptochlorogenic Acid
2022202320222023202220232022202320222023
UMH11395.3 ± 0.4 a5.6 ± 0.1 a4.9 ± 0.1 a2.3 ± 0.1 a1.8 ± 0.1 a2.1 ± 0.1 a1.3 ± 0.2 a1.1 ± 0.1 a1.2 ± 0.2 ab1.0 ± 0.1 a
MC18.6 ± 1.3 b6.8 ± 0.2 b5.5 ± 0.6 b3.5 ± 0.4 b2.0 ± 0.1 a1.9 ± 0.2 a2.2 ± 0.4 b1.8 ± 0.1 b1.0 ± 0.1 a0.8 ± 0.1 a
UMH1139×MC18.6 ± 0.9 b9.4 ± 0.6 c7.4 ± 1.4 c5.4 ± 0.6 c2.7 ± 0.1 b3.0 ± 0.3 b2.1 ± 0.1 b1.8 ± 0.1 b1.4 ± 0.1 b1.7 ± 0.3 b
Variety0 ***0 ***0 ***0 ***0 ***
Year0.5720 ***0.033 *0.005 **0.390
Variety × Year0.021 *0.8600.0690.6180.013 *
UMH12005.9 ± 0.9 a4.6 ± 0.4 a6.3 ± 0.6 b2.6 ± 0.2 a1.2 ± 0.1 a1.5 ± 0.1 a1.0 ± 0.1 a0.8 ± 0.1 a1.3 ± 0.1 b0.9 ± 0.1 b
MC18.6 ± 1.3 b6.9 ± 0.2 b5.5 ± 0.6 a3.5 ± 0.4 b2.0 ± 0.1 b1.9 ± 0.2 b2.2 ± 0.4 c1.8 ± 0.1 c1.0 ± 0.1 a0.8 ± 0.1 a
UMH1200×MC18.7 ± 0.4 b7.2 ± 0.1 b7.1 ± 0.7 b3.3 ± 0.3 b2.1 ± 0.3 b2.3 ± 0.1 b1.7 ± 0.1 b1.5 ± 0.1 b1.3 ± 0.2 b1.1 ± 0.1 b
Variety0 ***0.050 *0 ***0 ***0.004 **
Year0 ***0 ***0.1810.010 *0 ***
Variety × Year0.8800.013 *0.1490.3290.224
UMH11395.3 ± 0.4 a5.6 ± 0.1 a4.9 ± 0.1 a2.3 ± 0.1 a1.8 ± 0.1 b2.1 ± 0.1 b1.3 ± 0.2 a1.1 ± 0.1 a1.2 ± 0.2 a1.0 ± 0.1 a
MC28.0 ± 1.9 b7.2 ± 0.9 b7.0 ± 0.5 b2.6 ± 0.2 a1.6 ± 0.1 a1.7 ± 0.2 a3.1 ± 0.2 c1.8 ± 0.1 c1.3 ± 0.1 a0.8 ± 0.1 a
UMH1139×MC28.0 ± 0.8 b7.9 ± 0.8 b6.9 ± 0.3 b3.5 ± 0.2 b2.2 ± 0.1 c2.2 ± 0.1 b1.9 ± 0.1 b1.5 ± 0.1 b1.5 ± 0.1 b1.2 ± 0.1 b
Variety0.001 **0 ***0 ***0 ***0 ***
Year0.7070 ***0.038 *0 ***0 ***
Variety × Year0.7130 ***0.017 *0 ***0.199
UMH12005.9 ± 0.9 a4.6 ± 0.4 a6.3 ± 0.6 a2.6 ± 0.2 a1.2 ± 0.1 a1.5 ± 0.1 a1.0 ± 0.1 a0.8 ± 0.1 a1.3 ± 0.1 a0.9 ± 0.1 a
MC28.0 ± 1.9 b7.2 ± 0.9 b7.0 ± 0.5 a2.6 ± 0.2 a1.6 ± 0.1 b1.7 ± 0.2 b3.1 ± 0.2 c1.8 ± 0.1 b1.3 ± 0.1 a0.8 ± 0.1 a
UMH1200×MC26.8 ± 1.9 b8.9 ± 0.8 b8.2 ± 0.4 b4.2 ± 0.4 b1.8 ± 0.1 c2.2 ± 0.1 c2.1 ± 0.1 b1.5 ± 0.1 b1.5 ± 0.1 b1.0 ± 0.1 b
Variety0.005 **0 ***0 ***0 ***0 ***
Year0.9800 ***0.002 **0 ***0 ***
Variety × Year0.1000.4010.2040 ***0.895
*, **, *** Significant differences between means at a 5, 1 or 0.1% probability levels, respectively. Different letters in the same column indicate significant differences between genotypes within each year according to Duncan’s test at p < 0.05. Values are means ± SE (n = 6).
Table 7. Concentration of the main flavonols and flavanones (µg g−1 FW) and the p-values from a two-way ANOVA assessing the effects of variety, year and their interaction in the developed hybrids and their respective parents in 2022 and 2023 years.
Rutina and DerK-3-o-RNaringenin and DerPhloretin
20222023202220232022202320222023
UMH11391.37 ± 0.02 c0.73 ± 0.11 c1.25 ± 0.08 c0.88 ± 0.12 c0.21 ± 0.02 b0.21 ± 0.02 b0.37 ± 0.01 c0.38 ± 0.03 c
MC10.09 ± 0.02 a0.08 ± 0.01 a0.09 ± 0.01 a0.09 ± 0.01 a0.06 ± 0.01 a0.04 ± 0.01 a0.02 ± 0.01 a0.00 ± 0.01 a
UMH1139×MC10.35 ± 0.09 b0.26 ± 0.01 b0.38 ± 0.03 b0.37 ± 0.01 b0.20 ± 0.03 b0.18 ± 0.03 b0.11 ± 0.02 b0.09 ± 0.01 b
Variety0 ***0 ***0 ***0 ***
Year0 ***0.001 **0.2050.483
Variety × Year0 ***0 ***0.7260.425
UMH12001.91 ± 0.12 c0.61 ± 0.02 c1.71 ± 0.13 c0.69 ± 0.02 c0.26 ± 0.06 c0.20 ± 0.03 c0.50 ± 0.09 b0.38 ± 0.07 b
MC10.09 ± 0.02 a0.08 ± 0.01 a0.09 ± 0.01 a0.09 ± 0.01 a0.06 ± 0.01 a0.04 ± 0.01 a0.02 ± 0.01 a0.00 ± 0.01 a
UMH1200×MC10.24 ± 0.02 b0.28 ± 0.01 b0.27 ± 0.03 b0.26 ± 0.01 b0.15 ± 0.02 b0.13 ± 0.02 b0.09 ± 0.01 a0.05 ± 0.01 a
Variety0 ***0 ***0 ***0 ***
Year0 ***0 ***0.048 *0.001 **
Variety × Year0 ***0 ***0.4710.019 *
UMH11391.37 ± 0.02 c0.73 ± 0.11 c1.25 ± 0.08 c0.88 ± 0.12 c0.21 ± 0.02 c0.21 ± 0.02 c0.37 ± 0.01 c0.38 ± 0.03 c
MC20.12 ± 0.03 a0.09 ± 0.01 a0.05 ± 0.02 a0.07 ± 0.01 a0.06 ± 0.01 a0.03 ± 0.01 a0.01 ± 0.01 a0.00 ± 0.01 a
UMH1139×MC20.43 ± 0.04 b0.30 ±0.04 b0.34 ± 0.01 b0.33 ± 0.02 b0.20 ± 0.01 b0.15 ± 0.03 b0.11 ± 0.01 b0.09 ± 0.02 b
Variety0 ***0 ***0 ***0 ***
Year0 ***0.001 **0.011 *0.238
Variety × Year0 ***0 ***0.1460.192
UMH12001.91 ± 0.12 c0.61 ± 0.02 c1.71 ± 0.13 c0.69 ± 0.02 c0.26 ± 0.06 c0.20 ± 0.03 c0.50 ± 0.09 c0.38 ± 0.07 c
MC20.12 ± 0.03 a0.09 ± 0.01 a0.05 ± 0.02 a0.07 ± 0.01 a0.06 ± 0.01 a0.03 ± 0.01 a0.01 ± 0.01 a0.00 ± 0.01 a
UMH1200×MC20.40 ± 0.07 b0.27 ± 0.06 b0.29 ± 0.04 b0.34 ± 0.03 b0.18 ± 0.04 b0.17 ± 0.01 b0.12 ± 0.01 b0.07 ± 0.01 b
Variety0 ***0 ***0 ***0 ***
Year0 ***0 ***0.0750.001 **
Variety × Year0 ***0 ***0.4710.018 *
*, **, *** Significant differences between means at a 5, 1 or 0.1% probability levels, respectively. Different letters in the same column indicate significant differences between genotypes within each year according to Duncan’s test at p < 0.05. Values are means ± SE (n = 6).
Disclaimer/Publisher’s Note: The statements, opinions and data contained in all publications are solely those of the individual author(s) and contributor(s) and not of MDPI and/or the editor(s). MDPI and/or the editor(s) disclaim responsibility for any injury to people or property resulting from any ideas, methods, instructions or products referred to in the content.