
Evaluation of Nutrient Composition and Bioactive Substances in Water Caltrop from Different Origins

 , and
, and
Abstract
1. Introduction
2. Materials and Methods
2.1. Plant Material
2.2. Methodologies
2.2.1. Sample Preparation
2.2.2. Appearance and Color Difference
2.2.3. Texture
2.2.4. Water Content and Browning Degree
2.2.5. Soluble Sugar Content, Starch Content, Soluble Protein Content, and Soluble Solids Content
2.2.6. Vitamin C (VC) Content, Total Phenolic Content, Total Flaonoid Content, and DPPH Radical Scavenging Rate
2.2.7. Statistical Analysis
3. Results
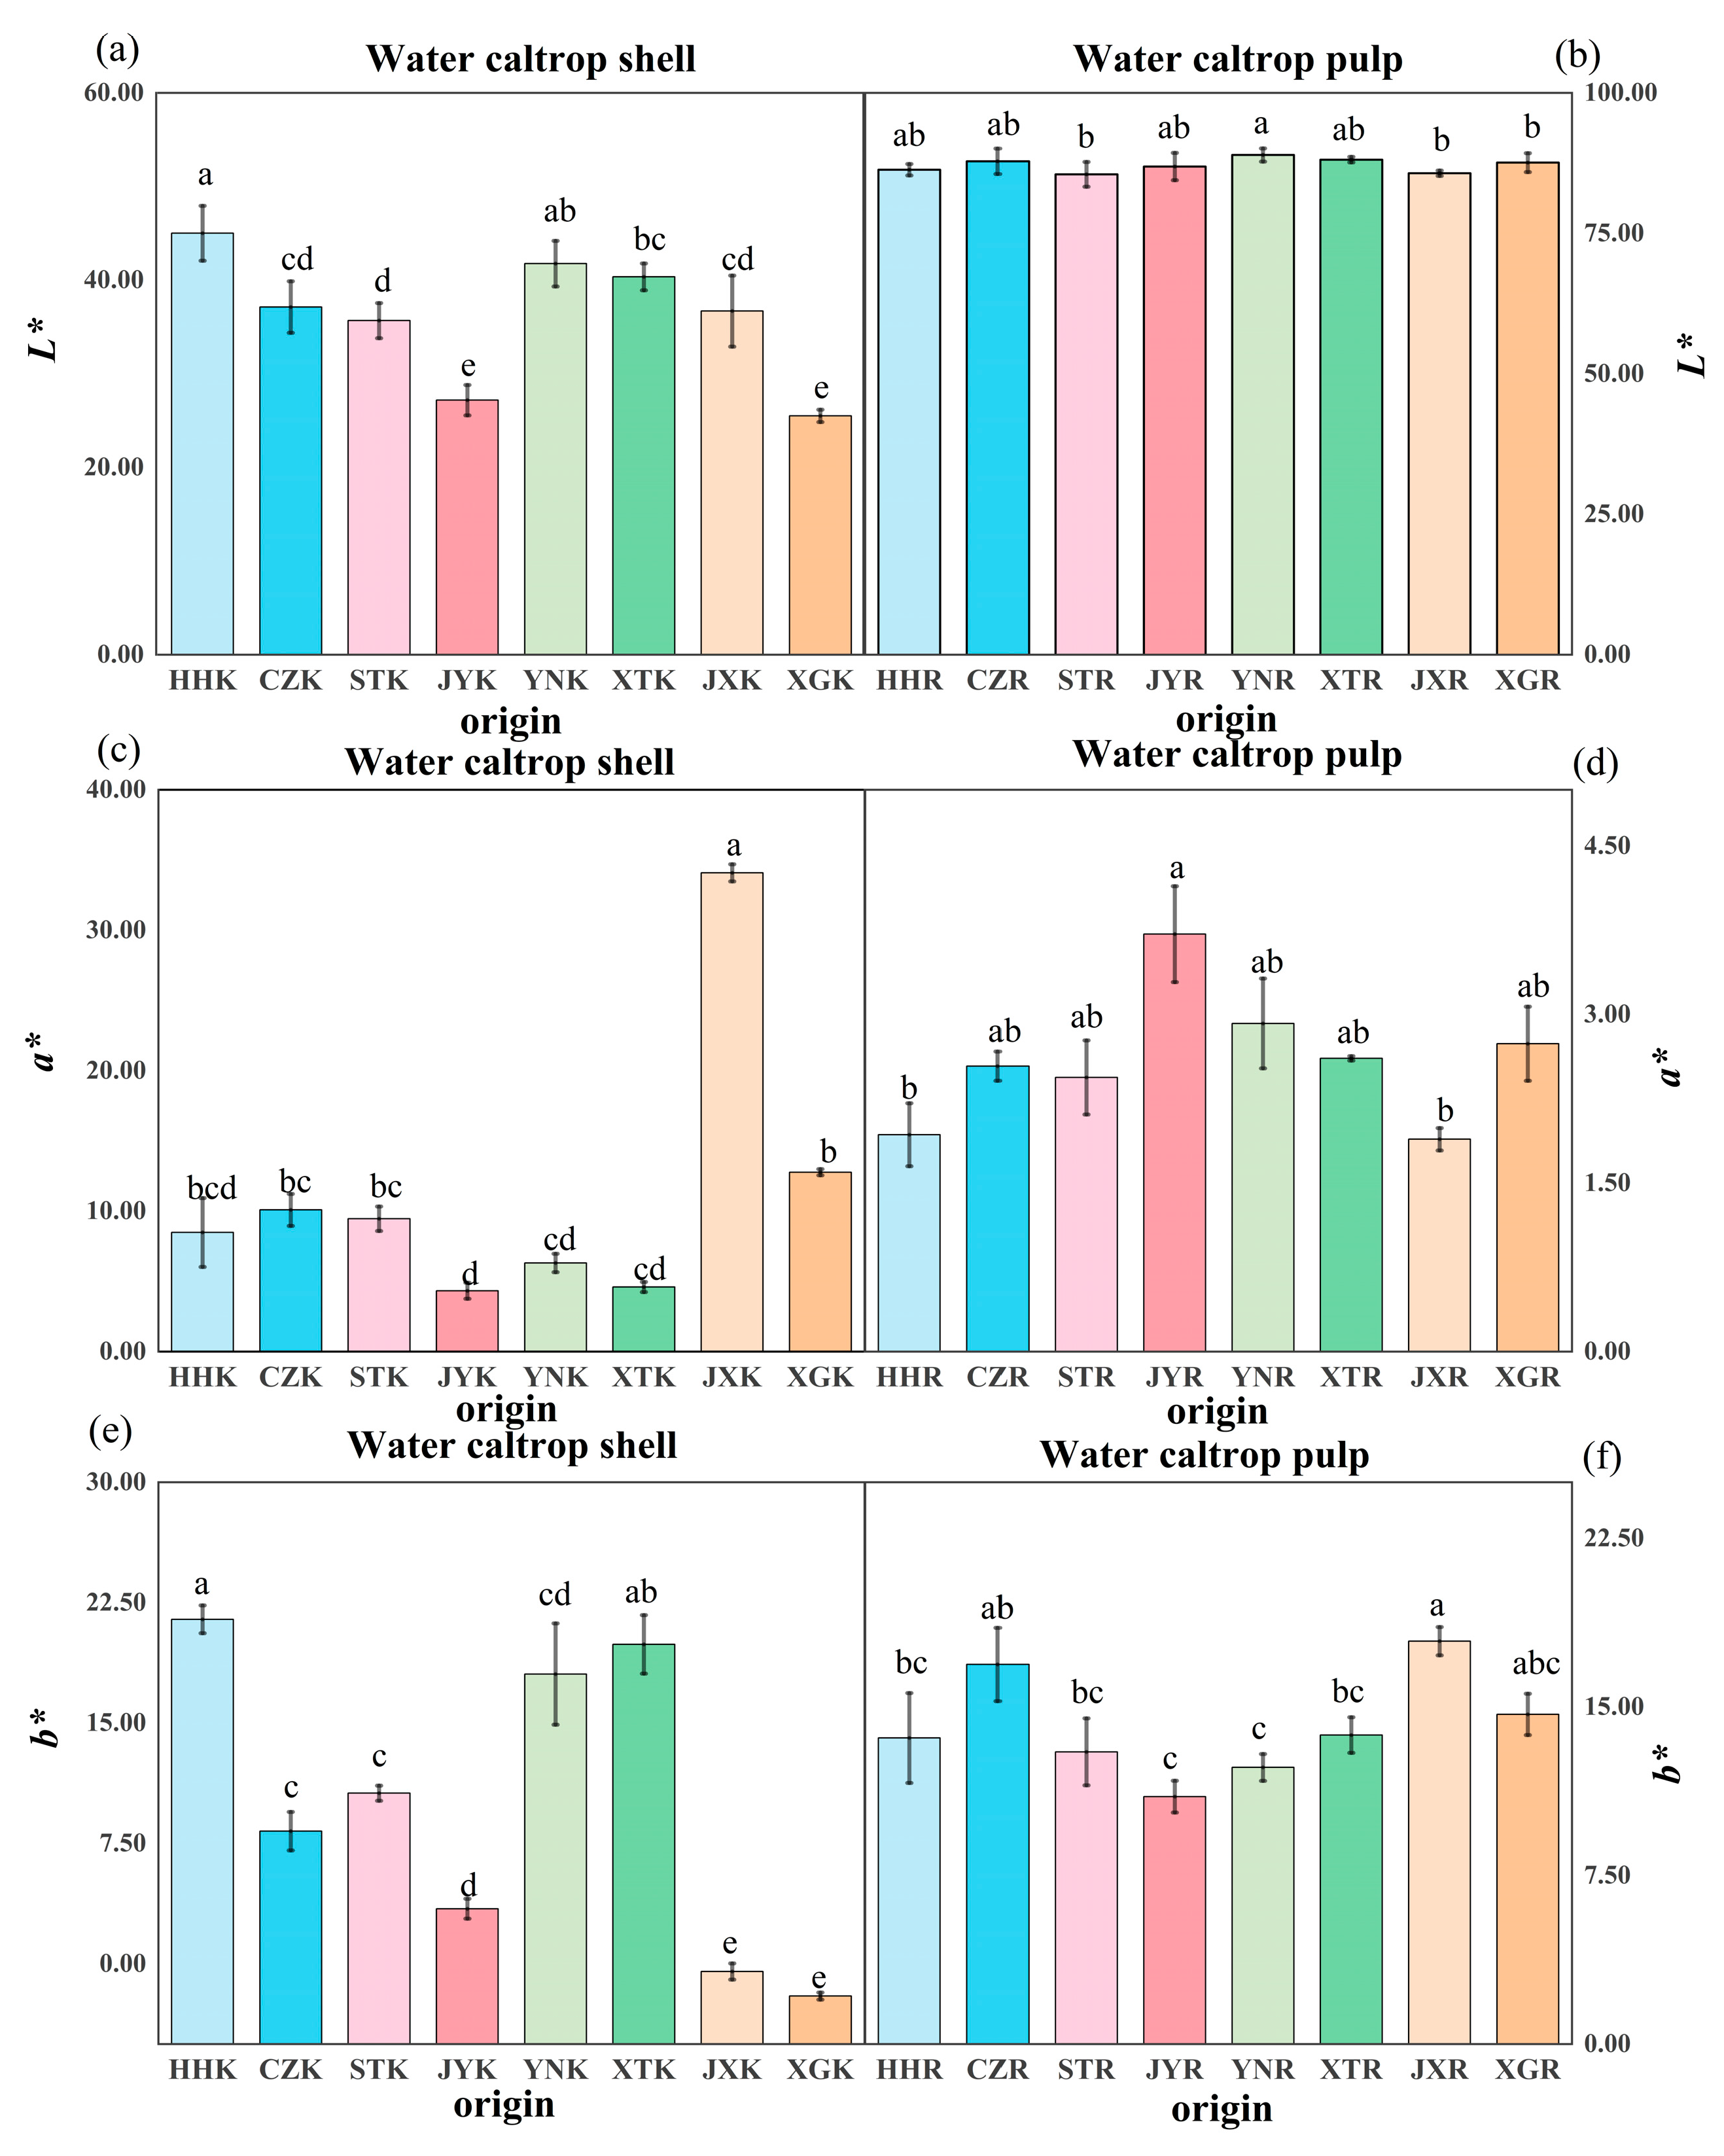
3.1. Appearance
3.2. Texture
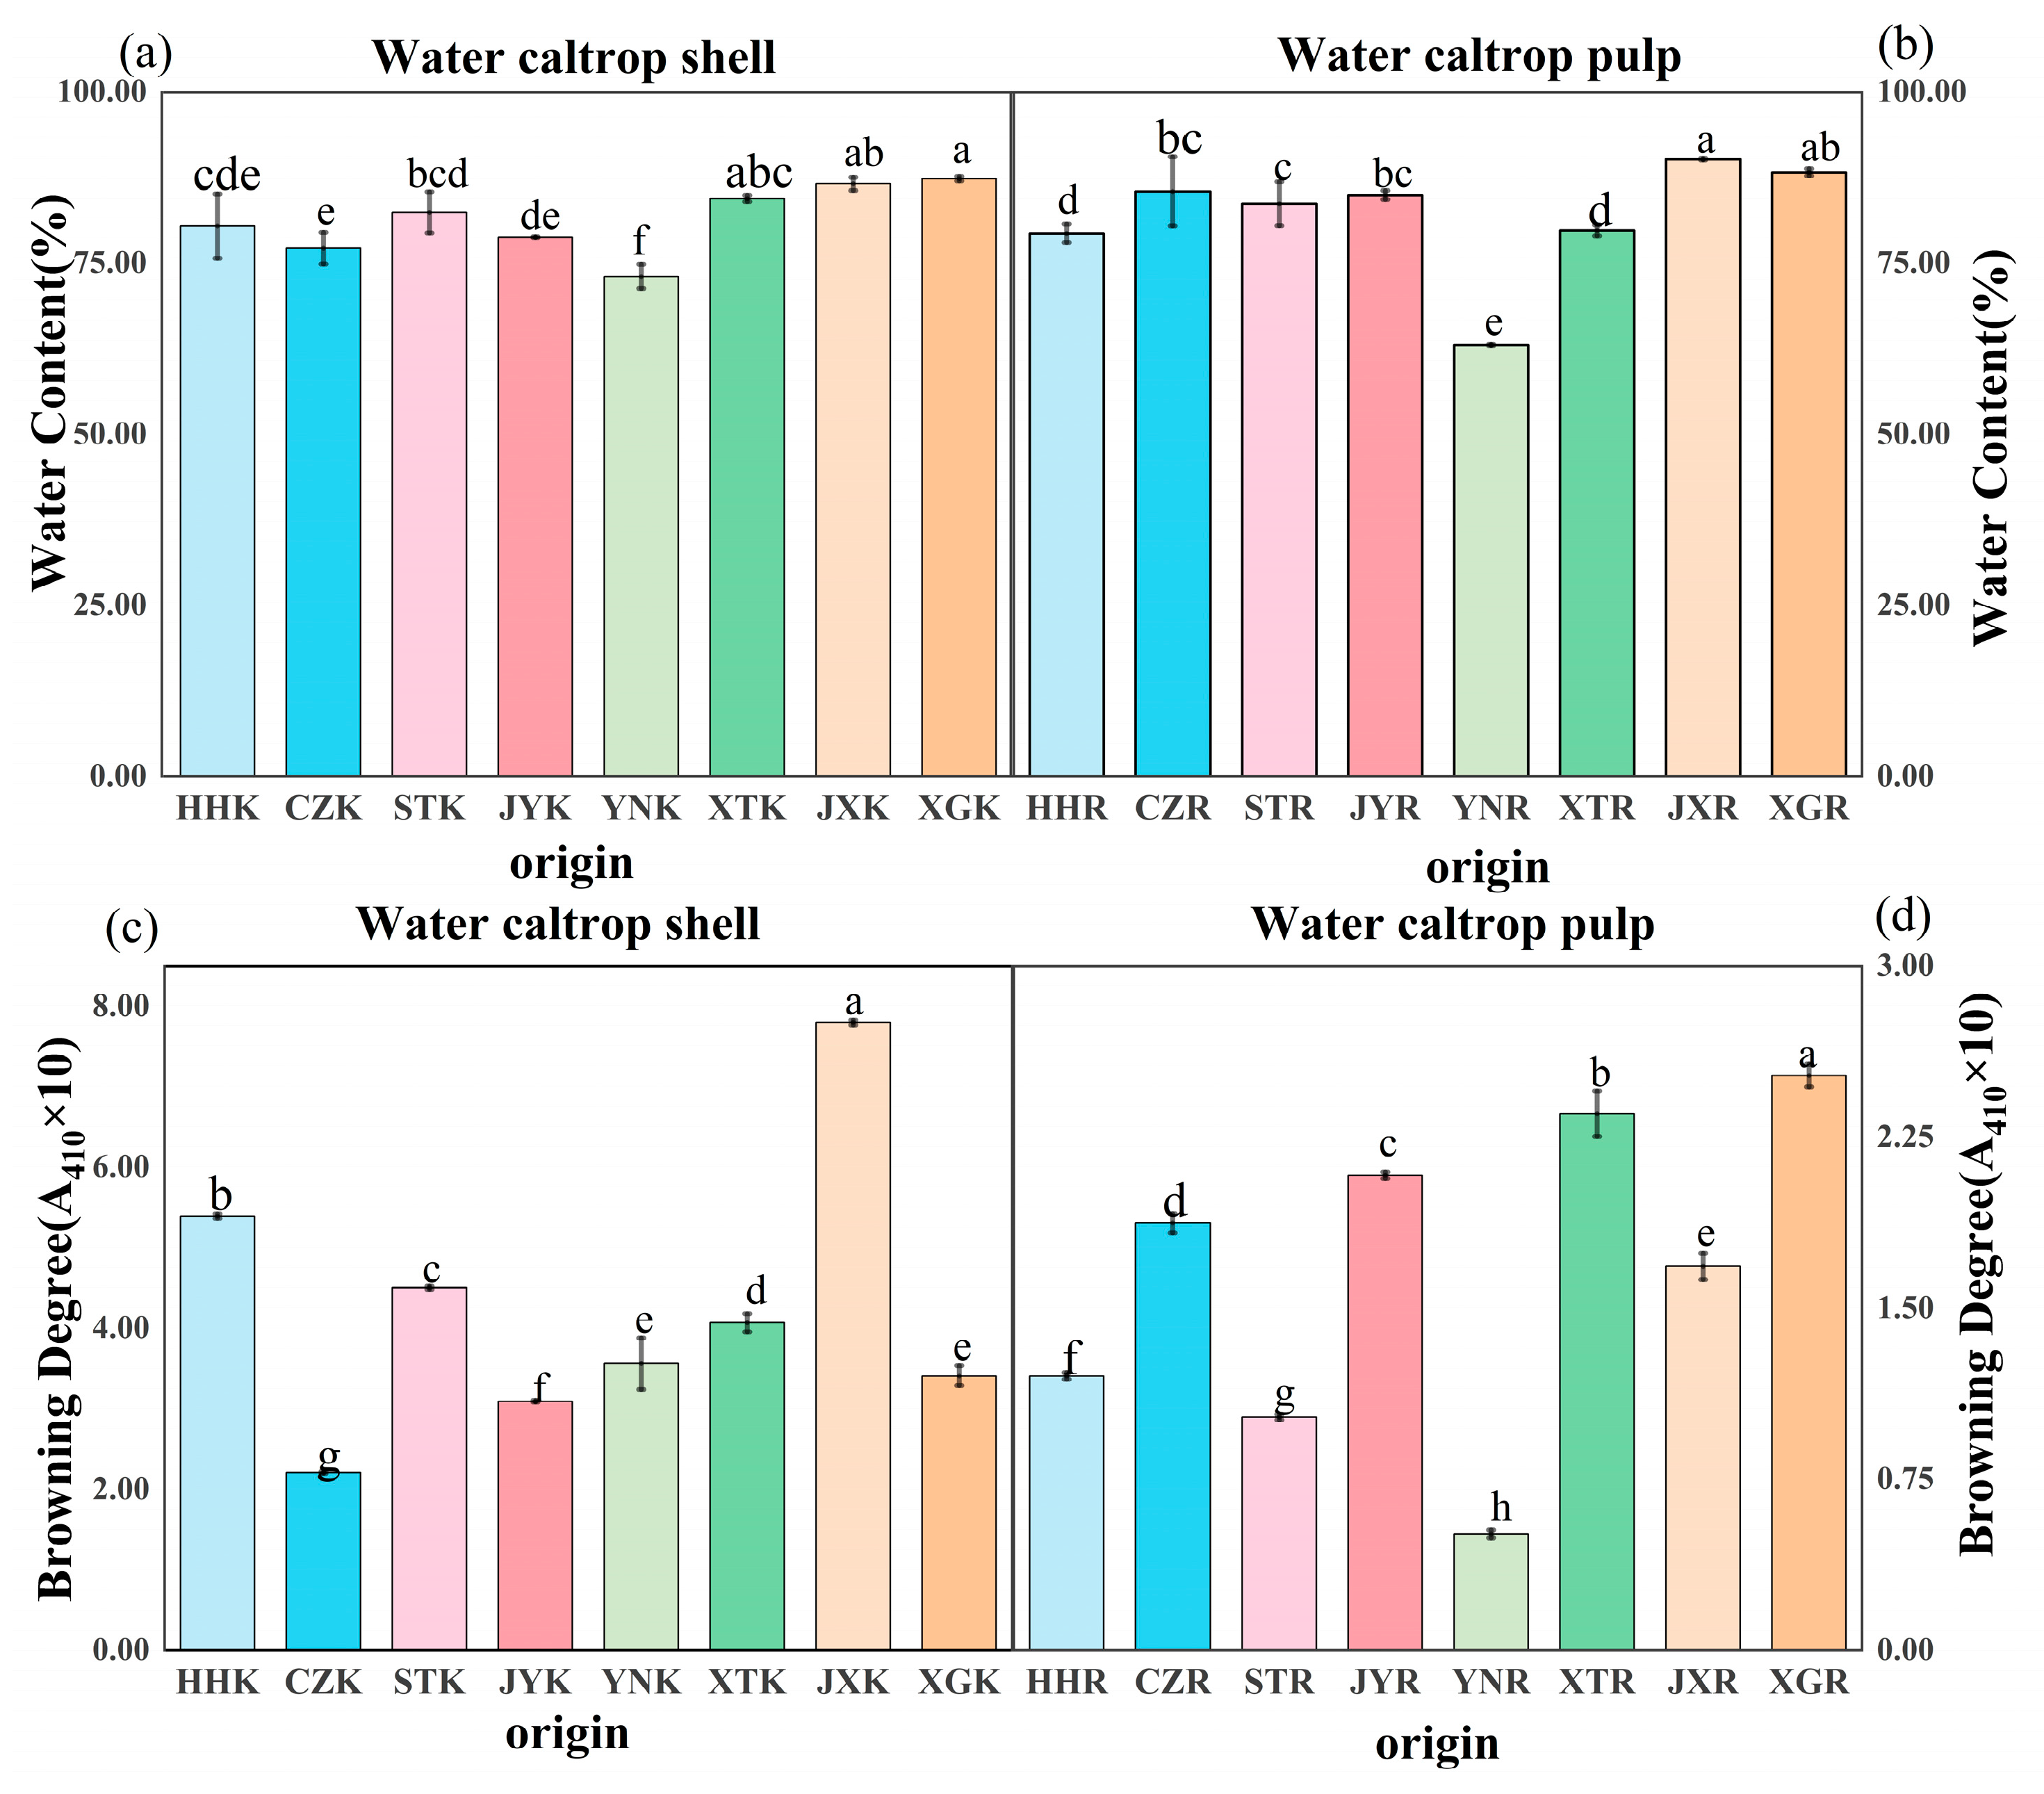
3.3. Water Content and Browning Analysis
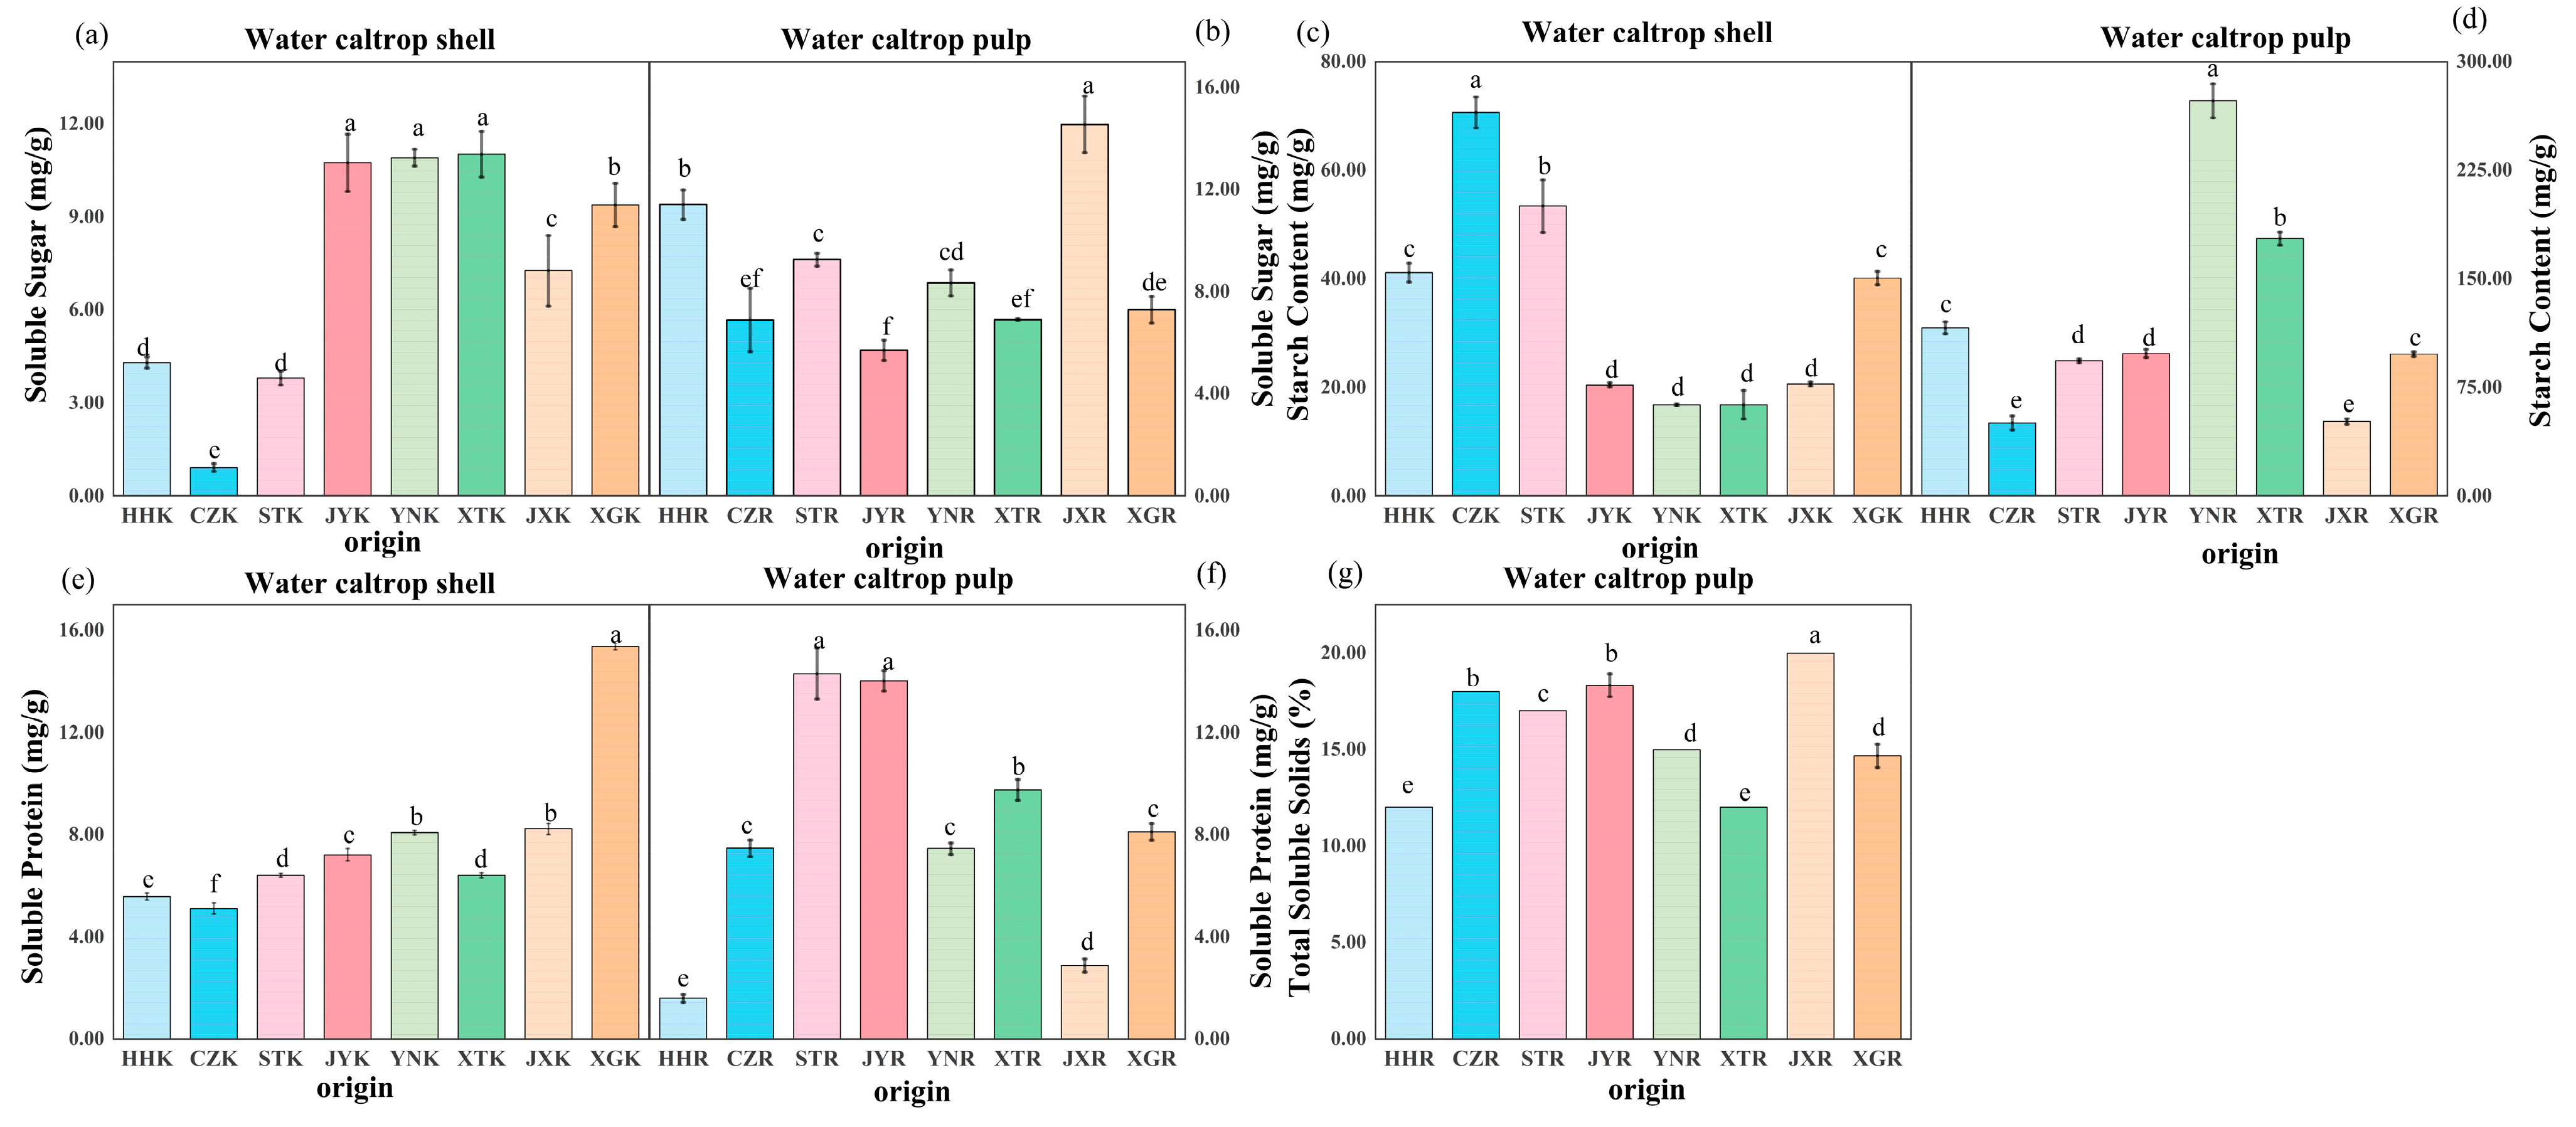
3.4. Soluble Sugar, Starch, Protein, and Soluble Solids Content
3.5. VC, Total Phenols, Total Flavonoids, and DPPH Radical Scavenging Rate
3.6. PCA
4. Discussion
5. Conclusions
Author Contributions
Funding
Institutional Review Board Statement
Data Availability Statement
Conflicts of Interest
Appendix A

References
- Chiang, P.; Li, P.; Huang, C.; Wang, C.R. Chemical composition and physical characteristics of water caltrop during growth. J. Sci. Food Agric. 2009, 89, 1298–1306. [Google Scholar] [CrossRef]
- Adkar, P.; Dongare, A.; Ambavade, S.; Bhaskar, V.H. Trapa bispinosa Roxb.: A review on nutritional and pharmacological aspects. Adv. Pharmacol. Sci. 2014, 2014, 959830. [Google Scholar] [CrossRef]
- Señorans, F.J.; Ibáñez, E.; Cifuentes, A. New trends in food processing. Crit. Rev. Food Sci. Nutr. 2003, 43, 507–526. [Google Scholar] [CrossRef] [PubMed]
- Tran, P.L.; Lee, J.S.; Park, K.H. Molecular structure and rheological character of high-amylose water caltrop (Trapa bispinosa Roxb.) starch. Food Sci. Biotechnol. 2013, 22, 979–985. [Google Scholar] [CrossRef]
- Li, X.; Yin, J.; Du, S.; Yang, Z.; Liu, P.; Wu, X. Research progress on nutrition and medicinal value of aquatic vegetables. Yangtze River Veg. 2015, 32, 25–30. [Google Scholar] [CrossRef]
- Niu, F.L.; Dong, W.Y.; Cheng, G.; Liang, R.; Gong, H.W. Analysis of nutrients in Northeast water caltrops. Food Sci. 2002, 23, 272–274. [Google Scholar] [CrossRef]
- Li, Y. Study on Postharvest Quality, Physiological and Biochemical Characteristics and Enzymatic Browning of Sparganium stoloniferum Buchenau; Nanjing Agricultural University: Nanjing, China, 2006. [Google Scholar] [CrossRef]
- Pei, M.M.; Wu, Y.Q.; Wang, Y.Y.; Dong, T.T.; Wang, L.Y. Development of Sparganium stoloniferum Buchenau trehalose biscuits. J. Luoyang Norm. Univ. 2022, 41, 26–30. [Google Scholar] [CrossRef]
- Yan, B.Y.; Huang, A.N.; Li, L.; Zhang, C.Y.; Wang, O. Development of Sparganium stoloniferum Buchenau and water chestnut yogurt. Chin. Dairy Cattle 2022, 40, 47–52. [Google Scholar] [CrossRef]
- Long, H.R. Extraction, Separation, and Antioxidant Activity Study of Flavonoids from Sparganium stoloniferum Buchenau Shell; Guangxi University: Nanning, China, 2009. [Google Scholar] [CrossRef]
- Niranjan, A.; Verma, S.; Lehri, A.; Amla, D. High-performance thin-layer chromatographic analysis for the simultaneous quantification of four phenolic compounds in green, red, and black fruits of Trapa natans var. bispinosa Roxb. (Singhara). Jpc—J. Planar Chromatogr.-Mod. Tlc 2013, 26, 316–321. [Google Scholar] [CrossRef]
- Dong, J.L.; Gao, G.C.; Huang, H.; Zhu, Q.F.; Jiang, X.H. Research progress on chemical composition and pharmacological activity of Sparganium stoloniferum Buchenau shell. J. Jiaxing Univ. 2014, 26, 68–71. [Google Scholar] [CrossRef]
- Lu, M.; Zhou, Y.J.; Li, L.; Xu, S.Q.; Kan, Y.F. Development of Sparganium stoloniferum Buchenau shell fiber chewing tablets. Food Process. 2018, 17, 19–20. [Google Scholar] [CrossRef]
- Xie, Y.; Lin, Q.; Guan, W.; Cheng, S.; Wang, Z.; Sun, C. Comparison of sodium acid sulfate and UV-C treatment on browning and storage quality of fresh-cut potatoes. Quality 2017, 2017, 58–67. [Google Scholar] [CrossRef]
- Chen, J.; Xu, Y.; Yi, Y.; Hou, W.; Wang, L.; Ai, Y.; Min, T. Regulations and mechanisms of 1-methylcyclopropene treatment on the browning and quality of fresh-cut lotus (Nelumbo nucifera Gaertn.) root slices. Postharvest Biol. Technology 2022, 185, 111782. [Google Scholar] [CrossRef]
- Wang, H.; Chen, J.; Yi, Y.; Wang, L.; Hou, W.; Ai, Y.; Wang, H.; Min, T. Regulation and mechanism of ethylene treatment on storage quality of fresh-cut lotus (Nelumbo nucifera Gaertn.) root slices. Sci. Hortic. 2023, 313, 111900. [Google Scholar] [CrossRef]
- Xue, T.-T.; Ruan, K.-H.; Xu, H.-B.; Liu, H.-B.; Tang, Z.-S.; Yang, Y.-G.; Duan, J.-A.; Sun, X.-X.; Wang, M.; Song, Z.-X. Effect of different drying methods on the drying characteristics, chemical properties and antioxidant capacity of Ziziphus jujuba var. spinosa fruit. LWT 2024, 196, 115873. [Google Scholar] [CrossRef]
- Min, T.; Xie, J.; Zheng, M.; Yi, Y.; Hou, W.; Wang, L.; Wang, H. the effect of different temperatures on browning incidence and phenol compound metabolism in fresh-cut lotus (Nelumbo nucifera G.) root. Postharvest Biol. Technol. 2017, 123, 69–76. [Google Scholar] [CrossRef]
- Yang, Y.; Liu, R.; Han, Y.; Wu, W.; Fang, X.; Mu, H.; Gao, H.; Chen, H. Critical taste substances and regulatory pathways of fresh lotus seed pulps at different ripeness stages. Postharvest Biol. Technol. 2023, 205, 112522. [Google Scholar] [CrossRef]
- Xu, Y.; Yu, J.; Chen, J.; Gong, J.; Peng, L.; Yi, Y.; Min, T. Melatonin maintains the Storage quality of fresh-cut Chinese water chestnuts by regulating phenolic and reactive oxygen species metabolism. Food Qual. Saf. 2022, 6, fyac002. [Google Scholar] [CrossRef]
- Xu, Y.; Bao, Y.; Chen, J.; Yi, Y.; Ai, Y.; Hou, W.; Wang, L.; Wang, H.; Min, T. Mechanisms of ethanol treatment on controlling browning in fresh-cut lotus roots. Sci. Hortic 2023, 310, 111708. [Google Scholar] [CrossRef]
- Chen, Z.; Xu, Y.; Lu, Y.; Miao, Z.; Yi, Y.; Wang, L.; Hou, W.; Ai, Y.; Wang, H.; Min, T. Effect and mechanism of eugenol on storage quality of fresh-peeled Chinese water chestnuts. Front. Plant Sci. 2022, 13, 965723. [Google Scholar] [CrossRef]
- Yi, Y.; Han, M.-M.; Huang, F.; Wang, L.-M.; Min, T.; Wang, H.-X. Effects of a Lysine-Involved Maillard Reaction on the Structure and In Vitro Activities of Polysaccharides from Longan Pulp. Molecules 2019, 24, 972. [Google Scholar] [CrossRef] [PubMed]
- García-Segovia, P.; Andrés-Bello, A.; Martínez-Monzó, J. Textural properties of potatoes (Solanum tuberosum L., cv. Monalisa) as affected by different cooking processes. J. Food Eng. 2008, 88, 28–35. [Google Scholar] [CrossRef]
- Hu, X.; Ma, T.; Ao, L.; Kang, H.; Hu, X.; Song, Y.; Liao, X. Effect of high hydrostatic pressure processing on textural properties and microstructural characterization of fresh-cut pumpkin (Cucurbita pepo). J. Food Process Eng. 2020, 43, e13379. [Google Scholar] [CrossRef]
- Biliaderis, C.G.; Maurice, T.J.; Vose, J.R. Starch gelatinization phenomena studied by differential scanning calorimetry. J. Food Sci. 1986, 45, 1669–1674. [Google Scholar] [CrossRef]
- Gao, F.; Li, D.; Li, H.; Chen, H.; Mao, X.; Wang, P. Influence of Post-Heating Treatment on the Sensory and Textural Properties of Stirred Fermented Milk. Foods 2023, 12, 3042. [Google Scholar] [CrossRef] [PubMed]
- Zhang, W.; Mayinur, J.; Wang, M.; Han, S.A.; Xie, H.; Pan, M.Q. Analysis on the pulp texture, cell architecture and its physiological characteristics of different grape varieties. Acta Bot. Boreali-Occident. Sin. 2022, 42, 1870–1879. [Google Scholar] [CrossRef]
- Dong, W.; Liu, X.; Yi, Y.; Wang, L.; Hou, W.; Ai, Y.; Wang, H.; Min, T. Evaluation of Pre-Harvest Nutrient Composition and Functional Active Substances in Various Lotus Roots. Foods 2024, 13, 2297. [Google Scholar] [CrossRef] [PubMed]
- Tu, Y.; Yan, S.; Li, J. Impact of harvesting time on the chemical composition and quality of fresh lotus seeds. Hortic. Environ. Biotechnol. 2020, 61, 735–744. [Google Scholar] [CrossRef]
- Vella, F.M.; Calandrelli, R.; Laratta, B. Influence of ripening on polyphenolic content, degradative, and browning enzymes in Cantaloupe varieties (C. melo, L.). Horticulturae 2021, 7, 421. [Google Scholar] [CrossRef]
- Liu, J.; Peng, J.; Yang, J.; Wang, J.; Peng, X.; Yan, W.; Zhao, L.; Peng, L.; Zhou, Y. Comparative Analysis of the Physicochemical Properties and Metabolites of Farinose and Crisp Lotus Roots (Nelumbo nucifera Gaertn.) with Different Geographical Origins. Foods 2023, 12, 2493. [Google Scholar] [CrossRef]
- Xu, C.; Song, L. Research progress on browning control of fresh-cut fruits and vegetables. Food Saf. Guide 2022, 32, 188–192. [Google Scholar] [CrossRef]
- Tang, Y.; Ren, J.; Liu, C.; Jiang, J.; Yang, H.; Li, J. Genetic characteristics and QTL analysis of the soluble sugar content in ripe tomato fruits. Sci. Hortic. 2021, 276, 109785. [Google Scholar] [CrossRef]
- Singh, G.D.; Siingh, S.; Jindal, N.; Bawa, A.S.; Saxena, D.C. Physico-chemical characteristics and sensory quality of Singhara (Trapa natans L.): An Indian water chestnut under commercial and industrial storage conditions. Afr. J. Food Sci. 2010, 4, 693–702. Available online: https://academicjournals.org/journal/AJFS/article-full-text-pdf/FCB17F326177 (accessed on 12 May 2025).
- Singh, G.D.; Bawa, A.S.; Riar, C.S.; Saxena, D.C. Influence of heat-moisture treatment and acid modifications on physicochemical, rheological, thermal and morphological characteristics of Indian water chestnut (Trapa natans) starch and its application in biodegradable films. Starch 2009, 61, 503e513. [Google Scholar] [CrossRef]
- Ma, Y.; Lu, M.; Yuan, G.; Wang, X.; Liu, J.; Zhang, J.; Wang, D. Analysis of seven soluble sugar fractions from chestnut nuts. Econ. For. Res. 2024, 42, 215–223. [Google Scholar] [CrossRef]
- Jin, M. Effects of Different Packing Methods and Temperatures on the Storage Quality of Water Caltrop Fruit Pulp. Master’s Thesis, Wuhan Polytechnic University, Wuhan, China, 2021. [Google Scholar] [CrossRef]
- Yuan, X.; Wu, Z.; Li, H.; Wang, Y.; Liu, F.; Cai, H.; Newlove, A.A.; Wang, Y. Biochemical and proteomic analysis of ‘Kyoho’grape (Vitis labruscana) berries during cold storage. Postharvest Biol. Technol. 2014, 88, 79–87. [Google Scholar] [CrossRef]
- Zhang, H.; Zhao, Q.; Lan, T.; Geng, T.; Gao, C.; Yuan, Q.; Zhang, Q.; Xu, P.; Sun, X.; Liu, X.; et al. Comparative Analysis of Physicochemical Characteristics, Nutritional and Functional Components and Antioxidant Comparative Analysis of Physicochemical Characteristics, Nutritional and Functional Components and Antioxidant Capacity of Fifteen Kiwifruit (Actinidia) Cultivars- Comparative Analysis of Physicochemical Characteristics, Nutritional and Functional Components and Antioxidant Capacity of Fifteen Kiwifruit (Actinidia) Cultivars. Foods 2020, 9, 1267. [Google Scholar] [CrossRef]
- Del Rio, D.; Rodriguez-Mateos, A.; Spencer, J.P.E.; Tognolini, M.; Borges, G.; Crozier, A. Dietary (poly)phenolics in human health: Structures, bioavailability, and evidence of protective effects against chronic diseases. Antioxid. Redox Signal. 2013, 18, e1818–e1892. [Google Scholar] [CrossRef]
- Fang, L.; Wei, K.; Feng, L.; Tu, K.; Peng, J.; Wang, J.; Pan, L. Optical absorption and scattering properties at 900–1650 nm and their relationships with soluble solid content and soluble sugars in apple pulp during storage. Foods 2020, 9, 1881. [Google Scholar] [CrossRef]
- Yang, B.; Han, Y.; Wu, W.; Fang, X.; Chen, H.; Gao, H. Impact of melatonin application on lignification in water bamboo shoot during storage. Food Chem. 2022, 13, 100254. [Google Scholar] [CrossRef]
- Alañón, M.E.; Ivanović, M.; Gómez-Caravaca, A.M.; Arráez-Román, D.; Segura-Carretero, A. Choline chloride derivative-based deep eutectic liquids as novel green alternative solvents for extraction of phenolic compounds from olive leaf. Arab. J. Chem. 2020, 13, 1685–1701. [Google Scholar] [CrossRef]
- Hu, G.; Li, X.; Lai, A.; Liu, Y.; Zhang, Y.; Wang, J.; Sun, S.; Zhu, J.; Yang, M. Comparative analysis of the nutritional quality of Zizania latifolia cultivars harvested in different growing seasons. Foods 2023, 13, 30. [Google Scholar] [CrossRef] [PubMed]
- Zhang, Y.; Cai, S.; Ma, S.; Zhao, S.; Yi, J.; Zhou, L. Water caltrop (Trapa quadrispinosa Roxb.) shell improves oxidative stress and postprandial blood glucose in diabetes. Phenolic profiles, antioxidant activities and α-glycosidase inhibition of different fractions with in vitro and in silico analyses. Antioxidants 2022, 11, 1873. [Google Scholar] [CrossRef]
- Lü, H.; Zuo, Y.; Meng, X.; Ding, X.; Jian, T.; Liu, Y.; Ren, B.; Chen, J.; Li, W. Phenolic profiles, antioxidant activity and inhibition of digestive enzymes of water caltrop pericarps. J. Sci. Food Agric. 2022, 102, 2342–2351. [Google Scholar] [CrossRef]
- Zuo, Y.Y.; Lv, H.; Wu, Y.X.; Chen, J.; Jian, D.; Ren, B.; Li, W. Comparison on Total Phenols Content and Antioxidant Activity and Inhibitory Effect on α-Glucosidase Activity in Water caltrop Shells (Trapa natans Linn. Shells) from Different Regions. J. Plant Resour. Environ. 2018, 27, 112–114. [Google Scholar] [CrossRef]
- Tilistyák, J.T.; Kücsön, G. Evaluation of Trapa natans L. (water caltrop) harvested from Lake Tisza, Hungary. Rev. Agric. Rural. Dev. 2023, 12, 28–33. [Google Scholar]
- Rehman, A.U.; Khan, A.U.; Sohaib, M.; Rehman, H. Comparative Analysis of Nutritional Properties, Phytochemical Profile, and Antioxidant Activities between Red and Green Water Chestnut (Trapa natans) Fruits. Foods 2024, 13, 1883. [Google Scholar] [CrossRef] [PubMed]
- Paul, L.C.; Suman, A.A.; Sultan, N. Methodological analysis of principal component analysis (PCA) method. Int. J. Comput. Eng. Manag. 2013, 16, 32–38. Available online: https://www.researchgate.net/publication/325011441_Methodological_analysis_of_principal_component_analysis_PCA_method (accessed on 12 May 2025).
- Wen, X.; Xiao, Y.D.; Nie, M.M.; Li, D.; Liu, C.; Niu, L.; Bao, Y.; Tang, D. Comprehensive evaluation of blueberry crisp quality of different varieties based on principal component analysis. Food Sci. Technol. 2024, 45, 208–217. [Google Scholar] [CrossRef]
- Zhang, Z.W.; Huang, L.; Deng, Z.C.; Wang, Z.; Hu, C.; Jiang, W.; Zhang, Y.; Peng, Y.; Wang, Z. Research Progress on the Water Purification Function and Cultivation Technology of Trapa. J. Agron. 2022, 12, 37–41. [Google Scholar] [CrossRef]
- Ferrer-Gallego, R.; Hernández-Hierro, J.M.; Rivas-Gonzalo, J.C.; Escribano-Bailón, M.T. Influence of climatic conditions on the phenolic composition of Vitis vinifera L. cv. Graciano. Anal. Chim. Acta 2012, 732, 73–77. [Google Scholar] [CrossRef] [PubMed]
- Gani, A.; Haq, S.S.; Masoodi, F.A.; Broadway, A.A.; Gani, A. Physico-chemical, morphological and pasting properties of starches extracted from water chestnuts (Trapa natans) from three lakes of Kashmir, India, Braz. Arch. Biol. Technol. 2010, 53, 731–740. [Google Scholar] [CrossRef]
- Gluten, M.N.M. major histocompatibility complex, and the small intestine: A molecular and immunobiologic approach to the spectrum of gluten sensitivity (‘celiac sprue’). Gastroenterology 1992, 102, 330–354. [Google Scholar] [CrossRef]
- Cai, J.; Cai, C.; Man, J.; Zhou, W.; Wei, C. Structural and functional properties of C-type starches. Carbohydr. Polym. 2014, 101, 289–300. [Google Scholar] [CrossRef]
- Singh, J.; Kaur, L.; McCarthy, O.J.; Moughan, P.J.; Singh, H. Rheological and textural characteristics of raw and par-cooked Taewa (Maori potatoes) of New. J. Texture Stud. 2008, 39, 210–230. [Google Scholar] [CrossRef]
- Hussain, S.Z.; Beigh, M.A.; Naseer, B.; Amin, T.; Naik, H.R. Characteristics of resistant starch in water chestnut flour as improved by preconditioning process. Int. J. Food Prop. 2019, 22, 449–461. [Google Scholar] [CrossRef]
- GarcõÂa-Viguera, C.; TomaÂs-BarberaÂn, F.A.; Ferreres, F.; ArteÂs, F.; TomaÂs-Lorente, F. Determination ofcitrus jams genuine-ness by avonoid analysis. Z. Für Lebensm.-Unters. Und Forsch. 1993, 197, 255–259. [Google Scholar] [CrossRef]
- Gao, Z.M.; Luo, Y.H.; Chen, Z.L.; Pan, Z. Development of water chestnut peel fruit vinegar beverage. China Brew. 2010, 29, 164–166. [Google Scholar] [CrossRef]
- Wang, S.; Zhu, F. Dietary antioxidant synergy in chemical and biological systems. Crit. Rev. Food Sci. Nutr. 2017, 57, 2343–2357. [Google Scholar] [CrossRef] [PubMed]


| Hardness gf | Chewiness gf | Cohesiveness | |
|---|---|---|---|
| HH | 7703.331 ± 1414.274 bc | 3158.659 ± 446.003 c | 0.129 ± 0.033 e |
| CZ | 5310.493 ± 867.348 d | 2604.313 ± 255.078 cd | 0.332 ± 0.038 bcd |
| ST | 5702.515 ± 1441.559 cd | 3399.198 ± 449.448 c | 0.230 ± 0.018 de |
| JY | 9092.815 ± 1492.718 b | 2207.109 ± 329.968 d | 0.264 ± 0.016 cd |
| YN | 12,746.764 ± 1729.968 a | 4533.122 ± 534.988 b | 0.439 ± 0.086 b |
| XT | 14,144.124 ± 1043.115 a | 2151.391 ± 464.048 d | 0.363 ± 0.036 bc |
| JX | 9598.567 ± 541.574 b | 6073.649 ± 861.064 a | 0.680 ± 0.136 a |
| XG | 6678.571 ± 816.277 cd | 1816.271 ± 375.514 d | 0.272 ± 0.013 cd |
| Variable | PC1 | PC2 | PC3 |
|---|---|---|---|
| Total Phenol Content | 0.283 | −0.106 | 0.117 |
| Total Flavonoid Content | 0.21 | 0.014 | −0.091 |
| DPPH | 0.227 | −0.002 | 0.033 |
| Water Content | −0.002 | 0.379 | −0.024 |
| VC Content | 0.248 | 0.104 | 0.356 |
| Soluble Protein | 0.116 | −0.04 | 0.708 |
| Soluble Sugar | 0.126 | 0.008 | −0.332 |
| Starch Content | −0.028 | −0.349 | −0.006 |
| Browning Degree | −0.175 | 0.334 | −0.134 |
| Characteristic Values | 4.251 | 2.525 | 1.179 |
| Variance Percentage/% | 47.231 | 28.055 | 13.096 |
| Accumulate/% | 47.231 | 75.286 | 88.382 |
| Origins | PC1 | PC2 | PC3 | PC | RANK |
|---|---|---|---|---|---|
| HHR | −0.202 | −0.589 | −0.942 | −0.434 | 7 |
| CZR | −0.512 | 0.641 | 0.428 | −0.007 | 3 |
| STR | 1.332 | −0.274 | 1.902 | 0.906 | 1 |
| JYR | −0.825 | 0.669 | 0.572 | −0.144 | 5 |
| YNR | 0.082 | −1.464 | −0.971 | −0.564 | 8 |
| XTR | −0.152 | 0.401 | −0.387 | −0.011 | 4 |
| JXR | 1.184 | −0.352 | −0.282 | 0.479 | 2 |
| XGR | −0.905 | 0.968 | −0.319 | −0.224 | 6 |
| Variable | PC1 | PC2 | PC3 | PC4 |
|---|---|---|---|---|
| Total Phenol Content | 0.38 | 0.085 | 0.104 | −0.3 |
| Total Flavonoid Content | 0.337 | 0.134 | −0.072 | 0.104 |
| DPPH | 0.321 | 0.127 | −0.065 | 0.054 |
| Vc Content | 0.135 | −0.299 | 0.141 | 0.012 |
| Soluble Protein | 0.118 | 0.523 | −0.057 | −0.17 |
| Soluble Sugar | 0.041 | 0.013 | 0.511 | −0.19 |
| Starch Content | 0.019 | 0.162 | −0.537 | −0.129 |
| Browning Degree | 0.119 | 0.483 | −0.041 | 0.156 |
| Water Content | −0.059 | −0.037 | −0.032 | 0.8 |
| Characteristic Values | 3.788 | 2.103 | 1.195 | 1.057 |
| Variance Percentage/% | 42.089 | 23.367 | 13.278 | 11.74 |
| Accumulate/% | 42.089 | 65.456 | 78.734 | 90.474 |
| Origins | PC1 | PC2 | PC3 | PC4 | PC | RANK |
|---|---|---|---|---|---|---|
| HHK | −0.370 | 0.642 | −0.620 | 0.518 | −0.030 | 4 |
| CZK | −0.245 | 1.727 | −1.483 | −1.454 | −0.075 | 5 |
| STK | 0.835 | 0.326 | 0.196 | 0.161 | 0.522 | 3 |
| JYK | 1.945 | 1.199 | −0.597 | −1.105 | 0.982 | 1 |
| YNK | −0.904 | −0.725 | 0.270 | 0.026 | −0.564 | 6 |
| XTK | −1.058 | −1.298 | −0.240 | 0.321 | −0.821 | 8 |
| JXK | 0.616 | −0.030 | 0.504 | 1.780 | 0.584 | 2 |
| XGK | −0.819 | −1.840 | 1.970 | −0.247 | −0.598 | 7 |
Disclaimer/Publisher’s Note: The statements, opinions and data contained in all publications are solely those of the individual author(s) and contributor(s) and not of MDPI and/or the editor(s). MDPI and/or the editor(s) disclaim responsibility for any injury to people or property resulting from any ideas, methods, instructions or products referred to in the content. |
© 2025 by the authors. Licensee MDPI, Basel, Switzerland. This article is an open access article distributed under the terms and conditions of the Creative Commons Attribution (CC BY) license (https://creativecommons.org/licenses/by/4.0/).
Share and Cite
Si, H.; Yi, Y.; Wang, L.; Hou, W.; Wang, H.; Ai, Y.; Min, T. Evaluation of Nutrient Composition and Bioactive Substances in Water Caltrop from Different Origins. Horticulturae 2025, 11, 833. https://doi.org/10.3390/horticulturae11070833
Si H, Yi Y, Wang L, Hou W, Wang H, Ai Y, Min T. Evaluation of Nutrient Composition and Bioactive Substances in Water Caltrop from Different Origins. Horticulturae. 2025; 11(7):833. https://doi.org/10.3390/horticulturae11070833
Chicago/Turabian StyleSi, Haizhen, Yang Yi, Limei Wang, Wenfu Hou, Hongxun Wang, Youwei Ai, and Ting Min. 2025. "Evaluation of Nutrient Composition and Bioactive Substances in Water Caltrop from Different Origins" Horticulturae 11, no. 7: 833. https://doi.org/10.3390/horticulturae11070833
APA StyleSi, H., Yi, Y., Wang, L., Hou, W., Wang, H., Ai, Y., & Min, T. (2025). Evaluation of Nutrient Composition and Bioactive Substances in Water Caltrop from Different Origins. Horticulturae, 11(7), 833. https://doi.org/10.3390/horticulturae11070833