
Combining Diluted Seawater and Fertilizer in an Ion-Based Multivariate Approach as an Effective Assay of Salt Tolerance in Brassica juncea Seedlings

 ,
,  ,
, 
Abstract

1. Introduction
2. Materials and Methods
2.1. Seed Germination and Substrate Preparation
2.2. Design of Nutrient Treatments
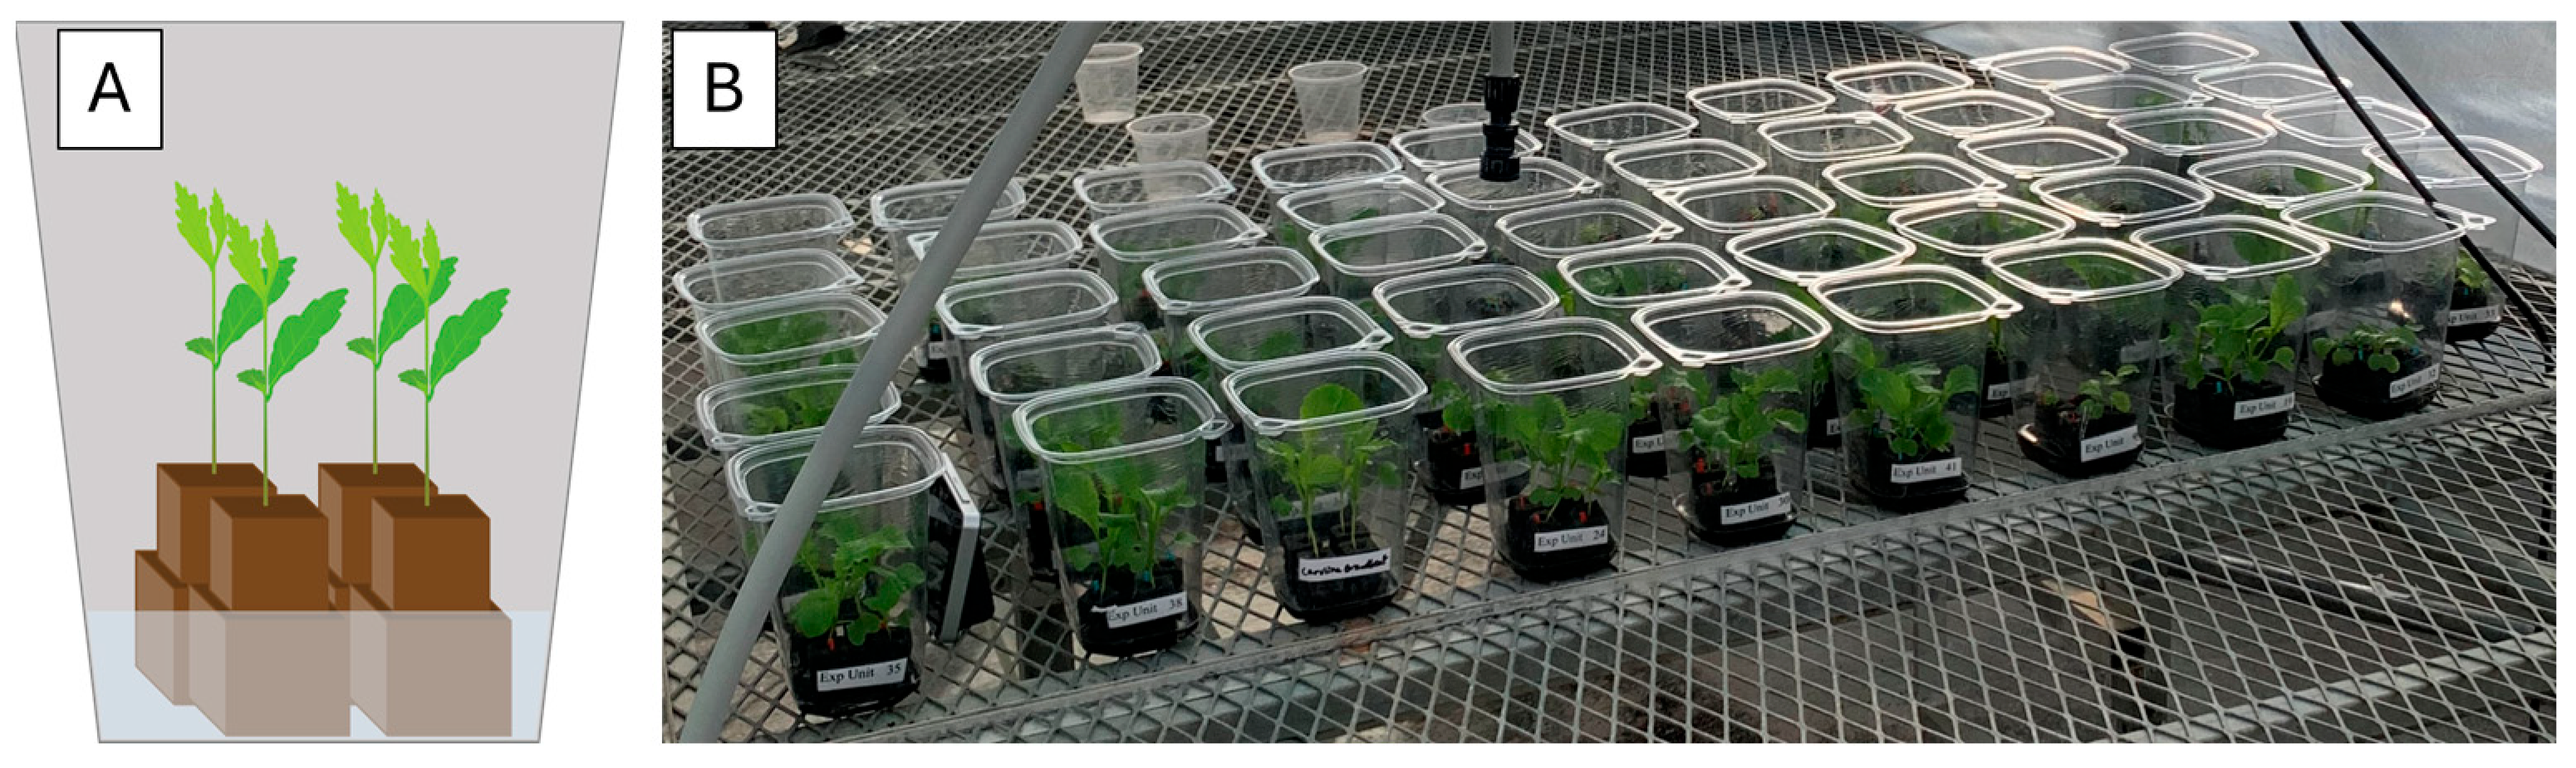
2.3. Trasnfer to Microcosm
2.4. Data Analysis
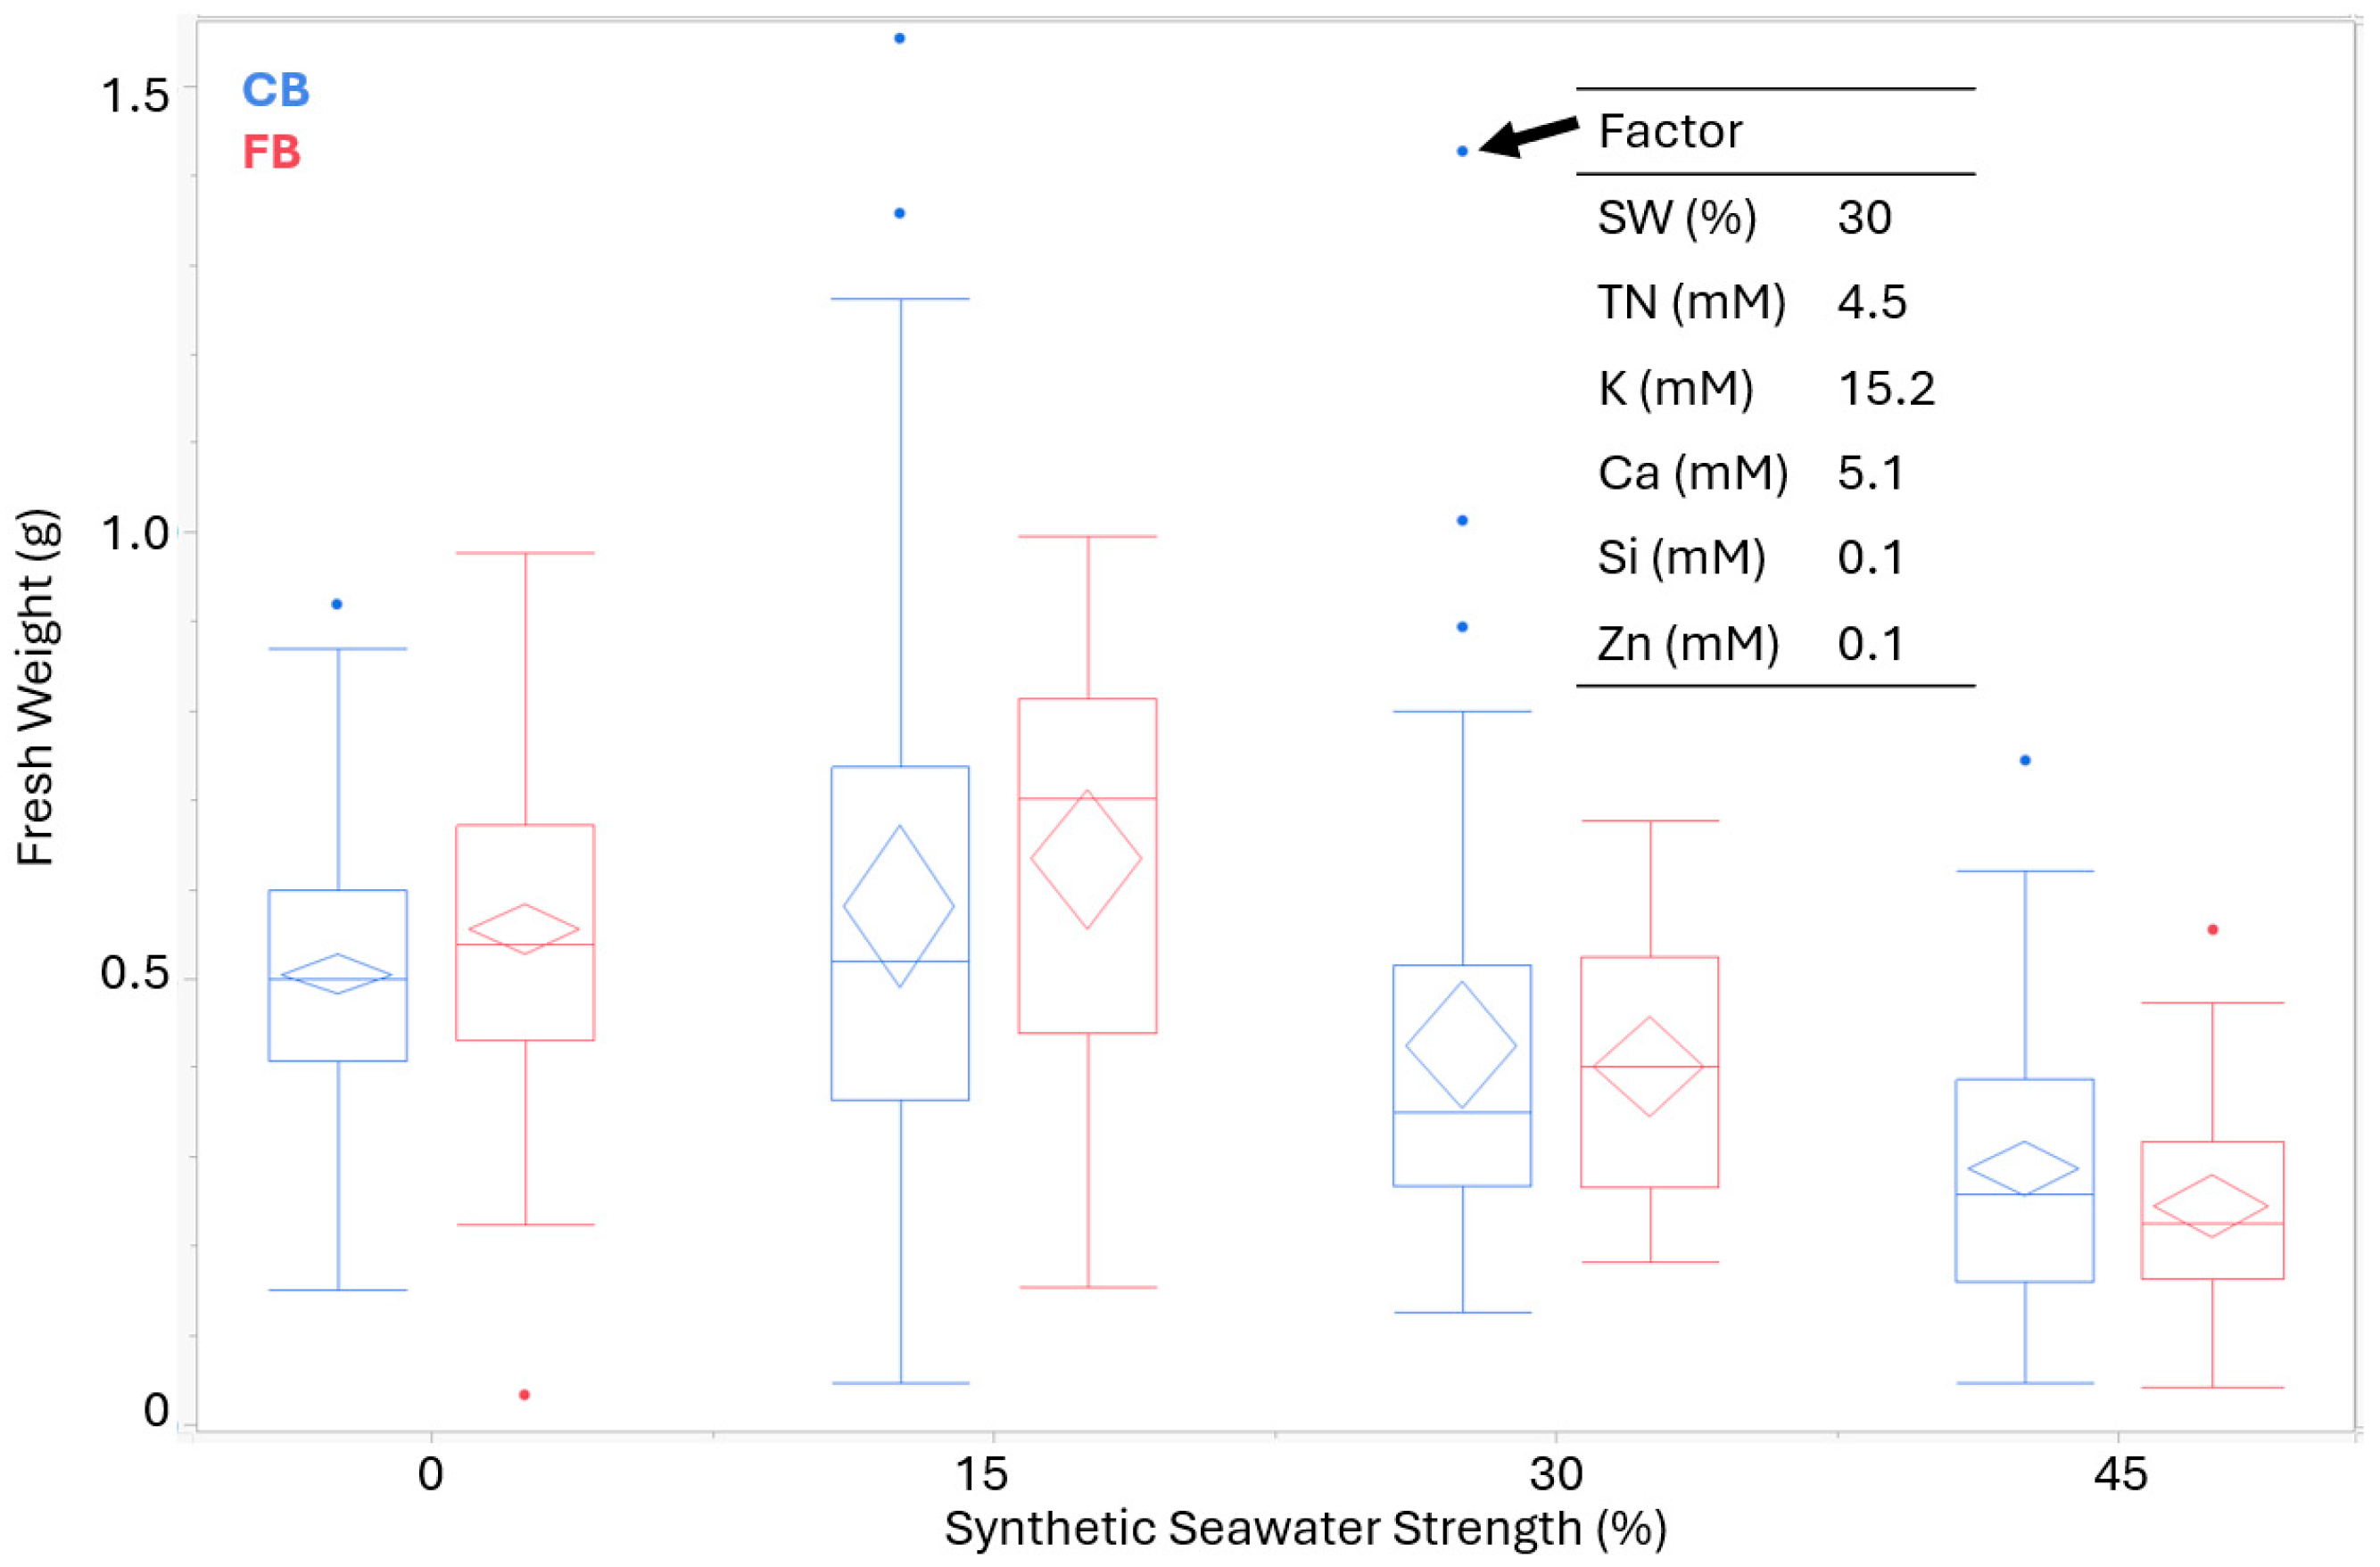
3. Results
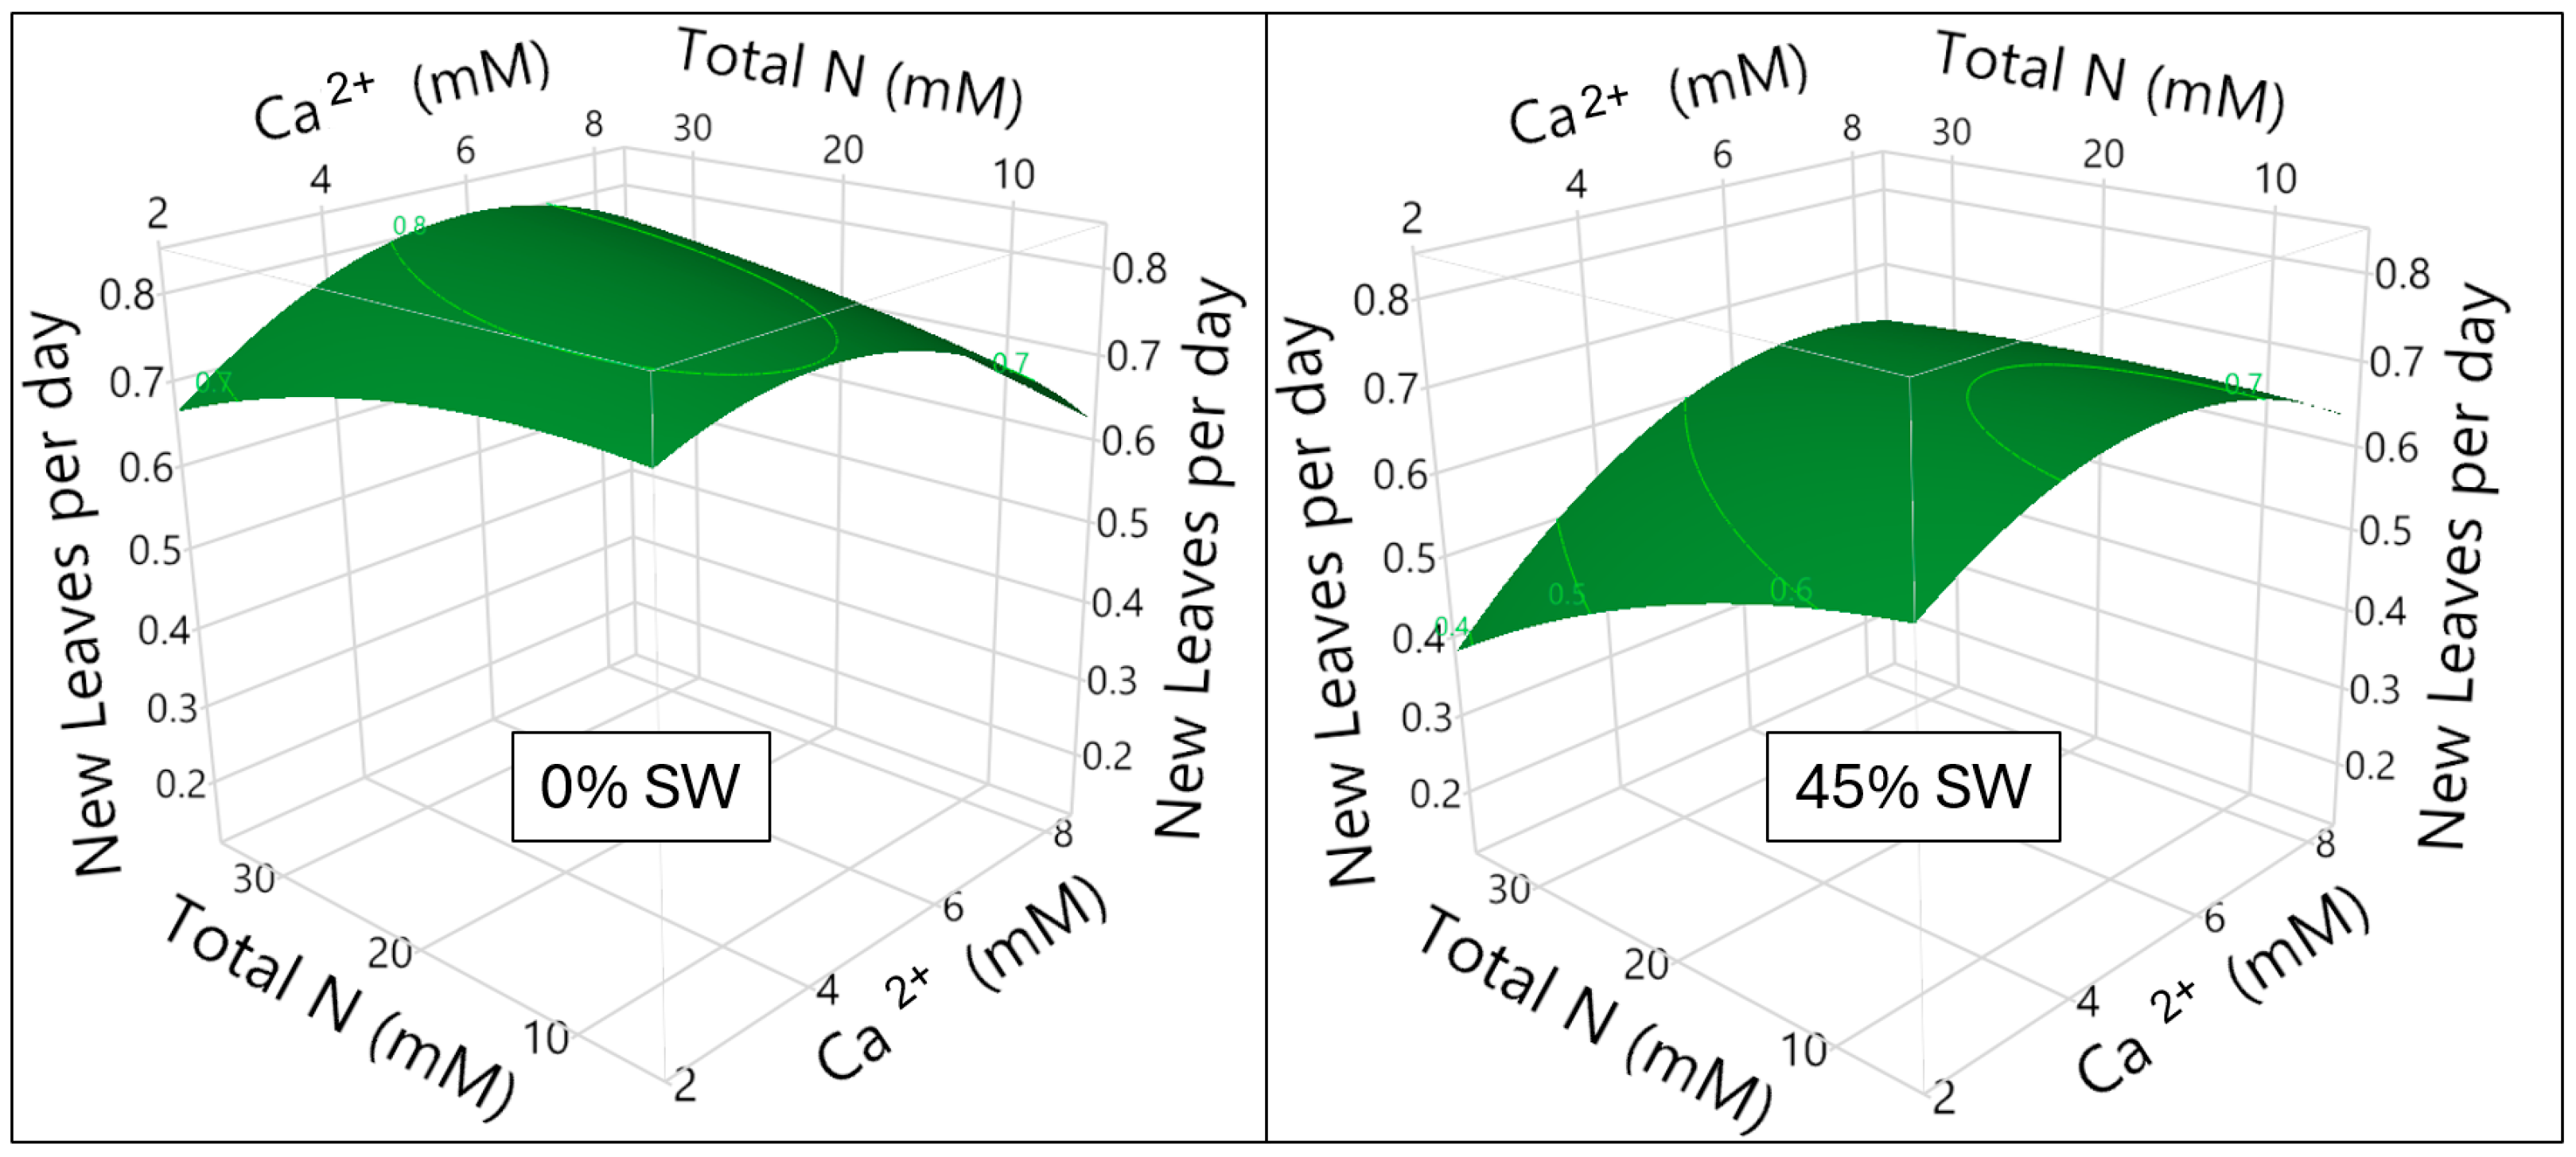
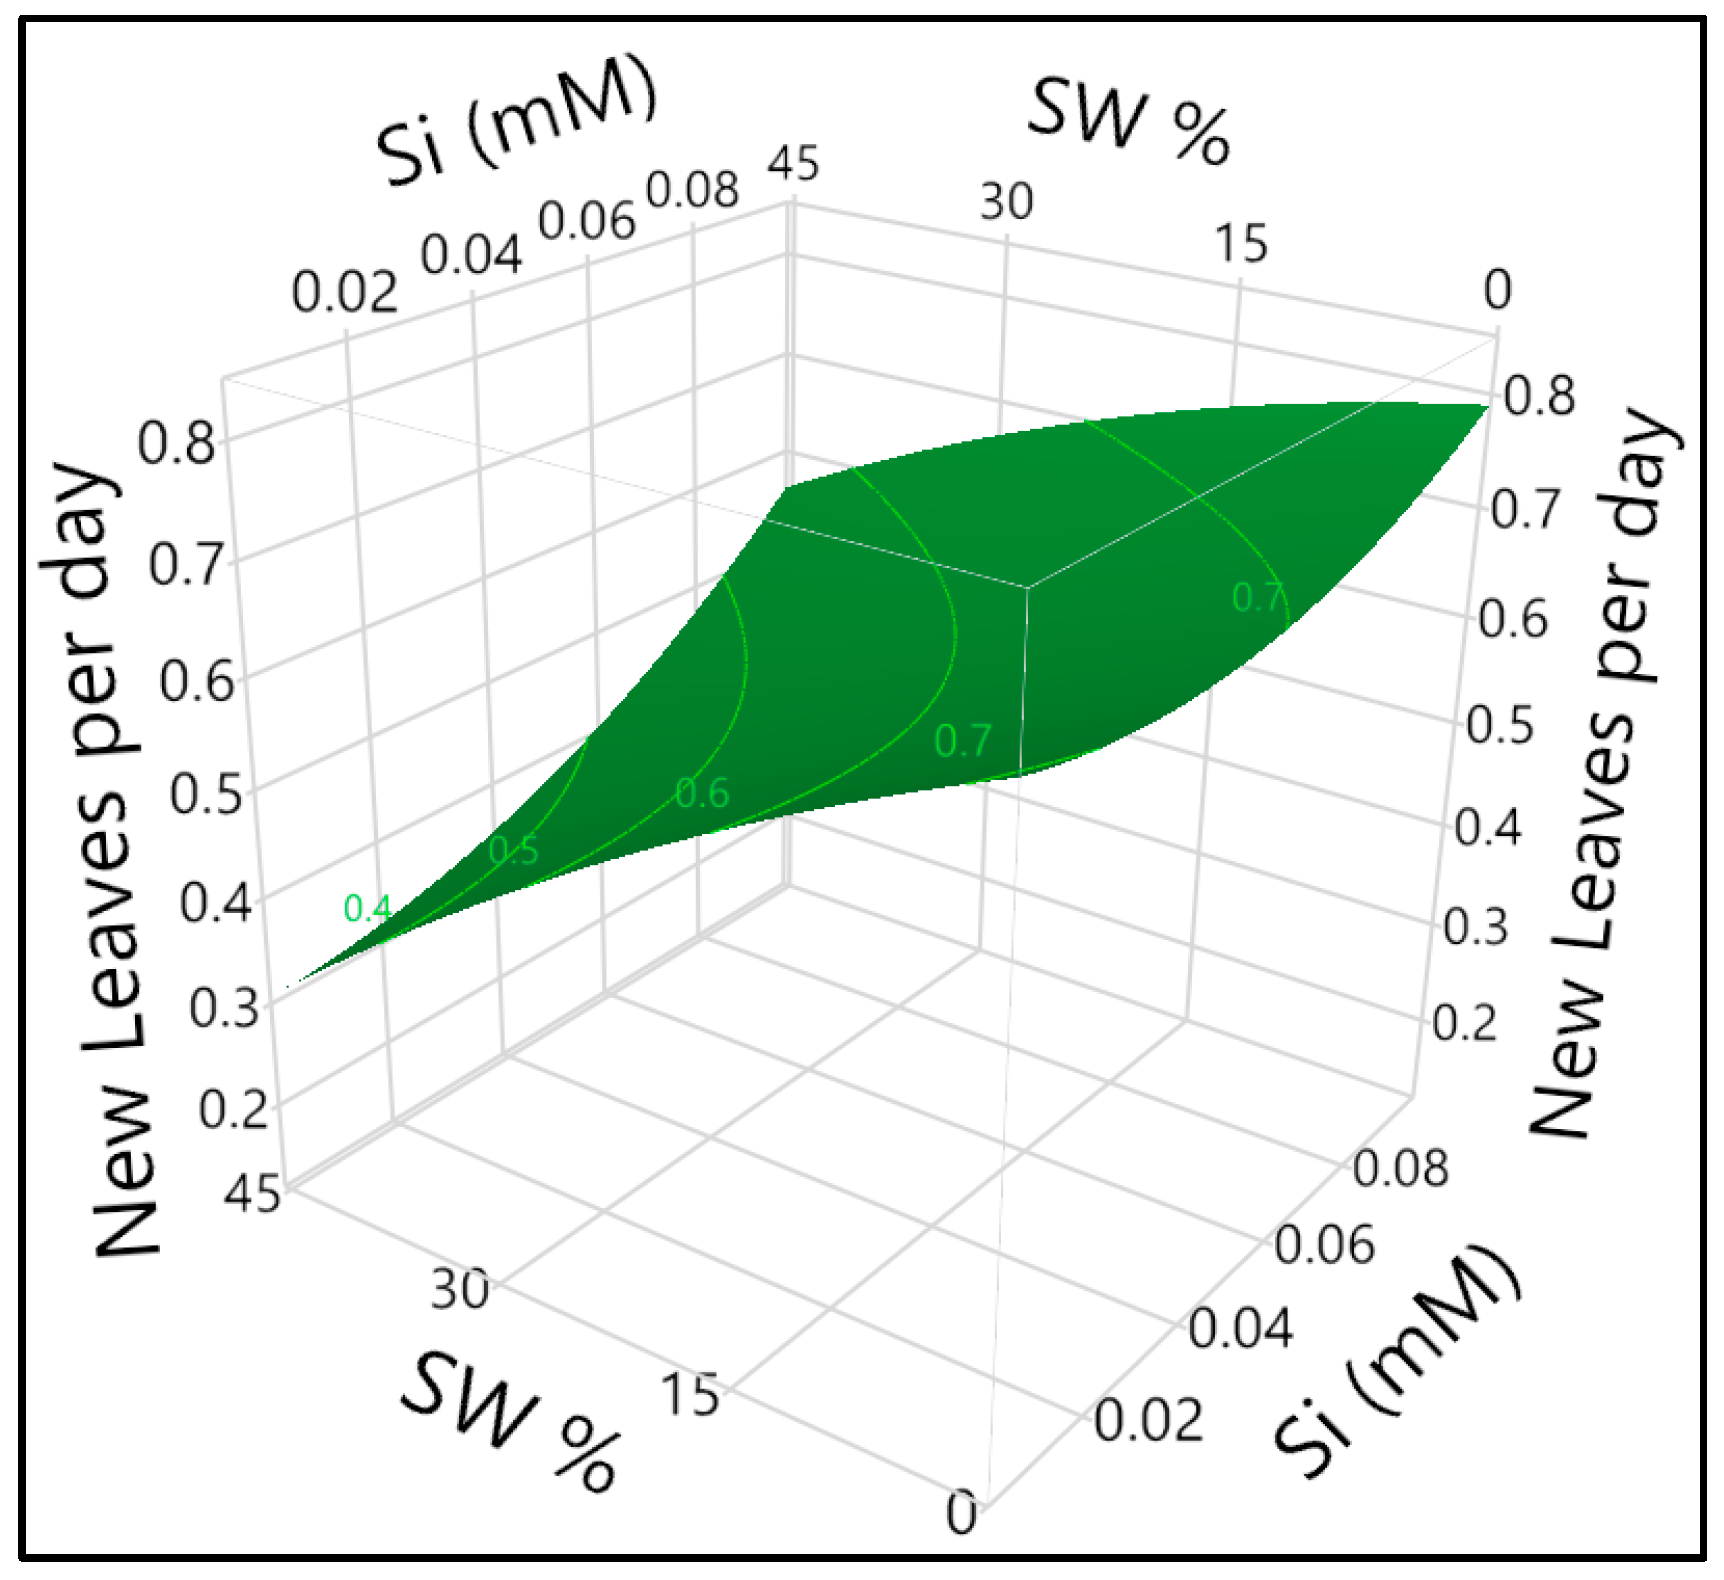
3.1. Calcium and Nitrogen Milieu Interaction and Impact on New Leaf Formation
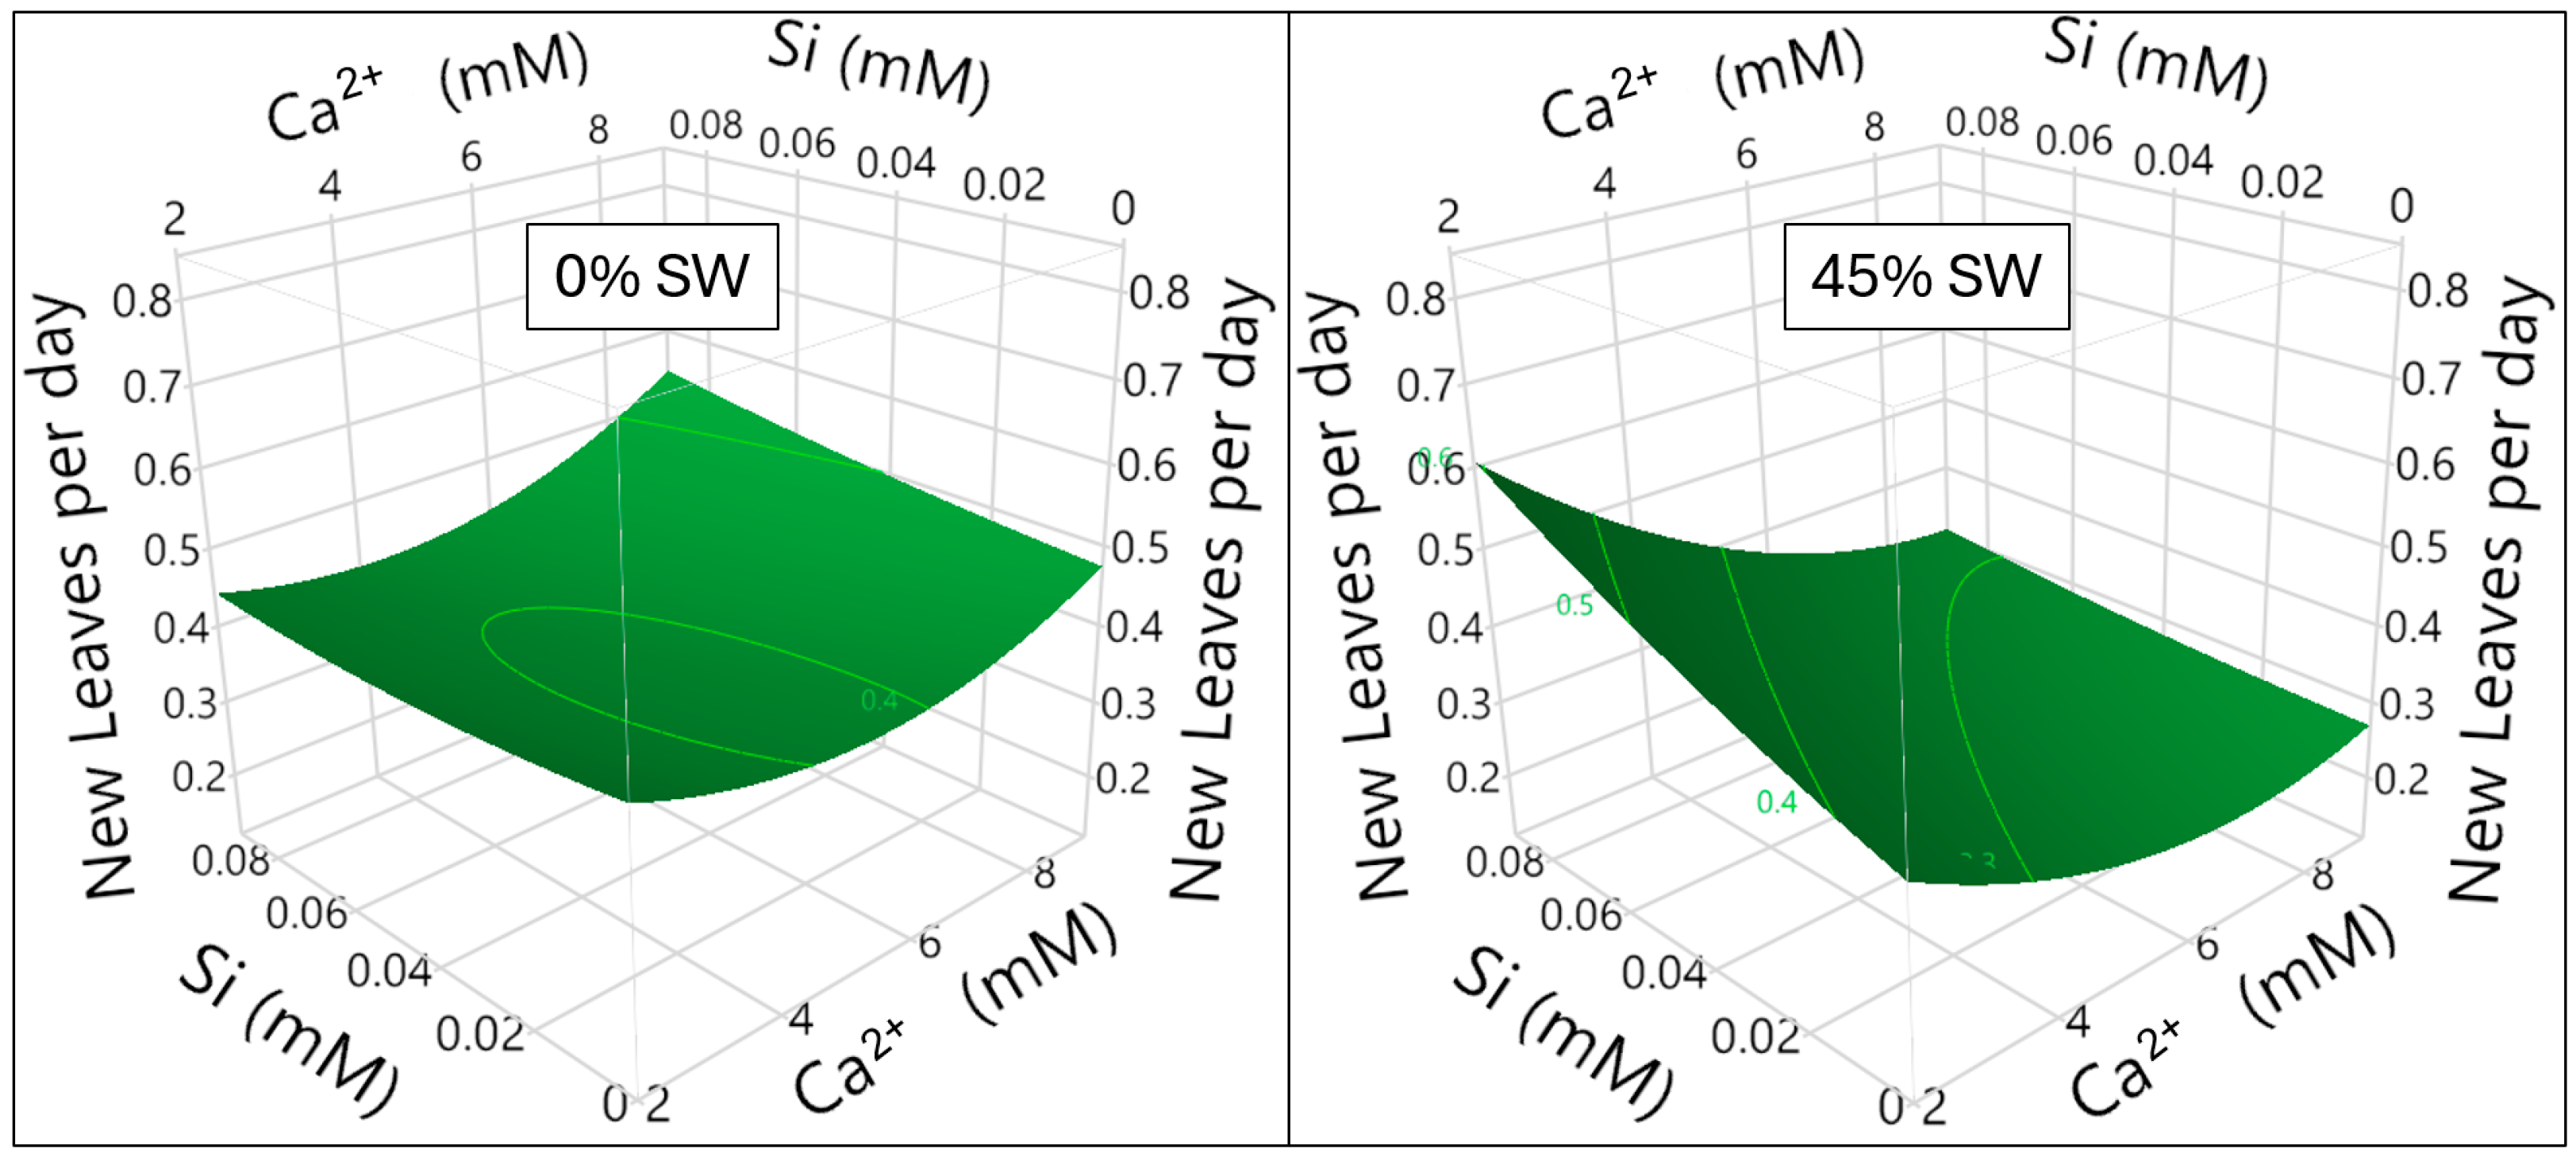
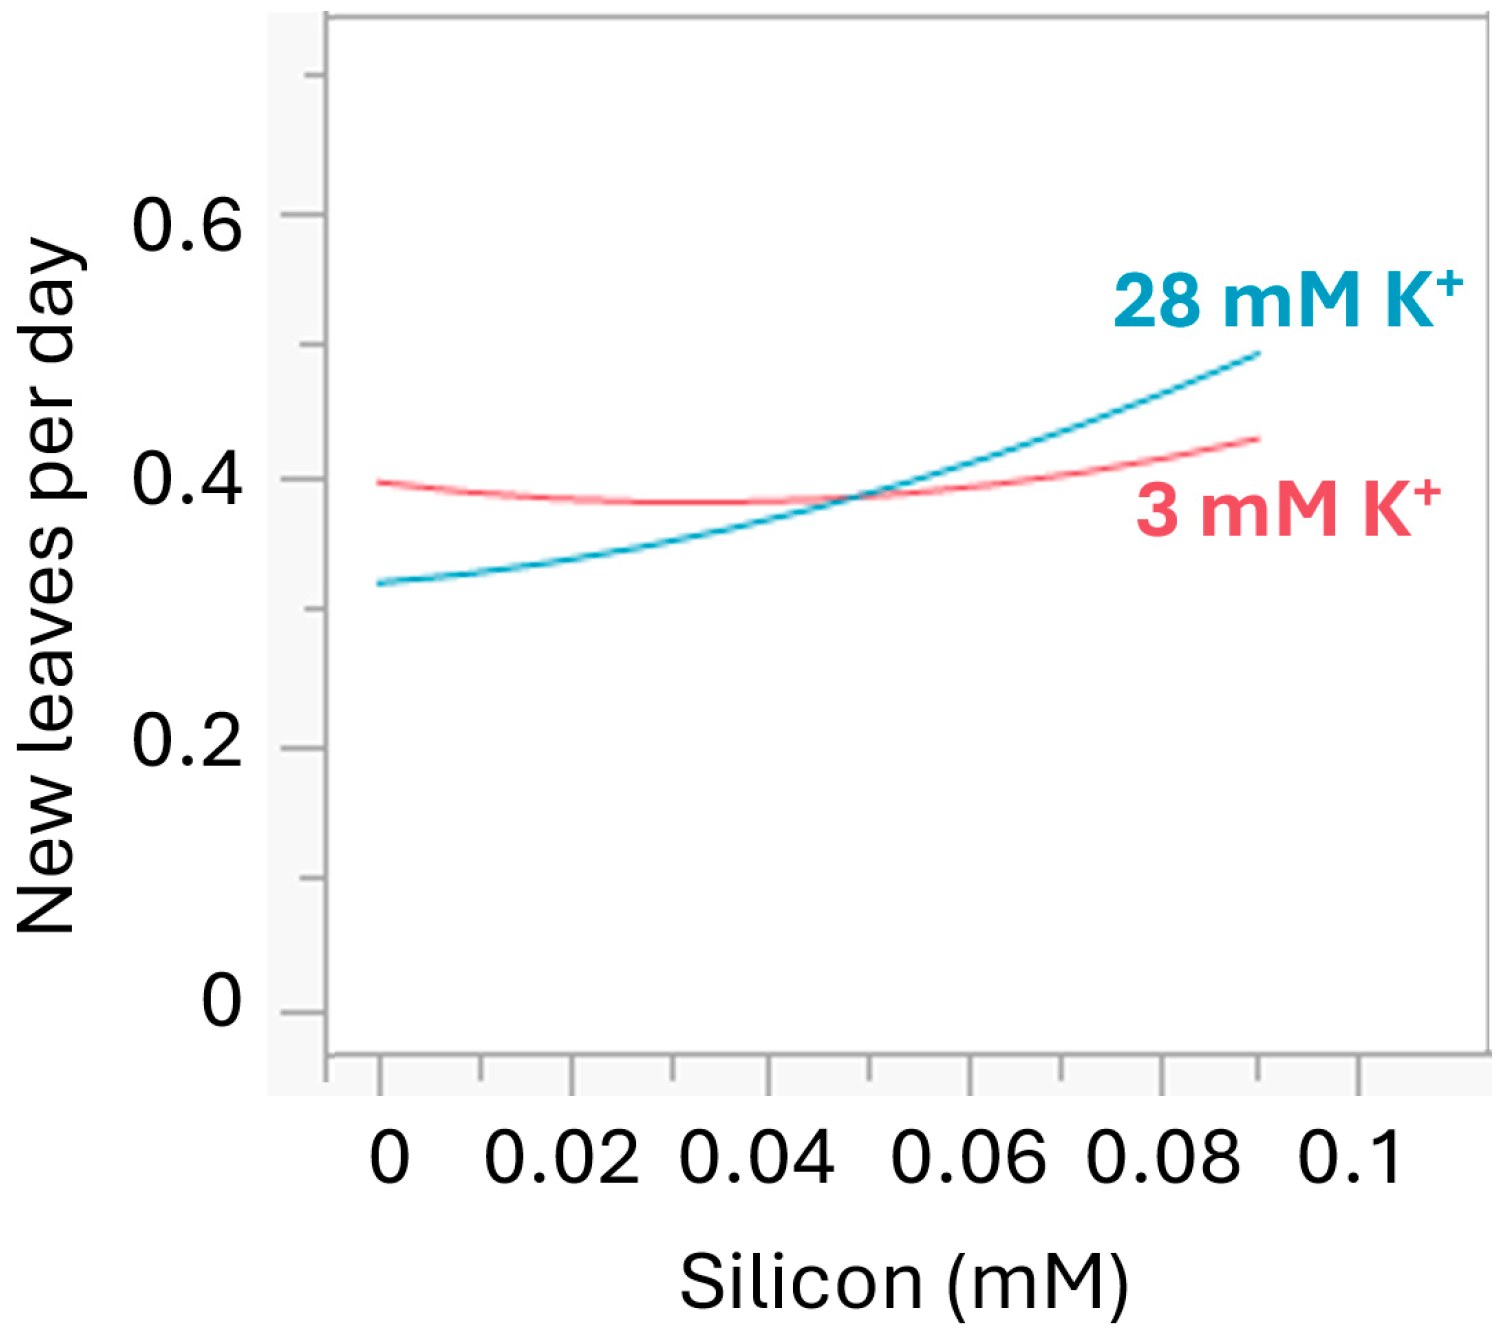
3.2. Silicon Milieu Interaction and Impact on New Leaf Formation
4. Discussion
4.1. Multivariate Approaches to Evaluating Salt Tolerance
4.2. Impact of Individual Factors and Interactions with Salinity Tolerance
4.3. Implications for Assay-Scale Hydroponic Systems and Future Work
5. Conclusions
Author Contributions
Funding
Data Availability Statement
Acknowledgments
Conflicts of Interest
Abbreviations
| DoE | Design of Experiments |
| FB | Florida Broadleaf |
| CB | Carolina Broadleaf |
| EC | Electrical conductivity |
| PPFD | Photosynthetic Proton Flux Density |
| RSM | Response surface model |
| DI | Deionized |
| RNS | Reactive nitrogen species |
| CEA | Controlled Environment Agriculture |
Appendix A

| Concentration (mM) of Ions in Fertilizer and Simulated Seawater (Instant Ocean®) | |||||||||||||
|---|---|---|---|---|---|---|---|---|---|---|---|---|---|
| Ca2+ | Mg2+ | K+ | Na+ | Si4+ | Fe2+ | Zn2+ | NH4+ | NO3− | SO42− | H2PO4− | Cl− | HCO3− | |
| -----------------------------------------------mM----------------------------------------------------------- | |||||||||||||
| Hoagland’s Solution | 2.0 | 1.0 | 3.0 | - | - | 2.2 × 10⁻³ | 4.0 × 10⁻⁴ | 0.5 | 4.0 | 1.0 | 0.5 | 2.3 × 10⁻³ | - |
| Instant Ocean® | 4.5 | 24. | 4.8 | 211.0 | - | - | - | - | - | 12.5 | - | 244.0 | 1.50 |
Appendix B
| ANOVA Modified Response Surface Model of New Leaves per Day | ||
|---|---|---|
| Model Term | Carolina Broadleaf | Florida Broadleaf |
| Intercept | <0.0001 | <0.0001 |
| Trial | <0.0001 | <0.0001 |
| Day | <0.0001 | <0.0001 |
| X coordinate | 0.9178 | 0.1704 |
| Y coordinate | 0.0203 | 0.0359 |
| Instant Ocean® strength (%) (SW) | <0.0001 | 0.0009 |
| Calcium mM (Ca) | 0.0590 | 0.4910 |
| Potassium mM (K) | 0.6615 | 0.1041 |
| Silicon mM (Si) | 0.2208 | 0.5547 |
| Zinc mM (Zn) | 0.4657 | 0.3796 |
| Total nitrogen mM (TN) | 0.1493 | 0.8121 |
| SW × SW | 0.7856 | 0.6019 |
| SW × Ca | 0.5668 | 0.3985 |
| Ca × Ca | 0.4933 | 0.4344 |
| SW × K | 0.8413 | 0.5176 |
| Ca × K | 0.8161 | 0.3094 |
| K × K | 0.8066 | 0.6258 |
| SW × Si | 0.6364 | 0.4494 |
| Ca × Si | 0.6957 | 0.9300 |
| K × Si | 0.0500 | 0.6401 |
| Si × Si | 0.3715 | 0.0371 |
| SW × Zn | 0.6575 | 0.4839 |
| Ca × Zn | 0.2623 | 0.2984 |
| K × Zn | 0.3904 | 0.0663 |
| Si × Zn | 0.9857 | 0.3909 |
| Zn × Zn | 0.2187 | 0.1392 |
| SW × TN | 0.4484 | 0.1636 |
| Ca × TN | 0.2368 | 0.0379 |
| K × TN | 0.6372 | 0.1902 |
| Si × TN | 0.7855 | 0.9724 |
| Zn × TN | 0.4667 | 0.800 |
| TN × TN | 0.5099 | 0.4629 |
| TN × TN × Ca | 0.0572 | 0.8356 |
| SW × Ca × Si | 0.0207 | 0.0816 |
| SW × Ca × Zn | 0.4869 | 0.7067 |
| Ca × Si × Si | 0.8627 | 0.2756 |
| SW × Si × Zn | 0.4772 | 0.6149 |
| SW × Ca × Si × Zn | 0.8954 | 0.1366 |
| R2 | 0.45 | 0.51 |
| R2a | 0.44 | 0.48 |
Appendix C

References
- Angelakis, A.N.; Tchobanoglous, G.; Capodaglio, A.G.; Tzanakakis, V.A. The Importance of Nonconventional Water Resources under Water Scarcity. Water 2024, 16, 1015. [Google Scholar] [CrossRef]
- Perumal, M.; Sekar, S.; Carvalho, P.C.S. Global Investigations of Seawater Intrusion (SWI) in Coastal Groundwaters in the Last Two Decades (2000–2020): A Bibliometric Analysis. Sustainability 2024, 16, 1266. [Google Scholar] [CrossRef]
- Stanton, J.S.; Anning, D.W.; Brown, C.J.; Moore, R.B.; McGuire, V.L.; Qi, S.L.; Harris, A.C.; Dennehy, K.F.; McMahon, P.B.; Degnan, J.R.; et al. Brackish Groundwater in the United States; U.S. Geological Survey Professional Paper; US Geological Survey: Reston, VA, USA, 2017. [Google Scholar]
- Su, Q.; Kambale, R.D.; Tzeng, J.-H.; Amy, G.L.; Ladner, D.A.; Karthikeyan, R. The growing trend of saltwater intrusion and its impact on coastal agriculture: Challenges and opportunities. Sci. Total. Environ. 2025, 966, 178701. [Google Scholar] [CrossRef]
- Edirisooriya, E.M.N.T.; Wang, H.; Banerjee, S.; Longley, K.; Wright, W.; Mizuno, W.; Xu, P. Economic feasibility of developing alternative water supplies for agricultural irrigation. Curr. Opin. Chem. Eng. 2023, 43, 100987. [Google Scholar] [CrossRef]
- Negrão, S.; Schmöckel, S.M.; Tester, M. Evaluating physiological responses of plants to salinity stress. Ann. Bot. 2016, 119, 1–11. [Google Scholar] [CrossRef] [PubMed]
- Kim, J.; Kim, H.-J.; Gang, M.-S.; Kim, D.-W.; Cho, W.-J.; Jang, J.K. Closed Hydroponic Nutrient Solution Management Using Multiple Water Sources. J. Biosyst. Eng. 2023, 48, 215–224. [Google Scholar] [CrossRef]
- Lakhiar, I.A.; Yan, H.; Syed, T.N.; Zhang, C.; Shaikh, S.A.; Rakibuzzaman; Vistro, R.B. Soilless Agricultural Systems: Opportunities, Challenges, and Applications for Enhancing Horticultural Resilience to Climate Change and Urbanization. Horticulturae 2025, 11, 568. [Google Scholar] [CrossRef]
- Kumari, S.; Chhillar, H.; Chopra, P.; Khanna, R.R.; Khan, M.I.R. Potassium: A track to develop salinity tolerant plants. Plant Physiol. Biochem. 2021, 167, 1011–1023. [Google Scholar] [CrossRef]
- Sun, T.; Ma, N.; Wang, C.; Fan, H.; Wang, M.; Zhang, J.; Cao, J.; Wang, D. A Golgi-Localized Sodium/Hydrogen Exchanger Positively Regulates Salt Tolerance by Maintaining Higher K+/Na+ Ratio in Soybean. Front. Plant Sci. 2021, 12, 638340. [Google Scholar] [CrossRef]
- Reid, R.; Hayes, J. Mechanisms and control of nutrient uptake in plants. Int. Rev. Cytol. 2003, 229, 73–114. [Google Scholar] [CrossRef]
- Ekman, V.W.; Sverdrup, H.U.; Johnson, M.W.; Fleming, R.H. The Oceans, Their Physics, Chemistry and General Biology. Geogr. Ann. 1945, 27, 388. [Google Scholar] [CrossRef]
- Rietra, R.P.J.J.; Heinen, M.; Dimkpa, C.O.; Bindraban, P.S. Effects of Nutrient Antagonism and Synergism on Yield and Fertilizer Use Efficiency. Commun. Soil Sci. Plant Anal. 2017, 48, 1895–1920. [Google Scholar] [CrossRef]
- Niedz, R.; Evens, T. Design of experiments (DOE)—History, concepts, and relevance to in vitro culture. Vitr. Cell. Dev. Biol.-Plant 2016, 52, 547–562. [Google Scholar] [CrossRef]
- Singh, R.K.; Kota, S.; Flowers, T.J. Salt tolerance in rice: Seedling and reproductive stage QTL mapping come of age. Theor. Appl. Genet. 2021, 134, 3495–3533. [Google Scholar] [CrossRef]
- Kratky, B.A. A capillary, noncirculating hydroponic method for leaf and semi-head lettuce. HortTechnology 1993, 3, 206–207. [Google Scholar] [CrossRef]
- Gumisiriza, M.S.; Ndakidemi, P.A.; Mbega, E.R. A simplified non-greenhouse hydroponic system for small-scale soilless urban vegetable farming. MethodsX 2022, 9, 101882. [Google Scholar] [CrossRef]
- Naeem, M.; Iqbal, M.; Shakeel, A.; Ul-Allah, S.; Hussain, M.; Rehman, A.; Zafar, Z.U.; Athar, H.-U.; Ashraf, M. Genetic basis of ion exclusion in salinity stressed wheat: Implications in improving crop yield. Plant Growth Regul. 2020, 92, 479–496. [Google Scholar] [CrossRef]
- Gobade, A.; Arathi, S.; Gijare, S.; Pawar, D.; Patil, A.S. Evaluating salt tolerance in soybean core collection: Germination response under salinity stress. Genet. Resour. Crop. Evol. 2024, 72, 2059–2076. [Google Scholar] [CrossRef]
- Yan, N.; Cao, J.; Wang, J.; Zou, X.; Yu, X.; Zhang, X.; Si, T. Seed priming with graphene oxide improves salinity tolerance and increases productivity of peanut through modulating multiple physiological processes. J. Nanobiotechnol. 2024, 22, 565. [Google Scholar] [CrossRef]
- Borisjuk, L.; Rolletschek, H.; Radchuk, R.; Weschke, W.; Wobus, U.; Weber, H. Seed development and differentiation: A role for metabolic regulation. Plant Biol. 2004, 6, 375–386. [Google Scholar] [CrossRef]
- Yan, L.; Lu, M.; Riaz, M.; Gao, G.; Tong, K.; Yu, H.; Wang, L.; Cui, K.; Wang, J.; Niu, Y.; et al. Differential response of proline metabolism defense, Na+ absorption and deposition to salt stress in salt-tolerant and salt-sensitive rapeseed (Brassica napus L.) genotypes. Physiol. Plant. 2024, 176, e14460. [Google Scholar] [CrossRef] [PubMed]
- Wang, L.; Zheng, J.; Zhou, G.; Li, J.; Qian, C.; Lin, G.; Li, Y.; Zuo, Q. Moderate nitrogen application improved salt tolerance by enhancing photosynthesis, antioxidants, and osmotic adjustment in rapeseed (Brassica napus L.). Front. Plant Sci. 2023, 14, 1196319. [Google Scholar] [CrossRef]
- Laccetti, L.; Salbitani, G.; Lumaga, M.R.B.; Bossa, R.; Cerasuolo, P.; Loreto, F.; Manna, M.; Carfagna, S.; Scopece, G. How to survive on Mediterranean coastal cliffs: Tolerance to seawater in early life-cycle stages in Brassica incana Ten. (Brassicaceae). Plant Biol. 2024, 26, 977–988. [Google Scholar] [CrossRef] [PubMed]
- Jamil, M.; Malik, Z. Parveen Salt stress manifestation on plants, mechanism of salt tolerance and potassium role in alleviating it: A review. Zemdirbyste-Agric. 2016, 103, 229–238. [Google Scholar] [CrossRef]
- Tittal, M.; Mir, R.A.; Jatav, K.S.; Agarwal, R.M. Supplementation of potassium alleviates water stress-induced changes in Sorghum bicolor L. Physiol. Plant. 2021, 172, 1149–1161. [Google Scholar] [CrossRef]
- Hessini, K.; Issaoui, K.; Ferchichi, S.; Saif, T.; Abdelly, C.; Siddique, K.H.; Cruz, C. Interactive effects of salinity and nitrogen forms on plant growth, photosynthesis and osmotic adjustment in maize. Plant Physiol. Biochem. 2019, 139, 171–178. [Google Scholar] [CrossRef]
- Sikder, R.K.; Wang, X.; Zhang, H.; Gui, H.; Dong, Q.; Jin, D.; Song, M. Nitrogen enhances salt tolerance by modulating the antioxidant defense system and osmoregulation substance content in Gossypium hirsutum. Plants 2020, 9, 450. [Google Scholar] [CrossRef]
- Islam, M.; Jahan, K.; Sen, A.; Urmi, T.A.; Haque, M.M.; Ali, H.M.; Siddiqui, M.H.; Murata, Y. Exogenous Application of Calcium Ameliorates Salinity Stress Tolerance of Tomato (Solanum lycopersicum L.) and Enhances Fruit Quality. Antioxidants 2023, 12, 558. [Google Scholar] [CrossRef]
- Zrig, A.; AbdElgawad, H.; Touneckti, T.; Ben Mohamed, H.; Hamouda, F.; Khemira, H. Potassium and calcium improve salt tolerance of Thymus vulgaris by activating the antioxidant systems. Sci. Hortic. 2021, 277, 109812. [Google Scholar] [CrossRef]
- Yang, W.; Gao, Y.; Wang, X.; Li, S.; Zheng, H.; Chen, Z.; Wu, F.; Du, X.; Sui, N. Exogenous calcium application enhances salt tolerance of sweet sorghum seedlings. J. Agron. Crop. Sci. 2022, 208, 441–453. [Google Scholar] [CrossRef]
- Kambale, R.D.; Su, Q.; Karthikeyan, R.; Adelberg, J.; Jeong, B.R. Enhancing Resilience in Hydroponic Crops with Silicon: Insights into Growth Enhancement and Stress Mitigation; Springer: Cham, Switzerland, 2024. [Google Scholar]
- Alayafi, A.H.; Al-Solaimani, S.G.M.; El-Wahed, M.H.A.; Alghabari, F.M.; El Sabagh, A. Silicon supplementation enhances productivity, water use efficiency and salinity tolerance in maize. Front. Plant Sci. 2022, 13, 953451. [Google Scholar] [CrossRef]
- Dhiman, P.; Rajora, N.; Bhardwaj, S.; Sudhakaran, S.S.; Kumar, A.; Raturi, G.; Chakraborty, K.; Gupta, O.P.; Devanna, B.; Tripathi, D.K.; et al. Fascinating role of silicon to combat salinity stress in plants: An updated overview. Plant Physiol. Biochem. 2021, 162, 110–123. [Google Scholar] [CrossRef] [PubMed]
- Khan, I.; Awan, S.A.; Rizwan, M.; Brestic, M.; Xie, W. Silicon: An essential element for plant nutrition and phytohormones signaling mechanism under stressful conditions. Plant Growth Regul. 2022, 100, 301–319. [Google Scholar] [CrossRef]
- Shao, J.; Tang, W.; Huang, K.; Ding, C.; Wang, H.; Zhang, W.; Li, R.; Aamer, M.; Hassan, M.U.; Elnour, R.O.; et al. How Does Zinc Improve Salinity Tolerance? Mechanisms and Future Prospects. Plants 2023, 12, 3207. [Google Scholar] [CrossRef] [PubMed]
- Ahmad, P.; Ahanger, M.A.; Alyemeni, M.N.; Wijaya, L.; Egamberdieva, D.; Bhardwaj, R.; Ashraf, M. Zinc application mitigates the adverse effects of NaCl stress on mustard [Brassica juncea (L.) Czern & Coss] through modulating compatible organic solutes, antioxidant enzymes, and flavonoid content. J. Plant Interact. 2017, 12, 429–437. [Google Scholar] [CrossRef]
- Hanley, M.E.; Sanders, S.K.D.; Stanton, H.M.; Billington, R.A.; Boden, R. A pinch of salt: Response of coastal grassland plants to simulated seawater inundation treatments. Ann. Bot. 2020, 125, 265–275. [Google Scholar] [CrossRef]
- Morris, T.P.; van Smeden, M.; Pham, T.M. The marginality principle revisited: Should “higher-order” terms always be accompanied by “lower-order” terms in regression analyses? Biom. J. 2023, 65, e2300069. [Google Scholar] [CrossRef]
- Yousuf, P.Y.; Ahmad, A.; Kardam, H.; Ganie, A.H.; Aref, I.M.; Iqbal, M. Potassium and calcium application ameliorates growth and oxidative homeostasis in salt-stressed Indian mustard (Brassica juncea) plants. Pak J. Bot. 2015, 47, 1629–1639. [Google Scholar]
- Iqbal, N.; Umar, S.; Khan, N.A. Nitrogen availability regulates proline and ethylene production and alleviates salinity stress in mustard (Brassica juncea). J. Plant Physiol. 2015, 178, 84–91. [Google Scholar] [CrossRef]
- Siddiqui, H.; Yusuf, M.; Faraz, A.; Faizan, M.; Sami, F.; Hayat, S. 24-Epibrassinolide supplemented with silicon enhances the photosynthetic efficiency of Brassica juncea under salt stress. S. Afr. J. Bot. 2018, 118, 120–128. [Google Scholar] [CrossRef]
- Rees, S. An Introduction to the Chemistry of the Sea, 2nd. ed.; Pilson, M.E.Q., Ed.; New Directions in the Teaching of Physical Sciences; Cambridge University Press: Cambridge, UK, 2016; pp. 107–108. [Google Scholar] [CrossRef]
- Feng, D.; Wang, X.; Gao, J.; Zhang, C.; Liu, H.; Liu, P.; Sun, X. Exogenous calcium: Its mechanisms and research advances involved in plant stress tolerance. Front. Plant Sci. 2023, 14, 1143963. [Google Scholar] [CrossRef] [PubMed]
- Mangal, V.; Lal, M.K.; Tiwari, R.K.; Altaf, M.A.; Sood, S.; Kumar, D.; Bharadwaj, V.; Singh, B.; Singh, R.K.; Aftab, T. Molecular Insights into the Role of Reactive Oxygen, Nitrogen and Sulphur Species in Conferring Salinity Stress Tolerance in Plants. J. Plant Growth Regul. 2022, 42, 554–574. [Google Scholar] [CrossRef]
- Etesami, H.; Jeong, B.R. How does silicon help alleviate biotic and abiotic stresses in plants? Mechanisms and future prospects. In Plant Stress Mitigators: Types, Techniques and Functions; Academic Press: Cambridge, MA, USA, 2023; pp. 359–402. [Google Scholar]
- Kumawat, G.; Jakhar, M.L.; Singh, V.; Singh, J.; Gothwal, D.K.; Yadava, D.K. High throughput phenotyping of functional traits and key indices for selection of salt tolerant Mustard [Brassica juncea (L.) Czern & Coss] genotypes. Physiol. Plant. 2024, 176, e14178. [Google Scholar] [CrossRef] [PubMed]

| Treatment Combinations of Experimental Units Guided by DoE Matrix | ||||||
|---|---|---|---|---|---|---|
| mM | ||||||
| Unit | SW (%) | TN | K | Ca | Si | Zn |
| 1 | 45 | 14 | 0 | 5 | 0.09 | 0 |
| 2 | 45 | 14 | 0 | 5 | 0.09 | 0 |
| 3 | 30 | 0 | 9 | 0 | 0.09 | 0.2 |
| 4 | 30 | 0 | 9 | 0 | 0.09 | 0.2 |
| 5 | 0 | 28 | 21 | 2 | 0.09 | 0.2 |
| 6 | 45 | 14 | 21 | 0 | 0.09 | 0 |
| 7 | 45 | 14 | 0 | 0 | 0 | 0.2 |
| 8 | 45 | 0 | 21 | 5 | 0.03 | 0 |
| 9 | 45 | 28 | 0 | 5 | 0.03 | 0.2 |
| 10 | 0 | 28 | 21 | 0 | 0 | 0.05 |
| 11 | 0 | 14 | 0 | 5 | 0 | 0 |
| 12 | 45 | 28 | 0 | 0 | 0.09 | 0.05 |
| 13 | 0 | 0 | 21 | 2 | 0 | 0 |
| 14 | 45 | 0 | 0 | 0 | 0.03 | 0 |
| 15 | 0 | 28 | 21 | 5 | 0.03 | 0 |
| 16 | 45 | 0 | 21 | 0 | 0 | 0.05 |
| 17 | 30 | 28 | 21 | 0 | 0.03 | 0.2 |
| 18 | 45 | 0 | 9 | 5 | 0.09 | 0.2 |
| 19 | 0 | 28 | 9 | 5 | 0 | 0.2 |
| 20 | 0 | 14 | 0 | 0 | 0.09 | 0.2 |
| 21 | 0 | 28 | 0 | 2 | 0 | 0.05 |
| 22 | 0 | 0 | 21 | 0 | 0.09 | 0.05 |
| 23 | 0 | 14 | 0 | 5 | 0.09 | 0.2 |
| 24 | 0 | 0 | 9 | 0 | 0 | 0.2 |
| 25 | 30 | 14 | 21 | 5 | 0 | 0.2 |
| 26 | 45 | 14 | 21 | 2 | 0.03 | 0.2 |
| 27 | 0 | 28 | 9 | 0 | 0.09 | 0 |
| 28 | 15 | 14 | 0 | 0 | 0.03 | 0 |
| 29 | 15 | 28 | 0 | 5 | 0.09 | 0 |
| 30 | 0 | 0 | 9 | 5 | 0.09 | 0 |
| 31 | 0 | 0 | 21 | 5 | 0.03 | 0.2 |
| 32 | 45 | 0 | 0 | 5 | 0 | 0.05 |
| 33 | 45 | 28 | 21 | 2 | 0 | 0 |
| 34 | 45 | 28 | 0 | 2 | 0 | 0 |
| 35 | 15 | 0 | 0 | 2 | 0 | 0.2 |
| 36 | 45 | 28 | 21 | 5 | 0.09 | 0.05 |
| 37 | 15 | 14 | 9 | 2 | 0.03 | 0.05 |
| 38 | 0 | 0 | 0 | 2 | 0.09 | 0 |
| 39 | 30 | 14 | 9 | 2 | 0.03 | 0.05 |
| 40 | 30 | 14 | 9 | 2 | 0.03 | 0.05 |
| 41 | 15 | 14 | 9 | 2 | 0.03 | 0.05 |
| 42 | 15 | 14 | 9 | 2 | 0.03 | 0.05 |
| Temperature (°C) | Humidity (%) | PPFD (µmol m−2s−1) | |||||
|---|---|---|---|---|---|---|---|
| Dates | Day | Night | Day | Night | Day | Night | |
| Trial 1 | 1/14/24–1/24/24 | 20.8 ± 0.2 | 15.7 ± 0.2 | 31.3 ± 0.7 | 33.3 ± 0.5 | 83.0 ± 5.0 | 5.0 ± 0.1 |
| Trial 2 | 1/28/24–2/7/24 | 24.7 ± 0.3 | 17.8 ± 0.1 | 38.60 ± 0.3 | 43.7 ± 0.3 | 136.4 ± 9.4 | 9.4 ± 0.2 |
| Trial 3 | 2/14/24–2/24/24 | 26.1 ± 0.4 | 17.89 ± 0.1 | 37.8 ± 0.5 | 44.2 ± 0.5 | 179.8 ± 12.5 | 12.5 ± 0.1 |
| Trial 4 | 3/29/24–4/8/24 | 27.2 ± 0.3 | 19.2 ± 0.2 | 46.6 ± 0.9 | 58.6 ± 0.8 | 199.6 ± 10.5 | 10.5 ± 0.1 |
| Abridged ANOVA Modified Response Surface Model of New Leaves per Day | ||
|---|---|---|
| Model Term | Carolina Broadleaf | Florida Broadleaf |
| Intercept | *** | *** |
| Trial | *** | *** |
| Day | *** | *** |
| Y coordinate | * | * |
| Instant Ocean® strength (%) (SW) | *** | ** |
| K × Si | * | |
| Si × Si | * | |
| Ca × TN | * | |
| SW × Ca × Si | * | |
| R2 | 0.45 | 0.51 |
| R2a | 0.44 | 0.48 |
Disclaimer/Publisher’s Note: The statements, opinions and data contained in all publications are solely those of the individual author(s) and contributor(s) and not of MDPI and/or the editor(s). MDPI and/or the editor(s) disclaim responsibility for any injury to people or property resulting from any ideas, methods, instructions or products referred to in the content. |
© 2025 by the authors. Licensee MDPI, Basel, Switzerland. This article is an open access article distributed under the terms and conditions of the Creative Commons Attribution (CC BY) license (https://creativecommons.org/licenses/by/4.0/).
Share and Cite
Tomlin, M.; Bridges, W.; Su, Q.; Karthikeyan, R.; Jeong, B.R.; Liu, H.; Amy, G.L.; Adelberg, J. Combining Diluted Seawater and Fertilizer in an Ion-Based Multivariate Approach as an Effective Assay of Salt Tolerance in Brassica juncea Seedlings. Horticulturae 2025, 11, 820. https://doi.org/10.3390/horticulturae11070820
Tomlin M, Bridges W, Su Q, Karthikeyan R, Jeong BR, Liu H, Amy GL, Adelberg J. Combining Diluted Seawater and Fertilizer in an Ion-Based Multivariate Approach as an Effective Assay of Salt Tolerance in Brassica juncea Seedlings. Horticulturae. 2025; 11(7):820. https://doi.org/10.3390/horticulturae11070820
Chicago/Turabian StyleTomlin, Morgan, William Bridges, Qiong Su, Raghupathy Karthikeyan, Byoung Ryong Jeong, Haibo Liu, Gary L. Amy, and Jeffrey Adelberg. 2025. "Combining Diluted Seawater and Fertilizer in an Ion-Based Multivariate Approach as an Effective Assay of Salt Tolerance in Brassica juncea Seedlings" Horticulturae 11, no. 7: 820. https://doi.org/10.3390/horticulturae11070820
APA StyleTomlin, M., Bridges, W., Su, Q., Karthikeyan, R., Jeong, B. R., Liu, H., Amy, G. L., & Adelberg, J. (2025). Combining Diluted Seawater and Fertilizer in an Ion-Based Multivariate Approach as an Effective Assay of Salt Tolerance in Brassica juncea Seedlings. Horticulturae, 11(7), 820. https://doi.org/10.3390/horticulturae11070820