
Study on the Variation Patterns of Main Components and Chromaticity During the Developmental Process of Magnoliae Flos (Magnolia biondii)

Abstract
1. Introduction
2. Materials and Methods
2.1. Materials and Reagents
2.2. Extraction of Volatile Oil
2.3. GC-MS Analysis Conditions
2.4. UPLC Chromatographic Conditions
2.5. Mass Spectrometry Conditions
2.6. Preparation of Reference Solution
2.7. Preparation of Test Solution
3. Results
3.1. Characterization of Volatile Compounds
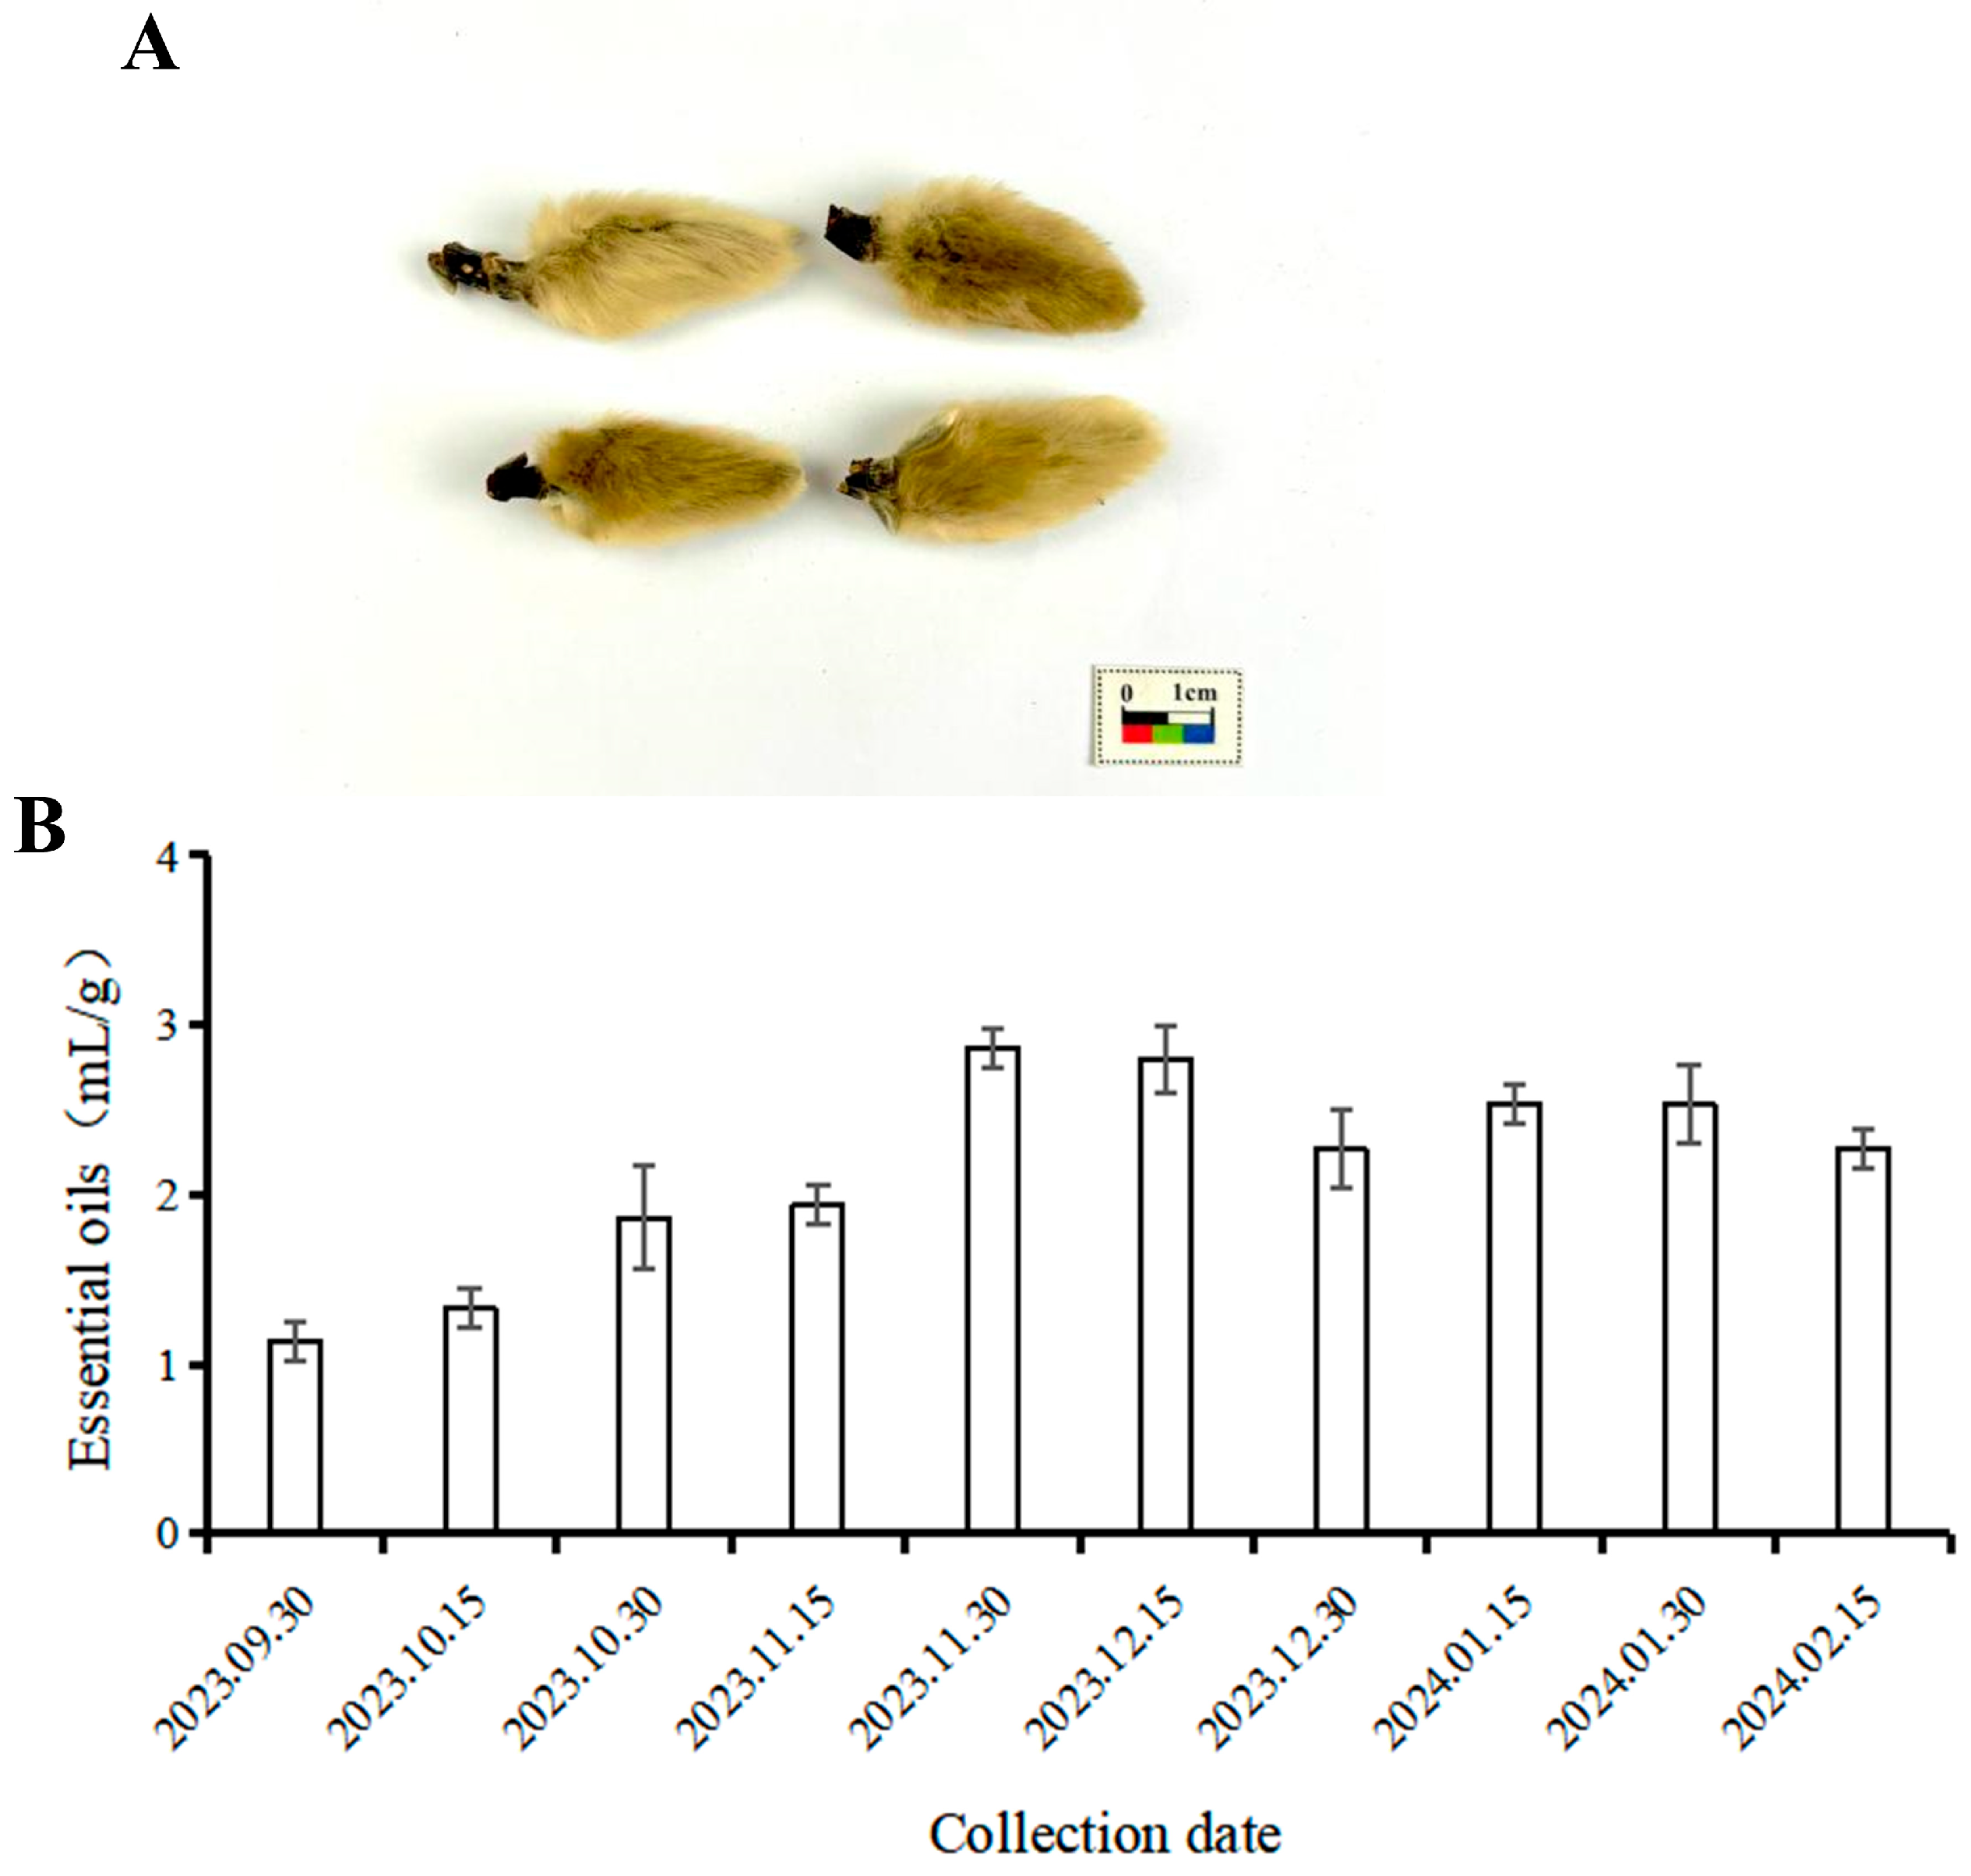
3.1.1. Comparison of Volatile Oil Content in MF at Different Developmental Stages
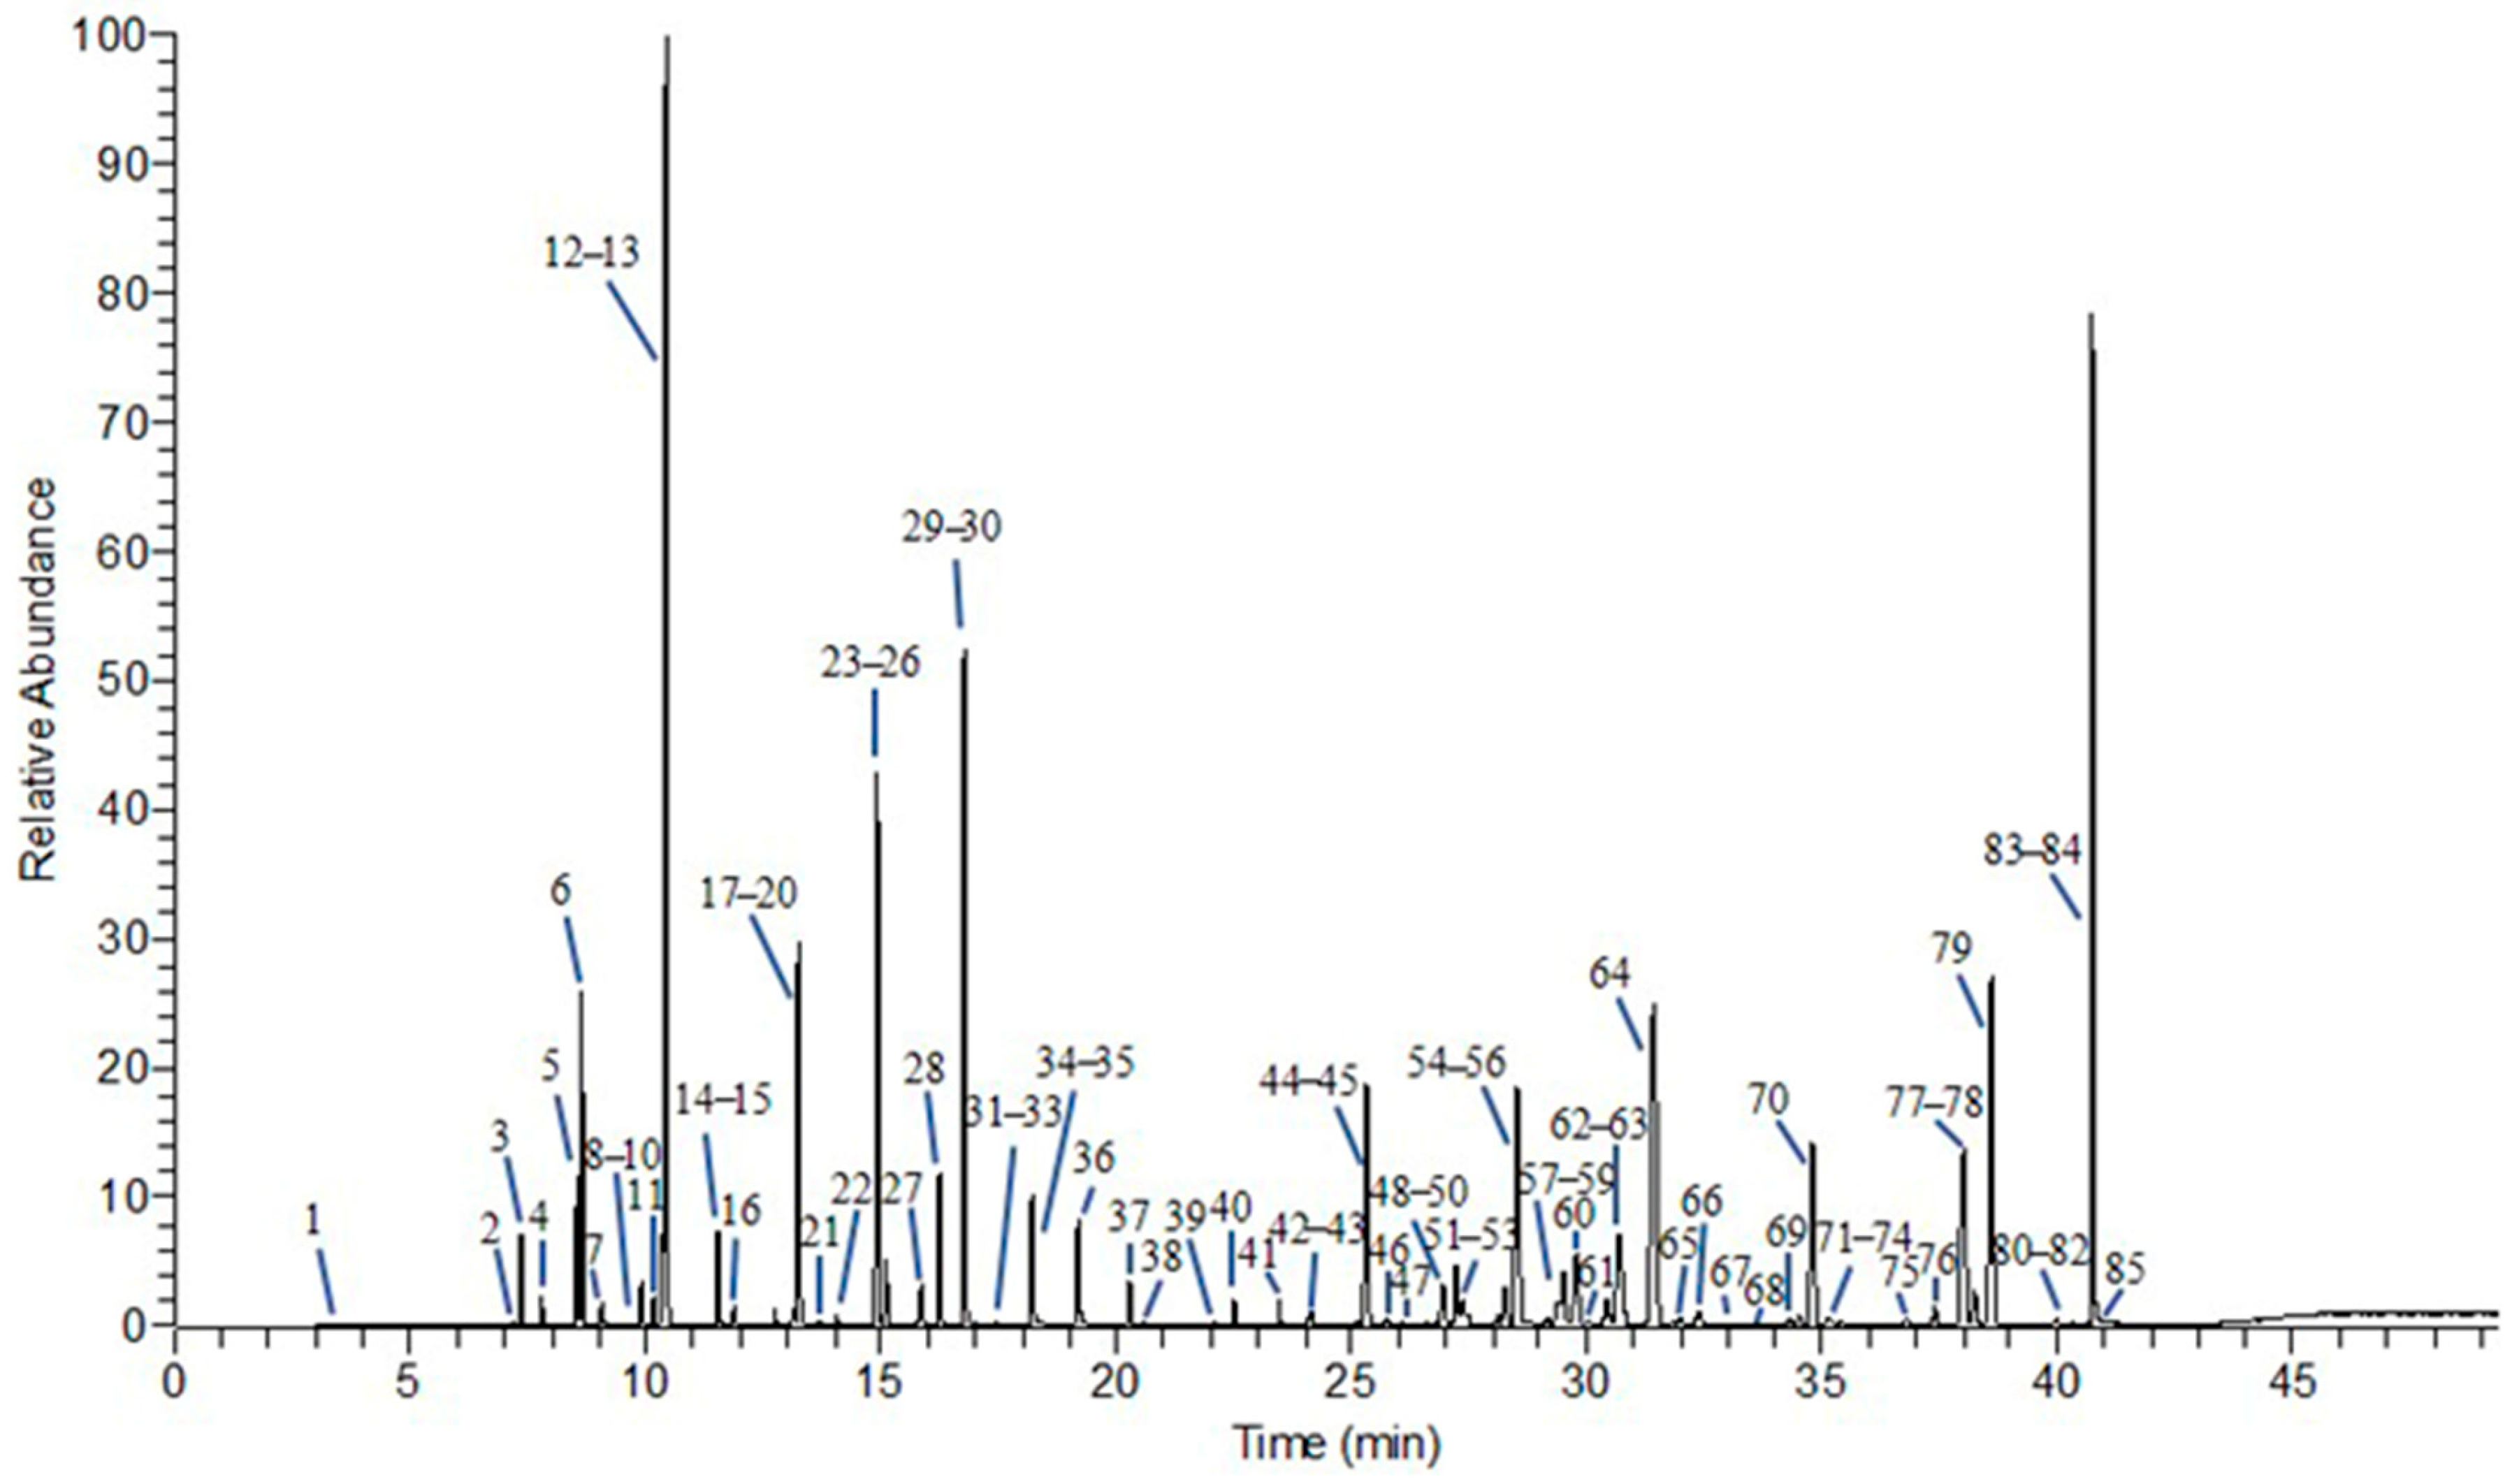
3.1.2. Analysis of Chemical Components in Volatile Oils from MF at Different Developmental Stages
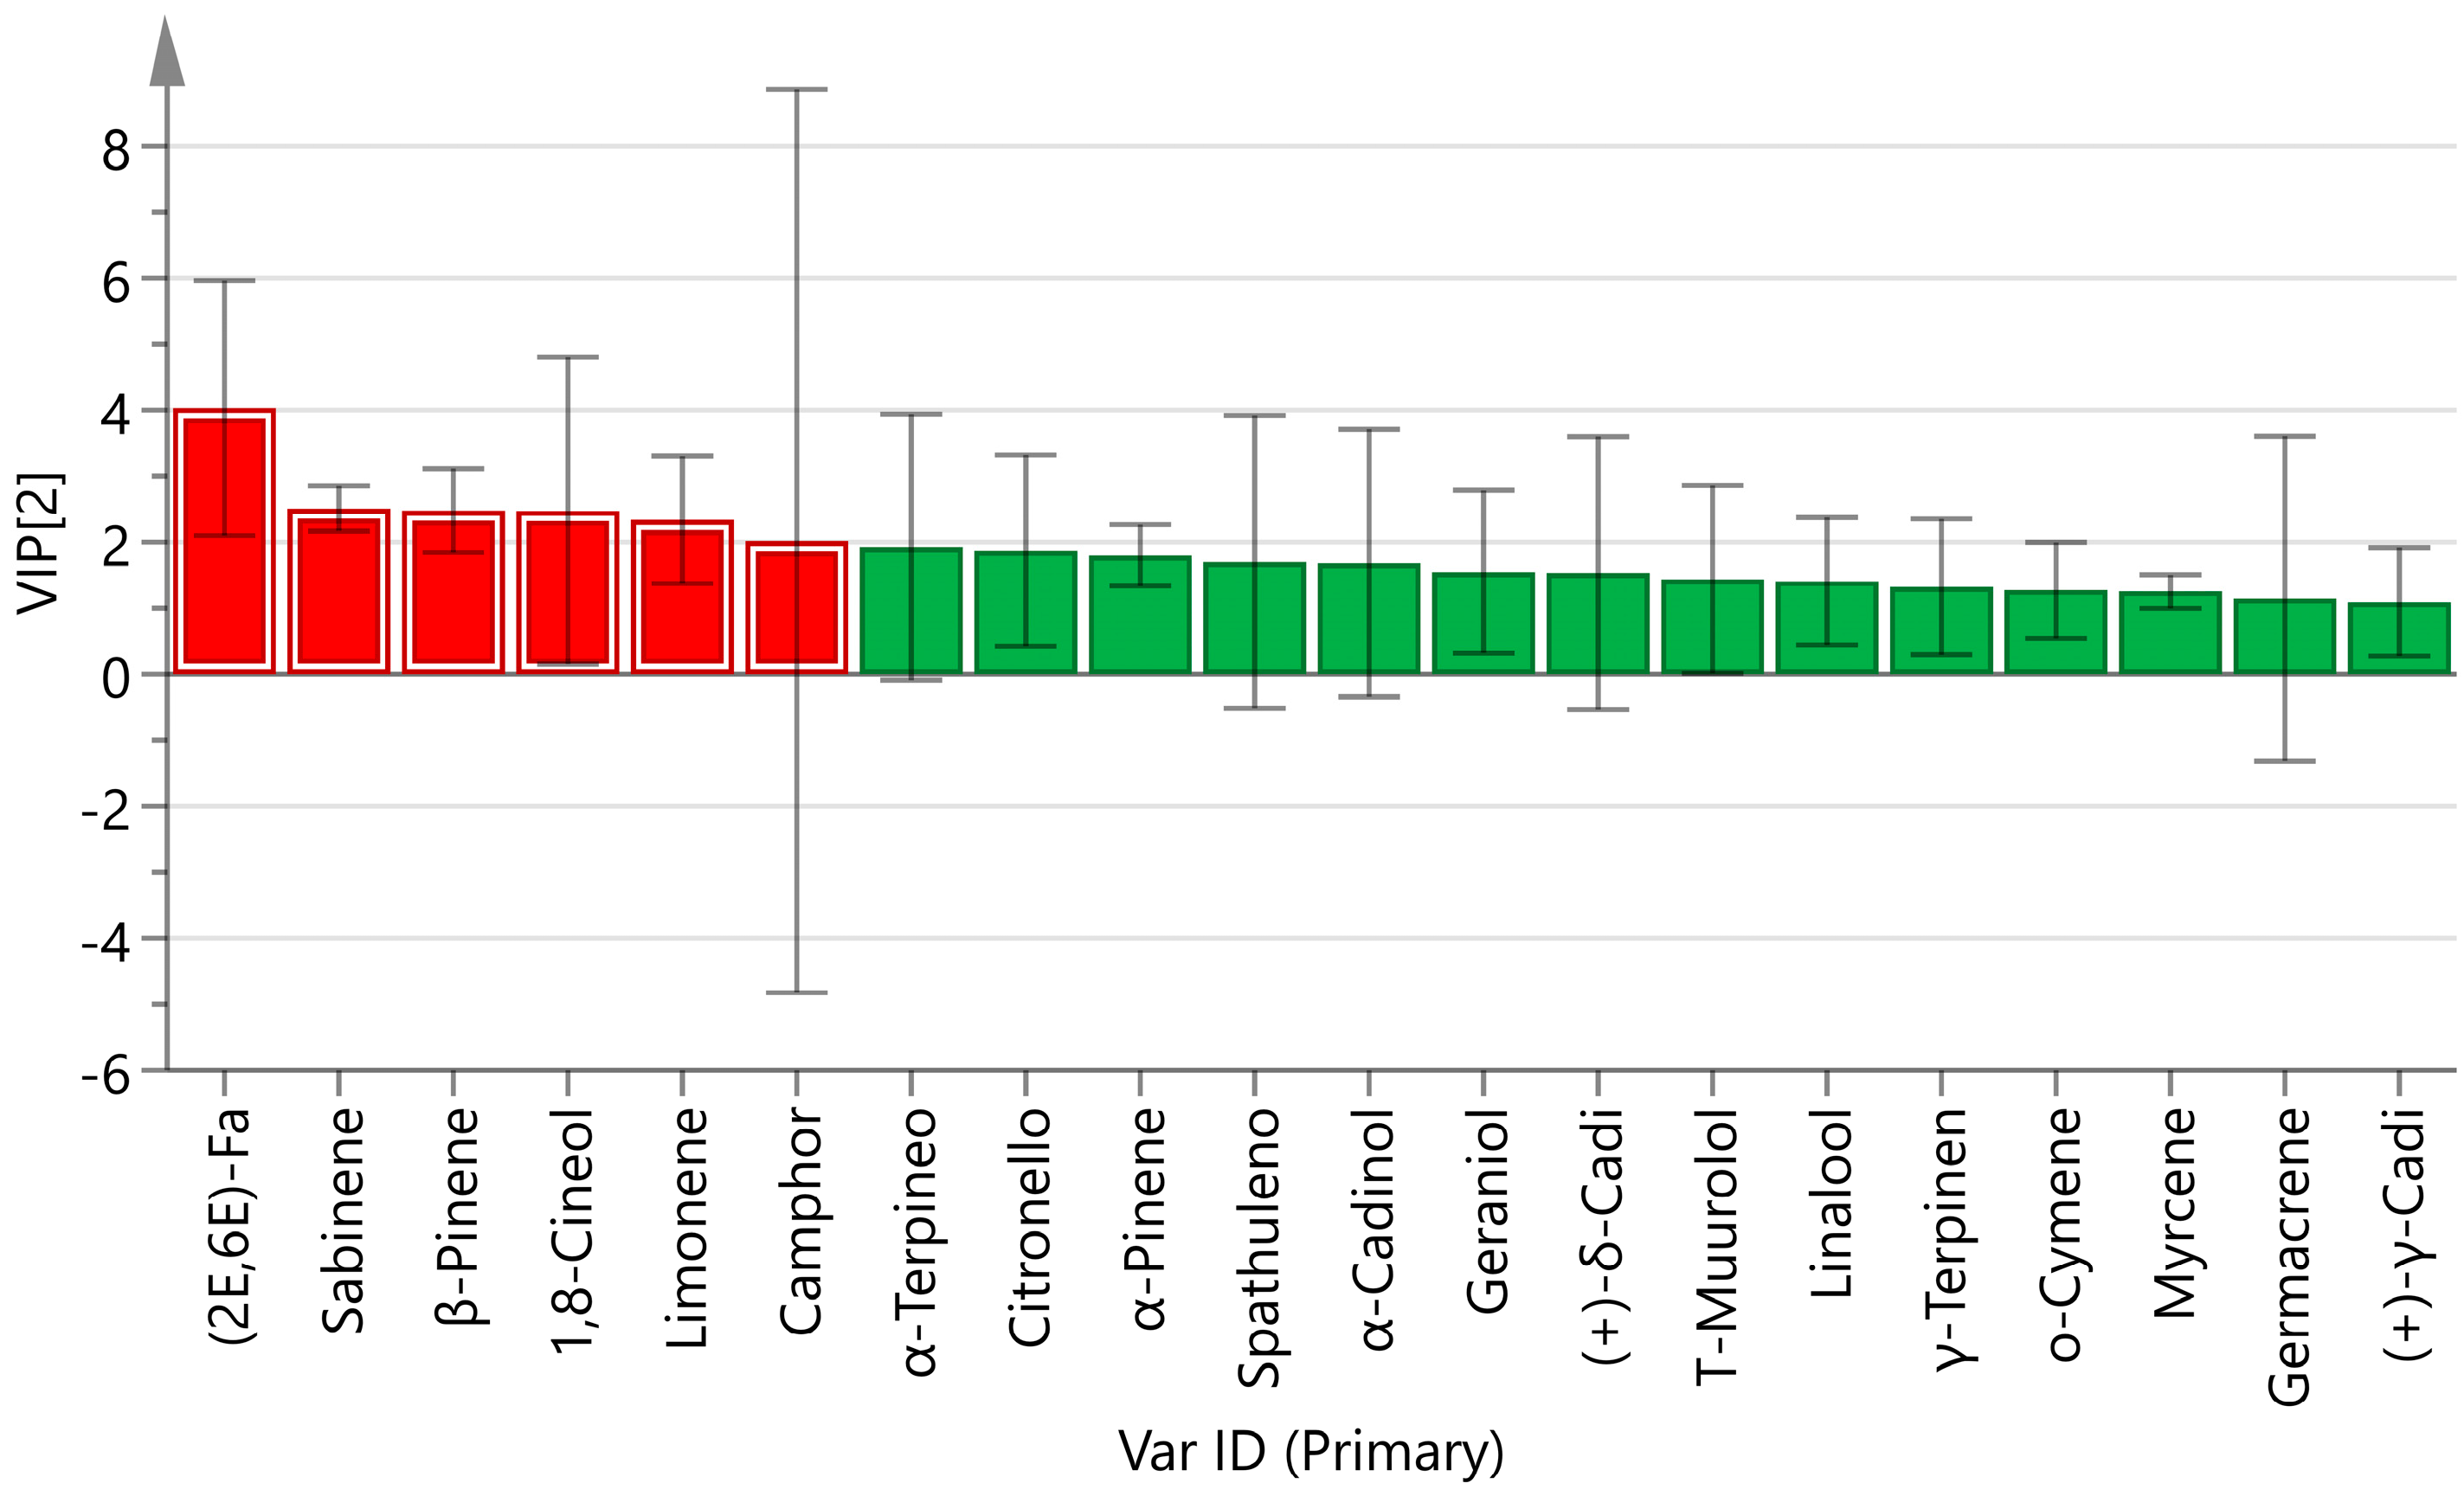
3.1.3. Analysis of Differences in Volatile Components
3.2. Research on Lignan Compounds
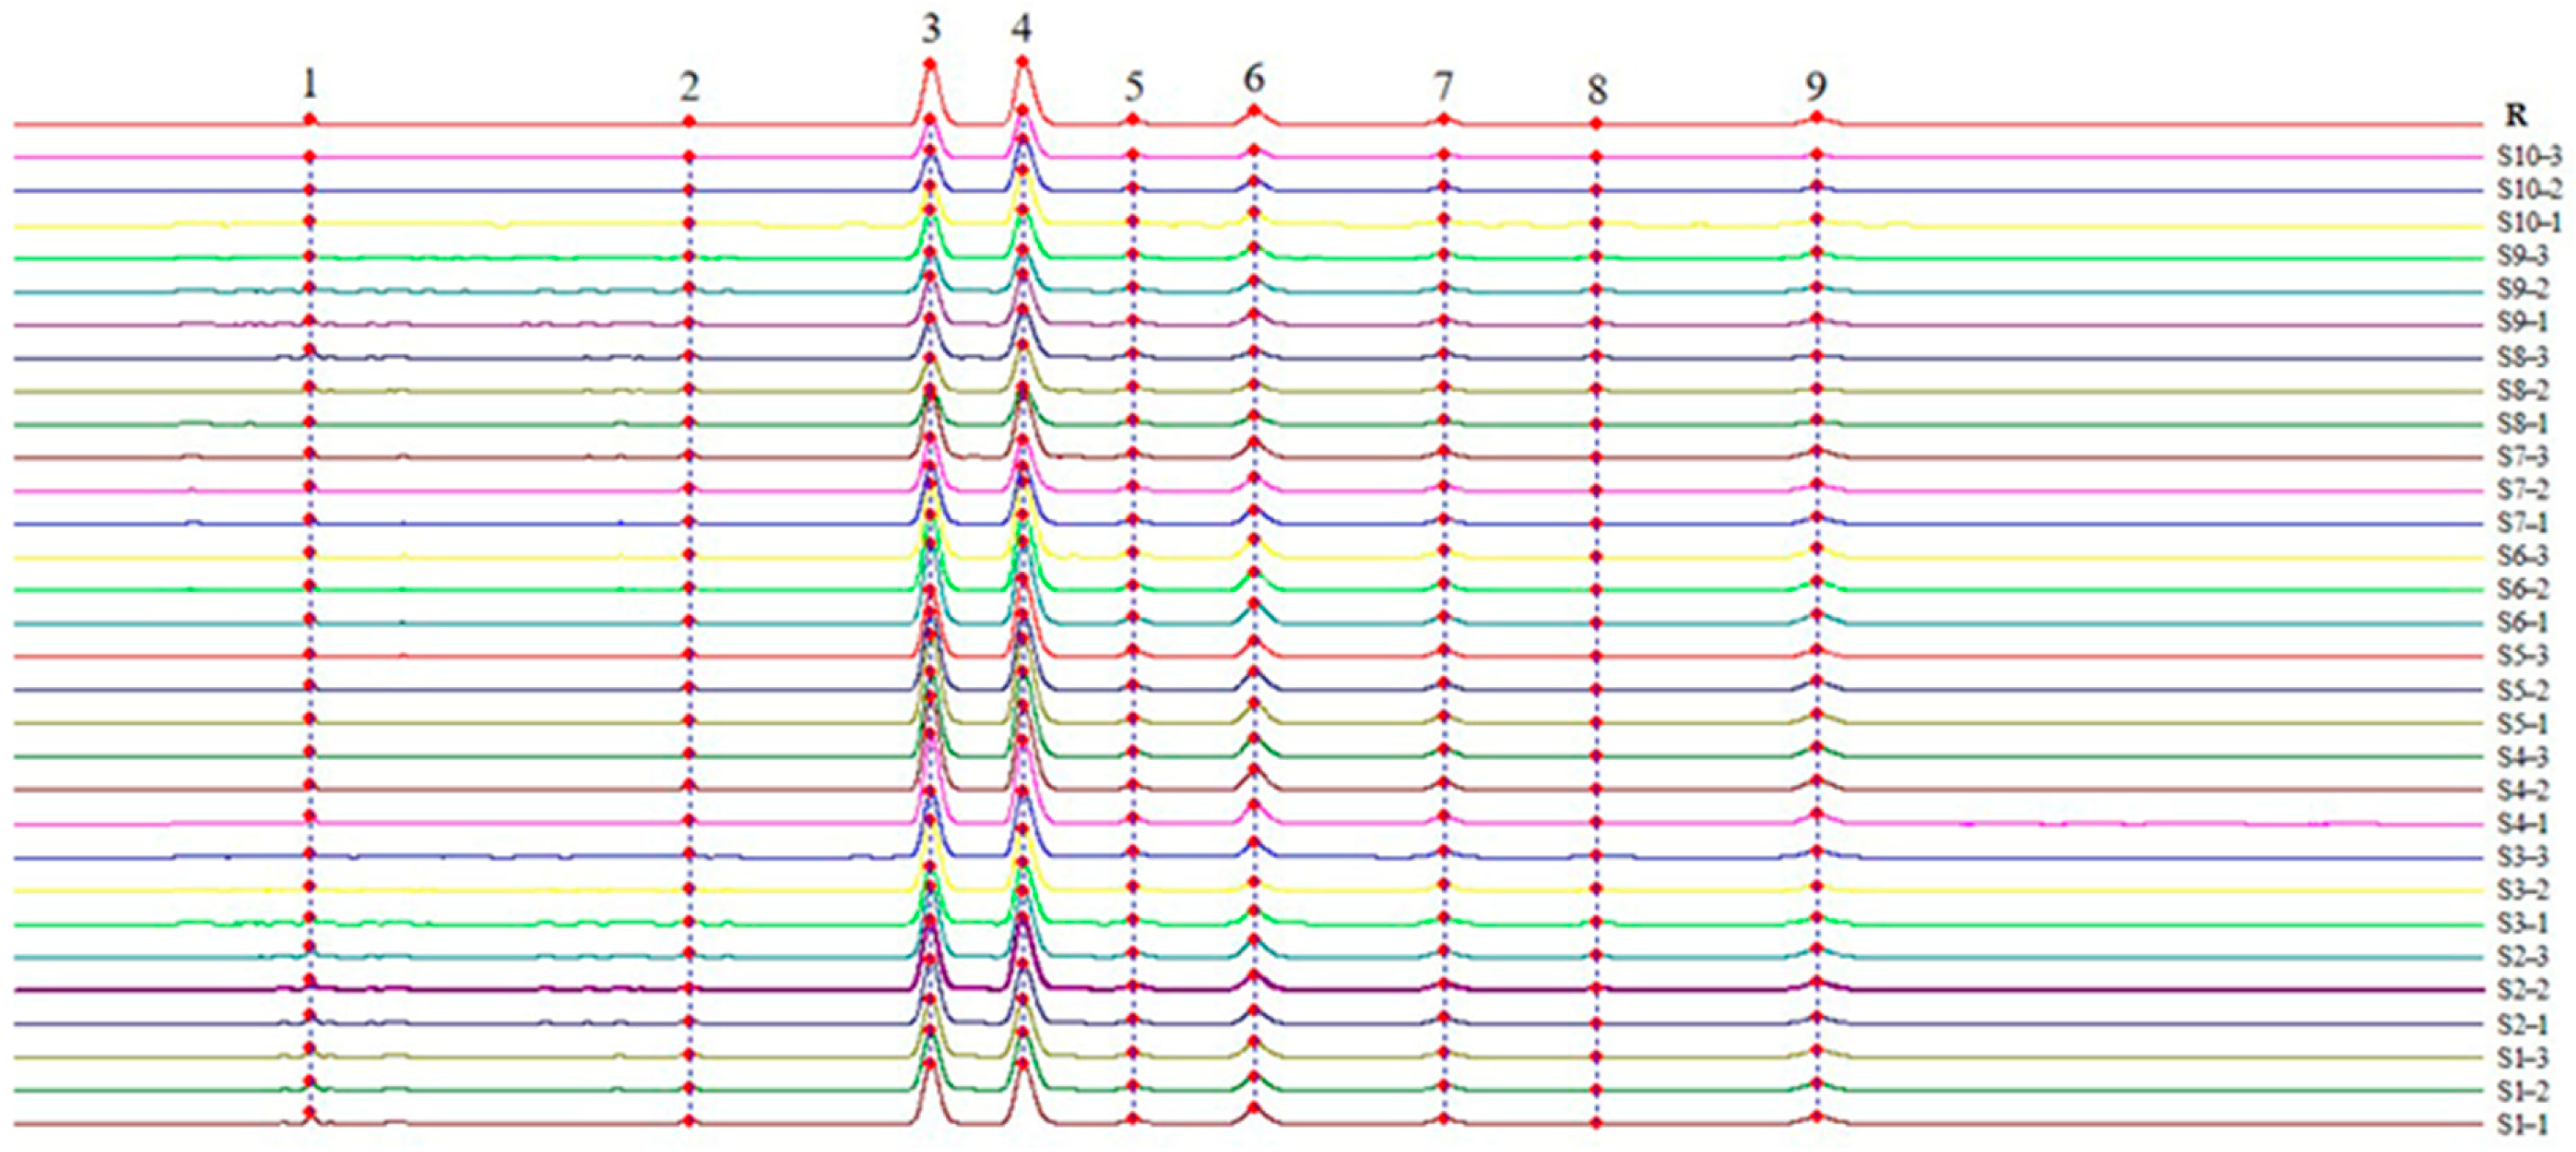
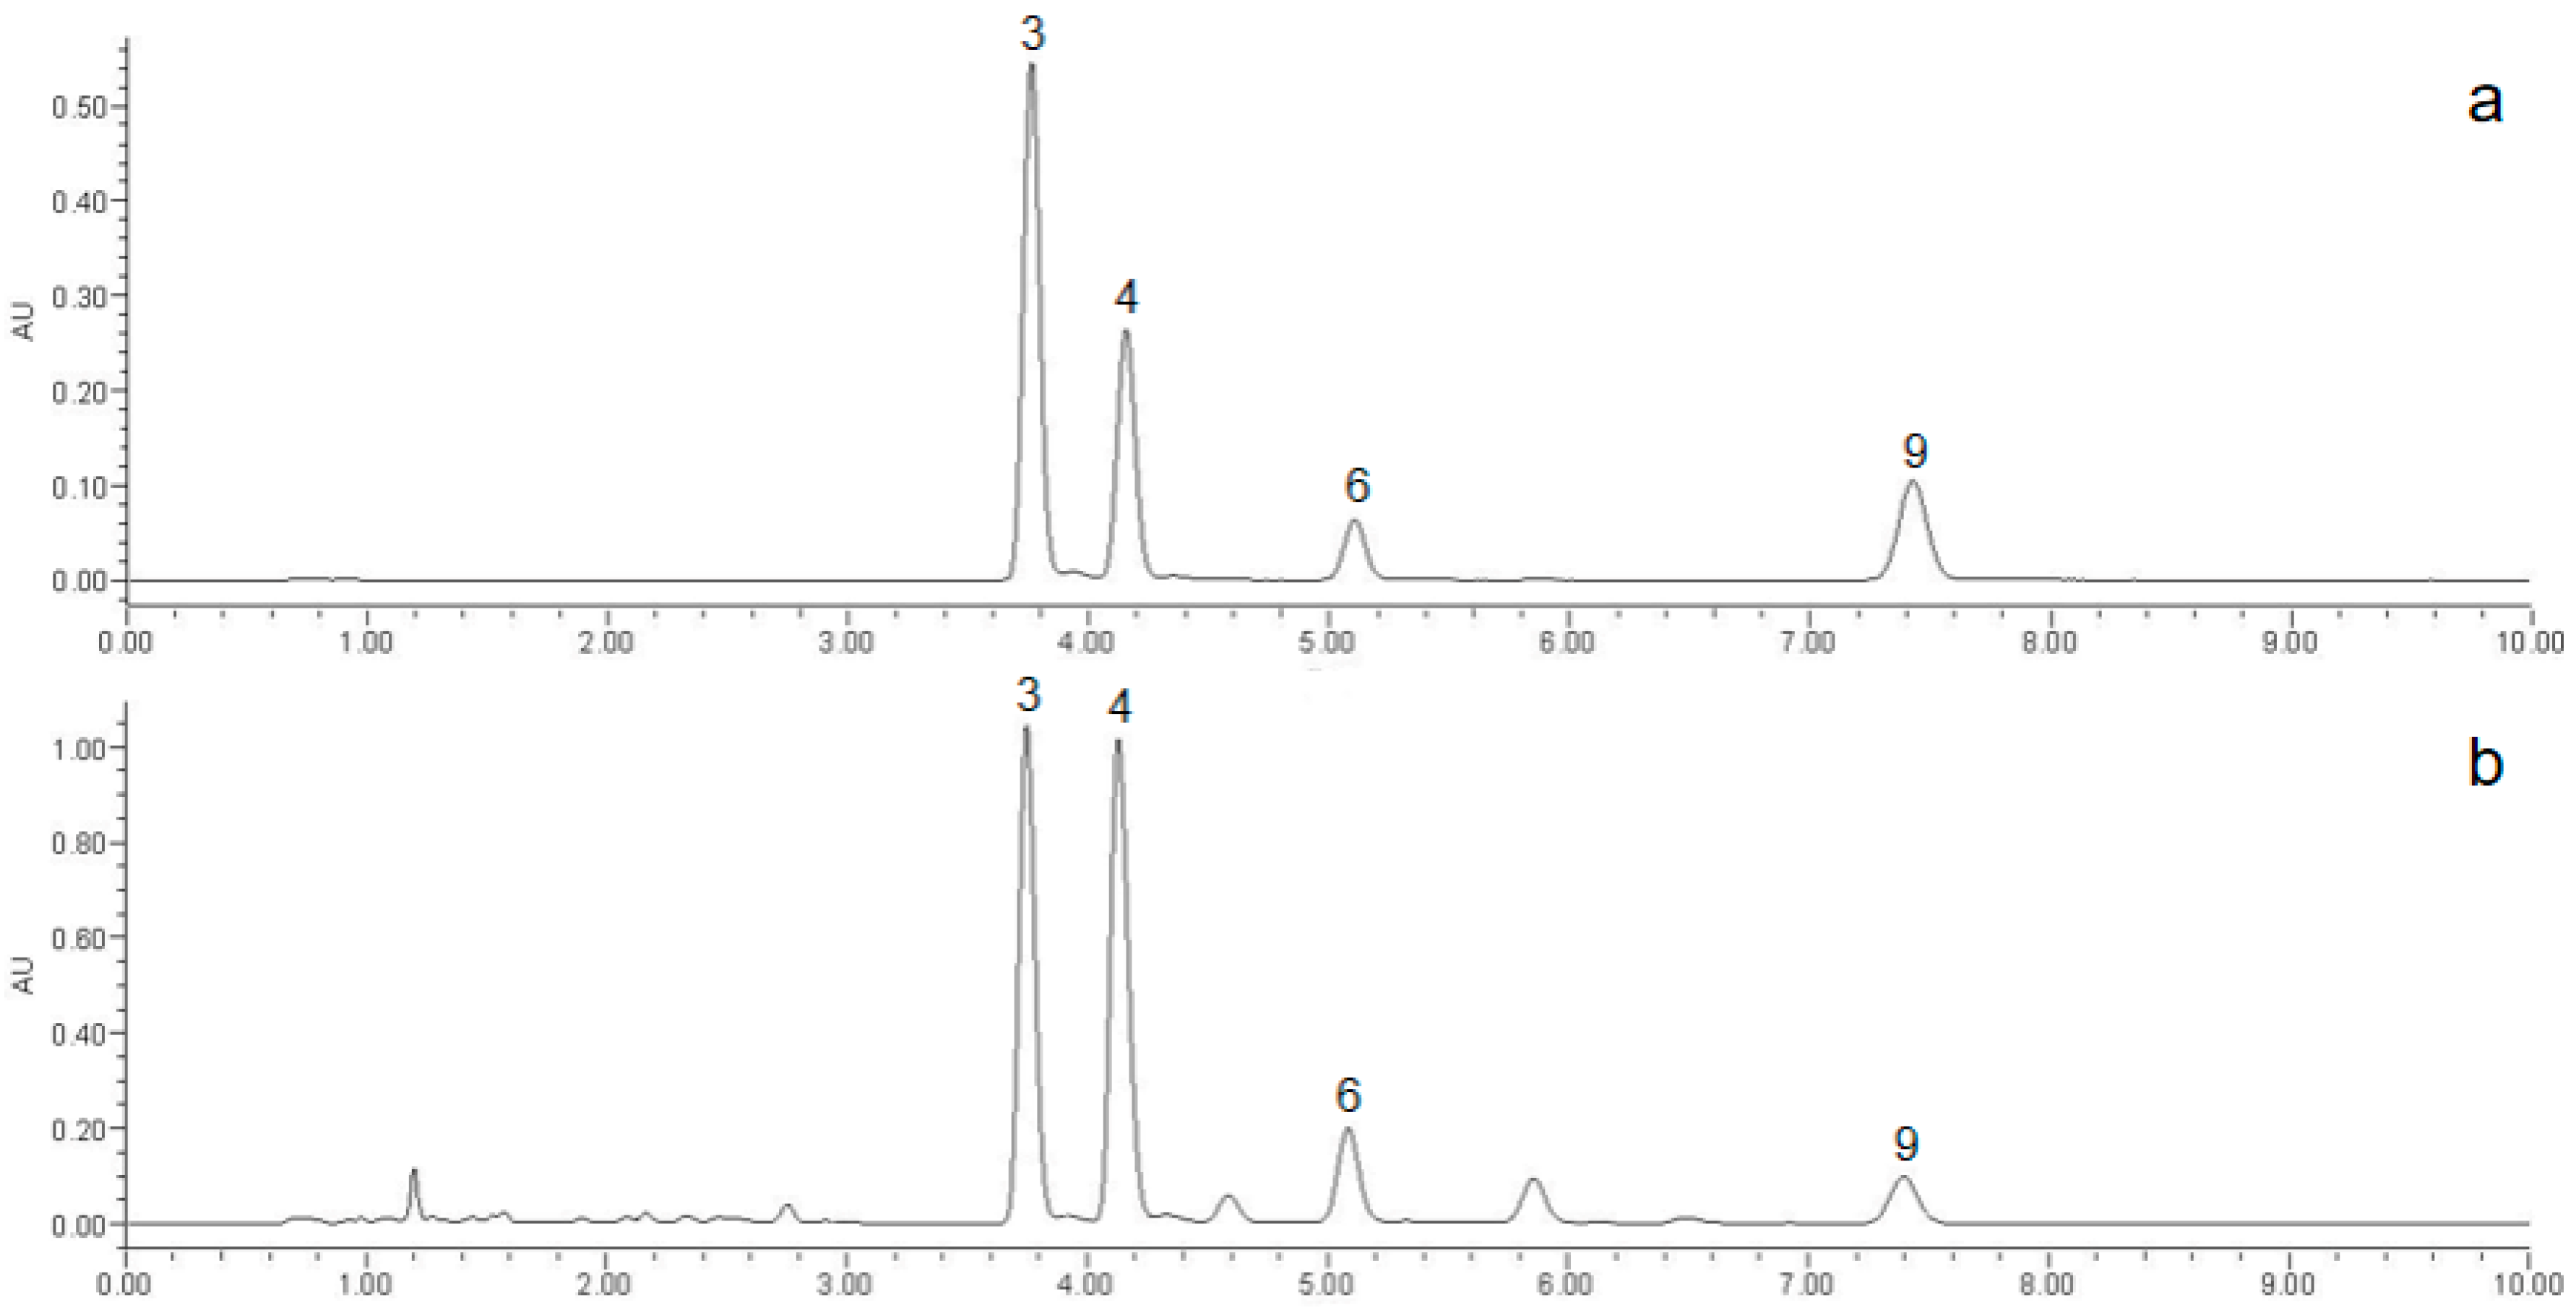
3.2.1. Establishment of the Characteristic Map of MF and Similarity Evaluation
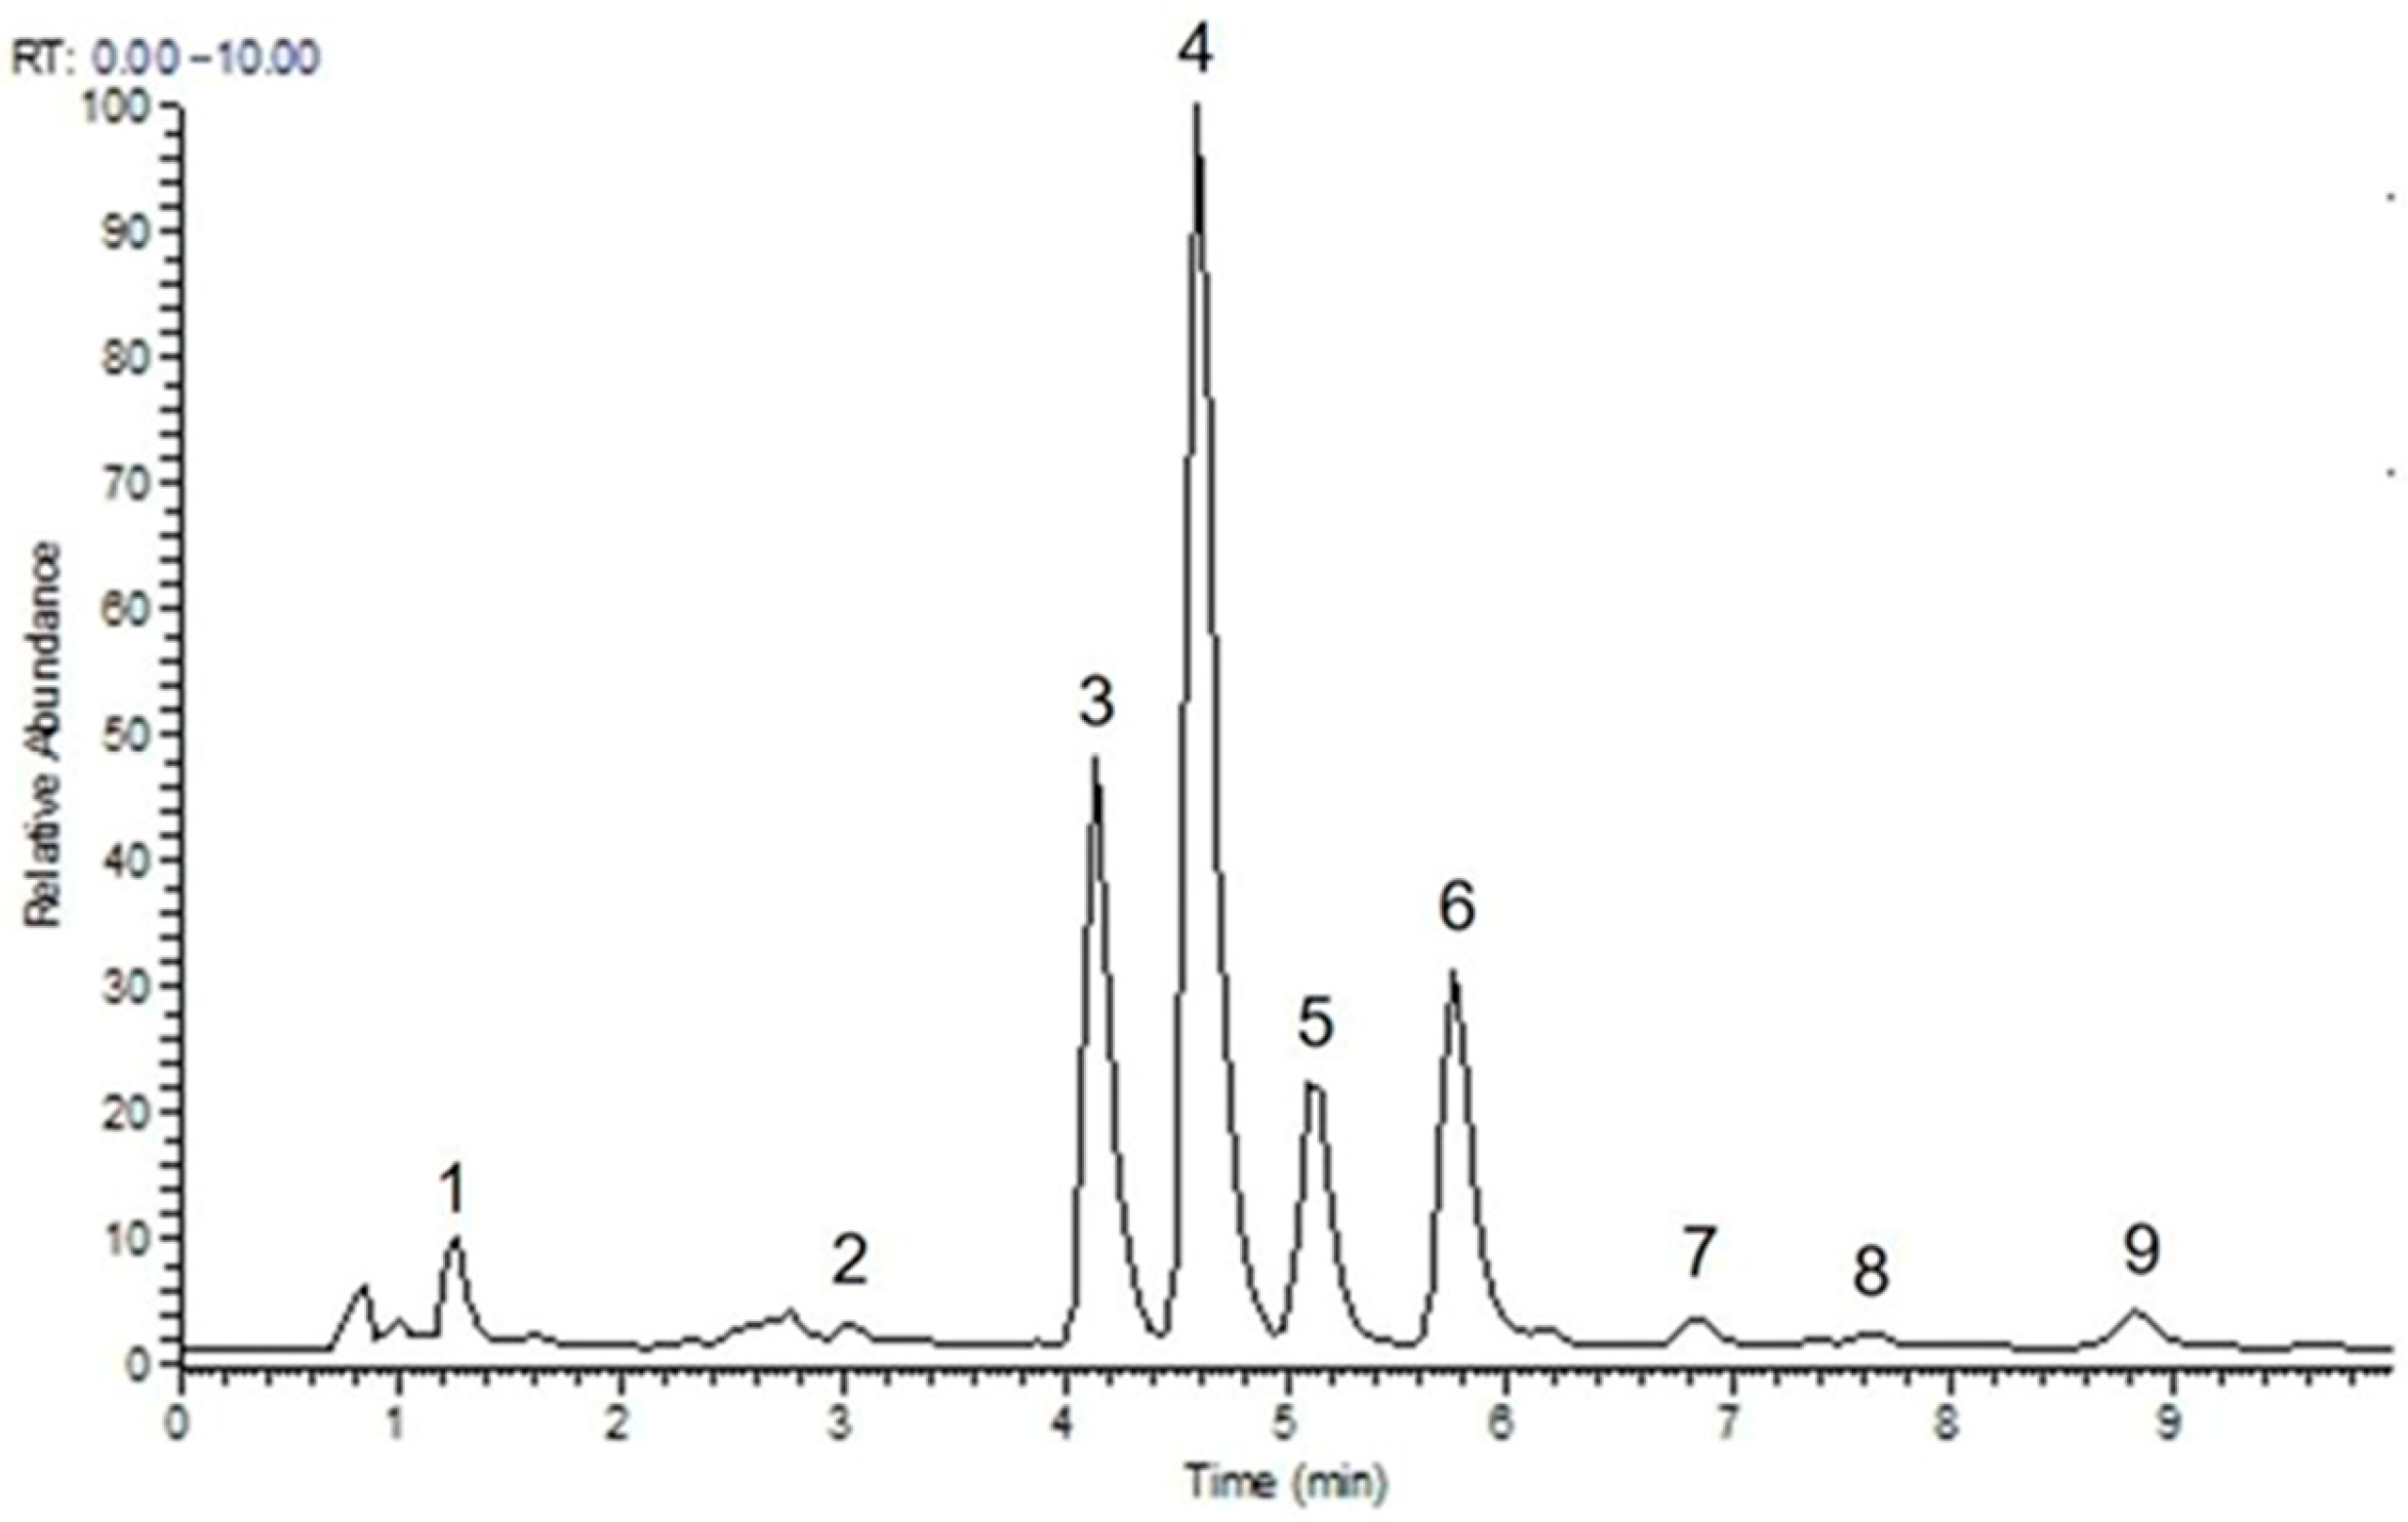
3.2.2. Mass Spectrometry Qualitative Analysis
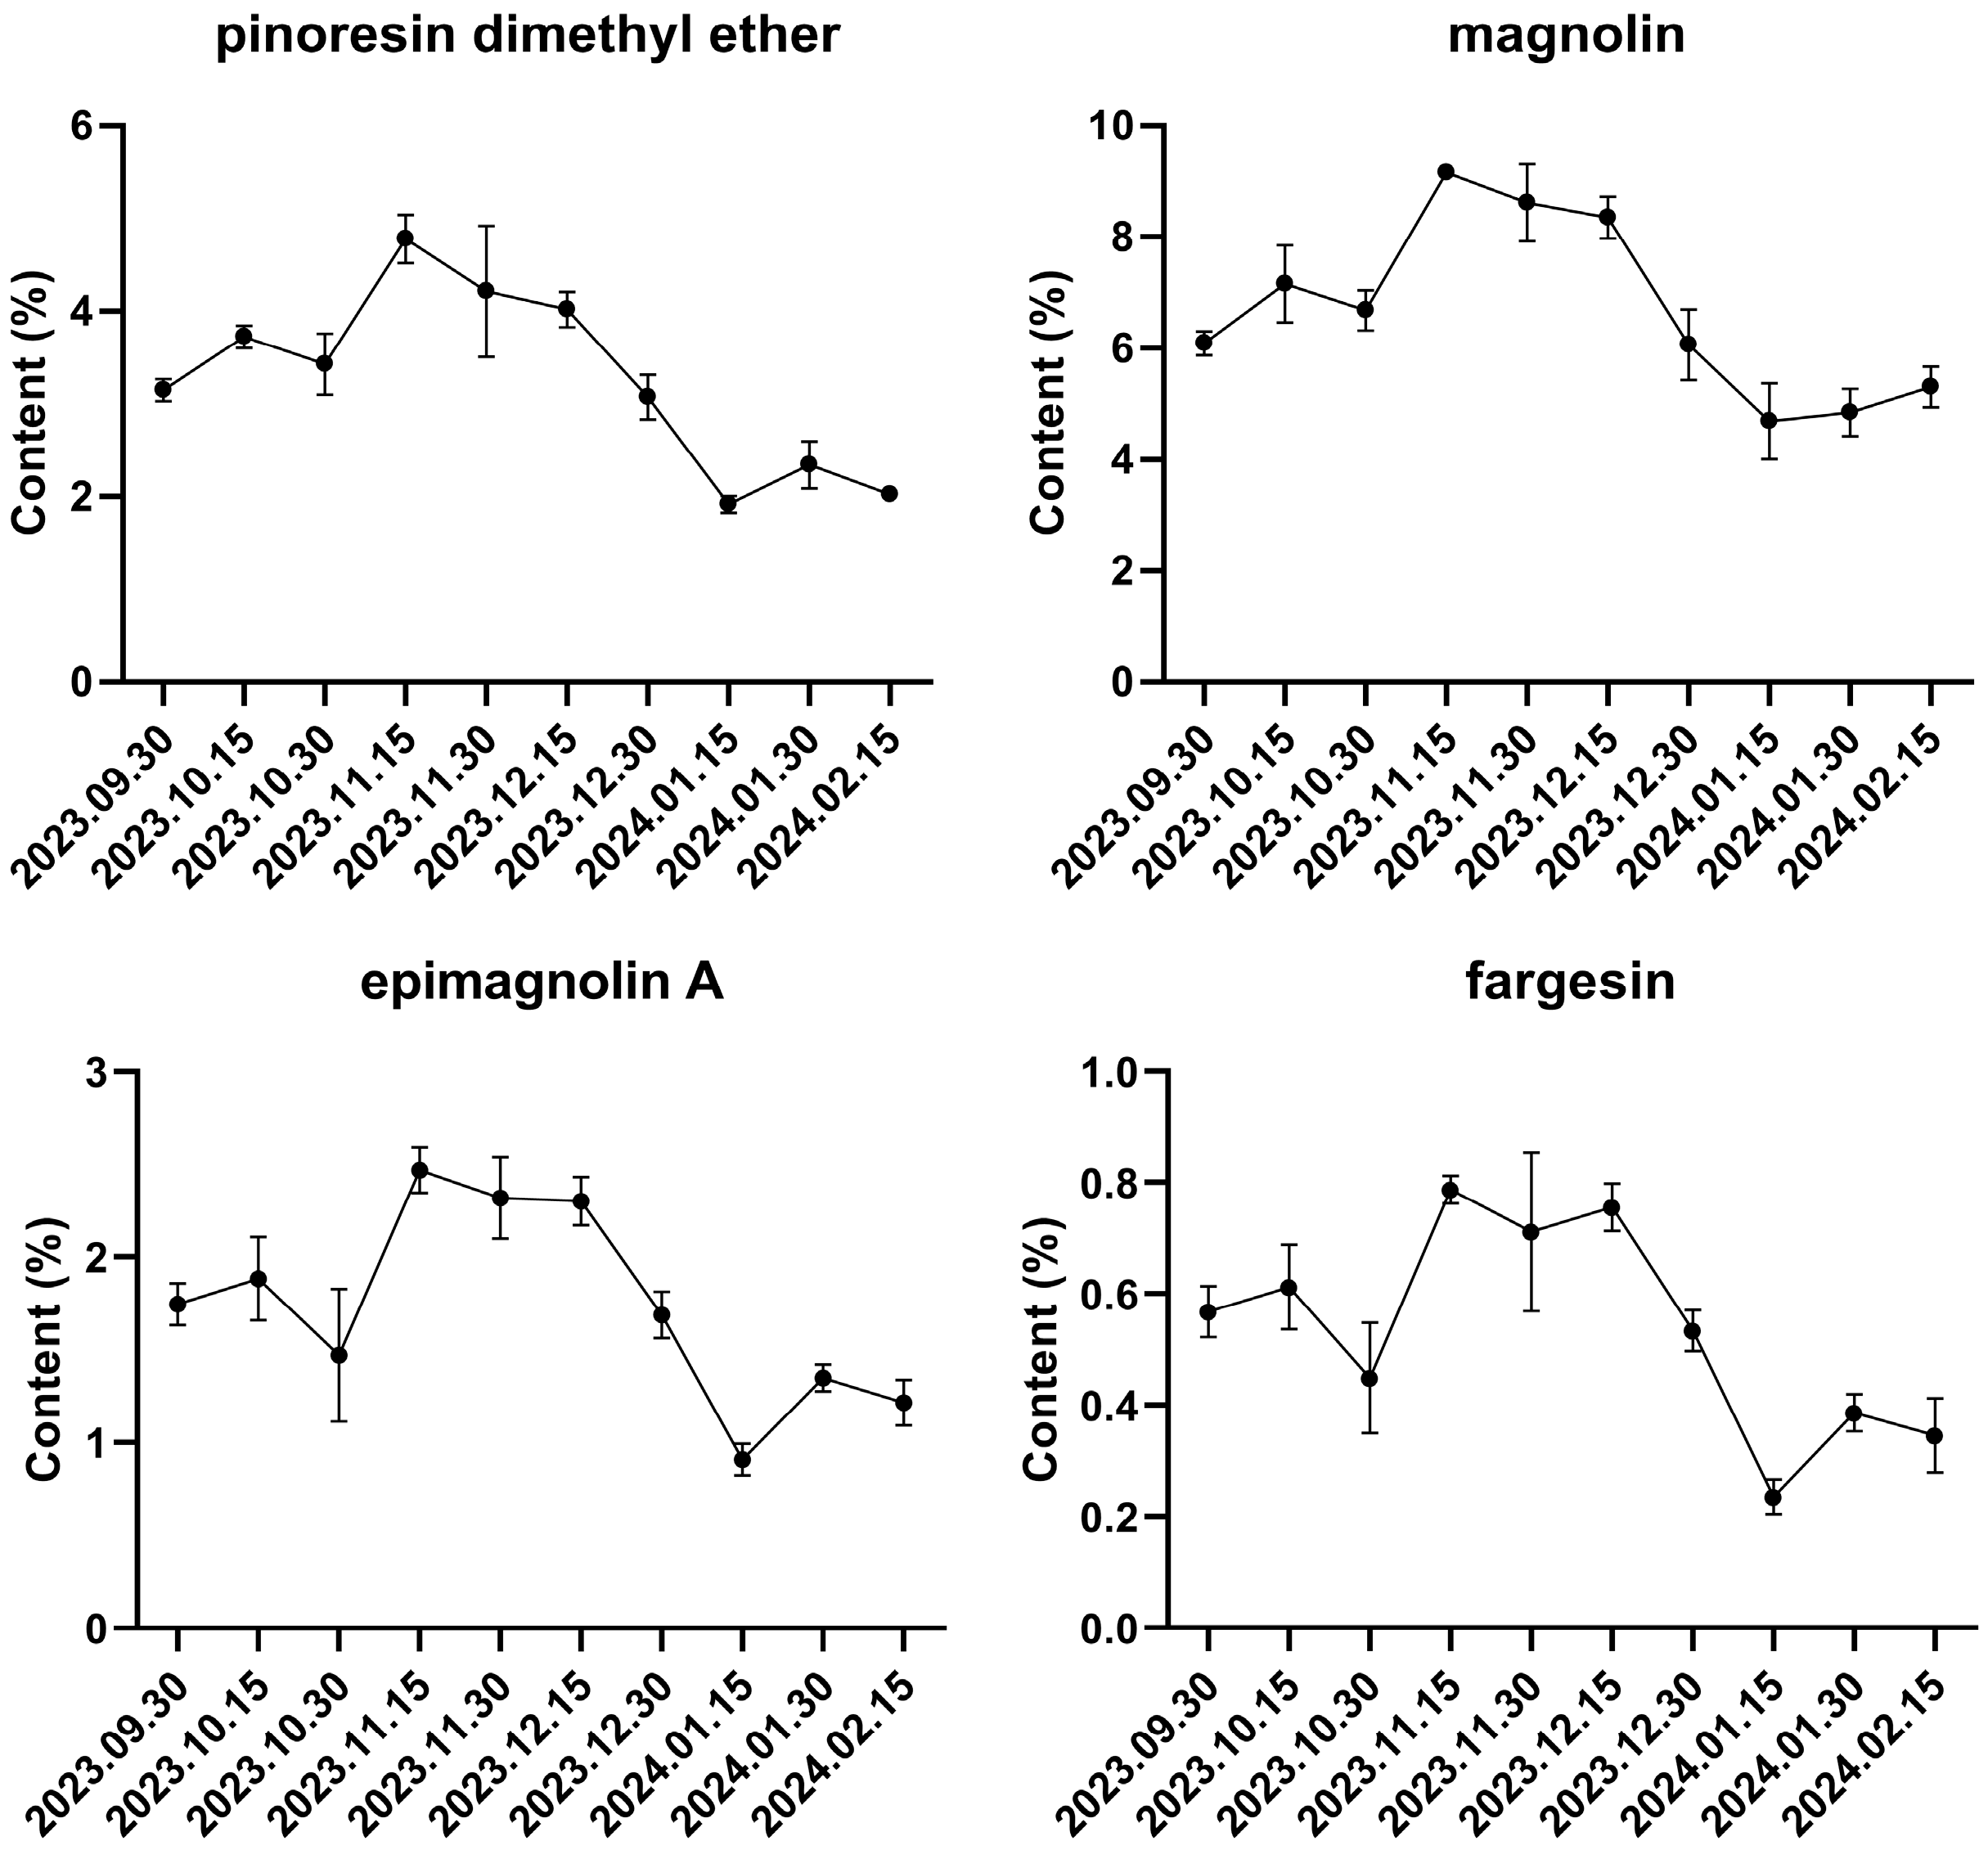
3.2.3. Multi-Component Content Determination
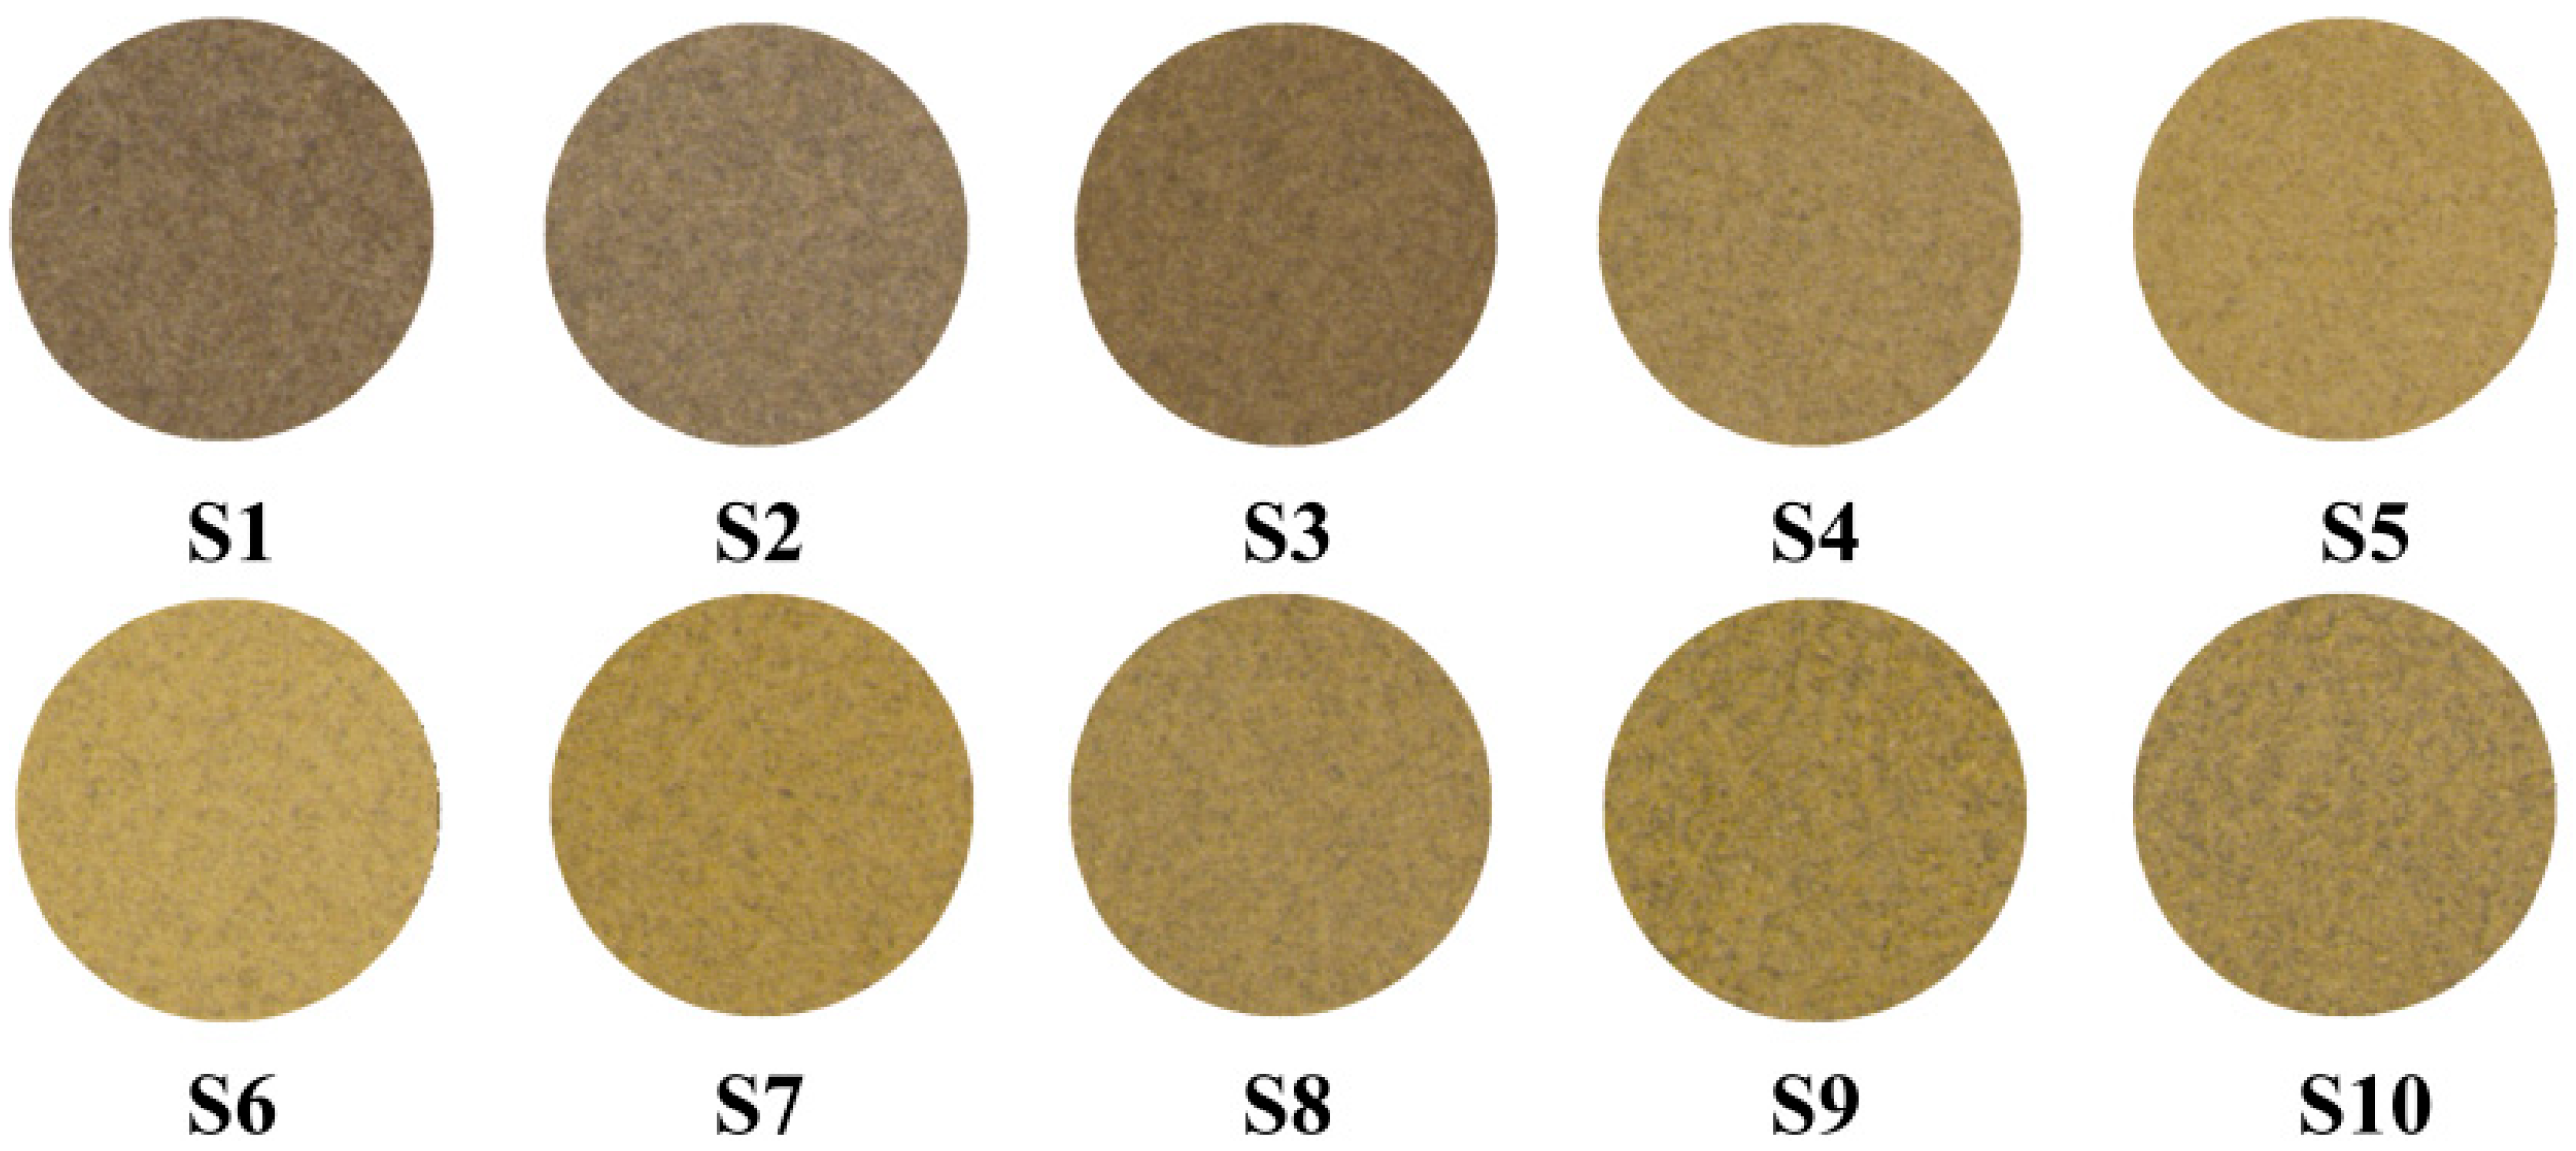
3.3. Determination of Colorimetric Values in MF at Different Developmental Stage
3.4. Correlation Analysis Between Main Components and Chromaticity Values in MF
4. Discussion
5. Conclusions
Author Contributions
Funding
Data Availability Statement
Conflicts of Interest
Abbreviations
| MF | Magnoliae Flos |
| GC-MS | gas chromatography-mass spectrometry |
| UPLC | ultra-high performance liquid chromatography |
| TICs | total ion chromatograms |
| NIST | National Institute of Standards and Technology |
| VIP | variable importance for the projection |
| PLS-DA | partial least squares discriminant analysis |
References
- Hu, M.L.; Bai, M.; Ye, W.; Wang, Y.L.; Wu, H. Variations in Volatile Oil Yield and Composition of “Xin-yi” (Pamp. Flower Buds) at Different Growth Stages. J. Oleo Sci. 2018, 67, 779–787. [Google Scholar] [CrossRef]
- Pharmacopoeiacommittee of the Ministry of Health of the People’s Republic of China. Pharmacopoeia of the People’s Republic of China; China Pharmaceutical Science and Technology: Beijing, China, 2020; Volume Part I; pp. 189–190. [Google Scholar]
- Shen, Y.; Li, C.G.; Zhou, S.F.; Pang, E.C.K.; Story, D.F.; Xue, C.C.L. Chemistry and bioactivity of Flos Magnoliae, a Chinese herb for rhinitis and sinusitis. Curr. Med. Chem. 2008, 15, 1616–1627. [Google Scholar] [CrossRef]
- Sun, Y.Y.; Cai, X.J.; Cao, J.X.; Wu, Z.; Pan, D.D. Effects of 1,8-cineole on Carbohydrate Metabolism Related Cell Structure Changes of Salmonella. Front Microbiol. 2018, 9, 1078. [Google Scholar] [CrossRef]
- Bhuia, M.S.; Wilairatana, P.; Chowdhury, R.; Rakib, A.I.; Kamli, H.; Shaikh, A.; Coutinho, H.D.M.; Islam, M.T. Anticancer Potentials of the Lignan Magnolin: A Systematic Review. Molecules 2023, 28, 3671. [Google Scholar] [CrossRef]
- Park, R.; Park, E.J.; Cho, Y.Y.; Lee, J.Y.; Kang, H.C.; Song, I.S.; Lee, H.S. Tetrahydrofurofuranoid Lignans, Eudesmin, Fargesin, Epimagnolin A, Magnolin, and Yangambin Inhibit UDP-Glucuronosyltransferase 1A1 and 1A3 Activities in Human Liver Microsomes. Pharmaceutics 2021, 13, 187. [Google Scholar] [CrossRef]
- Hu, J.M.; Cai, J.H.; Cheng, Q.Q.; Wang, L.J.; Hu, X.R.; Wang, W.Z.; Liao, Z.F.; Tao, X.H. Multi-Indicator Comprehensive Quality Evaluation of Turpinia arguta (Lindl.) Seem Herbs at Different Harvesting Periods. Agronomy 2024, 14, 2658. [Google Scholar] [CrossRef]
- Lee, J.; Lee, D.; Jang, D.S.; Nam, J.W.; Kim, J.P.; Park, K.H.; Yang, M.S.; Seo, E.K. Two new stereoisomers of tetrahydrofuranoid lignans from the flower buds of. Chem. Pharm. Bull. 2007, 55, 137–139. [Google Scholar] [CrossRef]
- Kim, H.K.; Seo, J.W.; Kim, G.H. Various effects of volatile constituents from Magnolia kobus flowers against Aedes albopictus (Diptera: Culicidae). Ind. Crop Prod. 2020, 145, 112109. [Google Scholar] [CrossRef]
- Marzocchi, S.; Baldi, E.; Crucitti, M.C.; Toselli, M.; Caboni, M.F. Effect of Harvesting Time on Volatile Compounds Composition of Bergamot (Citrus × Bergamia) Essential Oil. Flavour. Frag. J. 2019, 34, 426–435. [Google Scholar] [CrossRef]
- Li, Y.Q.; Kong, D.X.; Huang, R.S.; Liang, H.L.; Xu, C.G.; Wu, H. Variations in essential oil yields and compositions of innamomum cassia leaves at different developmental stages. Ind. Crop Prod. 2013, 47, 92–101. [Google Scholar] [CrossRef]
- Liu, Z.D.; Lan, J.X.; Chen, S.Q. Quality analysis of Citri Trifoliatae Fructus in different harvest time by HPLC combined with electronic eye technology. Zhongguo Zhong Yao Za Zhi 2021, 46, 5253–5259. [Google Scholar] [CrossRef]
- Miyazawa, M.; Nakashima, Y.; Nakahashi, H.; Hara, N.; Nakagawa, H.; Usami, A.; Chavasiri, W. Volatile Compounds with Characteristic Odor of Essential Oil from Leaves by Hydrodistillation and Solvent-assisted Flavor Evaporation. J. Oleo Sci. 2015, 64, 999–1007. [Google Scholar] [CrossRef]
- Calín-Sánchez, A.; Lech, K.; Szumny, A.; Figiel, A.; Carbonell-Barrachina, A.A. Volatile composition of sweet basil essential oil (Ocimum basilicum L.) as affected by drying method. Food Res. Int. 2012, 48, 217–225. [Google Scholar] [CrossRef]
- Georgieva, P.; Rusanov, K.; Rusanova, M.; Kitanova, M.; Atanassov, I. Construction of Simple Sequence Repeat-Based Genetic Linkage Map and Identification of QTLs for Accumulation of Floral Volatiles in Lavender (Lavandula angustifolia Mill.). Int. J. Mol. Sci. 2025, 26, 3705. [Google Scholar] [CrossRef]
- Kunc, N.; Hudina, M.; Osterc, G.; Grohar, M.C. Determination of Volatile Compounds in Blossoms Rosa spinosissima, Rosa pendulina, Rosa gallica, and Their Cultivars. Agriculture 2024, 14, 253. [Google Scholar] [CrossRef]
- Ning, J.R.; Wang, K.H.; Yang, W.L.; Liu, M.S.; Tian, J.Y.; Wei, M.Y.; Zheng, G.D. Qualitative and quantitative analyses of chemical components of Citri Sarcodactylis Fructus from different origins based on UPLC-Q-Exactive Orbitrap-MS and GC-MS. Food Sci. Nutr. 2022, 10, 2057–2070. [Google Scholar] [CrossRef]
- Zeng, Z.; Xie, R.Q.; Zhang, T.; Zhang, H.; Chen, J.Y. Analysis of Volatile Compositions of Pamp by Steam Distillation and Headspace Solid Phase Micro-extraction. J. Oleo Sci. 2011, 60, 591–596. [Google Scholar] [CrossRef]
- Cirlini, M.; Mena, P.; Tassotti, M.; Herrlinger, K.A.; Nieman, K.M.; Dall’Asta, C.; Del Rio, D. Phenolic and Volatile Composition of a Dry Spearmint (Mentha spicata L.) Extract. Molecules 2016, 21, 1007. [Google Scholar] [CrossRef]
- Feng, X.; Shi, H.; Yang, G.Y.; Chang, Y.Q.; Zhang, D.; Zheng, Y.G.; Guo, L. Dynamic changes of volatile components in Forsythia suspensa at different harvest periods based on GC-MS and chemometrics analysis. Zhongguo Zhong Yao Za Zhi 2022, 47, 54–61. [Google Scholar] [CrossRef]
- Schühly, W.; Skarbina, J.; Kunert, O.; Nandi, O.I.; Bauer, R. Chemical Characterization of Magnolia biondii (Flos Magnoliae, Xin Yi). Nat. Prod. Commun. 2009, 4, 231–234. [Google Scholar] [CrossRef]
- Lu, Y.; He, Z.X.; Wang, Q.; Lei, T.; Ning, N.; Chen, X.Y.; Wu, X.; Wang, S.P.; Wan, L.; Cao, J.L. An advanced strategy for quality evaluation of Xinyi Biyan Pill by UPLC-DAD fingerprinting combined with multi-components UPLC-MS/MS analysis. J. Pharm. Biomed. 2023, 239, 115858. [Google Scholar] [CrossRef] [PubMed]
- Kim, J.S.; Kim, J.Y.; Lee, H.J.; Lim, H.J.; Lee, D.Y.; Kim, D.H.; Ryu, J.H. Suppression of Inducible Nitric Oxide Synthase Expression by Furfuran Lignans from Flower Buds of in BV-2 Microglial Cells. Phytother. Res. 2010, 24, 748–753. [Google Scholar] [CrossRef] [PubMed]
- Senatore, F. Influence of harvesting time on yield and composition of the essential oil of a thyme (Thymus pulegioides L.) growing wild in Campania (Southern Italy). J. Agr. Food Chem. 1996, 44, 1327–1332. [Google Scholar] [CrossRef]
- Juergens, L.J.; Worth, H.; Juergens, U.R. New Perspectives for Mucolytic, Anti-inflammatory and Adjunctive Therapy with 1,8-Cineole in COPD and Asthma: Review on the New Therapeutic Approach. Adv. Ther. 2020, 37, 1737–1753. [Google Scholar] [CrossRef]
- Gibbs, J.E.M. Essential oils, asthma, thunderstorms, and plant gases: A prospective study of respiratory response to ambient biogenic volatile organic compounds (BVOCs). J. Asthma Allergy 2019, 12, 169–181. [Google Scholar] [CrossRef]
- Phan, H.; Nam, Y.; Kim, H.; Woo, J.; NamKung, W.; Nam, J.; Kim, W. In-vitro and in-vivo anti-allergic effects of magnolol on allergic rhinitis via inhibition of ORAI1 and ANO1 channels. J. Ethnopharmacol. 2022, 289, 115061. [Google Scholar] [CrossRef]
- Tang, Q.; Zhang, R.; Zhou, J.; Zhao, K.; Lu, Y.; Zheng, Y.; Wu, C.; Chen, F.; Mu, D.; Ding, Z.; et al. The levels of bioactive ingredients in Citrus aurantium L. at different harvest periods and antioxidant effects on H2O2-induced RIN-m5F cells. J. Sci. Food Agric. 2021, 101, 1479–1490. [Google Scholar] [CrossRef]


| No. | Harvest Date |
|---|---|
| S1–1~S1–3 | 2023.9.30 |
| S2–1~S2–3 | 2023.10.15 |
| S3–1~S3–3 | 2023.10.30 |
| S4–1~S4–3 | 2023.11.15 |
| S5–1~S5–3 | 2023.11.30 |
| S6–1~S6–3 | 2023.12.15 |
| S7–1~S7–3 | 2023.12.30 |
| S8–1~S8–3 | 2024.1.15 |
| S9–1~S9–3 | 2024.1.30 |
| S10–1~S10–3 | 2024.2.15 |
| NO. | Compound | RI | Relative Content (%) | |||||||||
|---|---|---|---|---|---|---|---|---|---|---|---|---|
| S1 | S2 | S3 | S4 | S5 | S6 | S7 | S8 | S9 | S10 | |||
| Alkene | ||||||||||||
| 1 | Cycloheptatriene | 778 | 0.02 ± 0.00 | 0.02 ± 0.00 | 0.02 ± 0.00 | 0.02 ± 0.00 | 0.02 ± 0.00 | 0.02 ± 0.00 | 0.01 ± 0.00 | 0.01 ± 0.00 | 0.02 ± 0.00 | 0.01±0.00 |
| 2 | α-Thujene | 924 | 0.04 ± 0.00 | 0.03 ± 0.02 | 0.06 ± 0.02 | 0.04 ± 0.02 | 0.05 ± 0.01 | 0.25 ± 0.17 | 0.20 ± 0.05 | 0.19 ± 0.03 | 0.21 ± 0.04 | 0.20 ± 0.01 |
| 3 | α-Pinene | 930 | 0.52 ± 0.09 | 0.48 ± 0.22 | 0.80 ± 0.20 | 0.68 ± 0.26 | 0.93 ± 0.19 | 2.69 ± 1.80 | 2.70 ± 0.46 | 2.28 ± 0.30 | 2.76 ± 0.40 | 2.90 ± 0.27 |
| 4 | Camphene | 942 | 0.26 ± 0.06 | 0.15 ± 0.06 | 0.28 ± 0.04 | 0.21 ± 0.08 | 0.28 ± 0.04 | 0.29 ± 0.09 | 0.64 ± 0.35 | 0.33 ± 0.06 | 0.51 ± 0.36 | 1.14 ± 1.01 |
| 5 | Sabinene | 964 | 0.74 ± 0.09 | 0.74 ± 0.20 | 1.42 ± 0.11 | 1.41 ± 0.31 | 1.85 ± 0.60 | 4.37 ± 2.64 | 5.27 ± 0.15 | 5.72 ± 0.91 | 5.16 ± 0.87 | 5.37 ± 1.27 |
| 6 | β-Pinene | 966 | 2.09 ± 0.21 | 2.09 ± 0.73 | 3.25 ± 0.67 | 2.84 ± 0.85 | 3.59 ± 0.71 | 6.70 ± 3.45 | 6.69 ± 0.87 | 6.22 ± 0.48 | 6.97 ± 0.76 | 7.06 ± 0.58 |
| 7 | Myrcene | 980 | 0.25 ± 0.01 | 0.19 ± 0.05 | 0.46 ± 0.21 | 0.28 ± 0.07 | 0.31 ± 0.06 | 1.33 ± 0.97 | 1.26 ± 0.14 | 1.33 ± 0.17 | 1.26 ± 0.18 | 1.34 ± 0.24 |
| 8 | α-Phellandrene | 992 | 0.03 ± 0.00 | 0.02 ± 0.01 | 0.04 ± 0.00 | 0.03 ± 0.01 | 0.03 ± 0.01 | 0.17 ± 0.13 | 0.13 ± 0.04 | 0.12 ± 0.03 | 0.13 ± 0.01 | 0.09 ± 0.04 |
| 9 | Carene | 997 | 0.01 ± 0.00 | 0.01 ± 0.00 | 0.01 ± 0.00 | 0.01 ± 0.00 | 0.01 ± 0.00 | 0.06 ± 0.04 | 0.05 ± 0.02 | 0.04 ± 0.01 | 0.05 ± 0.00 | 0.03 ± 0.02 |
| 10 | α-Terpinene | 1004 | 0.39 ± 0.07 | 0.32 ± 0.11 | 0.57 ± 0.16 | 0.36 ± 0.11 | 0.40 ± 0.04 | 1.16 ± 0.69 | 0.90 ± 0.24 | 0.93 ± 0.12 | 0.94 ± 0.11 | 0.79 ± 0.21 |
| 11 | o-Cymene | 1012 | 0.35 ± 0.02 | 0.25 ± 0.05 | 0.39 ± 0.05 | 0.41 ± 0.16 | 0.43 ± 0.15 | 1.49 ± 1.11 | 1.79 ± 0.56 | 1.31 ± 0.41 | 1.55 ± 0.04 | 1.19 ± 0.50 |
| 12 | Limonene | 1017 | 0.71 ± 0.21 | 0.71 ± 0.10 | 1.31 ± 0.13 | 0.95 ± 0.43 | 1.15 ± 0.19 | 4.73 ± 3.63 | 4.80 ± 1.19 | 3.79 ± 0.76 | 4.79 ± 0.14 | 4.39 ± 1.16 |
| 14 | (Z)-β-Ocimene | 1040 | 0.02 ± 0.00 | 0.02 ± 0.01 | 0.04 ± 0.00 | 0.03 ± 0.01 | 0.03 ± 0.01 | 0.12 ± 0.08 | 0.12 ± 0.02 | 0.11 ± 0.02 | 0.10 ± 0.00 | 0.10 ± 0.03 |
| 15 | γ-Terpinene | 1052 | 1.00 ± 0.13 | 0.83 ± 0.23 | 1.46 ± 0.33 | 1.05 ± 0.32 | 1.15 ± 0.14 | 2.97 ± 1.91 | 2.36 ± 0.58 | 2.48 ± 0.41 | 2.59 ± 0.18 | 1.98 ± 0.71 |
| 17 | Terpinolene | 1087 | 0.32 ± 0.03 | 0.21 ± 0.04 | 0.35 ± 0.05 | 0.24 ± 0.06 | 0.25 ± 0.02 | 0.38 ± 0.11 | 0.39 ± 0.02 | 0.38 ± 0.02 | 0.39 ± 0.10 | 0.48 ± 0.18 |
| 19 | 4-Thujanol | 1098 | 0.08 ± 0.07 | 0.15 ± 0.09 | 0.14 ± 0.08 | 0.27 ± 0.10 | 0.24 ± 0.07 | 0.22 ± 0.17 | 0.18 ± 0.05 | 0.32 ± 0.09 | 0.14 ± 0.02 | 0.21 ± 0.10 |
| 39 | δ-Elemene | 1336 | 0.02 ± 0.01 | 0.04 ± 0.02 | 0.03 ± 0.00 | 0.04 ± 0.02 | 0.05 ± 0.01 | 0.02 ± 0.01 | 0.04 ± 0.00 | 0.03 ± 0.02 | 0.03 ± 0.01 | 0.02 ± 0.02 |
| 40 | (-)-α-Cubebene | 1348 | 0.21 ± 0.03 | 0.27 ± 0.02 | 0.31 ± 0.09 | 0.30 ± 0.08 | 0.32 ± 0.03 | 0.22 ± 0.01 | 0.20 ± 0.02 | 0.24 ± 0.04 | 0.23 ± 0.04 | 0.17 ± 0.04 |
| 41 | α-Copaene | 1375 | 0.21 ± 0.12 | 0.25 ± 0.11 | 0.34 ± 0.05 | 0.31 ± 0.16 | 0.36 ± 0.01 | 0.22 ± 0.04 | 0.30 ± 0.03 | 0.20 ± 0.04 | 0.29 ± 0.04 | 0.20 ± 0.13 |
| 42 | β-Cubebene | 1389 | 0.04 ± 0.02 | 0.06 ± 0.03 | 0.06 ± 0.01 | 0.07 ± 0.03 | 0.10 ± 0.01 | 0.06 ± 0.02 | 0.09 ± 0.01 | 0.09 ± 0.06 | 0.08 ± 0.01 | 0.06 ± 0.04 |
| 43 | β-Elemene | 1391 | 0.12 ± 0.06 | 0.17 ± 0.07 | 0.19 ± 0.02 | 0.21 ± 0.10 | 0.24 ± 0.04 | 0.12 ± 0.02 | 0.19 ± 0.03 | 0.12 ± 0.05 | 0.16 ± 0.06 | 0.11 ± 0.07 |
| 44 | α-cis-Bergamotene | 1414 | 0.04 ± 0.02 | 0.07 ± 0.03 | 0.05 ± 0.00 | 0.06 ± 0.04 | 0.11 ± 0.02 | 0.06 ± 0.02 | 0.09 ± 0.01 | 0.05 ± 0.02 | 0.07 ± 0.02 | 0.05 ± 0.04 |
| 45 | β-Caryophyllene | 1417 | 2.30 ± 1.01 | 3.61 ± 1.33 | 2.74 ± 0.39 | 3.37 ± 1.46 | 4.75 ± 0.88 | 3.14 ± 1.26 | 3.86 ± 0.91 | 2.29 ± 0.83 | 3.46 ± 0.87 | 2.77 ± 2.01 |
| 46 | β-Copaene | 1425 | 0.08 ± 0.04 | 0.11 ± 0.05 | 0.11 ± 0.02 | 0.10 ± 0.06 | 0.12 ± 0.00 | 0.05 ± 0.01 | 0.06 ± 0.01 | 0.04 ± 0.01 | 0.07 ± 0.01 | 0.04 ± 0.04 |
| 47 | α-Bergamotene | 1432 | 0.03 ± 0.02 | 0.06 ± 0.03 | 0.06 ± 0.00 | 0.06 ± 0.02 | 0.08 ± 0.01 | 0.05 ± 0.01 | 0.07 ± 0.01 | 0.04 ± 0.01 | 0.06 ± 0.01 | 0.04 ± 0.03 |
| 48 | cis-Muurola-3,5-diene | 1441 | 0.04 ± 0.03 | 0.04 ± 0.02 | 0.07 ± 0.02 | 0.06 ± 0.05 | 0.05 ± 0.02 | 0.03 ± 0.00 | 0.03 ± 0.00 | 0.03 ± 0.00 | 0.04 ± 0.00 | 0.02 ± 0.01 |
| 49 | trans-Muurola-3,5-diene | 1445 | 0.05 ± 0.03 | 0.04 ± 0.02 | 0.08 ± 0.03 | 0.06 ± 0.05 | 0.06 ± 0.02 | 0.04 ± 0.00 | 0.05 ± 0.01 | 0.04 ± 0.02 | 0.05 ± 0.00 | 0.03 ± 0.02 |
| 50 | α-Caryophyllene | 1448 | 0.52 ± 0.24 | 0.67 ± 0.21 | 0.52 ± 0.07 | 0.57 ± 0.23 | 0.79 ± 0.09 | 0.49 ± 0.17 | 0.62 ± 0.08 | 0.37 ± 0.07 | 0.53 ± 0.09 | 0.43 ± 0.27 |
| 51 | (E)-β-Farnesene | 1453 | 0.62 ± 0.39 | 0.97 ± 0.51 | 0.65 ± 0.15 | 0.75 ± 0.42 | 1.28 ± 0.24 | 0.57 ± 0.26 | 1.06 ± 0.15 | 0.52 ± 0.22 | 0.75 ± 0.20 | 0.54 ± 0.48 |
| 52 | Alloaromadendrene | 1455 | 0.28 ± 0.15 | 0.30 ± 0.13 | 0.50 ± 0.03 | 0.42 ± 0.26 | 0.40 ± 0.08 | 0.24 ± 0.03 | 0.34 ± 0.05 | 0.29 ± 0.15 | 0.36 ± 0.02 | 0.24 ± 0.16 |
| 53 | cis-Muurola-4(15),5-diene | 1456 | 0.11 ± 0.06 | 0.10 ± 0.04 | 0.15 ± 0.04 | 0.13 ± 0.12 | 0.09 ± 0.07 | 0.04 ± 0.02 | 0.04 ± 0.00 | 0.04 ± 0.03 | 0.07 ± 0.04 | 0.03 ± 0.02 |
| 54 | γ-Muurolene | 1473 | 0.39 ± 0.23 | 0.49 ± 0.21 | 0.73 ± 0.13 | 0.60 ± 0.33 | 0.70 ± 0.02 | 0.43 ± 0.06 | 0.66 ± 0.08 | 0.45 ± 0.13 | 0.59 ± 0.07 | 0.44 ± 0.29 |
| 55 | Germacrene D | 1476 | 1.66 ± 0.83 | 2.94 ± 1.31 | 3.00 ± 0.56 | 3.85 ± 1.25 | 5.31 ± 0.70 | 3.54 ± 1.18 | 4.76 ± 0.52 | 3.39 ± 0.60 | 3.94 ± 0.78 | 3.39 ± 1.77 |
| 56 | α-Curcumene | 1480 | 0.05 ± 0.02 | 0.05 ± 0.02 | 0.07 ± 0.00 | 0.06 ± 0.03 | 0.08 ± 0.01 | 0.04 ± 0.00 | 0.05 ± 0.00 | 0.05 ± 0.01 | 0.05 ± 0.00 | 0.04 ± 0.02 |
| 57 | Bicyclosesquiphellandrene | 1487 | 0.10 ± 0.06 | 0.09 ± 0.04 | 0.16 ± 0.04 | 0.13 ± 0.09 | 0.13 ± 0.03 | 0.10 ± 0.01 | 0.13 ± 0.02 | 0.08 ± 0.04 | 0.11 ± 0.01 | 0.07 ± 0.05 |
| 59 | Bicyclogermacrene | 1493 | 0.63 ± 0.27 | 1.05 ± 0.42 | 0.91 ± 0.08 | 1.09 ± 0.40 | 1.37 ± 0.16 | 0.75 ± 0.32 | 0.95 ± 0.12 | 0.69 ± 0.16 | 0.96 ± 0.17 | 0.72 ± 0.48 |
| 60 | α-Muurolene | 1499 | 0.98 ± 0.52 | 0.97 ± 0.34 | 1.35 ± 0.22 | 1.20 ± 0.64 | 1.29 ± 0.16 | 0.86 ± 0.04 | 1.18 ± 0.17 | 0.86 ± 0.27 | 1.10 ± 0.10 | 0.83 ± 0.46 |
| 61 | α-Bulnesene | 1504 | 0.04 ± 0.02 | 0.04 ± 0.02 | 0.06 ± 0.01 | 0.05 ± 0.02 | 0.07 ± 0.01 | 0.06 ± 0.02 | 0.08 ± 0.01 | 0.06 ± 0.02 | 0.06 ± 0.00 | 0.05 ± 0.03 |
| 62 | Farnesene | 1510 | 0.26 ± 0.18 | 0.19 ± 0.10 | 0.61 ± 0.17 | 0.41 ± 0.24 | 0.40 ± 0.10 | 0.23 ± 0.11 | 0.21 ± 0.04 | 0.29 ± 0.13 | 0.23 ± 0.01 | 0.20 ± 0.14 |
| 63 | (+)-γ-Cadinene | 1513 | 1.28 ± 0.69 | 1.32 ± 0.50 | 1.96 ± 0.31 | 1.79 ± 1.23 | 1.68 ± 0.30 | 1.01 ± 0.24 | 1.18 ± 0.19 | 0.97 ± 0.32 | 1.17 ± 0.06 | 0.85 ± 0.46 |
| 64 | (+)-δ-Cadinene | 1526 | 4.42 ± 2.50 | 4.26 ± 1.65 | 6.93 ± 1.02 | 5.77 ± 3.30 | 5.76 ± 0.89 | 4.28 ± 0.66 | 5.28 ± 0.77 | 4.06 ± 1.70 | 5.09 ± 0.30 | 3.86 ± 2.17 |
| 65 | Cadinadiene | 1534 | 0.10 ± 0.06 | 0.09 ± 0.04 | 0.15 ± 0.03 | 0.12 ± 0.08 | 0.11 ± 0.02 | 0.08 ± 0.00 | 0.10 ± 0.01 | 0.08 ± 0.02 | 0.11 ± 0.00 | 0.07 ± 0.04 |
| 66 | α-Cadinene | 1537 | 0.21 ± 0.13 | 0.20 ± 0.09 | 0.31 ± 0.05 | 0.28 ± 0.21 | 0.24 ± 0.06 | 0.16 ± 0.01 | 0.20 ± 0.03 | 0.15 ± 0.06 | 0.21 ± 0.02 | 0.14 ± 0.08 |
| 67 | α-Calacorene | 1545 | 0.03 ± 0.00 | 0.04 ± 0.01 | 0.04 ± 0.01 | 0.04 ± 0.02 | 0.04 ± 0.00 | 0.03 ± 0.01 | 0.02 ± 0.00 | 0.02 ± 0.01 | 0.02 ± 0.00 | 0.02 ± 0.00 |
| 68 | Germacrene B | 1558 | 0.03 ± 0.00 | 0.04 ± 0.01 | 0.03 ± 0.01 | 0.05 ± 0.02 | 0.05 ± 0.01 | 0.02 ± 0.00 | 0.03 ± 0.00 | 0.02 ± 0.00 | 0.02 ± 0.01 | 0.02 ± 0.00 |
| 74 | Humulene epoxide ii | 1604 | 0.03 ± 0.01 | 0.02 ± 0.00 | 0.02 ± 0.00 | 0.02 ± 0.00 | 0.03 ± 0.00 | 0.01 ± 0.00 | 0.01 ± 0.00 | 0.01 ± 0.00 | 0.02 ± 0.00 | 0.02 ± 0.00 |
| Alcohol | ||||||||||||
| 13 | 1,8-Cineole | 1020 | 14.47 ± 3.76 | 14.29 ± 2.70 | 18.54 ± 3.77 | 18.64 ± 5.86 | 17.51 ± 1.74 | 21.61 ± 3.22 | 18.13 ± 1.30 | 24.19 ± 1.90 | 19.44 ± 3.07 | 20.86 ± 2.38 |
| 16 | (Z)-Sabinene hydrate | 1062 | 0.11 ± 0.10 | 0.21 ± 0.12 | 0.18 ± 0.09 | 0.38 ± 0.15 | 0.35 ± 0.14 | 0.32 ± 0.26 | 0.28 ± 0.09 | 0.47 ± 0.14 | 0.19 ± 0.02 | 0.28 ± 0.12 |
| 20 | Linalool | 1100 | 5.22 ± 1.69 | 5.76 ± 1.85 | 3.20 ± 1.15 | 4.32 ± 1.93 | 4.15 ± 0.15 | 3.60 ± 0.60 | 3.10 ± 0.60 | 2.90 ± 1.84 | 2.86 ± 0.60 | 2.78 ± 1.30 |
| 21 | Fenchol | 1113 | 0.09 ± 0.06 | 0.13 ± 0.02 | 0.02 ± 0.01 | 0.06 ± 0.04 | 0.07 ± 0.00 | 0.03 ± 0.02 | 0.05 ± 0.02 | 0.04 ± 0.02 | 0.04 ± 0.00 | 0.03 ± 0.03 |
| 22 | (Z)-ρ-Menth-2-en-1-ol | 1122 | 0.14 ± 0.02 | 0.11 ± 0.03 | 0.13 ± 0.00 | 0.11 ± 0.04 | 0.10 ± 0.02 | 0.12 ± 0.05 | 0.08 ± 0.01 | 0.11 ± 0.03 | 0.09 ± 0.02 | 0.13 ± 0.07 |
| 23 | (E)-ρ-Menth-2-en-1-ol | 1140 | 0.05 ± 0.01 | 0.06 ± 0.02 | 0.05 ± 0.02 | 0.05 ± 0.02 | 0.04 ± 0.00 | 0.05 ± 0.01 | 0.03 ± 0.01 | 0.05 ± 0.02 | 0.04 ± 0.01 | 0.04 ± 0.01 |
| 25 | Camphene hydrate | 1148 | 1.29 ± 0.54 | 0.14 ± 0.05 | 0.47 ± 0.38 | 0.23 ± 0.19 | 0.31 ± 0.36 | 0.20 ± 0.31 | 0.25 ± 0.21 | 0.12 ± 0.06 | 0.18 ± 0.24 | 0.54 ± 0.68 |
| 27 | δ-Terpineol | 1167 | 0.45 ± 0.09 | 0.50 ± 0.18 | 0.65 ± 0.14 | 0.54 ± 0.16 | 0.45 ± 0.09 | 0.61 ± 0.57 | 0.30 ± 0.05 | 0.46 ± 0.08 | 0.33 ± 0.08 | 0.36 ± 0.11 |
| 28 | Terpinine-4-ol | 1177 | 1.85 ± 0.31 | 1.78 ± 0.70 | 1.93 ± 0.59 | 1.72 ± 0.61 | 1.45 ± 0.29 | 1.96 ± 0.47 | 1.25 ± 0.16 | 1.82 ± 0.44 | 1.55 ± 0.39 | 1.77 ± 0.59 |
| 29 | 2-(4-Methylphenyl)propan-2-ol | 1185 | 0.06 ± 0.04 | 0.01 ± 0.00 | 0.02 ± 0.01 | 0.01 ± 0.00 | 0.01 ± 0.00 | 0.01 ± 0.00 | 0.01 ± 0.00 | 0.01 ± 0.00 | 0.01 ± 0.00 | 0.02 ± 0.01 |
| 30 | α-Terpineol | 1191 | 7.41 ± 1.74 | 8.45 ± 2.95 | 9.87 ± 2.85 | 9.25 ± 2.09 | 7.75 ± 0.97 | 7.69 ± 4.85 | 5.16 ± 0.44 | 7.62 ± 0.95 | 5.64 ± 1.08 | 6.44 ± 1.48 |
| 31 | (Z)-Piperitol | 1195 | 0.03 ± 0.01 | 0.03 ± 0.02 | 0.03 ± 0.01 | 0.03 ± 0.01 | 0.02 ± 0.00 | 0.03 ± 0.01 | 0.02 ± 0.00 | 0.03 ± 0.00 | 0.03 ± 0.00 | 0.03 ± 0.00 |
| 32 | (E)-Piperitol | 1208 | 0.03 ± 0.01 | 0.03 ± 0.01 | 0.03 ± 0.01 | 0.03 ± 0.01 | 0.02 ± 0.00 | 0.03 ± 0.02 | 0.02 ± 0.00 | 0.03 ± 0.00 | 0.03 ± 0.00 | 0.03 ± 0.01 |
| 34 | Citronellol | 1229 | 2.86 ± 1.30 | 4.12 ± 1.18 | 0.63 ± 0.38 | 1.39 ± 0.80 | 1.43 ± 0.12 | 0.57 ± 0.36 | 0.75 ± 0.16 | 0.58 ± 0.50 | 0.62 ± 0.16 | 0.42 ± 0.52 |
| 36 | Geraniol | 1256 | 2.19 ± 1.44 | 3.13 ± 1.01 | 0.65 ± 0.09 | 1.24 ± 0.64 | 1.04 ± 0.10 | 0.55 ± 0.11 | 0.44 ± 0.10 | 0.52 ± 0.29 | 0.45 ± 0.07 | 0.40 ± 0.30 |
| 58 | epi-Cubebol | 1492 | 0.16 ± 0.07 | 0.25 ± 0.09 | 0.30 ± 0.05 | 0.30 ± 0.23 | 0.25 ± 0.06 | 0.17 ± 0.07 | 0.04 ± 0.02 | 0.14 ± 0.10 | 0.19 ± 0.03 | 0.14 ± 0.04 |
| 69 | Nerolidol | 1566 | 0.07 ± 0.02 | 0.08 ± 0.02 | 1.23 ± 1.62 | 0.05 ± 0.01 | 0.08 ± 0.04 | 0.44 ± 0.63 | 0.03 ± 0.00 | 0.37 ± 0.45 | 0.34 ± 0.37 | 0.39 ± 0.53 |
| 70 | Spathulenol | 1575 | 1.13 ± 0.31 | 2.05 ± 0.81 | 2.77 ± 1.16 | 4.37 ± 2.57 | 3.63 ± 0.65 | 2.89 ± 2.22 | 2.94 ± 1.16 | 3.85 ± 0.66 | 2.12 ± 0.35 | 2.51 ± 1.36 |
| 72 | Gleenol | 1586 | 0.06 ± 0.00 | 0.08 ± 0.02 | 0.08 ± 0.02 | 0.10 ± 0.04 | 0.07 ± 0.01 | 0.05 ± 0.04 | 0.04 ± 0.01 | 0.05 ± 0.01 | 0.05 ± 0.01 | 0.05 ± 0.00 |
| 75 | 1,10-di-epi-Cubenol | 1612 | 0.16 ± 0.06 | 0.15 ± 0.02 | 0.18 ± 0.04 | 0.15 ± 0.10 | 0.12 ± 0.04 | 0.07 ± 0.03 | 0.07 ± 0.01 | 0.07 ± 0.02 | 0.08 ± 0.00 | 0.07 ± 0.00 |
| 76 | 1-epi-Cubenol | 1627 | 0.32 ± 0.10 | 0.30 ± 0.03 | 0.37 ± 0.10 | 0.31 ± 0.17 | 0.22 ± 0.08 | 0.16 ± 0.08 | 0.16 ± 0.02 | 0.16 ± 0.06 | 0.18 ± 0.00 | 0.16 ± 0.00 |
| 77 | T-Muurolol | 1642 | 3.66 ± 0.98 | 3.45 ± 0.27 | 4.75 ± 0.92 | 4.41 ± 2.61 | 3.41 ± 0.55 | 2.60 ± 1.40 | 2.55 ± 0.58 | 2.75 ± 1.13 | 2.82 ± 0.25 | 2.69 ± 0.35 |
| 78 | α-Muurolol | 1644 | 0.55 ± 0.13 | 0.53 ± 0.06 | 0.71 ± 0.16 | 0.71 ± 0.32 | 0.54 ± 0.09 | 0.39 ± 0.22 | 0.38 ± 0.09 | 0.42 ± 0.16 | 0.43 ± 0.05 | 0.41 ± 0.06 |
| 79 | α-Cadinol | 1654 | 5.30 ± 1.38 | 5.40 ± 0.83 | 7.37 ± 1.39 | 7.07 ± 3.28 | 5.43 ± 0.56 | 4.64 ± 2.93 | 4.36 ± 1.12 | 4.85 ± 1.99 | 4.78 ± 0.71 | 4.90 ± 0.93 |
| 80 | Eudesma-4(15),7-dien-1β-ol | 1689 | 0.04 ± 0.00 | 0.05 ± 0.00 | 0.02 ± 0.01 | 0.03 ± 0.00 | 0.04 ± 0.01 | 0.01 ± 0.00 | 0.02 ± 0.00 | 0.01 ± 0.00 | 0.03 ± 0.01 | 0.02 ± 0.00 |
| 81 | Shyobunol | 1691 | 0.10 ± 0.01 | 0.15 ± 0.02 | 0.10 ± 0.03 | 0.15 ± 0.03 | 0.13 ± 0.02 | 0.08 ± 0.05 | 0.08 ± 0.01 | 0.08 ± 0.01 | 0.07 ± 0.03 | 0.07 ± 0.00 |
| 82 | 4(15),5,10(14)-Germacratrien-1-ol | 1697 | 0.07 ± 0.01 | 0.10 ± 0.01 | 0.04 ± 0.02 | 0.04 ± 0.00 | 0.04 ± 0.01 | 0.02 ± 0.01 | 0.03 ± 0.00 | 0.02 ± 0.01 | 0.03 ± 0.01 | 0.02 ± 0.00 |
| 83 | Farnesol | 1714 | 0.03 ± 0.01 | 0.03 ± 0.00 | 0.01 ± 0.00 | 0.02 ± 0.00 | 0.02 ± 0.01 | 0.03 ± 0.02 | 0.01 ± 0.00 | 0.02 ± 0.02 | 0.03 ± 0.03 | 0.02 ± 0.01 |
| 84 | (2E,6E)-Farnesol | 1724 | 15.79 ± 2.96 | 19.29 ± 0.58 | 5.84 ± 5.52 | 8.62 ± 3.00 | 9.03 ± 2.12 | 3.23 ± 1.71 | 5.18 ± 0.52 | 3.70 ± 2.65 | 5.48 ± 3.68 | 3.70 ± 2.40 |
| Ketone | ||||||||||||
| 18 | 2-Nonanone | 1093 | 0.03 ± 0.01 | 0.04 ± 0.02 | 0.03 ± 0.00 | 0.03 ± 0.02 | 0.03 ± 0.01 | 0.04 ± 0.02 | 0.06 ± 0.01 | 0.08 ± 0.04 | 0.04 ± 0.01 | 0.05 ± 0.01 |
| 24 | (−)-Camphor | 1143 | 11.60 ± 2.96 | 1.84 ± 0.35 | 4.88 ± 2.74 | 2.73 ± 1.82 | 3.25 ± 3.06 | 2.00 ± 2.68 | 2.80 ± 2.26 | 1.49 ± 0.62 | 2.18 ± 2.66 | 5.61 ± 6.62 |
| 73 | Salvial-4(14)-en-1-one | 1591 | 0.02 ± 0.00 | 0.03 ± 0.00 | 0.01 ± 0.00 | 0.01 ± 0.01 | 0.02 ± 0.00 | 0.01 ± 0.00 | 0.01 ± 0.00 | 0.01 ± 0.00 | 0.01 ± 0.00 | 0.01 ± 0.00 |
| Aldehyde | ||||||||||||
| 26 | (+)-Citronellal | 1154 | 0.07 ± 0.03 | 0.10 ± 0.01 | 0.02 ± 0.02 | 0.03 ± 0.02 | 0.04 ± 0.01 | 0.07 ± 0.07 | 0.09 ± 0.02 | 0.05 ± 0.04 | 0.07 ± 0.04 | 0.05 ± 0.05 |
| 85 | (2-trans,6-trans)-Farnesal | 1746 | 0.17 ± 0.16 | 0.10 ± 0.02 | 0.02 ± 0.02 | 0.03 ± 0.02 | 0.02 ± 0.01 | 0.06 ± 0.04 | 0.04 ± 0.01 | 0.04 ± 0.04 | 0.06 ± 0.06 | 0.04 ± 0.02 |
| Phenol | ||||||||||||
| 38 | Carvacrol | 1304 | 0.04 ± 0.00 | 0.06 ± 0.02 | 0.03 ± 0.00 | 0.03 ± 0.00 | 0.03 ± 0.00 | 0.02 ± 0.01 | 0.03 ± 0.00 | 0.04 ± 0.01 | 0.03 ± 0.00 | 0.03 ± 0.01 |
| Ester | ||||||||||||
| 33 | Fenchyl acetate | 1221 | 0.03 ± 0.00 | 0.03 ± 0.01 | 0.01 ± 0.00 | 0.02 ± 0.00 | 0.02 ± 0.00 | 0.02 ± 0.01 | 0.02 ± 0.00 | 0.02 ± 0.00 | 0.02 ± 0.00 | 0.02 ± 0.01 |
| 37 | (+)-Bornyl acetate | 1286 | 0.64 ± 0.22 | 0.18 ± 0.02 | 0.38 ± 0.18 | 0.24 ± 0.07 | 0.31 ± 0.18 | 0.25 ± 0.25 | 0.18 ± 0.10 | 0.19 ± 0.07 | 0.26 ± 0.27 | 0.55 ± 0.71 |
| Ether | ||||||||||||
| 35 | 2-Isopropyl-5-methylanisole | 1236 | 0.04 ± 0.00 | 0.04 ± 0.00 | 0.05 ± 0.02 | 0.04 ± 0.01 | 0.04 ± 0.00 | 0.03 ± 0.01 | 0.03 ± 0.01 | 0.04 ± 0.01 | 0.04 ± 0.01 | 0.03 ± 0.00 |
| 71 | Caryophyllene oxide | 1581 | 0.22 ± 0.05 | 0.26 ± 0.03 | 0.10 ± 0.05 | 0.17 ± 0.04 | 0.19 ± 0.02 | 0.11 ± 0.02 | 0.12 ± 0.01 | 0.08 ± 0.01 | 0.07 ± 0.02 | 0.07 ± 0.03 |
| No. | tR/ min | Compound Formula | MS (ESI+) | Error /ppm | MS2 (ESI+) | Name |
|---|---|---|---|---|---|---|
| 1 | 1.31 | C22H26O6 | 387.1800 [M + H]+/369.1695 [M + H-H2O]+ | −0.659 | 351.1591, 339.1590, 231.1009, 151.0754 | eudesmin |
| 3 | 4.14 | C22H26O6 | 386.1721 [M]+/ 369.1693 [M + H-H2O]+ | −0.621 | 351.1592, 339.1592, 231.1015, 151.0752 | pinoresinol dimethyl ether |
| 4 | 4.6 | C23H28O7 | 417.1903 [M + H]+/ 399.1801 [M + H-H2O]+ | −1.054 | 381.1698, 350.1514, 261.1121, 231.1015, 181.0858, 151.0752 | magnolin |
| 5 | 5.1 | C24H30O8 | 447.2002 [M + H]+/ 429.1906 [M + H-H2O]+ | −0.895 | 411.1801, 380.1620, 261.1119, 231.1014, 181.0856 | lirioresinol B dimethyl ether |
| 6 | 5.75 | C23H28O7 | 416.1825 [M]+/ 399.1800 [M + H-H2O]+ | −1.02 | 381.1696, 350.1512, 261.1120, 231.1015, 181.0857, 151.0751 | epimagnolin A |
| 7 | 6.83 | C21H22O6 | 370.1419 [M]+/ 353.1383 [M + H-H2O]+ | 2.135 | 335.1277, 323.1269, 135.0435 | demethoxyaschantin |
| 8 | 7.63 | C22H24O7 | 401.1517 [M + H]+/ 383.1489 [M + H-H2O]+ | 0.114 | 365.139 | aschantin |
| 9 | 8.77 | C21H22O6 | 370.1414 [M + H]+/ 353.1384 [M + H-H2O]+ | 0.811 | 335.1276, 283.0961 | fargesin |
| Compound | Regression | R2 | Linear Range/(mg·mL−1) |
|---|---|---|---|
| Pinoresinol diMethyl ether | y = 5,719,722 x + 82,768 | 0.9992 | 0.0272–1.74 |
| magnolin | y = 3,198,608 x + 81,412 | 0.9996 | 0.0510–3.26 |
| epimagnolin A | y = 3,278,152 x + 3689 | 1.0000 | 0.0150–0.96 |
| fargesin | y = 6,435,286 x − 7258 | 1.0000 | 0.0169–1.08 |
| No. | L* | a* | b* | E*ab |
|---|---|---|---|---|
| S1–1 | 47.01 | 2.15 | 25.88 | 53.71 |
| S1–2 | 43.08 | 2.81 | 25.40 | 50.09 |
| S1–3 | 48.85 | 2.39 | 28.62 | 56.67 |
| S2–1 | 51.52 | 1.74 | 26.16 | 57.81 |
| S2–2 | 48.56 | 1.82 | 27.82 | 55.99 |
| S2–3 | 48.58 | 1.90 | 26.53 | 55.39 |
| S3–1 | 46.09 | 2.66 | 29.77 | 54.93 |
| S3–2 | 50.24 | 2.01 | 30.26 | 58.68 |
| S3–3 | 56.21 | 1.34 | 29.89 | 63.68 |
| S4–1 | 56.12 | 1.57 | 35.26 | 66.30 |
| S4–2 | 59.58 | 1.37 | 32.77 | 68.01 |
| S4–3 | 53.32 | 1.95 | 35.48 | 64.08 |
| S5–1 | 60.41 | 1.58 | 39.42 | 72.15 |
| S5–2 | 59.43 | 2.05 | 39.73 | 71.52 |
| S5–3 | 57.20 | 1.88 | 40.25 | 69.97 |
| S6–1 | 65.33 | 1.16 | 42.40 | 77.89 |
| S6–2 | 55.92 | 1.74 | 40.27 | 68.93 |
| S6–3 | 61.85 | 1.62 | 39.49 | 73.40 |
| S7–1 | 60.84 | 1.60 | 42.14 | 74.03 |
| S7–2 | 58.26 | 1.90 | 42.26 | 72.00 |
| S7–3 | 58.03 | 1.59 | 41.40 | 71.30 |
| S8–1 | 55.78 | 1.14 | 38.62 | 67.85 |
| S8–2 | 56.45 | 1.28 | 37.37 | 67.71 |
| S8–3 | 57.32 | 1.44 | 40.09 | 69.96 |
| S9–1 | 55.26 | 0.99 | 39.65 | 68.02 |
| S9–2 | 57.98 | 1.08 | 37.88 | 69.27 |
| S9–3 | 55.35 | 1.55 | 36.79 | 66.48 |
| S10–1 | 57.57 | 1.01 | 37.38 | 68.65 |
| S10–2 | 57.25 | 1.26 | 37.61 | 68.51 |
| S10–3 | 57.23 | 1.27 | 38.50 | 68.99 |
Disclaimer/Publisher’s Note: The statements, opinions and data contained in all publications are solely those of the individual author(s) and contributor(s) and not of MDPI and/or the editor(s). MDPI and/or the editor(s) disclaim responsibility for any injury to people or property resulting from any ideas, methods, instructions or products referred to in the content. |
© 2025 by the authors. Licensee MDPI, Basel, Switzerland. This article is an open access article distributed under the terms and conditions of the Creative Commons Attribution (CC BY) license (https://creativecommons.org/licenses/by/4.0/).
Share and Cite
Bu, C.; Zhang, Q.; Sun, X.; Chen, S. Study on the Variation Patterns of Main Components and Chromaticity During the Developmental Process of Magnoliae Flos (Magnolia biondii). Horticulturae 2025, 11, 806. https://doi.org/10.3390/horticulturae11070806
Bu C, Zhang Q, Sun X, Chen S. Study on the Variation Patterns of Main Components and Chromaticity During the Developmental Process of Magnoliae Flos (Magnolia biondii). Horticulturae. 2025; 11(7):806. https://doi.org/10.3390/horticulturae11070806
Chicago/Turabian StyleBu, Chenxi, Qinqin Zhang, Xiaoya Sun, and Suiqing Chen. 2025. "Study on the Variation Patterns of Main Components and Chromaticity During the Developmental Process of Magnoliae Flos (Magnolia biondii)" Horticulturae 11, no. 7: 806. https://doi.org/10.3390/horticulturae11070806
APA StyleBu, C., Zhang, Q., Sun, X., & Chen, S. (2025). Study on the Variation Patterns of Main Components and Chromaticity During the Developmental Process of Magnoliae Flos (Magnolia biondii). Horticulturae, 11(7), 806. https://doi.org/10.3390/horticulturae11070806