Article

Difference Analysis of Non-Volatile and Volatile Components in Kujingcha (Ilex dabieshanensis) Compared with Green Tea (Camellia sinensis)

1
Key Laboratory of Tea Resources Comprehensive Utilization of Ministry of Agriculture and Rural Affairs, Fruit and Tea Research Institute, Hubei Academy of Agricultural Sciences, Wuhan 430064, China
2
Tuanfeng Daqishan Kujingcha Co., Ltd., Huanggang 438810, China
3
Huanggang Agricultural Technology Promotion Center, Huanggang 438000, China
4
Huanggang Academy of Agricultural Sciences, Huanggang 438000, China
5
Tuanfeng Agricultural and Rural Bureau, Huanggang 438800, China
6
Tuanfeng Agricultural Technology Promotion Center, Huanggang 438800, China
7
Tuanfeng Kujingcha Research and Development Center, Huanggang 438810, China
*
Author to whom correspondence should be addressed.
These authors contributed equally to this work.
Horticulturae 2025, 11(7), 804; https://doi.org/10.3390/horticulturae11070804
Submission received: 10 June 2025 / Revised: 27 June 2025 / Accepted: 2 July 2025 / Published: 7 July 2025

Abstract

Kujingcha (KJC) is a widely consumed substitute tea due to its unique flavor quality and health benefits. However, the biochemical basis for the formation of KJC’s unique flavor quality and health benefits remain unclear. In this study, using Camellia sinensis green tea and its processed fresh leaves as a control, we systematically analyzed the non-volatile and volatile components in KJC and its processed fresh leaves. The results indicate that high levels of flavonoids and water-soluble sugars, and low levels of amino acids and water-soluble proteins, are important biochemical foundations for the formation of taste quality in KJC. High aldehyde, alkene and heterocyclics contents contribute significantly to the aroma of KJC, among which heterocyclics are the key components for the formation of KJC’s rich pan-fried bean-like aroma. Flavonoids such as neohesperidin, hyperoside, rutin, astilbin and morin are important components for the formation of KJC’s health benefits.

1. Introduction

Kudingcha is an important traditional substitute tea in China and is widely consumed due to its unique flavor quality and many health benefits [1]. A wide variety of plant species are used for processing Kudingcha, and nearly 20 plant species from different families in different regions of China have been named Kudingcha because of their similar appearance, flavor and traditional usage [2]. Plants of the genus Ilex, such as Ilex kudingcha, I. latifolia, I. cornuta, I. pentagona, I. chinensis and I. rotunda, are regarded as the main plant sources of Kudingcha and are called “large-leaved Kudingcha” [3]. Among them, I. kudingcha and I. latifolia are the main plant sources for processing Kudingcha products in the current market, while few reports exist on Kudingcha made from other Ilex genus plants [2,4].
In the Dabie Mountain area of Huanggang city, Hubei Province, local people have been using the fresh leaves of I. dabieshanensis to process Kudingcha according to the traditional green tea (Camellia sinensis) processing technique for a long time, which is called Kudingcha (KJC) locally and also known as “Tuanfeng Kucha” [5,6]. In terms of its flavor characteristics, KJC has a strong bitter taste followed by a sweet aftertaste, a clear and mellow taste and a rich pan-fried bean-like aroma [5]. Moreover, it has been proven in practice that KJC has health benefits such as clearing away internal heat, detoxifying the body, refreshing the mind, helping digestion and resolving food stagnation, reducing fat and facilitating weight loss, lowering blood sugar and blood pressure, reducing inflammation, and killing bacteria [7]. Due to its unique flavor characteristics and health benefits, it is deeply favored by consumers, and the products are sold to regions such as Guangdong, Hong Kong and Macau. Today, KJC has become a featured product in local areas, especially “Tuanfeng Kujingcha”, which is a protected product with the geographical indication of the People’s Republic of China.
Although the processing technique of KJC is similar to that of C. sinensis green tea, vast differences exist in their flavor characteristics and health benefits. The reason lies in the large differences in their biochemical and volatile components. To date, a large number of research reports have focused on the formation of the flavor quality and health benefits of C. sinensis green tea. For example, tea polyphenols, catechins, caffeine, theanine, etc., are the main substances that impart the important taste quality and health benefits of C. sinensis green tea [8,9]. Linalool, nonanal, dimethyl sulfide, geraniol, caproicacidhexneylester, etc., are the key components that constitute the aroma of C. sinensis green tea [10,11].
However, few systematic studies focus on the main biochemical components of KJC, and the biochemical basis for the formation of KJC’s unique flavor characteristics and health benefits remains unclear, which greatly affects the promotion and application of KJC and the development of new products. Metabolomics technologies serve as important tools for studying plant metabolites, playing a significant role in elucidating the formation mechanisms of flavor quality in plant-derived foods, as well as in the discovery and utilization of functional components [12,13]. Therefore, in this study, using traditional green tea and its processed fresh leaves as controls, we systematically analyzed the main non-volatile and volatile components in KJC and its processed fresh leaves through high-performance liquid chromatography (HPLC), ultra-high-performance liquid chromatography coupled with triple quadrupole mass spectrometry (UPLC-QQQ-MS) and head space solid-phase microextraction with gas chromatography and mass spectrometry (HS-SPME-GC-MS). This approach reveals the material basis underlying the formation of KJC’s flavor quality and health benefits. The results are conductive to comprehensively understanding the flavor components and health-active components of KJC and provide an important basis for the further application and new product development of KJC in the future.

2. Materials and Methods

2.1. Experimental Materials

In May 2023, the fresh leaves (one bud and two leaves) of I. dabieshanensis (KJCFL) and C. sinensis (GTFL) were picked at the tea garden of Tuanfeng Daqishan Kujingcha Co., Ltd. (Huanggang, China) Next, KJC and green tea (GT) were processed according to the technological processes of spreading, fixation, rolling, drying and re-drying. Specifically, the spreading process involved placing fresh leaves at a density of 0.75 kg/m2 under conditions of a room temperature of 18 °C~20 °C and approximately 75% relative humidity until the moisture content in the leaves decreased to around 60~65%. For fixation, the spread leaves were processed in a drum fixation machine (6CST-80, Hangzhou Chunjiang Tea Machinery Co., Ltd., Hangzhou, China) at 280 °C for 2 min. Rolling was carried out using a rolling machine (6CR-65, Zhejiang Chunjiang Tea Machinery Co., Ltd., Hangzhou, China) for 30 min. Drying was carried out using a hot-air dryer (6CHM-901, Zhejiang Fuyang Tea Machinery Co., Ltd., Hangzhou, China) at 110~120 °C for 10~15 min, followed by 80 °C for 15~20 min, and the moisture content of all tea samples was controlled to below 6%. Finally, 500 g of each sample was randomly selected, and this was repeated three times; the samples were frozen quickly with liquid nitrogen, then freeze-dried by freeze dryers, and placed in a refrigerator at −80 °C for storage until further analysis.

2.2. Chemicals and Reagents

The chemicals and reagents used in the study are listed in Table S1.

2.3. Experiment Methods

2.3.1. Sensory Evaluation and Quantitative Descriptive Analysis (QDA)

The infusion color, aroma and taste characteristics of the tea samples were subjected to sensory evaluation according to GB/T 23776-2018 [14]. Meanwhile, six experienced evaluators (three females and three males) conducted QDA of the tea samples. In brief, precisely 3.0 g of each tea sample was weighed and brewed with 150 mL of boiling water for 5 min. After assessing the aroma and taste characteristics of all tea samples, six primary aroma types (floral, sweet, nutty, roasted and faint scent) and six primary taste types (sweetness, sourness, astringency, bitterness umami) were selected for QDA. A 10-point scale was used to rate the intensity of these six aroma attributes in the tea infusion, where 0 = absent, 3 = weak, 5 = moderate, 7 = strong, and 10 = very strong.

2.3.2. Determination of Main Conventional Biochemical Components

The total free amino acid content was determined by the ninhydrin colorimetric method, with L-glutamic acid as the reference substance (GB/T 8314-2013) [15]. The content of tea polyphenols was determined by the Folin phenol colorimetric method, with gallic acid as the reference substance (GB/T 8313-2018) [16]. The determination of water extract content was carried out with reference to GB/T 8305-2013 [17]. The contents of water-soluble protein, water-soluble sugar and total flavones were determined according to the method of Li (2018) [18].

2.3.3. Determination of Flavonoid Content

Flavonoid content was determined by UPLC-QQQ-MS according to the following method, which was described by Xue (2025) [19]: Accurately weigh 0.10 g of the sample and place it in a 2 mL centrifuge tube, add 0.80 mL of 80% methanol–water solution, shake it thoroughly for 1 min, and perform ultrasonic treatment at 4 °C for 30 min. Let it stand still at 4 °C for 60 min, and centrifuge it for 10 min. The supernatant is then removed for solid-phase extraction. Place the supernatant in a concentrator and concentrate it to dryness, then add 0.20 mL of 80% methanol–water solution to redissolve it, shake it thoroughly for 5 min, centrifuge it at 4 °C for 10 min, and take the supernatant for testing using the testing instrument.
UPLC-QQQ-MS analysis was performed using a Waters Acquity UPLC system (Waters, Milford, MA, USA) with a UPLC HSS T3 (1.8 µm, 2.1 mm × 100 mm, Waters, Milford, MA, USA) coupled to a QQQ-MS (AB SCIEX 5500, Waters, Milford, MA, USA). Chromatographic conditions: The column temperature was 40 °C, the flow rate was 0.3 mL·min−1 and the injection volume was 5 µL. Mobile phase A was water with 0.1% formic acid, and mobile phase B was acetonitrile with 0.1% formic acid. The elution gradients were as follows: 0 min, 90% A and 10% B; 0–1 min, 90% A and 10% B; 1–14 min, 10% A and 90% B; 14–15 min, 10% A and 90% B; 15–15.1 min, 90% A and 10% B; 15.1–18 min, 90% A and 10% B. Mass spectrum conditions: ESI ion source, Curtain Gas at 35 arb, Collision GAS at 9 arb, IonSpray voltage at 4000 V, ion source temperature at 400 °C, IonSource Gas1 at 55 arb, IonSource Gas2 at 55 arb, Spray voltage at 3.1 kV (negative).
The content of each flavonoid component was quantified using the internal standard method with quercetin D5 as the reference standard. The calculation was performed according to the formula f = (Ms/As)/(Ar/Mr), where As and Ar represent the peak areas of the internal standard and reference standard, respectively, and Ms and Mr indicate the amounts of internal standard and reference standard added.

2.3.4. Determination of Catechins and Caffeine Content

Catechin and caffeine content was determined by HPLC according to the following method, which was described in our previous study [13]: Accurately weigh 0.05 g of the sample and put it into a 10 mL centrifuge tube. Add 5 mL of 70% methanol–water solution, place it in a water bath at 70 °C for 20 min, and centrifuge it at 3500 rpm for 5 min, and take the supernatant and place it in a 10 mL volumetric flask. Repeat the above steps once to extract water. Finally, make up the volume to 10 mL with a 70% methanol-water solution, filter it through a 0.22 µm filter membrane and conduct detection using the testing instrument.
The conditions and apparatus used in HPLC were a Waters 2695 HPLC system (Waters, Milford, MA, USA) equipped with a 2998 PDA detector, and a symmetry C18 column (18.5 µm, 4.6 mm × 250 mm, Waters, Milford, MA, USA). Chromatographic conditions: The column temperature was 40 °C, the flow rate was 1.0 mL·min−1, and the injection volume was 10 µL. Mobile phase A was 2% acetic acid, and mobile phase B was acetonitrile. The elution gradients were as follows: 0 min, 93.5% A and 6.5% B; 0–4 min, 93.5% A and 6.5% B; 4–16 min, 85% A and 15% B; 16–28 min, 75% A and 25% B; 28–35 min, 93.5% A and 6.5% B; 35–40 min, 93.5% A and 6.5% B.

2.3.5. Determination of Amino Acid Content

Amino acid content was determined according to the method described in our previous study [13], but slight modifications were made to the extraction method. The procedure is as follows: Accurately weigh 0.10 g of the sample and put it into a 10 mL centrifuge tube. Add 5 mL of water, place it in a water bath at 100 °C for 20 min, centrifuge it at 3500 rpm for 5 min, and take the supernatant and place it in a 10 mL volumetric flask. Repeat the above steps once to extract water. Finally, make up the volume to 10 mL with water, filter it through a 0.22 µm filter membrane and conduct detection using the testing instrument.

2.3.6. Determination of Volatile Content

Volatile component content was determined by HS-SPME-GC-MS according to the following method, which was described by in our previous study [13]. Accurately weigh 3.0 g of the tea sample and put it into an extraction flask. Add 90.0 mL of boiling water with 2.00 μL of the internal standard (90 mg·L−1 ethyl decanoate). Meanwhile, use a 50/30 μm DVB/CAR/PDM extraction probe (the extraction probe was aged for 30 min at 250 °C prior to the experiment) to adsorb the volatiles. Keep it in a water bath at 60 °C for 60 min, then take it out and immediately conduct detection using the testing instrument. All extractions were performed in triplicate to ensure analytical reproducibility.
The conditions and apparatus used in GC-MS were a 7890A gas chromatograph and a 5975C mass spectrometer (Agilent, Santa Clara, CA, USA), an HB-5MS (30 m × 0.32 mm × 0.25 µm), and an elastic quartz capillary column (Agilent, Santa Clara, CA, USA). Chromatographic conditions: The temperature of the injection port was 240 °C, the carrier gas was helium, and the flow rate was 1.0 mL·min−1. The column temperature was kept at 50 °C for 5 min, increased to 180 °C at a rate of 3 °C·min−1 and maintained for 2 min, and increased to 250 °C at a rate of 10 °C·min−1 and maintained for 3 min. Mass spectrum conditions: The EI ionization energy was 70 eV. The mass scanning range was 50–600 amu. The temperature of the ion source was 230 °C. The temperature of the quadrupole was 150 °C. The temperature of the mass spectrum transmission line was 280 °C.
Tandem retrieval and manual analysis were performed on the obtained mass spectra using the NIST11.L spectral library, and a mass spectrum matching degree greater than 90% was taken as the standard for substance identification. The concentration of each volatile component was calculated according to the formula Ci = Cis × Ai/Ais, where Ci represents the concentration of a certain component (μg·L−1), Cis represents the concentration of the internal standard (μg·L−1), Ai represents the peak area of a certain component, and Ais represents the peak area of the internal standard.

2.3.7. Data Analysis

The analyses of all samples (KJC, KJCFL, GT and GTFL) were conducted with three biological replicates, and no pooling was performed during sample preparation. GraphPad Prism 5 was used to draw histograms. Principal component analysis (PCA) was performed separately on the contents of 35 flavonoids and 58 volatile components across the four sample groups using SIMCA 14.1 software, and autoscaling was applied to all variables prior to modeling. Difference analysis was performed using SPSS 19.0 software, with one-way analysis of variance followed by significance testing at p < 0.05. Heat maps and radar charts were drawn through the online website https://www.chiplot.online (accessed on 8 April 2025). The data were subjected to Z-score normalization prior to heatmap analysis to enable the comparative visualization of metabolite expression patterns.

3. Results

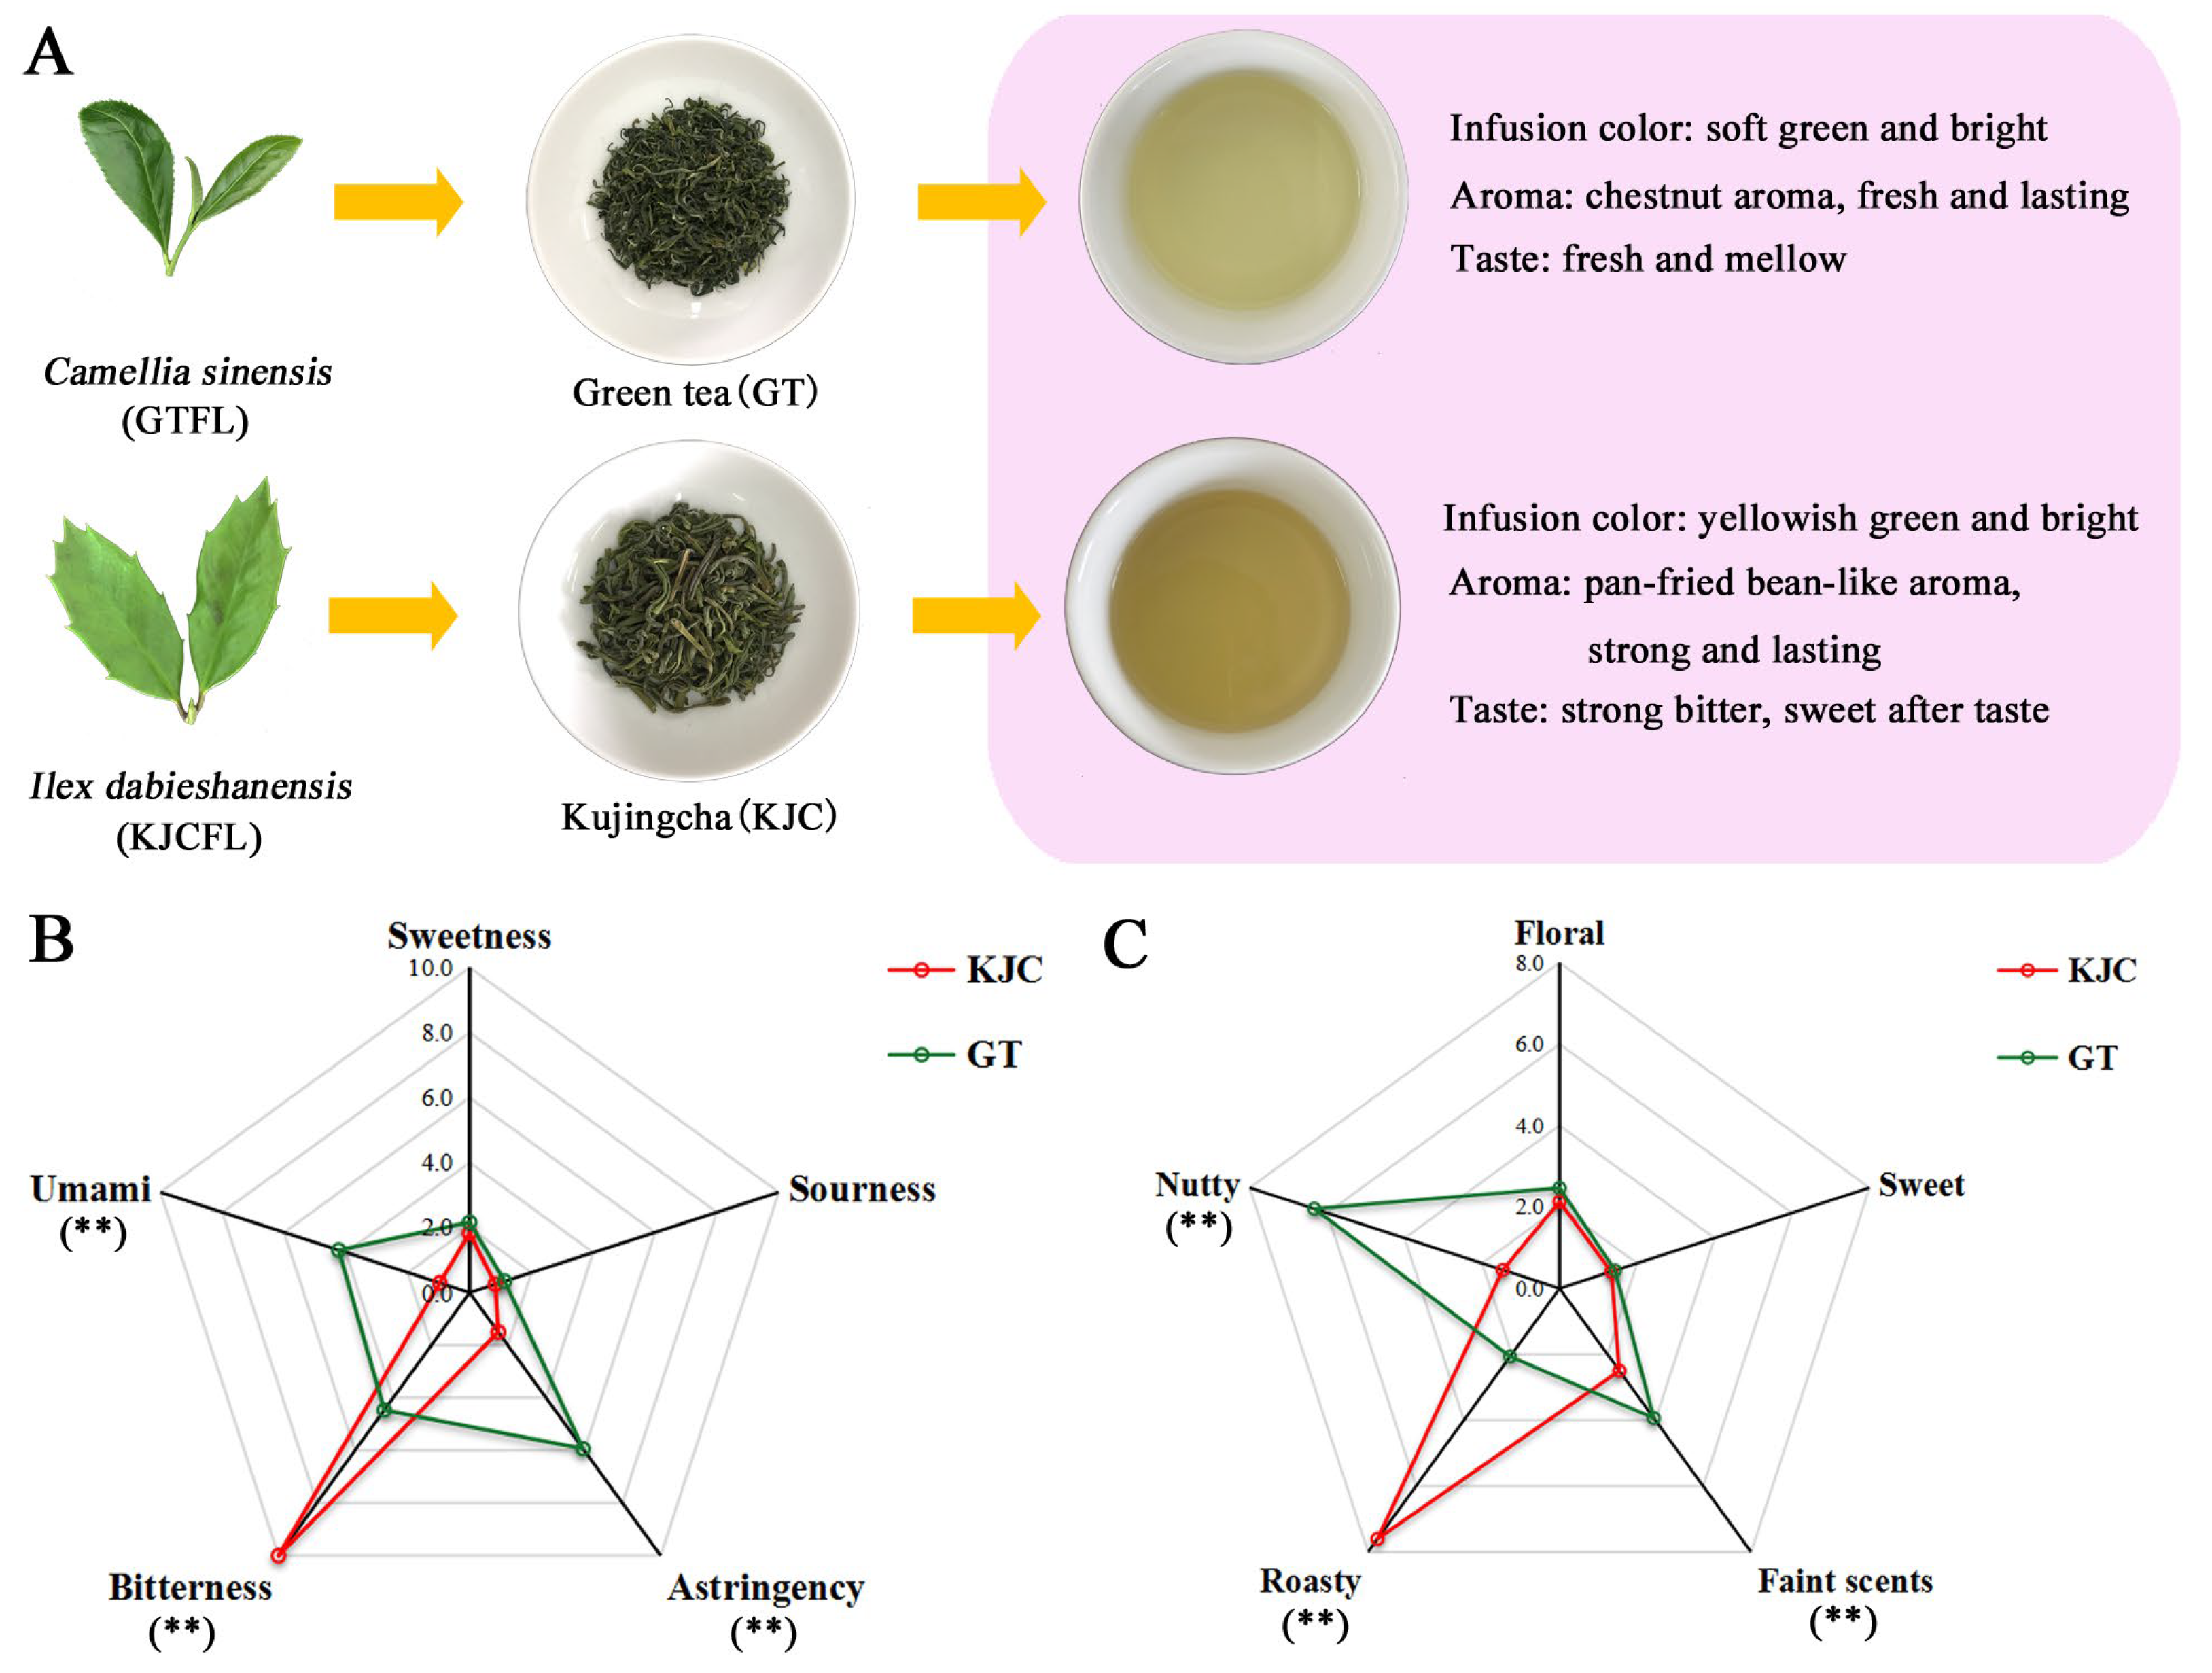
3.1. Sensory Evaluation of KJC and GT

As shown in Figure 1A, KJC and GT exhibited distinct differences in sensory characteristics. KJC displayed a yellowish green and bright infusion color, with a strong bitter taste followed by a sweet aftertaste, and a rich pan-fried bean-like aroma. In contrast, GT presented a soft green and bright infusion color, featuring a fresh and mellow taste with a refreshing chestnut-like aroma. To further characterize the taste and aroma profiles of KJC and GT in detail, QDA was performed to evaluate five taste and aroma attributes for each sample. As shown in Figure 1B, KJC showed significantly higher bitterness intensity than GT, whereas GT exhibited more pronounced umami and astringency. Additionally, no significant differences were observed between the two samples in terms of sweetness and sourness intensities. Regarding aroma attributes (Figure 1C), KJC demonstrated a significantly stronger roasty attribute compared to GT, while GT had more distinct nutty and faint-scent characteristics. No significant differences were found between the two samples in terms of the floral and sweet aroma profiles.

3.2. Analysis of Non-Volatile Component Content in Tea Samples

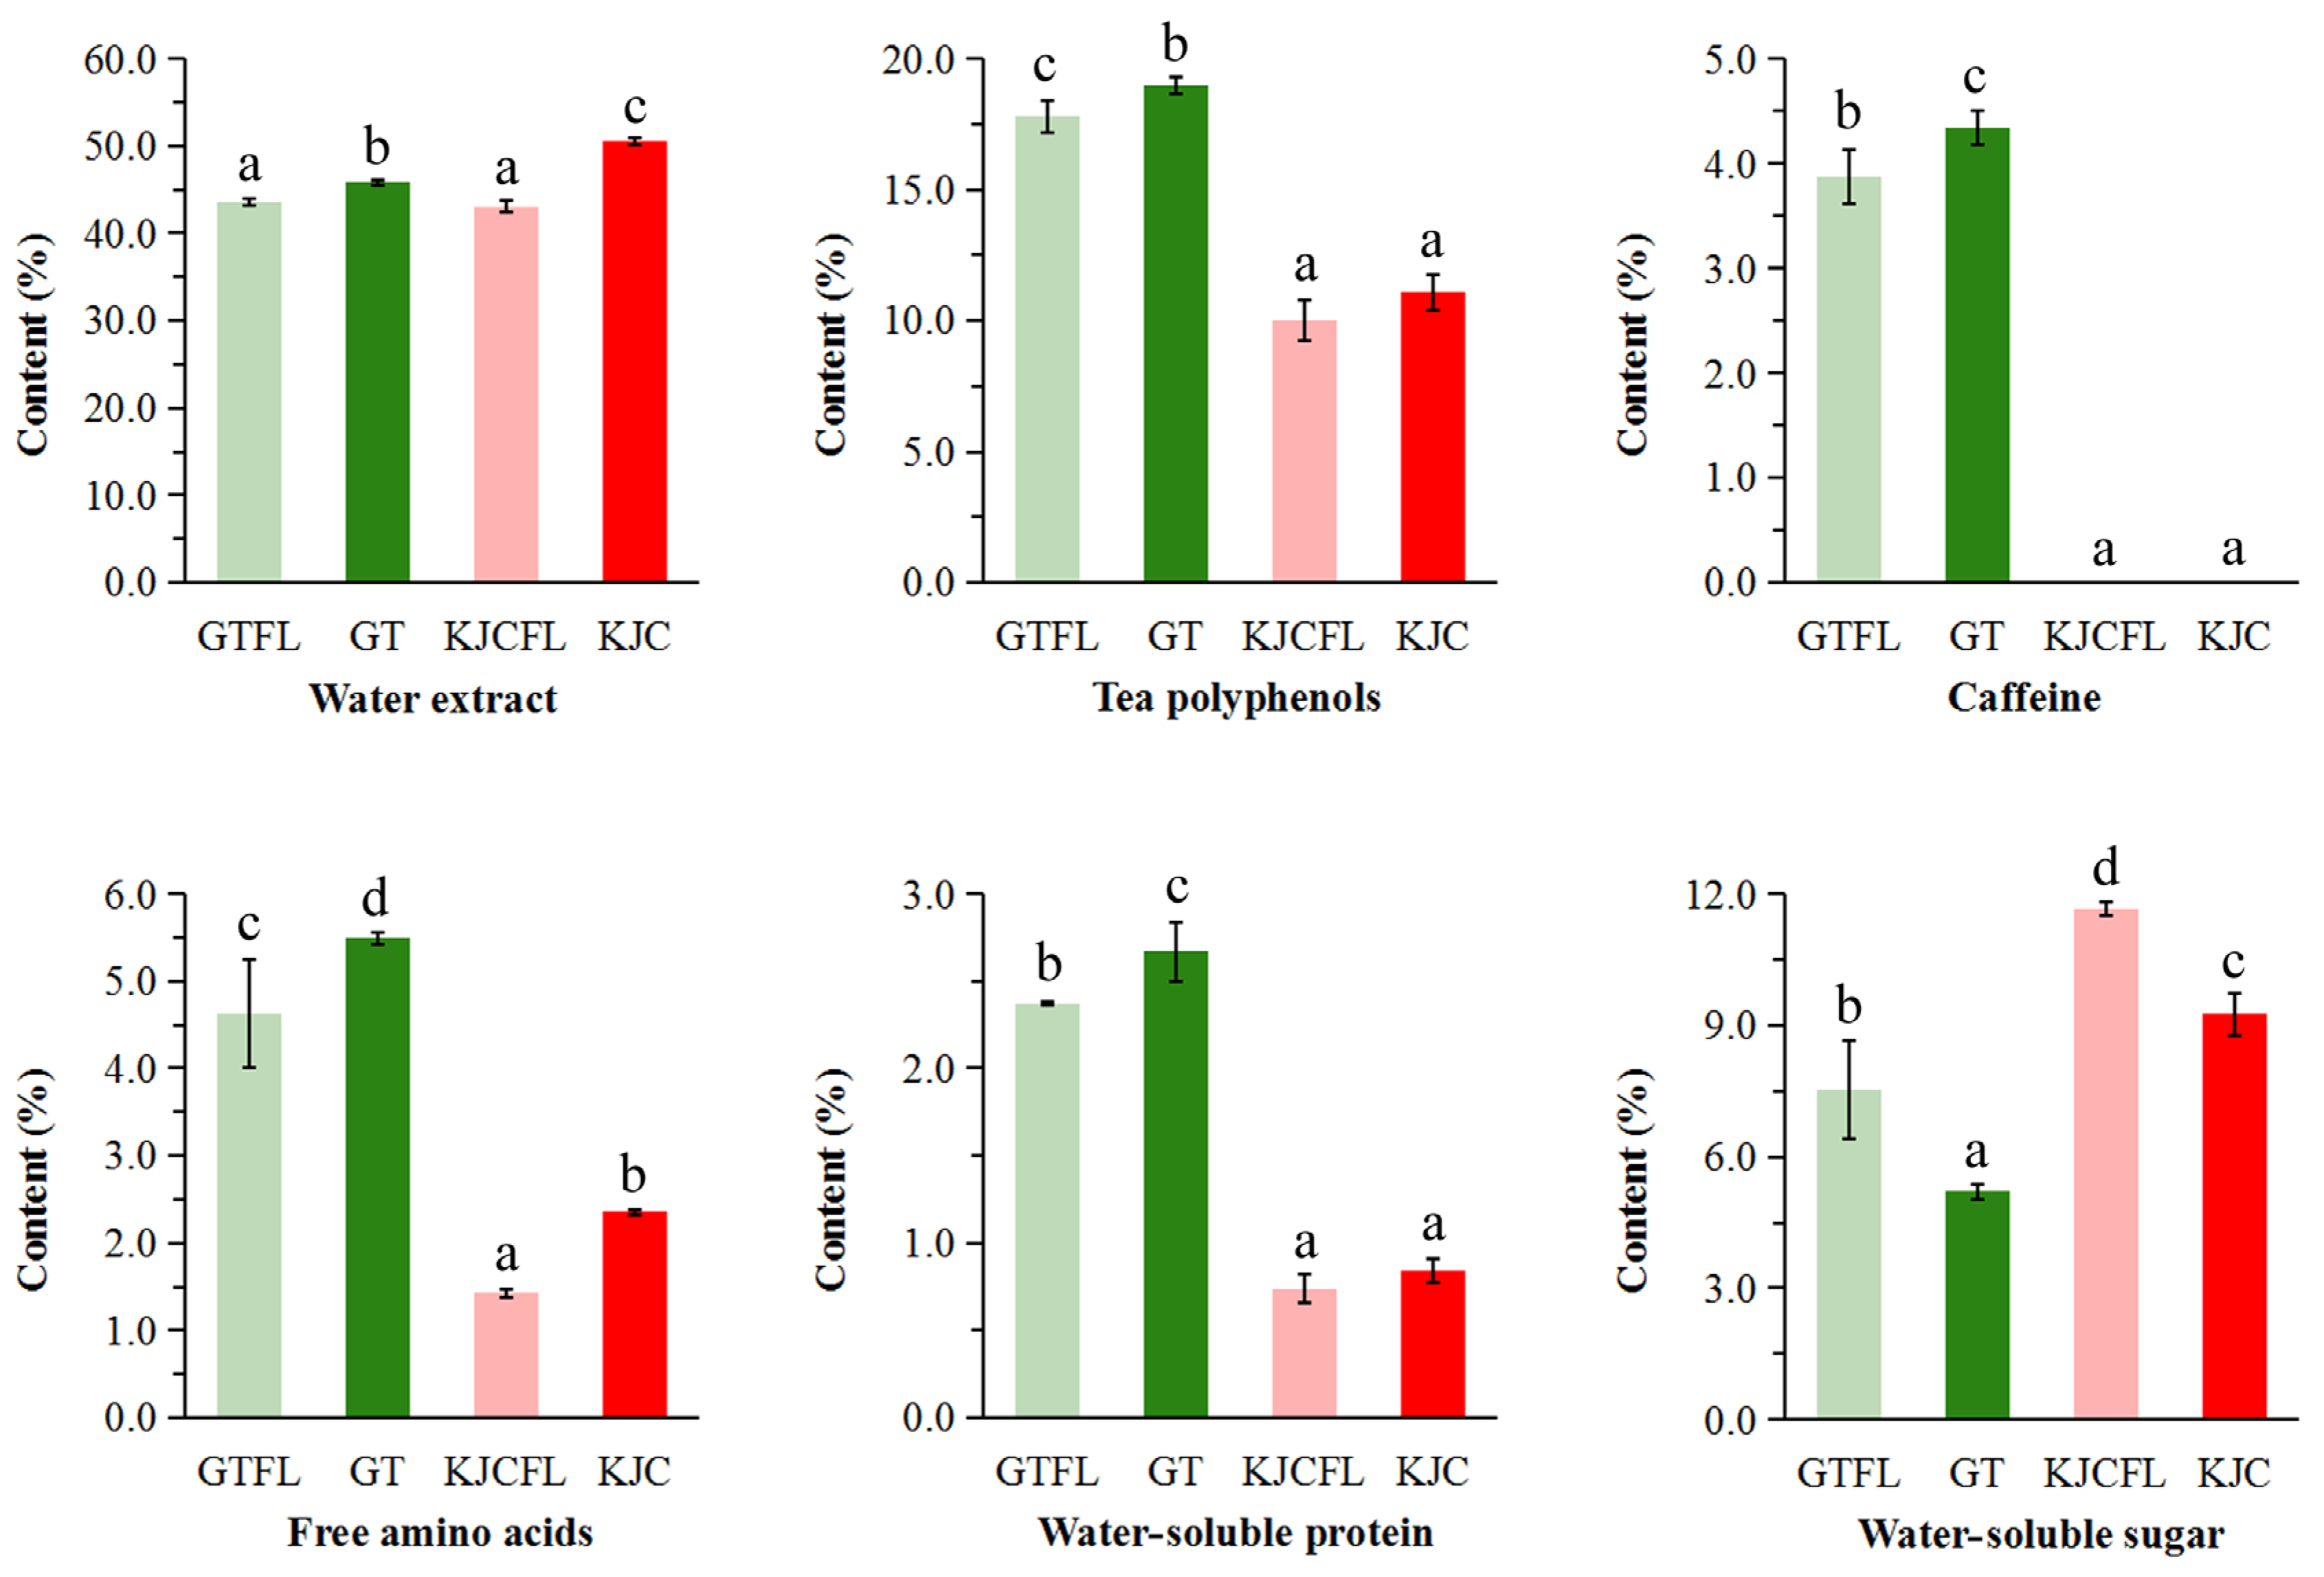
3.2.1. Main Conventional Biochemical Components Analysis

The type and content of biochemical components largely explain the taste quality and health benefits of tea [9,20]. Considering the obvious differences in the taste quality and health benefits of KJC, the main conventional biochemical components, which include water extracts, tea polyphenols, caffeine, free amino acids, water-soluble protein, and water-soluble sugar, of four tea samples (KJC, KJCFL, GT and GTFL) were analyzed. As shown in Figure 2, the water extract content was highest in KJC (50.53 ± 0.36%), and was significantly higher than that in GT. In contrast, KJCFL showed the lowest water extract content (43.07 ± 0.64%). The tea polyphenol contents in KJC and KJCFL were 11.08 ± 0.67% and 10.00 ± 0.78%, respectively, both significantly lower than those in GT and GTFL. Caffeine, a key contributor to the bitter taste of green tea [9], was detected at 4.34 ± 0.16% in GT and 3.87 ± 0.26% in GTFL, but was undetectable in both the KJC and KJCFL samples. The total free amino acid contents in KJC and KJCFL were 2.36 ± 0.03% and 1.43 ± 0.05%, and the water-soluble protein contents were 0.84 ± 0.07% and 0.74 ± 0.08%, significantly lower than those in GT and GTFL. The water-soluble sugar contents in KJC and KJCFL were 9.26 ± 0.48% and 11.67 ± 0.15%, both significantly higher than those in GT and GTFL. Meanwhile, the change rules of the main conventional biochemical components were extremely similar after KJCFL and GTFL were processed into KJC and GT. Specifically, the water extracts, tea polyphenols, amino acids, and water-soluble proteins all demonstrate varying degrees of increase, while water-soluble sugars indicate the opposite change rules.

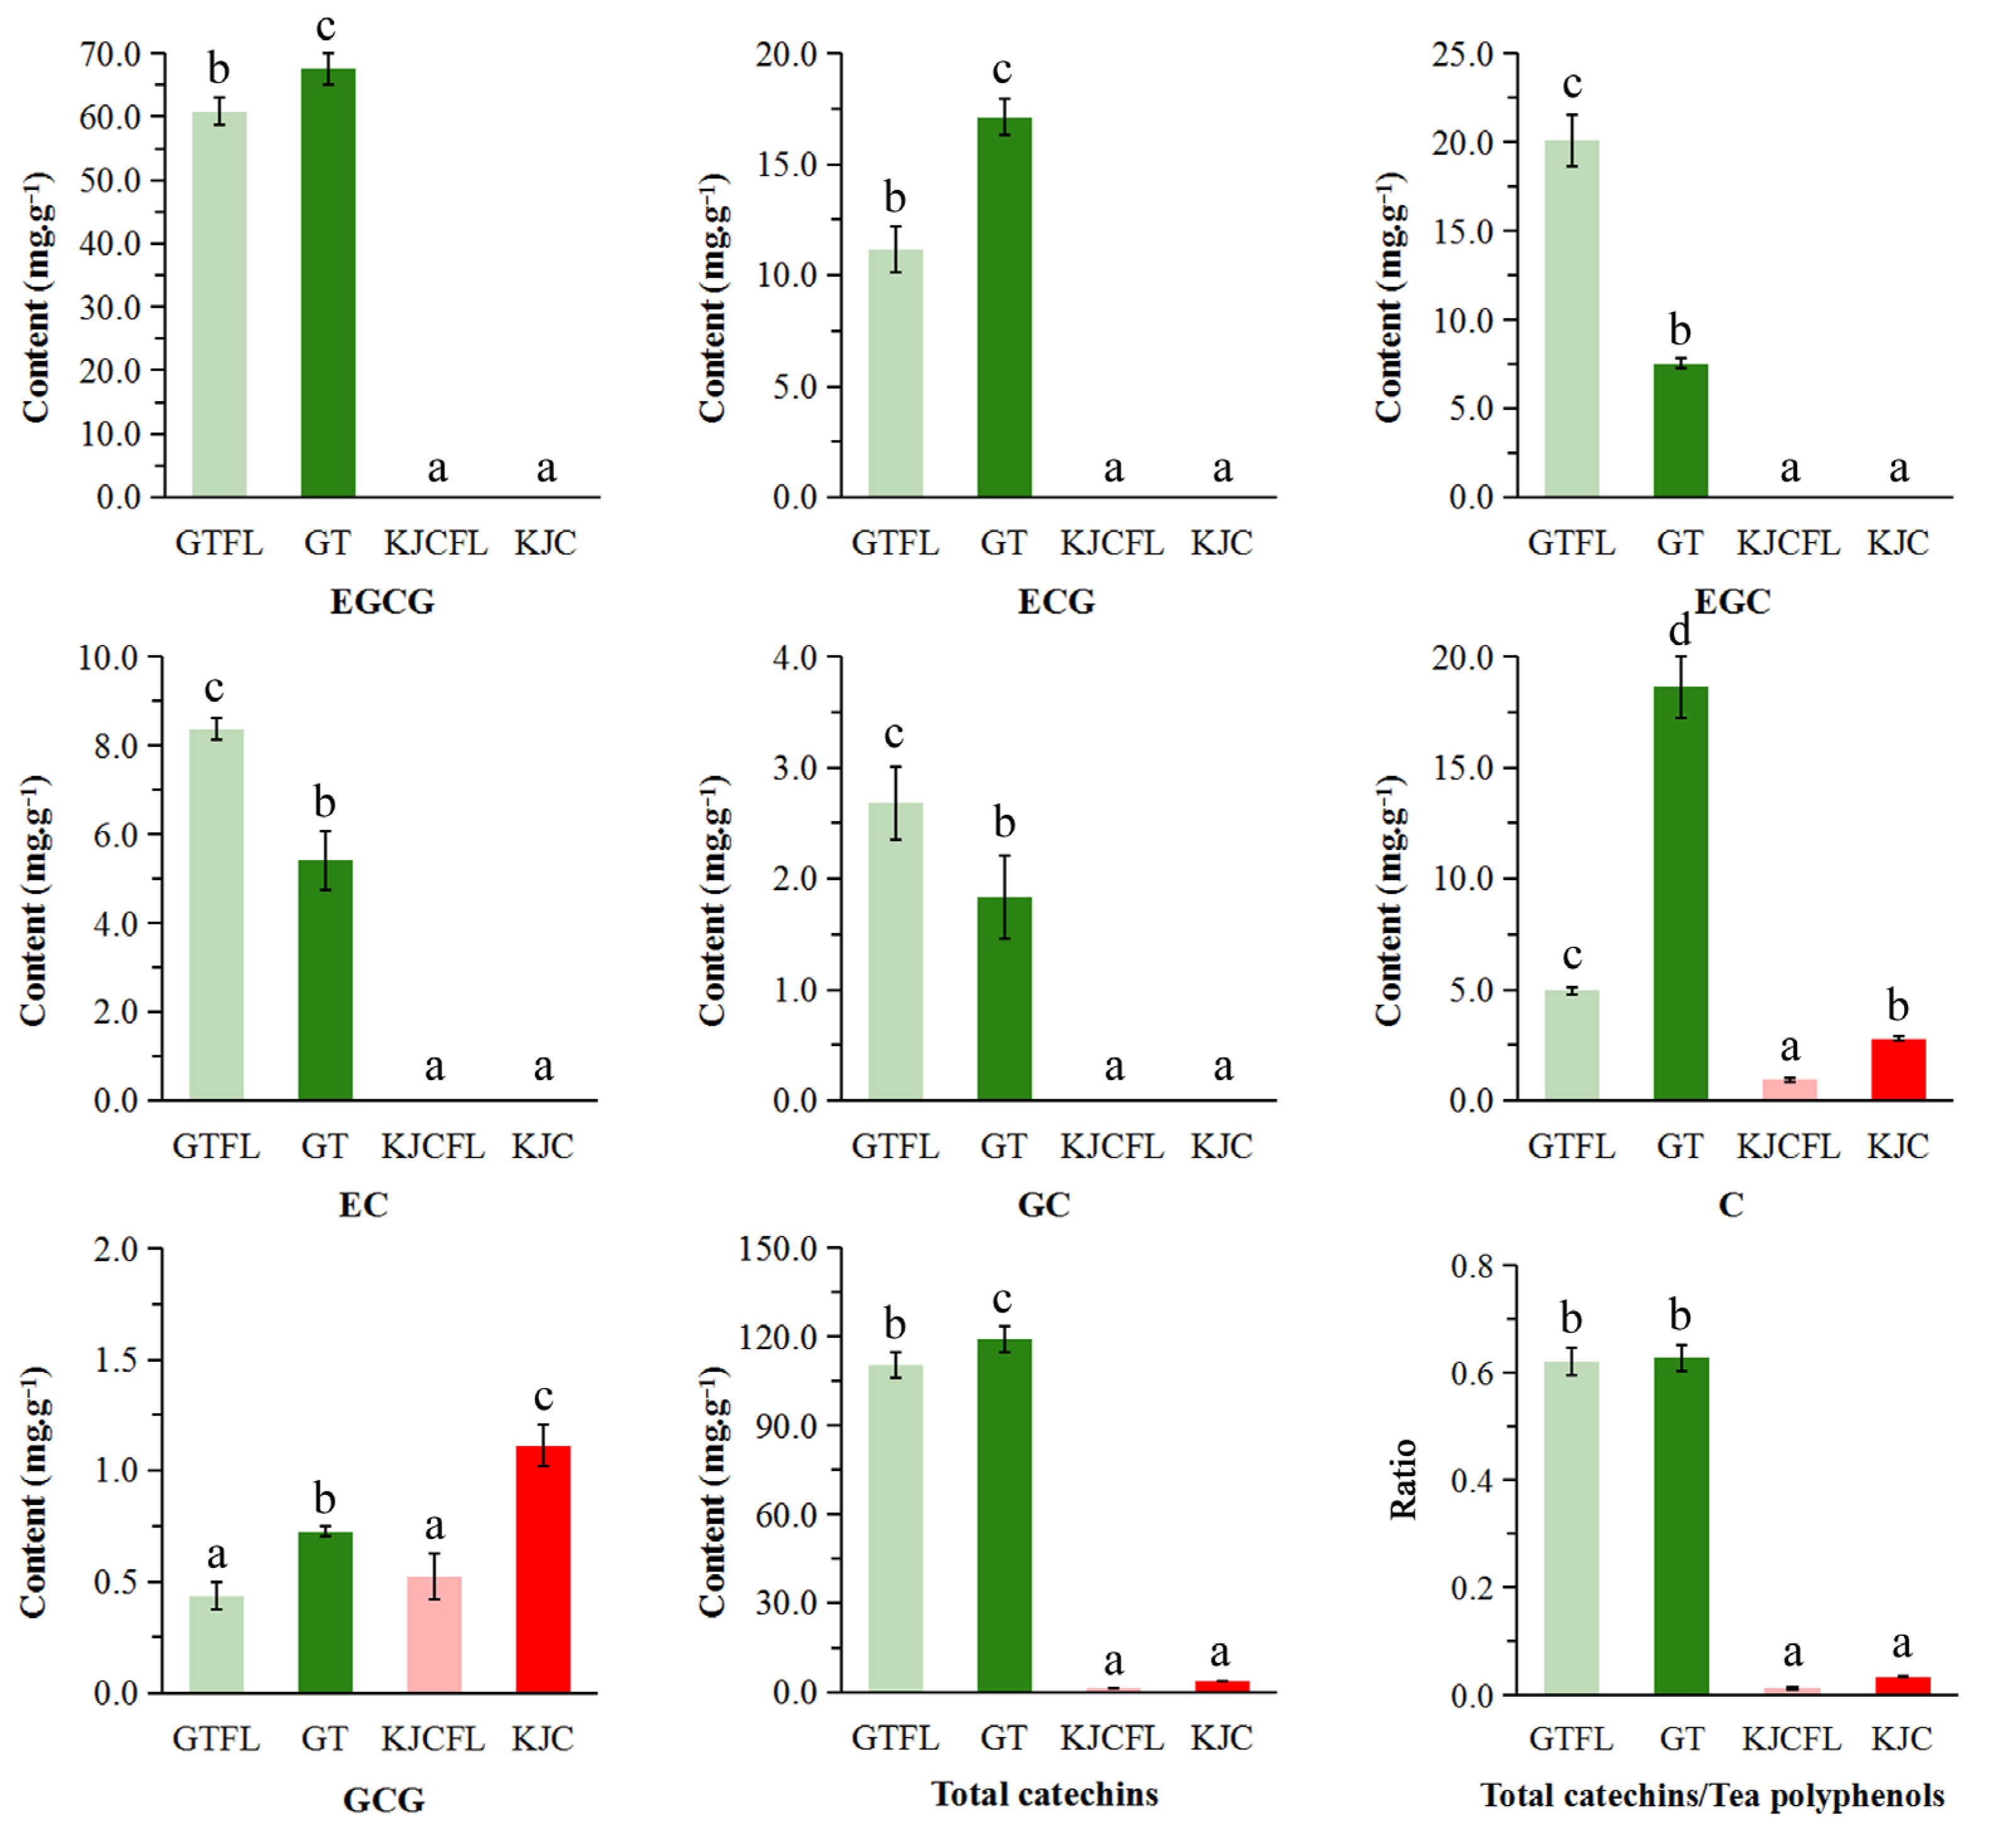
3.2.2. Catechin Analysis

Catechins are the main components of tea polyphenols in green tea, accounting for about 70% of total tea polyphenols [8], and are important substances in the formation of the bitter and astringent taste and health benefits of green tea [20,21]. To further clarify the differences between KJC and GT in terms of their taste and health benefits, seven catechins were determined by HPLC in the four tea samples. As shown in Figure 3, the total catechin contents in KJC and KJCFL were only 3.92 ± 0.16 mg·g−1 and 1.46 ± 0.21 mg·g−1, and the ratios to tea polyphenols were only 0.04 and 0.01, much lower than those in GT and GTFL. Only C and GCG were detected in KJC and KJCFL, and both showed varying levels of increase after processing. EGCG had the highest content of catechins in green tea and was significantly related to the tea’s taste and health benefits [8,20]. The EGCG contents in GT and GTFL were 60.86 ± 2.07 mg·g−1 and 67.50 ± 2.48 mg·g−1, while it was not detected in either KJC or KJCFL. Therefore, the low content of catechins is the main reason why the content of tea polyphenols in KJC is lower than that in GT, which further shows that catechins are not the main components in the formation of the taste and health benefits of KJC.

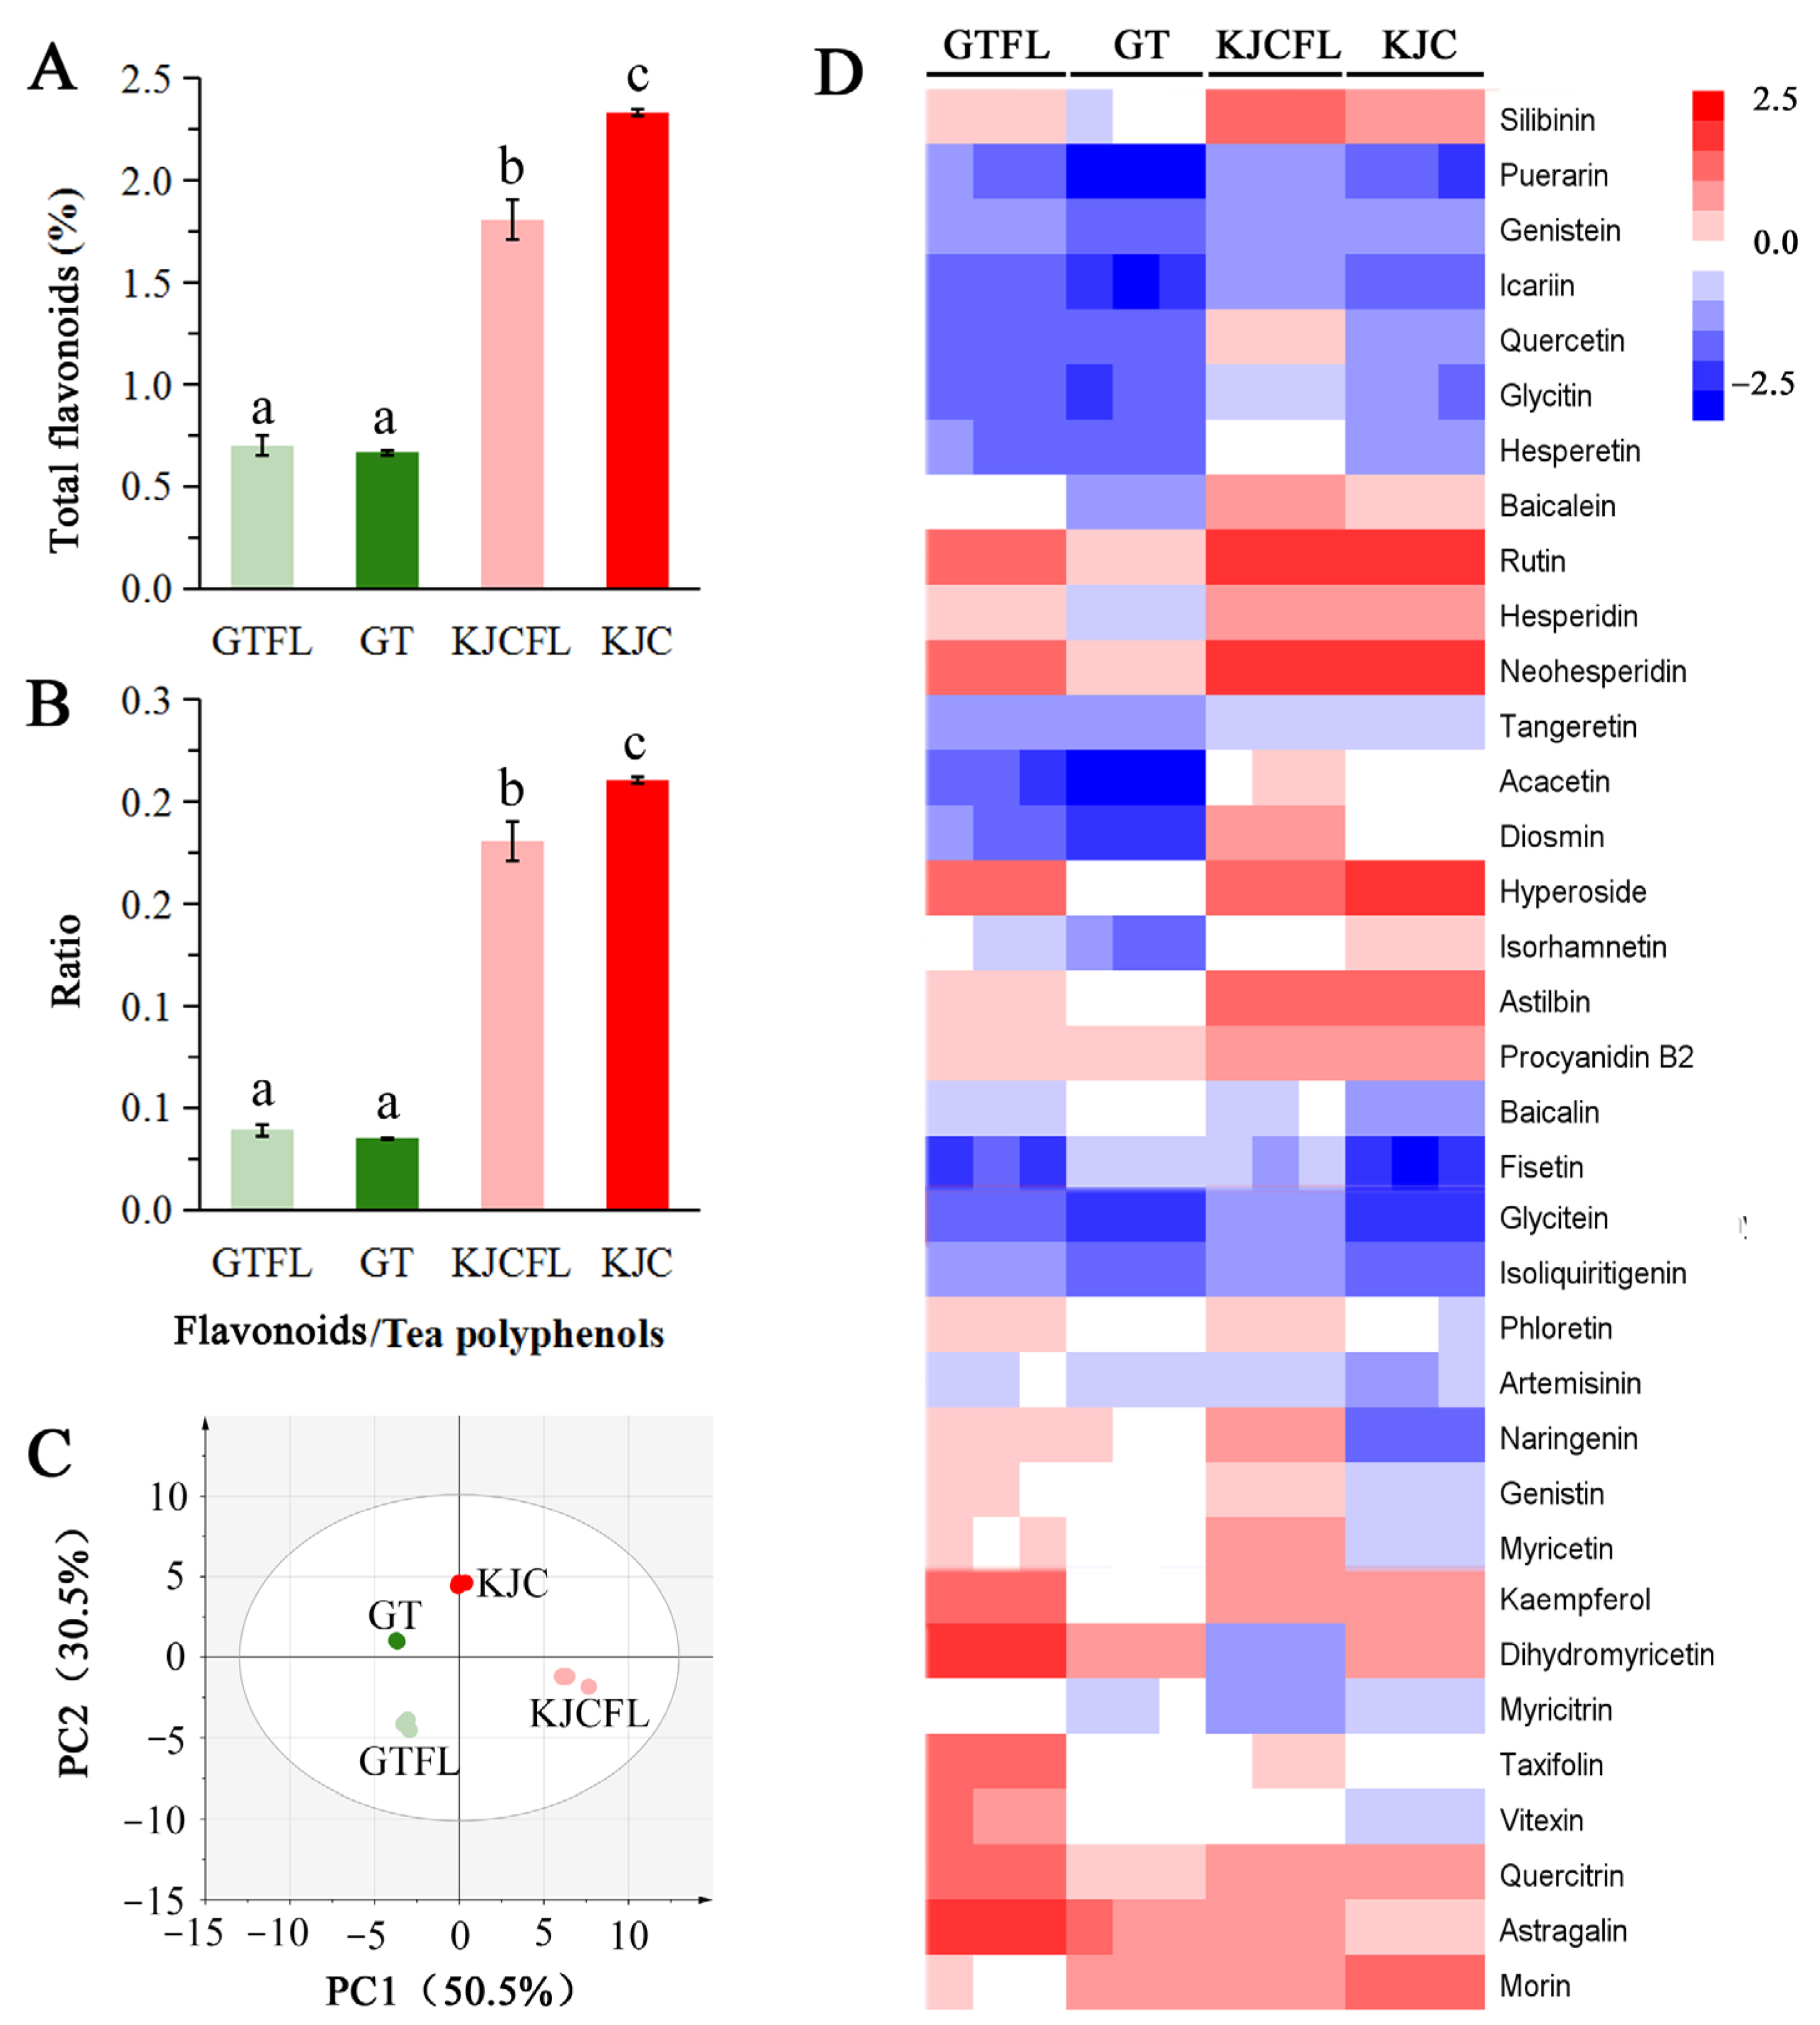
3.2.3. Flavonoid Analysis

Flavonoids are an important component of polyphenols in tea and are closely related to the taste quality and health benefits of tea [8,22]. As shown in Figure 4A, the total flavonoids in KJC and KJCFL were 2.33 ± 0.02% and 1.81 ± 0.10%, significantly higher than those in GT (0.67 ± 0.01%) and GTFL (0.70 ± 0.05%). Meanwhile, the ratios of total flavonoids to tea polyphenols in KJC and KJCFL were 0.21 and 0.18, while a ratio of only 0.04 was found in GT and GTFL (Figure 4B). To further clarify the main reasons for the formation of high flavonoid content in KJC and KJCFL, LC-MS was used to determine the contents of 35 flavonoids in the four samples. PCA revealed distinct clustering patterns among the four tea samples based on their flavonoid profiles (Figure 4C). The first two principal components accounted for 81.0% of the total variance (PC1 = 50.5%, PC2 = 30.5%), effectively capturing the majority of variation in the 35 flavonoid compounds analyzed. Notably, all biological replicates of each tea sample clustered tightly together, while clear separations were observed between different tea groups, indicating substantial differences in their flavonoid composition. It is known from Figure 4D that the contents of five flavonoids, including neohesperidin, hyperside, rutin, astilbin and morinin, were relatively high in KJC, and their contents were 0.18 ± 0.00 mg·g−1, 0.12 ± 0.01 mg·g−1, 0.10 ± 0.00 mg·g−1, 0.05 ± 0.00 mg·g−1 and 0.05 ± 0.00 mg·g−1, higher than those in GT and GTFL. The contents of three flavonoids, neohesperidin, rutin and hyperside, were relatively high in KJCFL, with contents of 0.23 ± 0.02 mg·g−1, 0.17 ± 0.01 mg·g−1 and 0.06 ± 0.00 mg·g−1, and all higher than those of GT and GTFL.

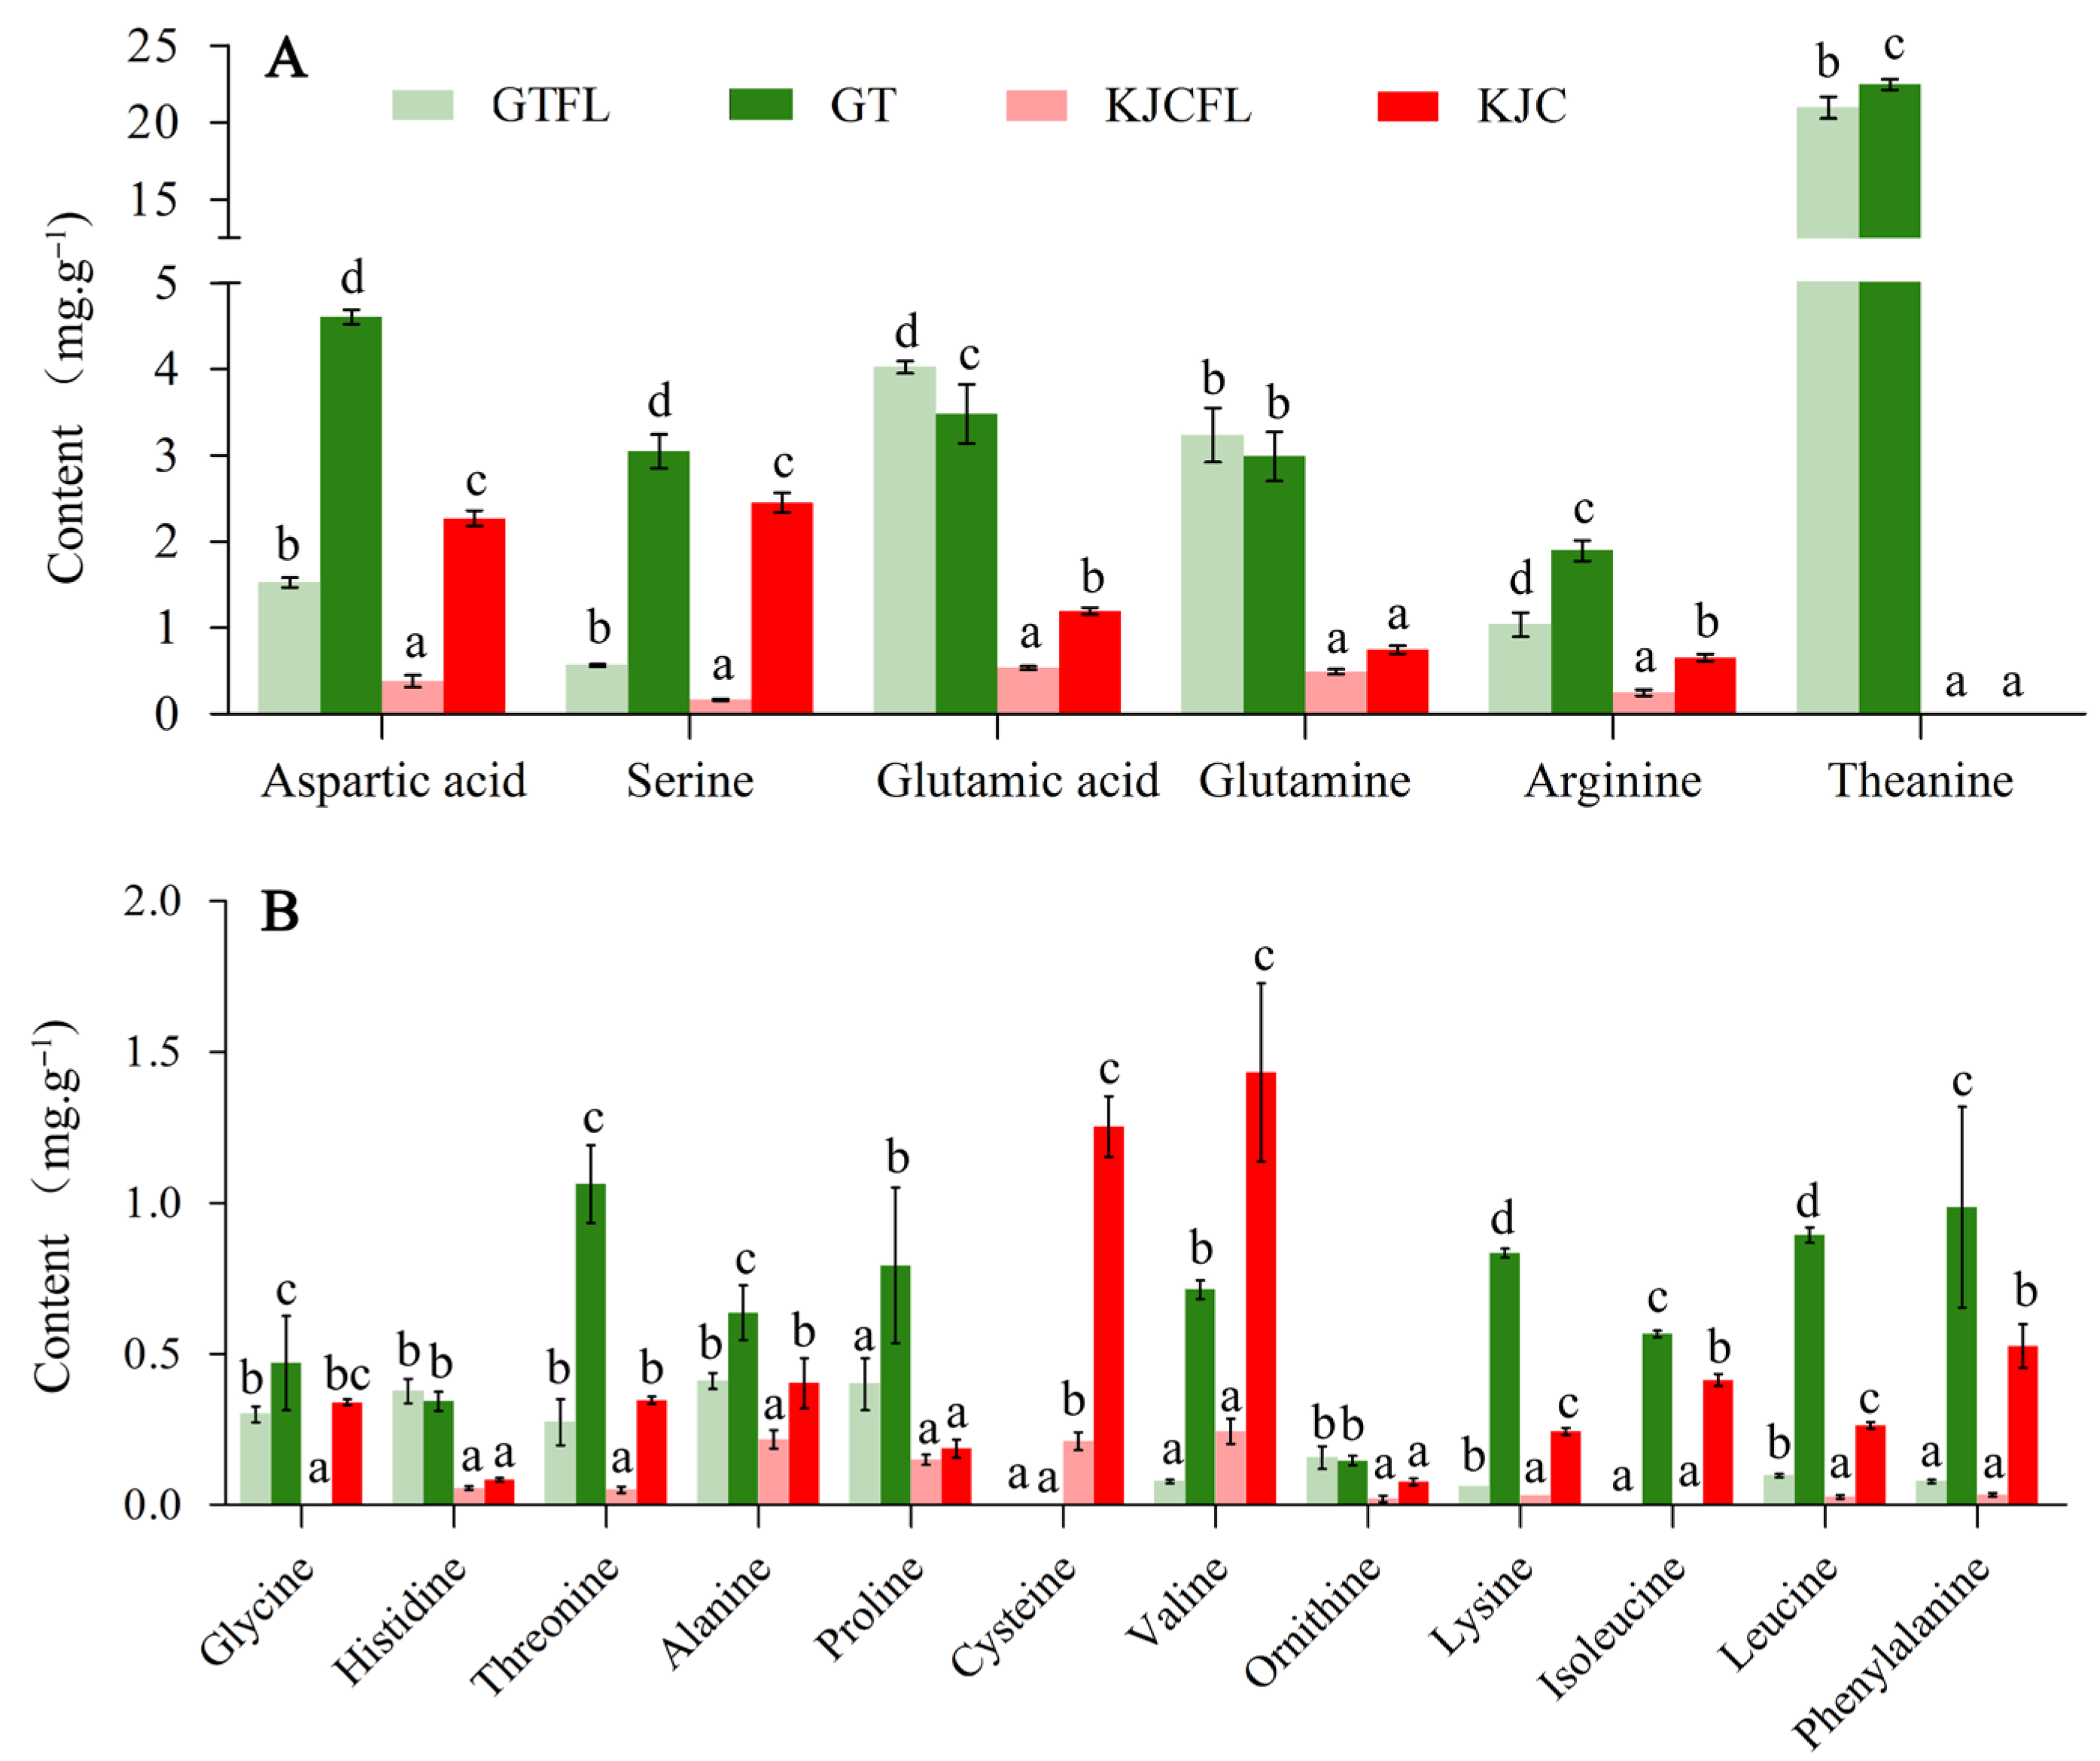
3.2.4. Amino Acid Analysis

Amino acids are an important component of the umami taste of green tea, and have a strong positive correlation with the quality of tea, their content can also effectively reduce the bitter taste [8,23]. To further clarify the reasons for the formation of low amino acid contents in KJC and KJCFL, the content of amino acids in the four tea samples was determined by HPLC. Theanine is a characteristic amino acid in tea plants and is significantly related to tea quality and health benefits [8,23]. It is observed from Figure 5A that the theanine contents in GT and GTFL were 22.47 ± 0.35 mg·g−1 and 20.96 ± 0.69 mg·g−1, while it was not detected in KJC and KJCFL, which is also the main factor responsible for the low amino acid content in KJC. In addition, the main amino acids in C. sinensis green tea, such as aspartic acid, serine, glutamic acid, glutamine and arginine, were significantly lower in KJC than in GT. The other amino acids with relatively low content in C. sinensis green tea were also mostly low in KJC, but the contents of cysteine and valine in KJC were 1.25 ± 0.10 mg·g−1 and 1.44 ± 0.03 mg·g−1, significantly higher than those in GT, and cysteine was not detected in either GT or GTFL (Figure 5B). Meanwhile, it is observed from Figure 5A,B that after KJCFL and GTFL were processed into KJC and GT, most amino acid contents were increased to varying degrees, which may have been caused by the hydrolysis of proteins and polypeptides in fresh leaves during processing.

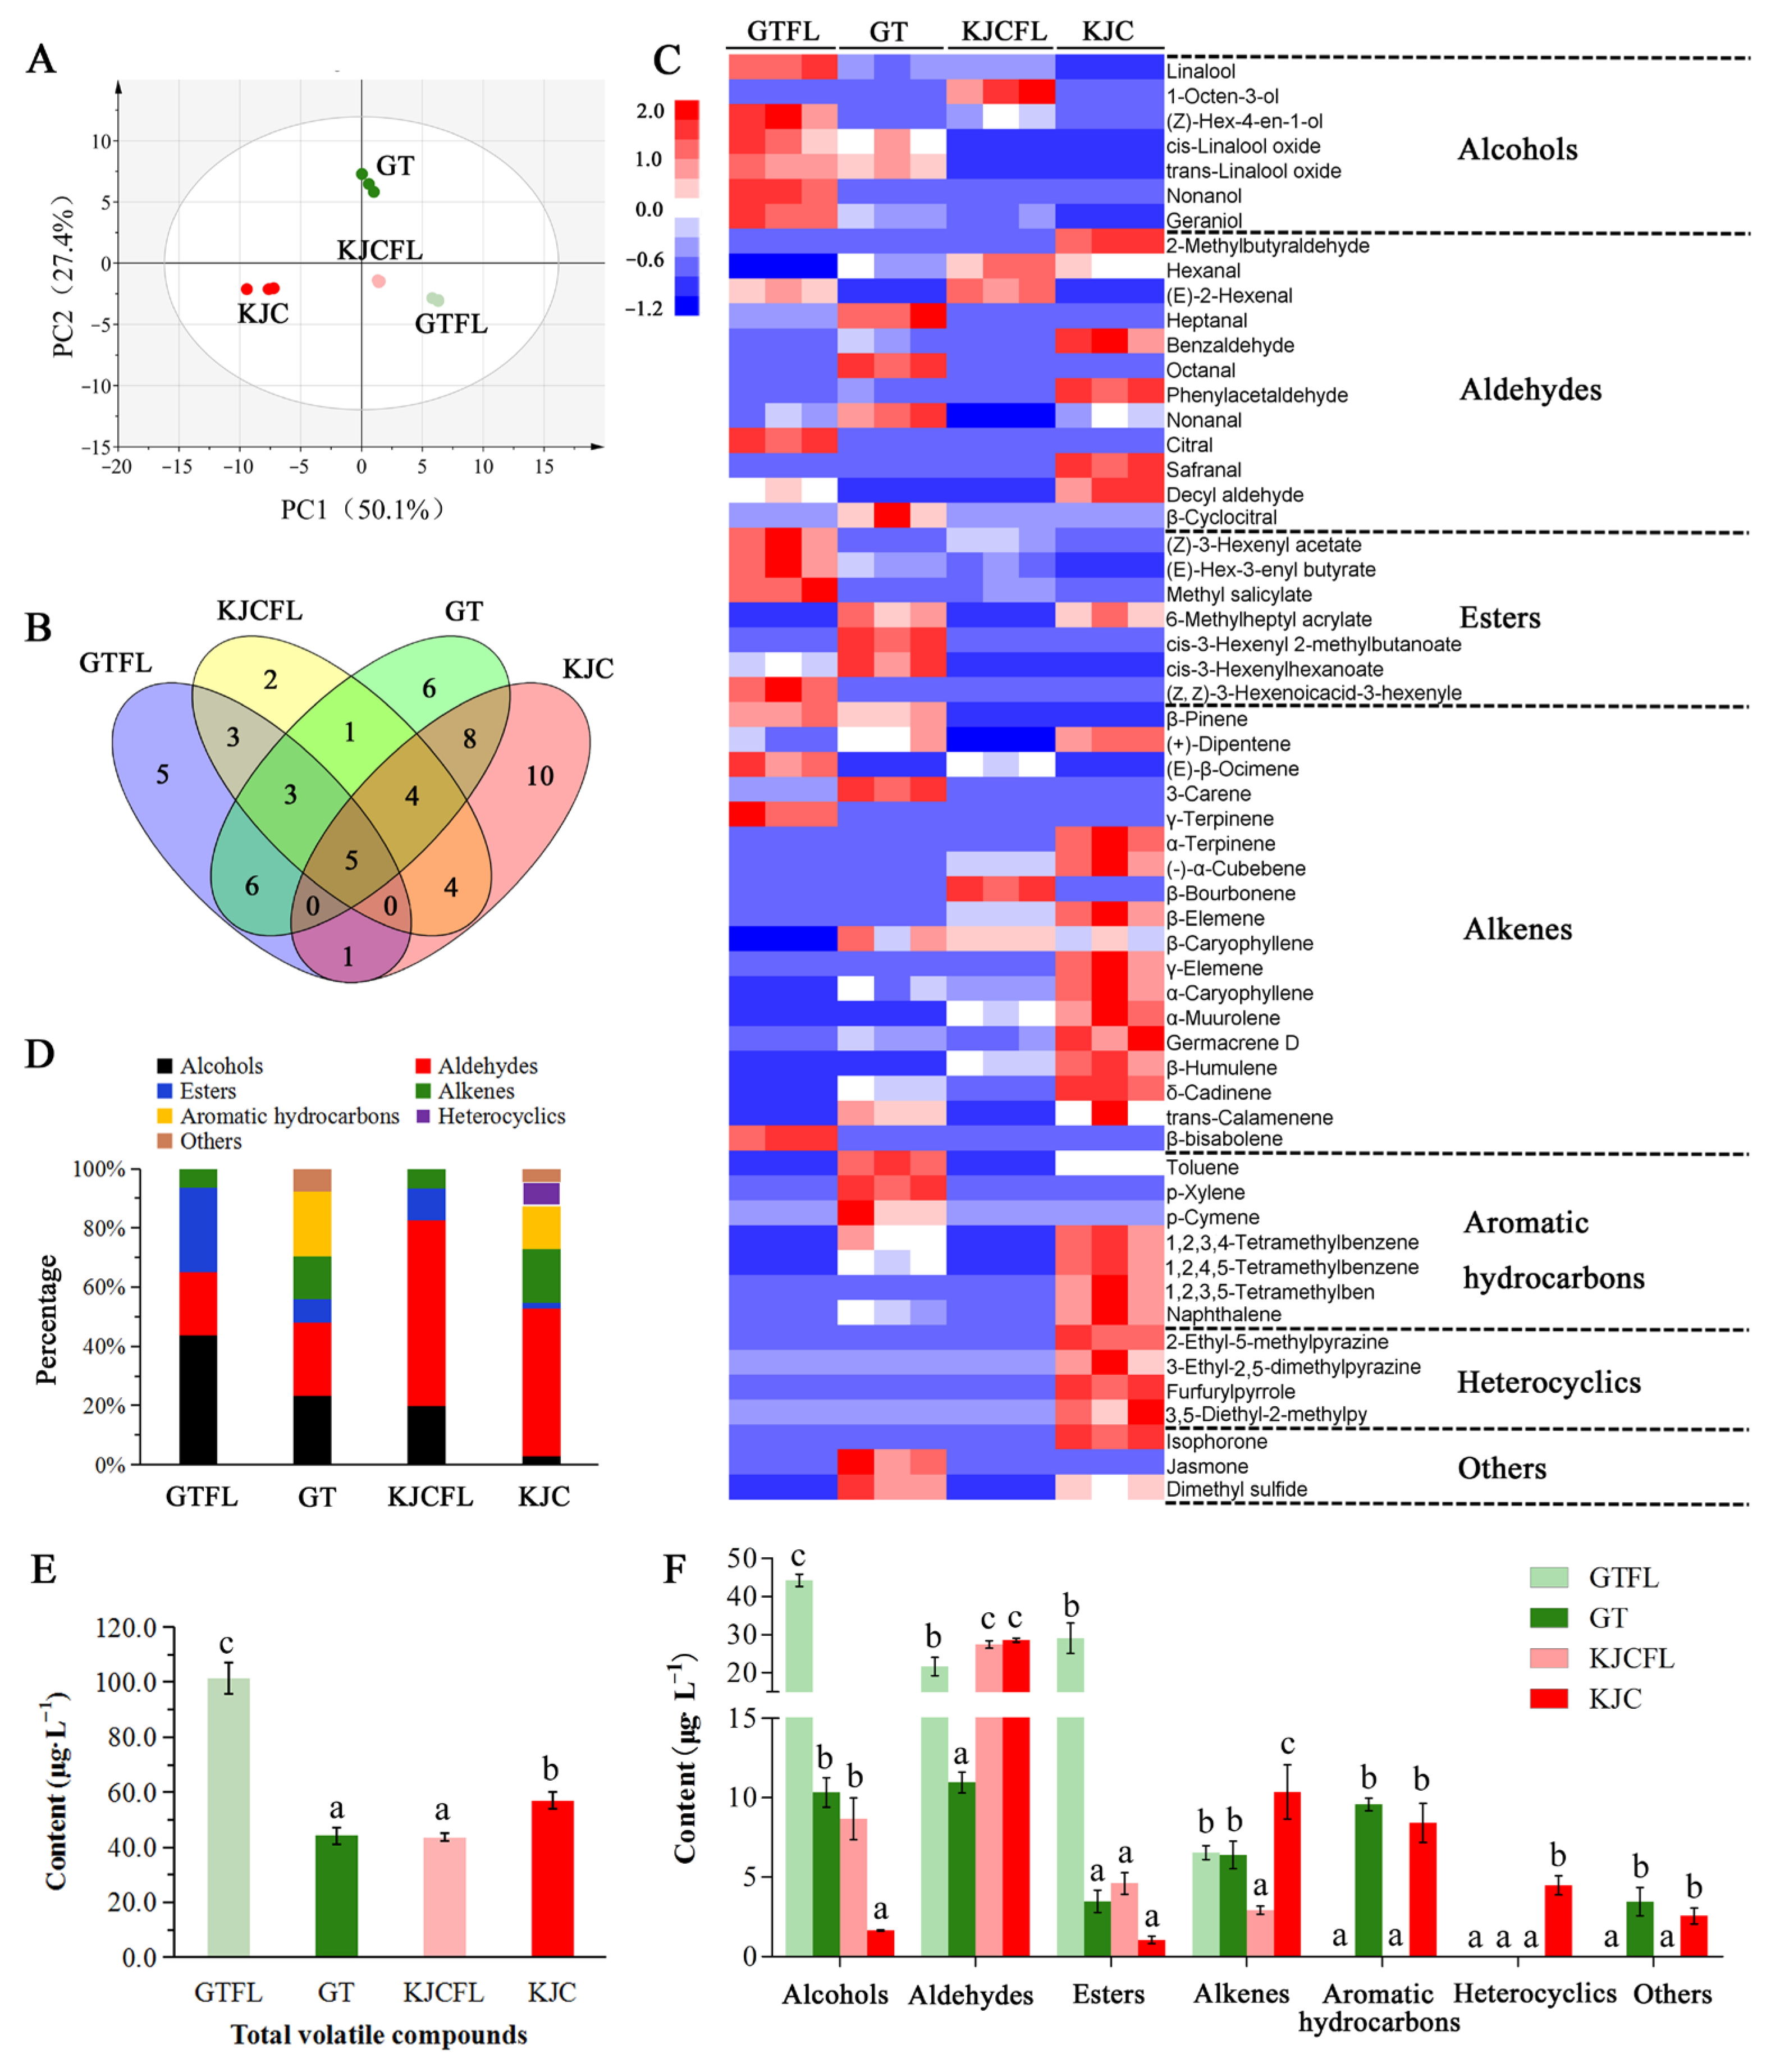
3.3. Analysis of Volatile Component Content in Tea Samples

A total of 58 volatile components were detected, including 7 alcohols, 12 aldehydes, 7 esters, 18 alkenes, 7 aromatic hydrocarbons, 4 heterocycles and 3 other components. PCA revealed distinct clustering patterns among the four tea samples based on their volatile component profiles (Figure 6A). The first two principal components accounted for 81.0% of the total variance (PC1 = 50.1%, PC2 = 27.4%), effectively capturing the majority of variation in the 58 volatile components analyzed. Notably, all biological replicates of each tea sample clustered tightly together, while clear separations were observed between different tea groups, indicating substantial differences in their volatile components. A Venn diagram analysis showed that 32, 33, 22 and 23 volatile components were detected in KJC, GT, KJCFL and GTFL, respectively. Five common components (linalool, nonanal, (+)-dipentene, δ-cadinene and trans-calamenene) were found in all samples. Notably, 17 common components were found in KJC and GT, and 11 common components were found in KJCFL and GTFL (Figure 6B). In addition, after KJCFL and GTFL were processed into KJC and GT, the number of volatile components increased significantly.
To further understand the changes in the volatile components of the four tea samples, a heat map analysis was performed based on the content of volatile components. As shown in Figure 6C, the volatile component contents of the four tea samples showed large differences, and obvious differences were detected in the types of volatile components. The proportions of aldehydes, alkenes, and heterocyclics components in KJC were significantly higher than those in GT, while the opposite pattern was found in alcohols and esters, which may explain the difference in aroma between KJC and GT (Figure 6D). Meanwhile, after KJCFL and GTFL were processed into KJC and GT, the proportions of alkenes, aromatic hydrocarbons and other volatile components increased significantly.
The total volatile component contents of the four tea samples were GTFL (101.43 ± 5.72 μg·L−1), KJC (57.03 ± 3.01 μg·L−1), GT (44.21 ± 3.03 μg·L−1) and KJCFL (43.60 ± 1.30 μg·L−1). The total volatile component content in KJC prepared from KJCFL increased significantly, while it showed an opposite pattern in GT prepared from GTFL (Figure 6E). As shown in Figure 6F, KJC had the highest contents of aldehydes, alkenes, and heterocyclics components, which were 28.51 ± 0.54 μg·L−1, 10.37 ± 1.70 μg·L−1 and 4.48 ± 0.60 μg·L−1. Among the aldehydes, phenylacetaldehyde, 2-Methylbutyraldehyde and benzaldehyde contents were relatively high in KJC, and phenylacetaldehyde content (17.06 ± 1.43 μg·L−1) was the highest. Among the alkenes, δ-Cadinene and (+)-Dipentene contents were relatively high in KJC. Heterocyclics were only detected in KJC, among which the contents of 2-Ethyl-5-methylpyrazine and 3-Ethyl-2,5-dimethylpyrazine were relatively high. Among the tea samples, KJC had the lowest content of alcohols and esters, of which only linalool was detected for alcohols, and only 6-Methylheptyl acrylate was detected for esters. Moreover, aromatic hydrocarbons and other volatile components were relatively high in KJC and GT, while they were not detected in KJCFL and GTFL. Among them, the aromatic hydrocarbon contents in KJC and GT were 8.42 ± 1.23 μg·L−1 and 9.58 ± 0.40 μg·L−1, both of which were dominated by toluene; the other volatile component contents in KJC and GT were 2.55 ± 0.49 μg·L−1 and 3.46 ± 0.88 μg·L−1, both of which were dominated by dimethyl sulfide.

4. Discussion

4.1. Flavonoids Are Significantly Associated with the Overall Flavor and Health Benefits of KJC

Polyphenols are the main components responsible for the bitter and astringent taste of tea, and are also important functional components of tea [8,24]. Both KJC and KJCFL contain relatively high levels of tea polyphenols, which are closely related to the flavor quality and health benefits of KJC. Tea polyphenols primarily consist of catechins, flavonoids, anthocyanins, leucoanthocyanidins, phenolic acids, and depsides [8,20]. Among these, catechins are the most abundant, accounting for approximately 70% of total polyphenol content [8]. Sensorily, catechins contribute predominantly to the bitter and astringent taste profile of green tea, with their concentration and composition directly determining the flavor quality [21]. More importantly, catechins serve as the key bioactive components responsible for green tea’s various health benefits, including its antioxidant, antimicrobial, antiviral, radioprotective, antiaging, and anticancer effects [8,24]. However, the composition of tea polyphenols exhibited obvious differences in KJC and GT, whereby the total catechin content in KJC and KJCFL was extremely low, while the total flavonoid content was significantly higher than that in GT and GTFL, accounting for about 20% of the total tea polyphenols. KJC contained relatively higher levels of flavonoids, including neohesperidin, hyperoside, rutin, astilbin and morin, compared to GT, all of which have been extensively demonstrated to possess various physiological and pharmacological functions. For instance, neohesperidin exhibits potential blood glucose-regulating effects [25], hyperoside shows significant neuroprotective and antioxidant activity [26], rutin exhibits significant antioxidant, anti-inflammatory and cardioprotective effects [27], astilbin possesses antioxidant, hypoglycemic and anticancer properties [28], and morin demonstrates anti-inflammatory and antioxidant effects [29]. Moreover, most flavonoids show obvious bitter and astringent characteristics. For example, neohesperidin is an important bitter substance in citrus fruit [30], and a high content of flavonoid glycosides like rutin is an important reason for the bitter taste of green tea in summer and autumn [31]. Therefore, it is speculated that high flavonoid content is an important basis for the overall taste and health benefits of KJC.

4.2. Umami and Sweet Components Are Important Supplements to Regulate the Overall Taste of KJC

The umami and sweet tastes account for a small proportion of the taste of green tea, but they can supplement and regulate the overall taste [32]. Amino acids and water-soluble protein are the main components of the umami taste of green tea and can effectively relieve the bitter and astringent taste of tea [23]. The albino tea cultivar, due to its higher amino acid content, produces green tea with a notably superior fresh and mellow taste compared to conventional tea varieties, along with significantly less bitterness and astringency [33]. The amino acid and water-soluble protein contents in KJC were relatively low, 57.0% and 68.5% lower than those in GT. C. sinensis green tea is rich in various amino acids, but not all amino acids have an umami taste, and some amino acids even have a bitter or astringent taste [23]. Theanine, glutamic acid and aspartic acid, which are the main umami amino acids in C. sinensis green tea, were all found at low levels in KJC. Notably, theanine, the characteristic amino acid of green tea, was not even detected. Therefore, the low contents of amino acids and water-soluble protein are an important reason for the formation of the intense bitterness of KJC. Water-soluble sugars such as fructose, glucose and sucrose are important sweet-tasting components in tea [34]. They serve as the primary substances responsible for the lingering sweet aftertaste of tea infusions and participate in aroma formation through Maillard reactions [35]. KJC contains significantly higher levels of water-soluble sugars, showing a 77.7% increase compared to GT. Therefore, the high content of water-soluble sugars forms the material basis for KJC’s distinctive sweet aftertaste. Furthermore, complex polysaccharides composed of sugars combined with proteins, mineral elements and other units exhibit multiple health benefits, including weight management, lipid reduction, blood pressure regulation, and free radical scavenging, and these components demonstrate remarkable efficacy in preventing and treating metabolic diseases such as obesity and diabetes [35,36]. The elevated water-soluble sugar content in KJC may be associated with these health-promoting effects.

4.3. Heterocyclics Contribute to the Formation of the Bean-Like Aroma of KJC

The aroma of tea, resulting from the comprehensive effect of tea volatile components in different concentration combinations on the human olfactory nerve, is an important indicator for evaluating the quality of tea [8,37]. Heterocyclics are nitrogen-containing compounds, such as pyrazines and pyrroles, generated by the Maillard reaction between reducing sugars in fresh leaves and amino acids and proteins at relatively high temperatures during the tea processing process, and they are the key components in the formation of the roasted aroma and bean-like aroma of tea [38,39]. Pyrazines are important aroma components in oolong tea and mainly contribute to the roasted aroma, nutty aroma and popcorn aroma [40]. A total of 4 heterocyclics were detected in KJC, namely 2-Ethyl-5-methylpyrazine, 3-Ethyl-2,5-dimethylpyrazine, furfurylpyrrole and 3,5-Diethyl-2-methylpy. Among them, 2-Ethyl-5-methylpyrazine and 3,5-Diethyl-2-methylpyrazine are the key substances in the formation of the roasted aroma of Huangdacha [41], 3,5-Diethyl-2-methylpy is the key substance in the formation of the roasted aroma of crispy rice [42], and furfurylpyrrole is the key substance in the formation of the roasted aroma of rougui Wuyi rock tea [43]. Therefore, heterocyclics are important components for the formation of the bean-like aroma of KJC. Meanwhile, KJC exhibited significantly higher proportions of aldehydes and alkenes compared to GT, which synergistically complemented and enriched the dominant aroma profile of the tea, resulting in more complex olfactory characteristics. Among the aldehydes, phenylacetaldehyde was the most abundant compound in KJC, accounting for approximately 60% of the total aldehyde content. Notably, phenylacetaldehyde serves as the key aromatic component responsible for the chestnut-like fragrance characteristic of green tea [43]. Additionally, olefinic compounds such as (+)-dipentene and δ-cadinene, known for their low odor thresholds, made positive contributions to the overall tea aroma quality [44].

5. Conclusions

In this study, we found that the high tea polyphenol content in KJC was closely associated with its flavor quality and health benefits. The tea polyphenols in KJC were mainly composed of flavonoids, with relatively high levels of neohesperidin, hyperoside, rutin, astilbin and morin potentially serving as important bioactive compounds contributing to its health effects. The intense bitterness followed by a sweet aftertaste and the clean, mellow taste of KJC are primarily attributed to its unique composition featuring high levels of flavonoids and water-soluble sugars combined with low contents of amino acids and water-soluble proteins. This study identified high concentrations of aldehydes, olefins and heterocyclic compounds as key aroma components in KJC. Among these, the heterocyclic compounds 2-ethyl-5-methylpyrazine, 3-ethyl-2,5-dimethylpyrazine, furfurylpyrrole and 3,5-diethyl-2-methylpyrazine were particularly important for the formation of KJC’s bean-like aroma flavor. These results will provide a theoretical basis for studies on the flavor quality and health benefits of KJC and scientific support for its further development and utilization.

Supplementary Materials

The following supporting information can be downloaded at: https://www.mdpi.com/article/10.3390/horticulturae11070804/s1, Table S1: chemicals and reagents source information.

Author Contributions

Conceptualization, L.W.; Data Curation, L.M. and D.C.; Formal Analysis, L.M. and L.W.; Funding acquisition, X.J.; Investigation, P.F., L.W. and B.H.; Methodology, L.M. and Y.P.; Project Administration, X.J. and Y.P.; Resources, P.F. and Y.L. (Yijin Liu); Software, D.C. and Y.L. (Yanli Liu); Supervision, G.F. and A.L.; Validation, A.L. and B.H.; Visualization, P.F. and G.F.; Writing—Original Draft, L.M. and Y.P.; Writing—Review and Editing, D.C. and X.J. All authors have read and agreed to the published version of the manuscript.

Funding

The authors acknowledge the financial support of the Agricultural Science and Technology Innovation Project of Hubei Province (2025-620-000-001-020), and Hubei Seed Industry High-Quality Development Project of China.

Institutional Review Board Statement

In compliance with the “Ethics Review Measures for Life Sciences and Medical Research Involving Humans” issued by the National Health Commission of China in 2023 (Document No. 4), specifically Article 32, our study qualifies for exemption from ethical review as it does not present any potential risk to the participants.

Informed Consent Statement

Informed consent was obtained from all subjects involved in the study.

Data Availability Statement

The original contributions presented in the study are included in the article. Further inquiries can be directed to the corresponding authors.

Conflicts of Interest

Author Yanan Peng was employed by the company Tuanfeng Daqishan Kujingcha Co., Ltd. The remaining authors declare that the research was conducted in the absence of any commercial or financial relationships that could be construed as a potential conflict of interest.

References

  1. Wüpper, S.; Lüersen, K.; Rimbach, G. Chemical composition, bioactivity and safety aspects of Kuding tea-from beverage to herbal extract. Nutrients 2020, 12, 2796. [Google Scholar] [CrossRef] [PubMed]
  2. Li, L.; Xu, L.; Ma, G.; Dong, Y.; Peng, Y.; Xiao, P. The large-leaved kudingcha (Ilex latifolia Thunb and Ilex kudingcha C.J. Tseng): A traditional Chinese tea with plentiful secondary metabolites and potential biological activities. J. Nat. Med. 2013, 67, 425–437. [Google Scholar] [CrossRef] [PubMed]
  3. Li, L.; Peng, Y.; Ma, G.; He, C.; Feng, Y.; Lei, Q.; Xiao, P. Quantitative analysis of five kudinosides in the large-leaved Kudingcha and related species from the genus Ilex by UPLC-ELSD. Phytochem. Anal. 2012, 23, 677–683. [Google Scholar] [CrossRef]
  4. Gan, R.; Zhang, D.; Wang, M.; Corke, H. Health benefits of bioactive compounds from the genus Ilex, a source of traditional caffeinated beverages. Nutrients 2018, 10, 1682. [Google Scholar] [CrossRef]
  5. Lei, G.; Wu, Z.; Xu, Y.; Bao, Y. Effects of different processing methods on the contents of polyphenols in Kujingcha tea. Lishizhen Med. Mater. Med. Res. 2003, 14, 345–346. [Google Scholar]
  6. Zhang, F.; Lu, X.; Chu, D.; Yin, R.; Wang, C.; Zhou, Y.; Li, Y.; Li, N.; Cai, X.; Chen, H. A New Ilex dabieshanensis Cultivar “Ilex dabieshanensis No.1”. Acta Hortic. Sin. 2018, 45, 2827–2828. [Google Scholar]
  7. Jiang, A.; Wang, X.; Xiang, J.; Huang, W. Research on instant Kujing tea. Sci. Technol. Food Ind. 2012, 33, 280–282. [Google Scholar]
  8. Wan, X. Tea Biochemistry, 3rd ed.; China Agriculture Press: Beijing, China, 2003. (In Chinese) [Google Scholar]
  9. Zhang, L.; Cao, Q.; Granato, D.; Xu, Y.; Ho, C. Association between chemistry and taste of tea: A review. Trends Food Sci. Technol. 2020, 101, 139–149. [Google Scholar] [CrossRef]
  10. Ma, L.; Cao, D.; Liu, Y.; Gong, Z.; Liu, P.; Jin, X. A comparative analysis of the volatile components of green tea produced from various tea cultivars in China. Turk. J. Agric. For. 2019, 43, 451–463. [Google Scholar] [CrossRef]
  11. Zhai, X.; Zhang, L.; Granvogl, M.; Ho, C.; Wan, X. Flavor of tea (Camellia sinensis): A review on odorants and analytical techniques. Compr. Rev. Food Sci. Food Saf. 2022, 21, 3867–3909. [Google Scholar] [CrossRef]
  12. Zhao, Y.; Li, F.; Zhou, H.; Wang, Y.; Bian, J.; Sun, Y.; Du, X. Utilizing nontargeted metabolomics integrated with quality component quantitation via differential analysis to reveal the taste differences between and metabolite characteristics of hawk black tea and hawk white tea. Food Res. Int. 2024, 197, 115216. [Google Scholar] [CrossRef] [PubMed]
  13. Ma, L.; Yang, Y.; Cao, D.; Liu, Y.; Gong, Z.; Ercisli, S.; Luo, Z.; Jin, X. Analysis of the biochemical and volatile components of Qianlincha and Qiandingcha prepared from Eurya alata Kobuski and Camellia cuspidate. Agronomy 2021, 11, 657. [Google Scholar] [CrossRef]
  14. GB/T 23776-2018; Methodology for Sensory Evaluation of Tea. Standardization Administration of China: Beijing, China, 2018.
  15. GB/T 8314-2013; Tea—Determination of Free Amino Acids Content. Standardization Administration of China: Beijing, China, 2013.
  16. GB/T 8313-2018; Determination of Total Polyphenols and Catechins Content in Tea. Standardization Administration of China: Beijing, China, 2018.
  17. GB/T 8305-2013; Tea—Determination of Water Extracts Content. Standardization Administration of China: Beijing, China, 2013.
  18. Li, Y. Comprehensive Experiment of Tea Science; China Light Industry Press: Beijing, China, 2018. (In Chinese) [Google Scholar]
  19. Xue, J.; Liu, P.; Xu, Y.; Gui, A.; Wang, X.; Ye, F.; Feng, L.; Wang, S.; Teng, J.; Gao, S.; et al. Effect of cultivar and process on the astringency of matcha based on flavonoids-targeted metabolomic analysis. Food Res. Int. 2025, 204, 115954. [Google Scholar] [CrossRef] [PubMed]
  20. Lin, F.; Wei, X.; Liu, H.; Li, H.; Xia, Y.; Wu, D.; Zhang, P.; Gandhi, G.; Li, H.; Gan, R. State-of-the-art review of dark tea: From chemistry to health benefits. Trends Food Sci. Technol. 2021, 109, 126–138. [Google Scholar] [CrossRef]
  21. Narukawa, M.; Kimata, H.; Noga, C.; Watanabe, T. Taste characterisation of green tea catechins. Int. J. Food Sci. Technol. 2010, 45, 1579–1585. [Google Scholar] [CrossRef]
  22. Atmani, D.; Chaher, N.; Atmani, D.; Berboucha, M.; Debbache, N.; Boudaoud, H. Flavonoids in human health: From structure to biological activity. Curr. Nutr. Food Sci. 2009, 5, 225–237. [Google Scholar] [CrossRef]
  23. Yu, Z.; Yang, Z. Understanding different regulatory mechanisms of proteinaceous and non-proteinaceous amino acid formation in tea (Camellia sinensis) provides new insights into the safe and effective alteration of tea flavor and function. Crit. Rev. Food Sci. Nutr. 2020, 60, 844–858. [Google Scholar] [CrossRef]
  24. Khan, N.; Mukhtar, H. Tea polyphenols in promotion of human health. Nutrients 2018, 11, 39. [Google Scholar] [CrossRef]
  25. Zhang, J.; Sun, C.; Yan, Y.; Chen, Q.; Luo, F.; Zhu, X.; Li, X.; Chen, K. Purification of naringin and neohesperidin from Huyou (Citrus changshanensis) fruit and their effects on glucose consumption in human HepG2 cells. Food Chem. 2012, 135, 1471–1478. [Google Scholar] [CrossRef]
  26. Cao, J.; Tang, C.; Gao, M.; Rui, Y.; Zhang, J.; Wang, L.; Wang, Y.; Xu, B.; Yan, B. Hyperoside alleviates epilepsy-induced neuronal damage by enhancing antioxidant levels and reducing autophagy. J. Ethnopharmacol. 2020, 257, 112884. [Google Scholar] [CrossRef]
  27. Semwal, R.; Joshi, S.; Semwal, R.; Semwal, D. Health benefits and limitations of rutin-A natural flavonoid with high nutraceutical value. Phytochem. Lett. 2021, 46, 119–128. [Google Scholar]
  28. Xia, H.; Lv, C.; Lu, Y.; Zeng, C.; Qin, S.; Shi, M. Natural deep eutectic ready to use extract of astilbin: Super high in vitro bioaccessibility, α-amylase and α-glucosidase enzyme inhibition kinetics. Food Res. Int. 2023, 173, 113368. [Google Scholar] [CrossRef] [PubMed]
  29. Liu, X.; Han, L.; Wang, M.; Zhang, Y. Inhibitory Mechanism of Morin on Pancreatic Lipase. Food Sci. 2025, 46, 40–48. [Google Scholar]
  30. Rouseff, R.; Martin, S.; Youtsey, C. Quantitative survey of narirutin, naringin, hesperidin, and neohesperidin in citrus. J. Agric. Food Chem. 1987, 35, 1027–1030. [Google Scholar] [CrossRef]
  31. Qi, D.; Dai, W.; Tan, L.; Peng, Q.; Zhang, Y.; Lin, Z. Study on the effects of the fixation methods on the chemical components and taste quality of summer green tea. J. Tea Sci. 2016, 36, 18–26. [Google Scholar]
  32. Shi, Z. Chaye Shenping Yu Jianyan; China Agricultural Press: Beijing, China, 2010. (In Chinese) [Google Scholar]
  33. Li, Y.; Han, Z.; Wang, M.; Yan, Y.; Ma, R.; Wang, H.; Deng, W. Metabolomics and sensory evaluation reveal the influence of four albino tea cultivars on the quality of processed green tea. Food Res. Int. 2025, 209, 116180. [Google Scholar] [CrossRef]
  34. Li, W.; Zhang, Z.; Chen, R.; Sun, L.; Lai, X.; Li, Q.; Hao, M.; Zhang, S.; Li, Q.; Sun, S.; et al. Metabolomics-based analysis of the effects of differences in soluble sugars on the sweetness quality of six major tea types in China. Food Funct. 2025, 16, 3707–3720. [Google Scholar]
  35. Lu, T.; Dong, X.; Lan, W.; Zhou, B.; Teng, J.; Xia, N.; Khan, M.; Huang, L. From microbial perspective: Manufacturing process, chemical composition and health benefis of Liupao tea-A comprehensive review. Food Res. Int. 2025, 206, 116088. [Google Scholar] [CrossRef]
  36. Xiao, J.; Jiang, H. A review on the structure-function relationship aspect of polysaccharides from tea materials. Crit. Rev. Food Sci. Nutr. 2015, 55, 930–938. [Google Scholar] [CrossRef]
  37. Yang, Z.; Baldermann, S.; Watanabe, N. Recent studies of the volatile compounds in tea. Food Res. Int. 2013, 53, 585–599. [Google Scholar] [CrossRef]
  38. Van Boekel, M. Formation of flavour compounds in the Maillard reaction. Biotechnol. Adv. 2006, 24, 230–233. [Google Scholar] [CrossRef] [PubMed]
  39. Guo, X.; Song, C.; Ho, C.; Wan, X. Contribution of L-theanine to the formation of 2,5-dimethylpyrazine, a key roasted peanutty flavor in Oolong tea during manufacturing processes. Food Chem. 2018, 263, 18–28. [Google Scholar] [PubMed]
  40. Ho, C.; Zheng, X.; Li, S. Tea aroma formation. Food Sci. Hum. Wellness 2015, 4, 9–27. [Google Scholar] [CrossRef]
  41. Pei, Z.; He, G.; Liu, Y.; Hu, Y.; Li, M.; Wan, X.; Zhai, X. Characterization of the key aroma-active compounds responsible for the rice cruse-like aroma of large-leafed yellow tea (Camellia sinensis). Food Sci. 2023, 44, 289–297. [Google Scholar]
  42. Yang, P.; Yu, M.; Song, H.; Xu, Y.; Lin, Y.; Granvogl, M. Characterization of key aroma-active compounds in rough and moderate fire rougui wuyi rock tea (Camellia sinensis) by sensory-directed flavor analysis and elucidation of the influences of roasting on aroma. J. Agric. Food Chem. 2022, 70, 267–278. [Google Scholar]
  43. Zhu, Y.; Lv, H.; Shao, C.; Kang, S.; Zhang, Y.; Guo, L.; Dai, W.; Tan, J.; Peng, Q.; Lin, Z. Identification of key odorants responsible for chestnut-like aroma quality of green teas. Food Res. Int. 2018, 108, 74–82. [Google Scholar] [CrossRef]
  44. Schuh, C.; Schieberle, P. Characterization of the key aroma compounds in the beverage prepared from Darjeeling black tea: Quantitative differences between tea leaves and infusion. J. Agric. Food Chem. 2006, 54, 916–924. [Google Scholar]
Figure 1. Sensory evaluation of KJC and GT. (A) Sensory description of infusion color, aroma and taste. (B) QDA radar chart of taste. (C) QDA radar chart of aroma. “**” indicates highly significant differences (p < 0.01).
Horticulturae 11 00804 g001
Figure 2. Contents of main conventional biochemical components in tea samples. Different lowercase letters indicate significant differences (p < 0.05).
Horticulturae 11 00804 g002
Figure 3. Contents of catechins in tea samples. Different lowercase letters indicate significant differences (p < 0.05).
Horticulturae 11 00804 g003
Figure 4. Analysis of flavonoids in tea samples. (A) Total flavonoid contents. (B) The ratios of total flavonoids to tea polyphenols. (C) PCA derived from flavonoid contents. (D) A heat map of the relative flavonoid contents. Different lowercase letters indicate significant differences (p < 0.05).
Horticulturae 11 00804 g004
Figure 5. Content of amino acids in tea samples. (A) Relatively high-content amino acids. (B) Relatively low-content amino acids. Different lowercase letters indicate significant differences (p < 0.05).
Horticulturae 11 00804 g005
Figure 6. The analysis of volatile components in tea samples. (A) PCA derived from volatile component contents. (B) A Venn diagram of the volatile components in tea samples. (C) A heat map of the relative volatile component contents. (D) The percentages of the volatile component types. (E) The total volatile component contents. (F) The contents of each volatile component type. Different lowercase letters indicate significant differences (p < 0.05).
Horticulturae 11 00804 g006
Disclaimer/Publisher’s Note: The statements, opinions and data contained in all publications are solely those of the individual author(s) and contributor(s) and not of MDPI and/or the editor(s). MDPI and/or the editor(s) disclaim responsibility for any injury to people or property resulting from any ideas, methods, instructions or products referred to in the content.

