Article

Comparative Evaluation of Appearance and Nutritional Qualities of 57 Tomato (Solanum lycopersicum L.) Accessions

1
Institute of Agro-Products Processing Science and Technology (Institute of Food Nutrition and Health), Sichuan Academy of Agricultural Sciences, Chengdu 610066, China
2
Sichuan Research Center of Vegetable Engineering and Technology, Chengdu 611934, China
3
Institute of Horticulture, Sichuan Academy of Agricultural Sciences, Chengdu 610066, China
*
Authors to whom correspondence should be addressed.
Horticulturae 2025, 11(7), 796; https://doi.org/10.3390/horticulturae11070796
Submission received: 30 May 2025 / Revised: 26 June 2025 / Accepted: 2 July 2025 / Published: 4 July 2025

Abstract

This study aims to comparatively analyze and evaluate the postharvest quality of tomatoes, and to further screen and utilize the excellent tomato germplasm resources. Correlation analysis, principal component analysis (PCA), and cluster analysis were performed on 18 appearance and nutritional quality indicators of 57 tomato F1 hybrids (labeled accession 1# to 57#). The results show that the variation coefficients of the tested quality indicators among tomato accessions ranged from 3.77% to 42.92%. Among them, 11 indicators had variation coefficients greater than 10%. The soluble protein content had the highest variation coefficient. Six principal components were extracted through PCA, accounting for 78.696% of the variability. The appearance indicators (size, single fruit weight, and a* value) and soluble solid content played key roles in tomato quality evaluation. According to the calculated comprehensive scores, the top 10 accessions with superior overall quality were selected from the tested tomato accessions. Cluster analysis divided the 57 tomato accessions into two major groups and seven subgroups. Notably, accession 6# showed the best flavor and nutritional quality, which could be a focus for future tomato breeding. These results provide a theoretical basis for comprehensive evaluation of tomato and quality improvement in tomato breeding.

1. Introduction

A tomato (Solanum lycopersicum L.) is a vegetable-fruit dual-use crop cultivated and consumed worldwide [1]. It is rich in vitamin C, carotenoids (primarily lycopene), minerals, and polyphenolic compounds. Tomatoes possess significant health benefits and medicinal value, including antioxidant and anti-inflammatory properties, as well as the potential to prevent cardiovascular diseases and cancer [2,3,4]. Beyond fresh consumption, tomatoes can be processed into primary products such as paste, juice, and canned tomato, as well as value-added products such as lycopene extracts and fermented tomato beverages [5,6,7]. Currently, China is the world’s largest producer and consumer of tomatoes, with a production exceeding 68 million tons in 2022, accounting for more than one-third of global production (Food and Agriculture Organization of the United Nations, 2024).
Due to long-term breeding, the genetic diversity of tomatoes gradually narrowed [8]. Traditional tomato breeding and comprehensive evaluation studies primarily focused on agronomic traits based on the grower’s perspective, such as plant height, yield, disease resistance, and firmness, which are critical for production and transportation. However, the importance of quality traits has often been overlooked, potentially leading to a decline in the nutritional and flavor quality of screened tomato cultivars [9,10]. Studies reported that the contents of some important volatile flavor compounds decreased by approximately 50% in modern tomato cultivars [11]. However, with the improvement of living standards, consumer demand for nutritious and flavorful tomatoes has been increasing [12]. Therefore, more focus on quality traits in breeding is crucial for enhancing the marketability and consumer acceptance of tomatoes.
Tomato quality traits primarily include appearance indicators, such as size, color, and firmness, as well as nutritional indicators, such as soluble solids, titratable acid, soluble sugars, vitamin C, and lycopene [13,14]. Among these, the contents of soluble solids, sugars, and organic acids are closely related to the taste and flavor of the tomato [15]. Based on sensory evaluation and odor activity value analysis, Cheng et al. [12] identified key flavor factors in tomatoes, including soluble solids, fructose, glucose, citric acid, and 15 volatile compounds, such as 1-hexanol.
Given the numerous quality indicators of tomatoes, a single or a few indicators cannot accurately evaluate the differences of quality among tomato cultivars. Therefore, it is necessary to apply appropriate methods for comprehensive evaluation to identify superior tomato materials for breeding and production reference. Currently, integrated evaluation methods combining variation analysis, correlation analysis, principal component analysis (PCA), and cluster analysis have been widely used to assess the comprehensive quality of different fruit and vegetable cultivars [16,17,18]. Jin et al. [9] found that the coefficient of variation (CV) for 17 agronomic traits in 324 tomato accessions ranged from 5% to 108%. The primary traits contributing to the phenotypic diversity of inbred tomato lines were resistance to gray leaf spot, growth habit, fruit shape, and plant height. Based on agronomic traits, PCA and cluster analysis classified the tomato accessions into four groups, while insertion-deletion molecular marker assay divided them into five groups. However, the former classification method demonstrated higher genetic diversity and more similar agronomic traits. Li et al. [13] analyzed 28 nutritional quality traits in nine tomato cultivars and identified glucose, fructose, citric acid, and lycopene as the main components that affect the quality of a tomato. Using multivariate statistical methods, such as cluster analysis, PCA, and membership function analysis, they screened out two tomato cultivars with high quality. These studies demonstrated the feasibility of applying multivariate analysis methods based on PCA for the evaluation of tomato quality.
In this study, 57 tomato hybrids were analyzed and evaluated using multivariate methods, including correlation analysis, PCA, and cluster analysis. The evaluation focused on 18 appearance and nutritional quality indicators, aiming to identify key evaluation indicators and screen tomato accessions with superior quality traits. The findings are expected to provide more information for quality improvement and materials utilization in tomato breeding.

2. Materials and Methods

2.1. Plant Material

The 57 tomato F1 hybrids in this study, labeled accession 1# to 57#, were provided by the tomato breeding team of the Horticulture Research Institute, Sichuan Academy of Agricultural Sciences. The information of the parents of 57 tomato accessions is shown in Table S1. The plants were planted in the Modern Agricultural Science and Technology Innovation Demonstration Park of Sichuan Academy of Agricultural Sciences (30.77 °N, 104.21 °E) on 12 May 2023. The photon flux density ranged from 600 to 900 W m2. The temperature and relative humidity during the plant growth varied from 18 to 34 °C and 50 to 85%, respectively. The soil in this region is predominantly loam and slightly acidic, with a pH of 6.6. The management of the test field was the same as that of the general field with drip irrigation twice a week, nitrogen as the main fertilizer at the seedling stage, and P and K as the main fertilizer at the reproductive stage. The fruits of each accession were harvested at the ripe stage (about 50 days post anthesis). Fresh tomatoes were transported to the laboratory within 2 h after harvest.

2.2. Sample Preparation

For each accession, five fresh fruits were randomly selected to measure single fruit weight, horizontal diameter, vertical diameter, skin color parameters (L*, a*, and b* values), firmness, and soluble solids content. The middle flesh without peel was collected and grounded in liquid nitrogen, then stored at −80 °C for the further determination of other indicators. Three biological replicates were preserved for each accession.

2.3. Determination of Appearance Qualities

The single fruit weight of the tomatoes was measured by an electronic balance (JA31002, Jingtian Electronic Instrument Co., Ltd., Shanghai, China). The horizontal and vertical diameters of the tomatoes were determined using a vernier caliper (Huizhi 01130048, Hengliang Measuring Tools Co., Ltd., Shanghai, China). The fruit shape index was calculated as the ratio of the vertical diameter to the horizontal diameter. A fruit shape index greater than 1 indicates an elongated fruit, while a value less than 1 suggests a flattened fruit. The closer the index approaches 1, the more spherical the fruit shape is [19]. The skin color parameters of the tomatoes were measured using a colorimeter (CR-400, Konica Minolta, Tokyo, Japan). The L* value represents fruit brightness, with higher values indicating greater brightness. The a* value indicates the degree of redness (a* > 0) or greenness (a* < 0), with higher positive values indicating greater redness. The b* value represents the degree of yellowness (b* > 0) or blueness (b* < 0), with higher positive values indicating greater yellowness. The skin firmness of the tomatoes was measured using a texture analyzer (TA.XT plus, Stable Micro Systems, Godalming, Surrey, UK). The measurement protocol was as follows: P/2 probe, test speed of 1 mm s−1, displacement of 10 mm, and the maximum force required for the probe to penetrate the peel was defined as firmness. Five replicates were performed for single fruit weight and diameter measurements, while 10 data points (2 parallel measurements per fruit) were collected for color and texture analyses.

2.4. Determination of Nutritional Qualities

The soluble solids content was determined using a handheld refractometer (PAL-1, ATAGO Co., Ltd., Tokyo, Japan). The titratable acidity was measured using a fully automatic titrator (Model 855, Metrohm AG, Herisau, Switzerland), with 0.1 mol L−1 NaOH standard solution as the titrant, and the results are expressed as citric acid equivalents. The lycopene content [20] and β-carotene content [21] were quantified using a multifunctional microplate reader (Synergy HTX, BioTek Instruments, Inc., Winooski, VT, USA). The contents of soluble protein and vitamin C were determined using the Coomassie Brilliant Blue G-250 staining method and the molybdenum blue colorimetric method, respectively [22].
The contents of citric acid, L-malic acid, glucose, and fructose were determined by high-performance liquid chromatography (HPLC) (Agilent 1260, Agilent Technologies, Santa Clara, CA, USA), referring to the method described by Li et al. [13], with slight modifications. For the determination of citric acid and L-malic acid, the chromatographic conditions were as follows: an Aminex HPX-87H organic acid analysis column (300 mm × 7.8 mm, Bio-Rad, Hercules, CA, USA) was used with a column temperature of 30 °C, an injection volume of 10 µL, a mobile phase of 0.005 mol L−1 H2SO4 solution, a flow rate of 0.6 mL min−1, and a UV detection wavelength of 210 nm. For the determination of glucose and fructose, the chromatographic conditions were as follows: an Agilent Hiplex-Ca column (300 mm × 7.8 mm, Agilent Technologies, Santa Clara, CA, USA) was used with a column temperature of 80 °C, an injection volume of 20 µL, a mobile phase of ultrapure water, and a flow rate of 0.6 mL min−1. The evaporative light scattering detector (ELSD) conditions included a nitrogen gas flow rate of 2 mL min−1, a drift tube temperature of 60 °C, and an evaporation tube temperature of 80 °C. Five replicates were conducted for the determination of soluble solids content, while other nutritional indicators were performed in triplicate.

2.5. Statistical Analysis

Data statistical analysis was performed using Excel 2019. Pearson correlation analysis, PCA, and cluster analysis were performed using SPSS 26.0 software. Graphical representations were generated using Origin 2021 and TBtools-II.

3. Results

3.1. Quality Traits of Different Tomato Accessions

Statistical analysis was conducted on 18 postharvest quality indicators of the tomato accessions, as presented in Table 1. These indicators included 8 appearance indicators (single fruit weight, horizontal diameter, vertical diameter, fruit shape index, L* value, a* value, b* value, and firmness) and 10 nutritional indicators (soluble solids, soluble protein, titratable acid, citric acid, L-malic acid, glucose, fructose, vitamin C, lycopene, and β-carotene).
The CVs for the tested indicators ranged from 3.77% to 42.92%, and were ranked in descending order as follows: soluble protein > L-malic acid > β-carotene > lycopene > citric acid > b* value > firmness > single fruit weight > vitamin C > fructose > titratable acid > soluble solids > glucose > a* value > horizontal diameter > vertical diameter > fruit shape index > L* value. The results show that the CVs for soluble protein, L-malic acid, β-carotene, lycopene, citric acid, and b* value all exceeded 20%, suggesting significant variabilities in these indicators among different tomato accessions. Notably, soluble protein had the highest CV at 42.92%. The CVs for titratable acid, fructose, vitamin C, single fruit weight, and firmness ranged between 10.13% and 15.29%, while the CVs for soluble solids, glucose, a* value, horizontal diameter, vertical diameter, fruit shape index, and L* value were all below 10%, indicating relatively minor differences among the accessions for these indicators.
For the appearance indicators, accession 6# had the smallest values for single fruit weight, horizontal diameter, and vertical diameter among the 57 tomato accessions. Accession 12# had the largest single fruit weight, accession 54# showed the largest horizontal diameter, and accession 3# had the largest vertical diameter. Accession 20# had the highest fruit shape index, indicating that its fruit shape was closer to a round type. The remaining 56 accessions exhibited fruit shape indices ranging from 0.71 to 0.86, indicating a flattened shape. Among the three color parameters, the CVs for L* value and a* value were relatively small (less than 10%), while the CV for the b* value was the largest (higher than 20%). This suggested that there were minimal variations in brightness and redness, but significant variation in yellowness among the 57 tomato accessions. Accession 37# had the lowest yellowness, while accession 15# showed the highest. For firmness, accession 3# and 43# showed the lowest and highest values, respectively.
For the nutritional indicators, accession 3# and 6# showed the lowest and highest soluble solids contents, respectively. The soluble protein content varied significantly among accessions, with accession 49# having the lowest content and accession 19# showing the highest, representing an approximately 10.7-fold difference. Accession 5# showed the lowest titratable acid content, while accession 41# had the highest value. Accession 27# exhibited the lowest citric acid content, and accession 17# showed the lowest levels of L-malic acid, glucose, and fructose. In contrast, accession 6# had the highest contents of citric acid, L-malic acid, glucose, and fructose. Accession 2# and 53# showed the lowest and highest vitamin C contents, respectively. Accession 33# exhibited the lowest levels of both lycopene and β-carotene, while accession 26# had the highest contents of these two compounds.

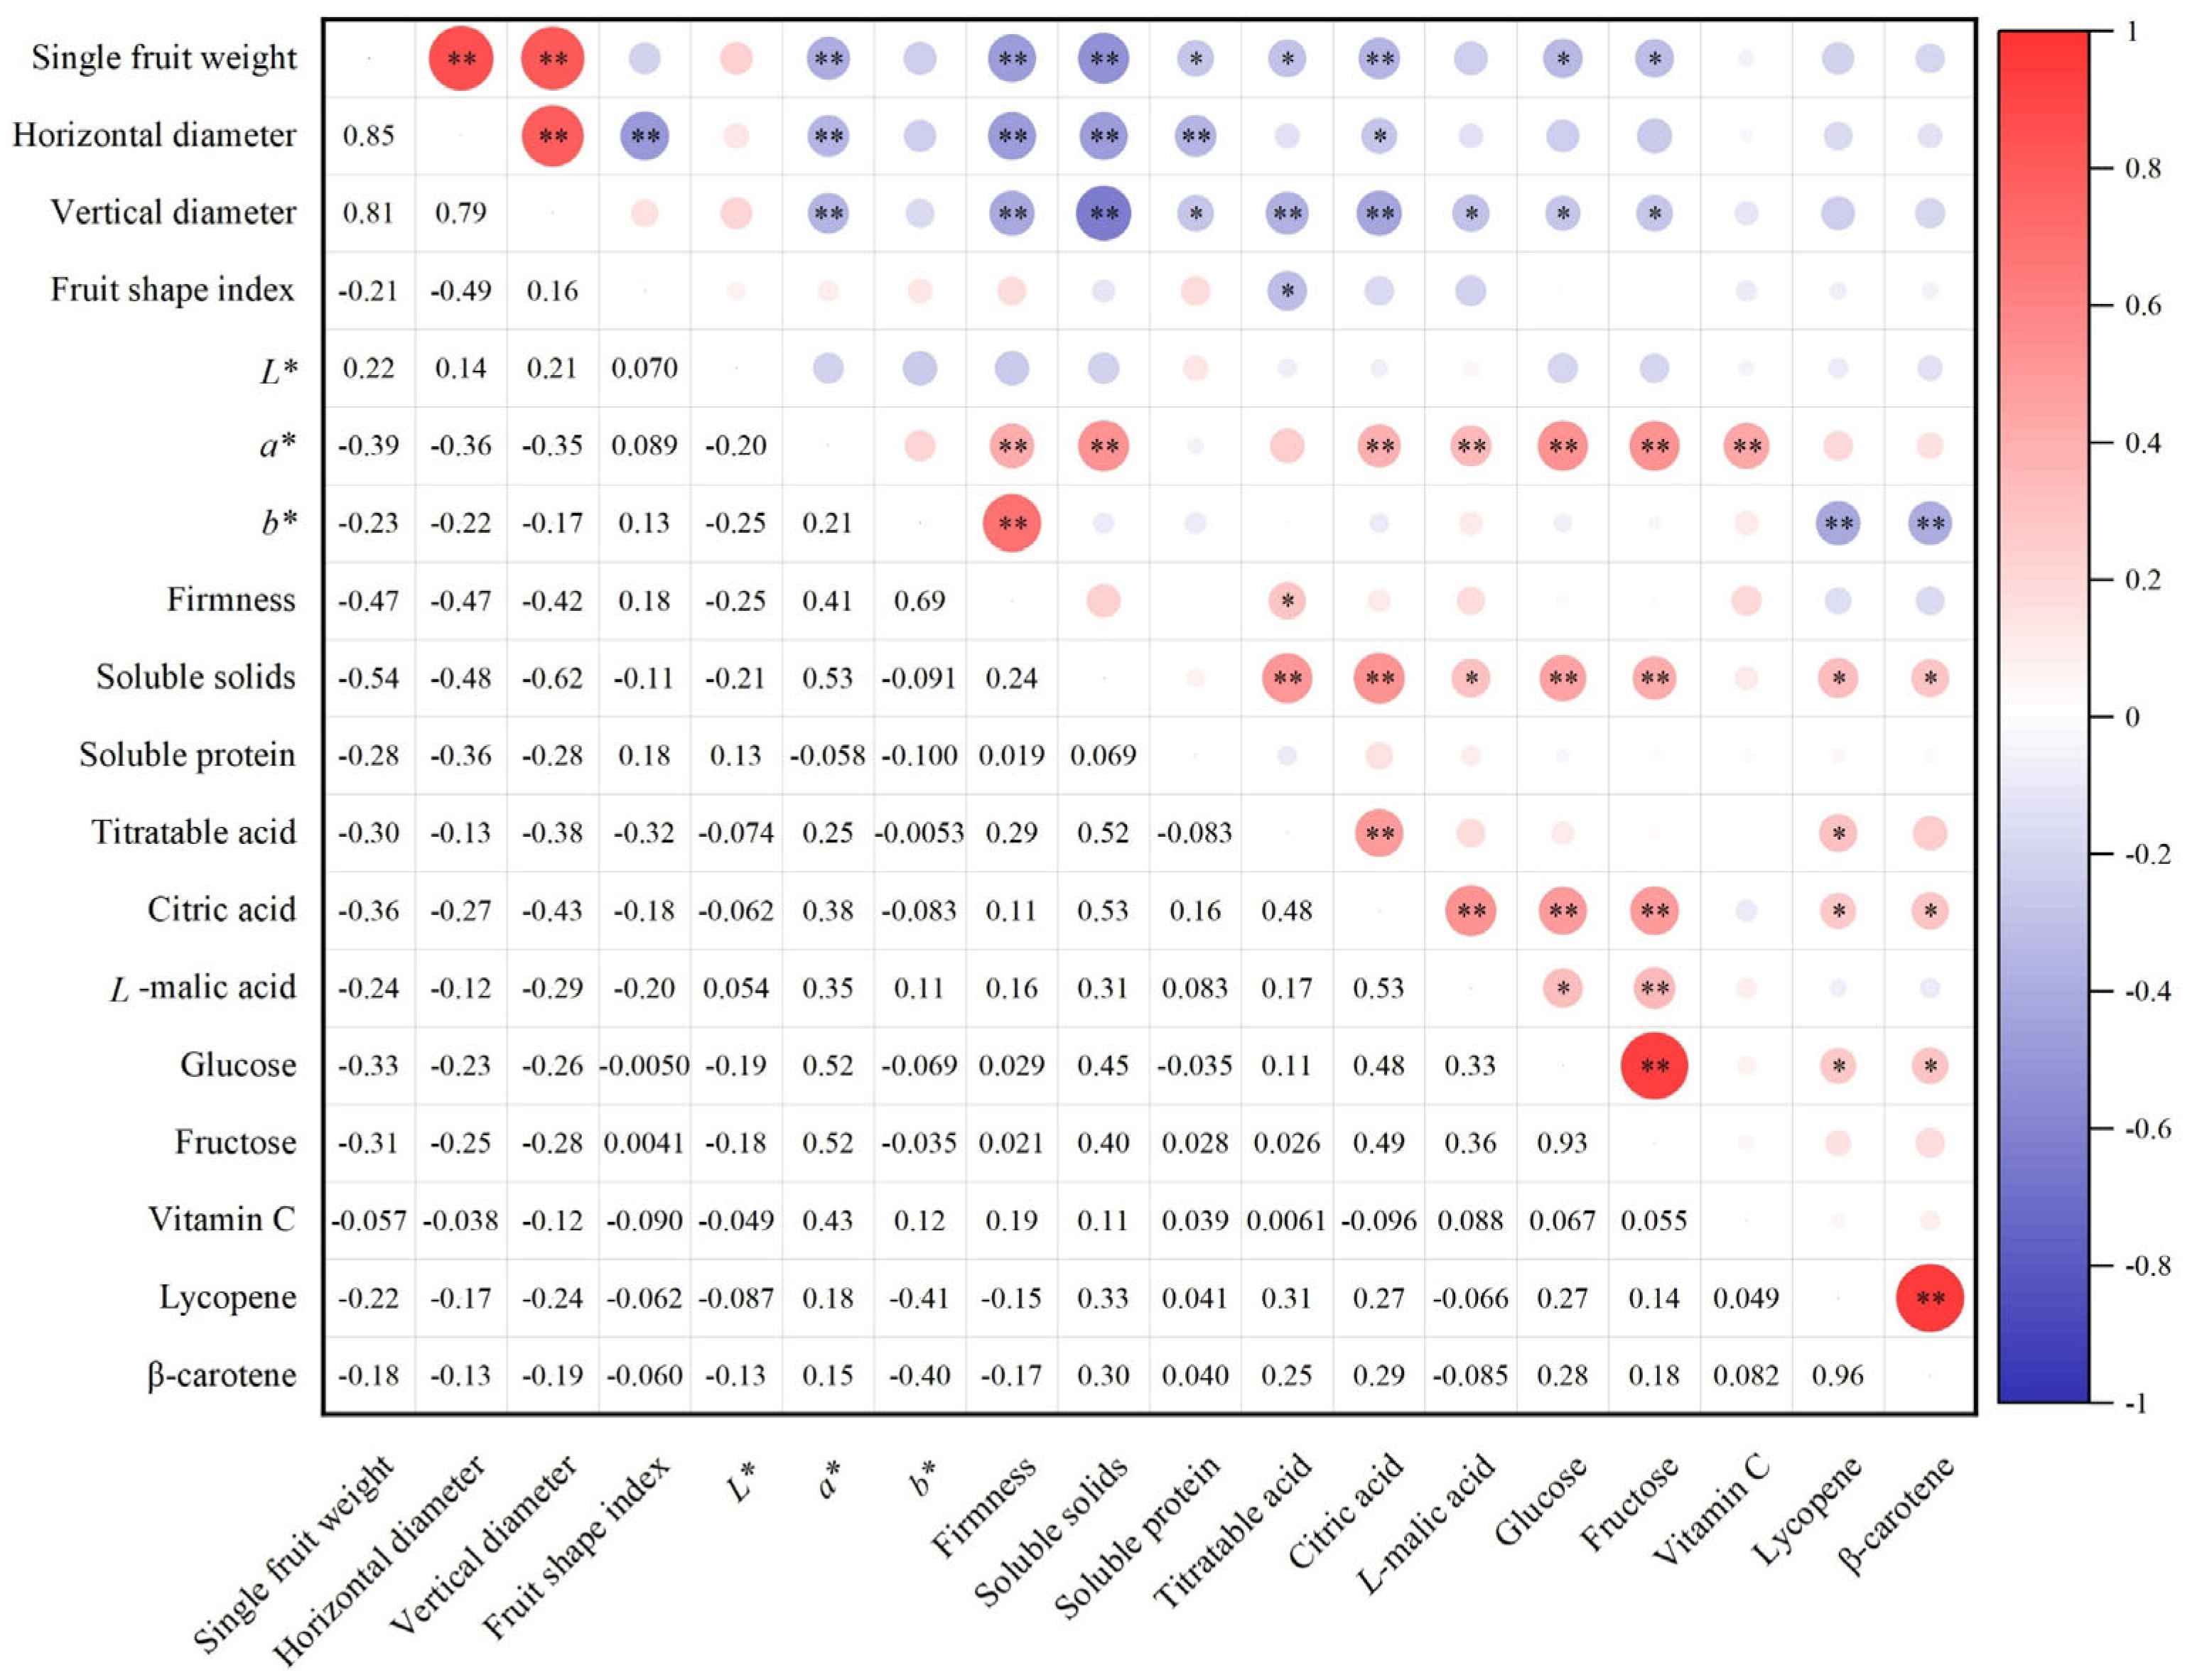
3.2. Correlation Analysis

Correlation analysis was conducted on the 18 quality indicators of the tested tomato accessions and the results are presented in Figure 1. Single fruit weight, horizontal diameter, and vertical diameter were highly significantly (p < 0.01) and positively correlated with each other, and were significantly (p < 0.05) or highly significantly (p < 0.01) negatively correlated with a* value, firmness, soluble solids, soluble protein, and citric acid. This suggested that larger tomato fruits tended to have heavier weight but might exhibit lower redness, firmness, and nutritional contents. The fruit shape index was negatively (p < 0.05) or strongly negatively (p < 0.01) correlated with horizontal diameter and titratable acid. As the horizontal diameter increased, the fruit shape index would decrease, resulting in a more flattened fruit shape, while the titratable acid content might increase.
No significant correlations were observed between the three color parameters or between the L* value and the other 17 indicators. The b* value was highly significantly (p < 0.01) and positively correlated with firmness and negatively correlated with lycopene and β-carotene. The a* value, in addition to its strong (p < 0.01) and negative correlations with fruit weight and size, was also highly (p < 0.01) positively correlated with firmness, soluble solids, citric acid, L-malic acid, glucose, fructose, and vitamin C. This indicated that among the color parameters, redness (a* value) had the strongest association with other quality indicators. Firmness was highly significantly (p < 0.01) correlated with fruit weight, size, redness, and yellowness, but there was no significant correlation between it with intrinsic nutritional indicators, except titratable acid.
Among the nutritional indicators, significant correlations were observed between soluble solids content and most of the other indicators. It was highly significantly (p < 0.01) and positively correlated with titratable acid, citric acid, glucose, and fructose, as well as significantly (p < 0.05) positively correlated with L-malic acid, lycopene, and β-carotene. Strong correlations were also observed between the acid- and sugar-related indicators. There were highly significant (p < 0.01) positive correlations between titratable acid, citric acid, and L-malic acid. A highly significant (p < 0.01) positive correlation was also observed between glucose and fructose. Additionally, citric acid and L-malic acid were significantly (p < 0.05) or highly significantly (p < 0.01) positively correlated with glucose and fructose. Lycopene and β-carotene were highly significantly (p < 0.01) and positively correlated with each other, and were significantly (p < 0.05) positively correlated with citric acid and glucose. Furthermore, lycopene was also significantly (p < 0.05) positively correlated with titratable acid. In contrast, there was no significant correlation between soluble protein and vitamin C with the other nutritional indicators. In brief, there were widespread correlations between the tested indicators. It is necessary to simplify these 18 quality indicators using PCA to more efficiently evaluate the comprehensive quality of different tomatoes.

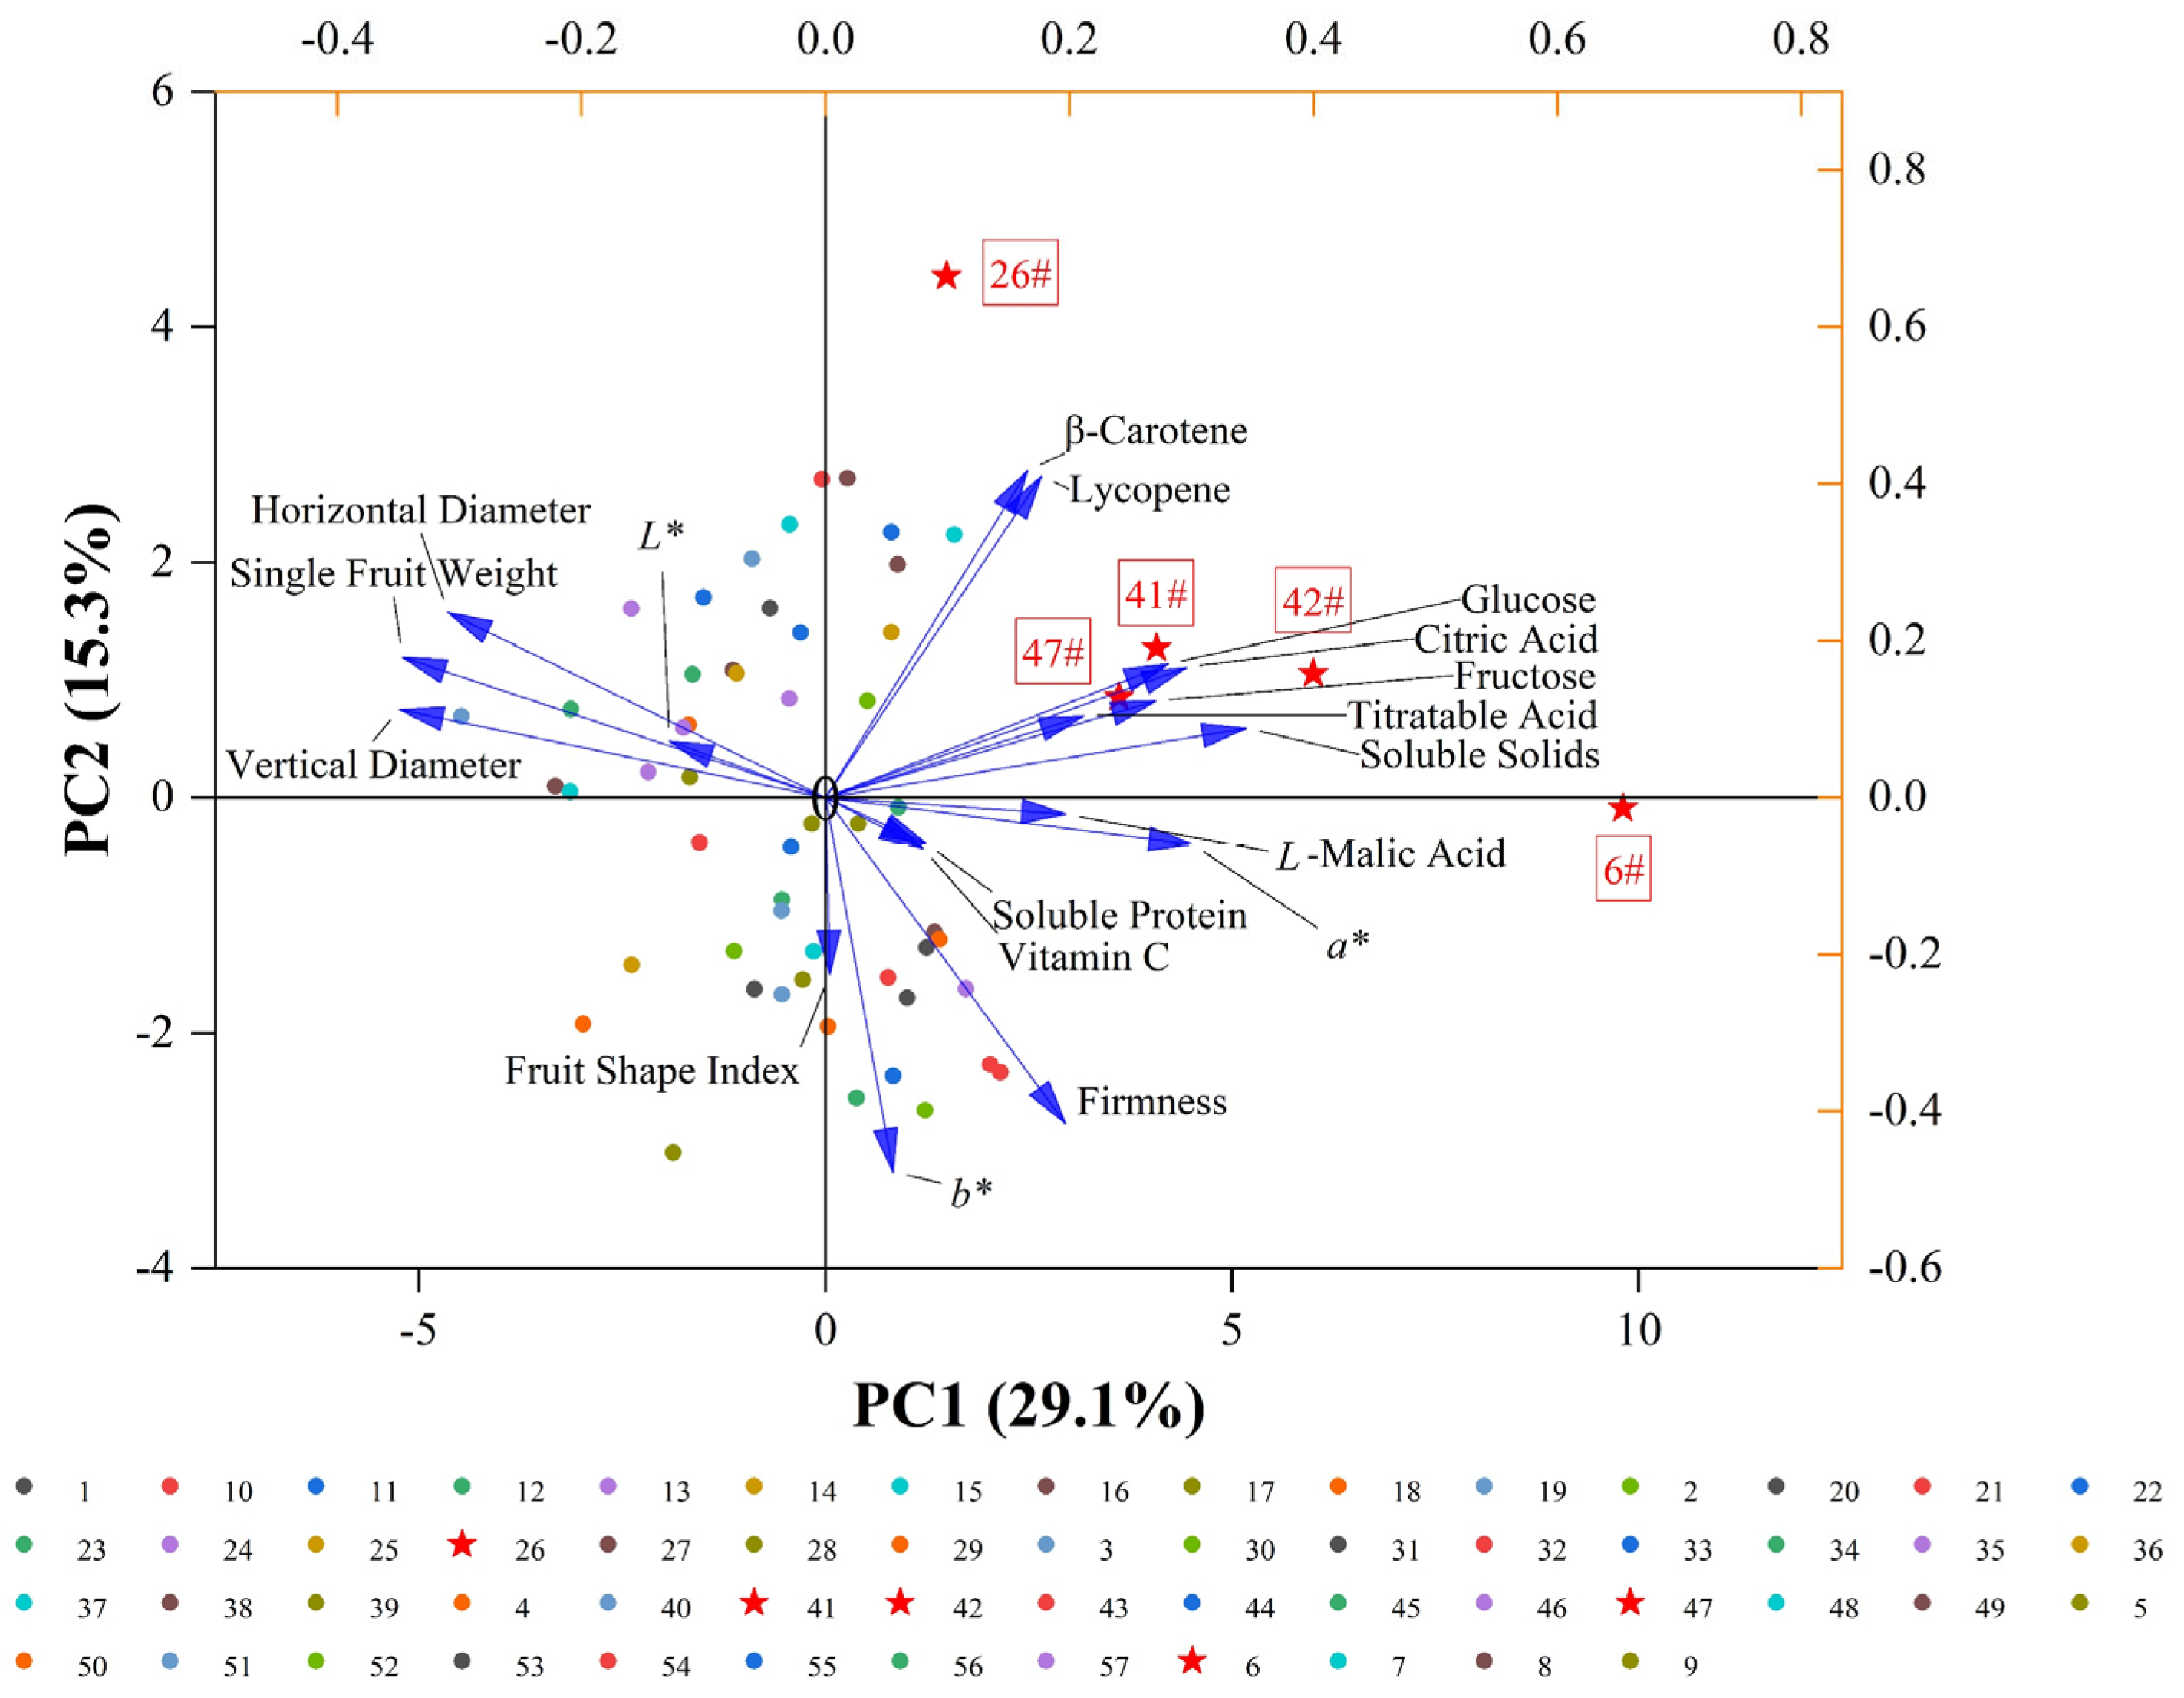
3.3. PCA of Tomato Quality Traits

The Kaiser–Meyer–Olkin (KMO) and Bartlett’s sphericity tests were performed on the 18 quality indicators of the tested tomato accessions. The results reveal a KMO value of 0.626, and the significance value was less than 0.05, indicating strong intercorrelations among the indicators and confirming the suitability of the data for PCA.
As shown in Table 2, a total of 78.696% of the information was expressed by six principal components (PC). The PC1 had an eigenvalue of 5.240, accounting for 29.109% of the variation. Soluble solids, a* value, citric acid, glucose, and fructose had higher positive loadings, while vertical diameter, single fruit weight, and horizontal diameter had higher negative loadings. This indicated that the appearance indicators (size, single fruit weight, and skin redness) as well as soluble solids, sugar, and acid-related indicators, played dominant roles in the quality evaluation of tomatoes. The PC2 had an eigenvalue of 2.748, explaining 15.269% of the variation. β-carotene and lycopene had higher positive loadings, while b* value and firmness had higher negative loadings. The cumulative variance contribution rate of the PC1 and PC2 reached 44.378%. As shown in Figure 2, the clear dispersion of most accessions in the PCA biplot reflected underlying diversity in their quality traits. Notably, the distinct separation of accessions 6#, 26#, 41#, 42#, and 47# implied that they might exhibit desirable traits. Their positioning correlated with higher concentrations of nutritional or flavor-related compounds (e.g., soluble solids, organic acids, soluble sugars, and β-carotene), making them potential candidates for breeding programs or further quality evaluation.
The PC3 explained 10.722% of the variation, with L-malic acid and soluble protein having relatively high positive and negative loadings, respectively. The PC4 explained 9.088% of the variation and was positively and negatively correlated with the fruit shape index and titratable acid, respectively. The variance contribution of PC5 was 8.186%, which was mainly negatively associated with L* value. The PC6 explained 6.321% of the variation and was positively correlated with vitamin C.

3.4. Comprehensive Evaluation of Tomato Quality

Y1, Y2, Y3, Y4, Y5, and Y6 were used to represent the six PCs’ scores, respectively. The coefficients for each quality indicator were obtained by dividing the loading values in Table 2 by the square root of the corresponding PC’s eigenvalue. The comprehensive evaluation function was derived by weighting the PC scores with their respective variance contribution rates, expressed as Equation (1).
Z = 0.2911 × Y1 + 0.1527 × Y2 + 0.1072 × Y3 + 0.0909 × Y4 + 0.0819 × Y5 + 0.0632 × Y6
The comprehensive score of each tomato accession was calculated and ranked in descending order. Higher scores indicate better quality of the tomato accession. As shown in Table 3, the top 10 tomato accessions with the highest comprehensive scores were as follows: 6# > 42# > 41# > 26# > 47# > 10# > 7# > 11# > 53# > 25#. Notably, accessions 6#, 42#, 41#, and 26#, which were superior hybrids, scored above 1.000.

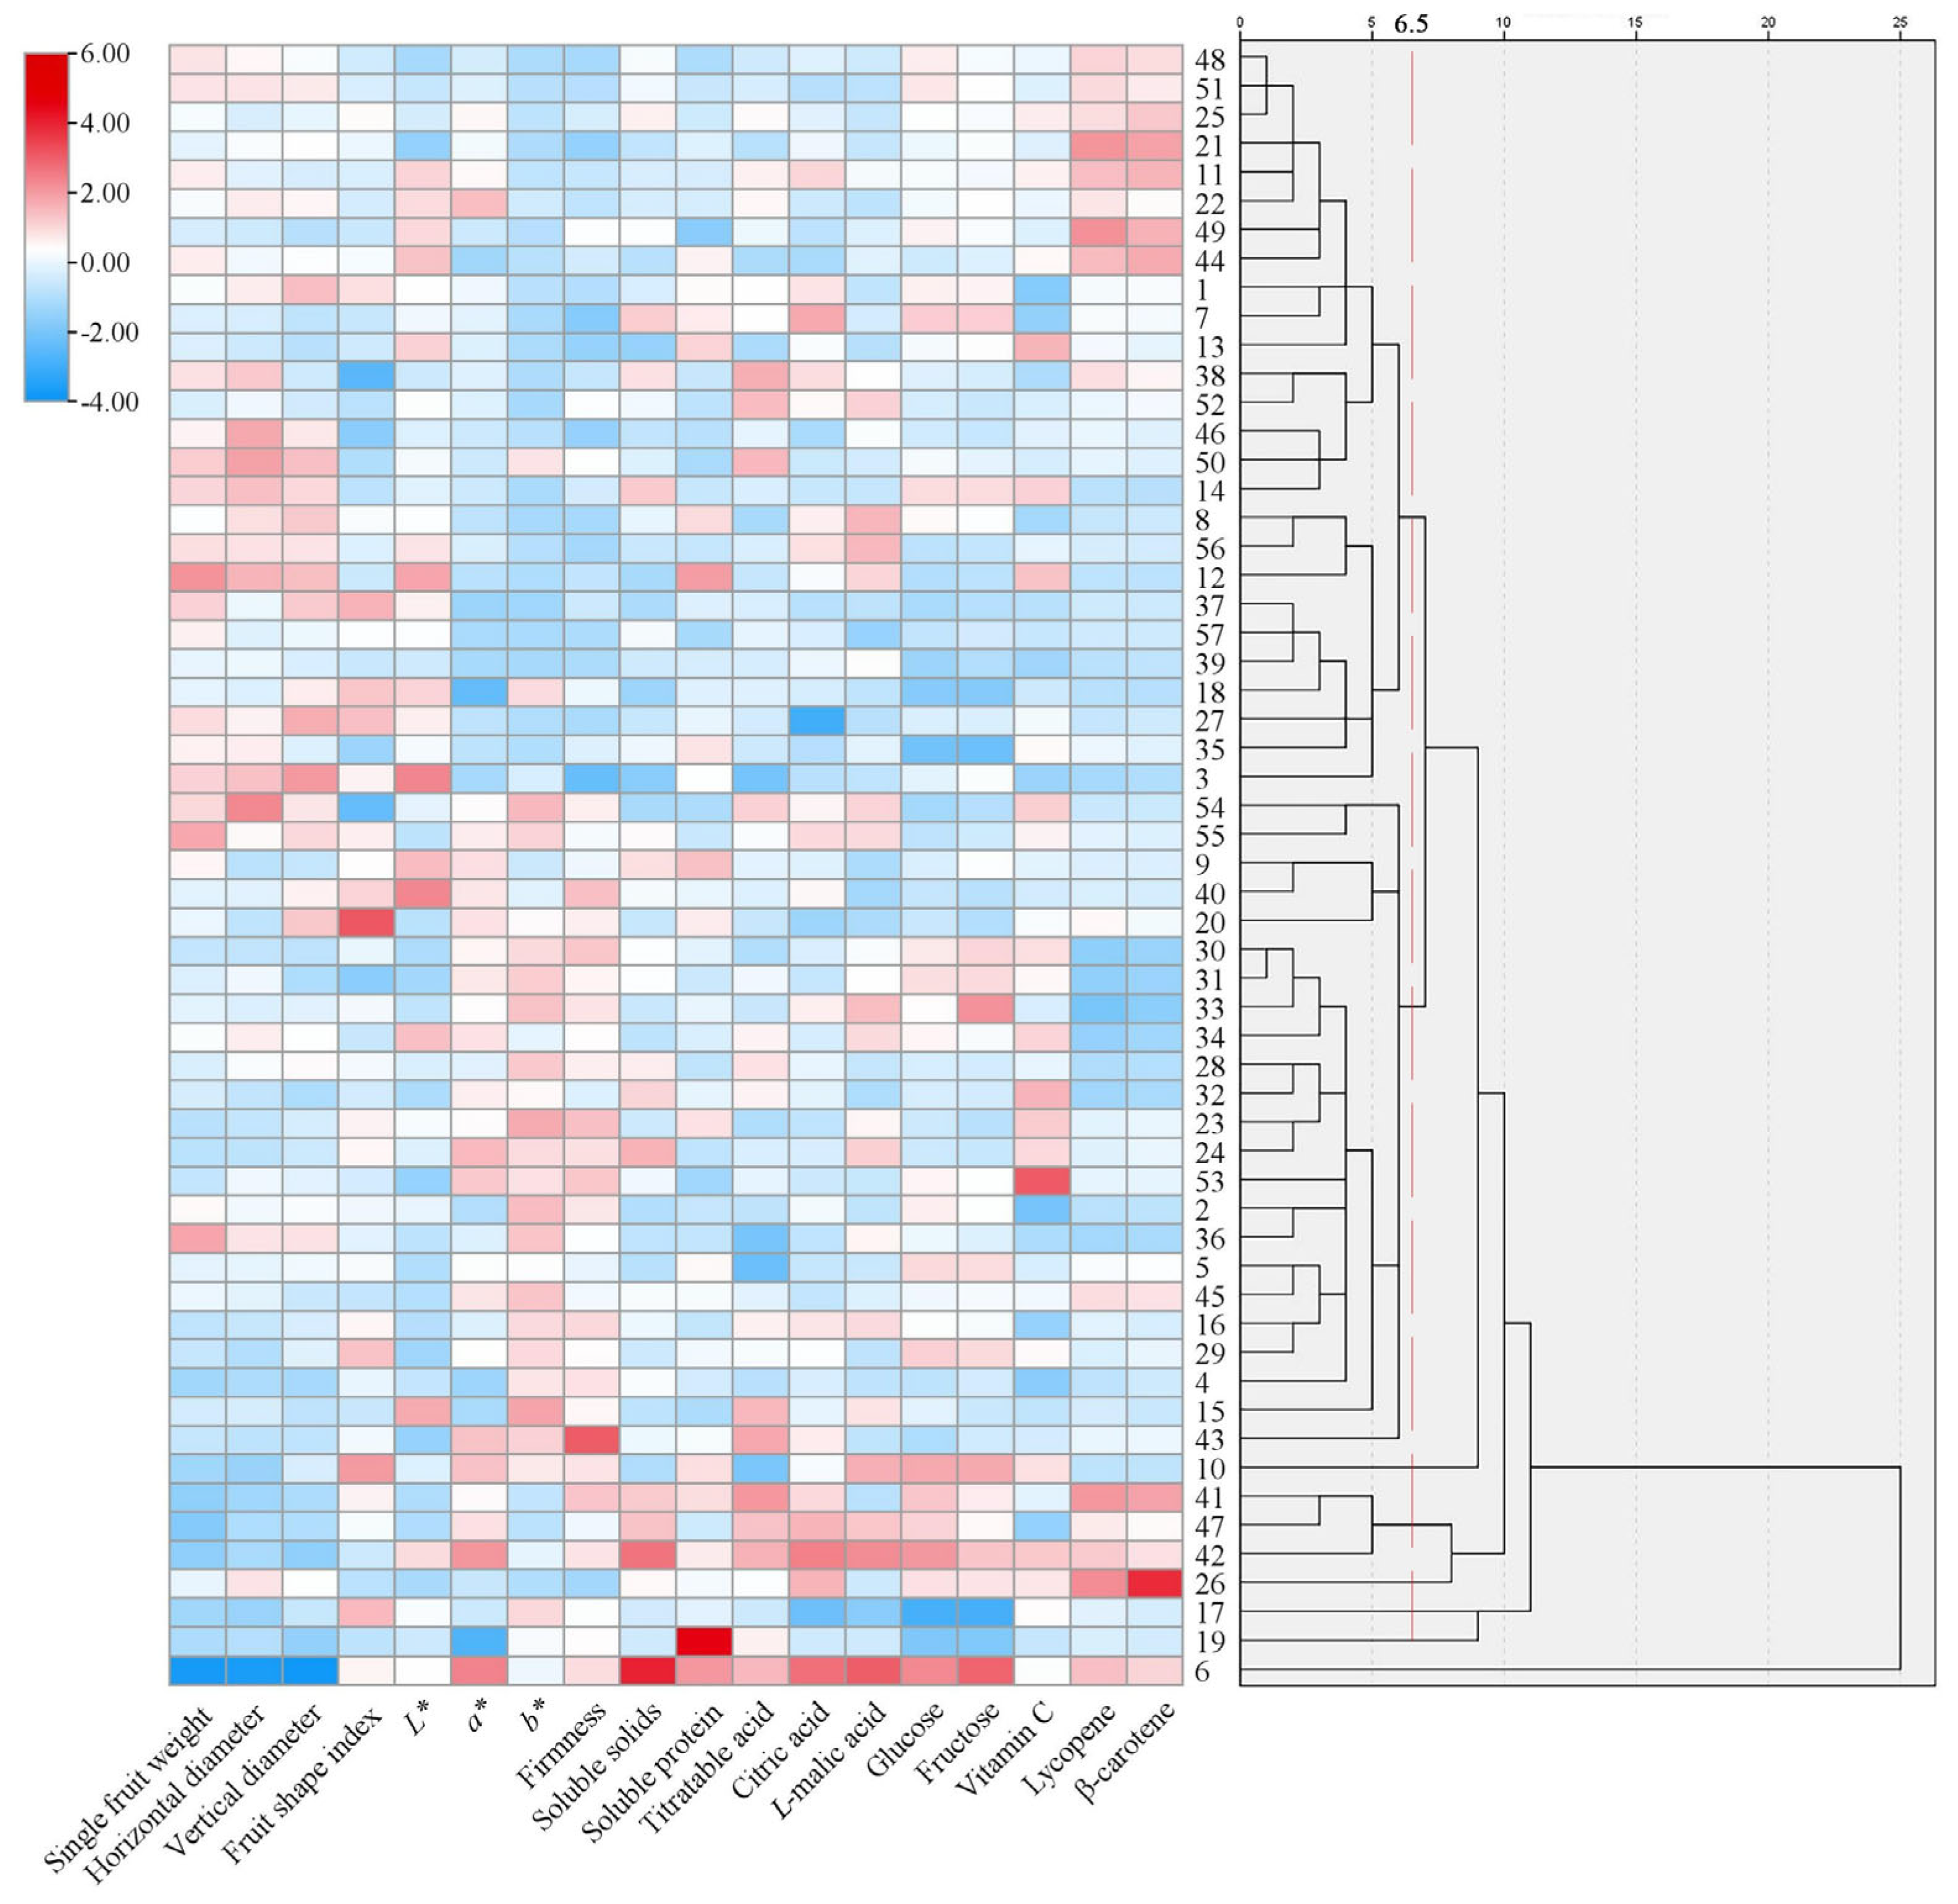
3.5. Cluster Analysis

Cluster analysis was performed using the between-cluster linkage method. As shown in Figure 3, the 57 tomato accessions were divided into two major clusters. Accession 6# was placed into a separate cluster, which was distantly related to the other accessions in terms of postharvest quality, suggesting its high potential value in distant hybridization breeding. It was characterized by smaller fruit size, higher skin redness, and elevated levels of soluble solids, soluble protein, titratable acid, citric acid, L-malic acid, glucose, and fructose. Additionally, it achieved the highest score in the comprehensive quality evaluation (Table 3).
The remaining 56 accessions were grouped into the second major cluster, which could be further divided into seven subclasses at a squared Euclidean distance of 6.5. Subclass I consisted of accession 19#, which had the highest soluble protein content, but lower levels of other nutritional components. Subclass II included accession 17#, which was characterized by a high fruit shape index, indicating a near-round fruit shape, but low levels of citric acid, L-malic acid, glucose, and fructose, resulting in poor comprehensive quality. Subclass III comprised accession 26#, which had the highest β-carotene content and elevated levels of lycopene, citric acid, glucose, fructose, and vitamin C. These indicators positively contributed to the quality evaluation, indicating this accession of high quality and ranking fourth in the comprehensive evaluation. Subclass IV included accessions 41#, 47#, and 42#, which exhibited high levels of soluble solids, titratable acid, citric acid, glucose, and lycopene, and were all ranked within the top five in the comprehensive evaluation. Subclass V consisted of accession 10#, which had a high fruit shape index and skin redness. Although its lycopene and β-carotene contents were relatively low, it showed high levels of L-malic acid, glucose, and fructose, resulting in good quality and a sixth-place ranking in the comprehensive evaluation. Subclass VI included 23 accessions, such as 43#, 15#, and 54#. Most fruits in this subclass had small size, high firmness, as well as high skin redness and yellowness, but were low in nutritional components such as lycopene and β-carotene. Subclass VII comprised 26 accessions, including 48#, 51#, and 25#. The majority of the fruits in this subclass were large, with low firmness as well as low skin redness and yellowness, and exhibited low content of nutritional components. The results of the cluster analysis were largely consistent with the loading values of the quality traits in PCA.

4. Discussion

The CV reflects the genetic diversity of traits. A higher CV indicates greater potential for genetic improvement. A CV exceeding 20% suggests that the trait exhibits a high level of variability [23]. In this study, 18 postharvest quality indicators of 57 tomato accessions were analyzed. The results reveal that the CVs for soluble protein, L-malic acid, β-carotene, lycopene, citric acid, and b* value all exceeded 20%. These traits had a broad scope for selection during hybrid breeding and were key targets for breeding improvement [21]. In contrast, the CVs for soluble solids, glucose, a* value, horizontal diameter, vertical diameter, fruit shape index, and L* value were relatively low, which indicated that the genetic expressions of these seven traits had been stabilized and were less influenced by external factors. Specifically, the CVs for horizontal and vertical diameters were 6.79% and 6.00%, respectively, with little difference between them. This might be attributed to the control of both traits by the same quantitative trait loci (QTL) [24].
Correlation analysis can enhance the efficiency of germplasm resource selection in breeding by enabling the indirect selection of one trait through another [25]. This study revealed that the most nutritional indicators in tomatoes exhibited positive correlations between each other, while they were negatively correlated with appearance indicators. This suggested that the intrinsic nutritional quality of tomatoes could be conveniently inferred from their external appearance, particularly through single fruit weight, horizontal, and vertical diameters. Fruit weight was highly significantly and negatively correlated with soluble solids, which is consistent with previous studies [26,27,28]. Nadia et al. [27] found that this negative relationship might result from a dilution effect. Smaller tomato fruits tended to have higher sugar content because of their greater dry matter content, i.e., lower water content, rather than increased sugar accumulation. As fruit weight increased, the dilution effect reduced the concentration of soluble solids. Both fruit weight and vertical diameter were significantly and negatively correlated with glucose and fructose, likely due to the loss of high-sugar alleles during the breeding process, where larger tomatoes were consistently selected [10]. Firmness is a critical indicator of fruit maturity and storage characteristics [15]. Correlation analysis revealed that skin firmness in tomatoes was significantly and negatively correlated with fruit weight, as well as horizontal and vertical diameters, suggesting that smaller fruits might have higher firmness and better storability.
PCA can reduce a large number of highly correlated variables into a few independent new variables while retaining most of the information from the original data. The extracted PCs are characterized by a decreasing percentage of explained variance, meaning that the first PC accounts for more variability in the original data than the second, and so on [29,30]. Chang et al. [15] identified soluble solids, fructose, glucose, and some amino acids as key indicators for the quality evaluation of cherry tomatoes. In this study, the PCA results reveal that appearance indicators (size, single fruit weight, and redness) as well as soluble solids, sugars, and acids were the primary factors influencing tomato quality. Piombino et al. [31] also found that tomatoes with a lower single fruit weight were more favored by consumers. Additionally, yellowness, firmness, and the contents of β-carotene and lycopene played significant roles in the comprehensive quality evaluation of tomato. Specifically, higher values of redness, soluble solids, sugars, acids, β-carotene, and lycopene, combined with lower values of size, weight, firmness, and yellowness, were indicative of superior quality. These indicators could basically reflect the overall quality of a tomato, with appearance traits serving as simple and effective indicators for quality assessment. This is in agreement with the correlation analysis results, which suggest that external appearance traits could reflect internal nutritional quality of a tomato.
Fruit shape is one of the most intuitive quality traits of tomatoes, aside from size and color. The fruit shapes of tomatoes include round, flattened, elongated, pear-shaped and heart-shaped types, etc. [32]. In this study, the fruit shape index of the 57 tomato accessions ranged from 0.71 to 0.90, consistent with the findings of Zhu et al. [33]. Fruit shape might be related to size and weight, and several potential genes, including OVATE, were identified in previous research [34]. In this study, the fruit shape index exhibited significant or highly significant negative correlations only with horizontal diameter and titratable acid. PCA further indicated that both horizontal diameter and titratable acid negatively influenced tomato quality evaluation. Therefore, a higher fruit shape index, indicating a more rounded fruit shape, might correlate with better quality. However, Baldina et al. [35] found that fruits of the flattened type contained higher levels of phenolic compounds and showed stronger antioxidant capacity.
Soluble solids refer to the total content of all soluble substances in fruit pulp, including soluble sugars, organic acids, amino acids, phenols, vitamins, and other compounds, serving as a comprehensive indicator of fruit and vegetable flavor [15]. Due to its low cost and ease of measurement, soluble solids content has been widely used in the quality evaluation of tomatoes [36]. Sugars and acids are fundamental compounds contributing to flavor formation in fruits and vegetables, with their accumulation determining the intensity of aroma. Higher sugar content and appropriate acidity are beneficial for the overall flavor of tomatoes [12]. Glucose and fructose are the primary forms of reducing sugars in tomatoes, contributing to sweetness, while citric acid and malic acid are the dominant organic acids, responsible for sourness [15,37]. In this study, the average contents of glucose, fructose, and citric acid in the tested tomato accessions were 14.47, 16.01, and 21.14 mg g−1, respectively, which were consistent with previous studies [12,38], while the average content of L-malic acid was 11.70 mg g−1, higher than that reported in the above studies.
β-carotene and lycopene belong to the carotenoid family. They are closely associated with tomato quality traits such as ripeness and skin color, making them key indicators for evaluating tomato quality [39]. Notably, lycopene is almost exclusively found in tomatoes and their derived products [40]. Previous studies confirmed that these compounds possess anti-inflammatory and immune-enhancing properties and can help prevent or manage cardiovascular diseases, cancers, and oral diseases. These health benefits are attributed to the antioxidant potential and physicochemical structure of β-carotene and lycopene [3,41]. In this study, the average contents of lycopene and β-carotene were 9.89 and 4.55 mg 100 g−1, respectively, consistent with the findings reported by Meng et al. [42] and Vogel et al. [43].
As stated previously, the taste and flavor of tomatoes are primarily affected by the contents of soluble solids, organic acids, soluble sugars, and carotenoids such as lycopene [15,43]. Among the 57 tomato accessions tested in this study, accession 6# exhibited the smallest single fruit weight, horizontal and vertical diameters, while having the highest values for redness, soluble solids, citric acid, L-malic acid, glucose, and fructose. Additionally, it showed relatively high levels of soluble protein, lycopene, and β-carotene. These results indicate that accession 6# was a small-size tomato with excellent flavor and nutritional quality, which was a promising candidate for future breeding.
In addition, selecting accessions with high levels of target compounds is crucial for improving variety quality in tomato breeding [21]. For instance, accession 19# and 26#, which had the highest soluble protein and β-carotene contents, respectively, could be utilized for gene discovery and hybrid breeding to develop tomato cultivars with elevated protein and carotenoid levels. Similarly, accessions 41#, 47#, 42#, and 10#, which had high levels of soluble solids, organic acids, and soluble sugars, could be strategically utilized into tomato breeding.

5. Conclusions

In this study, 18 appearance and nutritional quality indicators of 57 tomato hybrids were determined and analyzed by correlation analysis, PCA, and cluster analysis. The findings reveal that appearance traits (size, single fruit weight, and a* value) and soluble solids content, identified as significant through PCA, were key factors in the comprehensive quality evaluation of tomatoes. Based on the PCA results, comprehensive scores were calculated, allowing the identification of the top 10 accessions with superior overall quality, including 6#, 42#, 41#, 26#, 47#, 10#, 7#, 11#, 53#, and 25#. These accessions could serve as excellent parental germplasm resources for tomato breeding. The results of cluster analysis indicate that accession 6#, characterized by smaller fruit size, as well as exceptional flavor and overall nutritional quality, could be a priority candidate for breeding programs targeting flavor and nutritional enhancement. Accession 19# and 26# showed higher levels of certain nutritional components (soluble protein, β-carotene). Accessions 41#, 47#, 42#, and 10# had high levels of flavor-related compounds (e.g., organic acids, soluble sugars). The screened hybrids provide valuable information for further tomato breeding, accelerating the development of tomato cultivars with superior quality traits.

Supplementary Materials

The following supporting information can be downloaded at: https://www.mdpi.com/article/10.3390/horticulturae11070796/s1, Table S1: The information of the parents of 57 tomato F1 hybrids.

Author Contributions

Conceptualization, J.G.; validation, Y.Y., J.L. and Y.T.; formal analysis, Y.T.; investigation, Y.Y., J.L. and Y.T.; resources, Z.L. and L.Y.; data curation, Y.Y. and J.G.; writing—original draft preparation, Y.Y.; writing—review and editing, L.Y. and J.G.; visualization, J.L.; project administration, J.G.; funding acquisition, J.G. All authors have read and agreed to the published version of the manuscript.

Funding

This research was funded by Sichuan Science and Technology Program (2021YFYZ0022), Sichuan Innovation Team of National Modern Agricultural Industry Technology System (SCCXTD 2024-5).

Data Availability Statement

The data that support the findings of this study are available from the corresponding author upon reasonable request.

Conflicts of Interest

The authors declare no conflicts of interest.

References

  1. Cai, W.; Jiang, P.; Liu, Y.; Miao, X.; Liu, A. Distinct Changes of Taste Quality and Metabolite Profile in Different Tomato Varieties Revealed by LC-MS Metabolomics. Food Chem. 2024, 442, 138456. [Google Scholar] [CrossRef]
  2. Brainer, V.-L.; Yendry, C.-M.; Laura, B.-P.; Marianela, G.-M.; Jimmy, V.-P.; Gerardo, R.; Pablo, J.-B.; Victor, Á.-V. Phytonutraceutical Evaluation of Five Varieties of Tomato (Solanum lycopersicum) during Ripening and Processing. LWT 2022, 164, 113592. [Google Scholar]
  3. Caseiro, M.; Ascenso, A.; Costa, A.; Creagh-Flynn, J.; Johnson, M.; Simoes, S. Lycopene in Human Health. LWT Food Sci. Technol. 2020, 127, 109323. [Google Scholar] [CrossRef]
  4. Khalid, S.; Hassan, S.A.; Javaid, H.; Zahid, M.; Naeem, M.; Bhat, Z.F.; Abdi, G.; Aadil, R.M. Factors Responsible for Spoilage, Drawbacks of Conventional Packaging, and Advanced Packaging Systems for Tomatoes. J. Agric. Food Res. 2024, 15, 100962. [Google Scholar] [CrossRef]
  5. Deng, Y.; Zhao, S.; Yang, X.; Hou, F.; Fan, L.; Wang, W.; Xu, E.; Cheng, H.; Guo, M.; Liu, D. Evaluation of Extraction Technologies of Lycopene: Hindrance of Extraction, Effects on Isomerization and Comparative Analysis-A Review. Trends Food Sci. Technol. 2021, 115, 285–296. [Google Scholar] [CrossRef]
  6. Wu, X.; Yu, L.; Pehrsson, P.R. Are Processed Tomato Products as Nutritious as Fresh Tomatoes? Scoping Review on the Effects of Industrial Processing on Nutrients and Bioactive Compounds in Tomatoes. Adv. Nutr. 2022, 13, 138–151. [Google Scholar] [CrossRef]
  7. Zhao, L.; Maimaitiyiming, R.; Hong, J.; Wang, L.; Mu, Y.; Liu, B.; Zhang, H.; Chen, K.; Aihaiti, A. Optimization of Tomato (Solanum lycopersicum L.) Juice Fermentation Process and Analysis of Its Metabolites during Fermentation. Front. Nutr. 2024, 11, 1344117. [Google Scholar] [CrossRef]
  8. Dan, Y.; Yousef, G.; Campbell, F.N.; Phelps, D.W.; Burnett, C.; Kekkonen, A.; Shockley, A.; Lila, M.A. Development, and Genetic and Metabolic Characterization of New Tomato Mutants with Enhanced and Deficient Carotenoid Content. J. Hortic. Sci. Biotechnol. 2017, 92, 475–483. [Google Scholar] [CrossRef]
  9. Jin, L.; Zhao, L.; Wang, Y.; Zhou, R.; Song, L.; Xu, L.; Cui, X.; Li, R.; Yu, W.; Zhao, T. Genetic Diversity of 324 Cultivated Tomato Germplasm Resources Using Agronomic Traits and InDel Markers. Euphytica 2019, 215, 69. [Google Scholar] [CrossRef]
  10. Tieman, D.; Zhu, G.; Resende, M.F.R., Jr.; Lin, T.; Taylor, M.; Zhang, B.; Ikeda, H.; Liu, Z.; Fisher, J.; Zemach, I.; et al. A Chemical Genetic Roadmap to Improved Tomato Flavor. Science 2017, 355, 391–394. [Google Scholar] [CrossRef]
  11. Klee, H.J.; Tieman, D.M. The Genetics of Fruit Flavour Preferences. Nat. Rev. Genet. 2018, 19, 347–356. [Google Scholar] [CrossRef]
  12. Cheng, G.; Chang, P.; Shen, Y.; Wu, L.; El-Sappah, A.H.; Zhang, F.; Liang, Y. Comparing the Flavor Characteristics of 71 Tomato (Solanum lycopersicum) Accessions in Central Shaanxi. Front. Plant Sci. 2020, 11, 586834. [Google Scholar] [CrossRef]
  13. Li, J.; Liu, F.; Wu, Y.; Tang, Z.; Zhang, D.; Lyu, J.; Khan, K.S.; Xiao, X.; Yu, J. Evaluation of Nutritional Composition, Biochemical, and Quality Attributes of Different Varieties of Tomato (Solanum lycopersicum L.). J. Food Compos. Anal. 2024, 132, 106384. [Google Scholar] [CrossRef]
  14. Panthee, D.R.; Labate, J.A.; McGrath, M.T.; Breksa, A.P., III; Robertson, L.D. Genotype and Environmental Interaction for Fruit Quality Traits in Vintage Tomato Varieties. Euphytica 2013, 193, 169–182. [Google Scholar] [CrossRef]
  15. Chang, Y.; Zhang, X.; Wang, C.; Ma, N.; Xie, J.; Zhang, J. Fruit Quality Analysis and Flavor Comprehensive Evaluation of Cherry Tomatoes of Different Colors. Foods 2024, 13, 1898. [Google Scholar] [CrossRef]
  16. Fawole, O.A.; Opara, U.L. Physicomechanical, Phytochemical, Volatile Compounds and Free Radical Scavenging Properties of Eight Pomegranate Cultivars and Classification by Principal Component and Cluster Analyses. Br. Food J. 2014, 116, 544–567. [Google Scholar] [CrossRef]
  17. Lyu, J.; Liu, X.; Bi, J.; Jiao, Y.; Wu, X.; Ruan, W. Characterization of Chinese White-Flesh Peach Cultivars Based on Principle Component and Cluster Analysis. J. Food Sci. Technol. 2017, 54, 3818–3826. [Google Scholar] [CrossRef]
  18. Xu, M.; Li, J.; Yin, J.; Wu, M.; Zhou, W.; Yang, X.; Zhang, R.; He, J. Color and Nutritional Analysis of Ten Different Purple Sweet Potato Varieties Cultivated in China via Principal Component Analysis and Cluster Analysis. Foods 2024, 13, 904. [Google Scholar] [CrossRef]
  19. Brewer, M.T.; Lang, L.; Fujimura, K.; Dujmovic, N.; Gray, S.; van der Knaap, E. Development of a Controlled Vocabulary and Software Application to Analyses Fruit Shape Variation in Tomato and Other Plant Species. Plant Physiol. 2006, 141, 15–25. [Google Scholar] [CrossRef]
  20. Huang, J.; Gao, W.; Qiao, H.; Wang, J. Condition Optimization in Extracting Lycopene from Fresh Tomato. Feed Res. 2019, 42, 86–90. (In Chinese) [Google Scholar]
  21. Figas, M.R.; Prohens, J.; Raigon, M.D.; Fita, A.; Garcia-Martinez, M.D.; Casanova, C.; Borras, D.; Plazas, M.; Andujar, I.; Soler, S. Characterization of Composition Traits Related to Organoleptic and Functional Quality for the Differentiation, Selection and Enhancement of Local Varieties of Tomato from Different Cultivar Groups. Food Chem. 2015, 187, 517–524. [Google Scholar] [CrossRef]
  22. Luo, J.; Liang, G.; Luo, F.; Tang, Y.; Yang, Y.; Gao, J. Quality Analysis and Evaluation of Fleshy Stems and Leaves of 10 Lettuce Varieties. Sci. Technol. Food Ind. 2024, 45, 336–344. (In Chinese) [Google Scholar]
  23. Liu, X.-H.; Song, H.-Z.; Zhang, G.-M.; Duan, W.-X.; Zhang, R.-H.; Li, Y.-R. Phenotypic Variation and Genetic Diversity in the Collections of Erianthus arundinaceus (Retz.) Jesw. Sugar Tech 2017, 19, 359–367. [Google Scholar] [CrossRef]
  24. Adhikari, P.; McNellie, J.; Panthee, D.R. Detection of Quantitative Trait Loci (QTL) Associated with the Fruit Morphology of Tomato. Genes 2020, 11, 1117. [Google Scholar] [CrossRef]
  25. de Souza, L.M.; Melo, P.C.T.; Luders, R.R.; Melo, A.M.T. Correlations between Yield and Fruit Quality Characteristics of Fresh Market Tomatoes. Hortic. Bras. 2012, 30, 627–631. [Google Scholar] [CrossRef]
  26. Hernández-Bautista, A.; Lobato-Ortiz, R.; Cruz-Izquierdo, S.; García-Zavala, J.J.; Chávez-Servia, J.L.; Hernández-Leal, E.; Bonilla-Barrientos, O. Fruit Size QTLs Affect in a Major Proportion the Yield in Tomato. Chil. J. Agric. Res. 2015, 75, 402–409. [Google Scholar] [CrossRef]
  27. Nadia, B.; Mathilde, C.; Béatrice, B.; David, T.; Michel, G. Identification of Growth Processes Involved in QTLs for Tomato Fruit Size and Composition. J. Exp. Bot. 2009, 60, 237–248. [Google Scholar]
  28. Zhang, R.; Tao, J.; Song, L.; Zhang, J.; Liu, H.; Zhu, W.; Zhao, T.; Xiong, A. Identification of Genes of Molecular Marker TGS0892 on Chromosome 6 and Its Mechanism of Soluble Solids Metabolism in Tomato. Horticulturae 2023, 9, 52. [Google Scholar] [CrossRef]
  29. Saavedra, J.; Córdova, A.; Gálvez, L.; Quezada, C.; Navarro, R. Principal Component Analysis as an Exploration Tool for Kinetic Modeling of Food Quality: A Case Study of a Dried Apple Cluster Snack. J. Food Eng. 2013, 119, 229–235. [Google Scholar] [CrossRef]
  30. Santos, S.A.; Almeida, B.M.; Mata, C.U.M.F.; Oliveira, R.C.J.; Cotrim, S.B.; Galvão, N.C.; Venâncio, A.E.R. An Introductory Review on the Application of Principal Component Analysis in the Data Exploration of the Chemical Analysis of Food Samples. Food Sci. Biotechnol. 2024, 33, 1323–1336. [Google Scholar]
  31. Piombino, P.; Sinesio, F.; Moneta, E.; Cammareri, M.; Genovese, A.; Lisanti, M.T.; Mogno, M.R.; Peparaio, M.; Termolino, P.; Moio, L.; et al. Investigating Physicochemical, Volatile and Sensory Parameters Playing a Positive or a Negative Role on Tomato Liking. Food Res. Int. 2013, 50, 409–419. [Google Scholar] [CrossRef]
  32. Azzi, L.; Deluche, C.; Gevaudant, F.; Frangne, N.; Delmas, F.; Hernould, M.; Chevalier, C. Fruit Growth-Related Genes in Tomato. J. Exp. Bot. 2015, 66, 1075–1086. [Google Scholar] [CrossRef]
  33. Zhu, Y.; Gu, Q.; Zhao, Y.; Wan, H.; Wang, R.; Zhang, X.; Cheng, Y. Quantitative Extraction and Evaluation of Tomato Fruit Phenotypes Based on Image Recognition. Front. Plant Sci. 2022, 13, 859290. [Google Scholar] [CrossRef]
  34. Shi, Y.; Dai, Z.; Chen, K. Transcription Factors Involved in Tomato Fruit Quality Improvement. Food Qual. Saf. 2024, 8, fyad050. [Google Scholar] [CrossRef]
  35. Baldina, S.; Picarella, M.E.; Troise, A.D.; Pucci, A.; Ruggieri, V.; Ferracane, R.; Barone, A.; Fogliano, V.; Mazzucato, A. Metabolite Profiling of Italian Tomato Landraces with Different Fruit Types. Front. Plant Sci. 2016, 7, 664. [Google Scholar] [CrossRef]
  36. Beckles, D.M. Factors Affecting the Postharvest Soluble Solids and Sugar Content of Tomato (Solanum lycopersicum L.) Fruit. Postharvest Biol. Technol. 2012, 63, 129–140. [Google Scholar] [CrossRef]
  37. Zhang, J.; Liu, S.; Zhu, X.; Chang, Y.; Wang, C.; Ma, N.; Wang, J.; Zhang, X.; Lyu, J.; Xie, J. A Comprehensive Evaluation of Tomato Fruit Quality and Identification of Volatile Compounds. Plants 2023, 12, 2947. [Google Scholar] [CrossRef]
  38. Galiana-Balaguer, L.; Ibanez, G.; Cebolla-Cornejo, J.; Rosello, S. Evaluation of Germplasm in Solanum Section Lycopersicon for Tomato Taste Improvement. Turk. J. Agric. For. 2018, 42, 309–321. [Google Scholar] [CrossRef]
  39. Li, S.; Wang, Q.; Yang, X.; Zhang, Q.; Shi, R.; Li, J. Online Detection of Lycopene Content in the Two Cultivars of Tomatoes by Multi-Point Full Transmission Vis-NIR Spectroscopy. Postharvest Biol. Technol. 2024, 211, 112813. [Google Scholar] [CrossRef]
  40. Gorecka, D.; Wawrzyniak, A.; Jedrusek-Golinska, A.; Dziedzic, K.; Hamulka, J.; Kowalczewski, P.L.; Walkowiak, J. Lycopene in Tomatoes and Tomato Products. Open Chem. 2020, 18, 752–756. [Google Scholar] [CrossRef]
  41. Tufail, T.; Ul Ain, H.B.; Noreen, S.; Ikram, A.; Arshad, M.T.; Abdullahi, M.A. Nutritional Benefits of Lycopene and Beta-Carotene: A Comprehensive Overview. Food Sci. Nutr. 2024, 12, 8715–8741. [Google Scholar] [CrossRef]
  42. Meng, F.; Li, Y.; Li, S.; Chen, H.; Shao, Z.; Jian, Y.; Mao, Y.; Wang, Q.; Liu, L. Carotenoid Biofortification in Tomato Products along Whole Agro-Food Chain from Field to Fork. Trends Food Sci. Technol. 2022, 124, 296–308. [Google Scholar] [CrossRef]
  43. Vogel, J.T.; Tieman, D.M.; Sims, C.A.; Odabasi, A.Z.; Clark, D.G.; Klee, H.J. Carotenoid Content Impacts Flavor Acceptability in Tomato (Solanum lycopersicum). J. Sci. Food Agric. 2010, 90, 2233–2240. [Google Scholar] [CrossRef]
Figure 1. Correlation analysis of quality indicators of tomato accessions. The values in the heat map are Pearson’s correlation coefficient (red: positive correlation, blue: negative correlation, *: p < 0.05, and **: p < 0.01).
Horticulturae 11 00796 g001
Figure 2. Principal component analysis biplot of tomato accessions and quality traits (PC1 vs. PC2).
Horticulturae 11 00796 g002
Figure 3. Cluster heat map of quality traits of the 57 tomato accessions.
Horticulturae 11 00796 g003
Table 1. Descriptive statistics of quality differences of 57 tomato accessions.
IndicatorMinMaxMeanSDCV
Single fruit weight (g)87.86260.67197.3129.3914.90
Horizontal diameter (mm)55.685.773.95.06.79
Vertical diameter (mm)45.265.958.73.56.00
Fruit shape index0.710.900.800.034.17
L* value40.4446.7142.871.623.77
a* value18.2028.4923.632.028.53
b* value18.3634.5724.935.1620.71
Firmness (g)334.16757.24516.1478.9415.29
Soluble solids (%)4.2 6.8 5.0 0.5 9.23
Soluble protein (mg 100 g−1)1.2613.434.521.9442.92
Titratable acid (mg g−1)4.507.035.800.5910.13
Citric acid (mg g−1)7.5733.8021.144.6121.80
L-malic acid (mg g−1)6.0621.9111.703.3728.79
Glucose (mg g−1)10.8117.4114.471.288.82
Fructose (mg g−1)10.8821.2016.011.7711.08
Vitamin C (mg 100 g−1)13.8328.5119.642.8714.63
Lycopene (mg 100 g−1)4.9015.629.892.5325.60
β-carotene (mg 100 g−1)2.449.504.551.2828.18
Abbreviations: Min, minimum value; Max, maximum value; Mean, average value; SD, standard deviation; and CV, coefficient of variation.
Table 2. The component loading matrix, eigenvalues, and variance contribution rates of quality traits for the 57 tomato accessions.
IndicatorPC1PC2PC3PC4PC5PC6
Single fruit weight−0.7930.2970.337−0.0150.0780.079
Horizontal diameter−0.7080.3920.495−0.1870.0560.041
Vertical diameter−0.7990.1860.2350.2070.199−0.011
Fruit shape index0.008−0.373−0.4540.5810.203−0.071
L* value−0.2930.119−0.0900.169−0.5010.427
a* value0.689−0.0990.3150.1020.3260.274
b* value0.127−0.7910.217−0.1580.189−0.111
Firmness0.450−0.6880.022−0.2790.169−0.005
Soluble solids0.7890.1470.016−0.164−0.065−0.012
Soluble protein0.189−0.097−0.4550.270−0.4460.333
Titratable acid0.4840.1730.046−0.652−0.153−0.081
Citric acid0.6770.2750.219−0.028−0.382−0.108
L-malic acid0.451−0.0350.4880.046−0.4460.186
Glucose0.6430.2830.3770.4720.148−0.139
Fructose0.6190.2040.4130.5410.073−0.129
Vitamin C0.183−0.1070.157−0.0970.4170.807
Lycopene0.4050.679−0.416−0.1300.2870.044
β-carotene0.3790.691−0.387−0.0930.3280.038
Eigenvalue5.2402.7481.9301.6361.4731.138
Variance contribution rate (%)29.10915.26910.7229.0888.1866.321
Cumulative variance contribution Rate (%)29.10944.37855.10064.18872.37478.696
Abbreviations: PC, principal component.
Table 3. The PC scores and rankings of the top 10 tomato accessions with the highest comprehensive scores.
AccessionPC ScoreComprehensive Score (Z)Rankings
Y1Y2Y3Y4Y5Y6
6#9.803−0.088−0.7541.282−2.2700.7902.7401
42#5.9971.0541.068−0.128−1.1261.6392.0212
41#4.0711.270−2.062−0.6410.873−0.7101.1263
26#1.4924.434−0.768−0.3941.495−0.0231.1144
47#3.6080.853−0.030−0.202−0.863−1.7660.9775
10#2.149−2.3330.7333.7430.3590.7590.7666
7#1.5852.234−0.0120.945−1.711−1.3420.6627
11#0.8112.259−0.274−0.2710.1001.0070.5998
53#1.241−1.2721.259−0.8133.1231.3910.5729
25#0.8121.406−0.646−0.0321.4030.2760.51110
Disclaimer/Publisher’s Note: The statements, opinions and data contained in all publications are solely those of the individual author(s) and contributor(s) and not of MDPI and/or the editor(s). MDPI and/or the editor(s) disclaim responsibility for any injury to people or property resulting from any ideas, methods, instructions or products referred to in the content.

