Article

The Effect of Additional Night and Pre-Harvest Blue and Red LEDs and White Lighting During the Day on the Morphophysiological and Biochemical Traits of Basil Varieties (Ocimum basilicum L.) Under Hydroponic Conditions

by
Inna V. Knyazeva
1,*,
Olga Panfilova
2,*,
Oksana Vershinina
1,
Ibrahim Kahramanoğlu
3,
Alexander A. Smirnov
1 and
Andrey Titenkov
1
1
Federal State Budgetary Scientific Institution “Federal Scientific Agroengineering Center VIM” (FSAC VIM), Moscow 109428, Russia
2
Russian Research Institute of Fruit Crop Breeding (VNIISPK), Zhilina 302530, Russia
3
Department of Horticulture, Faculty of Agricultural Sciences and Technologies, European University of Lefke, Gemikonagi, Northern Cyprus, Mersin 99780, Turkey
*
Authors to whom correspondence should be addressed.
Horticulturae 2025, 11(7), 784; https://doi.org/10.3390/horticulturae11070784
Submission received: 22 May 2025 / Revised: 19 June 2025 / Accepted: 1 July 2025 / Published: 3 July 2025

Abstract

The effect of white and additional red and blue LED lighting at night (Blue-NLL, Red-NLL) and during the pre-harvest period (Blue-P-hLL, Red-P-hLL) on morphological and physiological parameters, elemental composition, content of polyphenols, and essential oils of purple basil cultivars ‘Ararat’ and green basil ‘Tonus’ grown in the hydroponic conditions of the climatic chamber was studied. The height of the plants was determined by the variety and the LED irradiation period. The highest purple basil plants were obtained in the variant with Blue-NLL illumination; the highest green basil plants were obtained under Blue-P-hLL and Red-P-hLL. The red spectrum, regardless of the lighting period and variety, increased the area and number of leaves, biomass, and vegetative productivity. Significant changes in the elemental composition of the vegetative mass of basil varieties were determined by the period of exposure to the red spectrum. Red-P-hLL stimulated the absorption and accumulation of Mg, Ca, S, and P from the nutrient solution, and Red-P-hLL reduced the nitrate content by more than 30.00%. Blue-NLL lighting increased the content of quercetin, rosmarinic acid, and essential oil and reduced the nitrate content in the vegetative mass by more than 40.00%. The effectiveness of the white LED was observed in increasing the vegetative mass of ‘Tonus’. The results of this study will be in demand in the real sector of the economy when improving resource-saving technologies for growing environmentally friendly leafy vegetable crops with improved chemical composition and high vegetative productivity.

1. Introduction

Basil (Ocimum basilicum L.) is one of the valuable spicy-flavored crops, with high essential oil contents and a rich vitamin and mineral complex [1]. It is used as a source of healthy nutrition for humans [2,3]. This crop is actively grown all over the world in open ground and greenhouse complexes [4]. The year-round production of such leafy vegetable crops in protected soil conditions is an economically important area in plant production [5]. The production of sweet basil-based food products can ensure the development of relevant sectors of the economy and the creation of additional jobs [6]. The morphological development and phytochemical composition of basil leaves depend on the species, variety, growing conditions, and period of ontogenesis [7,8]. Basil can be grown on soil and soil-free substrates [9]. Hydroponic basil cultivation under controlled conditions (light, temperature) increases crop productivity, improves plant quality characteristics, and ensures stable yields with improved morphological and biological parameters [10]. However, the yield in this case is determined to a greater extent by the genotype [11]. The biochemical composition and development of basil plants depend on light and temperature conditions, which are associated with the tropical origin of this plant [12]. In some studies, the effectiveness of using light spectra in optimizing basil cultivation technology has been proven [13,14]. The combination of 90% red and 10% blue spectra with wavelengths of 660 nm and 450 nm, respectively, and a light intensity of 100–200 mmol·m−2·s−1, optimize the growth processes and biochemical composition of basil leaves [15,16,17]. The white spectrum increases leaf area and biomass [18,19], while the blue spectrum and ultraviolet light affect the pigment content of the leaf and the accumulation of essential oils in Ocimum basilicum L. [20]. Some reports have shown a manipulation of the spectral composition of light, including green, red, far red, blue, and ultraviolet. Using LED lighting in hydroponic chambers with a 12 h daytime photoperiod alters the leaf growth, morphological development, physiological parameters, and pigment content in green and purple basil leaves [21,22].
Strong variability between genotypes is observed in the content of essential oils such as estragol, linalool, nerol, and citral [23,24,25]. In addition, the content of essential oils varies, depending on the stage of plant development [26]. Thus, the citral content increases during the flowering period, the amount of linalool increases after flowering before harvest, and the content of estragol is the highest before flowering [26,27]. There are no differences in the content of essential oils during the day; however, there is evidence of an increase in eugenol content during the day [28].
However, despite numerous attempts to improve the economically valuable properties of basil, the effective period and time of exposure to the spectra are poorly understood. In addition, it is necessary to study the effect of the percentage of spectra on metabolic processes (photosynthesis, nutrient absorption, etc.) in closed agroecosystems, taking into account genotypes. The night and pre-harvest periods are the most vulnerable and important periods in basil’s development. Exposure to LEDs at these stages of development opens up the possibility to control the qualitative and quantitative characteristics of plants [29,30,31]. In addition, the reactions of basil, taking into account the genetic origin, to identical light modes under controlled conditions have not been studied. Addressing these issues will make it possible to develop and improve the elements of technology for growing basil genotypes with specified characteristics as well as optimize the energy efficiency of high-quality production.
The purpose of this study was to determine out the effect of the modulation of the spectral composition of LED lighting at night (i) and during the pre-harvest period (ii) on morphometric parameters, pigment complex, elemental composition, content of polyphenols, and essential oils in the leaves of green and purple basil grown in the hydroponic conditions of the climate chamber.

2. Materials and Methods

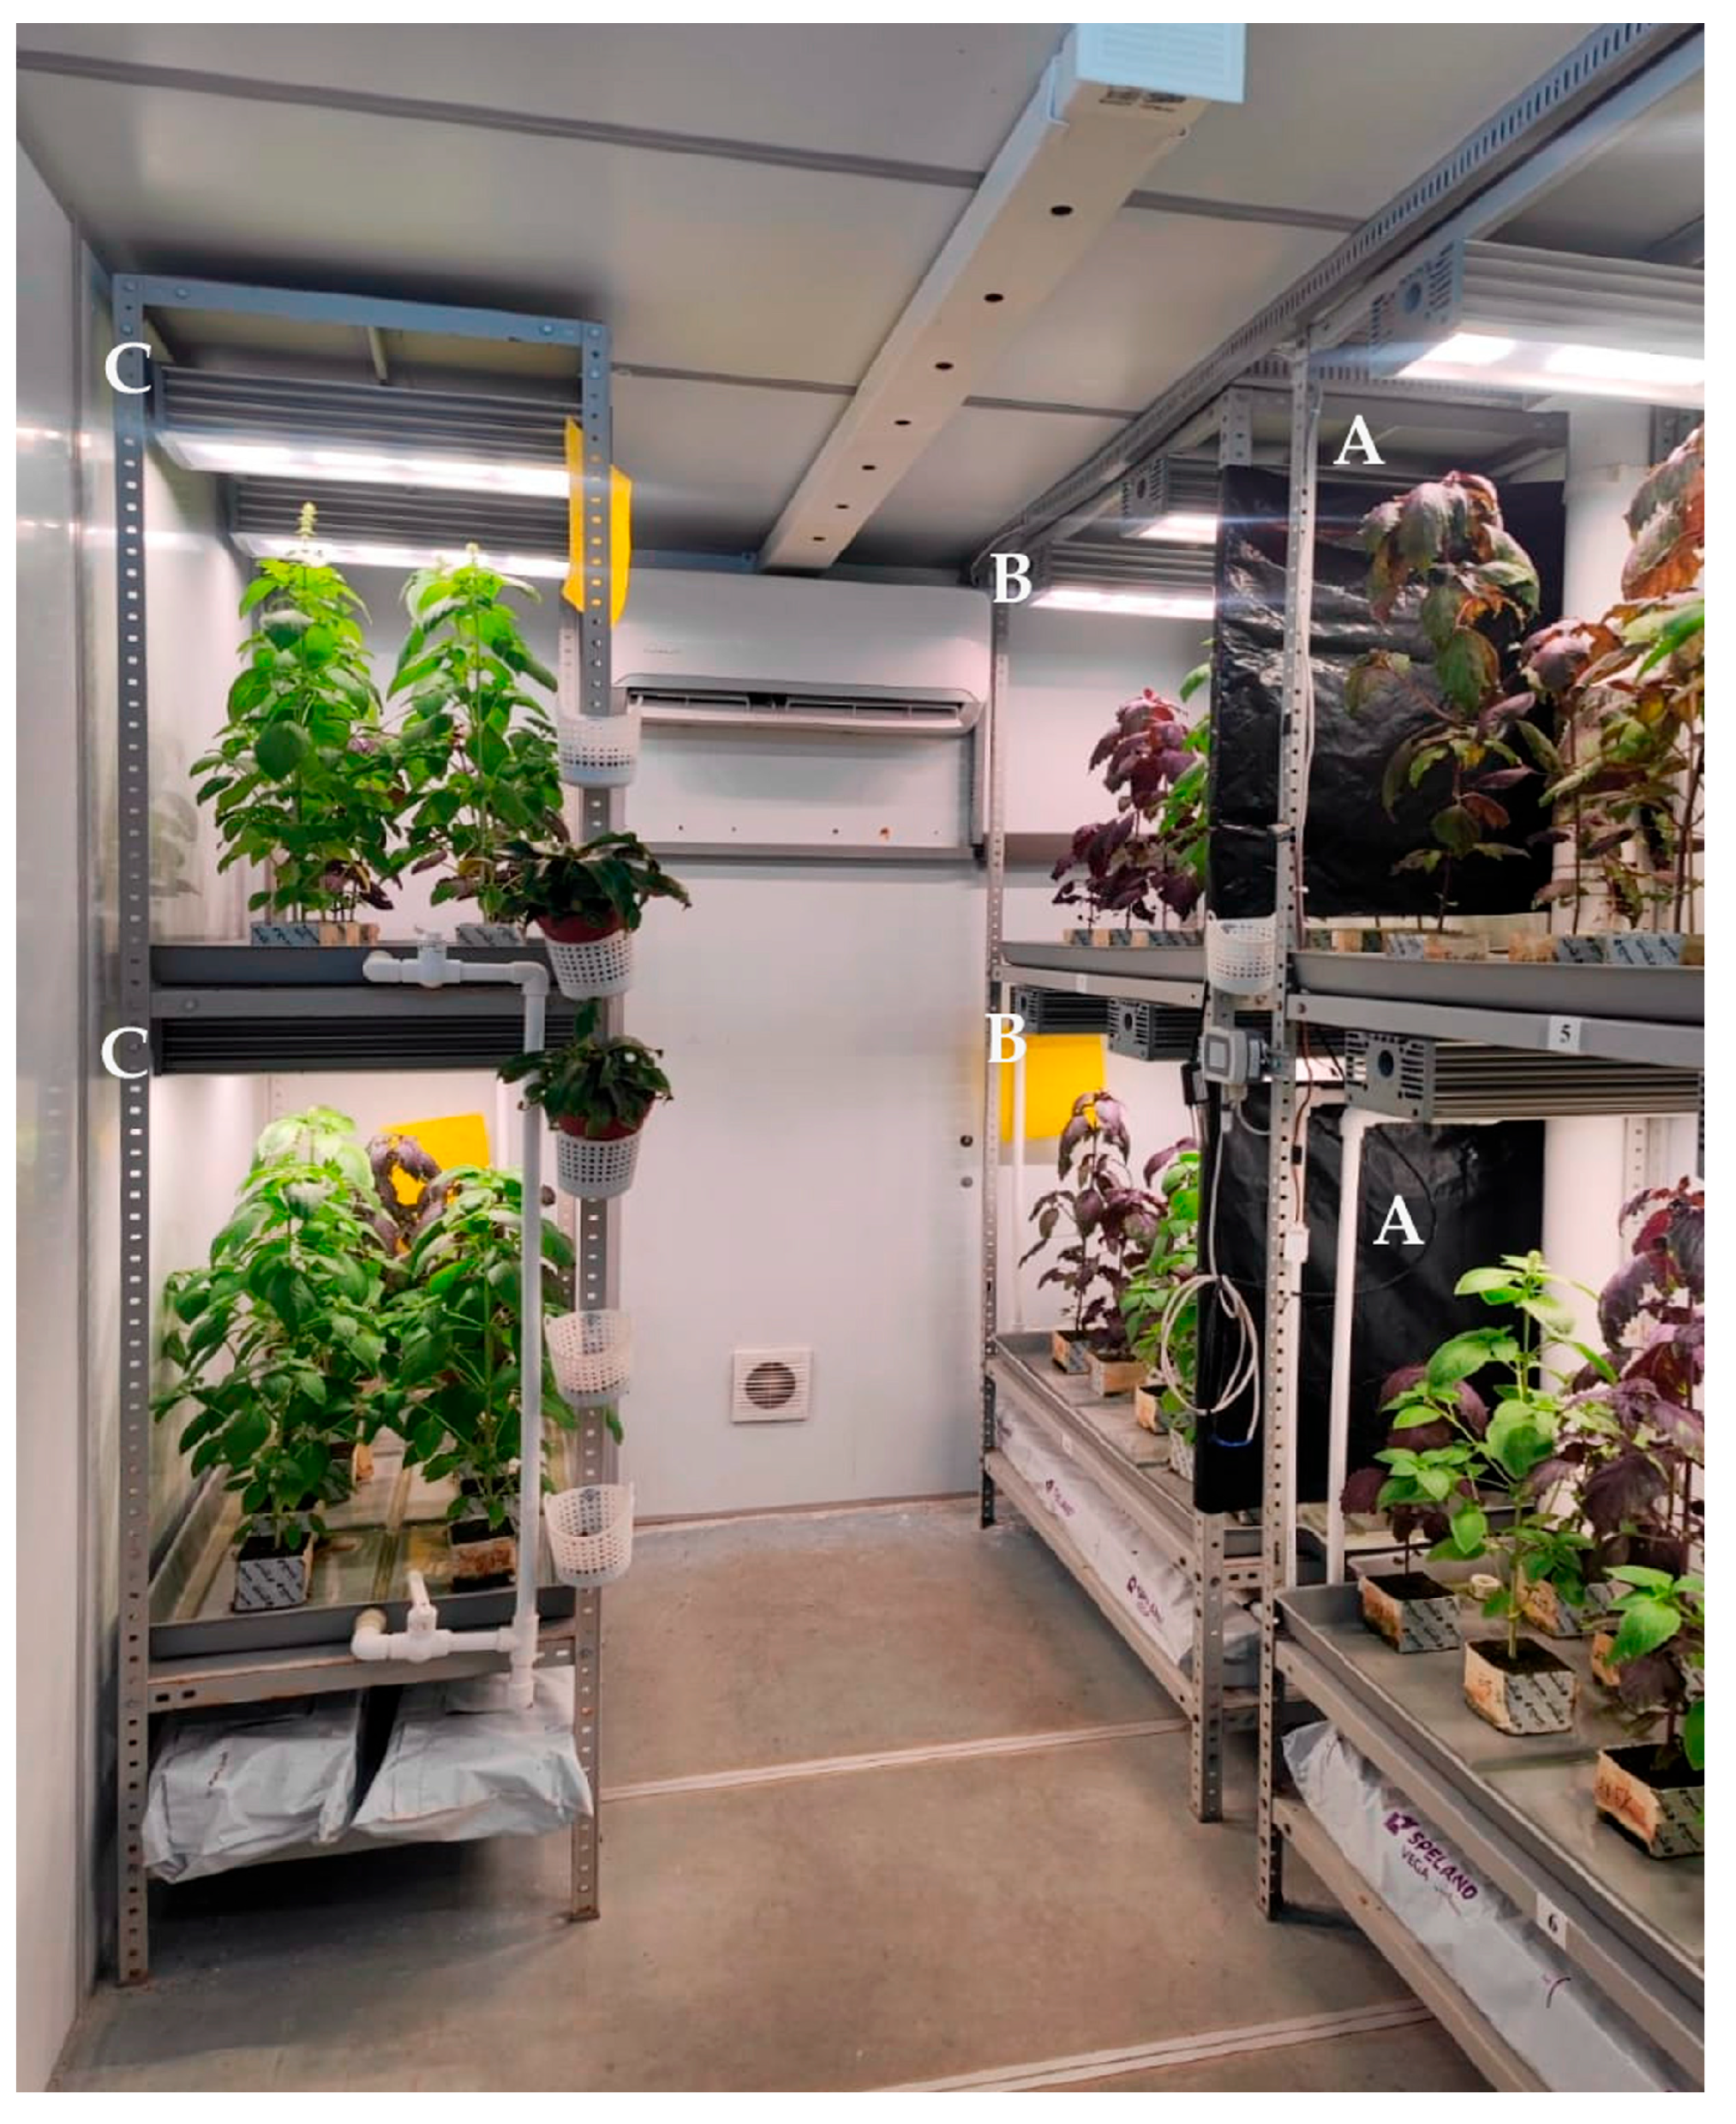
2.1. Plant Material and Cultivation Conditions

The study was conducted with the popular basil varieties ‘Ararat’ and ‘Tonus’ in 2024–2025 [32]. These varieties have valuable biological characteristics and are adapted for intensive cultivation. The growing period of varieties was from 71 to 76 days. The seeds were placed in mineral cotton cubes and grown hydroponically using low-volume technology in the climate chamber produced by the Federal Scientific Agroengineering Center VIM (Moscow, Russia). Ten plants were placed on 0.5 m2. The climate chamber was two-tiered and divided into three isolated compartments using reflective material (Figure 1).
The area of the climate chamber was 5 m2; the daytime temperature in the climate chamber at 16 h daylight hours and relative humidity of 65 ± 2% was + 23 ± 2 °C, and at night it was +17 ± 2 °C. Watering (360 mL per plant) was carried out daily once a day for 3 min. Nutrient solutions were prepared on the basis of GHE (General Hydroponics Europe, Fleurance, France) three-component fertilizers, with a pH of 5.8–6.2 and EC—1.12–1.26 PPM [33].

2.2. Light Conditions

In the experiment, three lighting options with two independent irradiation schemes were used.
The lighting options are as follows:
  • The light of white LEDs has a predominance of the green part of the spectrum. Photosynthetic photon flux density (PPFD) is ~139.9 µmol m−2·s−1 (Table 1). The color temperature of the white LEDs is 4000 K.
  • The light of white and blue LEDs. Photosynthetic photon flux density of the blue LED (PPFD) is ~50 µmol m−2·s−1, with a peak wavelength of 450 nm.
  • The light of white and red LEDs. Photosynthetic photon flux density of the red LED (PPFD) is ~50 µmol m−2·s−1, with a peak wavelength of 660 nm.
LEDs produced by Shenzhen Refond Optoelectronics Co., Ltd. (Shenzhen, China) were used.
The irradiation schemes are as follows.
  • Additional night exposure
During the basil growing period, the white LEDs and experimental versions worked 16 h/day (5 am–9 pm). After turning off the white LEDs, the blue (Blue-NLL) and red (Red-NLL) LEDs were turned on for 4 h/day from the second and three experimental versions (9 pm–1 am) (Figure S1).
  • Additional pre-harvest irradiation
At 14 days before harvest, blue (Blue-P-hLL) and red (Red-P-hLL) LEDs were turned on simultaneously with white lighting for 16 h/day in the experimental versions (5 am–9 pm) (Figure S2).
The radiation parameters are shown in Table 1. Measurements of the photon flux density and the spectral composition of the radiation were carried out using a PD200N compact spectrophotometer (UPRtek Corp. Miaoli County, Taiwan) in five repetitions.

2.3. Biometric Indicators

The height of the plants was measured in the period of intensive shoots growth from the tip of the shoot to the substrate with a technical ruler with an accuracy of 0.1 mm. The leaf area was determined using a LI-3100 AREA METER photoplanimeter (LI-COR, Lincoln, NC, USA). The number of leaves on a plant was determined visually by counting. The raw leaves (raw plant biomass) and yield were weighed on an EX224/AD analytical balance (OHAUS, Parsippany, NJ, USA) with three repetitions (the number of registered plants (n) was four plants).

2.4. The Content of Chlorophyll and Carotenoids in the Leaves

The pigment content was determined in a 0.1 g crude sample in an acetone extract (98%) using a UV-2200 dual-beam UV/VIS spectrophotometer (Jiuxin Group, Shanghai, China) with three repetitions (n = 6). The content of chlorophyll a (Chl a) and chlorophyll b (Chl b) was determined at λ = 662 nm and λ = 644 nm, respectively. Carotenoids (C car) were determined at λ = 440.5 nm.
Formulas (1)–(4) were used for the calculation [34,35].
C h l   a = 9.784 · D 662 0.990 · D 644
C h l   b = 21.426 · D 644 4.650 · D 662
C h l   a + b = 5.134 · D 662 + 20.436 · D 644
C   c a r = 4.694 · D 440.5 0.268 · C h l   a + C h l   b
where Chl a is the concentration of chlorophyll a (g·L−1); Chl b is the concentration of chlorophyll b (g·L−1); Chl a + b is total chlorophyll (g·L−1); C car is the concentration of carotenoids (g·L−1); A662 is the optical density of the solution at λ = 662 nm; A644 is the optical density of the solution at λ = 644 nm; and A440.5 is the optical density of the solution at λ = 440.5 nm.
The pigment content in the plant sample was determined by Formula (5) [34].
A = C · V P · 1000
where A is the pigment content in the plant sample, mg·g−1; C is the concentration of pigments in mg·L−1; V is the extract volume, ml; and P is the weight of the leaf sample, g.

2.5. The Content of Macronutrients and Nitrates in the Leaves

The content of macronutrients (potassium (K), magnesium (Mg), calcium (Ca), sulphur (S), phosphorus (P)), and nitrates (NO3) was determined using the ‘DROPS—205’ capillary electrophoresis system (LUMEX Company, St. Petersburg, Russia) with three repetitions (n = 4) [36,37]. To determine macronutrients, plant samples were dried and fired in a muffle furnace at 450 °C. The firing was carried out gradually, with the furnace temperature increasing by 50 °C every 30 min. The total mineralization time was 8 h. Crucibles with ash were cooled to room temperature, and then HNO3 was added and evaporated at 140 °C. The white ash was dissolved by heating in HNO3 (1:1), evaporation was carried out, and the precipitate was dissolved in 25 mL3 of 1% HNO3, after which distilled water was added until a pH of ≥4 was obtained. The capillary electrophoresis system was calibrated using standard solutions of different concentrations of each of the cations and anions.

2.6. The Content of Essential Oil in the Leaves

The content of essential oil in the extracts was determined by n-hexane from the leaves of the shoots of the first order with three repetitions (n = 4) [1,38]. The leaf suspension was cooled and fixed with liquid nitrogen, and then C6H14 was extracted with Na2SO4, after which the extract was filtered. The extracts were examined on an Agilent Technologies 6890N gas chromatograph with an MSD 5975B mass-selective detector (Santa Clara, CA, USA). The content of essential oils was identified from the NIST 14 mass spectrum library. The content of essential oil components was calculated by the method of internal normalization of peak areas. For the quantitative determination of basil essential oils, a hexadecane solution was introduced as an internal standard.

2.7. The Content of Quercetin and Rosmarinic Acid in the Leaves

An LC-20A liquid chromatograph (Shimadzu, Kyoto, Japan) was used to determine the content of quercetin and rosmarinic acid. The separation was carried out on a column C18 Luna 250 × 4.6 mm with a particle size of 5 microns (Phenomenex, Torrace, CA, USA). The measurements were carried out at a wavelength of 365 nm, and the column temperature was 38 °C. CH3CN and 0.1% H3PO4 were used at a ratio of 30%:70%) with three repetitions (n = 3) [39]. For rosmarinic acid, the determination was carried out in the mode of gradient elution (extraction). The separation took place on an ODS Hypersil 250 × 4.6 mm column (Thermo Scientific, Waltham, MA, USA). The measurement was carried out at a wavelength of 330 nm. CH3CN and H3PO4 with pH = 2.5 were used.
Biochemical studies and the elemental composition of the vegetative parts of the plants were carried out during the flowering period of basil varieties.

2.8. Statistical Data Analysis

The initial data was analyzed by the method of variance analysis (ANOVA) using the software package SPSS version 22.0 and Microsoft Excel 2016. To determine the statistical significance between the experimental variants, Tukey’s test was used (p < 0.05). The test was separately calculated for each culture. Multivariate statistical analyses were performed using R software (version 4.3.3). Correlation matrices were visualized using the corrplot package [40], while principal component analysis (PCA) was conducted using the principal component function on scaled data. Biplots were generated with the factoextra [41] and ggfortify [42] packages to interpret the relationships among variables and to visualize treatment and genotype groupings in two-dimensional space. fviz_pca_biplot was used for PCA visualization. fviz_pca_biplot is a function that combines some elements that were obtained in the process of PCA. Variable contributions to the first two principal components were extracted and plotted to assess dimensional influence.

3. Results

3.1. The Effect of Nighttime Spectral Irradiation on the Economically Valuable Traits of Basil Plants

3.1.1. Morphometric Parameters of Plants

The effect of the variety and additional nighttime spectral irradiation on the morphometric parameters of plants was confirmed. Red-NLL lighting stimulated the growth processes of ‘Ararat’ basil plants, and Blue-NLL stimulated the growth processes of ‘Tonus‘ (Figure 2A). The length of the shoots of these plants differed by more than 60.90 Cm from those grown under white light. The maximum number of leaves and their large area, as well as the biomass of plants, were in the variant with Red-NLL, regardless of the varietal characteristics (Figure 2B–D). The differences in the morphometric parameters of the varieties in the Red-NLL variant were 47.82% higher compared to white light, and in the Blue-NLL variant, they were 30.55% higher compared to white.
The data on vegetative productivity in basil varieties were comparable with the data on plant biomass, and the highest values were also obtained under Red-NLL lighting. However, variety specificity was revealed in relation to Blue-NLL irradiation. For ‘Ararat’, exposure to a blue LED reduced productivity by 0.13 kg·m2 compared to a white LED and by 0.33 kg·m2 compared to a red LED (Figure 2E).

3.1.2. The Content of Photosynthetic Pigments and Macronutrients in Leaves

There was no significant effect of Blue-NLL and Red-NLL illumination on the photosynthetic pigment content. The maximum accumulation of Chl a and Chl (a + b) was when irradiated with a white LED, and it did not depend on the variety (Table 2). A slight increase in Chl b content and the maximum Car content were found in ‘Tonus’ in the Blue-NLL variant.
Additional nighttime LED lighting affected the content of certain macronutrients in basil varieties. The maximum Na accumulation for the varieties was in the variant with Blue-NLL (Table 3).
The K and Mg content depended on the variety and type of LED. For ‘Ararat’, the maximum K accumulation was in the variant with Red-NLL, and Mg accumulation was in the variant with Blue-NLL; for ‘Tonus’, the high K content was in the variant with Blue-NLL illumination, and the Mg content was in the variant with a white LED.
There was a tendency to decrease the Ca, S, and P content in the leaves of basilica varieties under the influence of Red-NLL and Blue-NLL in comparison with the white LED. On average, a decrease of 17.99% in the Ca content, 15.67% in the S content, and 17.79% in the P content in leaves was recorded in comparison to the white light.

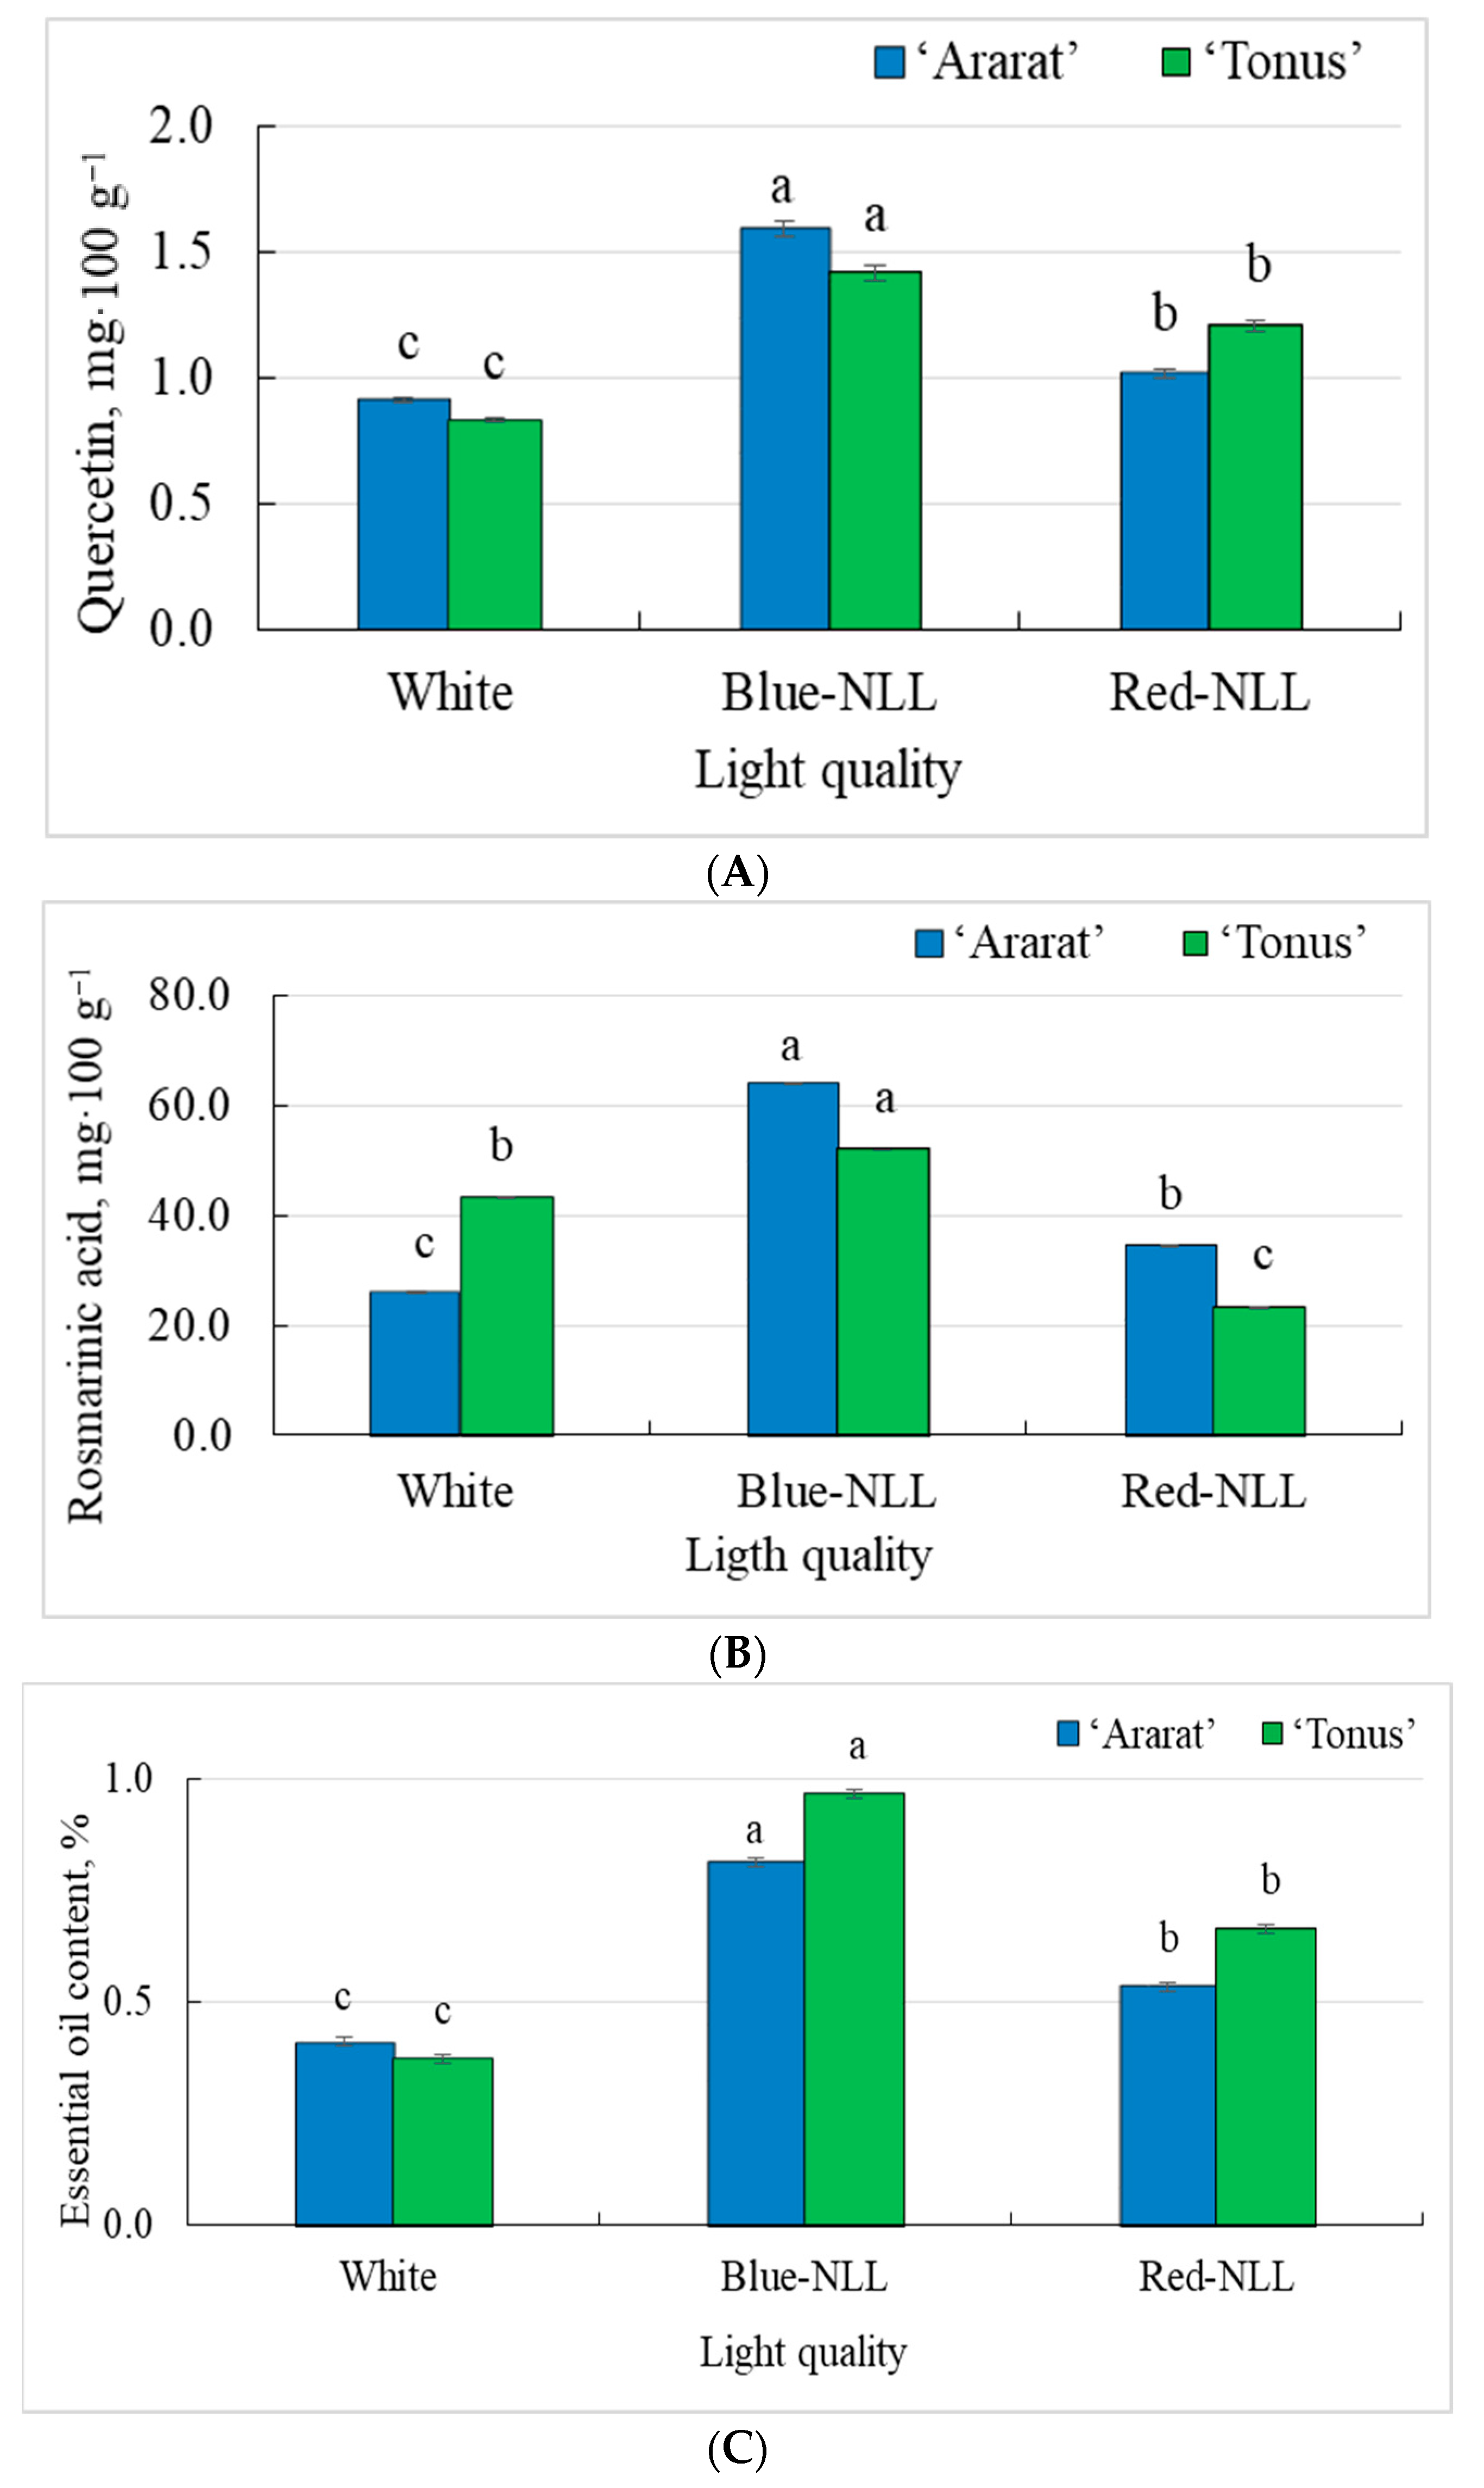
3.1.3. The Content of Quercetin, Rosmarinic Acid, and Essential Oil in the Vegetative Mass of Plants

Additional Blue-NLL lighting increased the content of quercetin and rosmarinic acid in the leaves of basil varieties. The concentration of quercetin increased from 0.83 mg·100−1 g under white lighting to 1.59 mg·100−1 g under Blue-NLL. Red-NLL also increased the content of quercetin, but to a lesser extent: up to 1.21 mg·100−1 g (Figure 3A).
The content of rosmarinic acid increased from 26.03 mg·100−1 g to 63.90 mg·100−1 g for ‘Ararat’. However, an increase in rosmarinic acid content was only observed in the variant with Blue-NLL for ‘Tonus’ (Figure 3B).
The maximum increase in essential oils in the studied varieties was obtained in the variant with Blue-NLL. In ‘Ararat’, the increase in essential oil compared to the white LED was 49.38%, and in ‘Tonus’, it was 61.47%. Additional Red-NLL lighting also increased the content of essential oils, but its effect was less effective compared to Blue-NLL (Figure 3C). The obtained result is explained by the role of the blue spectrum in the activity of enzymes involved in the formation of essential compounds, while the red spectrum contributes more to the accumulation of biologically active substances and enhances growth processes in the plant [33].

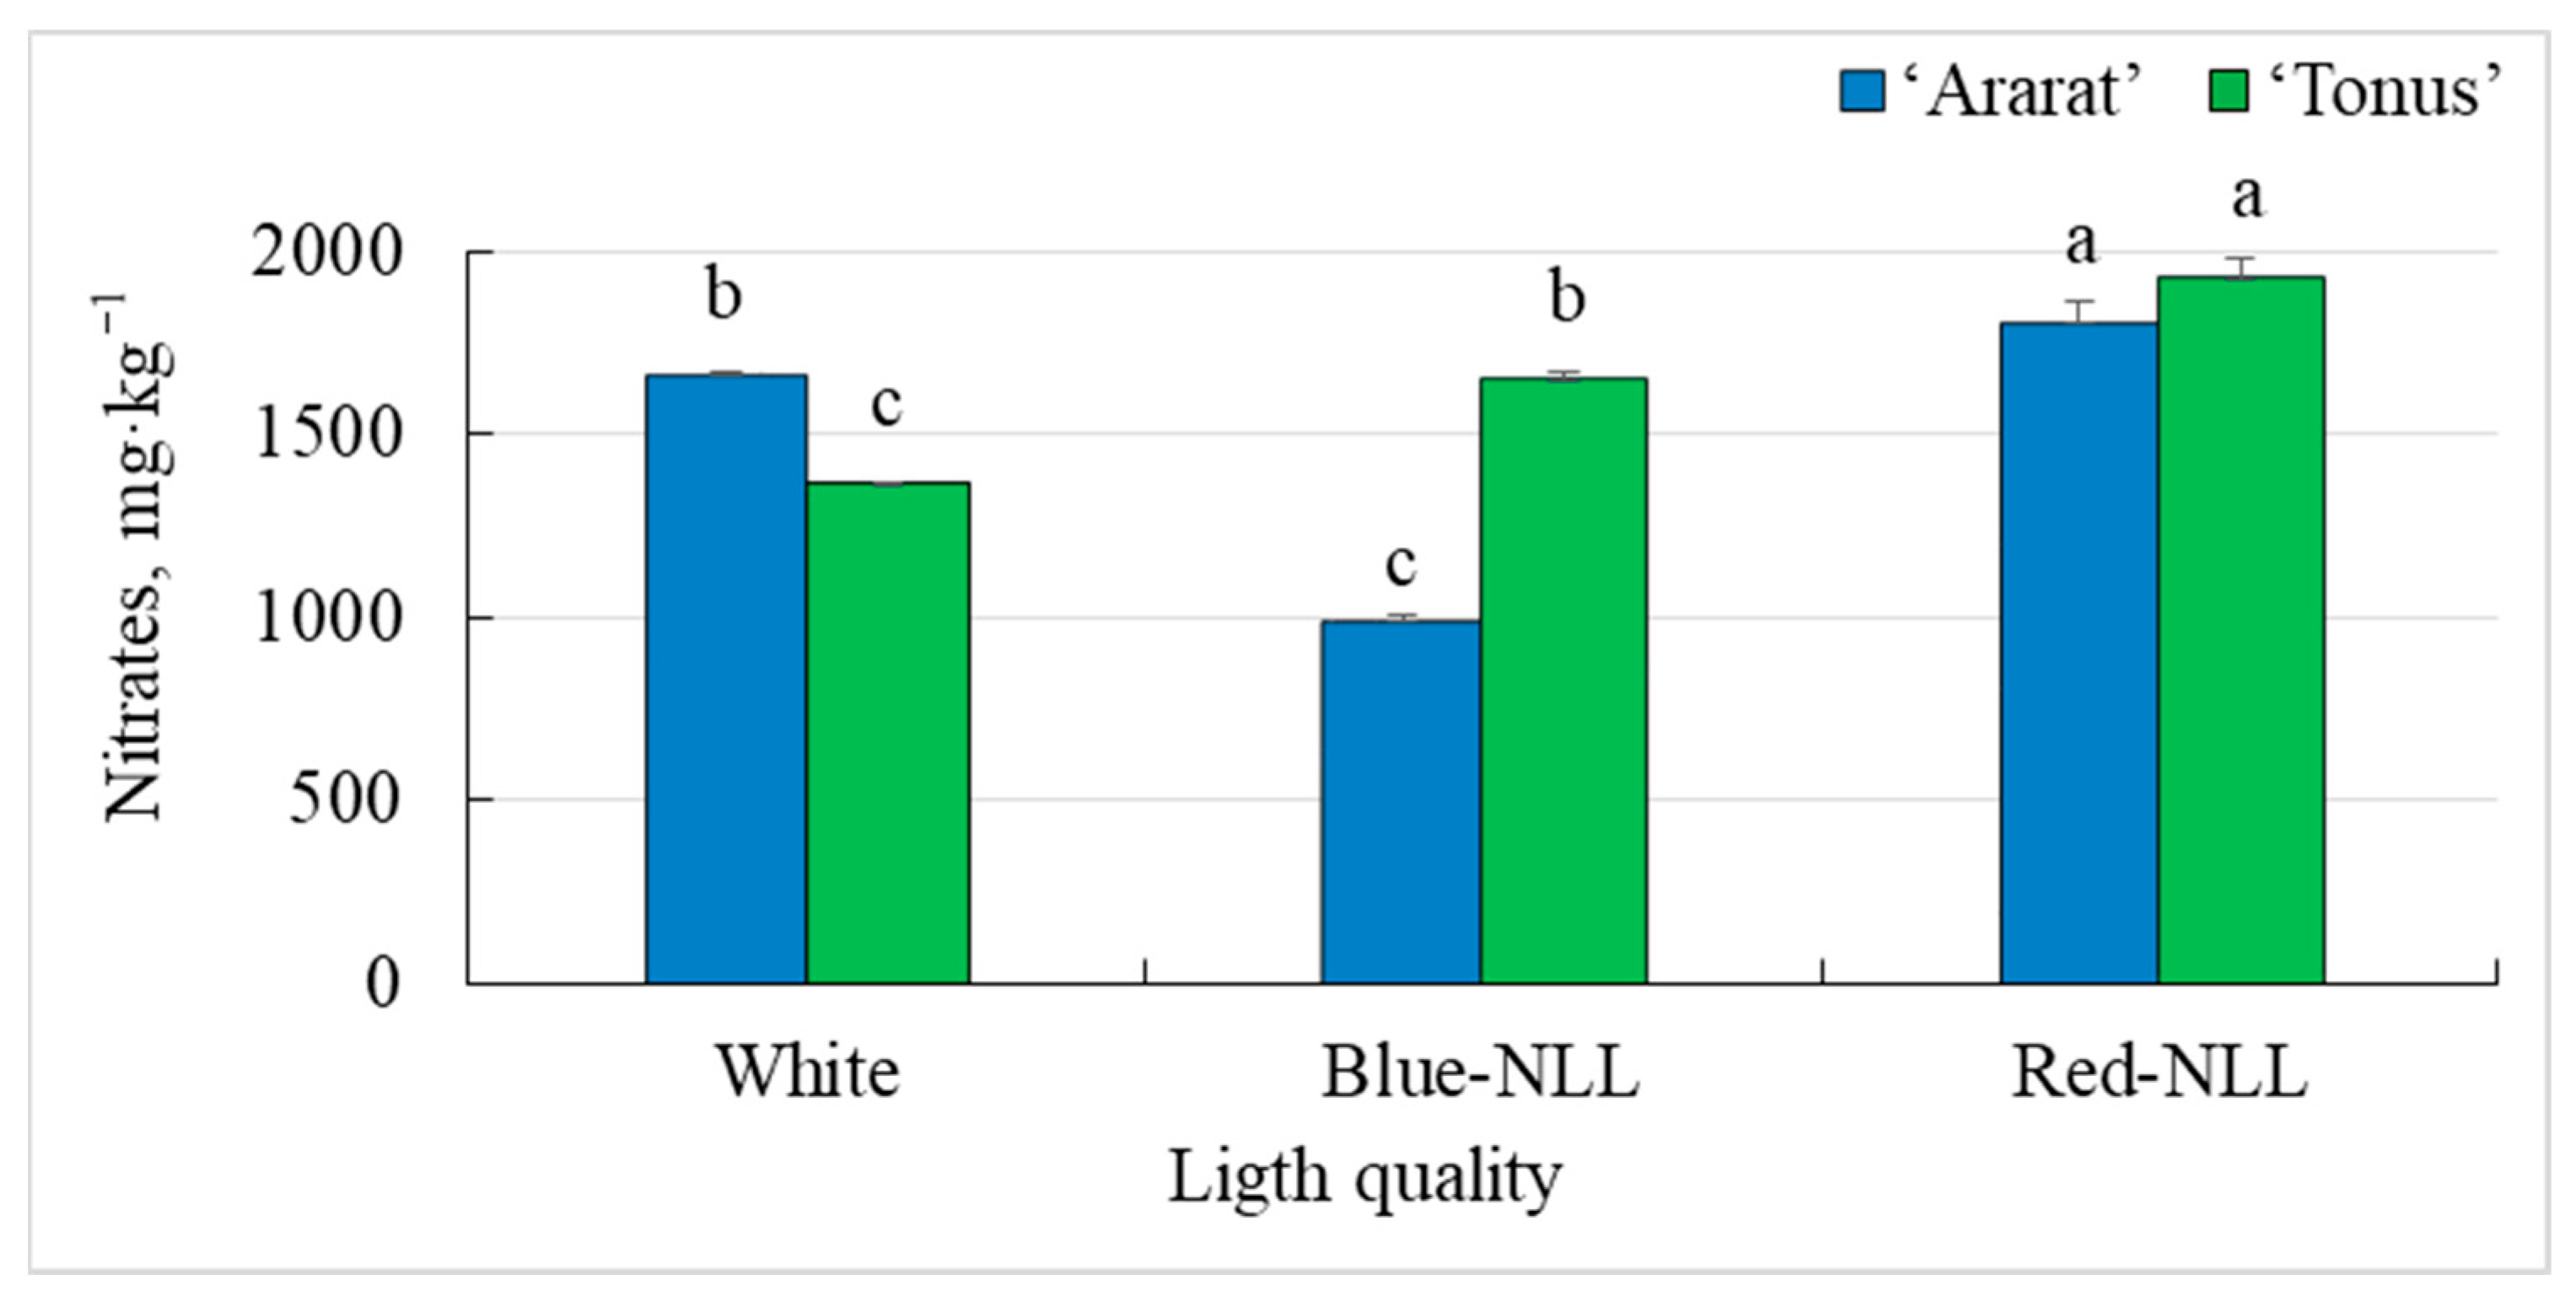
3.1.4. Nitrate Content in the Vegetative Part of Plants

A significant decrease in nitrates, as a toxic element for humans, was revealed in basil varieties under the influence of Blue-NLL (Figure 4).
At the same time, the maximum decrease was in ‘Ararat’. The nitrate content in the Red-NLL variant of the studied varieties was higher than in the white and in the Blue-NLL variant. However, the total nitrate content in both the white LED and experimental versions did not exceed the maximum permissible concentrations (2000 mg·kg−1) [43], and the consumption of vegetative mass of these varieties did not pose a threat to human health.

3.2. The Effect of Pre-Harvest Irradiation on the Economically Valuable Characteristics of Basil Plants

3.2.1. Morphological Parameters of Plants

The height of the plants with additional pre-harvest irradiation was higher in both varieties compared to the white LED. The height of the green and purple basil plants did not differ significantly when irradiated with red and blue LEDs (Figure 5A and Figure S3). Variety specificity was revealed in relation to the number and area of leaves and plant biomass. ‘Tonus’ had significantly high values for these parameters when irradiated with a white LED, and ‘Ararat’ had high values when irradiated with Red-P-hLL (Figure 5B–D).
The data on vegetative productivity were comparable to previous data on plant biomass. ‘Tonus’ had high productivity when irradiated with a white LED. Vegetative productivity under the white light was 45.41% higher than in the plants grown under Blue-P-hLL. It was also 25.87% higher than in the plants grown under red-P-hLL. In ‘Ararat’, vegetative productivity in the Red-P-hLL variant exceeded the white LED by 37.27% and in the Blue-P-hLL variant by 20.31% (Figure 5E).

3.2.2. The Content of Photosynthetic Pigments and Macronutrients in Leaves

In the leaves of basil ‘Tonus’, irradiation with Blue-P-hLL provided a slight increase in the photosynthetic pigment content. However, for ‘Ararat’, additional irradiation with Blue-P-hLL and Red-P-hLL LEDs reduced the accumulation of chlorophyll and carotenoids by 20.36% and 10.41%, respectively, compared to white (Table 4).
For the studied varieties, additional pre-harvest illumination with red and blue spectra at this stage of development is not an important element of technology that enhances the photosynthesis process.
Table 5 shows the elemental composition of basil leaves under the influence of light treatments during the pre-harvest period.
Additional lighting spectra were important factors influencing the accumulation of individual macronutrients. The irradiation with Blue-P-hLL increased Mg, Ca, and S content in ‘Tonus’. Red-P-hLL also increased Na, Mg, Ca, S, and P content in ‘Ararat’. K content increased under both lighting variants.

3.2.3. The Content of Quercetin, Rosmarinic Acid, and Essential Oil in the Vegetative Mass of Plants

Statistically significant differences were revealed for the studied varieties in the content of biologically active substances in the basil biomass with additional Blue-P-hLL lighting compared to white light. The blue irradiation increased the content of quercetin by more than 30.00% compared to the white and Red-P-hLL illumination. On average, the content of rosmarinic acid in the Blue-P-hLL variant exceeded the white variant by 37.50% and the Red-P-hLL variant by 57.65% (Figure 6).
Additional pre-harvest illumination with blue and red spectra stimulated the synthesis of essential oils in basil varieties. As can be seen in Figure 6C, the illumination with Blue-P-hLL increased the essential oil content by 55.58% compared to the white and by 34.44% compared to the Red-P-hLL variant.

3.2.4. Nitrate Content in the Vegetative Part of Plants

Optimally selected percentages of blue, green, and red LED spectra reduce the concentration of nitrates in the vegetative parts of basil plants (Figure 7).
The minimum nitrate content was under Red-P-hLL lighting. In general, the nitrate content under additional pre-harvest lighting was within the permissible concentration limit (2000 mg·kg−1). However, the long-term influence of the white LED increased the nitrate content in ‘Ararat’ up to 1971.64 mg·kg−1, and this value was approaching a dangerous indicator for human health.

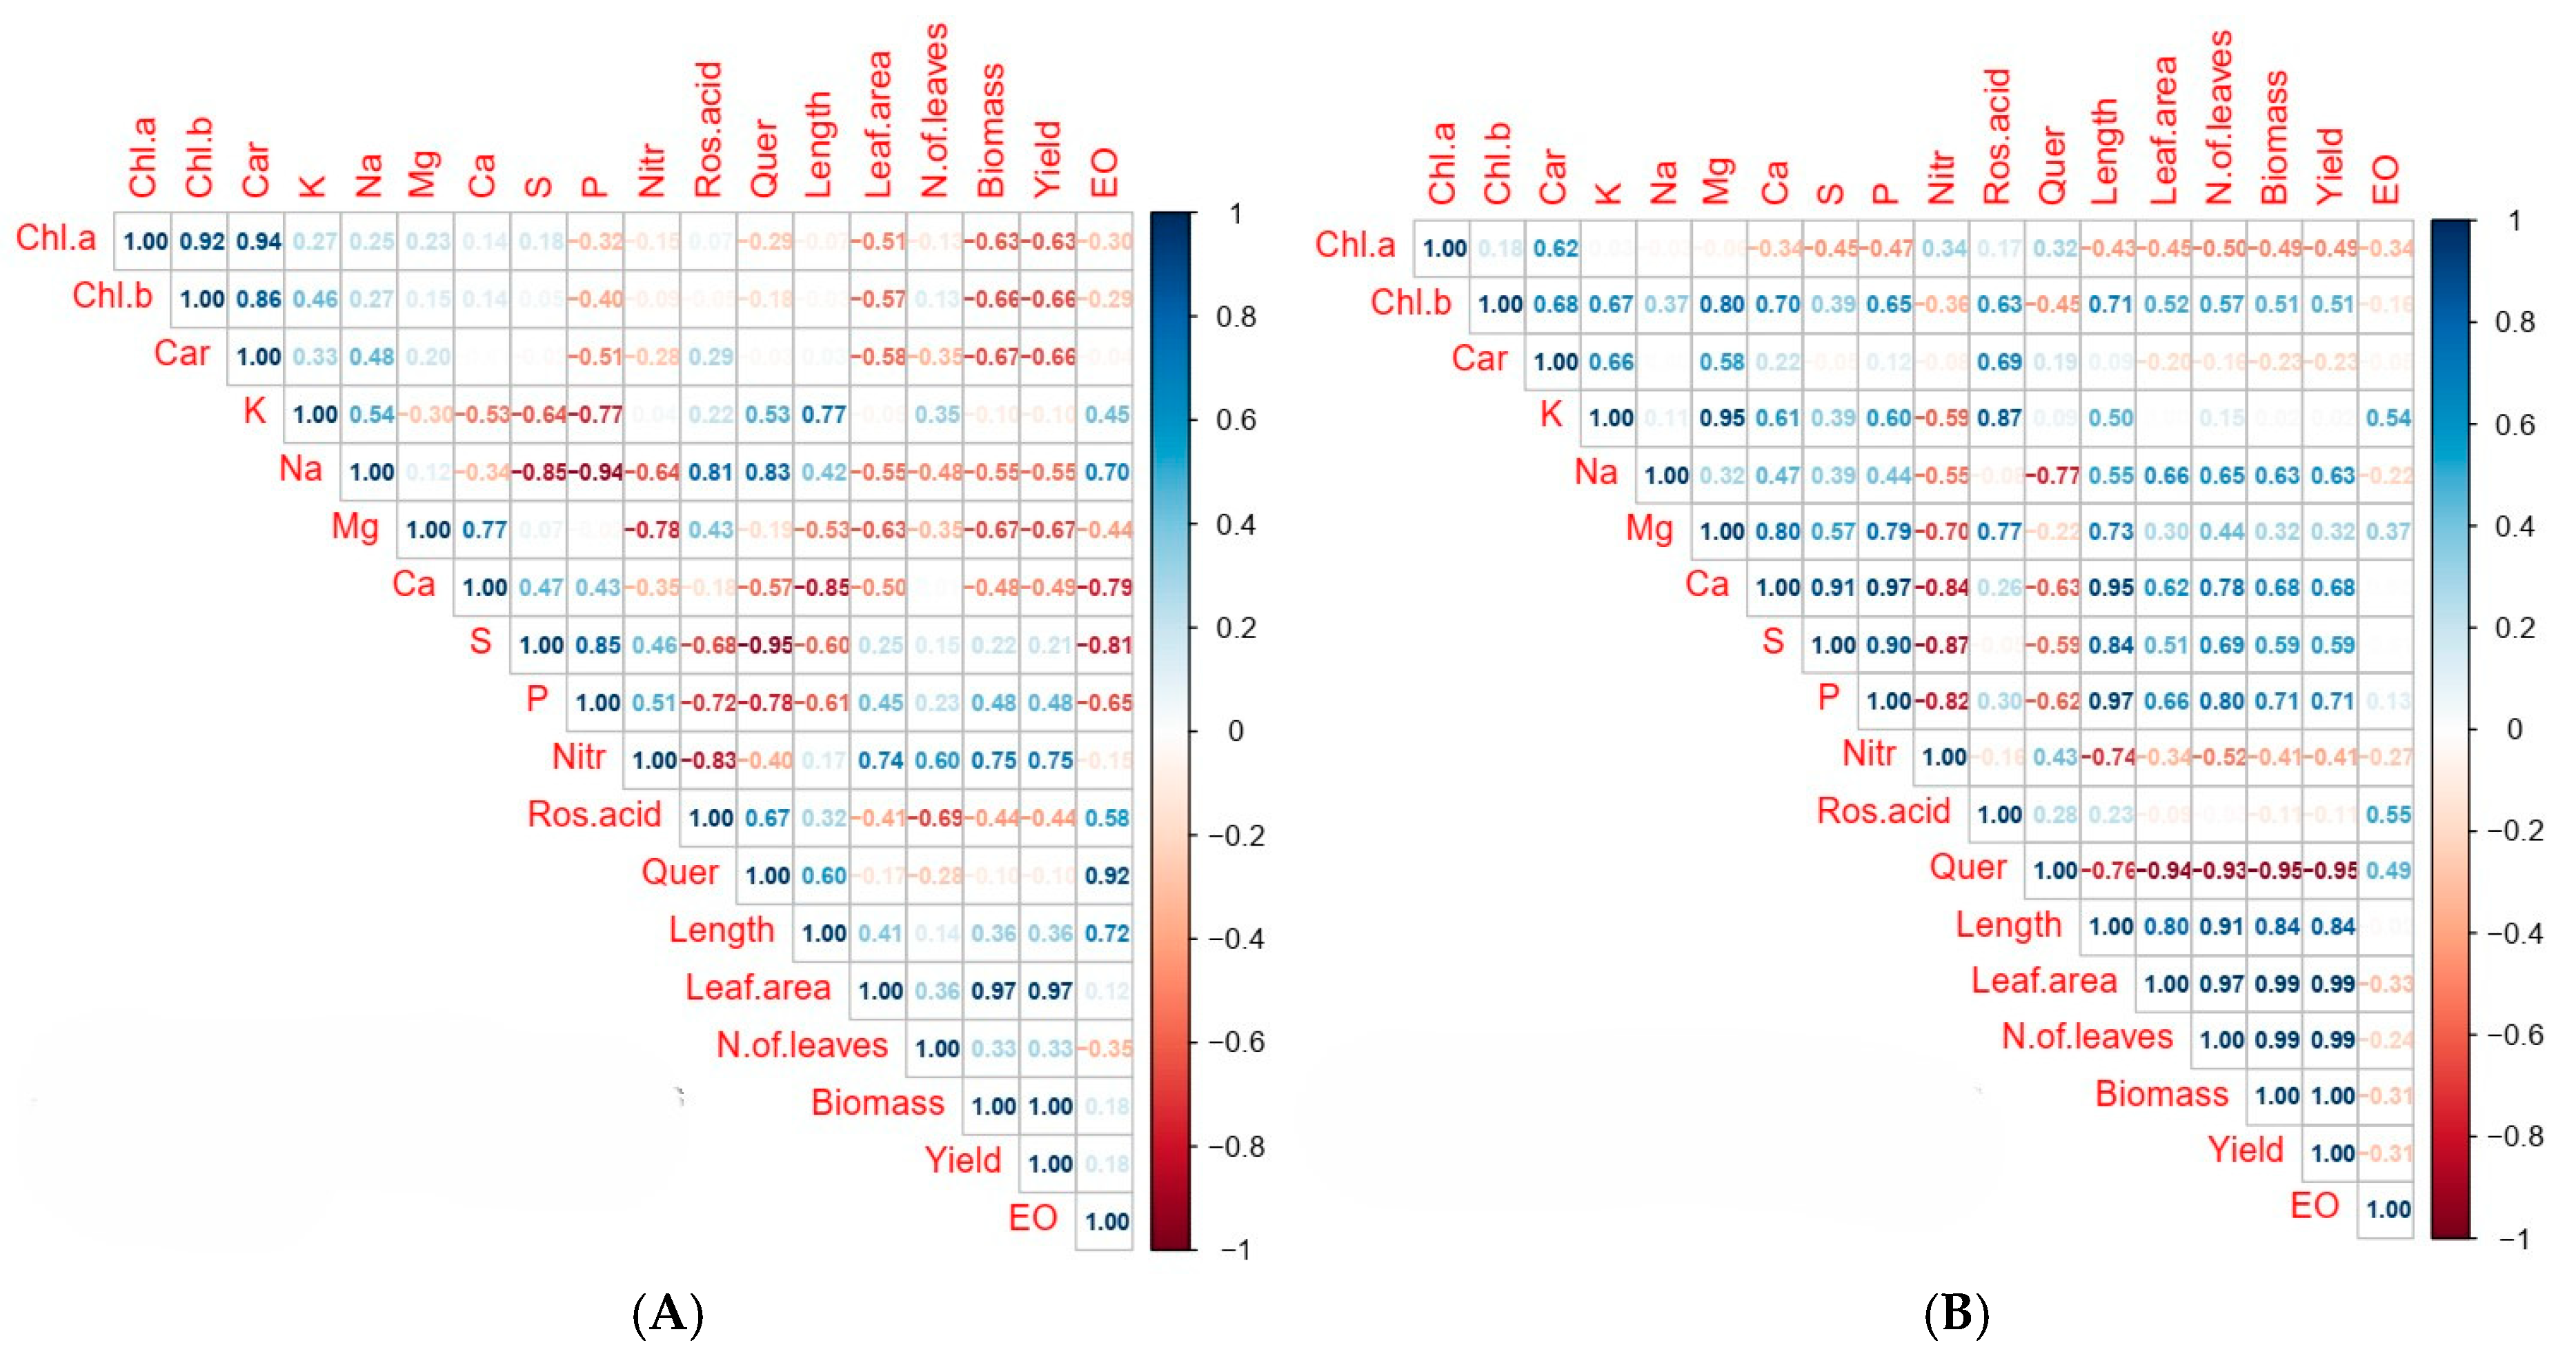
3.3. Correlation Analysis Among Morphophysiological and Biochemical Traits Under LED Lighting Treatments

To further understand the relationships among the morphophysiological and biochemical traits of basil plants under different LED lighting treatments, a correlation matrix was generated for the night (Figure 8A) and pre-harvest (Figure 8B) lighting periods.

LED Lighting

Under night LED lighting (Figure 8A), strong positive correlations were observed among growth-related parameters, such as leaf area, number of leaves, biomass, and yield (r = 0.97–1.00). These parameters were also significantly positively correlated with P and nitrate contents, suggesting that nutrient accumulation plays an essential role in biomass production during nighttime LED exposure. Notably, essential oil (EO) content exhibited a weak or negligible positive/negative correlation with most vegetative growth parameters: biomass (r = 0.18), number of leaves (r = −0.35), and yield (r = 0.18). Additionally, EO was negatively correlated with nitrate (r = −0.15). Rosmarinic acid and quercetin levels were positively correlated (r = 0.67), and both had moderate to strong negative correlations with nitrate content (r = −0.83 and −0.40, respectively), supporting their role as indicators of improved phytochemical quality under reduced nitrate levels. Photosynthetic pigments (Chl a, Chl b, and Car) were positively interrelated (r = 0.86–0.92) but showed negative or weak correlations with most morphological or productivity-related traits.
Under pre-harvest LED lighting (Figure 8B), the correlation structure among parameters revealed a highly coordinated response of basil plants. Growth-related traits such as plant length, leaf area, number of leaves, biomass, and yield exhibited very strong positive correlations with each other (r = 0.80–0.99), indicating a synchronized development of vegetative growth and productivity under pre-harvest lighting conditions. The essential oil (EO) content under pre-harvest and night lighting illuminations showed moderate positive correlations with rosmarinic acid (r = 0.55) and nutrient K (r = 0.54), while its relationship with yield and biomass was weak to negligible (r = −0.31). This suggests that essential oil synthesis under pre-harvest lighting is more aligned with phytochemical activity than with vegetative development. Notably, quercetin was strongly negatively associated with growth traits, including leaf area (r = −0.94), number of leaves (r = −0.93), biomass (r = −0.95), and yield (r = −0.95), indicating a clear trade-off between antioxidant compound production and vegetative yield during the final stages of plant development.
Among nutrients, Ca displayed moderate positive correlations with plant length (r = 0.95), leaf area (r = 0.62), biomass (r = 0.68), and yield (r = 0.68), indicating its central role in pre-harvest growth and productivity. Other macronutrients, such as P and S, were highly correlated with each other (r = 0.51–0.97) and moderately to strongly associated with growth traits. Photosynthetic pigments, especially Chl a and Chl b, were positively correlated with carotenoids (r = 0.62–0.68) and showed slight positive associations with nitrate (r = 0.34 for Chl a). However, their correlations with EO content were limited, suggesting that pigment synthesis and EO biosynthesis are not directly interlinked under pre-harvest LED treatment.
These results indicate that both lighting periods influence not only individual traits but also the relationships among traits, with stronger integration of growth and quality parameters observed under pre-harvest LED treatments.

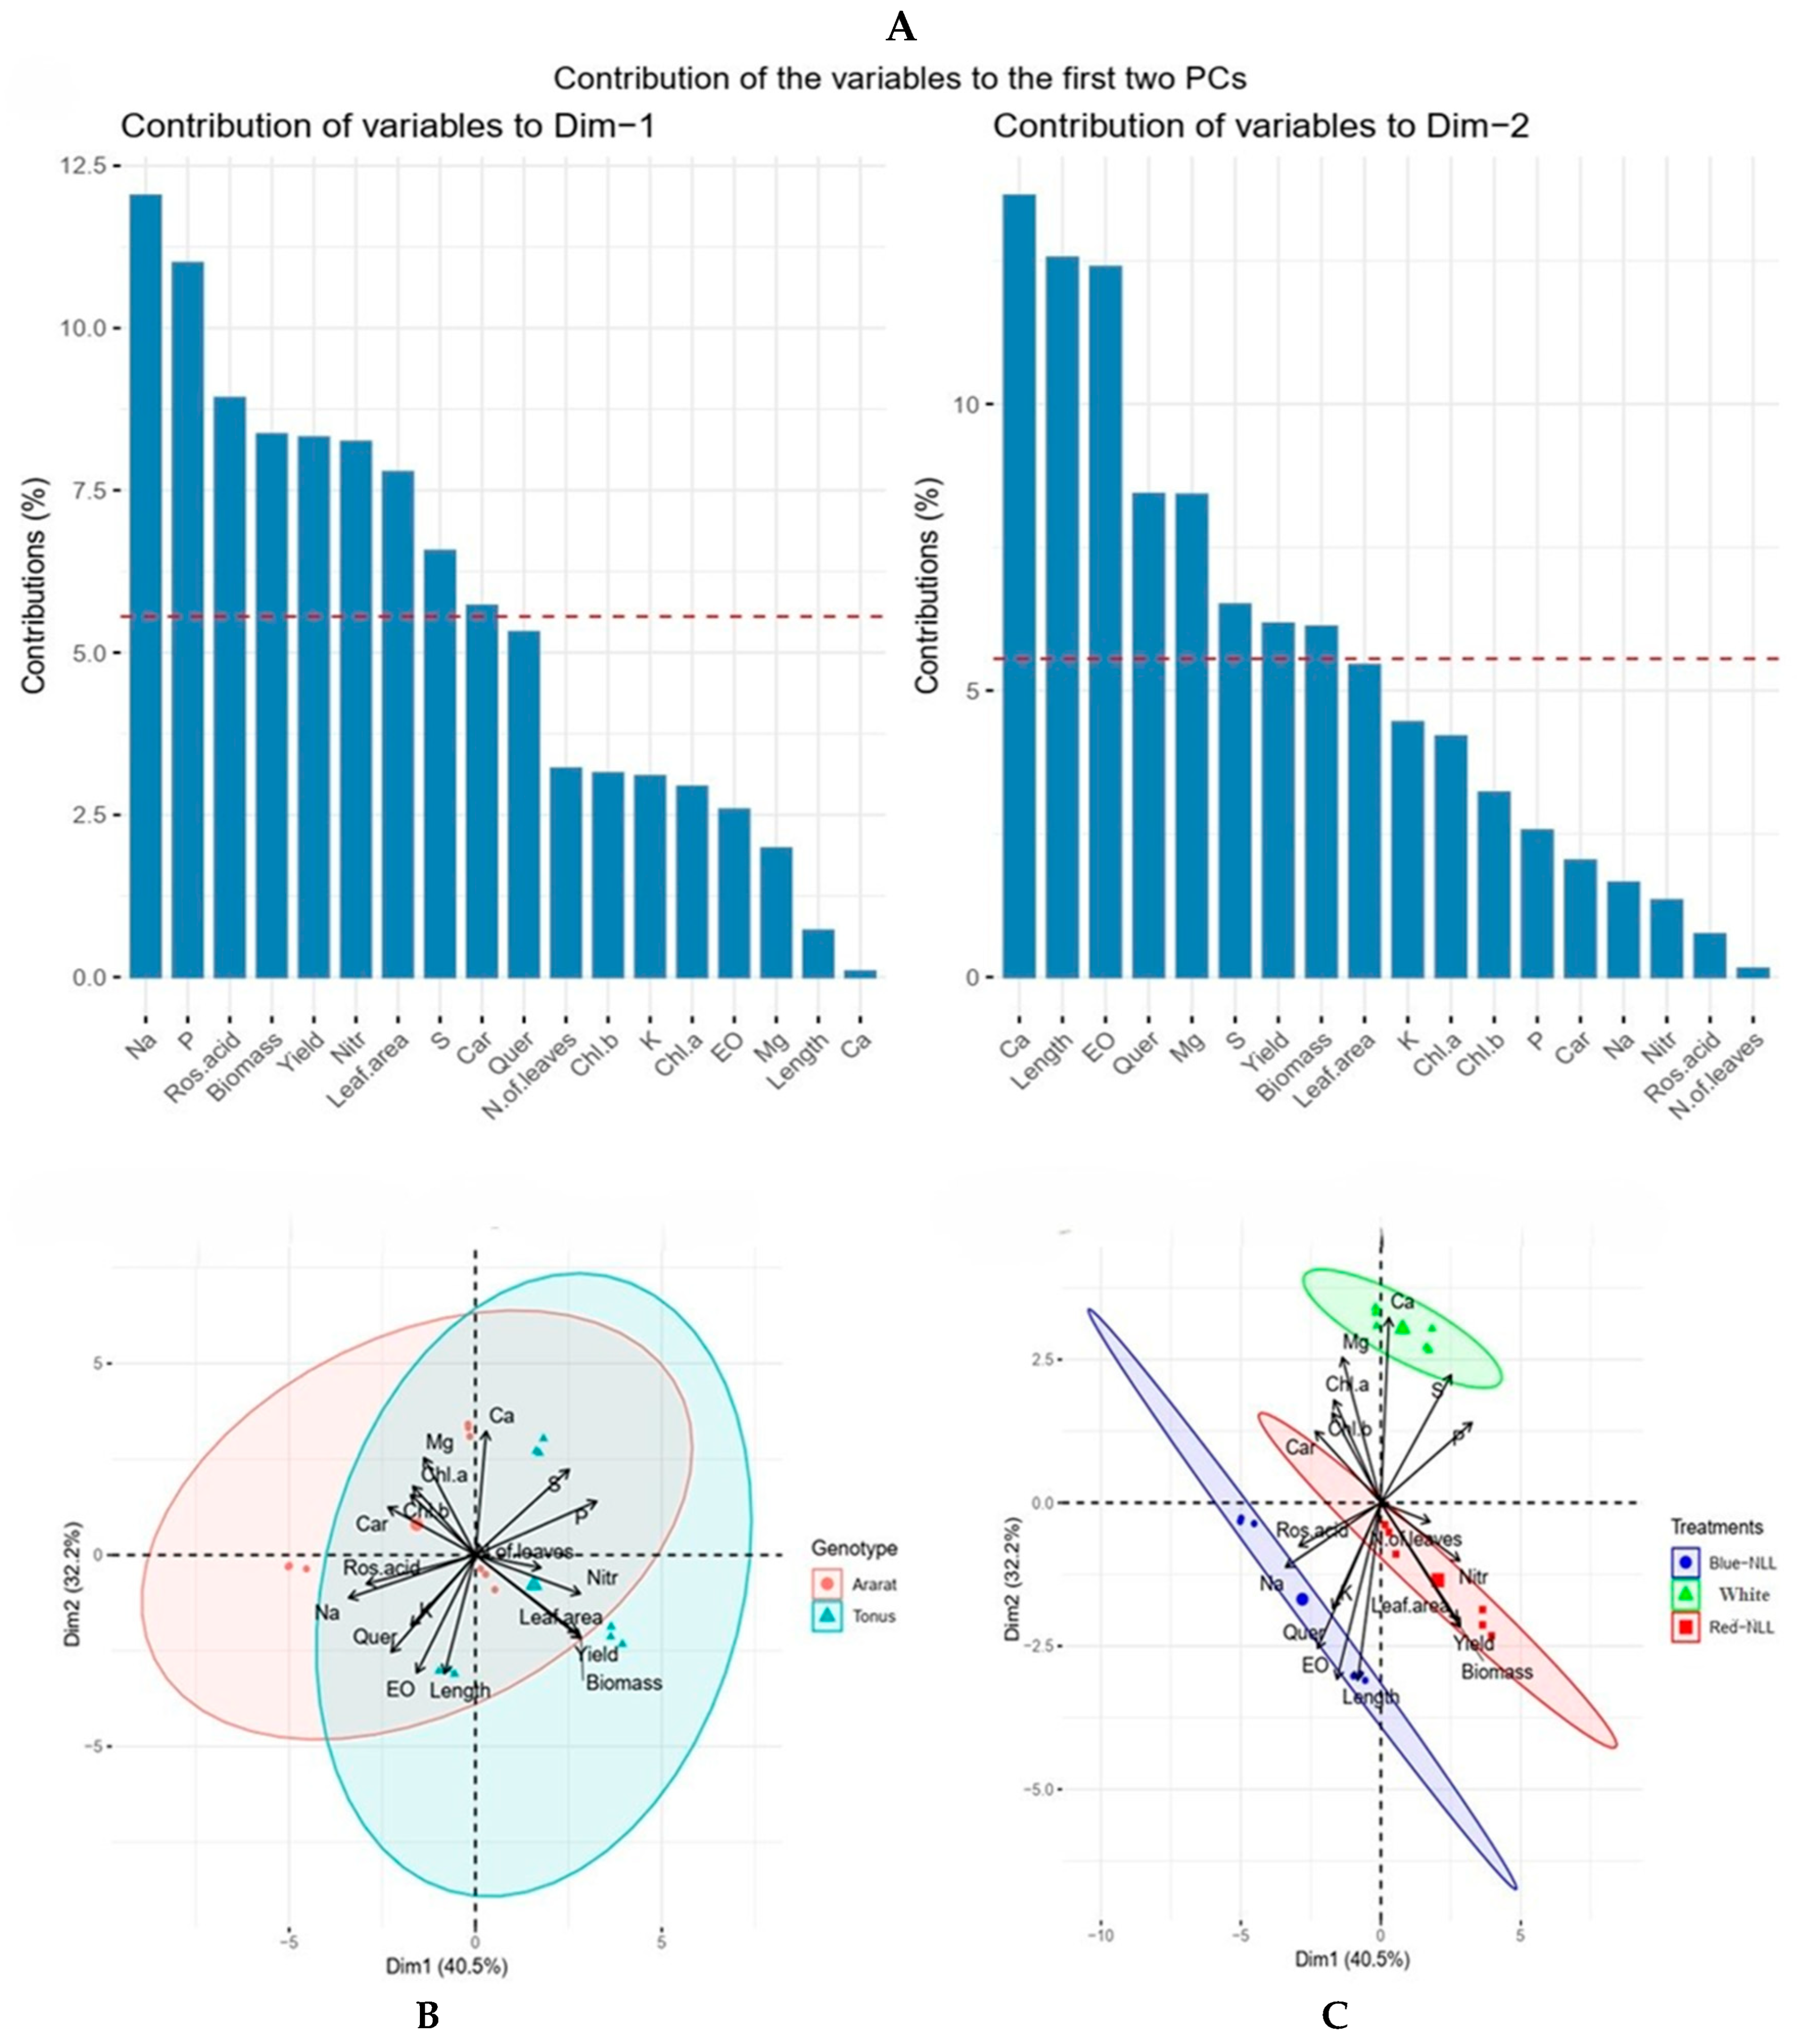
3.4. PCA—Biplot Analysis for Morphophysiological and Biochemical Traits Under LED Lighting at Night Treatments

Principal component analysis (PCA) was conducted to identify the major sources of variation and to determine how morphophysiological and biochemical parameters of basil responded to nighttime LED lighting (Figure 9). Figure 9A shows the contributions of each variable to the first two principal components. The first component (Dim-1), which explained 40.5% of the total variance, was mainly driven by Na, P, rosmarinic acid, biomass, yield, nitrate (NO3), and leaf area. These variables contributed most strongly to the discrimination of samples along the horizontal axis, suggesting a close link between productivity and specific biochemical traits. In contrast, Ca and Mg, length, and EO content had very limited contribution to Dim-1. The second component (Dim-2), accounting for 22.20% of the variance, was influenced most by Ca, plant length, EO, quercetin, Mg, and S. This axis reflects variation more aligned with mineral composition and secondary metabolism than with primary productivity.
Figure 9B presents the PCA biplot grouped by cultivars. The cultivars ‘Ararat’ and ‘Tonus’ showed a similar spatial grouping (not a clear separation) along the PC axes, while ‘Tonus’ was primarily associated with higher values of productivity traits, such as yield, biomass, and number of leaves, and ‘Ararat’ was more associated with secondary metabolites, like quercetin, EO, and rosmarinic acid. The absence of clear separation underlines similar physiological strategies between the two cultivars in response to night LED lighting.
Figure 9C illustrates the PCA biplot grouped by LED lighting treatments. Here, the Red-NLL treatment clustered closely with vectors for biomass, yield, nitrate, and P, indicating that red night lighting favored productivity-related parameters. The Blue-NLL treatment was grouped in the opposite quadrant, aligning with quercetin, EO, rosmarinic acid, and Na, indicating a shift toward secondary metabolite accumulation and antioxidant activity. Meanwhile, the white light was positioned near the origin, suggesting intermediate or neutral effects across traits. Together, these results confirm that spectral composition during nighttime lighting affects not only individual traits but also their interrelationships, with blue and red LEDs driving divergent physiological responses in basil.

3.5. PCA—Biplot Analysis for Morphophysiological and Biochemical Traits Under Pre-Harvest LED Lighting Treatments

The PCA biplots and variable contributions under pre-harvest LEF lighting treatments are illustrated in Figure 10A–C.
Principal component analysis (PCA) was applied to investigate the interrelationships among morphometric, physiological, and biochemical traits of basil under pre-harvest LED treatments. In Figure 10A, the contribution of variables to the first two principal components is presented. The first component (Dim-1), which explained 53.30% of the total variance, was predominantly influenced by length, phosphorus content, number of leaves, calcium content, biomass, yield, and leaf area, clearly representing a dimension of vegetative productivity. The second component (Dim-2, 24.30% of the variance) was defined by potassium, rosmarinic acid, carotenoids, magnesium, essential oils, and quercetin, reflecting variation in phytochemical accumulation and pigment synthesis.
In Figure 10B, the biplot grouped by cultivars revealed a clear spatial separation between ‘Tonus’ and ‘Ararat’. The ‘Tonus’ cultivar was associated with higher scores for productivity-related parameters, such as yield, leaf area, and biomass, while the ‘Ararat’ cultivar clustered with secondary metabolite-related traits, such as quercetin, rosmarinic acid, and essential oil content, along with chlorophyll b and nitrate. This separation confirms that cultivar-specific responses under pre-harvest lighting are structured along a trade-off axis between growth and biochemical quality.
Figure 10C shows the biplot grouping by LED treatments. The Red-P-hLL treatment grouped closely with vegetative growth traits—yield, leaf area, number of leaves, biomass, and Ca—suggesting that red pre-harvest lighting enhanced productivity. Conversely, the Blue-P-hLL treatment aligned with rosmarinic acid, quercetin, EO, carotenoids, and K, highlighting its role in promoting phytochemical and antioxidant compound accumulation. The white LED was centered near the origin, indicating intermediate effects on most traits. These results confirm that pre-harvest light spectra influence distinct physiological pathways, with red and blue light driving divergent responses: one favoring vegetative mass accumulation, the other enhancing antioxidant and biochemical quality traits.

4. Discussion

LED technologies are currently very popular and in demand due to energy efficiency, as well as the sensitivity of plants to the qualitative composition of light [22,44]. The qualitative characteristics of light include color or wavelength, which is a determining factor affecting the growth and development of plants [45,46].
In this study, different morphological reactions of basil varieties to the types of light and the period of their exposure were observed. Blue and red LED lighting stimulated the growth of the aboveground biomass of O. basilicum. These spectra are the main sources of energy for CO2 used in photosynthesis, and they can be maximally influenced in the ranges of 400–500 nm (blue) and 600–700 nm (red) [21]. This data corresponded to the results obtained on some basil varieties grown in protected soil conditions with different proportional ratios of red and blue spectra [22,47,48]. At the same time, the effect of the variety on growth processes is clearly traced during the irradiation period. In the version with Blue-NLL (100B:0G:0R) and Red-NLL (0B:0G:100R) illumination, purple basil was higher than with Red-P-hLL (15B:35G:50R) and Blue-P-hLL (45B:30G:25R), and vice versa, the green basil variety was higher when irradiated with red and blue light during the pre-harvest period. It should be noted that under Red-P-hLL and Blue-P-hLL, there were no significant differences in height in both varieties. The results are comparable with the data obtained for some European O. Basilicum varieties [48,49,50,51,52], and these are related to the percentage of spectra.
In this experiment, the area and number of leaves, biomass, and productivity under increased in the Red-NLL and Red-P-hLL variants, and these parameters did not depend on the genotype. According to the study by Emerson [53], the red and far-red spectra with additional green light from white LED determine the course of photosynthesis processes in plants and stimulate the development of morphological properties of plants in protected soil conditions [14]. In addition, in this study, with additional white light and Red-P-hLL, when ‘Tonus’ reached a maximum height, the effect of shading individual tiers of leaves was observed, and the plants tended to modulate growth. Using the red spectrum, a light search strategy was observed, and a ‘shade avoidance syndrome’ (SAS) emerged, which often occurs when growing leafy vegetable crops in greenhouses [54].
With additional pre-harvest lighting, the leaf area, leaves number, and plant biomass were determined by the spectrum and variety. Red-P-hLL and white light increased the number of leaves, vegetative biomass, and productivity of the ‘Ararat’ plants to a greater extent; in ‘Tonus’, these indicators tended to decrease in the following order of illumination, red > blue > white light, with green part of the spectrum. These results contrast with the results obtained for O. basilicum by Sale et al. [50]; their research emphasized that blue LED treatment increased the leaf area to a greater extent compared to white and red LEDs. Other studies noted that there were no significant differences in the leaf area and biomass of O. Basilicum plants grown under the influence of red and blue spectra [47].
The green spectrum from white LED combined with red and blue spectra under different irradiation schemes did not increase the content of photosynthetic pigments in basil leaves in this experiment. This was also confirmed in the reports by Chutimanukul et al. [52] and Lin et al. [22].
The accumulation of biologically active substances (rosmarinic acid and quercetin) in basil was associated with exposure to the blue spectrum [50,55]. At the same time, the maximum amount of quercetin is observed under the application of LED lighting during the pre-harvest period. The content of rosmarinic acid is determined by the variety and the period of exposure. The highest levels of rosmarinic acid were found in the Blue-NLL and Blue-P-hLL variants of ‘Ararat’ and ‘Tonus’, respectively. A greater amount of rosmarinic acid under the influence of blue light is indirectly related to cytochrome P450, which performs a protective function and leads to the accumulation of ROS (reactive oxygen species). ROS absorbents, i.e., rosmarinic acid, are produced as a protective mechanism [39,55,56].
Lighting with red and blue LEDs increases the essential oil content of basil plants [33,57], which is confirmed in this experiment. At the same time, their maximum content was in the Blue-P-hLL variant. A similar reaction, an increase in the total essential oil content of basil under the influence of the blue spectrum compared to the red spectrum, was noted in the report by Amaki et al. [58]. Prolonged additional illumination with red and blue spectra compared to other spectra increases the activity of free radicals in plants and increases the percentage of essential oil in basil varieties [33,59].
Information about the effect of spectra on the accumulation of macronutrients in basil leaves was contradictory; in some studies, the type of illumination did not affect the content of macronutrients [60], whereas other studies showed that red and blue spectra provided a greater accumulation of N, P, K, Ca, Mg, and Fe in the plant [61,62]. The results of this study showed that the uptake and accumulation of macronutrients (K, Na, Mg, Ca, S, P) from the nutrient solution were determined by the spectrum, illumination period, and variety. Irradiation with Blue-P-hLL increased Mg, Ca, and S content in ‘Tonus’; at the same time, Red-P-hLL increased Na, Mg, Ca, S, and P content in ‘Ararat’.
In this experiment, the use of LED lighting led to a decrease in the nitrate content under different lighting schemes. The blue spectrum during night irradiation reduced the nitrate content by more than 45.14% compared to the red spectrum in ‘Ararat’ and up to 14.50% in ‘Tonus’. However, in the pre-harvest period, on the contrary, the red spectrum reduced the nitrate content by 14.20% compared to the blue and by 34.83% compared to the white spectra of the studied varieties. The results of this study confirmed the data obtained by other scientists on a decrease in the concentration of nitrates in the vegetative parts of plants under the influence of blue and red spectral illumination compared to the white spectrum [60,63,64,65]. However, these studies did not focus on the period and duration of lighting.
The PCA analyses provided a comprehensive overview of the multivariate structure underlying basil responses to LED lighting treatments. Red-NLL was associated with enhanced growth traits, while Blue-NLL promoted the accumulation of antioxidant compounds and EO, highlighting a spectrum-dependent trade-off between biomass production and phytochemical enrichment [50,59]. Genotypic separation further revealed that ‘Tonus’ was aligned with vegetative traits, whereas ‘Ararat’ showed an affinity for phytochemical markers. Similarly, PCA under pre-harvest lighting conditions showed that Red-P-hLL clustered with growth-promoting traits, while Blue-P-hLL aligned with enhanced phytochemical traits, confirming the divergent physiological effects of these spectra [39,55]. These results clearly support the notion that the spectral quality and timing of LED application are critical determinants in steering basil physiology toward either higher productivity or improved phytochemical quality [61]. Such findings provide valuable insight for tailoring LED strategies to meet specific production goals in controlled-environment agriculture.
This comprehensive study shows the relationship between the influence of the spectral composition of light, the illumination period, and the genotype on the change in the economically valuable characteristics of basil. The application of red and blue light at certain stages of plant development is an improved technological method for cultivating different varieties of basil. Additionally, this technology can be used to cultivate large quantities of high-quality basil.

5. Conclusions

This study shows the prospects of using additional night and pre-harvest lighting in quality management and increasing yields of green and purple basil. Additional blue and red LED lighting increased plant growth, taking into account genotypic features: Blue-NLL for the purple variety ‘Ararat’ and Red-P-hLL and Blue-P-hLL for the green variety ‘Tonus’. Furthermore, additional nighttime and pre-harvest red spectrum irradiation increased the area and number of leaves, productivity, and yield of plants. The content of rosmarinic acid and quercetin increased under the influence of the blue spectrum under night and pre-harvest lighting. It was noted that pre-harvest lighting with a blue Blue-P-hLL LED (15V:35G:50R) increased the accumulation of essential oils in the vegetative parts of plants and did not depend on the variety. Pre-harvest illumination with Red-P-hLL and Blue-P-hLL LEDs increased the content of P, S, Ca, Mg, and K in the leaves. It has also been observed that Red-P-hLL and Blue-NLL lighting reduce the concentration of nitrates in the vegetative parts of plants, taking into account varietal features. Depending on the genotype, white light can enhance vegetative mass and yield. These results can be an important component for future research, ensuring the development and improvement of technologies for growing and producing environmentally friendly and safe products with a high percentage of biomass and essential oils of basil plants. Further research may be aimed at optimizing the time, period, and ratio of spectral composition, accounting for genotypic features, and identifying a mechanism for controlling biochemical reactions at the molecular level, taking into account growing technology (nano-mechanical approach).

Supplementary Materials

The following supporting information can be downloaded at https://www.mdpi.com/article/10.3390/horticulturae11070784/s1. Figure S1: LED lighting modes in the climate chamber during daytime and additional nighttime irradiation; Figure S2: LED lighting modes in the climate chamber with additional pre-harvest irradiation; Figure S3: Habitus of plants at Blue-P-hLL and Red-P-hLL LEDs.

Author Contributions

Conceptualization, I.V.K., O.P. and O.V.; methodology, I.V.K., O.V. and A.A.S.; software, I.K. and O.P.; validation, I.V.K., O.V., A.A.S. and A.T.; formal analysis, I.V.K., O.P., I.K. and O.V.; investigation, I.V.K., O.P., O.V., A.A.S., I.K. and A.T.; resources, I.V.K., O.V., I.K., A.A.S. and A.T.; data curation, I.V.K. and O.P.; writing—original draft preparation, I.V.K., O.P., O.V., I.K., A.A.S. and A.T.; writing—review and editing I.V.K., O.P., O.V., I.K., A.A.S. and A.T.; visualization, O.P., O.V. and I.K.; supervision, I.V.K. and O.P.; project administration, I.V.K. and O.P.; funding acquisition, I.V.K. All authors have read and agreed to the published version of the manuscript.

Funding

The research was carried out at the expense of a grant from the Ministry of Science and Higher Education of the Russian Federation for large scientific projects in priority areas of science and technology development (subsidy ID 075-15-2024-540).

Data Availability Statement

Data is contained within the article and Supplementary Materials.

Conflicts of Interest

The authors declare no conflicts of interest.

References

  1. Ivanitskikh, A.; Tarakanov, I.G. Effect of light spectral composition on the essential oils accumulation in basil plants grown with artificial lighting. Probl. Biol. Med. Pharm. Chem. 2022, 25, 3–9. [Google Scholar] [CrossRef]
  2. Silvestre, W.P.; Pauletti, G.F. Evaluation of extraction yield and chemical composition of the essential oil of five commercial varieties of basil (Ocimum basilicum L.). Rev. Interdiscip. Ciênc. Apl. 2021, 6, 44–50. [Google Scholar] [CrossRef]
  3. Date, M.B.; Rivero, W.C.; Tan, J.; Specca, D.; Simon, J.E.; Salvi, D.A.; Karwe, M.V. Growth of Hydroponic Sweet Basil (O. basilicum L.) Using Plasma-Activated Nutrient Solution (PANS). Agriculture 2023, 13, 443. [Google Scholar] [CrossRef]
  4. Degtereva, M.; Levin, Y.; Gubina, A.; Degterev, A.; Lamkin, I.; Konoplev, G.; Tarasov, S.; Whaley, A.; Whaley, A.; Suloev, I.; et al. Influence of the Spectral Composition of Illuminating Light Sources on Biometric and Phytochemical Characteristics of Ocimum basilicum L. Photonics 2023, 10, 1369. [Google Scholar] [CrossRef]
  5. Mason-D’Croz, D.; Bogard, J.R.; Sulser, T.B.; Cenacchi, N.; Dunston, S.; Herrero, M.; Wiebe, K. Gaps between fruit and vegetable production, demand, and recommended consumption at global and national levels: An integrated modelling study. Lancet Planet. Health 2019, 3, e318–e329. [Google Scholar] [CrossRef]
  6. Kaur, P.; Verma, K.; Singh, A.K.; Kumar, R.; Singh, S. Co-cultivation of sweet basil (Ocimum basilicum L.) with food crops for efficient resource utilization and increasing the farm profits. Ind. Crops Prod. 2024, 214, 118495. [Google Scholar] [CrossRef]
  7. Rawat, R.; Negi, K.S.; Mehta, P.S.; Tiwari, V.; Verma, S.K.; Bisht, I.S. Study of six varieties of sweet basil (Ocimum basilicum L.) and their morphological variations. J. Non-Timb. Forest Prod. 2016, 23, 1–6. [Google Scholar] [CrossRef]
  8. Avetisyan, A.; Markosian, A.; Petrosyan, M.; Sahakyan, N.; Babayan, A.; Aloyan, S.; Trchounian, A. Chemical composition and some biological activities of the essential oils from basil Ocimum different cultivars. BMC Complement. Altern. Med. 2017, 17, 1–8. [Google Scholar] [CrossRef]
  9. Knaus, U.; Pribbernow, M.; Xu, L.; Appelbaum, S.; Palm, H.W. Basil (Ocimum basilicum) Cultivation in Decoupled Aquaponics with Three Hydro-Components (Grow Pipes, Raft, Gravel) and African Catfish (Clarias gariepinus) Production in Northern Germany. Sustainability 2020, 12, 8745. [Google Scholar] [CrossRef]
  10. Teliban, G.-C.; Stoleru, V.; Burducea, M.; Lobiuc, A.; Munteanu, N.; Popa, L.-D.; Caruso, G. Biochemical, Physiological and Yield Characteristics of Red Basil as Affected by Cultivar and Fertilization. Agriculture 2020, 10, 48. [Google Scholar] [CrossRef]
  11. Walters, K.J.; Currey, C.J. Hydroponic greenhouse basil production: Comparing systems and cultivars. HortTechnology 2015, 25, 645–650. [Google Scholar] [CrossRef]
  12. Wierdak, R.; Kocka, A.; Kowalski, R.; Borowski, B. Changes in the chemical composition of the essential oil of sweet basil (Ocimum basilicum L.) depending on the plant growth stage. Chemija 2012, 23, 216–222. [Google Scholar]
  13. Avgoustaki, D.D. Optimization of Photoperiod and Quality Assessment of Basil Plants Grown in a Small-Scale Indoor Cultivation System for Reduction of Energy Demand. Energies 2019, 12, 3980. [Google Scholar] [CrossRef]
  14. Rahman, M.M.; Vasiliev, M.; Alameh, K. LED Illumination Spectrum Manipulation for Increasing the Yield of Sweet Basil (Ocimum basilicum L.). Plants 2021, 10, 344. [Google Scholar] [CrossRef]
  15. Litvin, A.G.; Currey, C.J.; Wilson, L.A. Effects of supplemental light source on basil. dill. and parsley growth. morphology. aroma and flavor. J. Am. Soc. Hortic. Sci. 2020, 145, 18–29. [Google Scholar] [CrossRef]
  16. Oehler, M.A.; Kelly, N.; Fonseca, J.M.; Evensen, E.; Park, E.; Gu, G.; Teng, Z.; Luo, Y. Influence of Supplementary Blue and Far-Red Light on the Morphology and Texture of Ocimum basilicum L. Grown in Controlled Environments. Horticulturae 2025, 11, 287. [Google Scholar] [CrossRef]
  17. Hammock, H.A.; Sams, C.E. Variation in supplemental lighting quality influences key aroma volatiles in hydroponically grown ‘Italian Large Leaf’ basil. Front. Plant Sci. 2023, 14, 1184664. [Google Scholar] [CrossRef]
  18. Ahmadi, T.; Shabani, L.; Sabzalian, M.R. LED light sources improved the essential oil components and antioxidant activity of two genotypes of lemon balm (Melissa ofcinalis L.). Bot. Stud. 2021, 62, 9. [Google Scholar] [CrossRef]
  19. Maran, B.; Silvestre, W.P.; Pauletti, G.F. Preliminary study on the effect of artificial lighting on the production of basil, mustard, and red cabbage seedlings. AgriEngineering 2024, 6, 1043–1054. [Google Scholar] [CrossRef]
  20. Semenova, N.A.; Smirnov, A.A.; Ivanitskikh, A.S.; Izmailov, A.Y.; Dorokhov, A.S.; Proshkin, Y.A.; Yanykin, D.V.; Sarimov, R.R.; Gudkov, S.V.; Chilingaryan, N.O. Impact of Ultraviolet Radiation on the Pigment Content and Essential Oil Accumulation in Sweet Basil (Ocimum basilicum L.). Appl. Sci. 2022, 12, 7190. [Google Scholar] [CrossRef]
  21. Carvalho, S.D.; Schwieterman, M.L.; Abrahan, C.E.; Colquhoun, T.A.; Folta, K.M. Light quality dependent changes in morphology. antioxidant capacity and volatile production in sweet basil (Ocimum basilicum). Front. Plant Sci. 2016, 7, 1328. [Google Scholar] [CrossRef]
  22. Lin, K.-H.; Huang, M.-Y.; Hsu, M.-H. Morphological and physiological response in green and purple basil plants (Ocimum basilicum) under different proportions of red, green and blue LED lightings. Sci. Hortic. 2021, 275, 109677. [Google Scholar] [CrossRef]
  23. Ilić, Z.S.; Milenković, L.; Tmušić, N.; Stanojević, L.; Stanojević, J.; Cvetković, D. Essential oils content, composition and antioxidant activity of lemon balm, mint and sweet basil from Serbia. LWT 2022, 153, 112210. [Google Scholar] [CrossRef]
  24. Varga, F.; Carovic-Stanko, K.; Ristic, M.; Grdisa, M.; Liber, Z.; Satovic, Z. Morphological and biochemical intraspecific characterization of Ocimum basilicum L. Ind. Crops Prod. 2017, 109, 611–618. [Google Scholar] [CrossRef]
  25. Sęczyk, Ł.; Ozdemir, F.A.; Kołodziej, B. In vitro bioaccessibility and activity of basil (Ocimum basilicum L.) phytochemicals as affected by cultivar and postharvest preservation method–Convection drying, freezing, and freeze-drying. Food Chem. 2022, 382, 132363. [Google Scholar] [CrossRef]
  26. Toncer, O.; Karaman, S.; Diraz, E.; Tansi, S. Essential oil composition of Ocimum basilicum L. at different phenological stages in semi-arid environmental conditions. Fersenius Environ. Bull. 2017, 8, 5441–5446. [Google Scholar]
  27. Al-Kateb, H.; Mottram, D. The relationship between growth stages and aroma composition of lemon basil Ocimum citriodorum. Vis. Food Chem. 2014, 152, 440–446. [Google Scholar] [CrossRef]
  28. Chang, X.; Alderson, P.; Wright, C. Variation in the Essential Oils in Different Leaves of Basil (Ocimum basilicum L.) at Day Time. Open Hortic. J. 2009, 2, 13–16. [Google Scholar] [CrossRef]
  29. Brindisi, L.J.; Simon, J.E. Preharvest and postharvest techniques that optimize the shelf life of fresh basil (Ocimum basilicum L.): A review. Front. Plant Sci. 2023, 14, 1237577. [Google Scholar] [CrossRef]
  30. Knyazeva, I.V.; Panfilova, O.; Vershinina, O.; Smirnov, A.A.; Dorokhov, A.S.; Kahramanoğlu, I. The Effect of Nighttime LED Lighting on Tomato Growth, Yield, and Nutrient Content of Fruits. Horticulturae 2024, 10, 1259. [Google Scholar] [CrossRef]
  31. Panfilova, O.; Ryago, N.; Ondrasek, G.; Knyazeva, I.V.; Kahramanoğlu, I.; Vershinina, O.; Tsoy, M.; Izmailov, A.Y.; Dorokhov, A.S. Optimizing Microclonal Propagation of Red Currant Cultivars: The Role of Nutrient Media, Sterilizers, and LED Lighting in Plant Adaptation. Horticulturae 2025, 11, 149. [Google Scholar] [CrossRef]
  32. Stepanova, N.Y. Evaluation of basil cultivars suitability for drying and freezing. Sci. Support Dev. Agro Ind. Complex Import. Cond. 2020, 1, 115–118. [Google Scholar]
  33. Hosseini, A.; Mehrjerdi, M.Z.; Aliniaeifard, S. Alteration of bioactive compounds in two varieties of basil (Ocimum basilicum) grown under different light spectra. J. Essent. Oil Bear. Plants 2018, 21, 913–923. [Google Scholar] [CrossRef]
  34. Gavrilenko, V.F.; Ladygina, M.E.; Khandobina, L.M. Large Workshop on Plant Physiology, Photosynthesis, Respiration; Higher School: Moscow, Russia, 1975; pp. 133–134. [Google Scholar]
  35. Lichtenthaler, H.K. Chlorophylls and carotenoids: Pigments of photosynthetic biomembranes. Methods Enzymol. 1987, 148, 350–382. [Google Scholar] [CrossRef]
  36. De Carvalho, L.M.; Raabe, A.; Martini, M.; Santanna, C.S.; Da Silveira, G.D.; Do Nascimento, P.C.; Bohrer, D. Contactless Conductivity Detection of 14 Inorganic Cations in Mineral and Phytotherapeutic Formulations after Capillary Electrophoretic Separation. Electroanalysis 2011, 23, 2574–2581. [Google Scholar] [CrossRef]
  37. Nazir, S.; Wani, I.A. Protein Isolate from Basil Seeds (Ocimum basilicum L.): Physicochemical and Functional Characterisation. Food Chem. Adv. 2023, 3, 100424. [Google Scholar] [CrossRef]
  38. Burbott, A.; Loomis, W. Effects of light and temperature on the monoterpenes of peppermint. Plant Physiol. 1967, 42, 20–28. [Google Scholar] [CrossRef]
  39. Shiga, T.; Shoji, K.; Shimada, H.; Hashida, S.N.; Goto, F.; Yoshihara, T. Effect of light quality on rosmarinic acid content and antioxidant activity of sweet basil Ocimum basilicum L. Plant Biotechnol. 2009, 26, 255–259. [Google Scholar] [CrossRef]
  40. Wei, T.; Simko, V.R. Package ‘Corrplot’: Visualization of a Correlation Matrix (Version 0.92). 2021. Available online: https://github.com/taiyun/corrplot (accessed on 5 May 2025).
  41. Kassambara, A.; Mundt, F. factoextra: Extract and Visualize the Results of Multivariate Data Analyses (Version 1.0.7). 2020. Available online: https://cran.r-project.org/package=factoextra (accessed on 5 May 2025).
  42. Tang, Y.; Horikoshi, M.; Li, W. ggfortify: Unified Interface to Visualize Statistical Results of Popular R Packages. R J. 2016, 8, 474–485. [Google Scholar] [CrossRef]
  43. Shaidullin, A.K.; Makarov, P.N. Productivity and nitrate content in green crop products (Ocimum basilicum L., Eruca sativa Mill.) under light culture conditions. In Proceedings of the III All-Russian Scientific and Practical Conference, Surgut, Russia, 11–12 November 2020. [Google Scholar]
  44. Nelson, J.A.; Bugbee, B. Economic Analysis of Greenhouse Lighting: Light Emitting Diodes vs. High Intensity Discharge Fixtures. PLoS ONE 2014, 9, e99010. [Google Scholar] [CrossRef]
  45. Lee, S.H.; Tewari, R.K.; Hahn, E.J.; Paek, K.Y. Photon flux density and light quality induce changes in growth, stomatal development, photosynthesis and transpiration of Withania somnifera (L.) Dunal. plantlets. Plant Cell Tissue Organ Cult. 2007, 90, 141–151. [Google Scholar] [CrossRef]
  46. Casson, S.A.; Hetherington, A.M. Phytochrome B Is required for light-mediated systemic control of stomatal development. Curr. Biol. 2014, 24, 1216–1221. [Google Scholar] [CrossRef]
  47. Beatrice, P.; Saviano, G.; Reguzzoni, M.; Divino, F.; Fantasma, F.; Chiatante, D.; Montagnoli, A. Light spectra of biophilic LED-sourced system modify essential oils composition and plant morphology of Mentha piperita L. and Ocimum basilicum L. Front. Plant Sci. 2023, 14, 1093883. [Google Scholar] [CrossRef]
  48. Branca, F.; Treccarichi, S.; Ruberto, G.; Renda, A.; Argento, S. Comprehensive Morphometric and Biochemical Characterization of Seven Basil (Ocimum basilicum L.) Genotypes: Focus on Light Use Efficiency. Agronomy 2024, 14, 224. [Google Scholar] [CrossRef]
  49. Larsen, D.H.; Woltering, E.J.; Nicole, C.C.S.; Marcelis, L.F.M. Response of basil growth and morphology to light intensity and spectrum in a vertical farm. Front. Plant Sci. 2020, 11, 597906. [Google Scholar] [CrossRef]
  50. Sale, A.I.; Uthairatanakij, A.; Laohakunjit, N.; Jitareerat, P.; Kaisangsri, N. Pre-Harvest Supplemental LED Treatments Led to Improved Postharvest Quality of Sweet Basil Leaves. J. Photochem. Photobiol. B Biol. 2023, 248, 112788. [Google Scholar] [CrossRef]
  51. Jensen, N.B.; Clausen, M.R.; Kjaer, K.H. Spectral quality of supplemental LED grow light permanently alters stomatal functioning and chilling tolerance in basil (Ocimum basilicum L.). Sci. Hortic. 2018, 227, 38–47. [Google Scholar] [CrossRef]
  52. Chutimanukul, P.; Wanichananan, P.; Janta, S.; Toojinda, T.; Darwell, C.T.; Mosaleeyanon, K. The influence of different light spectra on physiological responses, antioxidant capacity and chemical compositions in two holy basil cultivars. Sci. Rep. 2022, 12, 588. [Google Scholar] [CrossRef]
  53. Emerson, R.; Chalmers, R.; Cederstrand, C. Some Factors Influencing The Long-Wave Limit of Photosynthesis. Proc. Natl. Acad. Sci. USA 1957, 43, 133–143. [Google Scholar] [CrossRef]
  54. De Keyser, E.; Dhooghe, E.; Christiaens, A.; Van Labeke, M.-C.; Van Huylenbroeck, J. LED light quality intensifies leaf pigmentation in ornamental pot plants. Sci. Hortic. 2019, 253, 270–275. [Google Scholar] [CrossRef]
  55. Lobiuc, A.; Vasilache, V.; Oroian, M.; Stoleru, T.; Burducea, M.; Pintilie, O.; Zamfirache, M.-M. Blue and Red LED Illumination Improves Growth and Bioactive Compounds Contents in Acyanic and Cyanic Ocimum basilicum L. Microgreens. Molecules 2017, 22, 2111. [Google Scholar] [CrossRef]
  56. Iwai, M.; Ohta, M.; Tsuchiya, H.; Suzuki, T. Enhanced accumulation of caffeic acid, rosmarinic acid and luteolin-glucoside in red perilla cultivated under red diode laser and blue LED illumination followed by UV-A irradiation. J. Funct. Foods 2010, 2, 66–70. [Google Scholar] [CrossRef]
  57. Aldarkazali, M.; Rihan, H.Z.; Carne, D.; Fuller, M.P. The Growth and Development of Sweet Basil (Ocimum basilicum) and Bush Basil (Ocimum minimum) Grown under Three Light Regimes in a Controlled Environment. Agronomy 2019, 9, 743. [Google Scholar] [CrossRef]
  58. Amaki, W.; Yamazaki, N.; Ichimura, M.; Watanabe, H. Effects of light quality on the growth and essential oil content in sweet basil. Acta Hortic. 2011, 907, 91–94. [Google Scholar] [CrossRef]
  59. Chu, H.T.T.; Vu, T.N.; Dinh, T.T.T.; Do, P.T.; Chu, H.H.; Tien, T.Q.; Tong, Q.C.; Nguyen, M.H.; Ha, Q.T.; Setzer, W.N. Effects of Supplemental Light Spectra on the Composition, Production and Antimicrobial Activity of Ocimum basilicum L. Essential Oil. Molecules 2022, 27, 5599. [Google Scholar] [CrossRef]
  60. Mirgos, M.; Geszprych, A.; Przybył, J.L.; Niedzińska, M.; Sujkowska-Rybkowska, M.; Gajc-Wolska, J.; Kowalczyk, K. Effect of Lighting Type on the Nitrates Concentration, Selective Bioactive Compounds and Yield of Sweet Basil (Ocimum basilicum L.) in Hydroponic Production. Agronomy 2025, 15, 966. [Google Scholar] [CrossRef]
  61. Pennisi, G.; Blasioli, S.; Cellini, A.; Maia, L.; Crepaldi, A.; Braschi, I.; Spinelli, F.; Nicola, S.; Fernandez, J.A.; Stanghellini, C.; et al. Unraveling the role of red:blue LED lights on resource use efficiency and nutritional properties of indoor grown sweet basil. Front. Plant Sci. 2019, 10, 305. [Google Scholar] [CrossRef]
  62. Sipos, L.; Balázs, L.; Székely, G.; Jung, A.; Sárosi, S.; Radácsi, P.; Csambalik, L. Optimization of basil (Ocimum basilicum L.) production in LED light environments—A review. Sci. Hortic. 2021, 289, 110486. [Google Scholar] [CrossRef]
  63. Ohashi-Kaneko, K.; Takase, M.; Kon, N.; Fujiwara, K.; Kurata, K. Effect of light quality on growth and vegetable quality in leaf lettuce, spinach and komatsuna. Environ. Control Biol. 2007, 45, 189–198. [Google Scholar] [CrossRef]
  64. Lillo, C. Signalling cascades integrating light-enhanced nitrate metabolism. Biochem. J. 2008, 415, 11–19. [Google Scholar] [CrossRef]
  65. Signore, A.; Bell, L.; Santamaria, P.; Wagstaff, C.; Van Labeke, M.C. Red light is effective in reducing nitrate concentration in rocket by increasing nitrate reductase activity, and contributes to increased total glucosinolates content. Front. Plant Sci. 2020, 11, 604. [Google Scholar] [CrossRef] [PubMed]
Figure 1. The climate chamber with green and purple basil plants and lighting options: A—white LED, B—white and blue LED, C—white and red LED.
Horticulturae 11 00784 g001
Figure 2. The effect of white LED lighting and additional blue (Blue-NLL) and red (Red-NLL) LEDs on the length of shoots (A), leaf area (B), number of leaves (C), biomass (D), and vegetative productivity (E) of basil varieties. The data are the average values of three repetitions (n = 4). Different letters indicate statistically significant differences between the groups according to Tukey’s test (p ≤ 0.05).
Horticulturae 11 00784 g002aHorticulturae 11 00784 g002b
Figure 3. The effect of white LED lighting and additional night blue (Blue-NLL) and red LEDs (Red-NLL) on the accumulation of quercetin (A), rosmarinic acid (B), and essential oil (C) in the vegetative mass of basil varieties. The data are the average values of three repetitions (n = 4). Different letters indicate statistically significant differences between the groups according to Tukey’s test (p ≤ 0.05).
Horticulturae 11 00784 g003
Figure 4. The effect of daytime white LED lighting and additional night blue (Blue-NLL) and red (Red-NLL) lighting on the nitrate content in the biomass of basil varieties ‘Ararat’ and ‘Tonus’. The data are the average values of three repetitions (n = 3). Different letters indicate statistically significant differences between the groups according to Tukey’s test (p ≤ 0.05).
Horticulturae 11 00784 g004
Figure 5. Influence of blue (Blue-P-hLL) and red (Red-P-hLL) illumination spectra in the pre-harvest period on the length of shoots (A), area (B), number of leaves (C), biomass (D), and vegetative productivity (E) of basil plants ‘Ararat’ and ‘Tonus’. The data are the average values of three repetitions (n = 4). Different letters indicate statistically significant differences between the groups according to Tukey’s test (p ≤ 0.05).
Horticulturae 11 00784 g005
Figure 6. The effect of blue and red illumination spectra in the pre-harvest period on the accumulation of quercetin (A), rosmarinic acid (B), and essential oil (C) in the biomass of basil varieties. The data are the average values of three repetitions (n = 4). Different letters indicate statistically significant differences between the groups according to Tukey’s test (p ≤ 0.05).
Horticulturae 11 00784 g006
Figure 7. The effect of pre-harvest LED lighting on the nitrate content in the biomass of ‘Ararat’ and ‘Tonus’. The data are the average values of three repetitions (n = 3). Different letters indicate statistically significant differences between the groups according to Tukey’s test (p ≤ 0.05).
Horticulturae 11 00784 g007
Figure 8. Correlation analysis of plant traits under (A) night and (B) pre-harvest.
Horticulturae 11 00784 g008
Figure 9. (A) Contributions of the variables to the first two principal components; (B) PCA—biplot analysis grouping for cultivars; and (C) PCA—biplot analysis grouping for treatments under LED lighting at night treatments.
Horticulturae 11 00784 g009
Figure 10. (A) Contributions of the variables to the first two principal components; (B) PCA—biplot analysis grouping for cultivars; and (C) PCA—biplot analysis grouping for treatments under pre-harvest LED lighting treatments.
Horticulturae 11 00784 g010
Table 1. Average PPFD coming from LEDs in each of the spectrum zones: blue (400–500 nm), green (500–600 nm), and red (600–700 nm).
VariantPhoton Flux, µmol Photons m−2·s−1Percentage Composition of Light (B:G:R)
Blue (B)Green (G)Red (R)PPFD
White LED23.9 ± 1.363.2 ± 3.252.9 ± 3.0139.9 ± 7.517:45:38
Additional night exposure
Blue-NLL49.7 ± 1.90.1 ± 0.080.2 ± 0.150 ± 2.1100:0:0
Red-NLL0.1 ± 0.010.1 ± 0.0149.9 ± 1.850 ± 1.80:0:100
Additional pre-harvest irradiation
Blue-P-hLL85.6 ± 3.857.4 ± 3.147.7 ± 1.3190.7 ± 8.245:30:25
Red-P-hLL29.1 ± 1.567.1 ± 2.294.0 ± 4.1190.2 ± 7.815:35:50
Red-NLL—red LEDs during the night exposure period; Blue-NLL—blue LEDs during the night exposure period; Red-P-hLL—red LEDs during the pre-harvest period; Blue-P-hLL—blue LEDs during the pre-harvest period.
Table 2. The effect of white LED lighting and additional blue (Blue-NLL) and red LEDs (Red-NLL) on the content of leaf pigments in basil varieties.
CultivarExperiment VariantContent, mg·g−1 Raw Weight of Plants
Chl aChl bChl (a + b)Car
‘Ararat’White1.93 ± 0.12 a0.88 ± 0.02 a2.81 ± 0.14 a0.58 ± 0.03 a
Blue-NLL1.59 ± 0.07 b0.71 ± 0.01 c2.30 ± 0.07 b0.51 ± 0.04 b
Red-NLL1.84 ± 0.10 a0.83 ± 0.02 b2.68 ± 0.09 a0.53 ± 0.02 ab
‘Tonus’White1.50 ± 0.05 a0.53 ± 0.02 b2.03 ± 0.05 a0.42 ± 0.02 b
Blue-NLL1.54 ± 0.09 a0.58 ± 0.02 a2.12 ± 0.09 a0.51 ± 0.03 a
Red-NLL1.08 ± 0.06 b0.45 ± 0.02 c1.53 ± 0.07 b0.29 ± 0.02 c
The data are the average values of three repetitions (n = 6). Different letters indicate statistically significant differences between the groups according to Tukey’s test (p ≤ 0.05).
Table 3. The effect of white LED lighting and additional blue (Blue-NLL) and red LEDs (Red-NLL) on the elemental composition of basil leaves.
CultivarExperiment VariantContent, mg·100 g−1 Raw Weight of Plants
KNaMgCaSP
‘Ararat’White380.40 ± 8.99 b6.96 ± 0.15 b31.59 ± 0.82 b53.17 ± 1.22 a11.97 ± 0.25 a49.39 ± 0.31 a
Blue-NLL432.23 ± 10.78 a11.02 ± 0.56 a35.75 ± 0.69 a49.21 ± 1.36 b8.76 ± 0.25 c34.14 ± 0.80 c
Red-NLL453.60 ± 12.26 a6.84 ± 0.22 b29.74 ± 1.15 c44.76 ± 0.92 c11.06 ± 0.10 b43.20 ± 0.68 b
‘Tonus’White 331.47 ± 9.37 b5.39 ± 0.22 b37.53 ± 1.56 a56.03 ± 2.70 a12.25 ± 0.24 a55.41 ± 0.96 a
Blue-NLL402.08 ± 3.07 a9.03 ± 0.52 a26.82 ± 0.78 b38.22 ± 0.93 c10.25 ± 0.38 b42.35 ± 0.27 c
Red-NLL389.16 ± 12.51 a5.48 ± 0.15 b26.74 ± 1.04 b46.54 ± 2.57 b10.78 ± 0.13 b53.08 ± 0.67 b
The data are the average values of three repetitions (n = 4). Different letters indicate statistically significant differences between the groups according to Tukey’s test (p ≤ 0.05).
Table 4. The effect of additional blue and red lighting during the pre-harvest period on the accumulation of photosynthetic pigments in basil leaves.
CultivarExperiment VariantContent, mg·g−1 Raw Weight of Plants
Chl aChl bChl (a + b)Car
‘Ararat’White1.78 ± 0.08 a0.62 ± 0.03 a2.40 ± 0.09 a0.51 ± 0.02 a
Blue-P-hLL1.48 ± 0.07 b0.48 ± 0.02 c1.97 ± 0.08 c0.38 ± 0.02 c
Red-P-hLL1.69 ± 0.07 a0.53 ± 0.02 b2.22 ± 0.08 b0.44 ± 0.02 b
‘Tonus’White1.54 ± 0.06 ab0.67 ± 0.03 b2.21 ± 0.07 b0.42 ± 0.02 b
Blue-P-hLL1.63 ± 0.04 a0.78 ± 0.03 a2.41 ± 0.07 a0.55 ± 0.02 a
Red-P-hLL1.48 ± 0.04 b0.60 ± 0.02 c2.08 ± 0.05 c0.40 ± 0.02 b
The data are the average values of three repetitions (n = 6). Different letters indicate statistically significant differences between the groups according to Tukey’s test (p ≤ 0.05).
Table 5. The effect of additional blue and red lighting during the pre-harvest period on the elemental composition of basil leaves.
CultivarExperiment VariantContent, mg·100 g−1 Raw Weight of Plants
KNaMgCaSP
‘Ararat’White467.47 ± 9.12 b9.65 ± 0.40 b29.47 ± 1.06 b48.86 ± 1.36 b6.10 ± 0.31 c48.33 ± 1.28 b
Blue-P-hLL503.60 ± 6.91 a8.69 ± 0.45 c31.35 ± 1.12 b42.66 ± 1.81 c7.22 ± 0.30 b54.00 ± 1.28 a
Red-P-hLL485.58 ± 14.67 a15.86 ± 0.58 a33.76 ± 1.11 a53.79 ± 1.87 a9.59 ± 0.28 a52.60 ± 1.38 a
‘Tonus’White438.11 ± 14.73 c15.80 ± 0.41 a39.38 ± 0.78 c85.68 ± 2.89 b12.24 ± 0.23 c67.58 ± 2.35 b
Blue-P-hLL832.28 ± 22.24 a14.01 ± 0.38 b86.12 ± 3.32 a125.25 ± 2.68 a18.90 ± 0.64 b80.93 ± 1.63 a
Red-P-hLL523.43 ± 8.38 b13.58 ± 0.25 b48.19 ± 1.20 b126.62 ± 3.71 a28.52 ± 1.10 a80.56 ± 1.01 a
The data are the average values of three repetitions (n = 4). Different letters indicate statistically significant differences between the groups according to Tukey’s test (p ≤ 0.05).
Disclaimer/Publisher’s Note: The statements, opinions and data contained in all publications are solely those of the individual author(s) and contributor(s) and not of MDPI and/or the editor(s). MDPI and/or the editor(s) disclaim responsibility for any injury to people or property resulting from any ideas, methods, instructions or products referred to in the content.

